sign & mana type intr f - patrick mcnutt · sign & mana type intr f p ... managerial...
TRANSCRIPT

SIGNALLING, STRATEGY &MANAGEMENT TYPE
Introducing Framework T3 and GEMSfor Business Strategy
Patrick A. McNuttThe usual disclaimer applies. The views expressed here are those
of the author
This is an E-book. It is available in camera copy format with freedownload from
www.patrickmcnutt.com.
December 2008

ACKNOWLEDGEMENTS
Thank you for reading the E-book and making a contribution to the charity asidentified on my web portal. The E-book can be read independently or inconjunction with the Kaelo v2.0 software tool. Some of the arguments arefiltered from McNutt (2005): Law, Economics and Antitrust and from booksreferenced in the E-book. There are indeed numerous references and secondaryreadings recommended in the E-book. These should be read as well. They willbe fully referenced as we continue together to write this E-book on the web.
Interesting books on related themes to read are Roberts (2004): The ModernFirm: Games, Strategies and Managers and Nalebuff and Dixit (2008): TheArt of Strategy. For my MBA students you will be reading either Baye (2008):Managerial Economics and Business Stratagy or Besanko (2007): Economicsof Strategy.
For clients using my services, a note of thanks and for management in generalwho may happen upon this E-book a set of business slides are available as oneset called Framework T3 and GEMS which is available from the author. Theywill appear also on my web page.
Please email your comments to me via my web portal atwww.patrickmcnutt.com and participate in the Discussion Forums available onthat web page. Some of my arguments are distilled from consultancy work andsupervision of MBA and PHD students. To all my former MBA students, I amindebted to your knowledge and thankful for your patience as we struggledthrough the lecture materials. We are not there yet but this E-book is the firsthurdle.
My inspiration is due to Martin Scully, a teacher par excellence and to WilliamBaumol for critical commentary as a reviewer of my published work. The usualdisclaimer applies. PMcN © 2008. Patrick McNutt, Donegal and Dublin,Deember 2008.
Qui desidarat pacem, praeparet bellumFlavius Vegetius Renatus

Chapter Outline
1. Framework T3 1
2. Game Embedded Strategy 11
3. Baumol Hypothesis 19
4. Marris Hypothesis 27
5. Cost Technology 39
6. Players and Vertical Blending 48
7. Mistake Proofing 59
8. Homo Ludens 74
9. Market-As-A-Game 81

1. FRAMEWORK T3
When a lady contemplating a picture in Matisse’s studio said to him, ’Surely the arm of this woman is much too long,’
the artist replied, ‘Madame you are mistaken. This is not a woman. This is a picture.
John Cohen
Introduction
This E-book is work in progress. The text complements the e-learning softwaretool Kaelo v2.0 available on the web portal www.patrickmcnutt.com. Thetheme of the E-book is management type. It is not a book on game theory perse nor is it a book on the microeconomics of firm behaviour; it is a book thatdraws upon basic arguments in both and distills those arguments into a cohesivesetting called Framework T3. We are able to understand management behaviourby focusing on type of management, using a framework based on a range ofvariables that can be observed and computed. Type is the integration (withrespect to time) of the signal used by management in communicating itsbusiness strategy. The proposed framework will draw upon the managementmodels, the traditional Baumol model and the Marris model and a costleadership (CL) model. Although specific economic characteristics will beidentified - Baumol on price, Marris on dividends, CL on costs or leader-follower in game theory - our overall objective is to present a managementframework within which management signal their type to the market.
The impact of both type and signalling on business strategy is the genesisof Framework T3. Signals convey information about type. A signal is the firstderivative of type with respect to time allowing the observer of the signal toform a judgement on whether the information conveyed is true or false.
Type = f.(Signals)
For example, if Baumol Inc conveyed a signal in time period t and it wasobserved at t by Rival Inc then Rival Inc could believe with certainty thatBaumol Inc is of Baumol type and will be observed as reducing price tomaximise revenues in time period t. Rival Inc could trust Baumol Inc and trust
1

in this particular instance becomes an assessment tool in Framework T3. If theywere competing for market shares, then both Baumol Inc and Rival Inc are nowin the market-as-a-game and they are both players in that game.
Arguably, type can be portrayed by a signal but not every signal observedportrays the truth about type. Baumol Inc can simultaneously signal a type andkeep a secret. Rival Inc, a trusted competitor, would be in a preferred positionif Rival Inc could read the signals from Baumol Inc and detect that secret. It isin reading the signals that an understanding of management type is crucial. Typeas a value badge can therefore be a function of signals.
When Apple Inc launched its iPhone in the summer of 2007 did it do so inthe belief that here was a gPhone about to be launched in the market? Ourconceptual analysis of type is reminiscent of the managerial models with anemphasis on management discretion within a company. The launch of any newproduct is a company secret, the exact timing is the prerogative of the CEO.The degree of discretion, however, will be influenced by signals in the market-as-a-game, underpinned by reference to the capacity constraints inherent in theproduction technology of the company. Time is introduced by the very natureof the game: in a sequential game each player has time to observe the actionsand reactions (the moves) of the opponent. Collectively, type, technology andtime represent Framework T3. If the iPhone was launched at time period tbecause of signals about a gPhone then the Apple Inc strategy can best beunderstood within Framework T3.
Traditional economic models, known as Neoclassical profit maximizationmodels are based on perfect knowledge and rational logic, aiming at maximisingprofit. The firm is defined as a single entity with no separation of ownershipand control and seeks to maximise profit subject to resource and marketconstraints. Whilst this has the advantage of being easy to model it is relativelymore difficult to model the importance of the decision making process withinthe firm in how it affects the outcome of any decision. Conversely, thebehavioural theories of Simon, for example, try to take into account thatmanagement like any other human activity will be subject to the irrational, andis less focused on one single goal. The decision-making1 process allows themultiple decision makers in a firm to reach a satisfactory level of attainmenttowards their individual goals and involves a trade-off between eachmanagement group in their individual ambitions.
Signalling, Strategy & Management Type2
1H.A Simon introduced the notion of ‘satisficing’, a dilution of the absolute goal of maximising their attainmentgiven the limitation of knowledge and the degree of uncertainty that would prevail on any given decision. Simonargued that “people possess limited cognitive ability and so can exercise only ‘bounded rationality’ when makingdecisions in complex, uncertain situations.” This level of satisfaction is not fixed but will vary dependant onexperience and perception of risk and uncertainty. This concept was developed by Cyert and March who soughtto emphasise the “alternative decision logic – the logic of appropriateness, obligation, duty and rules.” Thus inmost organisations a set of standing instructions tend to dominate in most managerial decisions “rather thananticipatory, consequential choice”

Determining where the final decision rests is harder to model as this willvary from one organisation to another dependant on how responsive the firmis to adjusting to their collective experience in the market-as-a-game. Theoutcome will also be influenced by the prevailing conditions surroundingdecision-making: is it collective or individual, a sequence of choices orstandalone, a single criterion or a collection of less defined criteria and theinherent willingness within the management structure to obey the rules. Byobeying the rules, management keep to type. Conversely it could be arguedthat this adversarial approach to decision-making can promote thedysfunctional creativity that Mary Follett espoused in 1924’s CreativeExperience. Decisions that have been reached through this process of collectivebargaining could be seen as having a greater chance of optimising the firm’sresources and therefore its profitability. However these multiple factors couldalso act as a restraint from achieving profit maximisation. Leibenstein, in histhe 1976 Beyond Economic Man argued x-factors can also dictate the behaviourand efficiency of the company. Dependent on the firm’s history of managementinitiatives, this x-inefficiency can affect the firm’s productivity, profitabilityand size.
What is Type?
Framework T3 focuses on management as individuals and, as individuals, theycan be assessed or ranked by both personality and style, attributes that arepersonal, subjective, easily observed but difficult to determine. Managementdo have a unique idiosyncratic style of leadership But there is a further intrinsiceconomic characteristic more meaningful as an innate determinant of acompany’s performance, and that we call type. Type is a behaviouralcharacteristic, often overt and occasionally covert, an innate characteristic thatwe would wish to observe as a barometer of the likely future behaviour of ourcompetitors in the delivery and execution of their strategy.
For example, the Baumol hypothesis is about sales revenue maximizationand one way to achieve this is to focus on price. Under normal circumstances,when price falls, consumers on average buy more and sales revenue shouldincrease. Management can signal a Baumol type by focusing on price or byfocusing on revenue maximization. Since revenue maximization can beachieved by using price it becomes imperative for management to understandthat price not only serves to maximise total revenue, but also acts as a signal torival competitors. Organic growth as opposed to growth by acquisition is a keyfeature of the Marris model with an emphasis on using capital for R&Dexpenditure in a trade-off with less dividends today for more dividends
Signalling, Strategy & Management Type 3

tomorrow. Management can signal a Marris type by focusing on organic growthby signalling increased R&D expenditure.
Later in the E-book we will explore types that are located in noncooperative game theory. For example, there is a type called price followerwherein the management of company A are observed as reducing price inreaction to your price movement. What, if anything can you, the managementof company B, infer from the behaviour of company A? What, if anything canyou glean from additional information on type? If company A’s type is signalledas a price follower type, and if that type has particular attributes, whatguarantees do you have that the management of company A will subscribe tothem at a point in time? In particular, would they necessarily follow your pricelead in a game?
In the market-as-a-game management waits and observes what happens.Because the future is less certain, the probability that reaction from rivals willfollow your action will be very high in some markets, notably in the oligopolymarkets, where interdependence is the norm. The value of waiting thusincreases. Management that would have hithertofore acted unilaterally on aproduct launch (Marris type) or price change (Baumol type) may reconsidertheir plans. In the interregnum, rivals observe each other in a wait-and-seescenario. Why is the future less certain? There are many reasons advanced inthe literature; but in this E-book we focus specifically on three viz type,technology and time – the three ‘ts’ in Framework T3.
Trade-Offs
In order to understand type of management we need to understand trade-offs.An indifference relationship considers the trade-off between two variables, Xand Y. Management type can be linked to a financial variable – profits, costs,value or sales revenue. For example, a Baumol type focuses on revenues andsales maximization, a Marris type focuses on organic growth through productdiversification, and price follower focuses on competitive price movements.Therefore one key determinant in understanding type is to be able to unravelthe trade-off that is implicit in the management decision-making. In otherwords, we need to identify a 3rd variable, Z, about which the variables X and Yare indifferent because Z remains constant over the decision making horizon.
The family of management models, including Baumol, the early models ofWilliamson and indeed Marris, have two key attributes in common, attributesthat park their application outside the traditional ranch of the microeconomictheory of the firm. Firstly, management are not so pre-occupied with profitmaximization as is the norm within the neo-Classical models of the firm. There
Signalling, Strategy & Management Type4

are other variables that do attract the interest of management – maximizingrevenue, maximizing the growth of the company, avoiding price wars, or indeedmaximizing their personal utility or satisfaction. It is the latter that gives riseto a second distinguishing characteristic of the management models – theapplication of indifference curve analysis to management behaviour.
Indifference Analysis
Within the neo-Classical paradigm the indifference analysis is uniquely appliedto understanding the behaviour of consumers: a random consumer is said to beindifferent between two baskets of fruit if her utility – the Z or 3rd variable -does not change in choosing one basket over another. So whether the consumerhas 5 apples and 3 oranges or 3 apples and 5 oranges, her utility does notchange, and thus she is declared indifferent as between both baskets of fruit.An indifference relationship can be ascribed to her choice. However, we arepresented with a unique application when we ascribe an indifference analysisto the behaviour of management.
We need to identify two variables around which management could beindifferent: profits and market share or profits and annualized sales revenues.The choice of pair may be entirely subjective, as management differ in theirtrade-offs across the variables. For some intent on lowering costs, there maybe a trade-off between labour and capital expenditures, moving between lesslabour intensive and more capital intensive in the production technologyprovided productivity does not change. In such a scenario, productivity takesthe place of utility – a third parameter that does not change as managementdecides between the pairs of less L more K, and more L less K. The difficultylies in identifying that elusive third variable, a difficulty compounded by thesubjective nature of the indifference analysis. In the Marris model, however,we will identify value as marked by the market capitalisation of a company, asa candidate for the 3rd variable, but value that is underpinned by growth.
Z or 3rd Variable
However it is in trying to identify a 3rd variable that type becomes important inunderstanding management behaviour since type can be signalled tocompetitors by the observed behaviour of management. As individuals we areinclined to keep to type, observed by our behaviour as we keep to type. It isthese patterns of observed behaviour that rival competitors should be lookingfor in scoping the behaviour of the management of a competitor. For example,if a new CEO has a history of growing companies by acquisition then there is
Signalling, Strategy & Management Type 5

a high probability that the CEO will keep to type in the new company andattempt to grow by acquisition rather than achieving organic growth.
Detecting the identity of the 3rd variable Z is interesting. Remember thatmanagement are only prepared to trade-off Y and X provided U(Z) does notchange. So what is Z? This is a guessing game between management and theinvestment community, shareholders and external stakeholders including rivalcompetitors. The identity of Z could provide an insight into the strategicthinking of the management and that becomes critical in the playing of games.Figure 1.1 illustrates a managerial indifference trade-off relationship.
Often Z is identified by management as growth or value or costs. But generallyit is camouflaged. Management do provide signals to the market or investmentcommentators and analysts contribute to the guessing game by offering opinionsas well as to the identity of Z. We shall look in detail at the Marris modelwherein managerial discretionary behaviour is allowed because of the principal-agent relationship that facilitates growth. Management therefore has thediscretion to focus on the growth rate of a firm. By adjusting the growth rate,management can achieve their personal goals, such as status, power and pay
Premium on Type
We can ascribe an indifference relationship to management type. Theexplanatory power of a managerial indifference relationship is greatly enhancedwhen we include forms of personal and social capital in the management utilityfunction. Management receive share options and indeed the share price of acompany includes a premium on the type of CEO. In Apple’s case, for example,
Signalling, Strategy & Management Type6

there is a premium on Steve Jobs as CEO built into the share price.Management have objectives and they derive a sense of personal satisfactionfrom realising that objective. An important attribute is that type displays signalsto the market inclusive of consumers and competitors. More importantly, thesignals are observed by shareholders and investors in the company. There aretwo important signals: (a) dividends signal and (b) price signal. The latter iscrucial in that we have elevated price to the level of signal. What does thatmean? Traditionally, if company A lowers its price, it is in reaction to a levelof demand. Now, that very act of lowering of price may be construed by acompetitor as a threat to his or her sales, and thus provoke a price reaction.One must remember that 50p is cheap if the competitor is 60p; but reducingmy price to 30p will only secure more sales if my competitor is still 60p.
PLT: Positive Learning Transfer
In our observations there are different time periods, t, which corresponds tonow, and the future as represented by time period t+1. Decisions taken in timeperiod t have consequences in time period t+1. In other words, a trade-offbetween two variables in time period t could be explained by the likely impactof that trade-off on a third variable in time period t+1. Consider the followingstorybook. The growth in the company depends upon the growth in the market.In the market the company sells a range of products, so growth in the productswill grow the market. Product diversification at time period t enables thecompany to grow organically in t+1. However this requires investment in R&Dand technology to ensure that the products are differentiated in the market tosustain the growth in sales required to filter back into company growth.
With higher investment in R&D there may be a claim on the finances ofthe company in time period t as shareholder require dividends, as more isexpended on R&D so the company could go the external market and borrowfunds externally. Alternatively, management could decide to use internal fundsto finance the R&D in period t, postpone dividend payments until period t+1and focus on maximizing the growth of the company. As the company grows,and management opt to deliver dividends in period t+1 the value of thecompany may increase. This implicit trade-off observed in a Marris type,between payment of dividends v more expenditure of R&D is at the heart ofunderstanding the Marris model. The elusive third variable is the value of thecompany.
Signalling, Strategy & Management Type 7

Table 1.1 Model Objectives
How can an optimal trade-off be achieved? It can be achieved by a positivelearning transfer from the management to the shareholders orchestrated byproviding information and reassurance in the activities of management. And ofcourse if management were observed in the past as successfully maximizinggrowth then shareholders may be persuaded to trust the type of management.However, shareholders are prone to follow a Bayesian-type rule in seeing whatthey want to see – so if it is the case that profits fall in time period t during therefocus of strategy towards more product diversification, shareholders will onlysee the falling profits and react by selling stock. It is therefore imperative formanagement to transfer a positive learning about their behaviour and plans tothe shareholders. This can explain the willingness of many CEOs to appear onbusiness channels such as cnbc.com and Bloomberg.com.
Behavioural approach
One of the more interesting applications in the business world is the applicationof game theory in shaping strategy. Game theory focuses on observed behaviourand allows us to identify patterns from which we can predict a likely futureoutcome. Look around you: observe the number of right handed people besideyou – it is relatively easy to predict that if you were to hand any one of them apen to write that they would write with their right hand. However, if theindividuals know that you are observing them as right handed individuals, thensome of them may fool you and write on paper with their left hands. A game of
Signalling, Strategy & Management Type8
Behavioural Baumol Marris FrameworkT3
Approach Satisficing - Maximisation - Maximisation - Maximisation -subject to Profit subject to Profit subject to subject to
Constraint Constraint Security External Constraint Constraints
Short v Varies Short Long Time Period Long Term t+1
Decision Yes No No DQs Making Coalitions
Objective Multiple goals Sales Growth Z or 3rd Variable
Principal Yes Yes Yes YesAgentRelationship
Reaction & Yes Partial YesPartial Nash repliesInteraction

poker is a typical game of observation and trust wherein a sequence of movesis played, the game ends and then winnings or payoffs are realised. Thesequence of poker-hands can be regarded as moves and they represent a game.Schooled players will look for connections between poker hands and eachplayer will be observing what every other player is doing or not doing as thegame unfolds. Everyday in the business world, management are observingrival prices, costs, and share price movements. The business environment isone that is rich with observed data.
Whilst all these managerial models have recognised and promoted a singleover-riding goal that complements profit maximisation, they are all in theirown way forced to recognise that other factors will still potentially interferewith the model. This would imply that focusing on a single over-riding goal isunrealistic. The behaviourist approach has recognised the multiplicity of goalsfrom these managerial models and have allowed for the greater complexity thatresults by moving away from a single ‘maximised’ result to a ‘satisficed’ result.It is the means by which an outcome is reached not the goal that is importantbecause the outcome is a compromise on many different goals, the influenceand importance of each varying from one business to another.
Therefore management display certain characteristics – a type - dependingon their business and industry experience, the costs and the constraints ofcompetition. Over time management’s objective is to increase the relativeperformance of the company and Framework T3 conceptually integrates thecore of economic reasoning with the other business disciplines, for example,finance and marketing, by providing a common framework for investigatingand understanding management behaviour as a signaling game. Managementbehaviour expands with the market-as-a-game or disappears as a function ofthe game. In the real world, business decisions may be influenced by manydifferent kinds of considerations. The owners and managers of firms may havea variety of goals and objectives, especially over longer periods of time. Theymay conceivably be motivated by a desire to become well respected in thecommunity, or to serve some other higher purpose such as promoting theirhome country’s national objectives, or they may simply want their organisationto become as large and powerful as possible. However, the basic economictheory of business behaviour is based on a very different premise: that firmexist to earn profits and that the goal of management will be to maximise thoseprofits (or minimise their losses) in time period t+1.
Framework T3 places emphasis on explaining how decisions are takenwithin the firm, and goes well beyond neo-classical economics. In our earlierreference to the Baumol hypothesis, if management opt to use a price reductionin order to increase total revenue, the objective will depend ultimately on the
Signalling, Strategy & Management Type 9

price reaction of a competitor. So management type and player type anddifferent choice situations call for different decision approaches bymanagement. Simon in the 1950s argued that “people possess limited cognitiveability and so can exercise only ‘bounded rationality’ when making decisionsin complex, uncertain situations.” Completely rational decision making involvesidentifying alternatives, projecting the probabilities and outcomes ofalternatives, and evaluating the outcomes according to known preferences.These information gathering and information processing requirements arebeyond the capabilities of any organisation. In practice, organisational decisionmaking departs from the rational ideal in important ways depending on thecontingencies of the decision context. Richard Cyert and James March (1963)coupled bounded rationality with the assumption that human actors are myopic.
Therefore the behavior of management is critically assessed in the contextof testing management’s ability to affect outcomes. Management as anindividual is to be understood in terms of a rational individual making adecision. Within the decision-making process for a modern organizationmanagement teams take the actions as their combined effort and expertiseimpact on knowing when and how to act. The conflict, that is, the trade-off,referred to earlier is necessarily a conflict of subjective outcomes as differentmanagement have different outcomes to a given action. Management A, forexample, change price to achieve a subjective outcome; however, managementB’s reaction to the price change will depend on B’s own subjective outcome.Neither management take price as exogenous. Price is now a signal. Thereforeboth need to know the type of all participants in the market as well as their ownfirm’s production technology in order to compete.
Signalling, Strategy & Management Type10
2. GAME EMBEDDED STRATEGY
We are capable of continuing to believe thingsthat all the evidence shows not to be true,
even long after everyone has demonstrated that they’re not true’.George Orwell
The original Neoclassical theory of the firm was originally developed on theassumption of perfect knowledge. That assumption has now been substantiallymodified, and its modification has allowed the development of sophisticatedtheories of decision-taking under conditions of uncertainty. But this uncertaintyrelates simply to the future outcome of alternative courses of action; and it isuncertainty of a probabilistic kind. But uncertainty extends much wider thanthis. Management are bounded rational – they do not have the informationwhich the traditional theory assumes that they have. They are informationconstrained or the information may be flawed or out of date. Therefore strategyneeds to be defined within the contours of bounded rationality.
In addition, the market is a game, as rival competitors compete for marketshare. Each move by a company can be observed and a sequence of movesconstitutes a strategy. Type as we understand it for the purposes of this E-bookrefers to the boundary of managerial behaviorism, that is, to the study of theirovert actual behavior. As applied to management in understanding strategy,there is a need to focus on the role of subjective value and methodologicalindividualism, that is, management as individuals realizing their wills despitethe resistance of others. In other words the CEO is an individual, managementare individuals and as individuals they have a type. Views on type and relatedtopics have deep historical roots across many disciplines2 in an attempt tounderstanding the behavior of rational action.
Critical Time Line
The key to understanding type in Framework T3 is to understand behaviour,and thus to infer from observed behaviour the likely actions and reactions ofmanagement in the business world. Management can suffer from a failure tounderstand rival competitor behaviour. Part of the explanation is that
11
2Jones, T (2004): Business Economics and Management Decisions, Wiley; Mahoney, JT (2005): EconomicFoundation of Strategy, Sage; Hagstrom, R (2005): The Warren Buffet Way, Wiley;

management are bounded rational; in other words, they do not factor in all thepossible scenarios, nor do they afford time and effort to analyzing rivalbehaviour, clinging instead to a bunker silo approach. At the root of this failureis a misunderstanding of the importance of type. If management’s decision todo x is in any way influenced by the type of rival management, then competitorsdo have an implicit belief system, thinking or believing what the other may door how they may act.
It is one thing to believe or think about how another individual is morelikely to behave, and in the absence of any signals, chat or communication, onehas to rely on one’s belief system. Alternatively, management can observebehaviour as signals and as patterns in the signals. The pattern can be difficultto determine and requires many years of observations. In the interim, we canread the signals of CEO type by listening to their views on cnbc.com orBloomberg.com, at conferences or at company briefings to the equity markets.Each CEO has a type, a particular economic characteristic that can give a clueto strategy. It is imperative to observe the signals in order to understand type.Patterns do emerge in the observed behaviour, patterns on price movements orpatterns to do with achieving growth through acquisition. The patterns create acritical time line (CTL) of observed actions and as the CTL unfolds, it revealsa strategy. You can see the critical line for Microsoft and Sony in Kaelo v2.0during the period 2000-2004 with the launch of PS2 and Xbox. Comparingcritical time lines for both Nissan and General Motors can help in evaluatingthe strategy adopted at Nissan. Check the CTL for Nokia and Apple presentedat page 71.
Table 2.1 Critical Time Line: Nissan Example
Signalling, Strategy & Management Type12

Zero-sum
In the competitive environment known as oligopoly wherein there are 5 or lessrival competitors, a degree of interdependence arises in the market.Interdependence creates a game dimension and transforms management intoplayers. Therefore it behooves us to look both at management type and playertype, reserving the latter to describe the behavior of firms, that is, firms andcompanies as we have come to understand them in modern business. In thecase of Intel v AMD in microprocessors the gain in market share by onecompetitor is at the expense of another as they both try to gain increasinglymore market share or consolidate existing shares. In many markets a unilateralgain in market share can occur as a direct consequence of a loss accruing to acompetitor.
The zero-sum constraint also acts as an external constraint. Oncemanagement realise that their pricing and output decisions depend as much onthe likely reactions of the rival competitors as it does on understanding theirconsumers, management may have to understand that there is a price andquantity output that is the best that they can do given the likely reactions of therival competitors. It is not, however, the best they can do in terms of their ownmotives. This is the Nash premise to which we will return in a later chapter.
The zero-sum constraint could easily arise in product markets where thereare fickle preferences and changing demand for increasingly differentiatedproducts amongst consumers. A player lags behind in the market due to aninability to differentiate fast enough in the market. It is contrary to the Model-T effect: consumers will buy your Model-T - only available in colour black -but over time preferences will change and more consumers will buy differentbrands of coloured cars. Growth and discretionary theories such as Marris andBaumol formally start from the same point that management has power overan objective function. Included in a managerial objective function are locatedthe motives of management: a desire for sustainable long term growth in thesize of the company as measured by (say) assets, employees, output or marketshare. In managerial theories the pursuit of managerial motives is subject toexternal shareholder constraint. The motives of management reveal their type.
Penrose effect
The real world competitive environment is different from the textbook modelof the perfectly competitive economy. In a perfectly competitive market,product markets are assumed to be supplied by a large number of small single-
Signalling, Strategy & Management Type 13

plant single-product owner-managed price taking firms with limited, if any,capacities for growth. Economists3 began responding to this from the mid-1950sto the mid-1970s, responses that can now be placed into three distinct groups:the discretionary theories (Baumol 1959, Williamson 1970), growth-orientatedtheories (Penrose 1958, Marris 1964, Mueller 1972) and the bureaucratictheories (Monsen and Downs 1965).
The modern company is a bureaucratic structure with an administrativecapability that could frustrate the achievement of sustainable growth.Consequently there are unique internal constraints within each company. Themanagement team operates within this structure; problems may arise within themanagement team on information about opportunities for growth or topmanagement may not be capable of making a decision. In other words,management per se may act as a constraint on achieving a growth rate throughtime. This is referred to as the Penrose effect and it represents a tangible costof growth within the company. In the E-book it is the failure to understand typeand its implications that exacerbates the Penrose effect. It is imperative formanagement to realise that their respective actions are interdependent. Oncemanagement recognise their interdependence and act accordingly then they arein what we are labeling a game dimension. How to filter the rival’s type intothe decision on x will be guided by the rules of sequential non-cooperativegames; how best to respond will ultimately depend on the underlying costtechnology of the company.
Table 2.2 Typology on Type
Nash Premise
In the game dimension there is an important rule. It is called the Prisoners’dilemma (PD). It is critical for management to understand the dilemma in orderto avoid incurring a Penrose effect. In the original PD two prisoners are faced
Signalling, Strategy & Management Type14
3Baumol, W (1959): Business Behaviour, Value and Growth, Macmillan, NY. Marris, R (1964): The EconomicTheory of Managerial Capitalism, Macmillan, London. Mueller, D (1972): ‘A Life Cycle Theory of the Firm’Journal of Industrial Economics 20 (3)pp199-219. Monsen, R and A. Downs (1965): ‘A Theory of LargeManagerial Firms’ Journal of Political Economy, 73(3) pp221-236. Penrose, E (1958): The Theory of the Growthof the Firm, Blackwell, Oxford. Williamson, O (1970): Corporate Control and Business Behaviour, Prentice Hall,NJ.
Signal Type Observation
Price Baumol Low Prices Dividends Marris R&D increase Costs CL Reduce costs
with a dilemma when caught by the police for burglaries: do they trust eachother enough to cooperate to minimize total loss of liberty, or will one of them,trusting the other to cooperate, betray her so as to go free?. Knowing that thereis a bond of trust, the police interview each prisoner separately and tell eachprisoner that the other has informed on them. So do you trust your friend orbetray her and take the deal from the policeman? Both prisoners betray in theabsence of a strong bond of trust. Management type will be characterised as aPD game later in the E-book.
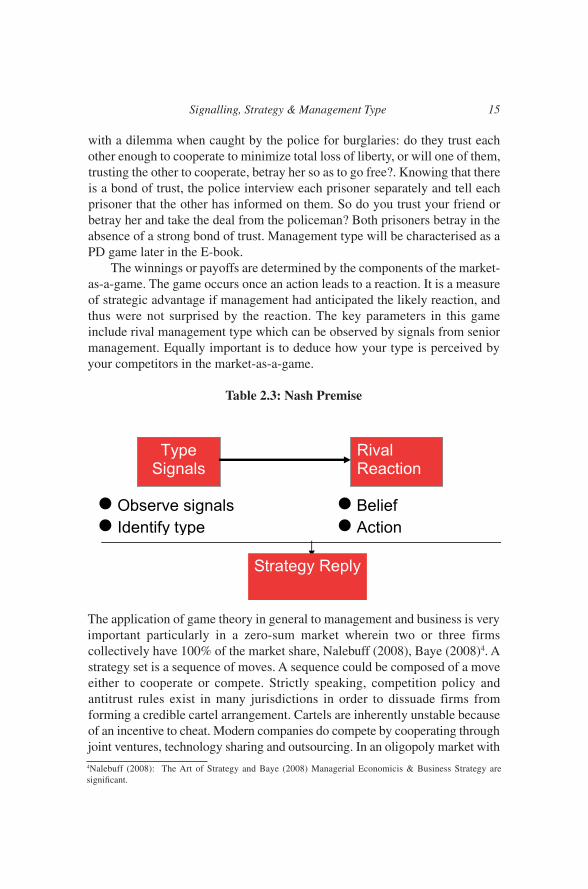
The winnings or payoffs are determined by the components of the market-as-a-game. The game occurs once an action leads to a reaction. It is a measureof strategic advantage if management had anticipated the likely reaction, andthus were not surprised by the reaction. The key parameters in this gameinclude rival management type which can be observed by signals from seniormanagement. Equally important is to deduce how your type is perceived byyour competitors in the market-as-a-game.
Table 2.3: Nash Premise
The application of game theory in general to management and business is veryimportant particularly in a zero-sum market wherein two or three firmscollectively have 100% of the market share, Nalebuff (2008), Baye (2008)4. Astrategy set is a sequence of moves. A sequence could be composed of a moveeither to cooperate or compete. Strictly speaking, competition policy andantitrust rules exist in many jurisdictions in order to dissuade firms fromforming a credible cartel arrangement. Cartels are inherently unstable becauseof an incentive to cheat. Modern companies do compete by cooperating throughjoint ventures, technology sharing and outsourcing. In an oligopoly market with
Signalling, Strategy & Management Type 15
4Nalebuff (2008): The Art of Strategy and Baye (2008) Managerial Economicis & Business Strategy aresignificant.

5 players the presence of an acute zero-sum constraint and interdependence canact as a trigger for a merger wave in the industry. In other words, oncemanagement realise that they are players and the market shapes the dimensionof the game, an alternative to competing is simply to cooperate or merge. Butthere is always the element of trust.
If the players trust each other then they can believe the signals in the market.However there is sill a preference for dishonesty amongst some players, andthus it becomes critical to understand the type of player in the game. Chandler’sthesis is that structure follows strategy. In other words, it is the behaviour ofmanagement, observed in the CTL as strategy by competitors, that determinesthe market structure. If a firm’s strategy is to be carried out, or implemented,individuals working within the firm must know about the strategy and itsoperational requirement for tasks and actions. How management responds toproblems of information, innovation, coordination and commitment in a gamewill determine its long term position in that game. How they respond toproblems of information, innovation, coordination and commitment in a market-as-a-game will determine the firm’s long term position in an industry.
What market should we be in?
It is critical for management to answer the question: what market should we bein? A company should not be in a market-as-a-game unless they understandthe dimension of the game, that is, number of players and the type of each ofthe players in the game.
Table 2.4 GEMS
The decision-making process involves a run-off between three possiblescenarios: (i) competition and cooperation, (ii) adaptation and (iii) technology
Signalling, Strategy & Management Type16

and game and feedback. Determining what market the company should be inis hard to predict, as this will vary from one firm to another dependant on theinfluence management is able to exercise, on management type, on player typeand how responsive shareholders are to adjusting management expectations.The outcome will also be influenced by the decision-making process per sewithin the firm and the inherent willingness to follow the rules. Oncemanagement discount the likely reaction of a competitor to an impending pricechange, management are said to be in a ‘game’ wherein decisions and outcomesare interdependent. The degree of interdependence is important: as the numberof competitors fall below 5 (oligopoly) there is a mutual understanding drivenby the innate structure of the market that each company in an oligopolystructure could do better in the absence of price competition. It is a differentmatter to announce that management proceed to cooperate: on the contrary, webegin from the premise of non cooperation.
In a GEMS environment of non cooperation with mutual interdependence, adecision by company A will lead to a reaction from company B. Therefore Ashould expect a reaction from B and vice vearsa. If the management of
Signalling, Strategy & Management Type 17

company A have no contingency in terms of any reaction from B then there isthe possibility of misguided decision making by A. The expectation of a likelyreaction and its computation is at the heart of the economics of strategy. Theeconomics of strategy contains an emphasis on the use of non cooperative gametheory as a tool of analysis to understand management behaviour. Carefulattention is placed on management type and the identification of signals fromthe decisions, actions and commentary of management. Decisions on price andcosts, for example, are taken in the context of likely reaction from competitors.
CTL and Ambush Strategy
In Cross’s book on Jungle Warfare (1989) there is an interesting discussion ofmilitary ambush strategy during WWII. Ambushes can be of any shape butbasically they are linear and area in concept. The critical time line (CTL) is alinear concept and allows management to identify a pattern of observedbehaviour. The geography and the product spaces define the dimensions of thegame. He continued, interestingly to identify the parameters for success ‘forsuccess a few things not to be forgotten on the battle field: surprise, silence,security, a rehearsal whenever possible and a reserve (p211)’. Earlier in hisbook, he had argued that adverse reaction on being surprised was minimisedby well-tried and instinctive immediate action drills. But there are signals asindicated in this passage on tracking discipline: one successful alternative wasleaving the track walking backwards into the jungle with some of the forcecontinuing walking forward then leaving then track into the jungle on theopposite side….[sic][ this was risky as the footprint of those walking backwards(when the toe imprint is greater) and those walking forwards (when the heelimprint is greater) are patently obvious (p87)’. The ambush strategy is bothlinear and area in context. The linearity is captured by our critical time line thattracks a range of observations including price and product specifications.
The area dimension to ambush strategy is about geography. In China at themoment (late 2008) a player called Tencent has emerged as a leading player inthe instant text messaging (IM) market ahead of MSN. Tencent’s QQ instantmessaging success is linked to the demand for IM from the newly employedyoung Chinese consumers. The threat from the new 3G cellular networksoffering more Chinese consumers access to mobile email will appear on thehorizon in 2009-2010 as 3G networks begin to roll-out their services. Howshould Tencent react? One way to react is to adopt a ‘well-tried and instinctiveimmediate action drill’: QQ’s success is based on the social networking andonline gaming services it provides. So it could ‘walk forward’ into a strategythat builds on these two aspects with a range functionalities that are better thancurrently available on tried and tested 3G networks abroad.
Signalling, Strategy & Management Type18

3. BAUMOL HYPOTHESIS
I was so much older thenI am younger than that now
Bob Dylan
In the history of economics applied to the business world many scholars andpractitioners were skeptical toward the focus on managerial behaviour. Duringthe latter half of the twentieth century managerial theories of the firm began toemerge in the literature as economic theories on how the behaviour of modernmanagement affected the working of the economic system, rather than the otherway around. The debate on strategy determining structure is implicit in theChicago hypothesis of modern antitrust and the Chandler dilemma is a keycomponent of strategic management. They have, however, been the subject ofconsiderable research in the management literature.
Therefore this E-book is not about the models per se; however, some ofthe managerial models will inform our discussion of type. As suggested,Baumol type is related to the fundamentals of the Baumol model: there is acorrelation between price and TR dependent on the price elasticity of demand.When a price reduction is observed, rival management should stop and think:is it a one-shot price reduction to increase TR or not? How to respond dependson the belief system and on what one observes as signals in the market.
So type is ascribed to management as a unique and, sometimesidiosyncratic behavioural characteristic that can be inferred from understandingthe motives of management. Arguably, management in debates over strategycan look to behavioural theories about type to gain a better appreciation of theassumptions and foundations of their own business acumen. For type to berelevant to understanding modern business we will argue throughout thatoutcomes, as measured by key financial indicators, are equally likely acrossmanagement but that information about a rival competitors’ management typedelivers a competitive advantage.
Oligopoly n < 5
Five is a key number of competitors (n) in a market. With five or lesscompetitors, each competitor becomes increasingly aware of the degree ofmutual interdependence amongst the group. Framework T3 could provide
19

management with a framework for assessing the competitive environment inmarkets increasingly defined by a smaller number of competing firms. Howsmall? Markets are increasingly characterized by 5 or less rival competitors,the quintessential oligopoly market structure. In everyday experiencemanagement as a team are concerned with price and quantity outcomes in anoligopoly market and how those outcomes could change from one particularcircumstance to another in that competitive environment. For example, theappointment of a new CEO by a rival competitor could change the outcomesand indeed the dimensions of the game.
In the literature, dissatisfaction with the simple conception of a firm as amechanism which transforms atomistic inputs into marketable outputs resultedin alternative perspectives on the firm. New emphasis has been placed on theinternal structure of the corporate firm and the emerging managerial theoryemphasised the complex nature of the modern corporate firm. In theirpioneering work, Berle and Means (1932) described the diminishing influenceof shareholders in the decision making process of large corporations in the USfrom the turn of the 20th century. This left much of the decision making tomanagement, whose objectives, it was suggested, could be different from thoseof the owners of the firm. If, in terms of its influence on managers’ salaries,size of firm, for example, was more important than firms’ profitability, thengrowth could be a more important objective of firms than profit. This is key tounlocking the 3rd variable.
Other reasons were advanced as to why management may be morepreoccupied by sales or revenue maximisation than by profit maximisationBaumol (1967). If sales fail to rise, this is often equated with reduced marketshare and market power, and consequently, with increased vulnerability to theactions of competitors. Under a zero-sum constraint, management may notrealise their sales targets as rival poach market shares. When asked about theway his company performs, an executive would typically reply in terms of whatthe firm’s levels of sales are. The financial market and retail distributors aremore responsive to a firm with rising sales. The model developed by Baumolattempts to reconcile the behavioural conflict between profit maximisation andthe maximisation of the firm’s sales, its total revenue. It assumes that the firmmaximises sales revenue subject to a minimum profit constraint.
Elasticity
The revenue-maximising level of output is the level at which the marginalrevenue is zero and the elasticity of demand is one. For a Baumol total revenuesales maximising firm prices are low when demand is elastic, that is, for every
Signalling, Strategy & Management Type20

10% reduction in price, total revenue would increase by at least 10%.Embedded in the demand relationship is a measurement of how responsivedemand is to price changes. This is called price elasticity ep. It is a key linkbetween price and total revenue. A supplier will supply more if the priceincreases, subject to production constraints. However, at the higher price withgreater supply, a key question remains: is the total revenue accruing from theadditional supply higher than before the price change. This goes to the heartof the concept of elasticity, which measures the responsiveness of demand toprice.
ep = %Dq / %Dp
Remember that the formula for total revenue is TR = p.q. So any change inTR can come about from either a price change %Dp or a change in demand (ata given price) %Dq.
The q is the amount of product purchased by the normal rational consumer.For some products if the price increases total revue will increase. As illustratedby the Kaelo v2.0 software, there are products for which total revenue willincrease only if the price actually falls. The former are inelastic products andthe latter are elastic products – the key driver is the responsiveness of demandto price changes. This is clearly illustrated later in this Chapter.
Baumol type
A Baumol type focuses on pricing as a driver of revenue and volumes but mayface a cost-volume constraint, whereas a Marris type chooses betweenmaximum dividends or growth but faces shareholder concerns over the valueof the company. Competitors would observe a Baumol-type strategy based onleveraging revenues from a pricing policy. Provided the demand elasticity issufficiently elastic, a price reduction should produce the increase in intendedsales revenue. It is by reducing price that management are able to maximizethe revenue yield from the asset. This is better know in the industry as yieldper passenger, average revenue per user (ARPU) or simply ‘bums on seats’pricing.
Signalling, Strategy & Management Type 21

Figure 3.1 Baumol model
The business model works until elasticity falls: initially elasticity is high asconsumers switch from good or service x to the Baumol good or service, y, butthe preference set of the once-x-now-y consumer changes as they experiencethe good but with lower opportunity costs. These are known as switching costs.To understand this, recall that the revenue is TR = p.q and that DTR = Dp.q tobe followed by Dq at the new lower p, Dp. There is a sequence in pricing asrevenue awaits the lag in quantity-sales response. For various reasons,particularly, to do with quality and price, consumers may be weary of a pricereduction from the higher priced elastic segment. In that segment, the higherprices have been sustained and supported probably by increased advertising andconsumer persuasion. Or the Dq may not materialise as consumers remain loyalto a rival player or indeed, even with a Dp = 8, your final lower price may stillbe higher, relative to a rival’s price. So Baumol pricing, favoured by low costairlines model of revenue yield management, would fit into the top right handcorner of the following Table.
Table 3.1 TOTAL REVENUE TEST
Signalling, Strategy & Management Type22
Price Increase Price Decrease Ep > 1 Elastic TR decreases TR increases
Ep <1 Inelastic TR increases TR decreases
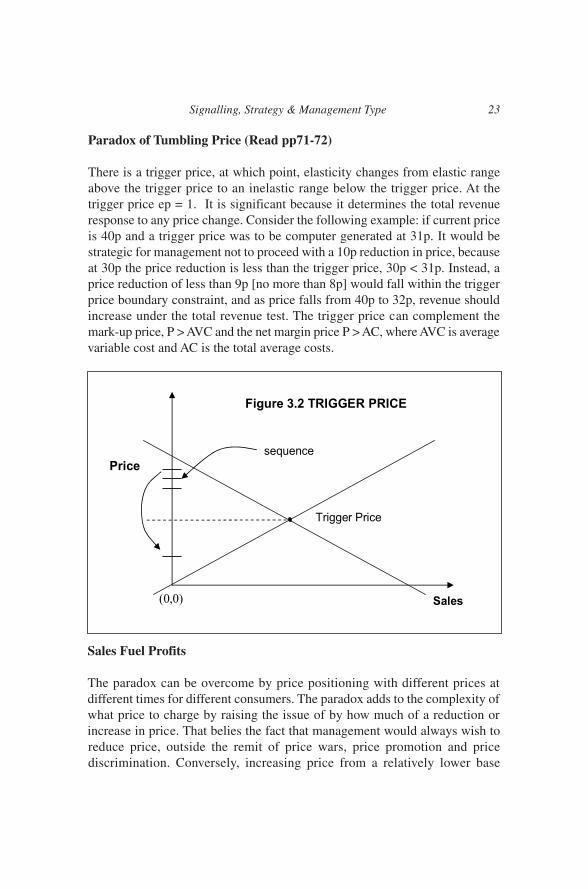
Paradox of Tumbling Price (Read pp71-72)
There is a trigger price, at which point, elasticity changes from elastic rangeabove the trigger price to an inelastic range below the trigger price. At thetrigger price ep = 1. It is significant because it determines the total revenueresponse to any price change. Consider the following example: if current priceis 40p and a trigger price was to be computer generated at 31p. It would bestrategic for management not to proceed with a 10p reduction in price, becauseat 30p the price reduction is less than the trigger price, 30p < 31p. Instead, aprice reduction of less than 9p [no more than 8p] would fall within the triggerprice boundary constraint, and as price falls from 40p to 32p, revenue shouldincrease under the total revenue test. The trigger price can complement themark-up price, P > AVC and the net margin price P > AC, where AVC is averagevariable cost and AC is the total average costs.
Sales Fuel Profits
The paradox can be overcome by price positioning with different prices atdifferent times for different consumers. The paradox adds to the complexity ofwhat price to charge by raising the issue of by how much of a reduction orincrease in price. That belies the fact that management would always wish toreduce price, outside the remit of price wars, price promotion and pricediscrimination. Conversely, increasing price from a relatively lower base
Signalling, Strategy & Management Type 23

requires sufficient spend on advertising to ensure that that segment of thedemand function complies with inelasticity. Empirical evidence5 has sinceconcluded that increased advertising expenditure rescues the elasticity ofdemand less than 1 but this applies to the entire range of the demand and refersto the overall slope of the demand. In the segment, management should thinkof the low price as a penetration price strategy, and once price is well below atrigger price, only then should a price increase be considered. And if advertisingexpend is increased, the lower segment encroaches more of the entire demand.In other words, an inelastic entire demand will have a greater probability ofinelastic segments. It is important for management in general to realize thatsales revenue growth (DTR) adjusted for market growth represents market sharegain. Essentially you are creating demand as well as building a brand.
Mr Mun & Mr Hotelling
One strategy to achieve sales revenue growth can be located in mercantilisttheories attributable to Mr Mun. Mun’s strategy, where product enters themarket at a lower price, market share is cultivated and then, only then, shouldprice increase ensuring, a small but insignificant drop in sales revenue, is betterknown as penetration pricing in marketing. If a trigger price is high, arisingbecause of the low level of elasticity, then management should considerpositioning the product’s price at a higher end of the price scale and in effect,be dissuaded from reducing price. In the latter case, even with the poaching ofmarket shares by generic products, branded products should distance their priceas far away as constrained by the boundaries of the trigger price from therelatively lower priced generic.
This line of argument accords with an interpretation of Hotelling’s maximaldifferentiation principle. And as an intermediary price strategy, pricediscrimination should be considered as a deliberate non-price war attempt tooffer consumers a range of prices for the same product. First degreediscrimination requires arbitrage and negotiation and is more appropriate forthe pricing of services, so, for example, in holding on to clients accounts,advertising execs may engage in this form of pricing. But it is the second andthird degrees that should interest the discerning strategic player. With seconddegree volume discounts are offered, also coupon pricing and the ‘six-packphenomenon’ whereas with third degree, depending on how the market isfragmented, different prices could be charged to different consumers at differenttimes of the day. Ironically, third degree pricing allows management to pass thetotal revenue test, as the relatively lower price is charged to the more elasticsegment of the market.
Signalling, Strategy & Management Type24
5Schmalensee (1979) Economics of Advertising MIT Press

Each of these pricing strategies, allow management to price position theirproducts while taking cognisance of the boundaries of the trigger price. Priceas a signal impacts on the magnitude of any price change, and also guides asto the appropriateness of the price direction, both for a given demand function.While recognising that the demand can both shift and change in slope thetrigger price develops a strategic angle when complimented by the three pricestrategies just discussed. What is important is the relevance of elasticity to thedebate; it is more than a response variable and it has a very important andstrategic role to play in any pricing game. While the behavioural models helpto instill greater realism into economic modelling, the profit constraint is stillan absolute. Should the firm continue to make extremely irrational decisionsthen eventually the economic consequences of failing to maximise theprofitability of the company will take its toll. The degree of leeway inperformance would therefore be proportional to the size of the firm, the marketshare and profit margins that it enjoys. Ultimately, it depends on managementtype.
Elasticity and the Want Paradox
If price is the key driver of revenues in the business model then product priceelasticity of demand has to be computed. Although net total revenue willincrease for product with elastic demand, nonetheless as price falls there is adanger that in a product market wherein consumers expect more ‘bells andwhistles’ that net total revenue will fall as price falls. In other words, ‘bells andwhistles’ reduce the price elasticity of demand. This has an interestingapplication to the low cost airlines (LCA) pricing model. Low prices, initially,persuade passengers to switch from rail or ship to plane but as they becomemore accustomed with airline travel they expect more bells and whistles forthe low price. A change in their elasticity will frustrate the revenue projectionswithin the LCA pricing model unless (i) there is greater price discriminationto exploit different elasticities of demand or (ii) the geography of the marketexpands. Paradoxically, as the LCA player enters new markets, the increase inplayer competition in the geographic market will generate an elastic (industry)demand.
Signalling, Strategy & Management Type 25
Table 3.2- Price elasticity and the impact of pricing decisions revenue

Significantly, passengers who may never have travelled by plane will be mostvociferous in demanding the bells and whistles. It is the phenomenon of thewant paradox: we do not need product called ‘unknown’ but once it is availablewe all want ‘unknown’ and wonder how we survived without it. The faxmachine, email and mobile phones are modern examples of this phenomenon,the impact of which is to reduce price elasticity. But product life cycle may beshort as new ‘unknown’ products emerge displacing existing products – forexample, email replacing fax - or more ‘bells and whistles are expected as withmobile phones where preferences is as likely to be determined by the pixelquality of the inbuilt camera, the speed of video download, gigabyte capacityfor music content or some other functionality as it is by the actual price or tariffcharged.
Signalling, Strategy & Management Type26

4. MARRIS HYPOTHESIS
Mark and learn, AmyMark and learn
Charles Dickens
Our focus in this chapter is on the Marris model (1963 and 1966), whose 1966formulation has become “the standard one for analysis of [the growth of] themanagerially controlled firm” (Hay and Morris, 1991, p.328). In his model,Marris presented the hypothesis that managerial control would lead to growthas an objective, showing that shareholders were a less important constraint onsuch firms than financial markets. The Marris model is dynamic in the sensethat it incorporates growth. Like Baumol’s model, it assumes that managementwill act to maximise their utilities rather than profits, but in contrast to Baumol,it assumes that this will be achieved through growth rather than sales.
We have selected this model because it represents one of the few explicitanalyses of firm growth and because it has a greater relevance today than everbefore as management signal to maintain performance. More importantly, manycompanies today have too much cash on their books: should they return cashto shareholders or investment? For example, both Apple Inc and Pfizer Inc haveexcess cash today but do they have the investment potential in new products tosecure long term growth in time period t+1? By revisiting the mechanics of theMarris model forty years later, we are able to present a signalling option thatfits within the parameters of Framework T3 and may offer management a cashcure. The simplifying assumption of a balanced growth path = blue line inFigure 4.2 below, allows management to formulate a long-run equilibriumgrowth model in which the firm’s rate of demand-side growth must balance itsrate of supply-side growth, and in which explicit economic factors can beidentified which influence both sides.
Dividends v R&D Trade-off
Abstracting from the literature on the Marris model, there is a consensus thatMarris proposed a model of key metrics of firm performance, including salesgrowth and profitability. The sales growth depends on the success of R&Dexpenditure achieving product diversification. But management are faced with
27

an interesting trade-off as in Figure 4.1: to invest more in R&D or return cashto shareholder investors. We call this the dividends paradox and it is discussedlater.
In the interim, Figure 4.1 shows that there is a trade-off between theproportion of profit paid out by the firm and how much it can grow - every timethe firm reduces the dividend proportion by moving down the vertical-axis, itcan finance extra growth. The key issue for shareholders is whether or not theinvestment being financed by paying out less in current dividends eventuallyproduces more profits and future dividends. Shareholders have to trustmanagement.
Figure 4.1 Scouller’s Trade-off
The gd equation
Where does a firm obtain its gC supply of capital? Within the finance literaturethere are two sources, debt or equity. Contrary to the emerging theory at thetime on the relevance of debt financing v equity financing to the value of thecompany, Marris had promoted minimal debt. Once equity capital has beeninjected into the company, it can be used for R&D expenditure and/or returningdividends to equity investors. So gD the demand for capital has two sources,an internal management demand for more R&D expenditure and an external
Signalling, Strategy & Management Type28

shareholder demand for more cash through dividends. There is a trade-off. TheMarris trade-off can be summarized by the Koeller-Lechler equation:
gD = gC = α*p .
The equation uniquely determines the firm’s equilibrium growth rate and therate of return on its capital (p). According to standard accounting principles theterm p in Marris’ model is influenced by the firm’s capital (asset) turnover ratio,measured as output/capital. This ratio is an indicator of the operatingeffectiveness of the firm - the extent to which the firm’s asset base has beenused to generate sales. Relative ineffectiveness of the firm’s sales efforts wouldresult in a lower rate of return on capital, p, and a reduced growth rate.Furthermore, the term p is also influenced by the profit margin on sales,measured as profit/output, which can be interpreted as an indicator of the firm’soperating efficiency. We can rewrite the gd equation as follows:
{profit/output} x {output/capital} = {profit/capital} = profitability = p
Relative inefficiency of the firm’s operations (expenses increase relative tosales) would result in a lower value for p. The presence of bounded rationality,for example, or the Penrose effect, though not specified as such by Marris, couldresult in inward shifts of the balanced growth path.
The firm’s demand-side growth rate (gD) is determined by the extent ofproduct development. The extent of product development is then related tothe firm’s goal of increasing its profit rate. The achievement of this goal dependson the firm’s managerial capacity to successfully promote product development.According to Marris, demand-side product development efforts shouldeventually lower the firm’s rate of return on capital if one assumes diminishingreturns to product development activities. Improvement of the firm’smanagerial capacity can be expected to moderate the demand-side trade-offbetween growth and profitability. The supply-side growth rate (gC) of the firm’scapital base is dependent on the extent of internal financing from profits, wherethe parameter α* reflects the maximum extent of new investment that can befinanced per unit of profitability.The value of α* is determined by shareholders’interests in avoiding low profits and possible takeover.
The Dividends Paradox
Within the Marris model, management are faced with a trade-off between R&Dexpenditure and payment of dividends. The management do not wish to cease
Signalling, Strategy & Management Type 29

growing and so retain an increasing proportion of more profits in time periodt to finance increased growth in time period t+1. What happens when growthis curtailed? For example, this could arise in some product markets whereinthe company is unable to differentiate fast enough in that particular market. Tosustain the market value of the company, should management pay dividendsor retain more modest profits? Scouller argues that management can enjoy fastgrowth while also benefiting shareholders; their retained cash is being betterspent than they could invest it elsewhere. However, on account of managementconcern with their own security from takeover, they would be unlikely to pushtheir activity so far as to dilute the market value of their own shares sufficientlyto create reverse risk of takeover of themselves. Eventually the new marketssaturate and unless others similarly profitable markets are found, the firmbecomes mature and value peaks. However within Framework T3 dividendsare regarded as signals and the payment of dividends can influence the shareprice. If the dividends signal is interpreted as lack of product innovation withinthe gD side of the equation, then management have to engage in positivelearning transfer, PLT, by communicating with shareholders that in time periodt+1 value will be restored.
Marris Balanced Growth Path: BGP
In Figure 4.2, rather than at a point x where the profit rate would be maximised,management chooses to situate the firm at a point y where, under certainconstraints, the growth rate is maximised. Marris had represented his classictrade-off outcome by plotting the profit rate p versus the growth rate g.Alternatively, we have plotted the firms’ ‘valuation ratio’ in Figure 4.2 - thename given by Marris to the ratio of market value to underlying asset value,subsequently named q by Tobin - and the growth rate. It allows for aninteresting trade-off: the management may pursue a faster growth rate at theprice of reducing the valuation ratio to below its maximum: Please note that arobust empirical relationship between low valuation ratio and statisticallyobserved probability of takeover had been identified by Bartley and Boardmanin 1986.
Signalling, Strategy & Management Type30

Figure 4.2 Marris’ Trade-off
The Marris model is also of interest because it focuses on the vulnerability ofa firm. The valuation ratio V is used to identify the best growth rate that isacceptable to both the shareholders and management. U1 to U4 are managementindifference curves. They represent the 3rd of Z variable. In the classic Marrismodel the 3rd variable is managerial satisfaction or utility. U4, provides thehighest utility to management. However, because it is beyond the BGP, it isunachievable. Moving to the left to U3 generates a tangency point v on U3,which is tangent to the BGP. It provides the highest possible utility tomanagement. However point x on U2 provides the best return to shareholdersbecause of a higher valuation ratio. In choosing between these two points,management has a bias to set G2 as their ultimate organizational objective.
Quasi-Marris Model 21st Century
In his original model, Marris advocated that corporate growth could bemanipulated to maintain an optimum dividend-to-profit retention ratio thatkeeps the shareholders satisfied but does not retain too high a level of profit,creating a cash-rich business ripe for a take-over. This implies a degree ofcontrol on share value that would seem difficult to sustain for even the mosteffective management team. There are simply too many other factors that couldaffect the valuation ratio of the business beyond corporate growth. Decidingon how best to achieve growth becomes a crucial issue for management duringthe life cycle of a firm.
Signalling, Strategy & Management Type 31

For example, if management wish to grow by product diversification there is aconstraint inherent in the Marris model, the gd equation, that is fairly acute forfirms that opt to grow through product diversification rather than by acquisition:
gd = f.(d, k)
growth = f.(retained profits)
Where d is the dividend rate as a signal and the parameter k represents thepercentage of successful new products. The k parameter ultimately depends onR&D, advertising and promotion; and the $ spend on these variables dependson the profits that ultimately depend on the efficiency of the firm.
A Marris type would seek to achieve organic growth though productdiversification by investing more in R&D and paying lesser dividends toshareholders. There will be a trade off between these two variables andtherefore, we have defined the X variable to be the R&D expenditure and theY variable to be dividend respectively. The 3rd variable is the valuation asmeasured by
Marris v = market value/asset value = Tobin’s q
As asset value (net book value) grows with R&D investment in gd and moreshareholders invest in the company on the strength of the PLT, the v increasesand performance as measured by profitability increase form levels P1 to P3 inFigure 4.3.
Signalling, Strategy & Management Type32

At point X, the Neo-Classical equilibrium, is the profit maximization point forthe company with the maximum dividend, D1, paid out to shareholders. Thiscan be achieved by investing R1 in R&D. The profit line (indifference line) forthis position is reflected in the P1 curve. A Marris type believes that in orderfor a company to be able to sustain into the future it is necessary to grow andcreate value for the company. As such, management would invest in its R&D,assets and technology at the expense of short-term profits. By reducing thedividends from D1 to D2, and increasing the R&D expenditure from R1 to R2,it will attain the new equilibrium, at point Y. The objective over time throughthese infrastructural investments is to grow the company such that itsperformance will also increase from P2 to P3 with the balanced growth pathshifting upwards attaining a new dynamic equilibrium at point Y’.
The Marris v
The Marris v is an important variable; it not unrelated to Tobin’s q, if the q = v< 1 then the assets are not fully utilised in the company and it would be a goodinvestment to buy shares when v < 1. The buying of shares would increase theshare price and the market value in time period t+1. There are many financialperformance ratios such as the Hamada equations, Sharpe ratio, Jensen alpha,Traynor ratio or the Sortino ratio, in addition to α and β of the capital assetpricing model. They represent a measure of financial elasticity by measuringfinancial performance. The Marris v does likewise, measuring the elasticity ofasset value to market value but defined in terms of management type to ensurethat growth (gd) determines value (v). The Marris security parameter a is acombination of a range of key financial indicators, KFIs, such as leverage ratio,liquidity ratio and the retention ratio: fundamentally, management is secure ifthe firms carries minimal debt, delay dividends in time period t in favour ofR&D in time period t+1 and engages in positive learning transfer to reassureinvestors.
Agency costs
There is a benchmark rule in Framework T3: the higher the valuation of acompany the less likely is the threat of takeover. This rule, however, intimatesthat dividends should stay high to maintain the share price. Alternativelymanagement may wish to invest more profits to secure more growth with a riskthat the value of the company falls. If the higher valuation were perceived byshareholders to be at a maximum then shareholders would prefer that highervaluation, so it behoves management to persuade shareholders that the risk of
Signalling, Strategy & Management Type 33

a fall in value can be captured by a higher growth rate. Management inabilityto persuade shareholders gives rise to agency costs6. One way to tackle theagency costs is for management to design a trust mechanism betweenshareholder and management, and thus enabling shareholders to entrust moneyto management with a reasonable expectation of getting something back.
Marris type PLT
A central theme is designing trust is the context of the management decision,that is, how the decision is observed by shareholders. Shareholders may adopta Bayesian-type rule, seeing what they want to see about management and thefirm. Management should resist this. How? They could signal a positive learningtransfer to shareholders whereby management with prior experience (in gameswith) value-growth issues introduce positive expectations of a strongerperformance (higher value for the firm).
This could be achieved through persuading shareholders to view thedecision as a continuum rather than as a dichotomy. In other words, the decisionhas to be framed as a decision about more growth and higher value and notabout less value and more growth. Shareholders can then observe the decisionof management as a chance wherein making a gain in circumstances where theytrust management outweighs the risk of making a loss.
In terms of the competition, management should evolve as strategic playersin the sense that they understand that their actions are likely to lead to a reactionfrom competitors. In other words they become conscious of the fact that theprice of their product depends on the decisions of their competitors, affectingboth capacity and market reach of the product. For some products thecombination of overcapacity and technology standardisation will drive pricesdown creating low profit margins. In these circumstances, management as aplayer engage in patching by re-mapping portions of the product’s business tochanging market opportunities.
If higher value is sacrificed for higher growth in the interim, one elementof the trust mechanism should be that the product becomes a brand with globalreach, dominating its market through expenditure on R&D and advertising.This combination of decisions is what we define as the diversification acreage.Within the acreage of diversified products, if a product is not achieving itsglobal reach and is under-performing, then management should spin off theproduct.
Signalling, Strategy & Management Type34
6The agency costs arise because of the separation of the ownership and control of a firm. Berle and Means, whopublished a classic study in the 1930s, argued that this separation affords management a considerable degree ofdiscretion; the trust between shareholder (as principal) and management (as agent) comes under threat ifmanagement abuse the discretion, and the financial loss to the principal is called an agency cost.

Marris type
By 1970s, Mueller had advanced the Marris model by advocating a life cycleof firm growth. Mueller’s life cycle was a major qualification of the classiclinear characterization of the growth path of a firm advocated by Marris.Borrowing the arguments first identified by Mueller, we can also think of theMarris model as follows: first, sustainable long-run growth requires marketgrowth; this can be achieved, at a cost, by search and R&D. In turn, new marketsmust be supported by new productive capacity. The combined costs of boundedrationality, agency costs, R&D and new capacity may be called the costs ofgrowth. They require cash flow. Cash flow may be obtained from retainedprofits, new share issues and new debt.
Table 4.1 Return/Risk for gd
The amount of the last, in any given period, is constrained on the one hand bythe unwillingness of lenders to offer unrestricted sums relative to the firm’sexisting scale and size, and on the other by management’s fear of the risks, tothem, of excessive leverage. The management can pursue a growth rate(implying specific costs of growth and profit retention ratio) that wouldmaximize the firms’ valuation or q-ratio. Alternatively the management maypursue a faster growth rate at the price of reducing the valuation ratio to belowits maximum. If management have growth-preference, the model closes, witha unique management desired growth rate, and thus the factors which encouragemanagerial behaviour encourage faster growth of firms; for example moreexpenditure on R&D and marketing and hence a positive learning transferbetween management and investor shareholders.
It is the trade-off between dividends in time period t and more growth intime period t+1 that gives us our first glimpse of this particular Marris-type ofmanagement who are motivated by achieving sustainable long-term growth.Management are necessarily risk-averse, working out a risk profile for all
Signalling, Strategy & Management Type 35
High Growth/gd Low Growth/gd
RETURN Growth drives Value Value drives Growth Less dividend signals More dividend signals
RISK Inability to differentiate Innovating at speed fast enough slowest firm

decisions in terms of likely outcomes. Ultimately the decisions are binary: eitherproduct x or y but not x and y. The choice of product x carries with it theopportunity costs, in terms of lost revenues and market shares, of not selectingproduct y. But provided the costs are minimized the contribution of product xto the achievement of sustainable long-term growth in the company will bepositive.
Understanding type will help in identifying the trade-off facing a rivalcompetitor and this understanding may enable management to predict the likelyreactions of the competitor, a significant factor in any competitiveinterdependent market structure. But in order to understand managementbehaviour as observed we need to know more about management type. The 3rd
variable is key and there are three possible candidates: (i) utility from the classicMarris model, (ii) the valuation ratio from Framework T3 and (iii) profitability.The latter was applied to Apple Inc as an exercise in MBA workshops and isillustrated in Figure 4.4, while estimation of the Diageo plc BGP can be foundin Kaelo v2.0.
Figure 4.4 BGP for Apple Inc
If the motives of management reveal their type, then a Marris-type, for example,may now be summarized as follows: sustainable long-term growth requiresmarket growth; this can be achieved, at a cost, by R&D. In turn, new marketsmust be supported by new productive capacity. We are advancing an equationto compute the BGP and more details are available from the author:
McNutt’s BGP equation: y = a (x – h)2 + k
Signalling, Strategy & Management Type36

The equilibrium position of the BGP in time period t+1 can expand or contractas illustrated by Figure 4.3. The costs of growth in t+1 can be explained by thecombined costs of the Penrose effect, the costs of R&D and new capacity. Theyrequire a cash flow.
Table 4.2 Marris 3rd Variables
A cash flow may be obtained from retained profits, new share issues and newdebt. If the company does not borrow externally, then the only source of financefor achieving growth is retentions. Herein lies what we shall refer to as a Marristrade-off: more in R&D requires more cash and may mean less to shareholdersin the form of dividend payout. Growth is therefore a function of retained profit.
Marris Signalling
The Z-variable equation represents that unique 3rd variable that signalsmanagement type. In the case of a Baumol type the 3rd variable is salesrevenues and trade-off facing management is time period t will include profitas one of the (X,Y) variables. In the Marris type, we have advocated value v,the market capitalisation of the company divided by its asset (new book) valueas the Z variable. Management of Marris type will signal value maximisationthrough gd growth maximisation as the key variable. Signals can be read fromlistening to CEO interviews and as equity traders and analysts become moresophisticated in analysing volatility in equity markets, management maybecome less concerned about reaching the 3rd variable level and moreconcerned about signalling their intent to do so. During periods of greatmovement in equity price, analyst predictions and management signals willfeed off each other so that for the share price, p. a signalling maximum couldbe reached at:
Signalling, Strategy & Management Type 37
Variable X
Classic Marris
Diageo plc case inKaelo
Apple Inc in thischapter Figure 4.4
Variable X
gd
gd
Price/Book ratio
Variable Y
V
Share price
Profit Margin
3rd Variable, Z
Utility
V
Profitability

Signalling Maximum: (√p)/p-1
For example, a share of number 9 (£9 or €9) could reach a signalling maximumof 27. The author is examining the significance, if any, of this number. Mostanalysts are bullish on companies with a price/earnings number in the range 8to 10 and a dividend yield of 5%. Equity becomes an attractive investment withrelatively lower price/earnings ratios. The numbers send a signal. A signallingmaximum recognises the fact that a signal is already in the price. For example,companies with expensive shares that then have a profit downgrade as analysts’targets are not met in time period t may not necessarily experience a fall in theprice of shares as investors await target announcements in time period t+1. Agood stock to buy is one which is well placed to weather the storm of mis-signalling as analysts lag behind as CEOs engage in PLT. In the classic Marrismodel, there is mention of a security parameter, a, and it may be possible torewrite that Marris security parameter in terms of the capitalised value asdetermined by the signalling share price maximum.
a = signalling maximum valuation/replacement cost of net assets
This would allow us to assemble the three ratios, Marris v, Tobin’s q and theMarris security parameter as a measure of stock market value. If we were toexclude financial stocks and exclude intangible assets such as brand value orintellectual property rights from the computation of the replacement costs, thena value such that a = v = q < 1 might indicate a ‘buy’.
Signalling, Strategy & Management Type38

5. COST TECHNOLOGY
Feel the force Luke: let go of your conscious self and act on instinct
Star Wars
Competition has changed: there was once a reliance on price and quantity, thetwo classic firm-specific variables; now it is quality and innovation, which arequintessentially firm non-specific, yet the consumer benefits directly from them.One key parameter is the level of consumer demand for the product. In a zero-sum world, for example, one firm could be challenged to meet extra demanddue to falling sales of the rival. Whatever the reason for the extra demand,management strives to set the production rate equal to the rate of consumerdemand. This just-in-time approach can result in waste elimination and leadtime reduction. Historically batch production has been considered optimal dueto long machine changeover times and the requirement for immediatesatisfaction of customer demand. This can involve high stock holding costs forthe firm. Production smoothing is the process of adapting the production rateto variations in customer demand. From management’s perspective a highquality product is still delivered to market on time with significantly reducedcosts.
The production technology within a company has been presented in neo-Classical models as the constraint imposed on achieving optimal firm size. Inthe management models there is no optimal size but rather the growth of thecompany depends on the abilities and capabilities of management. If themanagement are not performing the company fails in its objectives. Boundedrationality is one reason advanced to explain management underperformance.In this chapter, we advance the idea that management are faced with a capacityconstraint that they do not fully understand. The reason for this is failure tofurther understand the cost technology embedded in the production.
There is a greater need to improve the lines of communication between theproduction, procurement and the sales division within a company, whether itbe manufacturing or service orientated, otherwise management will be facedwith a production-demand dilemma. One way to overcome this dilemma, andobtain a sustainable cost advantage as a cost leader (CL) is to understand thecost technology. The cost technology has been broken down into five constituent
39

steps in this chapter, so that management can decide at time period t which stepapplies to their company. The steps can be followed in sequence, they may takeup to seven years to complete. In the case of Canon, as illustrated at the end ofthis Chapter, under Mr Mitari as CEO, the process took ten years over a periodthat saw the emergence of Canon as a formidable CL type player in the marketfor copiers, scanners, printers and cameras with a sustainable cost advantagein its market.
Production-Demand Dilemma
For management, understanding capacity is a key to ensuring cost efficiencythroughout the production process. Framework T3 focuses on the link betweenthe cost and product curves and also distinguishes between excess capacity andreserve capacity. In obtaining cost efficiencies, management must be preparedto allow production to determine demand. Why? If demand determinesproduction in a product market with innovation and increasing productdifferentiation there is a risk that sales will lag as consumers opt to purchasethe latest innovative product. A company with lagging sales will carry inventoryand risk carrying obsolete products in a market with ever changing consumerpreferences. Therefore in 21st century many companies risk carrying excesscapacity as they are unable to sell what they have produced, simply becauseconsumers no longer prefer its products. This becomes more acute in thosemarkets where innovation, technology and product differentiation are keydrivers of demand. One way to escape this dilemma is to engineer theproduction process so that production determines demand.
Against that background, we introduce the cost leadership model as afiltering process that can be identified in manufacturing, in the productionrelationship by understanding cost leadership (CL) type. In achieving this statusin its industry, management would have to ensure that a number of steps arefollowed within the company. We adopt the premise that the companies are notsingle plant single product manufacturers serving only a national market. Thismay be the case for a small engineering plant but in the aggregate costleadership is obtained in multi-plant multi-product companies that transcendnational or indeed regional market boundaries.
Collectively the steps are referred to as the production relationship. Step 1is to distinguish between economies of scale and economies of size. Size shouldbe interpreted as a global economy of scale that can only be achieved oncemanagement neutralise the zero-sum constraint. Step 2 focuses on maximizingthe average productivity of labour, realizing that the measure of averageproductivity is the inverse of the average variable cost of production. Step 3
Signalling, Strategy & Management Type40
requires an introduction of a normalized wage system within the company,offering incentives to the workforce so that a numbers reduction in employeesis carefully matched with an increase in productivity.
Step 4 is key; it is about controlling costs: once costs are controlled or fixedduring the production cycle, management can then focus on decreasing theaverage fixed cost.. This can be achieved by hedging raw materials requiredduring the production cycle, offering workers a fixed term or fixed term-fixedwage contract or by outsourcing or by rebalancing costs back to the suppliersin the supply chain. Finally Step 5 requires management to identify the capacityconstraints within the company and to clearly demarcate excess capacity fromreserve capacity at each plant within the production technology. Reservecapacity requires the building of additional capacity in the plant in theexpectation of demand; excess capacity is to be avoided – it can arise if thecompany is unable to differentiate its products fast enough in an ever changingconsumer market. The ideal outcome is one of zero excess capacity with areserve capacity in production.
Wage Normalisation
From the geometry of the product and cost curves we can observe an inverserelationship as follows:
AVC = w/APL
From this equation we note that the average variable cost (AVC) is inverselyrelated to a measure of average productivity, (APL) dependent on the wage level,w. It is a simple observation but one that can be so easily overlooked bymanagement. The management at TooBig plc have decided that 7000 employeesis too big a number to sustain as they search for cost efficiencies. So they decideto downsize to 4000 employees, with a plan to lay-off 3000 employees. This isachieved usually with generous redundancy payments.
In many cases, the most productive take the package on offer; after a periodof time, management at Smaller plc with 4000 employees realise that they arenot achieving their cost reduction objectives. In fact, costs have increased inreal terms at Smaller plc. One reason is because the 4000 employees remainingare not as productive on average as the 7000. The 7000 employees included the3000 most productive workers who took the redundancy package and now endup re-employed by Smaller plc on a fixed-fee contract. In other words, costsare increasing at Smaller plc because productivity has fallen; it is not the onlyexplanatory of increasing costs but it is often a contributor.
Signalling, Strategy & Management Type 41
It would have been more judicious for TooBig plc to focus on the productivityissue, encourage the most productive staff by way of incentives and toencourage the least productive to leave the plant. It is important to note thataverage productivity can increase if existing workers are more productive sothat q* > q for a given number of workers, L, hence q*/L > q/L, and productivityhas increased because output has increased to q*. This is contrary to a moreconventional approach that reduces the number of workers from L to L*believing that q/L* > q/L: sadly, this result may not obtain. Productivity falls as the level of output, q, does not increase, and q will not increase if the mostproductive workers exit. Management should remember that the total productof L produced on a fixed amount of K is the same as the average product of Kwhen L is fixed. If we assume, that when K is fixed its value is 1 and when Lis fixed its value is also 1, then the relationship holds:
APL = TPK, when K = 1
With a normalised wage structure there is a greater focus on productivity as thewage structure offers incentives to the most productive workers to stay and theleast productive to exit. There could be share options, for example, and a rangeof productivity incentive contracts present in the plant. A normalized wage setsw = 1 and we have
AVC = 1/APL
So, notwithstanding how costs are reduced, sustainable cost advantage can onlybe obtained if their is an increase in productivity as a consequence of the costreduction measures.
Excess v Reserve Capacity
During the production phase it is important for management to properlyunderstand the capacity constraints facing a modern production facility. Wedistinguish between excess capacity and reserve capacity. For each plant sizethere is a minimum efficient scale of operation, know as the MES. At this pointaverage costs are at a minimum and production beyond this point will give riseto diseconomies of scale and rising costs. However, production is often at aproduction level to the left of the MES plant size. Traditionally this is the pointof excess capacity, and the older arguments were developed in economicsaccusing the monopolist of producing with excess capacity. Why bother toproduce more (towards the MES output) – there was no other rival supplier in
Signalling, Strategy & Management Type42

the monopolist’s market. However, modern firms today, and not in a monopoly position, can be
producing with excess capacity simply because they are faced with an everincreasing demand for their product at a time when they are unable to productdifferentiate fast enough to meet the demand. The technically have sparecapacity in the plant, which translates into excess capacity with a slack demandfor the firm’s product. Unless the firm is able to differentiate its product in themarket, it will be producing at a point to the left of its MES, with excesscapacity. It is equivalent to capacite excedentaire. This is not a preferredposition for management to be located to the left of the MES because it issimply not cost-efficient.
Figure 5.1 - Theoretical short-run cost curve
Conversely, reserve capacity arises when production is at a point of LMC = 0.It is best to think of reserve capacity as installed capacity used by managementwhen it is required. In other words, different levels of production can be reachedat zero marginal cost. This arises because the company has built in additionalcapacity into the production process early on in the production cycle. This couldarise in a product market where production determines demand: this is veryrelevant for the management of innovative products such as mobile phones,printers and video game consoles.
The reserve capacity is illustrated with a L-shaped cost structure for theLAC. In economics we refer to this as level of production as production whereconstant returns to scale prevail. However, more interestingly is the case where
Signalling, Strategy & Management Type 43

the L-shape neither increases upward (looking like an elongated U-shape) nordownward (representing a declining LAC). In this case the cost structure impliesthat output is not large enough to observe whether or not average costs will rise.Management may prefer to be cautious and not push production too far in casecosts increase.
CL Type
This is understandable. The demand (for the product) is so demanding - whatwe call reserve capacity on demand or CoD - that it is better for themanufacturer to allow production to control demand: this is contrary to theconventional wisdom that it is demand that drives production. No, better forproduction to determine demand - signal to the market production delay ordesign problems or delay in the integration of different functionalities.Functionalities are precisely what the consumers are demanding: For example:a printer is a printer plus copier plus scanner plus fax machine. Or a mobilephone is telephone + MP3 player + mega-pixel camera + email communicationsdevice. The combination of different functionalities (q1, q2,…qn ) generateseconomies of scope at Step 1, such that
C(q1,q2) < C(q1) + C(q2)
It is more cost efficient for management to have one large plant that producesa printer and a copier and a printer plus copier than to have three separate plants.Once the plant has reached its size then economies of scope can be engineeredinto the cost technology. But it may take time. If so, the time component shouldbe signalled to the market. If there are any production delays then they shouldbe signalled as shipment delays not as a failure to meet demand. The signal isnecessary in order to calm investors while allowing management to plan foradditional capacity at the production plant(s). Consequently management arein a stronger position to control costs. What you observe is a flat-bottomed costcurve and with seasonality in demand or a new innovative product on demand,the company with reserve capacity in production will be better placed to meetthat demand at cost efficient levels of production. The firm is more likely toemerge as a CL type in its market.
Signalling, Strategy & Management Type44

COST-LEADERSHIP
MAPPING THE PRODUCTION PHASE
CHECKLIST
STEP 1: Distinguish between Economies of Scale, Economies of Size andEconomies of Scope within the production process.
Scale: DK = DL = 2% and Dq > 2%
Size: achievable in competitive market Dq = 4% in phase 1, decide ex-postin phase 2 of the production process the most optimal, DK or DL, and
implement in phase 3.
Scope: across production so that c(q1,q2) < c(q1) + c(q2)
STEP 2: Focus on increasing average productivity of labour APL. How?
Note that APL = w/AVC, where w = wage proxy and AVC = averagevariable costs.
STEP 3: Normalise the wage structure: let w = 1. In other words, offer theworkers incentives or bonus payments as productivity increases, revisit theorganisational structure and consider the production process as a nexus ofcontracts.
STEP 4: Control more of the production costs to allow more costs to comeunder control during the production process. Hedge positions on materialinputs, minimise exchange rate risks, workers on fix-wage fix-termcontracts with incentives per flexible manufacturing.
STEP 5: Demarcate between excess capacity (idle capacity) and reservecapacity (installed capacity), aware that excess capacity can occur if theproduct is not sufficiently differentiated fast enough in the market tocapture market sales. At the point of production in phase 1 ensure sufficientinstalled capacity to meet demand in later phases of production.
Signalling, Strategy & Management Type 45

A key assumption here is that management can change the plant size. This canarise due to economies of scale from the larger size plant when to the left ofthe minimum point on the LAC curve. The minimum point on the LAC is theoptimum scale of plant, the MES. SAC represents the cost structure of thesmaller scale plant and the corresponding minimum point on the SAC is theoptimum rate of output. The challenge for management is to move fromoptimum rate of output to the optimum scale of plant. Division andspecialisation of labour can bring about the economies of scale; likewise theadoption of advanced technology, for example, robotics and computertechnology can trigger economies of scale.
Management today seek to obtain economies of scale in the supply chainby out-sourcing to a lower-wage economy as with the move from the EU to theBRIC economies in equipment manufacture, textiles, or back-office financialadministration. However, with outsourcing management must ensure thatproductivity does not decrease at the outsourced plants: simply offering lowerwages does reduce the variable costs but average costs will only decline ifproductivity is increased. As output increases management are faced with asecond challenge in understanding the capacity constraints that may emergeduring the production process. Arguably, management intent on cost leadershipwill not produce at the minimum point on a SAC curve because if it did it wouldlose in the sense that it could produce at a still lower average cost, with a slightlylarger but under-utilised plant if it were to the left of the minimum point of theLAC, and with a slightly smaller but over-utilised plant if it were to the right oflow point of the LAC curve. This is McNutt’s dilemma: do management builda larger plant that may be under-utilised or retain existing plant that may beover-utilised? The dilemma cannot be solved unless management introduce anormalised wage structure and demarcate at what point present productionlevels are at in terms of capacity. The economic argument is simply that thecost curve derives its shape because of five CL type steps
De Nihilo Nihil Fit
Rational management know the old adage that ‘nothing comes from nothing’so a decision has to be taken. For example, Brand Inc in time period t couldsignal the launch of a new product in time period t+1 and allow a ‘word ofmouth’ moon-shot to exist in the market. So consumers want to purchase theproduct in time period t to find that it is not available. Demand is notdetermining the production. It is by signalling that Brand Inc are able to createa ghost demand in time period t so that the production cycle in t+1 can beengineered to meet that level of demand, however, it is the production at time
Signalling, Strategy & Management Type46

period t+1 that determines the demand at t+1.
This back scatter approach to production would be characteristic of a CL typeat Step 5. The risk in delaying product is the loss of a first mover advantage(FMA) in products with a growing demand for its functionalities. However thegain in observing another player succumbing to demand, as productunderperforms due to lagging consumer expectations, is the second moveradvantage (SMA). In the production game there are two conjoint decisions:
FMA Loss < SMA Gain
FMA Gain > SMA Loss
CL type is not about an obsession with cost cutting per se, ensuring that everypurchase no matter how small is logged into a central accounting system. CLtype is about mistake proofing against these two decisions. Mistake proofingcan be assisted by a regret matrix (Chapter 7), which computes the opportunitycost or loss of deviating from an optimal decision.
Signalling, Strategy & Management Type 47
6. PLAYERS & VERTICAL BLENDINGYou tremble, carcass,
but you would tremble still moreif you knew where I am going to take you.
Marechal de Turenne
Blending is the co-existence of two types of the game play, one affirmed bysignals (management type) and the other displayed in effective action (playertype). For example, the appointment of a new CEO will introduce a new typeof management so we need to further understand how the type of managementis blended into the type of player. Vertical blending - the issue as to whethertype of management will influence the type of player - is crucial tounderstanding our approach to strategy. Management type is embedded withinthe firm and signalled to the market as a player type. This is important becauseit links the performance of the company to the type of management.Management are appointed by shareholders or private equity because of theirtype. Some are know as ruthless cost-cutters, some believe in growth byacquisitions, some believe in organic growth. The appointment of a new CEOsends a signal to the market and it is for the market – competitors and equityanalysts - to identify the management type in order to avoid misreading ofsignals. Have a look at the Diageo plc video analysis in Kaelo v2.0 and playthe investment game based on identifying the signals from the industrycommentators.
To put the idea of vertical blending sharply, the culture of the firm orcompany, composed of all its stakeholders, may influence the type ofmanagement by getting management to do what s/he does not want to do byinfluencing or shaping or determining their actions. Stakeholders may preferto persuade management as to a course of action, coerce management to takean action, that is, to secure their compliance by controlling their thoughts andactions Rational management as a player may simply duplicate the reasoningprocess of the stakeholders. However, taking control is an irreducible factbecause taking control emanates from the control of information within theorganization per se and through the game process. As the game unfolds,management’s actions ultimately define the type of player the company has
48

become in the game. Vertical blending is an exercise of type rather than a caseof structural determination7.
Signalling
Once management realizes that it has the power to act differently, and actsdifferently, blending is complete. Therefore the process arises whenmanagement actions means something to them as individuals – in other words,they are capable of processing their own experience in a manner which canconfound all predictions by a near rival, all predictions based on the fact finders’observations or the near rival’s description of the type of management. Thedifficulty for management is trying to understand the blend in a rival firm, andthe difficulty in coping with the blend may be due to the fact that the type ofmanagement per se has been formed, during the game, in reaction tocompetitors.
The key issue is to provide a template as to how management can bestrepresent the blend created within the company in actions or words. To do thatis to understand the words and actions of management: the signals. The templateis based on player interdependence in a game. While the actions areinterdependent, for example, in a sequential pricing game of leader-follower,the signals by which they are prompted are mutually independent. Thisnecessarily arises because player actions means something to management asindividuals, and different management will interpret the same signal differently.Consequently we refer to taking an action as the observed reality: the gamesuccess or payoff, the Porterian competitive advantage is obtained fromknowing when and how to act.
The Core of Vertical Blending
The type of player arises from an economic foundation based on a theory ofoligopoly. It is a market structure characterized by few players usually less than5. The number is significant because with so few players there is a greaterinterdependency amongst the players, and a greater probability that one of theplayers will recognize this and try to exploit it. The object is to maximize theeconomic position of the player, the payoff, and indeed to obtain a preferredoutcome for all players, that is, the market.
In oligopoly markets we are more likely to observe a consolidation acrossthe market shares of the players in time period t+1. We make this assumptionfor the purposes of the E-book. Consolidation is at the point at which the zero-
Signalling, Strategy & Management Type 49
7This assumes ala Lukes (1975) Concept of Power p.55 that it is in the exerciser’s or exercisers’ power to actdifferently.

sum constraint becomes acute. A fact-finder will observe constant marketshares. Player A’s market share loss from 35.2% to 35% translates into a gainfor Player B. For game theory to become an appropriate tool of analysis werequire that the underlying environment does not change too fast so that we canequate management behavior in terms of an equilibrating behavior. In otherwords, Player A realizes than the range 35% to 35.2% is the best market shareobtainable given the likely reaction to his action from other Players ascompetitors in the market-as-a-game. So Player A does nothing to regain thelost 0.2% market share because there is a probability of loosing 2%. OncePlayer A realizes this outcome we are at a Nash equilibrium, and the realizationmay be due to the fact that one of the players may have played a game in anearlier time period.
Strategy
Player A decides to reduce price and the key is whether or not B will react toany price movement. If A believes that B will react then it is imperative for Ato have a reply to the likely reaction from B. Hence we have the strategy triangleof action-reaction-reply. If A does not have a Nash reply then it is because Adid not expect a reaction. The key to understanding our definition of strategyin Framework T3 is to ask: why did A not expect a reaction? What is it aboutBs’ patterns of behavior that may have led A to belief that B would not react toany price change from A? One of the contributory factors is B’s type defined interms of the type of player and the type of management. Type of managementrefers to the subjective behavior of management in terms of a preference forpricing or organic growth. Type of player is to be understood in terms of thepatterns of observed behavior of the company in the market. For example, weseldom observe price wars between Pepsi and Coca Cola in their core marketunlike with Sony, Nintendo and Sega, who had experienced a lengthy price warin the video games market in the 1990s. A key question is: given their strategy,how should they behave? For example, Player A reduces price to correctdeclining total revenue but the competitor B does not know the reason why theobserved price has fallen. Could Player A be a Baumol type? If so the pricemove observed is a one-shot move and may not require a reaction from PlayerB. So to avoid any misunderstanding Player A could reveal its type as a Baumoltype. It helps to understand some basic economics of strategy in order to identifya type of management.
Signalling, Strategy & Management Type50

Limit Pricing Model
Otherwise know as the Bain-Modigliani model it defines a game between anincumbent type and a camuflaged entrant type. It is also reviewed in Kaelov2.0. In order to understand player type we will work with the Bain-Modiglianior limit pricing model.
Figure 6.1 Market Entry Decision: Extensive Form
The limit pricing model represents the classic example of a player consideringentry into a new market is presented as a demonstration of non cooperativegame theory. The biggest uncertainty faced by the new entrant is predicting thereaction of the incumbent player in the market, whose perceived options are,firstly, be accommodating and allow entry, or, react aggressively with price cutsor discounts. An aggressive response could reduce the value of the market dueto an ensuing price war. In this analogy, the incumbent is more likely to cedemarket share to avoid a price war. If the decision is taken not to enter the market,the payoff for the new entrant will be zero and the incumbent retains the fullvalue of the game (10). Should the company decide to enter, the incumbenthas two strategies to pursue: retaliate with aggressive price cuts, thereby riskinga price war that will leave it with a reduced payoff of 2. In the above example,the new entrant could not afford such a price war and would fail to return aprofit from the venture (losing 7). If the incumbent accommodates the newentrant, its payoff is reduced to 8 through ceding market share to the new comer,who makes a successful entry with profits of 5. Self interest (profitmaximization) governs the likely response of the market incumbent, therebynegating the value of any probability calculation if the incumbent’s first
Signalling, Strategy & Management Type 51

response is to prevent entry. It is important to analyze, not the probability ofthe reaction options, but instead be guided but what actions the rational, self-interested respondent is likely to reply with in the game.
Retaliation
The reply will depend on the player’s belief about the type of player thecompetitor is in a game. Like the Galton’s ox weight contest each player willobserve how individual errors and biases in predicting likely reactions will tendto cancel each other out as the sought-after information about type is distilledin some aggregate measure of belief. Players will either adopt a binary approachor not:
Player A asks:
Binary: Will Player B react? Yes or NoNon-Binary: Player B will react: Probability = X%.
Notice that in Figure 1 each of the options open to the rival result in a changein the total value of the game. Retaliation would lead to a price war in whichlower profits would devalue the total returns available to all players. In thisexample, the resulting market losses are 5. Alternatively, allowing the newcompany to enter would grow the market value overall, to 13, the sum of thepayoffs 5 and 8. The strategies open to the players are clear. Notice that thefirst decision lies with the new entrant, the subsequent response by theincumbent makes this a sequential game: Outlining the strategies forms the keyto systematic thinking about which one of those strategies is the optimal pathto follow.
Limit Pricing Strategy Set
SA: Do not enter, do not retaliate (status quo)SB: Enter and Retaliate
SB: Enter and Accommodate
Dominant Strategy
The same game can be represented in a matrix or strategic form as illustratedby Figure 2. The game matrix directs the players to only logical strategic choice.Player 1 assumes that player 2 will act in rational self-interest, and it is in player
Signalling, Strategy & Management Type52

2’s interest to assume the reciprocal arrangement applies. Suppose that there isa first strategy that “under no circumstances yields a lower payoff andsometimes does better” than a second option. It is said that the first strategydominates the second. In Figure 2, Player 1 has no dominant strategy. If theydo not enter they will not have any payoffs, the incumbent does not need toreact and will retain the market value. The ‘do not enter’ strategy dominatesthe ‘enter’ strategy if the incumbent reacts with discounts. A zero payoff isbetter than a loss of 7
Figure 6.2 Market Entry Payoffs: Normal Form
However, for Player 1, the accommodating’ strategy of the incumbent wouldresult in a higher payoff for the new entrant, than not entering at all. It is clearthat Player 1 has no dominant strategy. Player 2, however, has a clear dominantstrategy. In both cases of ‘do not enter’ and ‘enter’, the incumbent is better offby accommodating the new entrant. This indicated by the payoff of 10 if thenewcomer does not enter and a higher payoff of 8 versus 2 if Player 2accommodates. In this scenario, accommodation strategy dominates theaggressive retaliation strategy. The optimum strategy in this game is that Player1, knowing the payoffs (as opposed to the probabilities), realises it is in Player2’s best interest to accommodate and will therefore enter the market.
Signalling, Strategy & Management Type 53

Player Types and Signals
Markets characterized by incumbent management who regard a threat of entryas an actual plan of entry at a time period yet to be decided can be described ascontestable. A contestable market is as close as we get to the textbookcompetition. However, as geography begins to define the market boundaries,incumbents face the possibility of a de novo entrant type. A de novo type is aplayer in the same geographic market as the incumbent in at least two productmarkets that are complimentary to a third product market, the incumbent’smarket. The de novo type will seek to gain the synergy and acquire theincumbent. So a de novo entrant type grows by acquisition as the boundariesof the market expand. The boundaries can expand due to technology, innovation,or change in regulations. With changes in technology at time period t, a playercan exit a game and return in time period t+1. Netscape, for example, exitedthe internet browser war with Microsoft but has re-entered the market-as-a-game as Mozilla and is competing with incumbent players Microsoft and AppleSafari. This is a good example of a newborn player, who re-enters the game astechnology changes. Kodak could be defined as a newborn in that havingallowed the digital revolution in cameras to pass it by, as a newborn playerKodak has adopted digital technology.
The difficulty for an incumbent is to determine whether or not the entranttype is a potential entrant type with no intention to enter in time period t, or ade novo type, who has every intention to enter. Depending on the management’sbelief, actions will differ as to how best to limit entry. Each action will furtheract as a signal to the other players in the market and may invite a reaction fromthe other incumbent players. For example, if an incumbent type believes witha high probability that entry will happen, the incumbent reduces its pre-entryprice, and thus triggering a reaction from the incumbent players who have losta price differentiation advantage as a direct consequence of the pre-entry pricereduction.
Believable Bills
In markets, the incumbent type is easily recognized as the endogenous historicplayer already in the market because of (say) government imprimatur or nationalgeography or a survivor in the market-as-a-game. A defining characteristic ofan incumbent type is to protect their market share and this requires effort andmanagement time to attempt to delay or prevent entry by an entrant type.Vertical blending with such players creates ‘believable Bills’ based on the beliefthat if entrants enter the market, then profits post-entry would be driven to zero.
Signalling, Strategy & Management Type54

The believable Bills will do everything to delay, retard or prevent entry.Accommodation is not a dominant strategy for bB type.
Entrant types, by definition, are seeking entry but their type can be furthersubdivided into potential entrant types, who threaten to enter at a point in time,and de novo entrant types, who actually do enter at a point in time. The difficultyfor an incumbent type at a point in time is in determining the type of entrantand the incumbent management’s belief as to the type of management willdetermine the pre-entry actions of the incumbent player.
Doubting Thomas
The entrant type will signal to the incumbent type its intention to enter theincumbent’s market. This gives rise to the ‘doubting Thomas’ incumbent whodoes not perceive a threat of entry at a point in time. The doubting Thomasknows how the entrant will act because he knows the entrant management willact rationally. However, the entrant is a player, and if the entrants’ signals weredeviant, the doubting Thomas may not be able to respond should the entrantactually enter the market. If the believable Bill incumbent believes that theentrant type will actually enter the market then the incumbent management willtake actions to deter entry, for example, they may reduce the market price orincrease the quantity produced in the pre-entry period.
However, if the entrant type was a potential entrant type with no intentionto enter in time period t, then the believable Bill incumbent has reacted to athreat of entry that will not materialize at time period t. If an incumbentmanagement behaves in such a manner then they believed that the threat ofentry was credible, that is, that there was a high probability that the entrant typewould have entered, hence the rationale for reducing the market price.Conversely, a doubting Thomas incumbent would not have reduced the priceon a threat of entry but at the higher price may have left itself exposed to pricedifferentiation by other players including other incumbent players who may optto exploit the price differences.
Rank and Type
If all the incumbents have the same belief structure the low price will signal tothe entrant that the incumbent expects entry in time period t that the incumbentbelieves that the entrant type is de novo type. That means that there is aprobability of entry at time period t. Earlier we had distinguished betweenbelievable Bill and doubting Thomas: the bB reaction is to prevent entrywhereas the dT reaction is to dismiss the threat at this point in time. Conversely,
Signalling, Strategy & Management Type 55

if the incumbent player initiates a signalling game by an aggressive dividendspolicy this may be interpreted as a signal of the presence of a de novo entrantin the expanding geographic market. In other words, a bB player, concernedabout a possible threat of takeover, may opt to return capital to its shareholdersin the form of generous dividends. This would arise if bB management wereMarris type.
However, if a second incumbent feels threatened by the price action of thefirst incumbent, then there is every possibility that both incumbent players couldend up in a price war. The players that survive a price war are referred to asextant types. A price war outcome may have been the original intention of theentrant type who had earlier signalled its intention to enter the incumbent’smarket. But the price war outcome arises simply because one incumbentreduces price in the belief that the entrant is a potential entrant type and likelyto enter at time period t +1.
Conversely in the case of a de novo entry, for example, one incumbent mayplace a takeover bid for a second incumbent player, either as a defensive strategy(two incumbents are less likely to be acquired than alone) or by breaking rank.The presumption with rank is that incumbents in a given national geographyhave not or do not intend to acquire each other until an external shock to theirmarket. The shock may manifest itself as arrival of new technology or adoptionof new innovation or the emergence of a de novo entrant in the newly expandinggeographic market. But one player may have anticipated the external shock,readjusted its decision-making to reveal its type as an endogenous player onlyin the post-shock environment. To consider this further we need to understandthe decision-making8 within the blended type, that is, we need to define andcomment later on the decision quantum, DQ.
An incumbent type, for example, can readjust its actions from any agreedrank; an incumbent that breaks rank is referred to as an endogenous rival type.The presumption here is that the players in a rank game are able to act jointlybecause each player observes the behavior of each other and the customers obeythe rule: think of a taxi rank, where the rule is that the taxi in front of the queuegoes first or a random customer arriving at the rank, is requested to join thequeue for a rank taxi. The rank is a good example of rational cooperation thatis both desirable from the customer’s point of view and sustainable from theplayer’s point of view. A rank is more acceptable than a cartel because altruisticmotives are ascribed to the players and thus the players can act jointly in theknowledge that their joint behavior will not be condemned by a third party.
Signalling, Strategy & Management Type56
8There is additional external pressure on the firm today that is removed from the concerns of rival competitors –the interpretation of the decision per se by the fact-finder in a national competition agency. Lieberler, Easterbrookand Sidak have suggested that what passes for antitrust policy has been simply an attempt to force firms to actmyopically

In order to understand the behavior of an endogenous rival type we need toconsider the significance of ascribing altruistic motives to the players. Forexample, at one time it was regarded as in the public interest to have a nationalmonopoly with responsibility for (say) public utilities, a view that hasprogressed into a national champion theory and probable xenophobia. Nationalbanks serve a national population; with the transcending of national boundariesin a single European market the same national banks begin to rethink theirstrategy. Either they become the target of de novo entrants as they expandbeyond national geographic boundaries or they break rank by acquiring smallerincumbents or adopting new technology faster than other incumbents, signallingan aggressive organic growth strategy that remained silent under the rules ofthe rank. However, because we use banks as a fictitious example, and bankbehavior is not immune from antitrust investigation, banks as players would beadvised to deny a rank ever existed, notwithstanding the observations of thefact-finder.
Table 6.1 Bill and Thomas Types
Why Enter? Entry Function and Technology
It may be helpful for management to derive an entry function in order to re-focus the debate on the restrictions on entry:
E(q) = q2m
Where q = [Q – q*], Q is total demand and q* is incumbent output. Of particularinterest is the exponent term ‘2m’ – it will generate the concavity of the entryfunction. The specification of the entry function and its concavity, highlight therestrictive nature of entry. E(q) translates into an actual market share if entrywas impeded. As the incumbents increase q*, q tends to zero and E(0) = 0. The
Signalling, Strategy & Management Type 57
Incumbent actionBelievable Bill
Reduce priceIncrease output
Dividends policyIncrease share price
Probability of EntryDoubting Thomas
High & IncorrectLow & Correct
High & IncorrectLow & Correct
Potential entrant type
De Novo entrant type

function E = E(q) maps the optimal level of exclusion output for each numberof entrants. Technology and economies of scale in production make exclusionoutput easier to produce – this could be interpreted as a fall in the price ofexclusion resources. This would imply a higher return on each $ spent onexclusion and a shift upward in the function. The equilibrium outcome is oneof a smaller number of smaller firms than before entry deterrence.
An unanticipated change in technology may have left incumbent playerswith considerable excess capacity even though demand has not expanded.Alternatively as Landes and Posner argued, a decline in demand may have leftfirms with excess capacity. Whatever the reason for excess capacity, supposethe dominant player is matched with an entrant with the capacity to produceanother x% of output without a significant increase in marginal cost. In thiscase, the excess capacity of the entrant would limit the dominant incumbent’sefforts to raise price above marginal cost. Competition policy might argue thatthe incumbent’s excess capacity may make any threat by an incumbent toengage in predatory pricing - to keep out new entrants - more credible. If theincumbent monopolist has used real resources in order to deter entry, the issueis to explain how the opportunity cost of those resources factor into thetraditional costs of playing a game. New entrants probably would not find anindustry operating at excess capacity an attractive one to enter even in theabsence of predatory threats. The E(q) function would support this type ofoutcome, an outcome that requires a debate on credible mechanisms and theBetrand dilemma later in the E-book.
Signalling, Strategy & Management Type58

7. MISTAKE-PROOFING
Your words are like the handiwork of my ancestor Daedalus; and if I were the sayer or propounder of them,
you might say that this comes of my being his relation and that this is thereason why my arguments walk away and won’t remain fixed where they are
placed’.Socrates
Competitors know each other’s existence. The zero-sum constraint is acute. Inthis context, type is not only about conduct and behavior it is also about makingdecisions, carrying them through and taking action. We may regard the coursesof action open to management as strategies of the firm. A strategy is one firm’splan of action adopted in the light of management beliefs about the reactionsof its competitors. In this scenario, for example, a firm’s pricing policy per semay not affect the shareholder value; it will, however, affect the shareholdervalue through the management’s reaction to the action of a competitor to theoriginal pricing policy.
In other words, management must understand that action leads to reactionthat further requires a reply. Every action must have a (Nash) reply. Thishypothesis is maintained throughout the E-book. It simply means thatmanagement should not be surprised by events in time period t+1 that emanatefrom their action in time period t. As with our opening example in Chapter 1on the possible launch of a gPhone ahead of the launch of an iPhone, the signalon the possibility of a gPhone in the market-as-a-game is called a moon-shot.A moon-shot is a signal that players deny, but if one player believes the moon-shot to be credible then they are observed as acting sooner than the costtechnology or capacity may have facilitated at time period t. It is worth pointingout that the gPhone was only launched this September 2008. But was the iPhonereleased too soon in the summer of 2007?
Player Strategy
The issue of launching ‘too soon’ depends on inherent cost technology of theplayer to ensure that they do not have capacity constraints on launch of theproduct. But a greater risk in the absence of a Nash reply, is that competitors
59

can secure a second mover advantage by emulating the original players’functionalities. Nokia, for example, is in a strong position to secure a secondmover advantage in the evolving smart phone market. As a player, Nokia, bydifferentiating between music content with xPress models and focusing on themore professional users with N-series and E-series phones and focusing on timeperiod t+2 with mobile internet can secure that competitive advantage providedApple Inc are not surprised.
Player strategy is when management realise that they are in a game. Ineconomics, rational man makes optimal choices guided by well-defined andstable preferences. There are preferences on costs – marginal cost pricing, ABCcosting and incremental costs. Management are faced with a supplycorrespondence dilemma: on one hand there are rival competitors squared offagainst cyclical consumer preferences, the Penrose effect squared off againstinternal x-inefficiencies and costs squared off against price positioning. Therewill be capacity constraints in what is traditionally referred to as the short-runproblem coupled with planning horizon issues in the long run. Making adecision has to translate into taking an action. It isn’t easy. For example, plannedobsolescence, productivity and niche batch production characterise theproduction technology of many firms. Endogenous rivals whose type may beunknown at a given time period may emerge and the Nash premise becomesmore acute - the essence of modern competition.
Belief System
For management there are tensions between economic routine andargument and the desire to follow one’s own instinct in business matters. Thecompany may have a smaller asset base but generating greater pre-tax profits,hence it is making more profit from same level of assets as its near rival andthis will be reflected in the stock market as the company is observed tooutperform its near-rival. It is important for management to learn the lessonthat the best player in terms of profitability and performance measures is notnecessarily the biggest player in the market. And the biggest is not necessarilythe best player. The fact that management expects some reaction is referred toas a conjectural variation [CV]. If Player A has a C = 0 then they do not expecta reaction from a competitor; conversely, with a non-zero CV a player doesexpect a reaction to their action in a game.
Signalling, Strategy & Management Type60

Table 7.1 Game Theory Types
It is this that distinguishes between knowing that a decision has to be made andknowing when and how to make that decision. Knowing that a decision has tobe made we refer to as making a decision; knowing when and how a decisionhas to be made we refer to as taking an action. The latter term is analogous tomaking a move as understood in the theory of games, that is, the players maketheir moves when they actually decide on the strategy to be adopted. In brief, astrategy is a string of moves or actions.
Therefore management’s subjectivity is an essential property; it refers tomanagement’s sense of past, present and future, which makes management atonce a creature of history. Simon (1956) and the behavioural approach haveargued that management are bounded rational in decision making, whilePenrose (1958) had argued that management were limited in their abilities. Bothsubscribe to a view that management is exposed daily to complex information,reliant on sub-ordinates to inform them as to precisely the usefulness of piecesof information. Nonetheless management must take the first step in decision-making. In taking the first step they can apply their knowledge as managementguided by ‘laws’ of individual behavior and linked to other rival managementby the game and to internal management by the organizational structure of thecompany. It is this coalescing of the links reminiscent of Poincare’s ‘collisionof ideas’ that yields something new in a company and a degree ofunpredictability for observers of patterns of behavior. Simple ideas generatemore complex ideas and simple actions generate more complex actions, througha process of vertical blending whereby the type of management blends with thetype of player.
Behaving Strategically
From first principles we could define the economics of strategy as thecombination of both the Penrose effect (PE) and the Nash premise (NP). The
Signalling, Strategy & Management Type 61
CV = 0Expect No reactionSurprise
Bertrand type
Cournot type
CV ≠ 0Expect ReactionNo Surprise
Stackelberg type
Chamberlin-Porteriantype
Price VariablePrice signalsNon Price VariableR&D exp, advertising

latter simply requires a player to have a reply function, anticipating the likelyreaction from the player’s action. In their pursuit of growth, for example,management come to realize that a growth rate implies specific costs of growthand trade-offs. In Mueller’s (1972) life cycle interpretation of firm growth,desired growth is often limited by both internal and external constraints.Internally there are Penrose limitations on the ability of management to achievegrowth coupled with external constraints in a zero-sum market where growthof the firm slows down. Management does not wish this to happen.
Costs are committed to maximizing growth and management insecurityabout the impact of the zero-sum constraint could push their motives so far asto dilute the market value of the company sufficiently to create a reverse risk oftakeover. Understanding the type of management of the rival competitorbecomes crucial in this story. Once management takes cognizance of a rivalcompetitor’s interdependence, management has become a player in a game anddecisions are said to be strategic. Management behave strategically when theycome to understand that each and every decision is followed by an action thatis observed by the market participants. This gives us a definition of the strategyequation:
Strategy EquationS = PE + NP
It is a combination of minimizing the Penrose effect and ensuring you have areply to respond to any reactions to your initial decision in a game. The Penroseeffect can be minimized by understanding type and with a non-zero conjecturalvariation the player has anticipated a reaction. Ideally we as third partyobservers – the fact finders - would like to understand how the decision wasachieved, and for each alternative in the decision-making process, to understandwhy it was rejected, and by whom. In other words, we need to understand thecontext of the decision-making behavior. However the management of rivalcompetitors would like to know this as well but particularly they would need tounderstand the history of the actions for each of the market participants in thedecision-making process. The play of a firm consists of a detailed descriptionof the firms’ activities in carrying out its move. The description is captured laterin the E-book through the reaction functions. If A and B were to move to a pricewar, for example, their play would be a description of their actions but theintriguing question is how they made these decision to engage in a price war.
It is by knowing when and how to make a decision for each player that adescription may be forthcoming. But rival competitors will do everything tokeep one another guessing. Interpreting management as participants in a game
Signalling, Strategy & Management Type62

is nothing new. However, in this E-book we have approached management asparticipants from a different angle by introducing the significance of type inunderstanding management behavior and company strategy in product andservice markets, local, national and global markets. The focus on type is a keydriver to understanding actual, observable behaviour. The behaviour translatesinto a conflict of subjective outcomes in a non-cooperative market whereinmanagement as individuals compete against each other for market share;however they keep each other guessing on the next action.
DQ: Decision Quantum
The blending9 of management type and player type creates a decision quantum,DQ, that is, the individual or group of individuals that make decisions or takeaction or both. The quantum is composed of management type and firm, as theymorph into one game playing entity, the player. If a player per se finds itself ina market with less than 5 competitors, it behooves management to identify eachrival as a type of player. At its simplest, all players are incumbents in thesmallest bounded market and any new player wishing to enter that market is anentrant type. Post-entry, the entrant type evolves into an incumbent type andthe blending of management type with entrant-turned-incumbent player typebegins to unfold. The player is an extant (still existing) type. This becomes moreacute in a market where the number of players is less than 5, whereinterdependence, the quintessence of oligopoly, is a key driver of competitorreaction. For example, both Sony and Nintendo are extant players in the videogames market, Sega is not, while Microsoft morphed from an entrant type in2000 to an incumbent type today.
If DQ1 has a CV = 0 then DQ1 does not expect any reaction from DQ2;conversely if DQ1 has a CV ≠ 0 then DQ1 anticipates a reaction from DQ2,and formulates a reply strategy. The reason why a reaction is anticipated maybe due to the management reading of the signals from the type of managementblended within the player type that has become DQ2. For example, if DQ2 wascharacterized by DQ1 as an extant player, then there is less likelihood that DQ2would follow a price reduction by DQ1 than if DQ2 were characterized as anentrant type.
Signalling, Strategy & Management Type 63
9The blending of management type and player type is supported by the property of conjectural variation, (CV).The earliest models of oligopolistic behavior assumed that firms formed expectations about the reactions (orvariations) of other firms, called conjectural variations. The Cournot, Bertrand, and Stackelberg models can beinterpreted as conjectural variations models rather than as game theory models.

Table 7.2 Reply Strategy
Our treatment here is concerned with management acting only as DQs ratherthan as individuals, each DQ attempting to predict the actions of other DQs,but not cooperating explicitly with them. This really is about management teaminteraction. It assumes no cooperation but the outcome may sometimes beinterpreted as implicit cooperation between the DQs. Take the example of DQ1reducing price with a CV ≠ 0, DQ2 follows with CV ≠ 0 and DQ1 replies inwhat appears to a fact finder as a sequencing of price tumbles.
Players will either adopt a binary approach or not. In the Marris type thereis an inherent threat of takeover, and it is this threat that influences managementto take action10, for example, to engage in share buy-back or payment ofgenerous dividends. Competitors would observe and may infer a Marris-typestrategy based on an aggressive dividends policy within the company. Anaggressive dividend policy carries with it the opportunity cost of a £1 not spenton more R&D, lower growth for the company and the possibility of reducedfuture dividends. The business model works until the company is no longer ona balanced growth path, that is, unable to differentiate products or to innovatedue to lack of funds at a time when the share price is increasing in theexpectation of a change to the business model.
It is useful to address the issue of risk as understood from the premise thatmanagememt are risk-averse but that being risk-averse does not preclude thetaking of risks. In the context of game strategy there is a burden of loss in theinterpretation of strategy in the context of actually playing the game with rivalmanagement. Otherwise the interpretation of risk falls back on the issue ofwhether it is judicious for management to play the game. Indeed it may be thecase that management do opt not to play or that, the understanding of type iswholly inappropriate for some management and their respective firms. The lattercould define management who, in effect, increases volume in order to maximise
Signalling, Strategy & Management Type64
Type of Management
Bounded RationalPenrose effect
Player
Signal
Not in a game
In a gameReply
CV = 0
CV ≠ 0
10There is empirical evidence to support the view that share price movements are correlated with dividendpayments.

sales revenue, cuts the prices and largely ignore the presence of other firms. Itmay be a Baumol type.
Management philosophy known as kaizen, has captured the attention ofmanagement over the past thirty years. It is a generic term incorporatingnumerous management techniques with a promise of increased productivitycoupled with a reduction in inventories, errors and lead times with radicalrealignment of the production technology. Described by Imai11 (1986) as ‘thebasic philosophical underpinning for the best in Japanese management’, kaizenhas emerged as a process orientated, customer driven strategy for corporatesuccess. It has given management the capability to quickly adopt and adapt theirmanufacturing processes to changing customer and market requirements.Management terms such as TQM, JIT, kamban, and the 5-S programme areprocess-orientated concepts.
Poka-Yoke
However, there is a less known term that goes to the heart of our discussion oftype and strategy: known as mistake-proofing or ‘poka-yoke’ it is adaptable asa concept to understand management type and risk. Management by nature arerisk-averse but being risk-averse does not preclude the taking of risks. Indeedthe risk, however quantified, has an opportunity cost of real resources and themanagement team has to balance that cost with the possible gains. Gains from(say) launching a new product, exciting an episodic price war or relocating aplant may be forthcoming. The risk element is to be interpreted in terms ofmanagement as a player finally adopting a contingency plan to complimentwhatever motive is driving their action. The strategy adopted is observed bycompetitors as an action: so, for example, whether or not to launch a newproduct is a binary choice: launch the product or do not launch the product,park its launch until later. Either way, the competitor can interpret the actionand draw inferences about the type of management. If the expected return fornot launching the product, E(rA), is greater than the expected return forlaunching the product, E(rB), management take the risk and delay the productlaunch at this juncture.
To understand this, we need to understand that the computation of the E(rA)is computed as the nth-root of the different risks as perceived by the player. Innot launching a product, the opportunity costs of lost revenue, for example, isa risk r1 that has to be balanced against the opportunity cost of resources devotedto producing a product that might fail, r2, resources that could be used elsewherewithin the firm, r3, or indeed in R&D expenditure on a different type of product,r4. But one additional factor in computing that risk is the likely reaction from a
Signalling, Strategy & Management Type 65
11Masaaki Imai (1986) The Key to Japan’s Competitive Success,

competitorIf a player, for example, adopts a strategy, call it strategy 1 (S1), then we
would ordinarily associate a risk, r1, with that strategy play. However, in orderto integrate poka-yoke into that strategy, we would have to associate a rowvector of risks, R, such that R = (r1,r2,.........rn) and for each ri there is anexpected return E(ri), so that management as a player adopting a poka-yokeposition in trying to ensure mistake-proofing computes the nth-root of √{E(r1)+ E(r2) + E(r3) + .......+ E(rn). The action that is S1 is contingent on r1 with annth-root expected return. Across the strategy set, S, there are S1 to Sn and thestrategy with the maximum return as computed with nth-root formula is theadopted strategy. The choice is binary, that is, management as a player willchoose strategies from a set of strategies and can refer back to historic E(r) forany related strategy.
Burden of Loss Standard
The complexity of the strategy set mirrors the complexity of playing the game;there is a burden of loss standard that impinges on management in adoptingmistake-proofing or ‘poka-yoke’. In other words, the burden of loss standardrequires management to minimise the firm’s exposure to loss. In many respectsthe interpretation of strategy is in the context of actually playing the game withrival management, while the interpretation of risk falls back on the issue ofwhether it is judicious for management to play the game. Making a decision,and knowing that a decision has to be made, is crucial. As noted it may be thecase that management decide not to play a game per se but proceed withbusiness. Whether this happens or not depends on technology. In a world wheremanagement can influence rivals’ actions by their type, a reliance on profitmaximization or shareholder value as the key drivers of management behaviormay no longer seem reasonable. Making a decision, and knowing that a decisionhas to be made, is crucial.
Management in oligopoly markets find themselves coming closer to therhythm and pattern of real price movements. Prices are no longer arbitrarilyguided by a march towards the Holy Grail of a perfectly competitive price.Rather prices fall into a pattern that pervades the market for products andmanagement have to redeem themselves through their behaviour in the firm.Management’s rational nature can help management to decide to accept thereality or change the pattern of observed behaviour through their own actionsand reactions in the market. The economic price standards appear arbitrary orare imposed by institutions without any reference to the right reason or thepreferences of management. There are price opposites of the perfectly
Signalling, Strategy & Management Type66

competitive equilibrium, for example a cartel-like price, which can be turnedinto a negative signal (quaternity) when included with monopoly and dominantpositions. So in this view of the business world management, robbed of theirrationality, must avoid cartel price or monopoly position because otherwise theirbehaviour will be constrained and retarded by external factors.
Strategy Set
Although a fact finder may observe play in a market by observing managementactions, for management, however it is more complex. Observed behavior maynot be repeated or as in our fictitious example, player A may not have expecteda reaction from B because in the past, B did not react. This is a crucial point inunderstanding the relevance of management type to a meaningful and pragmaticdefinition of strategy. Management make decisions every day, many are internalorganizational-type decisions to do with budgeting, personnel or finance.However, the how and the when of those decisions, the taking of actions, aregenerally confined within the organization.
If we return to our fictitious example, player A may not have expected areaction from B because in the past, B did not react, so A observed a sufficientpattern of behavior and did not have a reply. The converse is equally important:why did B react? What is it about B that required it to divert from past behavior.We will look at a few explanations in terms of type of management, zero-sumconstraint, market systems, market share consolidation and innovation. Eachwill provide a template to overhang the strategy set.
Table 7.3 Blended Management
Signalling, Strategy & Management Type 67
Type of Player Ais determined by:
Zero-Sum Interdependence
Market System
Market Consolidation: n < 5
Innovation and Time
Type of Management
Firm A = Player A
YESYESYES
YES
Vertical Blending
Firm A ≠ Player A
NoNoNon < 5
YES
No Blending

The nub of the issue is this: when the taking of an action spills over onto themarket, it inevitably leads to a reaction from a rival. The identity of the rivalmay be unknown or indeed the reaction of a particular rival unexpected. Notevery day do management necessarily take an action that triggers a likelyreaction from a near rival in a market. Equally, not every day do they necessarilytake an action that requires knowledge of likely reactions from near rivals in acompetitive market. Taking an action to do nothing at this juncture translatesinto the making of no decision and may be observed as such by the near rival.
Table 7.4 Poka-Yoke
Today for the majority of companies, the management team has to evaluate therisks associated with market participation. They can indeed integrate and adoptmistake-proofing or a ‘poka-yoke’ into their decision making: managementevaluate the risks, decide to play the game, and become players, and thusproceed to adopt strategies accordingly.
The important element in all of this is that management are risk-averse,implying that they evaluate the risks, take the risk with the greater expectedreturn and enter the market as strategic players. Non-participation or admissionthat strategic behaviour is inapplicable to one’s firm, is, in and of itself, astrategic decision, whether the management wish to concede that point or notto the other market rival participants. It is the nature of the market-as-a-gamethat another firm, will interpret that decision strategically - it may signal, forexample, old traditional management styles, it may suggest a possibility ofpoaching market share, it may signal a lack of R&D expenditures or whatever.But the management who opt not to participate, have to take some responsibilityfor that decision should it inevitably leave the firm exposed to the vagaries of
Signalling, Strategy & Management Type68
Knowing that
Knowing howKnowing when
Make a decision
No error in thegameNo surpriseSignal
Poka-yokeLost First MoverAdvantage
Take an action
Poka-YokeMoon-shot iscredible
No error in the gameNo surpriseNash reply

strategic game play, playing catch-up in a rapidly changing business world. Thiswould be close to the concept of short-termism and could probably bestcharacterise a type traditionally referred to by the phrase, risk-aversemanagement.
Z or 3rd Variable
The importance of poka-yoke is to minimise errors by identifying a mistake.Ellsberg (1961) has shown that individuals express preferences for bets withknown probabilities over bets with unknown probabilities. In order to minimiseopportunity cost in any trade-off between variables X and Y, management havea 3rd variable, Z, so that they are prepared to trade different pairs of X and Yprovided Z remains at least constant in time period t and increasing in timeperiod t+1. Pairs of X and Y, for all n variables, (X1,Y1) ……....( Xn,Yn),translate into a business strategy: more profits and less revenues or less costsand more profits. A business strategy requires action. Rational managementprefer strategies yielding higher values for Z and are indifferent betweenstrategies yielding equal values. If by lowering costs in time period tmanagement can realise a higher value of Z then the observed strategy will bea lowering of costs. Keeping to type affords management a degree of certainty,a probability that the trade off between X and Y will deliver a Z-result.
The Z-result is like a default outcome, which allows management toovercome the Penrose effect. Consequently, the Z-result is intricately linked tomanagement type. The CEO is management of type Z. If player A wereobserved to choose Z (maximise value) more often, that is with a higherprobability, than Z (maximise revenues) then this would have to be interpretedas an indication of his attaching a higher utility to it, Harsanyi (1966). WithinFramework T3 there are a range of financial variables as candidates for X, Yand Z. The list is not exhaustive but includes revenues, price, profits, costs,R&D expenditure, dividends, value and profitability. There is also managementutility. Management utility, U, a measure of satisfaction, is a key driver of themanagerial models but it not the true utility as described in the Neo-classicalparadigm. Management utility is a choice utility as defined by Gul andPesendorfer (2007), the determinant of behaviour, the explanation whymanagement opt to maximise growth or value or total revenues.
Signalling, Strategy & Management Type 69

In other words, there is a personal satisfaction obtained by management in therealisation of an objective. In the two illustrations the payoff in Strategy Awould be greater than the payoff in Strategy B if the non-zero CV was correct.Management are not surprised by the reaction of a competitor; although it iscritical to be in a position to identify competitors, the nearest rival, thatcompetitor who with a greater probability will react first to your action, is themain competitor. In other words, in a business framework described bytechnology and time, the identity of the nearest rival becomes more critical andmore difficult in the absence of understanding signalling of player type. A firstresponse would be to construct a critical time line of competitor signals over aperiod of time.
Signalling, Strategy & Management Type70

Noise
Noise in a market is a distraction. McCullough (2008) Beyond Revengedescribes noise in a game in terms of an error ‘when you might accidentallydefect when you mean to cooperate or your partner will read your genuinecooperation as a defection (pp98-102)’. In Framework T3 noise is a signal toget players to think x-way but to do y-way. When a player is in decline in timeperiod t because of increased competition and shrinking demand noise willexist in the market-as-a-game. In other words, one player may think x but doand signal y. When the rival reacts to y, believing that y is the opponents truechoice, the opponent plays x. Noise as a signal may manifest itself in a gamewhere a player is playing not to loose rather than playing to win. In somerespects this might explain Nokia’s push into mobile services with maps andemail, which was signalled early in 2007 when it launched Ovi. Formal launchis planned for January 2009 with Ovi Maps and Ovi Mail. Ovi has beendescribed in technology magazines1 as ‘a hub that integrates mobile servicesbetween handsets and PCs’.
Nokia has a reputed worldwide market share of 40% in handsets. In order toprotect that market share – so that it does not fall (say) to 30% - Nokia arecreating noise by signalling a strategy that focuses not on growth of handsetsper se but on the services they provide.
Motorola’s launch of the clamshell mobile phone design in the 1990s maywell have been noise in the emerging game for dominance in handsets.
1For example, interesting article in The Economist, December 6th 2008
Signalling, Strategy & Management Type 71

Signalling, Strategy & Management Type72
Noise in a Tumbling Price
In the market for mobile phones both price and non-price characteristics areimportant in the game. Price falls can signal a Baumol type, and if playersbelieve that there is a Baumol type in a game, price should not fall below thetrigger price because net total revenue accruing to any player would fall. A rival,observing no price fall, believes that no player is a Baumol type. So no playerreduces price and no player knows that there is a Baumol type so no playermoves on reducing price. This is a paradox.
If a player knows that the rival believes that the player is not a Baumoltype then price will not be increased above the trigger price because net totalrevenue accruing to the player would fall. Consequently, it is only when theplayer knows that the rival knows that the player is a Baumol type that the playerwill reduce price but it is the action of reducing price (if present price is abovethe trigger price) that reveals the true identity of the player as a Baumol type.Within the elastic range a high prevailing price can be maintained to maximiseprofits in a concentrated market with less than 5 players. Any action by a playerto reduce price (in order to recoup lost revenues) could be interpreted as a pricesignal from a Baumol type, and unlikely to precipitate a price reaction, if therival knows that the player is a Baumol type and price should only fall to thelevel of the Baumol type’s trigger price floor.

Yet, if no player reduces price, prices will not tumble. For example, Nokia andApple could succumb to this paradox of a tumbling price, in that as price fallsin order to compete, the trigger price, activated by changing fickle consumerpreferences for more functionalities, embeds a sequentially lower bound onthe market price. In the limit that price could be a zero price. As that happens,a greater demand for functionalities is creating an inelastic demand that wouldwarrant a price increase in time. Identifying patterns in observed signals isnecessary in order for each player to isolate a rival’s strategy as a string of pricemoves across the CTL. It is imperative in the market-as-a-game, whereininnovation, rapid product development, technology and the demand forfunctionalities define the game dimension that patterns are identified.
Signalling, Strategy & Management Type 73

8. HOMO LUDENSWe can better satisfy our appetites
in an oblique manner, than by their headlong and impetuous motion.
David Hume
The central contribution of game theory to the economics of strategicmanagement is a new language for the understanding of how to formulate andstudy strategic or inter-company optimization involving two or more players.There is a wealth of application in the literature but we are suggesting in the E-book that there are two fundamentally different classes of application of gametheory to economic problems in business. The first is the application of two-person zero-sum games to primarily tactical business problems. The second isthe application of n-person non-constant-sum-games to strategic issuesinvolving threat analysis and price wars. It is this combined application ofgames that provides the genesis of the economics of strategy
When our interests are confined to applications of the two-person zero-sumgame, a reasonably strong case can be made for management as homo ludens(game-playing man) as an intelligent, calculating entity with no personality orpsychological foibles playing against an equally bloodless opponent. We canextend the concept of individual rational behavior to the two-person zero-sumgame. When our concerns are strategic and the game is naturally a non-zeromixed motives optimization, that is, where there is neither total coincidence nortotal opposition of interests, the model of an individual actor may not suffice tocapture the behavior of the players. It is in this context that we have introducedthe idea of a decision quantum (DQ) in order to help differentiate betweenmanagement as an individual and the management team working as a groupand the different groups functioning as a product market. A host of assumptionsconcerning the players and their game environment may have to be introducedlater in order to facilitate a model of some aspect of business reality for analysis.
Game Playing Man
It has been sixty years since the publication of the seminal work on the theoryof games with the interesting essays and approach of both Schelling (1960) and
74

Shubik (1960) raised a series of questions concerning the application of anintermix of game theory and gamesmanship to strategic analysis. Further, therecognition of the need to study and formulate the principles of war dates backto the writings of Sun Tzu circa 500BC. Although the seeds were sown manythousands of years ago, the specific development of a mathematical languagefor the study of conflict, cooperation and negotiation did not occur until theadvent of the theory of games.
Notwithstanding the market structure, what is important for managementis the degree of entry and their belief system on entrant types. Efficient entry isalso best understood within the parameters of the type of competition thatprevails in a market, McNutt (2005), including combat competition, scramblecompetition and contest competition. It is best characterised by an efficiententry price. The efficient entry price is a long run equilibrium price of entry.
Market Systems
Whether or not players in a market system co-operate and lock themselves intobinding commitments, which may be caught by antitrust legislation, dependson the rules of conduct for player behaviour in a market system. McNutt arguedthat there is a Boolean network of player behaviour – at its simplest it is a rule,which stipulates that each player acts on price if and only if two players act.Player A makes a decision if two other players make a decision but each playercan decide to act or not at each decision point. In many respects it is aboutaggressive competition. Under scramble competition, for example, there is anexact equal partitioning of the market and hence an equal division of the effectsof competition between the competitors. Scramble may be manifest by changesin size of players or in the number of players. Combat competition tends to becharacteristic of more stable market systems where the acquisition of marketshares requires constant defence by the incumbent types.
If the market-as-a-game is played just once allow for a unique payoff of(2, 2). It can be any number but both players receive exactly the same amount.Each player knows exactly what they want to do (they have a dominant strategy)and each player has the easiest of decisions to face – keep prices high andreceive 2. Both players would prefer to be in the top left cell of the matrixbecause in four cycles of this game a player could receive a payoff of 8 =2+2+2+2. However, player A has a dominant strategy of competing to a lowprice, trying to do better by obtaining a payoff of 3. But the 3 is only obtainableif player B continues to keep his prices high.
Signalling, Strategy & Management Type 75

Table 8.1 Prisoners’ Dilemma
In other words, if B keeps prices high, it is because he trusts A to do likewiseand vice vearsa. So B trusts A; but A knowing that, betrays B. Once player Brealises that player A has lowered its price, player B follows and they both12
find themselves in the lower right cell of the matrix with a payoff of (1,1). PlayerA now ends up with 6 = 2+3+1+0 or with 4 = 1+1+1+1 if B punishes A for thebetrayal by always keeping prices low. This is a recognised punishment strategy,signalling to A the payoff 4 in time period t+1 instead of 8. In trying to do betteryou can end up worse off! David Hume, an English philosopher, writing in the18th century, captured the idea: ‘we can better satisfy our appetites in an obliquemanner, than by their headlong and impetuous motion’. Remember that thefuture is not what it used to be!
Nash equilibrium
In the exchange of prices, players interact with each other by using prices assignals. An incumbent and entrant, or two incumbents can face classiccoordination problems. Conflicts can arise. In a two-person game, a pair ofstrategies will form a Nash equilibrium when each player cannot do better giventhe strategy the other player has adopted. A Nash equilibrium is a pair ofstrategies such that each is a best response to the other. The payoff (1,1) aboveis an example of a Nash equilibrium. To test whether a strategy combinationforms a Nash equilibrium just consider the following: let us call the strategyfor the first player x* and the strategy for the second player y*. A pure strategyequilibrium is a Nash equilibrium in which the equilibrium strategies are playedwith certainty or with probability equal to one. When the Nash equilibriuminvolves only strategies that are played with certainty, we have a pure strategy
Signalling, Strategy & Management Type76
High pPlayer B
Low p
Player AHigh p2,2
3,0
Low p0,3
1,1
12A cartel between A and B might seem a solution, but with an inherent incentive to cheat or betray,enforcement of the cooperative solution might prove to be difficult, vide the arguments in McNuttLaw, Economics and Antitrust. Cartels may not last very long. If one player believes that the otherplayer will always cooperate and keep prices high then there is an incentive to betray or cheat. Theissue is to do with trust: if B keeps its prices high, can B really trust A to do the same? It iscollectively that they each as players face a dilemma – how to obtain the cooperative outcome of 8rather than the non cooperative outcome of 6 or 4

equilibrium. The alternative to a pure strategy equilibrium is a mixed strategyequilibrium in which, in equilibrium, each player adopts a strategy that selectsat random from a number of pure strategies. For additional reading check Dixitand Nalebuff (2008): The Art of Strategy.
We need to ask whether, given that the second player will play y*, the firstplayer can do strictly better by switching to some strategy other than x*.Similarly, we need to ask whether, given that the first player will play x*, thesecond player can do strictly better by switching to some strategy other thany*. If there is no better strategy for the first player than x* in response to thesecond player’s y*, and if there is no better strategy for the second player thany* in response to x*, then this pair (x*, y*) is a Nash equilibrium for the game13.
First Hurdle Initiative
When we raise the question of solution to a game, interesting issues arisebetween two-player games and n-person games. Dynamic games with fewplayers, for example, have a leading contender in the perfect equilibrium butit is not unique. For tactical problems involving two players, the saddle pointor maximin-minimax solution provides a reasonable solution to a two-persongame of opposition. Strategic problems have been considered primarily asgames in extensive, strategic or coalitional form. Taking the first step in a gameis crucial for management: by taking a first step and should rivals follow, thenthe management assume the mantle of leader. We are looking for a volunteerbut both players realize that if both volunteer the worst possible outcome willobtain.
Both players have an incentive to volunteer given that the other player doesnot and it is because of this incentive it can be argued that the pre-conditionthat the other player does not volunteer may not hold and hence to volunteerbecomes the optimal strategy. The dilemma here is that it cannot be optimal forboth players simultaneously, that is, the players do not have dominant strategies.
Table 8.2 Volunteer’s Dilemma
Signalling, Strategy & Management Type 77
13McNutt in Law, Economics and Antitrust looks at this scenario in terms of a semi-ordering ofprices, where x* corresponds to a ‘reduced’ price by a defendant-firm and the y* corresponds toa ‘lower’ price for an entrant-plaintiff. The pair (x*, y*) is aggressive pricing.
S1S2
S3(2,2)
(3,2)
S4(2,3)
(1,1)

Unlike in the PD game where there is a unique Nash equilibrium, in theVolunteers Dilemma the solution can be characterized by either one of the Nashequilibria (2,3) or (3,2). In the VOD there is no strategy available by which oneplayer can punish the other player’s deviation from a quasi co-operative path.
Classic PD
Earlier in this chapter we represented the possible outcomes to demonstrate themaxim with one player seeking to do better than (2,2) by obtaining a 3 but endsup at (1,1). The player can only obtain 3 if the other player receives 0. In otherwords, one player opts to go for a low price but only if a second player keepsits price high - that is the only way to secure a 3. But the second player soonrealises that 0 is an outcome, so that player also reduces its price to low andboth players end up at (1,1).
Table 8.3 Classic PD
The only solution is communication and this is illegal in the real world due tothe antitrust legislation on cartels and price fixing. In other words, one player,a price leader, initiates an agreement to remain at the (2,2) outcome. In manymarkets, a fact finder would observe constant or fixed prices. However the mereadherence to a fixed price is not sufficient evidence of belonging to a cartel asthere must be some evidence of a rule or mechanism to ensure that the (2,2)outcome obtains across all periods and there is no incentive to cheat because of(say) a punishment strategy.
If both players were to communicate over a four period game then the totalpayoffs would amount to 2+2+2+2 = 8. If one player deviates from theagreement and cheats by charging a low price in the second period, that player
Signalling, Strategy & Management Type78
HIGH p
LOW p
HIGH p
[2,2]
we can both havethe payoff 2
[3,0]
LOW p
[0,3]
you want this payoff 3 instead
[1,1]
we both end up witha 1 payoff

obtains 2+3 = 5. However, the other player observes the cheating behaviour andreduces its price to low and does not move in order to punish the first playerwho now obtains 2+3+1+1 = 7 with a realisation of 1+1+1+1 = 4 for all periodsunless there is an agreement not to cheat. But this is difficult to maintain in thereal world unless a credible punishment mechanism can be put in place by oneof the players. Competition enforcement agencies now rely on whistle-blowerlegislation to entice a cartel member to come forwards and reveal the cartelmechanism. Alternatively, with an incentive for a player to do better, any cartelis inherently unstable.
The Folk Theorem in game theory spells out the means by which firms canattain outcomes that appear collusive without necessarily engaging in overtcollusion – or, indeed, even discussing together what to do. It shows howcollusive outcomes can be attained ‘as (sub-game perfect) non-cooperativeequilibria’, (Friedman, 2000). However, in producing cooperative behaviourfrom a conventional non-cooperative equilibrium, the Folk Theorem, it has beenargued, blurs the distinction between explicit collusion and tacit collusion. Fromthe standpoint of intent, this makes anti-trust investigation rather delicate. Inaddition, it opens up consideration of partial collusion wherein players colludeon certain choices (prices) and not on others (location or markets) as argued byFriedman, Jehiel and Thisse (1995) in their paper. It also leads to unintentionalco-operation or the ASP standard discussed in McNutt (2005) and later in thisE-book.
Mixed Strategy
An example of a mixed strategy would arise if one player in an exchange ofprices randomly decided to change or not change price with equal probability.This particular mixed strategy in a predatory pricing game may not be part ofa Nash equilibrium. A national competition agency or Court, for example,would need to discover the other firm’s response to this strategy. The other firmwould compute the expected payoffs from each of the pure strategies ofchanging and not changing price. A national competition agency or Court musttry to comprehend if management is not acting rationally if it chooses a strategythat does not maximise the firms’ payoff. Alternatively, a national competitionagency or Court must balance this with whether or not the management of anincumbent firm is willing to predate in order to convince entrants that they areaggressive rather than rational.
In the application to strategic business decisions what is equally importantfor management is to understand the game and the strategy may well dependon management’s interpretation of the context in which they obtained the move
Signalling, Strategy & Management Type 79

or had taking the action. This is a classic dilemma in cartel pricing: if Player 1keeps prices high, both players get (10.10) and the game is over. But it is Player1’s move to keep prices high or not. If Player 2 ever gets the move, then Player1 is either irrational or has made a blunder of some sort. If Player 2 gets themove, he can end the game at a new payoff or give the move back to Player 1.Player 2 strategy will depend on the context in which the move was obtained.
Making decisions and taking actions can only be understood by referenceto the subjective behavior of management so we find it useful to interpretdecision making by differentiating between knowing that (making a decision)and knowing how and when to act (taking an action). The iconic Prisoner’sDilemma in games arises precisely because one player takes an action to breakaway from the agreed decision on the presumption at this point in time that theother player will not react. Paradoxically, while management may prefer toavoid conflict, individually they may prefer an outcome that can only beobtained by conflict. This is the conundrum embedded in the PD expressed asfollows: in trying to do better than the status quo by taking an action theindividual ends up worse off. But someone has to take the first step otherwisethere is no game; there will be no market interaction.
Morphing into a DQ
Understanding type allows management as a player in a game to minimise atrial-and-error learning process in which they gradually discover that only somestrategies work. Management at time period t do not have complete knowledgeof details of the game. The market in which they are competing evolves intoeither a combat system, a contest system or a scramble system, McNutt (2005).Consequently management as an individual evolves in the market-as-a-game.As they recognise the degree of interdependence, management type morphsinto a DQ, a player, and the rules of the game, the type of players and thepayoffs become common knowledge. Nokia’s completion of the purchase ofSymbian in 2008 is an interesting example of management type morphing intoa DQ. A signal to Apple, Google and Microsoft was sent in summer of 2008when Nokia completed the deal to buy out Symbian the leading maker ofoperating system software for advanced mobile phones. The software is usedin at least 50% of mobile phones and is an integral part of delivering thefunctionalities of mobile music and photo sharing. The mobile market isevolving into services and players have tot ask: will one operating systemdominate in the handset market much like Microsoft Windows in the PCmarket? Much will depend on the game dimension: on other rival players suchas Google’s Android, Blackberry, iPhone and Linux but also on the need forhandset manufacturers to sign up to one software. That would change the rulesof the game.
Signalling, Strategy & Management Type80

9. MARKET AS A GAME
They came to the fields of joyThe fresh turf of the Fortunate Woods
Here was the company of those who had sufferedWounds fighting for the Fatherland
Aeneid vi. 638,660
Despite the many uncertainties in the business world, in this E-book there isone reason for uncertainty – the misreading of signals.. The market is introducedin terms of the market-as-a-game, focusing on the interaction of competitors asplayers in a product market wherein there is a recognized interdependence (CV)amongst the players. We do make some assumptions: our first assumption,Assumption I: player assumption, is that the company or firm is referred to asa player and this carries with it an understanding that the company or firm is ina game with other players. We are starting from the premise that firms are awareof their interdependence and management as players are mistake-proofing.Move and countermove ensue until both firms arrive at an equilibrating solution.
Market-as-a-Game
Now some firms do not necessarily carry this understanding of a player as inthe meaning provided in this E-book but they do compete and competeaggressively with each other. As long as management never perceive theirinterdependence the outcome achieved is the outcome expected and not theoutcome attainable. However, in different geographic markets, whether local,national or global, where the number of players is less than 5 there is a greaterprobability that the firms are players and that the management team do realisethat they are in a game. This is the market known as oligopoly. Our secondassumption, Assumption II definition of game assumption, is that a group ofcompanies realise that they are in a game whenever the fate of one companydepends not only on its own actions, but also on the actions of the rest of thecompanies in the market, (Binmore & Dasgupta, 1986).
From a third-party perspective, a fact finder may observe play in a marketby observing management behaviour and player actions (say) from signals on
81

price, quantity, or dividends policy. It is quite a different thing to infer the playertypes in a market by observing the behavior of the management alone. So forexample, by ascribing types to the management of Company X, the fact finderbecomes bounded rational about the player type. The fact-finder by employingthe principle known as Occam’s razor ignores the features of the economictheory that cannot be observed. He has limited ability to distinguish one typefrom another. So instead the fact-finder uses experience and easy-to-processsignals to sort the problem into a small number of categories. Once themanagement realize that they are in a game, camouflage may take place,deliberate attempts to confuse the opponent and thus the type of managementis then subsumed within the type of player. Consequently player type is moredifficult to predict and thus to observe ex-ante in the blending of types
In the late 1920s, the French mathematician Emil Borel wrote a series ofarticles to show how games, war and economic behaviour were similar activitiesin that they all involve the necessity of making strategic decisions. Borel’s workgained the attention of economists and the most significant achievement wasthe publication by Von Neumann & Morgenstern (1944). There was now a beliefamongst economists and mathematicians that a full-fledged theory of gamescould be developed, providing a much better understanding of oligopolybehaviour than that offered by traditional economic theory.
In their seminal work they introduced the fundamental classification ofgames into those of complete information and those of incomplete information.Competition may manifest itself in different ways, for example, in terms ofprice competition or advertising expenditures but in a game we are focusing onpatterns of observed behavior. In this enriched view of a market, managementembedded in a firm as a player will continue to look at prices but will also lookat patterns of prices over a period of time; they may need to also look at entropyin the market shares and later in the book we introduce the concept of scramble,combat and contest competition.
Unlike formal games such as chess, bridge or poker each has well definedbeginnings and ends, most models of strategic business situations cannot beeasily assigned a clear end-point or rest point. In essence it becomes theresponsibility of the fact finder to establish the context in which the game isplayed. The behavior of management as described must be assessed in thecontext of the situation at hand. A third assumption, Assumption III, anassumption of symmetry is deployed to capture the point that any differencesin abilities of individual management must be specified within the modelotherwise all non-specified attributes are regarded as the same. The value ofthis assumption is significant as a device for simplification. For example, if wewish to apply the two-person zero-sum game to a price-revenue evaluation
Signalling, Strategy & Management Type82

problem involving a task on elasticity, the assumption that the opposing playersare equal in all respects appears to be reasonable. For example, as managementthey each understand the economics of the total revenue test: price increaseson an inelastic demand will tend to increase net total revenues.
Homo Ludens
However, individual management, homo sapiens, is limited in both the abilityand capability to see, to comprehend, process and act upon all the informationavailable. His strategic cousin, homo ludens, is to be regarded as a simplificationof management with bounded rationality. In the study of threats, bargaining andnegotiating as applied to management and business it may be worth consideringtherefore a blending of type of management with type of player into a DQ, thegame playing type analogue of a management team. The behavior of the DQ issaid to be rational only in so far as it coincides with an equilibrating behavior.It is reasonable is so far as the player has sound judgement. Consider thefollowing payoff matrix from the game theory literature:
Table 9.1 Homo Ludens
The row player can play a if she can reasonably believe that the column playercould play A, since a is a best response to A. She can reasonably believe thatthe column player can play A if it is reasonable for column to believe that therow player could play a. He can believe that she will play a if it is reasonablefor him to believe that she could play a, etc. This provides an infinite chain ofconsistent beliefs that result in the players playing to an outcome (a, A). In thebusiness application, it is critical that each player have a belief systemconjectural variation and eacha ction should be define din terms of a CV. Inother words, a Baumol type with a CV = 0 could reduce price to increase totalrevenue. Unless management as a player signal this type to the market, otherplayers might interpet this price reduction as a threat and react by reducingprice, and this tit-for-tat as illustrated in Figure 9.3 could continue until thesignals are matched. Alternatively, a signal to the market that player X is aBaumol type, will allow other players to believe that player X is a Baumol typeand the observed price reduction is a one-shot price move requiring no reaction.
Signalling, Strategy & Management Type 83
a
b
A
1,1
0,0
B
0,0
1,1

In Heinrich (2004), for example, social preferences are admitted to thePrisoner’s Dilemma game, allowing for the possibility that some players areaverse to inequality. It is argued that some players in a PD game prefer the moreequal but personally less profitable outcome of mutual cooperation to the moreasymmetrical payoff produced by defecting against a cooperator. Within thePD pricing game once one player deviates by lowering price, Dp, there is atemptation for another player to follow. In other words, there is a kind ofreciprocity in pricing as follows: my rival has introduced Dp, would it pay meto do the same? The reciprocal price may not be so easily forthcoming inbusiness as management are either increasingly subject to shareholderconstraints or do not have the production capacity at a point in time to proceedwith a matching price reduction.
Price Tumbles
Therefore DQ1’s perception of DQ2 will influence its decision to commitresources to either avoiding or precipitating a price tumble. Consequently thereaction system has to be interpreted in such a way that the rollout of DQ1’sprice – in retrospect, the history of DQ1’s prices - is relevant for DQ2’s action.The price reaction functions are linear and have a positive slope to indicate thata given price reduction from DQ1 (fixed amount of resources) is triggered bya given price reaction from DQ2. But this action-reaction is only possible overa limited amount of time before each DQ begins to read the signals from thegame. The essence of the competitive process is trying to understand thecomplex web of competitors’ behaviour. Reaction function allows managementto track the price reactions of competitors. Management in a game under thezero-sum constraint will soon learn that to weigh competitors’ price reactionmore than the limitations imposed on price by the own demand elasticity. Thisis the essence of strategic pricing.
Price war is a term used in business to indicate a state of intense competitiverivalry accompanied by a multilateral series of price reductions. One competitorwill lower its price, and (in sequence) others will lower their prices to match.If one of the reactors reduces their price below the original cut price, then anew round of reduction is initiated. Price war is usually costly in terms of theopportunity cost of real resources used to defend market shares. Managementshould avoid price wars that are costly and profits are eroded.
Bertrand Model
The focus here is on strategic complements in a highly differentiated oligopoly
Signalling, Strategy & Management Type84

market. It focuses on likely price reactions in such a market. This modelexamines the pricing behaviour of interdependent companies in a productmarket with few competitors. This is more applicable to the oligopoly markets.
Figure 9.1 shows non-intersection of the reaction functions of companies A andB. The price equilibrium is zero, at the origin. There is every likelihood thatboth players could drive the price to the (0,0) price equilibrium as the gamewill continue until the equilibrium price is reached.
The challenge for the Bertrand model is to explain (i) in some markets inthe absence of overt collusion competing players are able to maintain highprices: US cigarette industry 1990s; (ii) in some markets where interdependenceis acute, there is significant price competition: regional cement suppliers andglobal video games market post 1998 and 2001-2005. The Sony-Microsoftgame 2000-2004 is discussed in Kaelo v2.0.
Signalling, Strategy & Management Type 85
Bertrand Challenge Explained by.
1. Realisation of the Nash equilibrium
2. Folk Theorem Benefit-Cost Condition
3. Asymmetric Sameness in Price Condition
4. Error in the Game
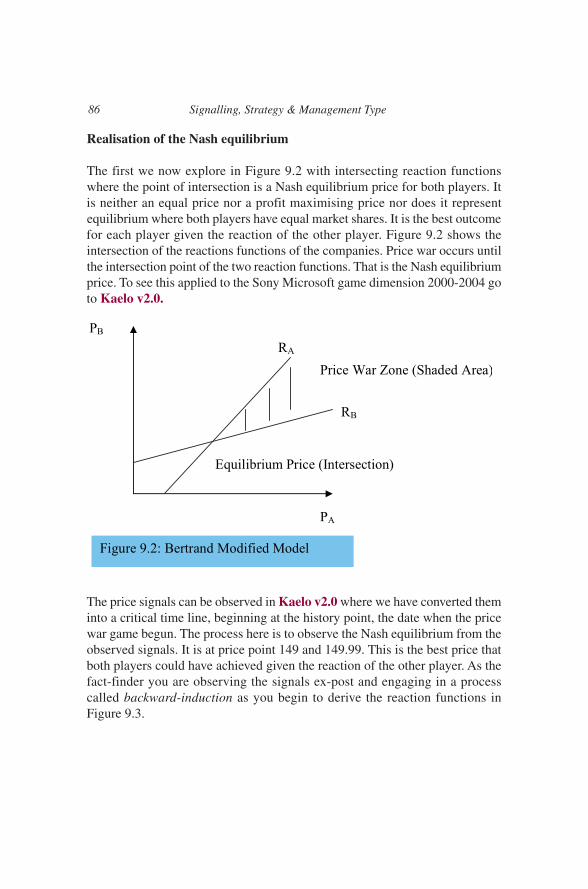
Realisation of the Nash equilibrium
The first we now explore in Figure 9.2 with intersecting reaction functionswhere the point of intersection is a Nash equilibrium price for both players. Itis neither an equal price nor a profit maximising price nor does it representequilibrium where both players have equal market shares. It is the best outcomefor each player given the reaction of the other player. Figure 9.2 shows theintersection of the reactions functions of the companies. Price war occurs untilthe intersection point of the two reaction functions. That is the Nash equilibriumprice. To see this applied to the Sony Microsoft game dimension 2000-2004 goto Kaelo v2.0.
The price signals can be observed in Kaelo v2.0 where we have converted theminto a critical time line, beginning at the history point, the date when the pricewar game begun. The process here is to observe the Nash equilibrium from theobserved signals. It is at price point 149 and 149.99. This is the best price thatboth players could have achieved given the reaction of the other player. As thefact-finder you are observing the signals ex-post and engaging in a processcalled backward-induction as you begin to derive the reaction functions inFigure 9.3.
Signalling, Strategy & Management Type86

Figure 9.3
If the fact-finder were to inform both players at the price point 299, the historypoint, that (i) they are about to enter a price war and (ii) the best price for eachwill be in the price range 149 to 149.99, after 4 years of price competition,neither player would believe the fact-finder. This is the classic PD as bothplayers believe that they can do better. It is important to note that the NE priceis not the best in terms of maximum profit or maximum market share, it issimply the best in the game play given the reaction of your competitor.
Folk Theorem Benefit-Cost Condition
A second explanation is to be found with reference to formally agreeing to fixprices above the Bertrand competitive level. This is illegal in most jurisdictionsdue to antitrust laws. To emphasise, the authors of the textbook are not focusingon formal collusion, rather the authors use the term cooperative pricing to referto situations in which firms can sustain prices in excess of those that wouldarise in non cooperative single shot games. Put another way, suppose two firmsare unilaterally setting prices that are near the prices they would set if theysuccessfully colluded. Are there conditions to do with costs and profits underwhich neither firm would wish to undercut its rival? Under these conditionscooperative pricing is feasible.
Signalling, Strategy & Management Type 87

However much remains unclear in the substitution of accounting profit foreconomic profit, particularly if, as noted by Demsetz, monopoly profits of theincumbent are capitalised in the accounting value of the firm’s assets, notablypatents and trademarks. In most cases the only hard number is the market shareand the concepts of dominance and significant market power (SMP) are definedwith respect to a market share threshold. Landes and Posner had argued for apossibility not to define market power in terms of specific market shares at all,but instead ‘to interpret the market share statistics in each case by reference toqualitative indicia of the market elasticity of demand and the supply elasticityof the fringe firms’. They continued to argue that if either the market elasticityof demand or the elasticity of supply were high, different inferences would bedrawn from the defendant’s market share than if either or both of the elasticityvalues were low.
Asymmetric Sameness in Price (ASP) Condition
An ASP standard is asymptotically close to a bargained competitive price andtherefore, it follows that not all instances of parallel behaviour could give riseto the same strength of inference that the parallelism results from anything otherthan the independent commercial judgement of the firms. Parties who engagein tacit collusion are behaving quite differently from firms that enter into explicitcartels. Management of firms that engage in tacit collusion may not even knowwhat they are doing; they may not recognise that the pricing practice helps tosupport an anticompetitive equilibrium. In many markets, price can take on itsown momentum: for example, demand for a limited supply will increase priceunder the basic law of supply and demand. Conversely in a competitive priceenvironment, price will fall to a low price on its own momentum.
Consider two outcomes 1st outcome: incumbents have excess capacity thatsignals a threat to new entrants; and 2nd outcome: a market with excess capacitythat is not attractive to enter. A combination of the two outcomes could meanthat we are dealing with a mixed duopoly where both firms simultaneouslydecide whether to enter the market or not and to communicate this andeventually they play a Cournot-Nash duopoly game choosing the output. Barros(1984) has shown that a mixed duopoly may indeed lead to an improvement inallocative efficiency. For a fact-finder trying to understand the proper contextof type of competition in a market the actions and reactions of the firms shouldbe regarded as an evolving process in which each participant carries out its dutyin the market, the job in which each is more efficient. The basis of any‘understanding’ is an increase in market power with a concomitant increase inallocative efficiency.
Signalling, Strategy & Management Type88

Competition or antitrust law and policy is about maximising consumer welfareand that can only be achieved by lower competitive prices at the retail level.And in so many competition issues, the real price that competition promisescontinues to elude the consumer across so many product and services market.If we begin with the premise that a market is a classic case of signalling whereinthe ability to ‘do a deal’ and negotiate or conduct transactions at prices throughsignalling mechanisms may be the modus operandi, then the fact that abargaining mechanism – cartel arrangements or signals - exists at all reflectsthe nature of the business and the fact that a bargaining mechanism cannot easilybe monitored by others would make it difficult to detect instances of allegedprice fixing.
Error in the Game
A price signal, Dp from one player may not always lead to a matching pricereduction. Furthermore, it does not require an immediate Dp if the player has acommitment to altruistic behaviour. Once the first player observes that thesecond player is not following with a Dp the first player may stop and reconsiderthe Dp. If so, the second player has influenced the first player not to initiate Dpso in effect changing the behaviour of the first player. In these circumstances,the fact-finder would observe cooperation and proceed to dismiss the possibilitythat it could have emerged from nothing more than the cold calculation of self-interest. It need not necessarily rely on a credible mechanism.
One important signal for DQ2 is the intention of DQ1 in initially reducingthe price: was the intention to make a price war unavoidable using it as a catalystfor greater competition? DQ1 with a CV = 0, for example, could be interpretedas a naïve strategy especially once DQ2 reacts with a price reduction. Both DQsfind themselves in a price war but DQ2 would have to ask: did DQ1 intend toinitiate a price war? This is the error in the game - the incomplete informationthat can trigger a price war. And it also raises the time constraint – whether anyDQ has a binding time constraint within which to complete the action.
With error DQ1 may have a lower bound on price – and thus facilitatingintersecting reaction functions - otherwise DQ2 might believe that DQ1 ismoving to the zero-price equilibrium. If DQ2 is going to follow a pricereduction (as perceived by DQ1, that is, CV ≠ 0) there is no reason why DQ1should initiate a price war; and conversely if DQ2 has CV ≠ 0. The price tumblethat triggers a price war scenario is more likely to manifest itself withasymmetric information, where one DQ is informed of all the parameters but asecond DQ is not informed as to a competitor DQ’s aversion to a price war orwillingness to engage.
Signalling, Strategy & Management Type 89

Table 9.2 Regret Matrix
It depends on how the DQ views the payoffs in the game. There is an elementof regret in not taking an action. The costs of regret would have to factor in thecosts of playing the game. This is discussed in Kaelo v2.0. In Table 9.2 you arePlayer A with two strategies, S1 and S2. Player B has two strategies, S3 andS4. Player A plays S1 only if the payoff of 3 is the maximin. If you are PlayerB, and if Player A has played S1, you play S3 only if the payoff of 4 is yourminimax.
The Regret Matrix
Within Framework T3 we are advocating that it more rational for businessmanagement as players to think in terms of the opportunity costs rather thanthe gains in a payoff matrix. Consider a player faced with three options, S1, S2,and S3. The player has a conjectural variation. For illustration purposes thepayoffs are defined in Table 9.3:
Table 9.3 Maximin
Faced with a decision, management assuming the minimum payoff may take apessimistic view of the market-as-a-game. Therefore he should act to ensurethat he gets as large a payoff as possible in the market-as-a-game. This is calledthe maximin because it maximises the minimum payoff. So he is faced withtwo choices, S2 and S3, and he is indifferent between them. This is sometimescalled the criterion of pessimism in that the worst in always assumed.Alternatively management may be an optimist and thus choose the maximaxstrategy that maximises the maximum payoff leading to the selection of S1.
Signalling, Strategy & Management Type90
S3S4
S13
5
S24
1
ACTION CV = 0 CV ≠ 0 MINIMUM MAXIMIN MAXIMUM MAXIMAX
S1 10 1 1 10 10
S2 9 3 3 3 9
S3 5 3 3 3 5
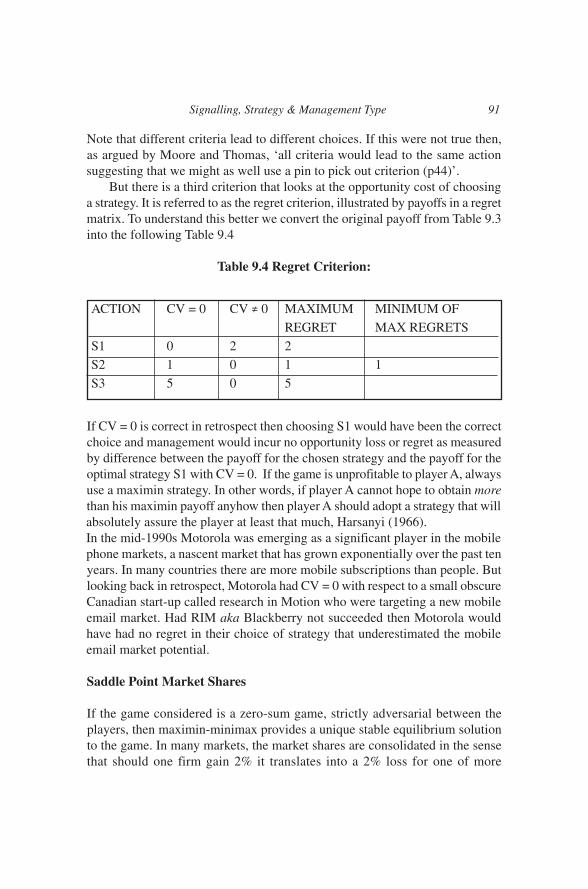
Note that different criteria lead to different choices. If this were not true then,as argued by Moore and Thomas, ‘all criteria would lead to the same actionsuggesting that we might as well use a pin to pick out criterion (p44)’.
But there is a third criterion that looks at the opportunity cost of choosinga strategy. It is referred to as the regret criterion, illustrated by payoffs in a regretmatrix. To understand this better we convert the original payoff from Table 9.3into the following Table 9.4
Table 9.4 Regret Criterion:
If CV = 0 is correct in retrospect then choosing S1 would have been the correctchoice and management would incur no opportunity loss or regret as measuredby difference between the payoff for the chosen strategy and the payoff for theoptimal strategy S1 with CV = 0. If the game is unprofitable to player A, alwaysuse a maximin strategy. In other words, if player A cannot hope to obtain morethan his maximin payoff anyhow then player A should adopt a strategy that willabsolutely assure the player at least that much, Harsanyi (1966). In the mid-1990s Motorola was emerging as a significant player in the mobilephone markets, a nascent market that has grown exponentially over the past tenyears. In many countries there are more mobile subscriptions than people. Butlooking back in retrospect, Motorola had CV = 0 with respect to a small obscureCanadian start-up called research in Motion who were targeting a new mobileemail market. Had RIM aka Blackberry not succeeded then Motorola wouldhave had no regret in their choice of strategy that underestimated the mobileemail market potential.
Saddle Point Market Shares
If the game considered is a zero-sum game, strictly adversarial between theplayers, then maximin-minimax provides a unique stable equilibrium solutionto the game. In many markets, the market shares are consolidated in the sensethat should one firm gain 2% it translates into a 2% loss for one of more
Signalling, Strategy & Management Type 91
ACTION CV = 0 CV ≠ 0 MAXIMUM MINIMUM OF
REGRET MAX REGRETS
S1 0 2 2
S2 1 0 1 1
S3 5 0 5

competitors in the market. The game is about market shares and this is not anunreasonable assumption to make across many product markets for two playergames.
We consider two players, A and B. Assuming that Player A has the strategyset (S1,S2,S3) represented across the rows and that Player B can react withstrategies (S4,S5,S6,S7) represented in the columns, then what should PlayerA do if faced with the market share payoffs? If Player A could be sure thatPlayer B would respond with S4, S1 would be an optimal strategy for Player 1since it would get 95% of the market. Strategy S1, given Player B’s responseof S4, yields the largest payoff for Player A but the worst payoff for Player B,so Player A can be certain that Player B will not respond with S4.
Player A must assume that Player B will respond with S5 which will givePlayer B 95% leaving Player A with only 5%. By assuming the worst possibleresponse, Player A predicts the outcomes for his use of the strategy S1 will bethe minimum payoff, that is 5% of the market. We illustrate this in bold printin Table 9.5. It would appear reasonable for Player A to reject S1 as too risky.As viewed by Player A the strategy offers an almost all or nothing gamble. Itdepends on how Player B’s response. So Player A chooses another strategy. S2offers the possibility of 90% if Player B can be counted on to respond with S7.However there is also the possibility that Player B will respond with S6 allowingPlayer A 55% market share. This is the least market share for Player A if heuses S2, so again we print it in bold.
If Player A considers S3, the least market share is 10% obtained if PlayerB responds with S7. Player A notes the least attractive outcome for eachstrategy. Player A in a zero-sum games assumes that the rival Player B willdeploy a strategy that reduces Player A’s market share to a minimum. So PlayerA uses a maximim strategy, that is, the maximum of all the minima and that isS2. Conversely, Player B will select the highest possible outcomes in terms ofPlayer As’ payoffs providing column maxima of 95, 70, 55 and 90 as illustratedin italics. So in order to obtain the highest market share, Player B will choosea strategy that will hold Player A to the lowest of the greatest possible outcomes.
Accordingly, Player B will choose S6, which allows Player A 55% marketshare. Confining Player A to the least of the greatest shares, Player B is said tobe employing a minimax strategy, that is, choosing the minima of the columnmaxima. We conclude that the game does have a unique equilibrium The marketshare 55% is both the maximum of the row minima and the minimum of thecolumn maxima. If Player A chooses S3, Player B will respond with S6; and ifPlayer B decides on S6, Player A will reply with S2. The market share 55% isreferred to as the saddle point of the game.
Signalling, Strategy & Management Type92

Table 9.5 Saddle Point Matrix
Games in strategic or extensive form are obvious candidates for managementgames where Player 2 is committed to not exciting a price war and Player 1either considers exciting a price war or not. Player 2 then faces the option of acounter-strike if a price war ensues. In this case, the non-cooperative solutionis the dominant solution used to analyse games in strategic or extensive form.The main property of the non-cooperative equilibrium is optimal response. IfA knows B’s action, then at the non-cooperative equilibrium, A will have nodesire to change his strategy as he cannot improve. The same holds for B. Thisgives rise to Nash equilibrium, the best outcome a player can obtain given themoves or actions of other players.
The Core of the Bertrand Dilemma: Trust
Do you trust your partner? Should you trust your competitor? Trust ultimatelydepends on one’s belief structure about other people, whether they becompetitors or not in a business world. If Mr A trusts in Mr B to do x, then MrB, knowing that Mr A trusts him to do x, has a choice to make: does he do x ornot. What is of interest in the business world is the consequences of x. Onescenario, referred to as the moonshot is the belief without providence that xwill be done. Neither Mr A nor Mr B issued the moonshot, neither know thatabout each other, and so they behave as if the moonshot has happened. Anotherscenario is the extent to which trust is credible in terms of doing x, where x hassignificant negative consequences for both A and B. In this cartel scenario, bothplayers must trust each other absolutely
Combat competition is about entry at the margin and manifests itself whenan increasing number of firms is not an advantage to the market system. Contestcompetition differs in that the market is unequally partitioned in that some firmsare content with their market shares while other firms are targets of merger ortakeover. Contest would occur, for example, where individual firms compete
Signalling, Strategy & Management Type 93
S1S2S3
Columnmaximum
S4
95603095
S5
5703570
S6
50553055
S7
40901090
RowMinimum
55510

either for a given market share or for market position. Contest competition canbe seen as a mechanism, which will tend to maintain the market level ofconcentration as long as the number of firms does not change. One essentialcharacteristic of contest and scramble is that in both cases there is no exit offirms below a threshold level of concentration when there is ample market sharefor all competing firms.
Above a critical threshold level of concentration exit increases abruptly inthe case of perfect scramble but gradually in the case of perfect contest. Thisfollows necessarily from the requirement that contest leaves a constant numberof firms in the market system. We contend that almost all competition undernormal market conditions falls between these idealised extremes of contest andscramble14. Pure contest is rare; as individual firms compete for market sharethere will often be a compromise as combat competition becomes more intenseand average market share may be reduced.
Stigler’s Dilemma
Players avoid price wars. They are expensive. One option is to form a cartel..Stigler had argued that firms seek cartelisation - the gains from cartelisationinclude a less elastic demand curve and a slower rate of entry. It is rational andmay be commercially sound for modern firms to collude and therefore noamount of legislation15 will stifle that desire. The argument can be traced backto Sraffa who had argued that firms would avoid competition if the expectedrents from cartelisation exceeded the gains from long run competition. Thisrequires us to focus on the type of competition in a market and not on marketstructure per se, on scramble, combat and contest competition. Or alternatively,if management enter a signalling game, the risk of competition could beavoided.
Signalling, Strategy & Management Type94
15In US antitrust, parallel pricing arises under s1 of the Sherman Act where the courts focus attentionon the type of evidence ‘from which a conspiracy can be inferred’. In this instance the type ofbehaviour refers to conscious parallel behaviour. However as we know the difficulty in antitrust isin deciding whether or not parallel behaviour is sufficient15 to establish an agreement. A notdissimilar debate took place in EU competition circles arising from the Courts interpretation ofcollective or joint collusion in the Gencor/Lonhro case.
14This may be a key contributor to undermining an understanding in antitrust analysis thatcompetition and concentration are antithetical. Within antitrust folklore concentration leads tocollusion; if we accept that competition and concentration are not antithetical, the debate in antitrustcircles on concentration and collective dominance would become uncomfortably and possiblyuntenable, if it leads to the conclusion that competition contributes to collusion in a market system.However, it may be possible, theoretically at least, to enunciate the possibility of competition withmonopoly outcomes.

Across the literature it is clear there is a need to return to an understanding ofthe type of competition that prevails in a market under scrutiny with a focus onfirms interacting in an evolving Boolean network of inter-related firm behaviour.As the atomistic behaviour of a perfectly competitive market structure leads toa long-run equilibrium, likewise the Boolean behaviour of the market systemsevolves into an ordered arrangement that manifests itself as market sharingstrategies and inevitably implicit or parallel collusion on price. In types ofmarket systems, the firm is an integrated network of market systems. As arguedelsewhere, greater emphasis should be placed on the relevant firm than on therelevant market for antitrust analysis.
With different elasticities, for example, a 2 firm and a 10 firm marketstructure challenge the traditional economic theory underpinning antitrustpolicy. A 10 firm structure with an industry elasticity of 0.5 could be moremonopolisitic as measured by the Lerner Index than a 2 firm structure with anindustry elasticity greater than 1.5. In the Chamberlain model, the degree ofindustry elasticity determines the level of profit. Could we imagine an industrystructure that exhibits an oligopoly structure with zero long run profit? Theproblem is that the industry structure is defined within the traditional structure-conduct-performance model with reference to H and η and deriving theequation
L = H/η
But this equation does not depend on any form of explicit collusive behaviour.Rather the monopoly power arises from the exogenous assumption of Cournot-Nash play and the restriction on entry – these conditions assure an outcome,which according to Cubbin could be interpreted as an ‘apparently collusivearrangement’. Ironically, the monopoly equilibrium arises from the best-replyresponses in what is essentially a non co-operative Cournot-Nash competition.
Trigger Price
An equally important determinant is the DQ’s knowledge about elasticity forits suite of products. At its simplest, elasticity16 measures the responsiveness ofany quantity variable Dq to changes in price, Dp. This has been referred to earlierin the E-book as price elasticity (of demand). For a given linear demand, anelastic region lies above the mid-point and an inelastic region below the mid-
Signalling, Strategy & Management Type 95
16The concept can be expanded to include supply-side responses and indeed to consider otherquantity type variables on the demand side. The most interesting is the advertising elasticity ofdemand, which would measure, for example, how a percentage change in advertising expenditurewould contribute to changes in sales.

point. The actual real market price will be in one or the other of the two regions.Therefore, strategically, DQ should now interpret a price fall as movementtowards the mid-point and a price increase as a movement upwards toward themid-point. How do we distinguish between both? We can do so by computingthat midpoint, the trigger price, and identifying the likely responsiveness in thedirection of the price signal.
In the elastic region, as price falls sales increase by more so revenue goesup; conversely, revenue falls, if price rises. Therefore in the elastic region, priceand revenue are inversely related. Contrast in the inelastic region, price andrevenue are positively related. Now a management decision to change price,must have knowledge of such price, the trigger price. Because if price is to drop,it can only do so from the elastic range towards the mid-point, otherwisemanagement fail the total revenue test. And such failure is a strategic mistakeif the price change excites a price war by sending the wrong signal to rivalplayers. If anything, the need to compute the trigger price is to act as a guide.It is not a real price that can be charged to consumers rather it is a measure ofby how much a price ought to change in any price sequencing.
What Market to Enter?
Chandler’s thesis is that structure follows strategy. In other words, it is thebehaviour of management, observed as strategy by competitors, that determinesthe market structure. If a firm’s strategy is to be carried out, or implemented,individuals working within the firm must know about the strategy and itsoperational requirement for tasks and actions, and their coordination .How thefirm responds to problems of information, innovation, coordination andcommitment in a game will determine its long term position in an industry.
Within Framework T3 there is a game embedded strategy (GEMS) whichhas the following important characteristics. In particular, determining thepreferred market will depend on a host of factors discussed throughout thetextbook from sustaining competitive advantage, strategic positioning in themarket to playing the non cooperative game of competition. Management’s bestresponse will ultimately depend on the unique set of circumstances it faces,although management may differ by type and may differ on the threats facingthe firm or how the firm should respond.
Dell Inc represents an interesting case. Competing on non-price attributesis a new approach for Dell and takes them into new strategic territories.
Signalling, Strategy & Management Type96

All players would like to significantly differentiate themselves to remove theirnearest rival from the horizon. In Dell’s current strategic position, this couldmean moving to the non-price competitive Cournot box with CV = 0. However,Dell Inc has a type historically - a Baumol type - of using price to driveearnings, revenues and value and whether or not they keep to type can begleaned from signals in CEO statements and through their fiscal yearperformance.
Drawing on Framework T3, game theory can be used to directly play-outscenarios to determine which strategic options are optimal. This is importantfor making the step from strategic option to strategic decision. The tool-boxpresented in this monograph can apply to business strategy at different levels;corporate, divisional or regional - all of which have one starting point – thegoals of the organization. Once known and understood, management seeks toimplement strategies that will achieve those goals. Tactics determine how eachof the strategies is played out on a day-to-day basis. The tool-box incorporatesgame theory. There are many industry analysis tools and many models forderiving business strategies including Porter’s 5 Forces model and the ValueNet. They can be deployed to support a view of the organization withmanagement as players in a dynamic non cooperative evolutionary game.
The tool-box is a process that starts with requiring DQs to understandorganizational goals. It then moves to requiring an understanding of theindustry in which the company operates and the factors effecting the industryand its future. Through this analysis opportunities and challenges shouldpresent themselves. These in turn present strategic options, which may benefitfrom being played out as a game – the next stage in the process. Gamescenarios, will help determine which of the strategic options is optimal.Furthermore, game theory can help add insight into what factors are importantin undertaking the chosen strategy such as; where to compete, what is the pricesensitivity of the market, how does the firm structure itself to compete
Signalling, Strategy & Management Type 97

effectively. The process ends with a strategic decision being made, given theoutcome of strategic game-playing.
A Game Embedded Strategy (GEMS)
Strategy Question: What Market Should We Be In?
A company should NOT be in a market where the identity of the nearestcompetitor is not known OR if the identify is known but not the likely
reactions.
Dimensions of GEMS
Profits are captured by management as players. Porter’s 5 Forces strategyfocuses on the threat to industry profits, Framework T3 identifies newopportunities for growth, a game embedded strategy enables management toact to capture and retain profits in t+1.
A game embedded strategy is more likely to be ahead of the game in terms ofthe next strategy adopted in oligopoly markets. It facilitates a second moveradvantage and with no surprises a first mover advantage is obtained.
Participation in a game requires management to pay attention to signals, tocamouflage their type and to be both consistent and coherent over the life cycleof the game.
Business strategy can be interpreted as games of complete information whereinmanagement not only knows their own type but also the type of the othercompetitors. Incomplete information as introduced by the concept of verticalblending whereby the type of management blends with the type of player, andthus the preferences of management are clouded. In this context, by adaptingthe arguments of Harsanyi (1967,1968), we are able to assume that each playerhas a particular characteristic, which determines its preferences over actions(social states) and its beliefs about the Z-preferences of the other players, thecompetitors
In other words, with vertical blending the type of player is no longercommon knowledge in the game. To have assumed that the beliefs of playersare common knowledge in the real world of business strategy appears
Signalling, Strategy & Management Type98

unreasonable. In reality, we have little idea how individual management actuallyacquires beliefs. However, vertical blending allows us to define the players ina game by their strategies. In other words, we do not ask: how does managementbehave? Rather we ask: given their strategy, how should they behave? The focusis on answering: what market should they be in? Less focus on answering: howcan they optimize in the present market? Management make a decision knowingthat something has to be done in terms of improving financial performance andthen management take an action knowing how and when to improve thatperformance. The action depends on their understanding of type and realizationthat their company is a player in a market-as-a-game.
GEMS Strategy Tool-Box
In all the payoff matrices self interest (maximizing the size of the payoff)governs the likely response of a player and that the probability of the outcomeis not relevant, can be diluted through the introduction of behaviouralcharacteristics of players. In assessing the game dimension, management shouldpay particular attention to understanding the behavioural characteristics of
Signalling, Strategy & Management Type 99

players in the game, the their type and assessing the likely responses of playersbased on a set of assumptions, beliefs and prior knowledge. The key point tonote is that game payoffs can be adjusted to reflect the nature of the responseby players, given assumptions made about their behaviour. Management shouldderive a set of behavioural aspects about the other players in a strategic gamein order to factor-in the likelihood that the behaviour will affect the gamepayoffs.
Table 9.4 Easterbrook McNutt Strategic Tool-Box GEMS
Signalling, Strategy & Management Type100

The majority of payoffs in the game analogies referred to in this E-book canapply and be extended to include conditional probability. Through the reviewof the concepts of game theory, it is clear that the discipline can add a differentperspective and complementary approach to examining strategic businessdecisions. Many of the key elements of game theory provide insights into areassuch as competitor reactions, pricing, cooperation and coopetition theimportance of scale, the value of information, signalling and the importance ofcommunication. The concepts of adverse selection and signalling providevaluable direction and insight on how to compete. Game theory broadens thescope of economic analysis.
In Table 9.4 Easterbrook and McNutt have constructed a strategic tool-boxto incorporate game theory. Game theory can be used to directly play-outscenarios to determine which strategic options are optimal. This is importantfor making the step from strategic option to strategic decision. The tool-boxpresented in Table 9.4 can apply to business strategy at different levels;corporate, divisional or regional, all of which have one starting point – the goalsof the organization. Once known and understood, management seeks toimplement strategies that will achieve those goals. Tactics determine how eachof the strategies is played out on a day-to-day basis. Determining the preferredmarket to enter will depend on a host of factors discussed throughout the E-book from sustaining competitive advantage as CL type, strategic positioningin the market to playing the non cooperative evolutionary game of competition.Management’s best response will ultimately depend on the unique set ofcircumstances it faces, although management may differ by type and may differon the threats facing the firm or how the firm should respond.
The tool-box is a process that starts with requiring decision makers tounderstand management type and then organizational goals. It then moves torequiring an understanding of the industry as a market-as-a-game in which thecompany operates as a player. Game scenarios, will help determine which ofthe strategic options is optimal. Furthermore, Framework T3 can help addinsight into what factors are important in undertaking the chosen strategy suchas identifying management type, where to compete, what is the price sensitivityof the market and how does the firm signal itself as a player to competeeffectively. The process ends with a strategy set that contains strategic decisionsthat have to taken, given the outcome of strategic game-playing. It is critical tounderstand the future implications of your action at time period t. One isreminded of Goethe who tells us that Faust lost the liberty of his soul when hesaid to the passing moment ‘stay thou art so fair’.
Signalling, Strategy & Management Type 101

Conclusion
The E-book is not a textbook on game theory per se. The reader is directed toany of the authors identified in the E-book and to the published works of BarryNalebuff, Ben Friedman, Larry Samuelson or Drew Fudenberg. Nonethelessthe E-book does begin to address how management choose their strategies in amarket wherein interactions between companies can be analysed as a noncooperative game. Therefore, Framework T3 conceptually straddles elementsof non cooperative game theory with an emphasis on common knowledge andelements of evolutionary game theory that assumes a trial-and-error learningprocess. The DQ and the market systems are presented as unique elements ofFramework T3. Management have to ask: is it better to signal your type (SA) inthe market-as-a-game where rivals believe your type or knowing that rivalsbelieve your type, to act differently, (SB) creating a mismatch, and thus incitinga signalling game. The latter is the classic Prisoner’s dilemma wherein eachplayer has a dominant strategy SB.
Table 9.6 Prisoners’ Dilemma
Samuelson (2005) had reported that in laboratory experiments on PD gamessome players have preferred the more superior outcome (2,2). In a businesscontext, where the market is a game, and where type is either signalled by allplayers or analysed by third parties, the DQ player may prefer the more equal,although firm-specific less profitable, outcome of SA to the more asymmetricpayoffs obtained under SB. If both players adopt SA we observe a penguinstrategy - a credible collective response by competitors to a market event suchthat no one competitor acts unilaterally and all competitors are observed tobehave together2. This would be a defining characterisitc of a game embeddedstrategy.
2It can give rise to an accidental sameness in price (ASP) observation absent tacit collusion asargued in McNutt's (2005) Law, Economics and Antitrust.
SA SB
SA : (Signal your type) 2,2 -1,3SB : (Act differently) 3, -1 0,0
Signalling, Strategy & Management Type102

In concentrated markets, where 5 or less players share 100% market share, thezero-sum constraint allows each player to infer what the other player is preparedto sacrifice, and thus what they stand to gain by an action. Without knowinghow much market share a player has, for example, a rival could not really knowwhether an action on price was meaningful or not. If the action on price can bedescribed3 as a price dwarf, and if a rival is to react at time period t, then theknowledge on market share is invaluable, because in its absence, a reaction tosuch a price action could trigger a price war. Heraclitus, a Greek philosopherof 6th century BC wrote ‘that character is destiny’; Framework T3 recognisedthat management type is destiny, and that understanding type, coupled withunderstanding technology and time, is intricately linked to sustaining acompetitive advantage in the market-as-a-game.
Signalling, Strategy & Management Type 103