ratio intr
TRANSCRIPT

CHAPTER-I
FINANCIAL STATEMENTS
LEARNING OBJECTIVES
After studying this chapter, you will be able to:
• Explain the meaning of financial statements of a company;
• Describe the form and content of balance sheet of a company;
• Prepare the Balance Sheet of a company as per Schedule VI Part I of the Companies Act 1956.
• Know the major headings under which the various assets and liabilities can be shown.
• Explain the meaning, objectives and limitations of analysis using accounting ratios
• Calculate various ratios to assess the solvency, liquidity, efficiency and profitability of the firm.
• Interpret the various ratios for inter and intra-firm comparison.
define Cash Flow Statement
• know its objectives
• understand its uses [Uses of Cash Flow Statement]
• explain the Limitations of Cash Flow Statements
• classify the Cash Flows as
•. cash flow from Operating Activities
•. cash flow from Operating
•. cash Flow from Financing Activities
• make a format of Cash Flow Statement as per Revised AS-3.
• prepare Cash Flow Statement in a Prescribed Format.
1.0 The financial statements are the end products of the accounting process which summaries the financial position and performance of a business concern in an organized manner. Financial Statements provide a summarized view of the operations of the business. They serve as an important medium in communicating accounting information to various users of accounts.
If you can read a cricket scoreboard, you can learn to read basic financial statements. Let’s begin by looking at what financial statements do.
1.1 Financial Statements of a company
Financial Statements show you where a company’s money came from, where it went, and where it is now.Financial statements are the basic and formal annual reports through which the corporate management communicates financial information to its owners and various other external parties which include-investors, tax authorities, government, employees, etc.
There are two main financial statements. They are: (1) balance sheets; (2) income statements.
Balance sheets show what a company owns and what it owes at a fixed point in time.
Income statements show how much money a company made and spent over a period of time.
Let’s look at the Balance Sheet in more detail.
1
USERS OF FINANCIAL STATEMENTS
1.2 Investors and potential investors
The present investors want to decide whether they should hold the securities of the company or sell them.
Potential investors, on the other hand, want to know whether they should invest in the shares of the company or not.
Investors (Shareholders or owners) and potential investors, thus, make use of the financial statements to judge the present and future earning capacity of the business, to judge the operational efficiency of the business and to know the safety of investment and growth prospects.
Lenders/long term creditors
Financial statement helps lenders such as debenture holders, suppliers of loans and leases in ascertaining the long term and short term solvency of the business. They like to know the financial soundness of the business i.e. the ability of the business to repay debt on maturity and whether the enterprise earns sufficient profits so as to pay interest regularly.
Management
Analysis of financial statements enable the management to evaluate the overall efficieny of the firm. It helps to ascertain the solvency of the enterprise; to know about its viability as a going concern and to provide adequate information for planning and controlling the affairs of the business. Future forecasts can easily be made by analyzing the past date.
Suppliers/short term creditors
Creditors/suppliers supplying goods to a business are interested to know as to whether the business would be in a position to pay the amounts on time. They are interested in short-term solvency i.e. the liquidity of the business.
They are more interested in current assets and current liabilities of the business. If current assets are sufficient, say, twice the current liabilities, they are satisfied that the business would be able to discharge the short-term debts on time.
Employees and Trade Unions
Employees are interested in better emoluments, bonus and continuance of business and whether the dues like provident fund, ESI et., have been deposited with the authorities.
They would therefore, like to know its financial performance and profitability and operating sustainability.
Government and its agencies
Financial statements are used by government and its agencies to formulate policies to regulate the activities of business, to formulate taxation policies, to compile national income accounts.
2

Taxation authorities such as income tax department use the financial statements for determination of income tax; sales tax department is interested in sales while the excise department is interested in production.
Stock exchange
Stock exchange uses the financial statements to analyze and thereafter, inform its members about the performance, financial health, etc. of the company, to see whether financial statements prepared are in conformity with the specified laws and rules and to see whether they safeguard the interest of various concerned agencies.
Other Regulatory authorities (such as, Company Law Board, SEBI, Stock Exchanges, Tax Authorities etc.) would like that the financial statements prepared are in conformity with the specified laws and rules, and are to safeguard the interest of various concerned agencies. For example, taxation authorities would be interested in ensuring proper assessment of tax liability of the enterprise as per the laws in force from time to time.
CustomersCustomers are interested to ascertain continuance of an enterprise.
For example, an enterprise may be supplier of a particular type of consumer goods and in case it appears that the enterprise may not continue for a long time, the customer has to find an alternate source.
BALANCE SHEET- MEANING AND PURPOSE
Balance Sheet is a financial statement that summarizes a company’s assets, liabilities and shareholders’ equity at a specific point in time. These three balance sheet segments give investors an idea as to what the company owns and owes, as well as the amount invested by the shareholders.
The balance sheet show: Assets = Liabilities + Shareholders’ Equity
A balance sheet thus, provides detailed information about a company’s assets, liabilities and shareholders’ equity.
Assets are things that a company owns that have value. This typically means they can either be sold or used by the company to make products or provide services that can be sold. Assets include physical property, such as plants, trucks, equipment and inventory. It also includes things that can’t be touched but nevertheless exist and have value, such as trademarks and patents. And cash itself is an asset. So are investments a company makes.
Liabilities are amounts of money that a company owes to others. This can include all kinds of obligations, like money borrowed from a bank to launch a new product, money owed to suppliers for materials, payroll a company owes to its employees, taxes owed to the government. Liabilities also include obligations to provide goods or services to customers in the future.
Shareholders’ equity is sometimes called capital or net worth. It’s the money that would be left if a company sold all of its assets and paid off all of its liabilities. This leftover money belongs to the shareholders, or the owners, of the company.
3

A company has to pay for all the things it has (assets) by either borrowing money (liabilities) or getting it from shareholders (shareholders’ equity).
The purpose of a Balance Sheet is to report the financial position of a company at a certain point in time. It is divided into two columns. The first column shows what the company owes (liabilities and net worth). The second shows what the company owns (assets) on the right. At the bottom of each list is the total of that column. As the name implies, the bottom line of the balance sheet must always “balance.” In other words, the total assets are equal to the total liabilities plus the net worth.
The balance sheet is one of the most important pieces of financial information issued by a company. It is a snapshot of what a company owns and owes at the point in time. The income statement, on the other hand, shows how much revenue and profit a company has generated over a certain period.
Neither statement is better than the other-rather, the financial statements are built to be used together to present a complete picture of a company’s finances.
CONTENTS OF BALANCE SHEET
The prescribed form of the Balance Sheet is given in Part I of Schedule VI of the Companies Act, 1956.
The Companies Act has laid down two forms of the Balance Sheet known as :
(i) Horizontal form
(ii) Vetical form
FORMAT OF SUMMARISED BALANCE SHEET(HORIZONTAL FORM)
SCHEDULE VI PART I
Balance Sheet of …. CO.LTD.
As at …
Figures for the previous year
Rs.
Liabilities Figures for the current year
Rs.
Figures for the previous year
Rs.
Assets Figures for the current year
Rs.
1. Share Capital
2. Reserves and surplus
3. Secured Loans
4. Unsecured Loans
5. Current Liabilities and
Provisions
(a) Current Liabilities
(b) Provisions
1. Fixed Assets
2. Investments
3. Current Assets, Loans and
Advances
(a) Current Assets
(b) Loans and Advances
4. Miscellaneous Expenditure
5. Profit and Loss A/c
Note: A footnote to the Balance Sheet may be added to show the contingent liabilities.
4

The format of the detailed Balance Sheet of a company in a horizontal form is given below:
FORMAT OF THE DETAILED BLANCE SHEET IN A HORIZONTAL FORM
Horizontal Form of Balance Sheet
Balance Sheet of ….(Name of the Company) as on …..Figures for the previous year
Rs.
Liabilities Figures for the current year
Rs.
Figures for the previous year
Rs.
Assets Figures for the current year
Rs.
Share Capital
Authorised
…shares of Rs…. Each
Preference
Equity
Issued:
Preference
Equity
Less: Calls Unpaid:
Add: Forfeited
Shares
Reserves and
Surplus:
Capital Reserve
Capital Redemption Reserve
Securities Premium
Other Reserves
Profit and Loss Account
Secured Loans:
Debentures
Loans and Advance from
Banks
Loans and Advance from
Subsidiary Companies
Other Loans and Advances
Unsecured Loans:
Fixed Deposits
Loans and Advances from
Subsidiaries
Companies
Short Term Loans and
Advances
Other Loans and Advances
Current Liabilities and
Provisions:
A. Current Liabilities
Acceptances
Debentures
Sundry Creditors
Outstanding Expenses
B. Provisions:
For Taxation
For Dividends
Fixed Assets:
Goodwill
Land
Building
Leasehold Premises
Railway Sidings
Plant and Machinery
Furniture
Patents and Trademarks
Live Stock
Vehicles
Investments:
Government or Trust Securities, Shares, Debentures, Bonds
Current Assets, Loans and Advances:
(A) Current Assets:
Interest Accrued
Stores and Spare parts
Loose Tools
Stock in Trade
Work in Progress
Sundry Debtors
Cash and Bank balances
(B) Loans and Advances:
Advances and Loans to Subsidiary
Bills Receivable
Advance Payments
Miscellaneous-Expenditure:
Preliminary Expenses
Discount on Issue of Shares and other Deferred Expenses
Profit and Loss Account
(debit Balance: if any)
5

For Contingencies
For Provident Fund Schemes
For Insurance, Pension and
Other similar benefits
Format of the Balance Sheet in vertical form
Balance Sheet of …. As on ……
Particulars Schedule Number
Figures as at the end of current financial year
Figures as at the end of previous financial year
I. Source of Funds:
1. Shareholder’s Funds:
(a) Share Capital
(b) Reserves and Surplus
2. Loan Funds:
(a) Secured loans
(b) Unsecured loans
Total(Capital Employed)
II. Application of Funds
1. Fixed Assets:
(a) Gross block
(b) Less : depreciation
(c) Net block
(d) Capital work-in-progress
2. Investments:
3. Current Assets, Loans and Advances:
(a) Inventories
(b) Sundry Debtors
(c) Cash and Bank Balances
(d) Other Current Assets
(e) Loans and Advances
Less: Current Liabilities and Provisions:
(a) Current liabilities
(b) Provisions
Net Current Assets
4. (a) Miscellaneous expenditure to the extent not written-off or adjusted.
(b) Profit and Loss account
(debit balance, if any)
TOTAL
Note: A footnote to the Balance Sheet may be added to show the contingent liabilities.
6

HOW TO READ A COMPANY’S BALANCE SHEET
(i) LIABILITIES SIDE
1. Share Capital: Unlike the non corporate entities were the entire capital is brought in by the proprietors or the partners, in the case of a company, it is brought in by the promoters, their friends, relatives as well as the general public in case of listed companies. The capital is known share capital and shareholders get dividend out of the profits of the company as return on their investment.
Share Capital is broadly divided into: Authorised Capital, Issued Capital, Subscribed Capital, Called up and Paid up capital.
Authorised Capital is the maximum share capital that a company is allowed to issue during its lifetime. It is stated in the Memorandum of Association.
Issued Capital is that part of authorized capital, which is offered to the public for subscription, including shares offered to the vendors for subscription other than cash (i.e. issue of shares in consideration for some other asset purchased).
Called-up capital means that part of subscribed capital which is called-up by the company for payment by the subscribers to the shares.
Paid up capital The amount that the shareholders have actually paid to the company is called as paid up capital of the company.
Calls in arrears must be shown by the way of deduction from the called up capital and
Forfeited shares account by the way of addition to the paid up capital.
2. Reserves and Surplus: Reserves represent that portion of earnings and receipts of a company which are set apart by the management for a general or a specific purpose. This item includes accumulated profits, reserves and funds- such as capital reserves, capital redemption reserve, balance of securities premium account, general reserve, credit balance of profit and loss account, and other reserves specifying the nature of each reserve and the amount in respect thereof including the additions during the current year.
3. Secured Loans: Long-term loans, which are taken against security of one or more assets of the company, are included under this head. Debentures and secured loans and advances from banks, subsidiary companies, etc., fall under this category. Likewise interest accrued and due on secured loans is also recorded under the same head.
4. Unsecured Loans: Loans and advances which are not backed by any security in the form of assets of the company are shown under this heading. This item includes fixed deposits, unsecured loans and advances from subsidiary companies, short-term loans and advances from banks and other sources.
7

5.Current Liabilities and Provisions : Current liabilities refer to such liabilities, which mature within a period of one year. They include bills payable, sundry creditors, advance payments and unexpired discounts, unclaimed dividends, Interest accrued but not paid, and other liabilities. Provisions refer to the amounts set aside out of revenue profits for some specific liabilities payable within a period of one year. Those include provision for taxation, proposed dividends, provision for contingencies, provision for provident fund, provision for insurance; pension and similar staff benefit schemes, etc. Both the sub headings current liabilities as well as provisions must be shown separately under two sub-heads- (a) Current liabilities (b) Provisions.
Contingent liabilities
These are the liabilities which may arise in future on the happening of some event. Contingent liabilities are not included in the total of the liability side. These are shown as a footnote to the Balance Sheet.
Following are the usual types of contingent liabilities:
(i) Claims against the company not acknowledged as debt.
(ii) Uncalled liability on shares partly paid.
(iii) Arrears of fixed cumulative dividend.
(iv) Estimated amount of contracts remaining to be executed on capital account and not provided for.
(v) Bills discounted not yet matured.
ASSETS SIDE
1. Fixed Assets : These are assets which are meant for use in business and not for sale. These assets provide a long term economic benefit, usually for more than one year to the firm. These include goodwill, land, buildings, leaseholds, plant and machinery, railway sidings, furniture and fittings, patents, livestock, vehicles, etc. These assets are shown at cost less depreciation till the date.
2. Investments: Business is supposed to great profit. When generated, this profit in excess of what is required for the business can be invested into say, shares or debentures of various companies. Investments thus represent assets held by an enterprise for earning income. Under this head, various investments made such as investment in government securities or trust securities; investment in shares, debentures, and bonds of other companies, immovable properties, etc., are shown.
3. Current Assets, Loans and Advances : One the fixed assets are in a state of readiness to produce or provide goods and services, the company needs current assets to carry out business operations. These assets are held for consumption of for sale and are expected to be realized in cash during the normal operating cycle. Current assets include inventories, debtors, cash etc. Loans and advances refer to those assets which are held for a short term and are expected to be realized within one year. These include advance payments, loans to subsidiary companies etc. Both the sub headings- current assets as well as loans and advances must be shown separately under two sub-heads- (a) Current Assets (b) Loans and Advances. It includes interest accrued on investment, inventories, sundry debtors, bills receivable, cash and bank balances while loans and advances and other advances like prepaid expenses, etc.
8

4. Miscellaneous Expenditure: The expenditure which has not been fully written off shown under this heading. It includes preliminary expenses, advertisement expenditure, discount on issue of shares and debentures, share issue expenses, etc.
5. Profit and Loss Account: When the Profit and Loss account shows a debit balance, i.e., loss which could not be adjusted against general reserves, is shown on the asset side of the Balance Sheet.
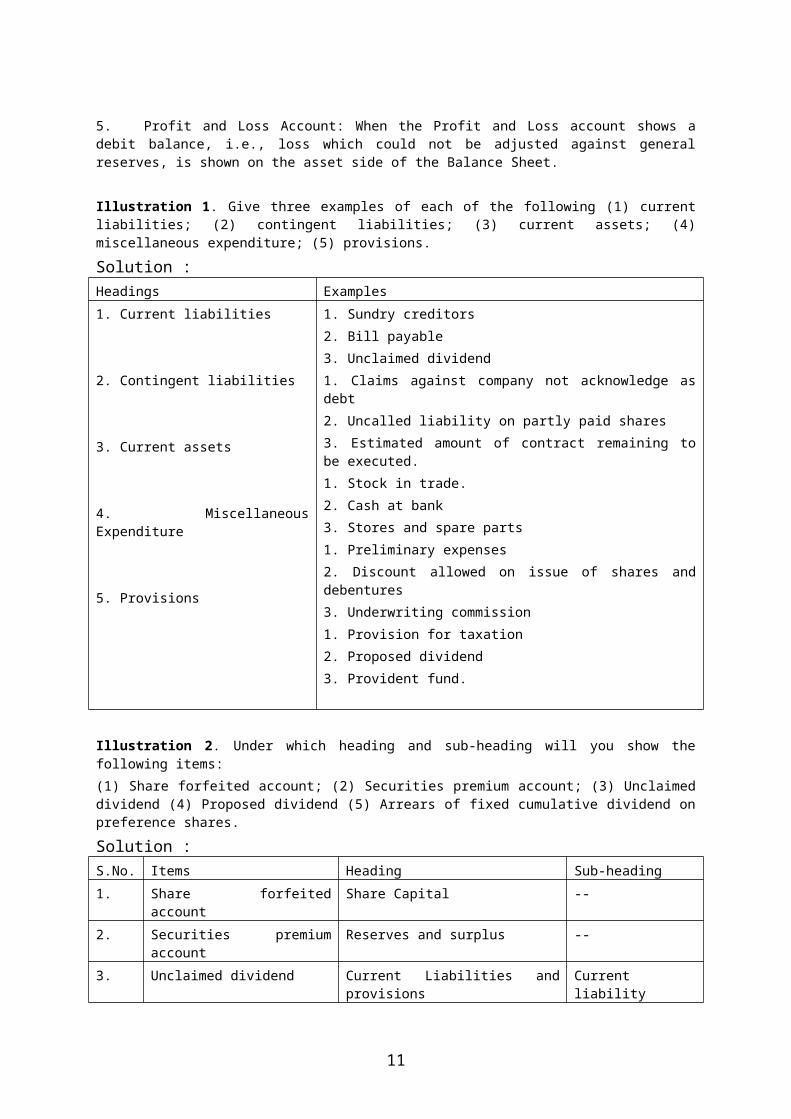
Illustration 1. Give three examples of each of the following (1) current liabilities; (2) contingent liabilities; (3) current assets; (4) miscellaneous expenditure; (5) provisions.
Solution :Headings Examples
1. Current liabilities
2. Contingent liabilities
3. Current assets
4. Miscellaneous Expenditure
5. Provisions
1. Sundry creditors
2. Bill payable
3. Unclaimed dividend
1. Claims against company not acknowledge as debt
2. Uncalled liability on partly paid shares
3. Estimated amount of contract remaining to be executed.
1. Stock in trade.
2. Cash at bank
3. Stores and spare parts
1. Preliminary expenses
2. Discount allowed on issue of shares and debentures
3. Underwriting commission
1. Provision for taxation
2. Proposed dividend
3. Provident fund.
Illustration 2. Under which heading and sub-heading will you show the following items:
(1) Share forfeited account; (2) Securities premium account; (3) Unclaimed dividend (4) Proposed dividend (5) Arrears of fixed cumulative dividend on preference shares.
Solution :S.No. Items Heading Sub-heading
1. Share forfeited account Share Capital --
2. Securities premium account
Reserves and surplus --
3. Unclaimed dividend Current Liabilities and provisions
Current liability
4. Proposed dividend Current Liabilities and Provisions
Provisions
5 Arrears of fixed cumulative
Dividend on preference shares
Contingent liability --
9

Illustration 3. Give the headings and sub-headings under which the following will be shown in a company’s balance sheet as per Schedule VI Part I of the Company’s Act 1956. (i) 10% debentures (ii) preliminary expenses (iii) Plant and Machinery (iv) Capital reserve (v) bills payable (vi) general reserve (vii) interest paid out of capital during construction (viii) railway sidings (ix) stores & spare part (x) fixed deposits.
Solution:S.No. Items Headings Sub-Headings
(i) 10 % Debentures Secured Loans --
(ii) Preliminary expenses Miscellaneous Expenditure --
(iii) Plant & Machinery Fixed assets --
(iv) Capital Reserve Reserves and Surplus --
(v) Bills Payable Current liabilities and provisions
Current liabilities
(vi) General reserve Reserves & surplus --
(vii) Interest paid out of capital during construction
Miscellaneous expenditure --
(viii) Railway sidings Fixed assets --
(ix) Store and spare parts Current assets, loans & advances
Current assets
(x) Fixed deposits Unsecured loans --
Illustration 4. The following figures were extracted from the trial balance of X Ltd. share capital 10,000 equity shares of Rs. 10 each fully paid :
Securities premium Rs. 10,000
12% Debentures Rs. 50,000
Fixed deposits Rs. 25,000
Creditors Rs. 5,000
You are required to draw up the liabilities side of the balance sheet, according to the requirements of the Companies Act.
Solution :
AN EXTRACT OF BALANCE SHEET OF X LTD. AS AT ……Liabilities Rs.SHARE CAPITAL:Authorized Capital……equity shares of Rs. 10 each
Issued and subscribed10,000 equity shares of Rs. 10 each
RESERVES AND SURPLUS:Securities premium
SECURED LOANS:12% DEBENTURES
1,00,000
10,000
50,000
10
UNSECURED LOANS:Fixed depositsCURRENT LIABILITIES AND PROVISIONS:(A) Current liabilitiesSundry creditors(B) Provisions
10,000
5,000---
Illustration 5. The following ledger balances were extracted from the books of Rushil Ltd.On 31st March, 2007.
Land and Building Rs. 2,00,000; 12% debentures Rs. 2,00,000; Share Capital 1,00,000 equity shares Rs. 10 each fully paid; Plant and Machinery Rs. 8,00,000; Goodwill Rs. 2,00,000;Investments in shares of Raja Ltd. Rs.2,00,000; Bills Receivable Rs 50,000; Debtors Rs. 1,50,000; Creditors Rs 1,00,000; Bank Loan (Unsecured) Rs 1,00,000; Provision for taxation Rs. 50,000; Discount on issue of 12% debentures Rs. 5000; Proposed dividend Rs. 55,000. Stock Rs. 1,00,000 General Reserve Rs 2,00,000.You are required to prepare the Balance Sheet of the company as per schedule VI Part I of the Companies act 1956.
Solution:RUSHIL LTD.
BALANCE SHEET AS AT 31ST MARCH,2007Liabilities Rs. Assets Rs.
SAHRE CAPITAL: Authorized CapitalIssued CapitalSubscribed Capital 1,00,000 Equity shares of Rs.10 each
RESERVES AND SURPLUS:General reserve
SECURED LOANS:12% Debentures
UNSECURED LOANS:Bank Loan
CURRENT LIABILITIES ANDPROVISIONS:(A) Current liabilitiesCreditors(B)ProvisionsProposed dividendProvision for taxation
______?___10,00,000
10,00,000
2,00,000
2,00,000
1,00,000
1,00,000
55,000
50,000
FIXED ASSETS:GoodwillLand and BuildingPlant and Machinery
INVESTMENTS:Shares of Raja Ltd.
CURRENT ASSETS, LOANS AND ADVANCES:(A) Current assets:Stock-in-TradeDebtors(B) Loans and AdvancesBill Receivables
MISCELLANEOUS EXPENDITURE:Discount on issue of 12%Debentures
2,00,0002,00,0008,00,000
2,00,000
1,00,0001,50,000
50,000
5,000
17,05,000 17,05,000
11

Illustration 6. X Ltd. has an authorized capital of Rs. 10,00,000 divided into Equity Shares of Rs. 10 each. The company invited applications for 50,000 shares. Applications for 45,000 shares were received. All calls were made and were duly received except the final call of Rs. 2 per share on 1,000 shares. 500 of the shares on which the final call was not received were forfeited. Show how share capital will appear in the Balance Sheet of the Company as per schedule VI part I of the Companies Act 1956?
Solution:X LTD.
BALANCE SHEET AS ON …………………Liabilities Amount
Rs.Assets Amount
Rs.SAHRE CAPITAL: Authorized Capital1,00,000 Equity Shares of Rs. 10 each
Issued Capital :50,000 Equity Shares of Rs. 10 each
Subscribed Capital:44,500 Equity Shares of Rs. 10 each 4,45,000Less: Calls in Arrears 1,000 4,44,000Add: Share Forfeited A/c 4,000
10,00,000
5,00,000
4,48,000
Illustration 7. From the following balances taken from the books of Gujarat Exports Ltd. prepare Company’s Balance Sheet in Horizontal Form:
Rs. Rs.
Land and Buildings 3,25,000 Patents 7,200
Plant and Machinery 2,90,000 Investments 20,000
Sundry Debtors 65,000 Preliminary Expenses 2,000
8,000 Equity Shares of Rs. 100 Securities premium 20,000
each Rs. 50 called up 4,00,000 Provision for Income tax 24,000
15% debentures 1,00,000 Closing Stock 1,28,000
Debenture Redemption Reserve 50,000 Cash 12,000
Prepaid Insurance 4,800 Advance Income Tax 4,000
Profit & Loss (Cr.) 1,13,000 Sundry Creditors 15,200
Bills Payable 15,000 Outstanding expenses 4,800
General Reserve 1,00,000 Proposed Dividend 16,000
Investments are in partly-paid shares on which calls of Rs. 10,000 have not been made.
12

Solution:BALANCE SHEET OF GUJARAT EXPORTS LTD.
As at ………………in horizontal form
Liabilities Rs. Assets Rs.SAHRE CAPITAL: Authorized CapitalIssued Capital8,000 Equity shares of Rs.100 eachSubscribed Capital8,000 Equity shares of Rs.100 each, Rs. 50 called up
RESERVES AND SURPLUS:Securities PremiumGeneral ReserveProfit & Loss A/cDebenture Redemption Reserve
SECURED LOANS:15% Debentures
UNSECURED LOANS:
CURRENT LIABILITIES ANDPROVISIONS:(A) Current liabilitiesBills payableSundry CreditorsOutstanding Expenses
(B)Provisions Provision for Income tax Proposed dividend
______?___
8,00,000
4,00,000
20,0001,00,0001,13,000
50,000
1,00,000
15,000--
15,00015,200
4,800
24,000
16,000
FIXED ASSETS:Land and BuildingPlant and MachineryPatents
INVESTMENTS:
CURRENT ASSETS, LOANS AND ADVANCES:(A) Current assets: Closing Stock Sundry Debtors Cash
(B) Loans and Advances Prepaid Insurance Advance Income Tax
MISCELLANEOUS EXPENDITURE:Preliminary Expenses
3,25,0002,90,000
7,200
20,000
1,28,00065,00012,000
4,8004,000
2,000
8,58,000 8,58,000
Note: Contingent Liabilities: For partly-paid shares Rs. 10,000
RATIO ANALYSIS
1.4 Ratio analysis is not just comparing different numbers from the balance sheet, income statement and cash flow statement. It is comparing the number against previous
13

years , other companies, the industry , or even the economy in general. Ratios look at the relationships between individual values and relate them to how a company has performed in the past and might perform in the future.
For example current assets alone don’t tell us a whole lot , but when we divide them by the current liabilities we are able to determine whether the company has enough money to cover short debts. Therefore we can say that when one figure is expressed in terms of another figure by dividing each other the relation which is established between them is called ration.
1.5 Meaning of Ratio Analysis
Ratio Analysis is the relationship between two terms of financial data expressed in the form of ratios and then interpreted with a view to evaluating the financial condition and performance of a firm.
Ratio Analysis can also help us to check whether a business is doing better this year than it was last year; and it can tell us if our business is doing better or worse than similar type of business.
Example : Firm A earns a profit of Rs. 50,000 while Firm B earns a profit of Rs. 1,00,000. Which of them is more efficient? We could tend to believe that firm B is more efficient than firm A. But in order to understand correctly , we need to find out their sales figure. Say firm A’s sales are Rs. 5,00,000 while firm B’s sale are Rs. 50,00,000. Now let’s compare the percentage of profit earned by them on sales.
For A: 50,000 X 100 = 10 % 5,00,000
For B: 1,00,000 X 100 = 2 % 50,00,000
This clearly shows that firm A is doing better than Firm B.This example shows that figure assumes significance only when expressed in relation to other related figures.
1.5.1 Objective of Ratio Analysis : The main objective of analyzing financial statement with the help of ratios are:
1. The analysis would enable the calculation of not only the present earning capacity of the business but would also help in the estimation of the future earning capacity.
2. The analysis would help the management to find out the overall as well as the department – wise efficiency of the firm on the basis of the available financial information.
3. The short term as well as the long tem solvency of the firm can be determined with the help of ration analysis.
4. Inter – firm comparison becomes easy with the help of ratios.
1.5.2 Advantages of Ration Analysis:
Financial statement prepared at the end of the year do not always convey to the reader the real profitability and financial health of the business. They contain various facts and figures and it is for the reader to conclude what these figures indicated. Ratio Analysis is an important tool for analyzing these financial statements .Some important advantage derived by the firm by the use of accounting ratios are:
1. Help in Financial statement analysis
14

It is east to understand the financial position of a business enterprise in respect of short term solvency, liquidity and profitability with the help of ratio. It tells us the changes taking place in the financial condition of the business.
2. Simplified accounting figuresAbsolute figures are not of mush use. They become important when relationships are established say between gross profit and sales.
3. Helps in calculating operation efficiency of the business enterpriseRatio enable the user of financial information to determine operating efficiency of a firm by relating the profit figure to the capital employed for a given period.
4. Facilities inter- firm comparisonRatio analysis provides data for inter- firm comparison. It revels strong and weak firms, overvalues and undervalues firms as well as successful and unsuccessful firms.
5. Makes inter- firms comparison possibleRatio Analysis helps the firm to compare its own performance over a period of time a swell as the performance of different divisions of the firm. It helps in deciding which division are more efficient than other.
6. Helps in forecasting Ratio Analysis helps in planning and forecasting . Ratios provides clues on trends and futures problems . e.g if the sales of a firm during the year are Rs. 10 lakhs and he average stock kept during the year Rs. 2 lakhs, it must be ready to keep a stock of Rs. 3 lakhs which is 20 % of the Rs. 15 lakhs.
1.5.3 Limitations of Ratio Analysis
Ratio Analysis is a useful technique to evaluate the performance and financial position of any business unit but it does suffer from a number of limitations. These must be kept in mind while analysing financial statements.
1. Historical AnalysisRatio Analysis is historical in nature a the finicial statement on the basis of which ratios are calculated are historical in nature.
2. Price Level ChangeChanges in price level often make comparison of figures of the previous years difficult. E.g ratio of sales to fixed assets in 2006 would be much higher than in 2000 due to rising prices, fixed assets being expressed on cost.
3. Not Free from biasIn many situations, the accountant has to make a choice out of the various alternatives available . e.g choice of the method depreciation, choice in the method of inventory valuation etc. Since there is a subjectivity inherent in the choice , ratio analysis cannot be said to be free from bias.
4. Window dressing
15

Window dressing is slowly the position better than what it is. Some companies , in order to cover up their bad finicial position resort to window dressing. By hiding important facts, they try to depict a better financial position.
5. Qualitative factors ignoredRatio Analysis is a quantitative analysis. It ignores qualitative factors like debtors character, honesty, past record etc.
6. Different accounting practices render ratios incomparableThe result of two firms are comparable with the help of accounting ratios only if they follow the same accounting methods . e.g. if one firm changes depreciation on straight line method while another is charging on diminishing balance method, accounting ratios will not be strictly comparable.
1.6 Classification of Ratios
Different types of ratios are computed depending on the purpose for which they are needed. Broadly speaking, they are grouped under four heads:
1. Liquidity ratios2. Solvency ratios3. Turnover or Activity ratios4. Profitability ratios
1.6.1 LIQUIDITY RATIOS
Liquidity is the short term solvency of the enterprise. I.e. the ability of the business enterprise to meet its short term obligation as and when they are due. The liquidity ratios, therefore , are also called the short- term solvency ratios.
The most common ratios which measures the extent of liquidity or the lack of it are:a) Current ratiob) Quick ratio/ Acid test ratio
Current RatioCurrent ratio establishes the relationship between current assets and Current liability. It measures the ability of the firm to meet its short term obligation as and when they become due. It is calculated as:
16
Classification of Ratio
Liquidity ratios Solvency ratios Activity Ratios Profitability Ratios
1. Current ratio;2. Quick Ratio.
1.Debt equality ratio;2.Total Assest to debt
ratio;3.Proprietary ratio;4.Interest Coverage
Ratio.
1. Stock Turnover;2. Debtors Turnover;3. Creditors Turnover;4. Fixed Assets
Turnover;5. Working Capital
Turnover.
1. Gross Profit Ratio
2. Net Profit Ratio
3. Operating Ratio
4. Return Profit Ratio

Current ratio= Current AssetsCurrent liabilities
Current assets include cash and those assets which can be converted into cash within a year. Current assets will therefore include cash , bank, stick(raw materials , work in progress and finished goods), debtors(less provision), bills receivable, marketable securities, prepaid expenses, short term loans and advances and accrued incomes.
Current liability include all those liabilities maturing with in one year.Current liabilities include creditors, bills payable, outstanding expenses, income received in advance , bank overdraft, short-term loans, provision for tax , proposed dividend and unclaimed dividend.
Generally , a current ratio of 2:1 is considered satisfactory.
Interpretation: It provides a measure of degree to which current assets cover current liabilities. The higher the ratio , the greater the margin of safety for the short term creditors. However, the ratio should neither be very high nor very low. A very highcurrent ratio indicates idle funds , piled up stocks, locked amount in debtors while a low ratio puts the business in a situation where it will not be able to pay its short- term debt on time.
Illustration 1
Calculate current ratio from the following information:
Stock Rs .60,000 ; Cash 40,000; Debtors 40,000; Creditors 50,000 Bills Receivable 20,000; Bills Payable 30,000; Advance Tax 4,000 Bank Overdraft 4,000; Debentures Rs. 2,00,000; Accrued interest Rs. 4,000.
Solution
Current Assets = Rs.60,000 + Rs.40,000 + Rs.40,000 + Rs.20,000 + Rs.4,000 + Rs.4,000 = Rs.1,68,000Current Liabilities = Rs.50,000 + Rs.30,000 + Rs.4,000 = Rs. 84,000Current Ratio = Rs.1,68,000 : Rs.84,000 = 2 : 1.
Illustration 2
Current Assets of a company are Rs. 10,00,000 and current liabilities are Rs. 6,00,000. The management is interested in making the ratio 2:1 by making payment of certain current liabilities. Advise the management as to how much of current liabilities should be paid to attain the desired ratio.Solution
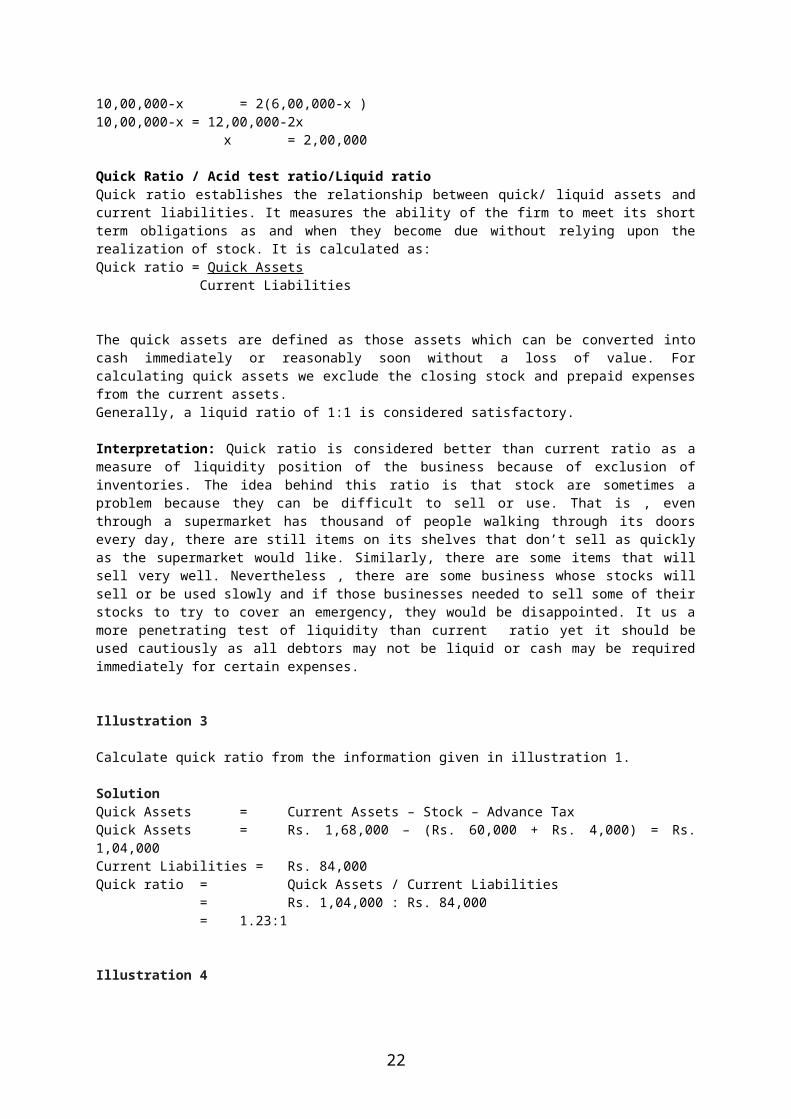
Let the current liabilities to be paid = x10,00,000-x = 2 6,00,000-x10,00,000-x = 2(6,00,000-x ) 10,00,000-x = 12,00,000-2x x = 2,00,000
Quick Ratio / Acid test ratio/Liquid ratioQuick ratio establishes the relationship between quick/ liquid assets and current liabilities. It measures the ability of the firm to meet its short term obligations as and when they become due without relying upon the realization of stock. It is calculated as:
17

Quick ratio = Quick Assets Current Liabilities
The quick assets are defined as those assets which can be converted into cash immediately or reasonably soon without a loss of value. For calculating quick assets we exclude the closing stock and prepaid expenses from the current assets. Generally, a liquid ratio of 1:1 is considered satisfactory.
Interpretation: Quick ratio is considered better than current ratio as a measure of liquidity position of the business because of exclusion of inventories. The idea behind this ratio is that stock are sometimes a problem because they can be difficult to sell or use. That is , even through a supermarket has thousand of people walking through its doors every day, there are still items on its shelves that don’t sell as quickly as the supermarket would like. Similarly, there are some items that will sell very well. Nevertheless , there are some business whose stocks will sell or be used slowly and if those businesses needed to sell some of their stocks to try to cover an emergency, they would be disappointed. It us a more penetrating test of liquidity than current ratio yet it should be used cautiously as all debtors may not be liquid or cash may be required immediately for certain expenses.
Illustration 3
Calculate quick ratio from the information given in illustration 1.
SolutionQuick Assets = Current Assets – Stock – Advance TaxQuick Assets = Rs. 1,68,000 – (Rs. 60,000 + Rs. 4,000) = Rs. 1,04,000Current Liabilities = Rs. 84,000Quick ratio = Quick Assets / Current Liabilities
= Rs. 1,04,000 : Rs. 84,000 = 1.23:1
Illustration 4
X Ltd. has a current ratio of 3.5:1 and quick ratio of 2:1. If excess of current assets over quick assets represented by stock is Rs. 1,50,000, calculate current assets and current liabilities.
SolutionLet Current Liabilities = xCurrent Assets = 3.5xAnd Quick Assets = 2xStock = Current Assets – Quick Assets1,50,000 = 3.5x – 2x1,50,000 = 1.5xx = Rs.1,00,000Current Assets = 3.5x = 3.5 × 1,00,000 = Rs. 3,50,000.
Illustration 5
Calculate the current ratio from the following information :Working capital Rs. 9,60,000; Total debts Rs.20,80,000; Long-term Liabilities Rs.16,00,000; Stock Rs. 4,00,000; prepaid expenses Rs. 80,000.
18

SolutionCurrent Liabilities = Total debt- Long term debt
= 20,80,000 – 16,00,000= 4,80,000
Working capital = Current Assets – Current liability9,60,000 = Current Assets – 4,80,000Current Assets = 14,40,000 Quick Assets = Current Assets – (stock + prepaid expenses)
= 14,40,000 – (4,00,000 + 80,000) = 9,60,000
Current ratio = Current Assets / Current liabilities = 14,40,000/4,80,000 = 3:1
Quick ratio = Quick Assets / Current liabilities = 9,60,000/4,80,000 = 2:1
1.6.2 Solvency Ratios
Solvency ratio are used to judge the long term financial soundness of any business. Long term Solvency means the ability of the Enterprise to meet its long term obligation on the due date. Long term lenders are basically interested in two things: payment of interest periodically and repayment of principal amount at the end of the loan period. Usually the following ratios are calculated to judge the long term financial solvency of the concern.
1. Debt equity ratio;2. Total Assets to Debt Ratio;3. Proprietary ratio;4. Interest Coverage Ratio.
Debt-Equity Ratio
Debt Equity Ratio measures the relationship between long-term debt and shareholders’ funds. It measures the relative proportion of debt and equality in financing the assets of a firm. It is computed as follows:
Debt-Equity ratio = Long-term Debt’s/ Share holder funds
Where –Long- term Debt = Debentures + Long – term loans
Shareholders Funds = Equity Share Capital + Preference Share Capital + Reserves and Surplus– Fictitious Assets
19

Interpretation: A low debt equity ratio reflects more security to long term creditors. From security point of view, capital structure with less debt and more equity is considered favourable as it reduces the chances of bankruptcy. A high ratio, on the other hand, is considered risky as it may put the firm into difficulty in meeting its obligations to outsiders. However, from the perspective of the owners, greater use of debt, firm can enjoy the benefits of trading on equity which help in ensuring higher returns for them if the rate of earning on capital employed is higher than the rate of interest payable. But it is considered risky and so , with the exception of a few business , the prescribed ratio is limited to 2:1.
Illustration 6Calculate Debt Equity , from the following information: 10,000 preference share of Rs. 10 each Rs. 1,00,0005,000 equity shares of Rs. 20 each Rs. 1,00,000Creditors Rs. 45,000Debentures Rs. 2,20,000Profit and Loss accounts(Cr.) Rs. 70,000
Solution
Debt = Debentures = Rs. 2,20,000Equity = Equity share capital + Preferences Share Capital + profit and Loss accounts
= Rs. 1,00,000 + Rs. 1,00,000 + Rs. 70,000 = Rs. 2,70,000
Debt Equity Ratio = Long term debt/ shareholders’ funds = Rs. 2,20,000 / Rs. 2,70,000 = 0.81:1
Illustration 7Calculate Debt Equity Ratio, from the following information :Total Debts Rs. 3,00,000 ; Total assets Rs. 5,40,000; Current liabilities Rs. 70,000.
SolutionLong-term Debt = Total Debt – Current Liabilities
= Rs. 3,00,000 – Rs. 70,000 = Rs. 2,30,000
Shareholders Funds = Total Assets – Total Debts = Rs. 5,40,000 – Rs. 3,00,000 = Rs. 2,40,000
Debt Equity Ratio = Long term debt/ Shareholders’ funds = Rs. 2,30,000/Rs. 2,40,000 = 0.96:
Total Assets to Debt Ratio
This Ratio established a relationship between total assets and long debts. It measures the extend to which debt is being covered by assets. It is calculated asTotal Assets to Debt Ratio = Total assets
Long-term Debt
20

Interpretation: This ratio primarily indicated the use of external funds in financing the assets and the margin of safety to long-term creditors. The higher ratio indicated that assets have been mainly financed by owners’ funds , and the long- tem debt is adequately covered by assets. A low ratio indicated a grater risk to creditors as it means insufficient assets for long term obligations.
Illustration 8
Shareholders’ funds Rs. 80,000; Total debts Rs. 1,60,000; Current liabilities Rs. 20,000. Calculate Total assets to debt ratio.
SolutionLong term debt = Total Debt - Current liabilities
= Rs. 1,60,000- Rs. 20,000= Rs. 1,40,000
Total Assets = Shareholders’ funds + Total debt = Rs. 80,000 + Rs. 1,60,000
= Rs. 2,40,000
Total Assets to debt ratio = Total Assets/ Debt= Rs. 2,40,000 / Rs. 1,40,000= 12:7= 1.7:1
Proprietary RatioProprietary ratio establishes a relationship between shareholders funds to total assets . It measures the proportion of assets financed by equity. It is calculated as follows :
Proprietary Ratio = Shareholders Funds/ Total assetsInterpretation: A higher proprietary ratio indicated a larger safety margin for creditors. It tests the ability of the shareholders’ funds to meet the outside liabilities. A low Proprietary Ratio , on the other hand , indicated a grater risk to the creditors. To judge whether a ratio is satisfactory or not, the firm should compare it with its own past ratios or with the ratio of similar enterprises or with the industry average.
Based on data of Illustration 8, it shall be worked out as follows:
Rs. 80,000 / Rs. 2,40,000 = 0.33: 1
Illustration 9
From the following balance sheet of a company, calculate debt equity ratio, total assets to debt ratio and proprietary ratio
Balance Sheet of X ltd as on 31.12.2007Preference Share Capital 7,00,000 Plant and
Machinery9,00,000
Equity Share Capital 8,00,000 Land and Building 4,20,000Reserves 1,50,000 Motor Car 4,00,000Debentures 3,50,000 Furniture 2,00,000Current Liability 2,00,000 Stock 90,000
Debtors 80,000Cash and Bank 1,00,000Discount on Issue of Shares
10,000
22,00,000 22,00,000
21
Solution
Debt equity Ratio = Long-term Debt/Equity
Total Assets Ratio= Total Assets / long term Debt
Proprietary Ratio = Shareholders Funds/Total assets
Debt equity ratio = Rs. 3,50,000/Rs. 16,40,000 = 0.213
Total Assets Ratio= Rs. 21,90,000/ Rs. 3,50,000 = 6.26
Proprietary Ratio = Rs. 16,40,000/Rs. 21,90,000 = 0.749
Illustration 10
From the following information, calculate Debt Equity Ratio, Debt Ratio,Proprietary Ratio and Ratio of Total Assets to Debt.
Balance Sheet as on December 31, 2006
Equity share Capital 3,00,000 Fixed Assets 4,50,000Preference Share Capital 1,00,000 Current Assets 3,50,000Reserves 50,000 Preliminary Expenses 15,000Profit & loss A/C 65,00011 % Mortgage Loan 1,80,000Current liabilities 1,20,000
8,15,000 8,15,000
Solution
Shareholders Funds = Equity Shares capital + Preference Shares capital + Reserves + profit % loss A/C - Preliminary Expenses
= Rs. 3,00,000 + Rs. 1,00,000 + Rs.50,000 + Rs. 65,000- Rs. 15,000 = Rs. 5,00,000
Debt Equity Ratio = Debt / Equity = Rs. 1,80,000/Rs. 5,00,000 = 0.36: 1
Proprietary Ratio = Proprietary funds / Total Assets = Rs. 5,00,000/Rs. 8,00,000 = 0.625:1
Total Assets to Debt Ratio = Total Assets / Debt = Rs. 8,00,000/Rs. 1,80,000 = 4.44:1
22

Illustration 11
The debt equity ratio of X Ltd. is 1:2. Which of the following would increase/decrease or not change the debt equity ratio?
(i) Issue of new equity shares(ii) Cash received from debtors(iii) Sale of fixed assets at a profit (iv) Redemption of debentures(v) Purchase of goods on credit.
Solution
a) The ratio will decrease. This is because the debt remains the same, equity increases.
b) The ratio will not change . This is because neither the debt nor equality is affected.
c) The ratio will decrease . This is because the debt remains unchanged while equity increases by the amount of profit.
d) The ratio will decrease . This is because debt decreases while equity remains same .
e) The ratio will not change . This is because neither the debt nor equity is affected.
Interest Coverage Ratio
Interest Coverage Ratio established a relationship between profit before interest on long-term debt and taxes and the interest on long term debts. It measures the debt servicing capacity of the business in respect of fixed interest on long term debts. It generally expressed as ‘ number of times’.It is calculated as follows:Interest Coverage Ratio = Net Profit before Interest and Tax / Interest on long term debt
Interpretation : It reveals the number of times interest on long-term debt is covered by the profits available for interest. It is a measure of protection available to the creditors for payment of interest on long term loans. A higher ratio ensures safety of interest payment debt and it also indicates availability of surplus for shareholders.
Illustration 12
Net Profit as per Profit & Loss A/C Rs. 5,40,000; Provision for tax Rs, 2,10,000;Interest on Debentures and other long terms loans Rs. 1,50,000Calculate interest coverage ratio.
Solution
Profit before interest and tax = Rs. 5,40,000 + Rs. 2,10,000 + Rs. 1,50,000 = Rs. 9,00,000 Interest coverage Ratio = Net Profit before Interest and Tax/ interest on long term debt
= Rs. 9,00,000 / Rs. 1,50,000 = 6 times.
Illustration 13Calculate interest coverage ratio from the following information:
23

Net Profit after tax Rs. 30,000; 15% Long-term Debt 10,00,000; and Tax Rate60%.
Solution
Net Profit after tax = Rs. 30,000Tax Rate = 60%.Net Profit before tax = Net Profit after tax X 100 / (100 – tax rate)
= Rs. 30,000 X 100 / ( 100- 60) = Rs. 75,000
Interest on Long Term Debt = 15% of Rs. 10,00,000 = Rs. 1,50,000Net profit before interest and tax = Net profit before tax + Interest
= Rs. 75,000 + Rs. 1,50,000 = Rs. 2,25,000
Interest Coverage Ratio = Net Profit before Interest and Tax/Interest on long term debt = Rs. 2,25,000/Rs. 1,50,000 = 1.5 times.
1.6.3 Activity (or Turnover) Ratios
The Activity (or Turnover) Ratios measures how well the facilities at the disposal of the concern are being utilized. They are known as turnover ratios as they indicates the speed with which the assets are being converted or turned over into sales. A proper balanced between sales and assets generally reflects tat assets are being managed well. They are expressed as ‘number of times’. Some of the important activity ratios are:
1. Stock Turn-over;2. Debtors (Receivable) Turnover;3. Creditors (Payable) Turnover;4. Fixed Assets Turnover;5. Working Capital Turnover.
Stock (or Inventory) Turnover Ratio
It establishes a relationship between cost of goods and average inventory. It determines the efficiency with which stock is converted into sales during the accounting period under consideration. It is calculated as: Stock Turnover Ratio = Cost of Goods Sold/ Average StockWhere - Average stock = (opening + closing stock) /2 and Cost of goods sold = Net Sales - gross profit orCost of goods sold = opening stock + net purchases + direct expenses
– closing stock
Interpretation : It indicates the speed with which inventory is converted into sales. A higher ratio indicated that stock is selling quickly. Low stock turnover ratio indicates that stock is not selling quickly and remaining idle resulting in increased storage cost and blocking of funds. High turnover is good but it must be carefully interpreted as it may be due to buying in small lots or selling quickly at low margin to realize cash. Thus , a firm should have neither a very high nor a vet low stock turnover ratio.
Illustration 14
From the following information, calculate stock turnover ratio :Opening Stock Rs.20,000;Closing Stock Rs.10,000;Purchases Rs. 50,000 Wages Rs. 13,000; sales Rs. 80,000 ; Carriage Inwards Rs. 2,000 ; Carriage outwards Rs. 6,000
24

Solution
Stock Turnover Ratio = Cost of Goods Sold/ Average StockCost of Goods Sold = Opening Stock + Purchases – Closing Stock + Direct Expenses
= Rs. 20,000+ Rs.50,000+ Rs.15,000–Rs.10,000 = Rs. 75,000
Average Stock = (Opening Stock + Closing Stock) /2 = (Rs. 20,000 + Rs. 10,000) /2 = Rs. 15,000
Stock Turnover Ratio = Rs. 75,000/Rs. 15,000 = 5 Times.
Illustration 15
From the following information, calculate stock turnover ratio. Opening stock Rs 58,000; Excess of Closing stock opening stock Rs. 4,000; sales Rs. 6,40,000; Gross Profit @ 25 5 on cost
Solution
Cost of goods Sold = Sales - Gross Loss = Rs. 6,40,000 – 25/125(6,40,000) = Rs. 5,12,000
Closing stock = Opening stock + Rs. 4000 = Rs. 58,000 + Rs 4,000 = Rs. 62,000
Average stock = (Opening stock + Closing Stock )/2= (58,000 +62,000)/2
= Rs. 60,000
Stock Turnover Ratio = Cost of Goods Sold/ Average Stock = Rs.5,12,000/Rs. 60,000 = 8.53 times.
Illustration 16
A trader carries an average stock of Rs. 80,000. His stock turnover is 8 times. If he sells goods at profit of 20% on sales. Find out the profit.
Solution
Stock Turnover Ratio = Cost of Goods Sold/ Average Stock = Cost of Goods Sold/Rs. 80,000
Cost of Goods Sold = Rs. 80,000 × 8 = Rs. 6,40,000
Sales = Cost of Goods Sold × 100/80 = Rs. 6,40,000 × 100/80 = Rs. 8,00,000
Gross Profit = Sales – Cost of Goods Sold= Rs. 8,00,000 – Rs. 6,40,000= Rs. 1,60,000.
25

Debtors Turnover Ratio or Receivables Turnover Ratio It establishes a relationship between net credit sales and average debtors or receivables. It determine the efficiency with which the debtors are converted into cash.It is calculated as follows :Debtors Turnover ratio = Net Credit sales/ Average Accounts Receivable
Where Average Account Receivable = (Opening Debtors and Bills Receivable + Closing Debtors and Bills Receivable)/2
Note: Debtors should be taken before making any provision for doubtful debts.Interpretation : The ratio indicated the number of times thereceivables are turned over and converted into cash in an accounting period. Higher turnover means that the amount from debtors is being collected more quickly. Quick collection from debtors increases the liquidity of the firm. This ratio also helps in working out the average collection period as follows:
Debt collection period This shows the average period for which the credit sales remain outstanding or the average credit period enjoyed by the debtors. It indicates how quickly cash is collected from the debtors.It is calculates as follows:
Debt collection period = 12 months/52 weeks/365 days Debtors’ turnover ratio
Illustration 17Calculate the Debtors Turnover Ratio and debt collection period (in months) from the following information:Total sales = Rs. 2,00,000Cash sales = Rs. 40,000Debtors at the beginning of the year = Rs. 20,000Debtors at the end of the year = Rs. 60,000
Solution
Average Debtors = (Rs. 20,000 + Rs. 60,000)/2 = Rs. 40,000
Net credit sales = Total sales - Cash sales = Rs.2,00,000 - Rs.40,000 = Rs. 1,60,000
Debtors Turnover Ratio = Net Credit sales/Average Debtors = Rs. 1,60,000/Rs. 40,000 = 4 Times.
Debt collection period = 12 months/52 weeks/365 days Debtors’ turnover= 12/4= 3 months
26

Creditors Turnover Ratio or Payable Turnover Ratio
This ratio establishes a relationship between net credit purchases and average creditors or payables. It determine the efficiency with which the Creditors are paid.
It is calculated as follows :
Creditors turnover ratio = Net credit purchase / Average accounts payable.
Where Average accounts payable = (Opening Creditors and Bills Payable + Closing Creditors and Bills Payable)/2
Interpretation: It indicated the speed with which the creditors are paid. A higher ratio indicates a shorter payment period. In this case, the enterprise needs to have sufficient funds as working capital to meet its creditors. Lower ratio means credit allowedby the supplier is for a long period or it may reflect delayed payment to suppliers which is not a very good policy as it may affect the reputation of the business. Thus , an enterprise should neither have a very high nor a very low ratio.
Debt payment period/Creditors collection period
This shows the average period for which the credit purchases remain outstanding or the average credit period availed of. It indicate how quickly cash is paid to the creditors.
It is calculated as follows:
Debt collection period = 12 months/52 weeks/365 days Debtors’ turnover
Illustration 18
Cash purchased ratio Rs. 1,00,000; cost of goods sold Rs. 3,00,000; opening stock Rs. 1,00,000 and closing stock Rs. 2,00,000. Creditors turnover ratio 3 times. Calculate the opening and closing creditors if the creditors at the end were 3 times more than the creditors at the beginning.
SolutionTotal Purchase = Cost of goods sold + closing stock - opening stock
= Rs. 3,00,000 + Rs. 2,00,000 – Rs. 1,00,000 = Rs. 4,00,000
Credit purchases = Total Purchase - cash purchase = Rs. 4,00,000- Rs. 1,00,000 = Rs. 3,00,000
Creditor Turnover Ratio = Net Credit Purchase / Average Creditor
Average Creditor = Rs. 3,00,000/ 3 = Rs. 1,00,000
(opening Creditor + Closing Creditor)/2 = Rs. 1,00,000opening Creditor + Closing Creditor = Rs. 2,00,000opening Creditor + (opening Creditor + 3opening Creditor) = Rs. 2,00,000 opening Creditor = Rs. 40,000Closing Creditor = Rs. 40,000 +(3 X Rs. 40,000)
= Rs. 1,60,000
27

Fixed Assets Turnover RatioThis ratio establishes a relationship between net sales and net fixed assets. It determined the efficiency with which the firm is utilizing its fixed assets. It is computed followsFixed Assets Turnover= Net sales/ Net Fixed Assets Where Net Fixed Assets =Fixed Assets- Depreciation
Interpretation: This ratio reveals how efficiently the fixed assets are being utilised.It indicates the firms’ ability to sales per rupee of investment in fixed assets. A high ratio indicates more efficient utilization of fixed assets.
Illustration 19
From the following information, calculate Fixed Assets Turnover Ratio:Gross fixed asset Rs. 4,00,000; Accumulated Depreciation Rs. 1,00,000; Marketable securities Rs. 20,000; Current Assets Rs. 1,30,000; Miscellaneous expenditure Rs, 20,000; Current Liabilities Rs. 50,000; Gross sales Rs. 18,30,000; sale return Rs. 30,000
Solution
Net fixed asset = Gross fixed asset- Depreciation= Rs. 4,00,000 - Rs. 1,00,000= Rs.3,00,000
Net Sale = Gross sale – Sale Returns= Rs. 18,30,000 - Rs. 30,000= Rs. 18,000
Fixed Asset Turnover Ratio= Net Sale/ net Fixed assets = Rs. 18,30,000/ Rs.3,00,000 = 6 times.
Working Capital Turn Over Ratio
This ratio establishes the relationship between net Sale and working capital. It determines the efficiency with which the working capital is being utilised.
It is calculated as followers:
working capital Turnover = Net Sale/ working Capital
Interpretation: This ratio indicates the firms’ ability to generate sales per rupee of working . A higher ratio would normally indicate more efficient utilized of working capital ; through neither a very high nor a very low ratio is desirable.
Illustration 20
28

From the following information, calculate (i) Fixed Assets Turnover and (ii) Working Capital Turnover Ratios :Preference Shares Capital 6,00,000 Plant and Machinery 6,00,000
Equity Share Capital 4,00,000 Land and Building 7,00,000
General Reserve 2,00,000 Motor Car 2,50,000
Profit and Loss Account 2,00,000 Furniture 50,000
15% Debentures 3,00,000 Stock 1,70,000
14% Loan 1,00,000 Debtors 1,20,000
Creditors 1,40,000 Bank 90,000
Bills Payable 30,000 Cash 20,000
Outstanding Expenses 30,000
20,00,000 20,00,000
Sales for the year were Rs. 60,00,000.
Solution
Sales = Rs 60,00,000Fixed Assets = Rs. 6,00,000 + Rs.7,00,000 + Rs. 2,50,000 + Rs. 50,000Working capital = Current Assets – Current LiabilitiesCurrent Assets = Stock + Debtors + bank + cash
Rs. 1.70,000 + Rs. 1.20,000 + Rs. 90,000 + Rs. 20,000Rs. 4,00,000
Current Liabilities = Creditors + BIP + OIS Exp = Rs. 1,40,000 + Rs. 30,000 + Rs. 30,000 = Rs. 2,00,000
Working capital = Rs. 4,00,000 + Rs. 2,00,000 = Rs. 2,00,000
Fixed Turn over Ratio = Net sale / Fixed assests = Rs. 60,00,000/ Rs. 16,00,000 = 3.75 times
Working capital Turnover = Net Sale / Working Capital = Rs. 60,00,000/ Rs. 2,00,000 = 30 times.
Profitability RatiosEvery business must earn sufficient profits to sustain the operations of the business and to fund expansion and growth. Profitability ratios are calculated to analysis the earning capacity of the business which is the outcome of utilisation of resources employed in the business. There is a close relationship between the profit and the efficiency with which the resources employed in the business are utilised. There are two major types of Profitability Ratios.
Profitability in relation to sales Profitability in relation to investment.
Following are the important Profitability ratio
29

1. Gross Profit Ratio2. Net profit Ratio 3. Operating Ratio4. Operating Profit Ratio5. Return on Investment (ROI) or Return on Capital Employed (ROCE)6. Earnings per Share 7. Price Earning Ratio.8. Dividend Payout Ratio
Gross Profit Ratio or Gross margin
Gross profit ratio establishes relationship between Gross Profit and net sale. It determines the efficiency with which production, purchase and selling operations are being carried on. It is calculated as percentage of sales. It is computed as follows:
Gross Profit Ratio = Gross Profit/Net Sales × 100
Interpretation: Gross Profit is the difference between sale and cost of good sold. Gross Profit margin reflect the efficiency with which the management produces each unit of output. It also include the margin available to cover operating expenses and non operating expenses. A high Gross Profit margin relative to the industry average employees that the firm is able to produced at comparatively at lower cost.
Illustration 21
Following information is available for the year 2006, calculate gross profit ratio:
Sales Rs. 1,20,000Gross Profit Rs. 60,000Return inwards Rs 20,000
Solution
Net Sales = Sales - Return inwards = Rs. 1,20,000- 20,000 = Rs. 1,00,000
Gross Profit Ratio = Gross Profit/Net Sales × 100 = Rs.60,000/Rs.1,00,000 × 100
= 60%.
Illustration 22Calculate Gross Profit ratio from the following information:Opening stock Rs. 50,000; closing stock Rs. 75,000; cash sale Rs. 1,00,000; credits sales Rs 1,70,000; Returns outwards Rs. 15,000; purchased Rs. 2,90,000; advertisement expenses Rs. 30,000; carriage inwards Rs. 10,000.
SolutionCost of goods sold = Opening stock + net purchases + direct expenses – closing stock
30

= Rs. 50,000 + (Rs. 2,90,000- Rs. 15,000) + Rs. 10,000 - Rs. 75,000= Rs. 2,60,000
Total Sales = Cash Sales + Credits Sales= Rs. 1,00,000 + Rs 1,70,000
= Rs. 2,70,000
Gross profit = Total Sales - Cost of goods sold = Rs. 2,70,000- Rs. 2,60,000
= Rs. 10,000
Gross profit Ratio = 10,000 X 100 2,70,000
= 3.704 %
Net Profit Ratio or Net Margin
This ratio establishes the relationship between net profit and net sale . It indicates managements’ efficiency in manufacturing, administering and selling the product. It calculates as a percentage of sale. it is computed as under:
Net Profit Ratio = Net profit / Net Sales × 100Generally, net profit refers to Profit after Tax (PAT).
Interpretation: This ratio measures the firms’ ability to turn each rupee sales into net profit. A firm with high net profit margin would be in an advantageous position to survive in the face of falling selling prices, rising cost of production or declining demand for the product.
Illustration 23
Sales Rs. 6,30,000; sales Returns Rs. 30,000; Indirect expenses Rs. 50,000; cost of goods sold Rs.2,50,000. Calculate Net Profit Ratio.
SolutionNet Sales = Total Sales – sales Returns
= Rs. 6,30,000 – Rs. 30,000 = Rs.6,00,000
Gross Profit = Net Sales – Cost of goods sold = Rs. 6,30,000 - Rs.2,50,000 = Rs. 3,50,000
Net Profit = Gross Profit - Indirect expenses = Rs. 3,50,000 – Rs. 50,000 = Rs. 3,00,000
Net Profit Ratio= Net Profit Net sale= Rs. 3,00,000 X 100 Rs. 6,00,000 = 50 %
Illustration 24
31

Gross profit ratio is 25 % . Cost of goods sold is Rs. 3,00,000. Indirect expenses Rs. 60,000. Calculate Net Profit Ratio.
Solution
Sales = 100/(100 – 25) X Rs. 3,00,000 = Rs. 4,00,000
Gross profit = Sale- cost of goods sold= Rs. 4,00,000 – Rs.60,000= Rs. 40,000
Net Profit Ratio = Net profit X 100 Net Sale
= Rs. 40,000/ Rs. 4,00,000 x 100= 10 %
Operating Ratio
Operating Ratio establishes relationship between operating cost and net sales. It determine the operational efficiency with the production , purchase and selling operations are being carried on. It is calculated as follows:
Operating Ratio = (Cost of Sales + Operating Expenses)/ Net Sales × 100
Operating expenses include office expenses, administrative expenses, sellingexpenses and distribution expenses.
Interpretation: Operating Ratio indicates the Operating cost incurred is computed to express Cost of operation excluding financial charge in relation to sales. A corollary of it is ‘ Operating Profit Ratio’. It helps to analyse the performance of business and throw light on the operations efficiency of the business. It is very useful for inter- firm as well as intra firm comparisons. Lower operating ratio is a very healthy sign.
Operating Profit Ratio
Operating Profit Ratio establishes the relationship between Operating Profit and net sales. It can be computed directly or as a residual of operating ratio.
Operating Profit Ratio = Operating Profit/ Sales × 100
Where Operating Profit = Sales – Cost of Operation
Interpretation: Operating Ratio determine the operational efficiency of the management . It helps in knowing the amount of profit earned from regular business transactions on a sale of Rs. 100. It is very useful for inter firm as well as intra firm comparisons. Higher operating ratio indicates that the firm has got enough margins to meet its non operating expenses well as to create reserve and pay dividends.
Illustration 25
Calculate the operating ratio from given the following information:
32

Sales Rs. 2,00,000; Sales returns rs. 30,000; operating expenses Rs. 55,000; Cost of goods sold Rs. 1,70,000
SolutionOperating Ratio = Cost of goods sold + Selling Expenses X 100
Net Sales = Rs. 1,70,000 + 55,000 X 100
Rs.1,70,000 (2,00,000- 30,000)
= 132.35 %
Illustration 26Calculate the Gross profit Ratio, Net Profit Ratio and Operating Ratio from the given the following information:
Sales Rs. 4,00,000Cost of Goods Sold Rs. 2,20,000Selling expenses Rs. 20,000Administrative Expenses Rs. 60,000
Solution
Gross Profit = Sales – Cost of goods sold= Rs. 4,00,000 – Rs. 2,20,000= Rs. 1,80,000
Gross Profit Ratio = Gross s Profit X 100 Sales
= Rs. 1 ,80,000 X 100 Rs 4 ,00,000
= 45 %
Net Profit = Gross Profit – Indirect expenses = Rs. 1,80,000 – (Rs. 20,000 + Rs. 60,000) = Rs. 1,00,000
Net Profit Ratio = Net profit / Sales × 100 = Rs.(1,00,000/ 4,00,000) X 100
= 25 %
Operating Expenses = Selling Expenses + Administrative Expenses = Rs. 20,000 + 60,000 = Rs. 80,000
Operating Ratio = Cost of goods + Operating Expenses X 100Net Sa les
= Rs. 2 ,20,000 + Rs. 80,000 X 100Rs4, 00,000
= 75 %
Return on Capital Employed or Return on Investment (ROCE or ROI)
This ratio establishes the relationship between net profit before Interest and Tax and capital employees. It measures how efficiently the long-term funds supplied by the
33

long-term creditors and shareholders are being used. It is expressed as a percentage.Thus, it is computed as follows:
Return on Investment = Profit before Interest and Tax/Capital Employed × 100
Where capital employed = Dept + equity Or
Capital Employed = Fixed Assets + Working Capital
Interpretation : It explains the overall utilisation of fund by a business. It reveals the efficiency of the business in utilisation of funds entrusted to it by, share holders , debenture-holders and long-term liabilities. For inter-firm comparison, it is considered good measure of profitability.
Illustration 27
Liabilities Rs. Assets Rs.Equity Share Capital (1,00,000 equity share of Rs. 10 each)
10,00,000 Fixed assets (Net) 14,00,000
Reserves 2,50,000 Current Assets 12,50,00010 % Debentures 5,00,000 Preliminary Expenses 1,00,000Current Liability 7,50,000Profit for the year 2,50,000
27,50,000 27,50,000
Calculate Return on Capital employed
SolutionReturn on Investment = Profit before Interest and Tax/Capital Employed × 100
Profit before Interest and Tax: Profit for the year = Rs. 2,50,000Add interest (10 % of 5,00,000) = Rs. 50,000Profit before interest and tax = 3,00,000
Capital Employes = NetAssets + working Capital= Rs. 14,00,000 + Rs( 12,50,000 – Rs. 7,50,000)= Rs. 19,00,000
Earnings Per ShareThis ratio measures the earning available to an equity shareholders per share. Itb indicates the profitability of the firm on a per share basis.The ratio is calculated as - Earning Per Share = Profit available for equity shareholders/ No. of Equity Shares
In this context, earnings refer to profit available for equity shareholders whichis worked out as Profit after Tax – Dividend on Preference Shares.
Interpretation : This ratio is very important from equity shareholders point of view and so also for the share price in the stock market. This also helps comparison with other firm’s to ascertain its reasonableness and capacity to pay dividend. But increase in Earning per share does not have always indicate increase in profitability because
34

sometimes , when bonus shares are issued , earning per share would decrease . In these cases, the earning per share is misleading as the actual earning have not decreased.
Illustration 28
Calculate earning per share from the following information:
50,000 equity shares of Rs. 10 each Rs 5,00,00010 % Preference share capital Rs 1,00,0009 % Debentures Rs. 2,00,000Net Profit after tax Rs. 2,00,000
Solution
Earning per share = Profit available for equity shareholders/ No. of Equity Share= Rs( 1,10,000 – 10,000) / 50,000= Rs. 2 per share
Price Earning Ratio
This ratio establishes a relationship between market price per share and earning per share. The objective of this ratio is to find out the expectations of the shareholders.
This ratio is calculated as –
P/E Ratio = Market price of a Share/Earnings per Share
Interpretation : It indicates the numbers of times of EPS the share is being quoted in the market. It reflects investors’ expectation about the growth in the firms’ earning and reasonableness of the market price of its shares. P/E ratios vary from industry to industry and company to company in the same industry depending upon investors perception of their future.
Illustration 29
Earning per share Rs. 150 . market price per share Rs. 3000. Calculate price Earning ratio.
Solution:
P/E Ratio = Market price of a Share/Earnings per Share = Rs. 3,000/ Rs. 150 = Rs. 20
Illustration 30
Calculated price earning ratio from the following information:
Equity share capital( Rs. 10 per Share) Rs 2,50,000Reserves (including current year’s profit) Rs 1,00,00010 % Preference Share Capital Rs 2,50,0009 % Debentures Rs 2,00,000Profit before interest Rs 3,30,000Market Price per Share Rs 50.Tax rate 50 %
35

SolutionP/E Ratio = Market price of a Share/Earnings per Share
Earning per share = Profit available for equity shareholders/ No. of Equity Share
Profit available for equity shareholders:
Profit before interest = Rs. 3,30,000Less interest on debentures = Rs 18,000
Rs 3,12,000
Less tax ( 50 % of Rs. 3,12,000) = Rs. 1.56,000Less preference dividend = Rs. 25,000Earning after Tax = Rs 1,31,000
Earning per share = Earning after tax / No.of equity shares = Rs 1,31,000/ 25,000
= Rs. 5.24
P/E Ratio = Market price share / Earning per share= Rs. 50/ Rs. 5.24= Rs. 9.54
Dividend Payout Ratio
This refers to the proportion of earning that are distributed against theshareholders. It is computed as –
Dividend Payout Ratio = Dividend Per Share Earnings Per Share
Interpretation : It expresses the relationship between what is available per share and what is actually paid in the form of dividends out of available earnings. This ratio reflects company’s’ dividend policy. A higher payout ratio may mean lower retention or a deteriorating liquidity position.
Illustration 31Calculate dividend payout ratio., If dividend paid per share Rs. 2.62 per share from the information of Illustration 30
Solution:
From the above Illustration , earning per share= Rs. 5.24Dividend paid per share = Rs. 2.62 per Share
So. Dividend payout Ratio= Dividend per shareEarning per ratio
= Rs. 2.62 Rs. 5.24
= Rs. O.50
1.7 Meaning of Cash Flow Statement
36

Cash flow is made up of two words i.e. Cash and Flow, whereas Cash means cash balance in hand including cash at bank balance, and Flow means changes (which may be + or – increase or decrease) in the cash movements of the business.
Cash Flow Statement deals with only such items, which are connected with cash i.e., items relating to inflow and outflow of cash. In other words, it is prepared to study the changes in cash, or to show impact of various transactions on the cash. In short, it is a statement, which is prepared to show the flow of cash in the business during a particular period. It thus, tells about the changes in cash position of a business. The changes may be related either with the cash receipts or cash payments or disbursements of cash. Thus, Cash Flow Statement is a summary of cash receipts and payments whereby reconciling the opening cash balance with the closing cash including bank balances in done. It also explains the reasons for the changes in the cash position of the business on account of the Decrease in the cash position is termed as outflow of cash and increase is termed in flow. Cash flow statement also tells about various sources in cash such as cash from operations, sale of current and fixed Assets, issue of shares/debentures, also termed as inflow of cash whereas loss from operations, purchase of current and fixed assets, redemption of preference shares/debentures and other long term loans etc are also termed as outflow of cash.
The Cash Flow Statement is prepared because of number of merits, which are offered by it. Such merits are also termed as its objectives. The important objectives are as follows :
1. To Help the Management in Making Future Financial Policies – Cash Flow statement is very helpful to the management. The management can make its future financial policies and is in a position to know about surplus or deficit of cash. Accordingly, management can think of investing surplus funds, if nay, in either short term or long term investments. Thus, cash is the center of all financial decisions.
2. Helpful in Declaring Dividends etc. – Cash Flow Statement is very helpful in declaring dividends etc. This statement can supply information regarding to understand the liquidity. It must be paid within 42 days.
3. Cash Flow Statement is Different than Cash Budget :- Cash budget is prepared with the help of inflow and outflow of cash. If there is any variation, the same can be corrected.
4. Helpful in devising the cash requirement :- Cash flow statement is helpful in devising the cash requirement for repayment of liabilities and replacement of fixed assets.
5. Helpful in finding reasons for the difference - Cash Flow Statement is also helpful in finding reasons for the difference between profits/losses earned during the period and the availability of cash whether cash is in surplus or deficit.
6. As per AS-3, Cash Flow Statement :- Cash Flow Statement is prepared with a view to highlight the cash generated from recurring activities or cash loss if any where as net profit is calculated after making adjustments on account of non cash items in the profit and loss account.
37

7. Helpful in predicting sickness of the business:- Cash flow is helpful in predicting sickness of the business with the help of different ratios.
1.7.1 USES OF CASH FLOW STATEMENT
(i) Short-Term Planning : The Cash Flow Statement gives information regarding sources and application of cash and cash equivalents for a specific period so that it becomes easier to plan investments, operating and financing needs of an enterprise.
(ii) The Cash Flow helps understand Liquidity and Solvency : Solvency is the ability of the business to meet its current liabilities. Quarterly or monthly Cash Flow Statements help ascertain liquidity in a better way. Financial institutions, like banks prefer the Cash Flow Statement to analyse liquidity.
(iii) Efficient Cash Management : The Cash Flow Statement provides information relating to surplus or deficit of cash. An enterprise, therefore, can decide about the short-term investments of the surplus and can arrange the short-term credit in case of deficit.
(iv) Comparative Study : A comparison of the Cash Flows for the previous year with the budgeted figures of the same year will indicate as to what extent the cash resources of the business were generated and applied according to the plan. It is, therefore, useful for the management to prepare cash budgets.
(v) Reasons for Cash Position : The Cash Flow Statement explains the reasons for lower and higher cash balances with the enterprise. Sometimes, a lower cash balance is found in spite of higher profits or a higher cash balance is found in spite of lower profits. Reasons for such situations can be analysed with the help of the Cash Flow Statement. Sometimes in spite of high profits gone? Answers to such questions can be found from the Cash Flow Statement.
(vi) Test for the Management Decisions : It is a general rule that fixed assets are purchased from the funds raised from long-term sources, and the best way to repay the long-term debt is out of profits. The Cash Flow Statement shows clearly whether the cash inflows from operations have been used for the purchase of fixed assets or whether these assets have been purchased from cash inflows from long-term debts. Similarly, it also explains whether the debentures have been redeemed out of profits or not. Thus, the Cash Flow Statement fan be used to test the credibility of the management decisions.
1.7.2 LIMITATIONS OF CASH STATEMENT
Though the Cash Flow Statement is a very useful tool of financial analysis, it has its limitations which must be kept in mind at the time of its use. These limitations are :
(i) Non-cash Transaction are ignored : The Cash Flow Statement shows only inflows and outflows of cash. It does not show non-cash transactions like the purchase of buildings by the issue of shares or debentures to the vendors or issue of bonus shares.
(ii) Not a substitute for an Income Statement : An income statement shows both cash and non-cash items. The income statement shows the net income of the firm whereas the Cash Flow Statement shows only the net cash inflows or outflows which do not represent the net profits or losses of the enterprise.
38

(iii) Historical in Nature : It rearranges the existing information available in the income statement and the balance sheet. It will become more useful if it is accompanied by the projected Cash Flow Statement.
(iv) Ignorance :- It ignores basic accounting concept, i.e., accrual concept.
1.7.3 IMPORTANT DEFINITIONS AS PER ACCOUNTING STANDARD-3 (REVISED)
(i) Cash comprises cash on hand and demand deposits with banks.
(ii) Cash Equivalents are short-term, highly liquid investments that are readily convertible into the known amount of cash and which are subject to an insignificant risk of change in value. An investment normally qualifies as cash equivalent only when it has a short maturity of, say, three months or less from the date of acquisition Examples of cash equivalents are : (a) treasury bills,(b) commercial paper, (c) money market funds and (d) Investments in preference shares and redeemable within three months can also be taken as cash equivalents if there is no risk of the failure of the company.
(iii) Cash Flows are inflows and outflows of cash and cash equivalents. AS-3 requires a Cash Flow Statement to be prepared and presented in a manner that it shows cash flows from business transactions during a period classifying them into :
(i) Operating Activities; (ii) Investing Activities ; and (iii) Financing Activities.
(iv) Operating Activities : Operating activities are the principal revenue-producing activities of the enterprise and other activities that are not investing or financing activities.
(v) Investing Activities : Investing activities are the acquisition and disposal of long-term assets and other investments not included in cash equivalents.
(vi) Financing Activities : Financing activities are the activities that result in change in the size and composition of the owners’ capital (including preference) share capital in the case of a company) and borrowing of the enterprise.
1.8 Classification of Cash Flows :
As discussed earlier, the Cash, Flow Statement shows the cash inflows (sources) and cash outflows (uses or applications) of cash and cash equivalents during an accounting period. Hence, it is essential to know about the various items of sources (or inflows of cash) and uses (outflows of cash) of cash. As per the Accounting Standard-3 (AS-3) the changes resulting in inflows and outflows cash and cash equivalents arise on account of three types of activities, i.e., operating, investing and financing as discussed below :
1.8.1 (i) Operating Activities :
Operating Activities are the principal revenue producing activities of the enterprise and other activities that are not related to investing or financing activities. The examples are :
(a) Cash receipts from the sale of goods and rendering of services.
(b) Cash receipts from royalties, fees, commission and other revenue.
(c) Cash payments to suppliers of goods and services.
39

(d) Cash payments to and on behalf of employees for wages, etc.
(e) Cash receipts and payments of an insurance enterprise for premiums and claims, annuities and other policy benefits.
(f) Cash payments or refunds of income taxes unless they can be specifically identified with financing and investing activities.
(g) Cash receipts and payments relating to future contracts, forward contracts, option contracts, and swap contracts, when the contracts are held for dealing or trading purposes.
The principal revenue producing activity of an enterprise is the main activity (business) carried on by it to earn profits. Examples of a financial enterprise; giving loans and dealing in securities is the principal revenue producing activity. Similarly, for an insurance company accepting premium and payments of claims is the principal revenue producing activity.
The net effect of the operating activities on the flow of cash is reported as cash flow from or cash used in Operating Activities in the Cash Flow Statement.
1.8.2 (ii) Investing Activities
Investing activities are the acquisition and disposal of the long-term assets and other investments, not included in cash equivalents, These activities include transactions involving purchase and sale of the long-term productive assets like machinery, land and buildings, etc., which are not held for resale. The cash flow from investing activities are:
(a) Cash payments to acquire fixed assets (including intangibles) and also payments for capitalized research and development costs and self constructed fixed assets.
(b) Cash receipts from the disposal of fixed assets (including intangibles).
(c) Cash payments to purchase (acquire) shares, warrants, or debt instruments of other enterprises and interests in joint ventures (other than payments for those instruments considered to be cash equivalents and those held for trading or dealing purposes).
(d) Cash receipts from sale (disposal) of shares, warrants, or debt instruments of other enterprises and interest in joint ventures (other than receipts from those instruments considered to be cash equivalents and those held for dealing or trading purposes).
(e) Cash receipts from sale (disposal) of shares, warrants, or debt instruments of other enterprises and interest in joint ventures (other than receipts from those instruments considered to be cash equivalents and those held for dealing or trading purposes).
(f) Cash receipts from repayments of advances and loans made to third parties (other than advances and loans of financial enterprises).
(g) Cash receipts relating to future contracts, forward contracts, option contracts and swap contracts except when the contracts are held for trading purposes, or the receipts are classified as financing activities.
(h) Cash payments relating to future contracts, forward contracts, option contracts and swap contracts except when the contracts are held for trading purposes, or the payments are classified as financing activities.
40

1.8.3 (iii) Financing Activities
Financing activities are the activities which result in changes in the size and composition of the owner’s capital (including preference share capital in the case of a company) and borrowings of the enterprise from other sources. The cash flow from financing activities are :
(a) Cash proceeds from the issue of shares or other similar instruments.
(b) Cash proceeds from the issue of debentures, loan notes, bonds and other short term borrowings.
(c) Buy-back of equity shares.
(d) Cash repayments of the amounts borrowed including redemption of debentures.
(e) Payments of dividends both equity and preference dividends.
(f) Payments for interest on debentures and loans.
Illustration 1. State a transaction a part of which is classified as an Investing Activity and another part is classified as a Financing Activity.
Solution :
Payment of installments of an asset purchased on Hire-Purchased on Hire-Purchase basis. The installment has two components, i.e., principal and interest. Principal is classified as an Investing Activity and interest as a Financing Activity.
Classification of Business Activities as per AS-3, showing the inflow and Outflow of Cash
Operating Activities
Cash Inflow Cash Outflow
(i) Cash Sales (i) Cash Purchases
(ii) Cash received from debtors (ii) Payment to Creditors
(iii) Cash received from Commission and Fees (iii) Cash Operating Expenses
(iv) Royalty (iv)Payment of Wages
(v) Income Tax
41

In the case of Financial Companies In the case of Financial Companies
(v) Cash received for interest and dividends (vi)Cash paid for interest
(vi) Sale of securities (vii) Purchase of Securities
Investing Activities
Cash Inflow Cash Outflow
(i) Sales of fixed Assets (i) Purchase of Fixed Assets(ii) Sale of Investments (ii) Purchase of Investments(iii) Interest Received(iv) Dividends Received
Financing Activities
Cash Inflow Cash Outflow
(i) Issue of Shares in Cash (i) Payment of Loans(ii) Issue of Debentures in Cash (ii) Redemption of Preference Shares(iii) Proceeds from Long-term Borrowings (iii) Buy-back of Equity Shares
(iv)Payment of Dividend(v) Payment of Interest(vi)Repayment of Finance/Lease
Liability
Why is it important to disclose the cash flows from each activity separately?A student will appreciate the importance of separate disclosure under each activity from the following :
Operating Activities Investing Activities Financing ActivitiesThe amount of the cash flow arising from operating activities is a key indicator of the extent to which the operations of the enterprise have generated cash, i.e., whether the cash generation is adequate to maintain operating capability of the enterprise, pay dividends, repay loans, and make new
The amount of the cash flow arising from investing activities represents the extent to which expenditure has been incurred to generate future income and cash flows.
The amount of the cash flow arising from financing activities is useful in assessing claims on future cash flows by providers of funds to the enterprise.
42

investments. It is also helpful in forecasting future cash flows from operations.
Illustration 2. Identify the transactions as belonging to (i) Operating, (ii) Investing, (iii) Financing Activities, and (iv) Cash Equivalents.1. Cash Sales; 2. Issue of Share Capital; 3. Issue of Debentures; 4. Purchase of Machines; 5. Sale of Machines; 6. Cash received from Debtors; 7. Commission and Royalty received; 8. Purchase of Investments; 9. Redemption of Debentures and Preference Shares; 10. Repayment of a Long-term Loan; 11. Interest paid on Debentures or long-term loans by (a) Finance company, and (b) Non-finance company; 12. Office Expenses; 13. Dividend received on Shares by (a) Finance company, and (b) Non-finance company; 14. Interest received on Investments by (a) Finance company, and (b) Non-finance company; 15. Manufacturing Expenses; 16. Rent received by a company whose main business is (a) real estate business, (b) manufacturing; 17. Selling and Distribution Expenses; 18. Sale of Investment by (a) Finance company, and (b) Non-finance company; 19. Purchase of Goodwill; 20. Dividends paid; 21. Cash Purchases; 22. Cash paid to Creditors; 23. Sale of Patents; 24. Income Tax refund received; 26. Bank Balance; 27. Cash Credit; 28. Short-term deposits in Banks; 29. Investment in Marketable Securities (Short-term); 30. Rent paid and 31. Buy-back of Equity shares.
Solution :Operating Activities : 1,6, 7, 11 (a) 12, 13 (a), 14(a), 15, 16(a), 17, 18(a), 21, 22, 24, 25,30.Investing Activities : 4, 5, 8, 13(b), 14(b), 16(b), 20, 31.Financial Activities: 2, 3, 9, 10, 11b, 18b, 19,23. Cash Equivalents : 26, 27, 28, 29.
Illustration 3 From the following details, calculate cash from operations :
Rs.
Sales 2,50,000
Purchases 1,25,000
Wages 30,000
Assume that all the above transactions were in cash.
Solution :
Cash from operations = Cash inflow – Cash outflow
43

= Sales – (Purchases + wages)
= Rs. 2,50,000 – (Rs. 1,25,000+ Rs. 30,000)
= Rs. 2,50,000 – Rs. 1,55,000 = Rs. 95,000
Illustration 4 (Calculation of Cash Inflow from Debtors). Calculate the Cash Inflow from Debtors from the following information :
Particulars Rs.
(a) Total Sales 4,00,000Cash Sales 1,20,000Opening Debtors 40,000Closing Debtors 60,000Sales Returns 10,000
(b) Credit Sales 2,00,000Bad Debts 15,000Discount Allowed 5,000Opening Debtors 14,000Closing Debtors 25,000Sales Returns 10,000
(c ) Opening Debtors 10,000Closing Debtors 25,000Opening Bills Receivables 12,000Closing Bills Receivables 15,000Total Sales 2,40,000Cash Sales 20% of Credit SalesDiscount Allowed 8,000Bad Debts 10,000Sales Returns 12,000
Solution(A) CASH INFLOW FROM DEBTORS
Particulars Rs.
Opening Debtors 40,000
44

Add : Credit Sales (Total Sales – Cash Sales) (Rs. 4,00,000 – Rs. 1,20,000) 2,80,0003,20,000
Less : Sales Returns 10,000 Closing Balance of Debtors 60,000 70,000
Cash Inflow from Debtors 2,50,000
Alternative Solution : Cash Flow from Debtors — as balancing figure by preparing the Total Debtors Account.
Total Debtors AccountDr. Cr.
Particulars Rs. Particulars Rs.
To Balance b/d 40,000 By Sales Returns 10,000To Credit Sales : By Cash Inflow from Debtors 2,50,000
Total Sales 4,00,000 (Balancing Figure) 5,000Less: 1,20,000 2,80,000 By Balance c/d 60,000
3,20,000 3,20,000
(b)
Particulars Rs.
Opening Balance Debtors 14,000Add : Credit Sales 2,00,000
2,14,000Less : Bad Debts 15,000
Discount Allowed 5,000Sales Returns 10,000Closing Balance of Debtors 25,000 55,000
Cash Inflow from Debtors 1,59,000
Alternative Solution : Total Debtors Account
Dr. Cr.
Particulars Rs. Particulars Rs.
To Balance b/d 14,000 By Sales Returns 10,000To Credit Sales 2,00,000 By Bad Debts 15,000
By Discount Allowed 5,000 2,80,000 By Cash Inflow from Debtors 1,59,000
(Balancing Figure)By Balance c/d 25,000
2,14,000 2,14,000
45

Total Debtors Account (c ) Dr. Cr.
Particulars Rs. Particulars Rs.
To Balance b/d 10,000 By Bill Receivable 3,000To Credit Sales 2,00,000 By Discount Allowed 8,000
By Bad Debts 10,000 By Sales Returns 12,000
By Cash (Inflow from Debtors) 1,52,000 (Balancing Figure)
By Balance c/d 25,000
2,10,000 2,10,000
Illustration 5 (Calculation of Cash Outflow to Creditors). Calculate the Cash Outflow to Creditors from the following information :
Particulars Rs.
(a) Total Purchase 1,20,000Cash Purchases 50% of Credit PurchasesOpening Creditors 6,000Closing Creditors 15,000Purchase Returns 15,000Discount Received 5,000
(b) Credit Purchases 2,00,000Opening Balance of Creditors 15,000Closing Balance of Creditors 6,000Discount Received 1,500Purchase Returns 3,500Opening Balance of Bills Payable A/c 18,000Closing Balance of Bills Payable A/c 24,000
Solution :
(a) CALCULATION OF CASH OUTFLOW TO CREDITORS
Particulars Rs.
Opening Balance of Creditors 6,000Add : *Credit Purchase 80,000
86,000Less : Discount Received 5,000 Purchase Returns 15,000
Closing Balance of Creditors 15,000 35,000
Cash Outflows to Creditors 51,000
* Let Credit Purchases = x; Cash Purchases =
46
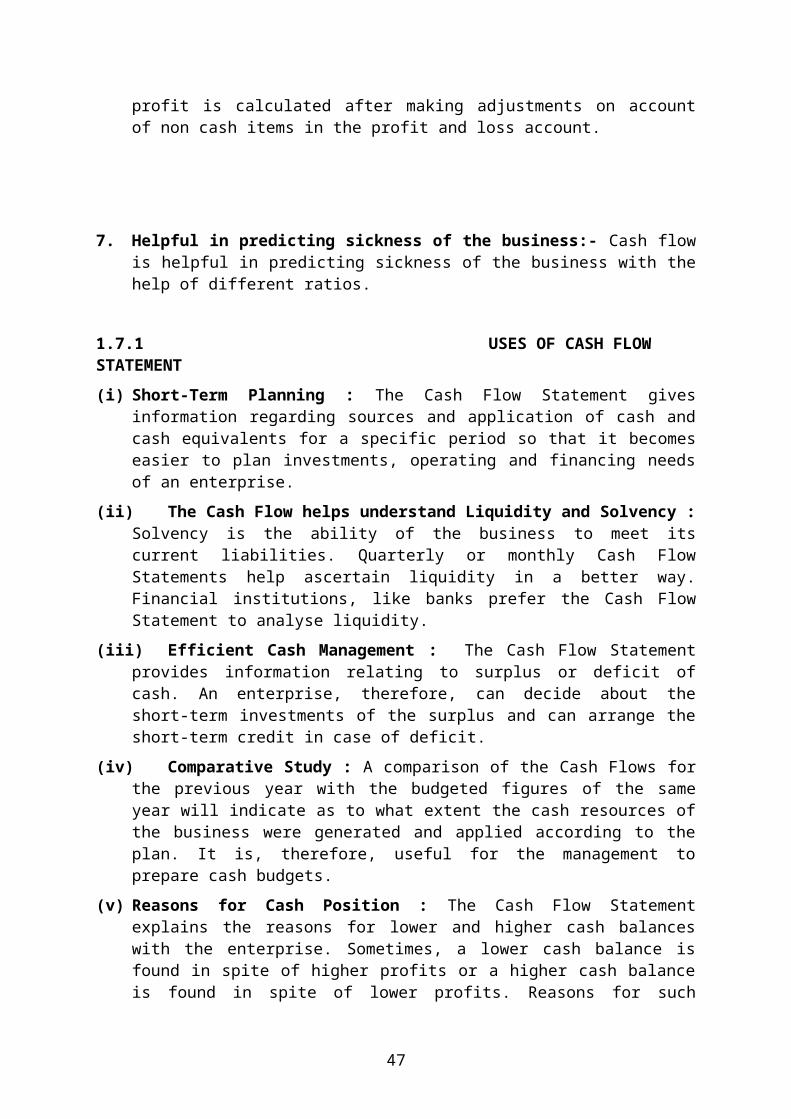
Total Purchase = = 1,20,000 Or x = Rs. 80,000
Alternatively, the cash outflow can be calculated by preparing the Total Creditors Account.
TOTAL DEBTORS ACCOUNT Dr. Cr.
Particulars Rs. Particulars Rs.
To Discount Received 5,000 By Bill Receivable 6,000To Purchase Returns 15,000 By Discount Allowed 80,000To Cash Outflow to Creditors 51,000
(Balancing Figure)
To Balance c/d 15,000
86,000 86,000
(b) CASH OUTFLOW TO CREDITORS
Particulars Rs.
Opening Balance of Creditors 6,000Opening Balance of Bills Payable 18,000Add : Credit Purchases 2,00,000
2,33,000Less : Discount Received 1,500 Purchase Returns 3,500
Closing Balance of Creditors 6,000 Closing Balance of Bills Payable 24,000 35,000
Cash Outflows to Creditors 1,98,000
Alternatively, the cash outflow can be calculated by preparing the Total Creditors Account.
TOTAL DEBTORS ACCOUNT Dr. Cr.
Particulars Rs. Particulars Rs.
To Discount Received 5,000 By Balance b/d (Opening) 15,000To Purchase Returns 15,000 By Credit Purchase 2,00,000To Bills Payable (Accepted)* 51,000
To Cash Outflow to Creditors 1,98,000
(Balancing Figure)
To Balance c/d (Closing) 6,000
2,15,000 2,15,000
* Bills Payable accepted = Closing balance of bills payable – Opening balance of bills payable
= Rs. 24,000 – Rs. 18,000 = Rs. 6,000
47

How is the amount of Income Tax paid determined?
Provision for Tax Account Dr. Cr.
Particulars Rs. Particulars Rs.
To Bank A/c (Tax Paid) ..….. By Balance b/d …..To Balance c/d …... By Profit and Loss A/c …..
(Provision made during the year)
…… ……
Note : If only the provision for tax is given in the two Balance Sheets and no information
about tax paid is given, the amount in the previous year’s Balance Sheet is treated as the tax
paid during the current year. It involves an outflow of cash.
The current year’s provision for tax represents the amount of tax provided for the current
year. It is added back to the current year’s profits to calculate cash from operating activities
(under the indirect method). It is merely a book entry and does not involve the outflow of
cash.
The provision for Tax Account provides information about the tax paid during the current
year as well as the tax provided for the current year.
The provision for Tax Account provides information about the tax paid during the current
year as well as the outflow of cash.
The provision for Tax Account provides information about the tax paid during the current
year as well as the tax provided for the current year.
The following illustration shows how income tax paid is determined.
Illustration 6. (Cash Flow from Operating Activity with Missing Amounts under the Direct Method). Prepare the Cash Flow Statement from Operating Activities by the Direct Method from the following given information :-
Profit and Loss Accountfor the year ended 31st March, 2007
Dr. Cr.
Particulars Rs. Particulars Rs.
To Opening Stock 20,000 By Sales : To Purchase : Cash 7,500
Cash 25,000 Credit 1,25,000 2,00,000Credit 75,000 1,00,000 By Closing Stock 26,000
To Selling Expenses 12,000 By Commissions 14,000
48

To Office Expenses 28,000 By Royalties 10,000To Bad Debts 4,000 By Purchases Returns 1,000To Discount Allowed 2,000To Depreciation 15,000To Tax Provisions 30,000To Sales Return 2,000To Net Profit 43,000
2,56,000 2,56,000
Additional Information :March 31, 2006 March 31, 2007
Rs. Rs.Debtors 15,000 10,000Creditors 14,000 10,000Outstanding Selling Exp. 3,000 4,000Prepaid Office Expenses 2,000 3,000Accrued Royalties 12,000 11,000Advance Commission 9,000 8,000Tax Provision 40,000 60,000
Solution :CASH FLOW FROM OPERATING ACTIVITIES
Particulars Rs.(a) Operating Cash Receipts
(i) Cash Sales 75,000(ii) Cash received from Debtors (Note 1) 1,14,000(iii) Cash from Royalties (Note 5) 11,000(iv) Cash from Commissions (Note 6) 13,000 2,13,000
(b) Operating Cash Payments(i) Cash Purchase 25,000(ii) Cash paid to Creditors (Note 2) 75,000(iii) Cash paid for Selling Exp.(Note 3) 11,000(iv) Cash paid for office Exp. (Note 4) 28,000 1,37,000
(c) Cash Inflows from Operating Activities before (Note-3) 76,000(d) Less : Income Tax Paid during the year (Note-7) 10,000Net Cash Flow from Operating Activities (c-d) 66,000
Note : Depreciation is a non-cash expenditure and, therefore, it is ignored.
Working Notes : Missing Information to be Calculated
TOTAL DEBTORS ACCOUNT 1. Dr. Cr.
Particulars Particulars Rs.
49

To Balance b/d 15,000 By Sales Returns 2,000 To Credit Sales 1,25,000 By Discount Allowed 2,000
By Bad Debts 4,000By Cash Received (Bal. Fig.) 1,14,000By Balance c/d 18,000
1,40,000 1,40,000
TOTAL CREDITOR ACCOUNT 2. Dr. Cr.
Particulars Particulars Rs.
To Purchase Returns 1,000 By Balance b/d 14,000 To Discount Received 5,000 By Credit Purchases 75,000To Cash Paid (Balancing Fig.) 73,000 To Balance c/d 10,000
89,000 89,000
SELLING EXPENSES ACCOUNT3. Dr. Cr.
Particulars Rs. Particular Rs.
To Cash A/c (Balancing Fig) 11,000 By Outstanding Expenses A/c 3,000 (In the beginning)
To Outstanding Exp. A/c 4,000 By Profit and Loss A/c 12,000
15,000 15,000
OFFICE EXPENSES ACCOUNT4. Dr. Cr.
Particulars Rs. Particular Rs.
To Prepaid Expenses A/c 2,000 By Profit and Loss a/c 28,000
(in the beginning) By Prepaid Expenses A/c 3,000To Cash A/c (Balancing Fig.) 29,000 (At the end)
31,000 31,000
ROYALTIES ACCOUNT5. Dr. Cr.
50

Particulars Rs. Particular Rs.
To Accrued Royalties 12,000 By Cash A/c (Balance Fig.) 11,000
(in the beginning) By Accrued Royalties A/c 11,000To Profit and Loss A/c 10,000 (At the end)
22,000 22,000
COMMISSION ACCOUNT6. Dr. Cr.
Particulars Rs. Particular Rs.
To Profit and Loss A/c 14,000 By Advance Commission A/c 9,000 (in the beginning)
To Advance Commission A/c 8,000 By Cash A/c (Balancing Fig.) 13,000 (At the end)
22,000 22,000
PROVISION FOR TAX ACCOUNT7. Dr. Cr.
Particulars Rs. Particular Rs.
To Bank A/c (Tax Paid) 10,000 By Balance b/d 40,000 By Profit and Loss A/c
30,000To Advance Commission A/c 8,000 (Provision made)
(At the end)
70,000 70,000
2. CASH FLOW FROM INVESTING ACTIVITIES
Investing Activities of an enterprise are acquisition and disposal of the long-term assets
and other investments not included in cash equivalents. Accordingly, the cash inflow and
outflow relating to the fixed assets, share and debt instruments of other enterprises,
interests in joint ventures, advances and loans to third parties and also their repayments
are shown under Investing Activities in the Cash Flow Statement. The Cash Flow from
Investing Activities is ascertained by analyzing the changes in Fixed Assets and Long-
term Investments in the beginning and at the end of the year.
51

Ascertaining Missing Amounts regarding Fixed Assets or Depreciation
Case 1 : When the fixed asset is shown at the written down value.
Fixed Assets Account (At written down value) Dr. Cr.
Particulars Rs. Particular Rs.
To Balance b/d …. By Bank A/c ….To Bank A/c (Purchases) .… Profit and Loss A/c ….To Profit and Loss A/c …. (Loss on Sale of Fixed Asset) ….(Profit on Sale of Fixed Asset) …. By Depreciation A/c ….
By Balance c/d ….….. ….
Notes : 1 Generally, the purchase of fixed assets is a balancing amount on the debit side of the account and depreciation or the sale of fixed asset on the credit side of the account.
2. Information regarding depreciation is generally given in the question. Students are required to find out only the sale or the purchase/sale of asset.
3. If both sale and depreciation are not given, then assume it is either sale or depreciation and give your assumption.
4. In the case of land, it should be assumed sale as depreciation is not charged on land. In the case of patents, goodwill and trade marks, it should be assumed sale as depreciation is not charged on land. In the case of patents, goodwill.
Illustration 7. X Ltd. has plant and machinery whose written down value on 1st April, 2006 was Rs.8,60,000, and on 31st March, 2007 was Rs. 9,50,000. Depreciation for the year was Rs. 40,000. At the beginning of the year, a part of plant was sold for Rs. 5,000 which had a written down value of Rs. 20,000. Calculate the Net Cash Flow from Investing Activities.
Solution : CASH FLOW FROM INVESTING ACTIVITIES
Particulars Rs.
Cash Payment to acquire Plant and Machinery (Note) 1,50,000Cash Receipts from Sale of Plant and Machinery 25,000 (1,25,000)
Note :PLANT AND MACHINERY ACCOUNT
Dr. Cr.
Date Particulars Rs. Date Particular Rs.
2006 2006 Apr 1 To Balance b/d 8,60,000 Apr 1 By Bank A/c 25,000
To Profit and Loss A/c 5,000 2007 By Depreciation A/c 40,000
52

(Profit on Sale of Plant) Mar 31 By Balance c/d 9,50,000To Bank A/c (Purchases 1,50,000Balancing Figure
10,15,000 10,15,000
Case 2 : When the fixed assets are shown at cost and accumulated depreciation (the provision for depreciation) is separately is separately maintained .Under this case, (in contrast to the above case), depreciation is not directly charged to the Assets account. The depreciation for the period is debited to the Depreciation Account (transfer to the Profit and Loss Account) and credited to Accumulated Depreciation Account. In the Balance Sheet, asset appears at its original cost and the accumulated depreciation is shown as a deduction from the Assets Account. In such cases, we prepare separate accounts for fixed assets and accumulated depreciation or provisions for depreciation. Depreciation for the year can be ascertained from Provision for the Depreciation Account.
Fixed Assets Account (At Cost) Dr. Cr.
Particulars Rs. Particular Rs.
To Balance b/d …. By Bank A/c (Sale of Fixed Asset) ….To Profit and Loss A/c .… By Accumulated Dep. A/c ….
Profit on Sale of Fixed Asset) …. (Accumulated Dep. onTo Bank A/c (Pur. of Fixed Asset) …. Fixed Asset Sold) ….
By Profit and Loss A/c ….(Loss on Sale of Fixed Asset) …..By Balance c/d …..
…… ……
Note : Normally, the purchase of fixed asset is a balancing amount on the debit side of the account and the sale of fixed asset on the credit side of the account.
ACCUMULATED DEPRECIATION ACCOUNT Dr. Cr.
Particulars Rs. Particular Rs.
To Fixed Asset A/c …. By Bank A/c (Sale of Fixed Asset) ….To Profit and Loss A/c .… By Accumulated Dep. A/c ….
Profit on Sale of Fixed Asset) …. (Accumulated Dep. onTo Bank A/c (Pur. of Fixed Asset) …. Fixed Asset Sold) ….
By Profit and Loss A/c ….(Loss on Sale of Fixed Asset) …..By Balance c/d …..
…… ……
Note : The Accumulate depreciation on the fixed asset sold or depreciation charged for the current accounting year may not be given, which shall be the balancing amount.
53

3. CASH FLOW FROM FINANCING ACTIVITIES
Financing Activities of an enterprise are those activities that result in change in the size and composition of owners’ capital and borrowing of the enterprise. It includes proceeds from issue of shares or other similar instruments, issue of debentures, loans, bonds, other short-term or long-term borrowings and repayments of amounts borrowed. Accordingly, receipts and payments on account of the above are disclosed in the Cash Flow Statement as the Cash Flow from Financing Activities.
Dividends paid (in all enterprises) and interest paid (in the case of non-financing enterprises) are also included in financing activities.
It is important to note that an increase in share capital due to bonus issue will not be shown in the cash flow statement, since it is a capitalization of reserves. When shares are issued at a premium, the cash flow statement reflects the total cash generated by the issue (i.e., Face Value of Shares + Premium).
The Cash Flow from Financing Activities is ascertained by analyzing the change in Equity and Preference Share Capital, Debentures and other borrowings.
Illustration 8. From the following information, calculate the Cash Flow from Financing Activities :
Particulars 31.3.2006 31.3.2007Rs, Rs
Equity Share Capital 4,00,000 5,00,00010% Debentures 1,50,000 1,00,000Securities 40,000 50,000
Additional Information : Interest paid on debentures Rs. 10,000
Solution :Calculation of Net Cash Flow From Financing Activities
Particulars Rs.
Cash Proceeds from the Issue of Shares (Including Premium) 1,10,000Interest paid on Debentures (10,000)Redemption of Debentures (50,000)Net Cash Flow from Financing Activities 50,000
Illustration 9. XYZ Ltd. provides the following information. Calculate the Net Cash Flow from Financing Activities :
54

Particulars 31.3.2006 31.3.2007Rs, Rs
Equity Share Capital 10,00,000 15,00,00010% Debentures 1,00,000 ……..8% Debentures ……… 2,00,000
Additional Information : (i) Interest paid on Debentures Rs. 10,000(ii) Dividend paid Rs. 50,000(iii) During the year 2006-2007, XZY Ltd. issued bonus shares in the ratio of 2 : 1 by
capitalising reserve.
Solution :Calculation of Net Cash Flow From Financing Activities
Particulars Rs.
Cash Proceeds from the Issue 8% of Debentures 2,00,000Redemption of 10% Debentures (1,00,000)Interest paid (10,000)Dividend paid (50,000)Net Cash Flow from Financing Activities 40,000
Note : Bonus shares is not to be shown in the Cash Flow Statement because there is no cash flow.
Illustration 10. From the following information, calculate the Cash Flow from Investing Activities and Financing Activities :
Particulars Opening Closing
Furniture (At Cost) 20,000 28,000
Accumulated Depreciation on Furniture 6,000 9,000
Capital 1,00,000 1,40,000
Loan from Bank 25,000 15,000
During the year, furniture costing Rs. 4,000 was sold at a profit of Rs. 3,000. Depreciation on furniture charged during the year amounted to Rs. 5,000.
Solution :
55

Cash Flow from Financing Activities
Particulars Rs.
Inflow from Issue of Fresh Capital (Given) (Rs. 1,40,000 – Rs. 1,00,000) 40,000
Outflow on Repayment of Bank Loan (Given) Rs. 25,000 – Rs. 15,000) (10,000)
Net Cash from Financing Activities 30,000
Cash Flow from Investing Activities
Particulars Rs.
Inflow from Sale of Furniture (3) 50,000
Outflow on Purchase of Furniture(1) (12,000)
Net Cash from Investing Activities (4) 7,000
1.9 PREPARATION OF CASH FLOW STATEMENT
Having discussed how the Cash Flow Statement is prepared for each activity, let us now discuss the Cash Flow Statement as a complete statement as follows :
1. Compute the Cash Flows from Operating Activities.
2. Compute the Cash Flows from Investing Activities and Financing Activities.
3. The Cash Flows under each activity (Operating/Investing/Financing) are shown in the Cash Flow Statement. Aggregate of these three activities will be either an increase or a decrease in cash equivalents.
4. Cash and Cash Equivalent balance at the beginning will be added to the net increase or decrease in Cash Equivalents (Step 3). Resulting figure will be Cash and Cash Equivalents at the end.
The formats for calculating Cash Flow from Operating Activities by Direct Method and Indirect Method are given below :
56

1.9.1 DIRECT METHOD
FORMAT FOR CASH FLOW STATEMENT
for the year ended ….
[ As per Accounting Standard-3 (Revised)]
Particulars Rs.
1. Cash Flow from Operating Activities
A. Operating Cash Receipts, e.g.,
– Cash Sales ….
– Cash received from Customers ….
– Trading Commissions received ….
– Royalties received …. …..
(B) Operating Cash Payments, e.g.,
– Cash Purchases (…)
– Cash Paid to the Suppliers (…)
– Cash Paid for Business Expenses like Office Expenses,
Manufacturing Expenses, Selling and Distribution
Exp. Etc. (…) (...)
(C) Cash generated from Operations (A – B) …
(D) Income Tax Paid (Net of Tax Refund received) (…)
(E) Cash Flow before Extraordinary Item ….
(F) Extraordinary Items (Receipt/Payment) (+/-)….
(G) Net Cash from (or used in) Operating Activities ….
II. Cash Flow from Investing Activities
(Same as under Indirect Method)
III. Cash Flow from Financing Activities …
(Same as under Indirect Method)
IV. Net Increase/Decrease in Cash and Cash Equivalents …
(Same as under Indirect Method - I + II + III) …
V. Add Cash and Cash Equivalents in the beginning of the year
(Same as under Indirect Method) …
VI. Cash and Cash Equivalents in the end of the year …
57

1.9.2 INDIRECT METHODFORMAT FOR CASH FLOW STATEMENT
for the year ended ….[ As per Accounting Standard-3 (Revised)]
Particulars Rs.1. Cash Flow from Operating Activities
Net Profit and Loss A/c or Difference between Closing Balance andOpening Balance of Profit and Loss A/c …Add : (A) Appropriation of funds.
Transfer to reserve …Proposed dividend for current year …Interim dividend paid during the year …Provision for tax made during the current year …Extraordinary item, if any, debited to the Profit and Loss A/c …
Less : Extraordinary item, if any, credited to the Profit and Loss A/c (…)Refund of tax credited to Profit and Loss A/c (…)
Net Profit before Taxation and Extraordinary Items ….(B) Add : Non operating Expenses :
– Depreciation …– Preliminary Expenses / Discount on Issue of Shares
and Debentures written off …– Goodwill, Patents and Trade Marks Amortized ….– Interest on Borrowings and Debentures ….– Loss on Sale of Fixed Assets ….
….(C) Less : Non Operating Incomes:
– Interest Income … – Dividend Income …– Rental Income …– Profit on Sale of Fixed Assets … …
(D) Operating Profit before Working Capital Changes (A+B–C) …(E) Add : Decrease in Current Assets and Increase in Current Liabilities
– Decrease in Stock/ Inventories …– Decrease in Debtors/ Bills Receivables …– Decrease in Accrued Incomes …– Decrease in Prepaid Expenses …– Increase in Creditors /Bills Payables …– Increase in Outstanding Expenses …– Increase in Advance Incomes …– Increase in Provision for Doubtful Debts. …
…(F) Less : Increase in Current Assets and Decrease in Current Liabilities
– Decrease in Stock/ Inventories …– Decrease in Debtors/ Bills Receivables …– Decrease in Accrued Incomes …– Decrease in Prepaid Expenses …– Increase in Creditors /Bills Payables …– Increase in Outstanding Expenses …– Increase in Advance Incomes …– Increase in Provision for Doubtful Debts. …
(G) Cash Generated from Operations (D+E–F) …
(H) Less : Income Tax Paid (Net of Tax Refund received) …
(I) Less : Income Tax Paid (Net of Tax Refund received) …(J) (+/-) Extraordinary Items(K) Net Cash from (or used in) Operating Activities …
58

II. Cash Flow from Investing Activities– Proceeds from Sale of Fixed Assets …– Proceeds from Sale of Investments …– Proceeds from Sale of Intangible Assets …– Interest and Dividend received
(For Non-financial companies only) …– Rent Income …– Purchase of Fixed Assets (…)– Purchase of Investments (…)– Purchase Intangible Assets like Goodwill (…) Net Cash from (or used in) Financing Activities …
III. Cash from Financing Activities– Proceeds from Issue of Shares and Debentures …– Proceeds from Other Long-term Borrowings …– Final Dividend Paid (…)– Interest and Debentures and Loans Paid (…)– Repayment of Loans (…)– Redemption of Debentures / Preference Shares (…)Net Cash from (or used in) Financing Activities …
IV. Net Increase / Decrease in Cash and Cash Equivalents (I+II+III) …
V. Add : Cash and Cash Equivalents in the beginning of the year– Cash in Hand– Cash at Bank (Less : Bank Overdraft) …– Short-term Deposits …– Marketable Securities … …
VI. Cash and Cash Equivalents in the end of the year– Cash in Hand …– Cash at Bank (Less : Bank Overdraft) …– Short-term Deposits …– Marketable Securities … …
Note : Amounts in brackets indicate negative amounts, i.e., amounts that are to be deducted.
Illustration 11. From the following information, prepare the Cash Flow Statement for the year ended March 31, 2007 :
Particulars Rs.
Opening Cash Balance 10,000
Closing Cash Balance 12,000
Decrease in Debtors 5,000
Increase in Creditors 7,000
Sale of Fixed Assets 20,000
Redemption of Debentures 50,000
Net Profit for the year 20,000
59

Solution :
Cash Flow Statement
for the year ended 31st March, 2007
Particulars Rs.
A. Cash Flow from Operating Activities 20,000
Net Profit for the year before tax
Add : Increase in Creditors 7,000
Decrease in Debtors 5,000 12,000
Net Cash provided by Operating Activities 32,000
B. Cash Flow from Investing Activities 20,000
Proceeds from Sale of Fixed Assets 20,000
Net Cash from Investing Activities
C. Cash Flow from Financing Activities
Redemption of Debentures (50,000)
Net Cash used in Financing Activities (50,000)
D. Net Increase in Cash (A +B+C) 2,000
Add : Cash at the beginning of the period 10,000
Cash at the end of the period 12,000
Illustration 12. From the following particulars , prepare the Cash Flow Statement for the year ended 31st March, 2007 by the Direct Method :
(i) Cash sales Rs. 65,86,000.
(ii) Cash collected from debtors during the year amounted to Rs. 33,23,400.
(iii) Cash paid to suppliers was Rs. 79,36,810.
(iv) Rs.9, 87, 500 was paid to and for employees.
(v) Furniture of the book value of Rs. 18,500 was sold for Rs. 11,000 and a new furniture costing Rs. 83,160 was purchased.
(vi) Debentures of the face value of Rs. 3,00,000 were redeemed at a premium of 2 per cent interest on debentures. Interest on debentures, Rs. 84,000 was also paid.
(vii) Dividend, Rs. 4,50,000 for the year ended 31st March, 2007 was distributed in May, 2007.
(viii) Cash in hand and at bank as on March 31, 2006 and March 31,2007 was Rs. 51,070 and
Rs. 5,74,000 respectively.
60

Solution :
CASH FLOW STATEMENT (DIRECT METHOD)
for the year ended 31st March, 2007
Particulars Rs.
Cash Flow from Operating Activities
Receipts – Cash Sales 65,86,000
Cash receipts from customers 33,23,400
99,09,400
Payments –Payments for purchases and to suppliers 79,36,810
Payments to and for employees 9,87,500
89,24,310
Net Cash from Operating Activities (Receipts – Payments) 9,85,090
Cash Flow from Investing Activities
Purchase of Fixed Assets (83,160)
Proceeds from Sale of Fixed Assets 11,000
Cash Flow from Financing Activities (72,160)
Redemption of debentures at a premium [Rs. 3,00,000 + Rs. 6,000] (3,06,000)
Interest paid on debentures (84,000) (3,90,000)
Net Cash used in Financing Activities (3,90,000)
Net increase in cash and cash equivalents 5,22,930
Cash and cash equivalents as on 31st March, 2007 (Closing Balance) 51,070
Cash and cash equivalents as on 31st March, 2007 (Closing Balance) 5,74,000
Notes : Dividend for the year ended 31st March, 2007 was paid in May 2007. Hence, it is not an outflow of cash for the year ended 31st March, 2007.
Illustration 13. From the summary cash account of X Ltd. prepare the Cash Flow Statement for the year ended 31st March, 2007 by Direct Method.
CASH BOOK Dr. for the year ended March 31,2007 Cr.
Particulars Rs. Particular Rs.
To Balance on April 1,2006 50,000 By Payment to Suppliers 20,00,000 To Issue of Equity Shares 3,00,000 By Purchased of Fixed Assets 2,00,000To Receipts from Customers 28,00,000 By Overhead Expenses 2,00,000To Sale of Fixed Assets 1,00,000 By Wages and Salaries 1,00,000
By Income Tax Paid2,50,000
By ‘Dividend Paid 3,00,000By Re payment of Bank Loan 3,00,000
61

By Balance on March 31, 2007 1,50,000
32,50,000 32,50,000
Solution :
CASH FLOW STATEMENT OF X LTD. (DIRECT METHOD)
for the year ended 31st March, 2007
Particulars Rs.A. Cash Flow from Operating Activities
(i) Operating Cash Receipts :Cash Received from Customers 28,00,000(ii) Operating Cash Payments :Cash Paid to Suppliers 20,00,000Wages and Salaries 1,00,000Overhead Expenses 2,00,000 (23,00,000)
Cash Generated from Operations 5,00,000Less : Income Tax Paid 2,50,000
Net Cash from Operating Activities 2,50,000B. Cash Flow from Investing Activities
Purchase of Fixed Assets (2,00,000)Proceeds from Sale of Fixed Assets 1,00,000Net Cash Used in Investing Activities (1,00,000)
C. Cash Flow from Financing ActivitiesProceeds from Issue of Equity Shares 3,00,000Payment of Bank Loan (3,00,000)Dividend Paid (50,000)Net Cash Used in Financing Activities (50,000)
D. Net Increase in Cash and Cash Equivalents (A+B+C) 1,00,000E. Cash and Cash Equivalent at the beginning of the year 50,000F. Cash and Cash Equivalent at the End of the year 1,50,000
Illustration 14. The financial position of ABC Ltd. as on 31st March was as follows :
Dr. Cr.
Liabilities 2006 2007 Assets 2006 2007Rs. Rs. Rs. Rs.
Current Liabilities 72,000 82,000 Cash 8,000 7,2000Loan from Z Ltd. …. 40,000 Debtors 70,000 76,800Loan from Bank 60,000 50,000 Stock 50,000 44,000
62

Share Capital 2,00,000 2,00,000 Land 40,000 60,000Profit and Loss A/c 96,000 98,000 Buildings 1,00,000 1,10,000
Machinery 2,14,000 2,44,000Provision for Dep. (54,000) (72,000)
4,28,000 4,70,000 4,28,000 4,70,000
During the year. Rs. 52,000 were paid as dividend. Prepare Cash Flow Statement.
Solution :
CASH FLOW STATEMENT
for the year ended 31st March, 2007
Particulars Rs.
Cash Flow from Operating Activities
Net profit before tax and extraordinary items
(See Working Note) 54,000
Add : Depreciation 18,000
Operating Profit before Working Capital Changes 72,000
Add : Decrease in Stocks 6,000
Increase in Current Liabilities 10,000
Less : Increase in Debtors (6,800)
Net Cash from Operating Activities 81,200
Cash Flow from Investing Activities
Purchase of Building (10,000)
Purchase of Land (20,000)
Purchase of Machinery (30,000)
Net Cash used in Investing Activities (60,000)
Cash Flow from Financing Activities
Proceeds of Loan from Z Ltd. 40,000
Repayment of Bank Loan (10,000)
Payment of Dividend (52,000)
Net cash used in Financing Activities (22,000)
Net Decrease in Cash and Cash Equivalents (800)
Cash and cash equivalents at the beginning 8,000
Cash and cash equivalents at the end of the period 7,200
Working Note :
Closing Balance as per Profit and Loss A/c (on 31st March, 2007) 98,000
Less : Opening Balance as per Profit and Loss A/c as on 1st April, 2006 96,000
63

Profit for the year 2,000
Add : Dividends Paid 52,000
Net Profit before Tax 54,000
Illustration 15. From the following particulars of XYZ Ltd. prepare the Cash Flow Statement.
Dr. Cr.
Liabilities March 31 March 31, Assets March 31, March 312006 2007 2006 2007
Rs. Rs. Rs. Rs.
Equity Share Capital 3,00,000 3,50,000 Fixed Assets (Net) 5,10,000 6,20,000
12% Pref. Share Capital 2,00,000 1,00,000 10% Investment 30,000 80,000
10% Debentures 1,00,000 2,00,000 Cash in Hand 20,000 35,000
Profit and Loss A/c 1,10,000 2,70,000 Cash at Bank 20,000 40,000
Creditors 70,000 1,45,000 Debtors (Good) 1,00,000 2,00,000
Provision for Doubtful Debts 10,000 15,000 Stock 1,00,000 90,000
Discount on Deb. 10,000 15,000
7,90,000 10,80,000 7,90,000 10,80,000
You are informed that during the year :
(i) A machine with a book value of Rs. 40,000 was sold for 25,000.
(ii) Depreciation charged during the year was Rs.70,000.
(iii) Preference shares were redeemed on 31st March, 2007 at a premium of 5%.
(iv) An Interim Dividend @ 15 per cent was paid on equity shares on 31st March, 2007. Preference Dividend was also paid on 31st march, 2007.
(v) New shares and debentures were issued on 31st March, 2007.
Solution :
CASH FLOW STATEMENT
for the year ended 31st March, 2007
Particulars Rs.
(A) Cash Flow from Operating Activities
Closing Balance as per Profit and Loss A/c 2,70,000
Less : Opening Balance as per Profit and Loss A/c 1,10,000
1,60,000
Add : Appropriation of Fund
64

Preference Dividend 24,000
Interim Dividend 45,000
Increase in Provision for Doubtful Debts (Since all debtors are good) (Note 1) 5,000 74,000
Net Profit before tax 2,34,000
Add : Non operating Expenses :
Depreciation 70,000
Interest on Long Term Borrowings (Debentures) 10,000
Loss on Sale of Machinery 15,000
Premium Payable on Redemption of Preference Shares 5,000 1,00,000
3,34,000
Less : Non operating Incomes :
Interest on Investment 3,000
Operating Profit before Working Capital Changes 3,31,000
Add : Decrease in Current Assets and Increase in Current Liabilities
Decrease in Stock 10,000
Increase in Creditors 75,000 85,000
4,16,000
Less : Increase in Current Assets and Decrease in Current Liabilities
Increase in Debtors 1,00,000
Net Cash from Operating Activities 3,16,000
B. Cash Flow from Investing Activities
Purchase of Fixed Assets (2,20,000)
Proceeds from Sale of Machinery 25,000
Interest on Investment 3,000
Purchase of Investments (50,000)
Net Cash Used in Investing Activities (2,42,000)
(C ) Cash Flow from Financing Activities
Proceeds from Issue of Share Capital 50,000
Proceeds from long-term borrowings (Debentures) 95,000[ Rs. 1,00,000 – Rs. 5,000 (Discount on Issue of Debentures) (Note 2)]
Redemption of Preference Shares (Rs. 1,00,000 + Rs. 5,000) (1,05,000)
Interest Paid on Long-Term Borrowings (10,000)
Interim Dividend paid (45,000)
Preference Dividend Paid during the year (24,000)
Net Cash Used in Financing Activities (39,000)
Net Increase in Cash and Cash Equivalents (A+B+C) 35,000
Cash and Cash Equivalents in the beginning of period 40,000
65

(Cash in Hand and Cash at Bank)
Cash in Cash Equivalents at the end of period 75,000
(Cash in Hand and Cash at Bank)
Working Notes :
a. Increase in Provision for Doubtful Debts (if all debtors have been considered as good)
represents transfer of the Profit from Profit and Loss Account. It is added back to the
current year’s profits to find out cash from Operating Activities.
b. Increase in Discount on the Issue of Debentures (or shares) is deducted from increase in
Debentures (or shares) to ascertain the net amount of issue.
FIXED ASSETS ACCOUNT (AT W.D.V)3. Dr. Cr.
Particulars Rs. Particulars Rs.
To Balance b/d 5,10,000 By Bank A/c 25,000To Bank A/c (Purchase) 2,20,000 By Profit and Loss A/c
(Balancing Figure) (Loss on Sale) 15,000By Depreciation A/c 70,000By Balance c/d 6,20,000
7,30,000 7,30,000
Illustration 16. The summarized Balance Sheets of XYZ Ltd. as on 31st March, 2006 and 2007 are given below :- Dr. Cr.
Liabilities March 31 March 31, Assets March 31, March 312006 2007 2006 2007
Rs. Rs. Rs. Rs.
Share Capital 4,50,000 4,50,000 Fixed Assets 4,00,000 3,20,000General Reserve 3,00,000 3,10,000 Investment 50,000 60,000Profit and Loss A/c 56,000 68,000 Stock 2,40,000 2,10,000Creditors 1,68,000 1,34,000 Debtors 2,10,000 4,55,000Provision for Taxation 75,000 10,000 Bank 1,49,000 1,97,000
Mortgage …. 2,70,000
10,49,000 12,42,000 10,49,000 12,42,000
66

Additional Information :(i) Investments costing Rs. 8,000 were sold during the year 2006-07 for Rs. 8,500.(ii) Provision for tax made during the year was Rs. 9,000.(iii) During the year, part of the fixed assets costing Rs. 10,000 was sold for Rs. 12,000 and
the profit was included in the Profit and Loss Account.(iv) Dividends paid during the year amounted to Rs. 40,000You are required to prepare a Cash Flow Statement.
Solution :
CASH FLOW STATEMENT
for the year ended 31st March, 2007
Particulars Rs.
(A) Cash Flow from Operating Activities :Closing Balance as per P & L A/c (31.3.2007) 68,000
Less : Opening Balance of Profit and Loss A/c (31.3.2006) 56,00012,000
Add : Appropriation of Fund :Interim Dividend 40,000Provision for Tax 9,000Transfer to Reserve 10,000 59,000Net Profit before tax and extraordinary items 71,000
Add:Non Operating Expenses : 70,000Depreciation (Note 1)
Less : Non Operating Incomes : (500)Profit on Sale of Investments (2,000) 67,500
Operating Profit before Working Capital Changes 1,38,500Add : Decrease in Current Assets and Increase in Current Liabilities :
Decrease in Stock (Rs. 2,40,000 – Rs. 2,10,000) 30,000Less : Increase in Current Assets and decrease in Current Liabilities :
Increase in Debtors (Rs. 4,55,000 – Rs. 2,10,000) (2,45,000)
Decrease in Creditors (Rs. 1,68,000 – Rs. 1,34,000) (34,000) (2,79,000)
Cash Generated from Operations (1,10,500)Less : Income tax Paid (74,000)
Net Cash used in Operating Activities (A) (1,84,500)(B) Cash Flow from Investing Activities
Purchase of Investment (18,000)Sale of Fixed Assets 12,000Sale of Investments 8,500Net Cash from Investing Activities (B) 2,500
(C) Cash Flow from Financing Activities Mortgage Loan 2,70,000Dividend Paid (40,000)
67

Net Cash from Financing Activities (C) (2,30,000)(D) Net Increase in Cash and Cash Equivalents (A+B+C) 48,000 (E) Cash and Cash Equivalents at the beginning of the year 1,49,000(F) Cash and Cash Equivalents at the end of the year 1,97,000
Working Notes : 1 Dr. Fixed Assets Account Cr.
Particulars Rs. Particulars Rs.
To Balance b/d 4,00,000 By Bank A/c 12,000To Profit and Loss A/c 2,000 By Depreciation A/c (Bal. Fig.) 70,000
(Profit on Sale) By Balance c/d 3,20,000
4,02,0004,02,000
2 Dr. Investment Account Cr.
Particulars Rs. Particulars Rs.
To Balance b/d 4,00,000 By Bank A/c 8,500To Profit and Loss A/c (Profit) 2,000 By Depreciation A/c (Bal. Fig.) 60,000To Bank A/c (Balance Fig.) 18,500
68,50068,500
3 Dr. Investment Account Cr.
Particulars Rs. Particulars Rs.
To Bank A/c (Balancing Fig.) 4,00,000 By Balance b/d 75,000To Balance c/d 2,000 By Profit and Loss A/c To 18,500 (Provision Made) 9,000
84,00084,500
Net Profit or Drawings : Sometimes in the case of a sole trader or a partnership firm, capital of the proprietor or partners is given but the amount of drawings or net profits made may be missing. The capital account may be prepared to find the net profits or drawings.
68
Profit = Capital at the end + Drawings – Capital at the beginning
Drawings = Capital at the beginning + Profit – Capital at the end

Illustration 17. The summarized Balance Sheets of XYZ Ltd. as on 31st March, 2006 and 2007 are given below :- Dr. Cr.
Liabilities 2006 2007 Assets 2006 2007Rs. Rs. Rs. Rs.
Creditors 40,000 44,000 Fixed Assets 10,000 7,000Mrs. A’s Loan 25,000 … Debtors 30,000 50,000Loan from Bank 40,000 50,000 Stock 35,000 25,000Capital of A and B 1,25,000 1,53,000 Machinery 80,000 55,000
Land 40,000 50,000Buildings 35,000 60,000
2.30,000 2,47,000 2,30,000 2,47,000
During the year, a machine costing Rs. 10,000 (accumulated depreciation Rs. 3,000) was sold for Rs. 5,000. The provision for depreciation against machinery as on March 31,2006 and March 31, 2007 was of Rs. 25,000 and Rs. 40,000 respectively.
The Net Profits for the year amounted to Rs. 45,000. You are required to prepare the Cash Flow Statement.
Solution :
CASH FLOW STATEMENT
for the year ended 31st March, 2007
Particulars Rs.
(A) Cash Flow from Operating ActivitiesNet Profit before Tax 45,000
Add : Non Operating Expenses :Depreciation (See Note 3) 18,000Loss on Sale of Machinery (See Note 4) 2,000 20,000
Operating Profit before Working Capital Changes 65,000Add : Decrease in Current Asset or Increase in Current Liabilities:
Decrease in Stock 10,000Increase in Creditors 4,000 14,000
79,000Less : Increase in Current Asset or Decrease in Current Liabilities
Increase in Debtors 20,000Net Cash from Operating Activities 59,000
(B) Cash Flow from Investing ActivitiesPurchase of Land (10,000)Purchase of Buildings (25,000)Proceeds from Sale of Machinery 25,000Net cash used in Investing activities (30,000)
(C ) Cash Flow from Financing ActivitiesProceeds of Loan from Bank 10,000Payment of Mrs. A’s Loan (25,000)Drawings (Note 1) (17,000) (32,000)
69

Net Cash used in Financing Activities(D) Net Decrease in Cash and Cash Equivalents (A+B+C) (3,000)(E) Cash and cash equivalents at the beginning of the period (10,000)(F) Cash and cash equivalents at the end of the period 7,000
Notes :Drawings = Opening Capital of A and B + Net Profits – Closing Capital of A and B = Rs. 1,25,000 + Rs. 45,000 – Rs. 1,53,000 = Rs. 17,000
2 Dr. Machinery Account Cr.
Particulars Rs. Particulars Rs.
To Balance b/d 1,05,000 By Cash A/c 5,000(Rs. 80,000+Rs. 25,000) By Provision for Depreciation 3,000
By Profit and Loss A/c – 2,000Loss on Sale (Note 4) 95,000
1,05,000 1,05,000
*Sometimes, fixed assets are shown at the written down value (after deducting depreciation) in the balance sheet and the accumulated depreciation is given in the additional information (as in the present illustration). In such a case, the opening and closing balances in the respective Fixed Assets account will be the total amount of book value shown in the balance sheet plus balance of the accumulated depreciation provided in additional information.
3 Dr. Provision for Depreciation Account Cr.
Particulars Rs. Particulars Rs.
To Depreciation on Machinery Sold 3,000 By Balance A/c 25,000To Balance c/d 40,000 By Depreciation provided (Balancing Figure) 18,000
43,000 43,000
4. Loss on Sale of Machinery = Cost – Accumulated Depreciation – Selling Price = Rs. 10,000 – Rs. 3,000 – Rs. 3,000 – Rs. 5,000 = Rs.2,000
Illustration 18. From the following Balance Sheets of M/s Gupta & Co., prepare the Cash Flow Statement for the year ended March 31 :
Liabilities 2006 2007 Assets 2006 2007Rs. Rs. Rs. Rs.
Creditors 20,000 22,000 Cash 8,000 22,000Outstanding Expenses 5,000 1,000 Debtors 15,000 11,000Loan from X 10,000 5,000 Bills Receivable 5,000 …
70

Capital 1,08,000 1,68,000 Stock 20,000 28,000Fixed Assets 95,000 1,35,000
2.30,000 2,47,000 2,30,000 2,47,000
During the year, the proprietor introduced Rs. 20,000 as additional capital. The net profits for the year, after charging Rs. 5,000 as depreciation on fixed assets, were Rs. 50,000.
Solution :
CASH FLOW STATEMENT
for the year ended 31st March, 2007
Particulars Rs.
(A) Cash Flow from Operating ActivitiesNet Profit before Tax 50,000
Non-Op. Expenses :Depreciation 5,000Operating profit before Working Capital Changes 55,000
Add : Decrease in Current Assets & increase in Current Liabilities :Debtors 4,000Bills Receivables 5,000 Creditors 2,000 11,000
66,000
Less : Increase in Current Assets & decrease in current liabilities:Stock 8,000 Outstanding Expenses 4,000 12,000Net Cash from Operating Activities 54,000
(B) Cash Flow from Investing ActivitiesFixed Assets Purchased (See Working Note 2) Net Cash used in Investing Activities (45,000)
(C) Cash Flow from Financing Activities Repayment of Loan from X (5,000) Additional Capital Introduced 20,000 Drawing (See Working Note-1) (10,000)Net Cash used in Financing Activities 5,000
(D) Net Increase in Cash and Cash Equivalents (A+B+C) (14,000)
71

(E) Cash Balance on April 1, 2006 (8,000)(F) Cash Balance on March, 31, 2007 22,000
Working Notes :
1 Dr. CAPITAL ACCOUNT Cr.
Particulars Rs. Particulars Rs.
To Cash A/c 10,000 By Balance b/d 1,08,000(Rs. 80,000+Rs. 25,000) By Cash A/c
(Additional Capital)By Profit and Loss A/c 50,000Loss on Sale (Note 4) 95,000
1,78,000 (Net Profit) 1,78,000
2 Dr. FIXED ACCOUNT Cr.
Particulars Rs. Particulars Rs.
To Balance b/d 95,000 By Depreciation 5,000To Bank A/c By Balance c/d 1,35,000
(Purchase – Balancing Figure) 45,000
1.40,000 1,40,000
Terms introduced in the chapter
1. Financial Statements
2. Profit and loss Account
3. Balance Sheet
4. Preliminary expense
5. Share Capital
6. Contingent liabilities
7. Proposed dividend
8. Provision for taxation
9. Ratio Analysis
10. Liquidity ratios
11. Solvency ratios
12. Turnover ratios
13. Profitability ratios
14. Return on investment
15. Quick Assets
16. Receivables
17. Earning per share
18. Dividend payout
19. Cash Flow
72

20. Liquidity
21. Cash Equivalent
22. Investing Activities
23. Extraordinary
24. Accounting
25. Solvency
26. Operating Activities
27. Financing Activities
28. Appropriation
Summary
Financial Statements: Financial statements are the basic and formal annual reports through which the corporate management communicates financial information to its owners and various other external parties which include-investors, tax authorities, government, employees, etc. There are two main financial statements. They are: (1) balance sheets; (2) income statements.
Balance sheet: The Balance Sheet shows what a company owns and what it owes at a fixed point in time.
Income statement: The Income Statement shows how much money a company made and spent over a period of time.
Users of financial statements: These include investors and potential investors; lenders/long term creditors; management; suppliers/short term creditors; employees and trade unions; government and its agencies; stock exchange and its customers
Ratio Analysis is the relationship between two items of financial data expressed in the form of ratios and then interpreted with a view to evaluating the financial condition and performance of a firm.
Objectives of Ratio Analysis
The analysis would enable the calculation of not only the present earning capacity of the business but would also help in the estimation of the future earning capacity. The analysis would help the management to find out the overall as well as the department-wise efficiency of the firm on the basis of the available financial information. The short term as well as the long term solvency of the firm can be determined w3ith the help of ratio analysis. Inter-firm comparison becomes easy with the help of ratios.
73

Advantages of Ratio Analysis
Ratio Analysis simplifies Financial Statements, facilitates inter-firm comparison; makes intra-firm comparison possible and helps in forecasting
Limitations of Ratio Analysis
Ratio Analysis is historical in nature; changes in price level often make comparison of figures of the previous years difficult. It is not free from bias. Some companies, in order to cover up their bad financial position report to window dressing. Ratio Analysis ignores qualitative factors and different accounting practices render ratios incomparable
Types of Ratios
Financial ratios can be classified into four important categories:1. Liquidity Ratios: Liquidity ratios help the users in knowing the extent of short-
term debt paying ability of a firm. They include current ratio and quick ratio.2. Solvency Ratios: Solvency ratios analyse the long-term debt paying capacity of
the firm. They include Debt equity ratio; Total Assets to Debt Ratio; Proprietary ratio and Interest Coverage Ratio.
3. Activity or Turnover Ratios: Activity ratios help in commenting on the efficiency of the firm in managing it assets. The speed with which assets are converted into sales is captured by activity ratios. These include Stock Turnover; Debtors (Receivable) Turnover; Creditors (Payable) Turnover; Fixed Assets Turnover and Working Capital Turnover.
4. Profitability Ratios: Profitability ratios are calculated to measure the profitability of a business enterprise. These include Gross Profit Ratio; Net profit Ratio; Operating Ratio; Operating Profit ratio; return on Investment (ROI); Earnings per Share; Price Earning Ratio and Dividend payout ratio
RATIOS AT A GLANCE
Ratio Formulae1. Current ratio
Current assetsCurrent liabilities
2. Quick ratioQuick assetsCurrent liabilities
3. Inventory turnover ratioCost of goods soldAverage inventory
4. Debtors (receivables) turnover ratioAnnual Net credit salesAverage accounts receivables
5. Debt (receivables) collection period 365 days/52 weeks/ 12 monthsDebtors turnover ratio
74

6 Creditors turnover ratioNet Credit Purchase Average Creditor Net
7. Average Credit Payment period 365 days/52 weeks/ 12 months
Creditor turnover ratio8. working capital Turnover Net Sale
working Capital
9. Fixed Asset Turnover ratio Net sale or cost of sale Net fixed assets
10. Current assets turnover ratio Net salesCurrent assets
11. Debt- equity ratio Total long term debt Shareholders’ funds
12. Total assets to debts Total assetsLong term debts
13. Proprietary ratioShareholders Funds
Total assets14. Gross Profit ratio Gross Profit/Net Sales × 100
15. Net Profit Ratio Net profit / Net Sales × 100
16. Operating ratio Operating cost X 100Net sales
17. Operating profit ratio Operating profit X 100Net sales
18. Return on capital employed (ROI) Net profit before interest, tax & dividend X 100Capital employed
19. Earnings per share (EPS) Net income after interest,tax and preference dividend X 100 Number of equity shares
20. Dividends per share Dividends amountNumbers of equity share
21. Price earning ratio Market price of shareEPC
22. Dividend payout ratio Dividend per shareEarning per share
Meaning of cash flow statement : It is a statement which is prepared to show the flow of cash in a business undertaking.
OBJECTIVES :
(i) helpful in making financial policies
(ii) helpful in decision making to declare dividend.
(iii) CFS is different than each Budget.
(iv) Helpful in devising the each question.
(v) helpful in telling reasons for difference between profit and loss
USES :
(i) helps in making short short term planning
75

(ii) helps understanding liquidity & solvency.
(iii) helps in comparative study.
(iv) tests for management decision
LIMITATION :
1. Non each transaction are ignored.
2. Not suitable for an income statement
3. Historical in nature.
Operating Activities : Operating activities are the principal revenue-producing activities of the enterprise and other activities that are not investing or financing activities.
Investing Activities : Investing activities are the acquisition and disposal of long-term assets and other investments not included in cash equivalents.
Financing Activities : Financing activities are the activities that result in change in the size and composition of the owners’ capital (including preference) share capital in the case of a company) and borrowing of the enterprise.
Very Short and short Answer Questions1. State whether the following statements are true or false.
(a) Provision is the amount set aside or written off for any known liability.(b) Unclaimed dividend is shown on the assets side of the balance sheet of the
company.( c) Preliminary expense is a current liability.(d) In the balance sheet of a company the items goodwill, patents and trade
marks are shown under the heading fixed assets.(e) Discount allowed on the issue of shares or debentures is shown in the assets
side of the balance sheet.(f) Debentures are shown in the balance sheet under the item unsecured loans.(g) Share forfeiture account is shown in the balance sheet under share capital
account.(h) Unclaimed dividend is shown in the balance sheet under the item current
liabilities.(i) Securities premium account is shown on the liability side of the balance sheet
under the heading share capital.[Ans. (a) True (b) False (c) False (d) True (e) True (f) False (g) True (h) True (i) False]
2. Indicate whether following items belong to the asset side or the liability side of the balance sheet of a company.
(a) Calls unpaid.(b) Preliminary expenses( c) Capital redemption reserve(d) Acceptances(e) Proposed dividend(f) Unexpired payments
[Ans. (a) Liability (b) Asset (c) Liability (d) Liability (e) Liability (f) Asset ]
3. What is the contingent liability? Where it is shown in the Balance sheet? Give three examples of contingent liabilities.
76

4. How would you disclose the following items in the balance sheet of a limited company:-
(i) Loose tools (ii) Stock (iii) Goodwill (iv) Discount on issue of debentures not yet written of (v) Securities premium.
5. Re-arrange the following assets in the proper order as per schedule VI Part I of Companies Act 1956.
Loans and advancesMiscellaneous expenditureCurrent assetsInvestmentsFixed assets
6. Correct the order of assets and liabilities according to the provision of schedule VI part I.
Liabilities AssetsSubscribed capital Loans and advancesUnsecured loans miscellaneous expenditureProvisions Current assetsSecured loans InvestmentsReserve and surplus Fixed assetsCurrent liabilities
7. Point out whether following statement are true or false?a)Current ratio improves increases in credit purchases.b)Liquidity ratio improves with increase in credit sale.c) Working capital is the excess of current assets over current liability.d)Current ratio measures the liquidity of the business.e)Debt equity ratio measures short term financial position of the business
Ans- A) False b) True c) True d) True e) false
8. Assuming the current ratio is 2 , state in each of the following cases whether the ratio will improve or decline or will have no change.
a. Payment of a current liabilityb.Purchase of fixed assets c. Cash collected from customersd.Issue of new share
Ans- A) improve b) decline c) No change d) Improve
9. The current ratio of a company is 25: 1. Which of the following suggestion would improve , reduce or not change it?
i) Payment to trade creditorsii) Sale of machinery for cashiii) Purchase of goodsiv) Issue of equity share
Ans- A) improve b) improve c) No change d) Improve
10. What are the category under which the various ratios are grouped?11. What does debt- equity ratio indicates?12. What is stock – turnover ratio, how it is calculated? What are the implications of
high and low stock turn over ratio?13. State the meaning and objective of the following- a) Proprietary ratio b) Operating ratio
77

14. What do you mean by the interest coverage ratio? Explain in brief, giving its formula?
15. State the significance and method of calculating the following-a.Current ratiob.Operating ratioc. Return on investment ratio(ROI)
16. What are the different names of activity ratios? Name five activity ratios.17. Describe three ratio based upon sales.18. Explain in about 50 words the importance of the following ratios-
a.proprietary ratiob.Debt equity ratio
19. Give the method of computing and the purpose of the following ratios-a. Acid Test ratiob.Inventory turnover ratioc. Debt equity ratiod.Return on investment ratio
20. What will be the impact of following suggestions on the debt equity ratio, assuming the given ratio to be 1:2?
a. Issue of equity sharesb.Cash received from debtorsc. Redemption of debenturesd.Purchase of goods on credit.
Ans- A) Decrease b) No change c) decrease d) No change
ESSAY TYPE QUESTIONS
1. What is Cash Flow Statement? How it is prepared? What are its uses?
2. What is Cash Flow Statement? Give three items of sources (inflow) of cash.
3. Explain the uses of cash Flow Statement.
4. Enumerate any three major sources of cash in flow.
5. What is meant by Cash Flow Statement? Explain briefly how the statement is prepared as per AS-3 (revised).
6. Explain the term ‘Cash Flow’. Give three items of uses (outflow) of cash.
7. Enumerate the various steps involved in the preparation of ‘Cash Flow Statement’.
21. For calculating ‘cash flow from operating activities from the given figure of Net Profit earned during a year, how would you deal with increase in Debtors, Decrease in Stock, Decrease in Bills Payable and Increase in Creditors.
22. For calculating Cash Flow from operating Activities’ from a given figure of ‘Net Profits’ earned during a year, how would you deal with the decrease in preliminary expenses, decrease in prepaid expenses, increase in inventory and increase in Bills Payable?
23. Explain the impact of increase in debtors, decrease in inventories, increase in creditors and decrease in bills payable on the computation of cash flow operating activities.
78

24. For calculating cash flow from operating activities from a given figure of Net Profit earned during a year, how will you deal with the redemption of debentures, decrease in outstanding expenses, increase in cash balance and decrease in inventories, decrease in Bills Payable, increase in creditors and increase in debtors.
PRACTICAL QUESTIONS
1. The following figures are extracted from the books of ABC Co. Draw up the Liabilities side according to law.
Rs.30,000 shares of Rs. 10 each, Rs. 8 paid up 2,40,000Securities Premium 20,000Reserves 35,000Creditors 45,000Fixed deposits 25,000
2. The following balances appeared in the books of Utsav Publications Ltd.
Rs.Goodwill 2,00,000Plant & Machinery 1,60,000Building 1,45,000Cash in hand 10,000Stock in trade 50,00010,000 shares of Rs. 10 each, Rs. 8 paid up 80,0009% debentures 2,50,000
Preliminary expenses 10,000Creditor 50,000Dividend Payable 25,000Prepare balance sheet of company as per the Performa given as per Schedule VI Part I of the Companies Act 1956.
3. The following ledger balances were extracted from the books of Akash Ltd. on 31st
March, 2007:-
79

Land and Buildings 2,00,000; 12% Debentures Rs.2,00,000; Shares Capital Rs.1,00,000; Equity Shares of Rs.12each fully paid up; Plant and Machinery Rs.8,00,000; Goodwill Rs.2,00,000; Investments in shares of Raja Ltd. Rs.2,00,000; General reserve Rs.2,00,000; Stock in trade Rs.1,00,000; Bills Receivable Rs.50,000; Debtors Rs.1,50,000; Creditors Rs.1,00,000; Bank Loan (Unsecured) Rs. 1,00,000; Provision for taxation Rs.50,000; Discount on issue of 12% debentures Rs.5,000; Proposed dividend Rs.55,000.You are required to prepare the balance sheet of the company as per schedule VI Part I of the companies Act, 1956.
4. Manu Ltd. has an authorized capital of Rs.50,00,000 divided into equity shares of Rs.10 each. The company invited applications for 3,00,000 shares. Applications for 2,75,000 shares were received. All calls were made and were duly received except the final call of Rs.3 per share on 5,000 shares. 4,000 of the shares on which the final call was not received were forfeited. Show how share capital will appear in the Balance sheet of the company as per schedule VI part I of the companies act 1956?
5. The following balances have been extracted from the books of Rishi Ltd. on 31.3.1996; Share capital Rs.10,00,000, securities premium Rs.1,00,000, 12% debentures Rs.5,00,000, creditors Rs.2, 00,000, proposed dividend Rs.50,000, profit and loss account (Dr) Rs.50,000, discount on issue of 12% debentures Rs. 1,00,000. Prepare the balance sheet of the company as per schedule VI part I of the companies act 1956.
6. The following balances are supplied on the basis of which you are required to show the major appropriate heads under which the items given below will appear in the balance sheet of Rajco Ltd. as on 31st March 2007:
Rs.Plant & Machinery 5,60,000Building 10,00,000Equity share capital (Authorised) 20,00,000Equity share of Rs.100 each Rs.70 called and paid up 14,00,00010% debentures 55,000Discount on Issue of 10% debentures 5,000Furniture and fixtures 15,000Long Term Bank Loan (secured) 1,25,000
7. Prepare a balance sheet of Vikas Ltd. as on March 31, 2007 as per provisions of Part-I, Schedule VI, Under section 211 of the companies Act 1956 from the following information.
Rs.General reserve 3,000Debentures 3,000Profit & Loss A/c (Cr.) 1,200Depreciation on Fixed Assets 700Gross Fixed Assets 9,000Current Liabilities 2,500Preliminary Expenses 300Preference Share Capital 5,000Current Assets 6,100
8. The following figures were extracted from the trial balance of XYZ Ltd.:
80

Share Capital: 10,000 Equity Shares of Rs.10 each fully called up and paid up.Rs.
Securities Premium 10,00012% debentures 50,000Fixed Deposits (Cr.) 25,000Creditors 5,000
You are required to draw up the liabilities side of the balance sheet of the company according to the requirements of the companies act.
9. The following balances appear in the books of Ruia Publications Ltd.:
Rs.Goodwill 20,000Plant & Machinery 1,60,000Building 1,45,000Cash at hand 10,000Stock in trade 70,000Share capital: 1,000 equity shares of Rs.100
each issued at Par, Rs.80 per share called up and paid up 80,0008% debentures 2,50,000
Preliminary expenses 5,000Creditor 55,000Dividend Payable 25,000
Showing the above items under the major; heads in accordance with Part I of Schedule VI of the Companies Act 1956, prepare a balance sheet of the company.
10. Find out current ratio.Gross Debtors Rs. 20,000; Provision for Bad debts Rs. 3,000; Bills receivable Rs. 13,000; Stock twice of net debtors; Cash in hand Rs. 16,000; Advance to suppliers Rs. 15,000; Creditors for goods Rs. 27,000; Bills payable Rs. 8,000; Outstanding expenses Rs. 15,000; Prepaid expenses Rs. 5,000 Investment (Long term) Rs. 12,000;[Ans. Current Ratio 2:1]
11. Find out current liabilities when current ration is 2.5:1 and current assets are Rs. 75,000.[Ans. Current Liabilities Rs. 30,000]
12. The ratio of current assets (Rs. 6,00,000) to current liabilities is 1.5:1. The accountant of this firm is interested in maintaining a current ratio of 2:1 by paying some part of current liabilities. You are required to suggest him the amount of current liabilities which must be paid for this purpose.
[Ans. Rs. 2,00,000]
13. A firm had current liabilities of Rs. 90,000. It then acquired stock-in-trade at a cost of Rs. 10,000 on credit. After this acquisition the current ratio was 2:1. Determine the size of current assets and working capital after and before the stock was acquired.[Ans. C.A. Rs. 2,00,000, Rs. 1,90,000; W.C. Rs. 1,00,000, Rs. 1,00,000]
14. A Ltd. company has a current ratio of 3.5:1 and acid test ratio of 2:1. If the inventory is Rs. 30,000, find out its total current assets and total current liabilities.[Ans. Current Assets Rs. 70,000; Current Liabilities Rs. 20,000]
15. Given: Current ratio 2.8; Acid test ratio 1.5; Working capital = Rs. 1,62,000.
81

Find out: Current assets;, Current liabilities; Liquid Assets.[Ans. A) Rs. 2,52,000; (b) Rs. 90,000; (c) 1,35,000]
16. From the following, calculate Debt-Equity Ratio.Equity share capital Rs. 1,50,000. Preference Share capital Rs. 50,000, General reserves Rs. 1,00,000, Accumulated profits Rs. 60,000, Debentures Rs. 1,50,000. Sundry creditors Rs. 80,000, Expenses payable Rs. 20,000. Preliminary Expenses not yet written off Rs. 10,000.[3 :7]
17. Calculate Debt Equity Ratio from the Balance Sheet of X Ltd. as on 31 st March 2007
Liabilities Rs. Assets Rs.Equity shares of Rs. 10 each11% preference share capitalSecurities premium accountGeneral reserveProfit and Loss account12% Debentures of Rs. 100 eachBills payableTrade creditorsOutstanding ExpensesProvision for tax
8,00,0004,00,000
80,0005,80,0001,40,000
10,00,00080,000
1,40,00060,000
2,20,000
Land and BuildingsPlant and MachineryFurniture and fittingsStock Trade debtorsCash in handCash at bankBills receivable
6,20,00012,00,000
1,80,0005,30,0004,70,000
65,0003,00,0001,35,000
35,00,000 35,00,000
[Ans. 1 :2]
18. From the following calculate debt-equity ratio:
Rs.Preference share capital 2,00,000Equity share capital 4,00,000Capital reserves 1,00,000Profit & Loss account 1,00,00014% Debentures 2,00,000Unsecured loans 1,00,000Creditors 40,000Bills payable 20,000Provision for taxation 10,000Provision for dividends 20,000 [Ans. 0.375 : 1]
19. The debt-equity ratio of a company is 1:2. Which of the following suggestions would (i) increase, (ii) decrease, and (iii) not change it.
a) Issue of equity shares,b) Cash received from debtorsc) Redemption of debentures for cash,d) Purchased goods on credit,e) Redemption of debentures by conversion into shares,f) Issue of shares against the purchase of a fixed asset,g) Issue of debentures against the purchase of a fixed asset.[Ans.(a) (ii), (b) (iii), (c) (ii), (d) (iii), (e) (ii), (f) (ii), (g) (i)]
82

20. Debtors in the beginning Rs. 90,000; debtors at the end Rs. 96,000 credit sales during the year Rs. 4,65,000. calculate debtors turnover ration.
[Ans. 5 times]
21. Rs. 1,75,000 is the net credit sales of a concern during 1989. If debtors turnover is 8 times, calculate debtors in the beginning and at the end of the year. Debtors at the end is Rs. 7,000 more than at the beginning.
[Ans. Rs. 18,375 and Rs. 25, 375]
22. From the following figures, compute the debtors turnover ratio:Year I Year II Rs. Rs.
Gross sales 9,50,000 8,00,000Sales returns 50,000 50,000Debtors in the beginning of year 86,000 1,17,000Debtors at the end 1,17,000 86,000Provision for doubtful debts 7,000 6,000
[Ans. 1 year 8,87 times II year 7.39 times]
23. Opening stock Rs. 76,250; Closing Stock Rs. 98,500; Sales Rs. 5,20,000; Sales Returns Rs. 20,000; Purchases Rs. 3,22,250. Calculate stock turnover ratio.
[Ans. 3.43 times]
24. Average stock carried by a trader is Rs. 60,000 stock turnover ratio is 10 times. Goods are sold at a profit of 10% on cost. Find out the profit.
[Ans. Profit Rs. 60,000]
25. If inventory turnover ratio is 5 times and average stock at cost is Rs. 75,000, find out cost of goods sold.
[Ans. 3,75,000]
26. You are given the following data.Gross profit at 30% on sales = Rs. 60,000Stock turnover = 7 timesThe opening stock is 5,000 less then the closing stock.
Accounts payable (opening) Rs. 30,000; Accounts payable (closing) Rs. 38,000.Find out (a) Net purchases (b) Accounts payable turnover (c) Average age of
creditors.[Ans. (a) Rs. 1,45,000; (b) 4.26 times (c) 85.6 days]
27. From the following information, calculate creditors at the beginning of the year:
Rs.Total purchases 22,00,000Cash purchases (included in above) 10,00,000Creditors turnover ratio-4 times creditor 2,50,000
[Ans. 3,50,000]
28. Calculate working capital turnover ratio from the following data:
83

Rs.Cost of goods sold 1,50,000Current assets 1,00,000Current liabilities 75,000
[Ans. 6 times]
29. From the following, compute working capital turnover;Rs.
Sales 25,20,000Current assets 15,60,000Current liabilities 6,00,000
[Ans. 2.6 times]
30. Find out the working capital turnover ratio:Rs.
Cash 10,000Bills receivable 5,000Sundry debtors 25,000Stock 20,000Sundry creditors 30,000Cost of sales 1,50,000
[Ans. 5 times]
31. Capital employed Rs. 1,00,000, Working capital Rs. 20,000, Cost of goods sold Rs. 3,20,000, Gross profit Rs. 80,000. Calculate fixed assets turnover ratio assuming that there were no long-term investments.
[Ans. 5 times]
32. Calculate Gross Profit ratio:
Sales 1,60,000 Purchases 90,000Sales return 10,000 Purchases returns 10,000Opening stock 30,000 Closing Stock 10,000
[Ans. 33 1/3 %]
33. From the following details calculate the operating ratio:
(a) Rs.Cost of goods sold 5,20,000Operating expenses 1,80,000Net sales 8,00,000
(b)Cost of goods sold 8,00,000Operating expenses 40,000Sales 10,50,000Sales return 50,000(c)Sales less Return 1,00,000
84

Gross Profit 40,000Administrative expenses 10,000Selling expenses 10,000Income from Investments 5,000Loss due to fire 3,000
(d) Trading and Profit & Loss Account for the year ended 31st December,2007
Particulars Rs. Particulars Rs.To stock 1.4.93To PurchaseTo WagesTo gross profit
35,0002,25,000 6,0001,84,000
By SalesBy Stock at end
4,00,000 50,000
4,50,000 4,50,000To administrative exp.To selling & distribution exp.To loss on sale of plantTo net profit
10,000 14,000 10,0001,50,000
By Gross Profit 1,84,000
1,84,000 1,84,000
(Ans. (a) 87.5% (b) 84% (c) 80% (d) 60%)
34. Opening stock Rs. 80,000; Purchase Rs 4,30,900; Direct expenses Rs 4,000; Closing stock Rs. 1,60,000; Administrative expenses Rs 21,100; Selling and distribution expenses Rs 40,000; Sales Rs 10,00,000 Calculate :(a) Gross Profit ratio(b) Operating ratio
(Ans. Gross Profit ratio = 64.52%, Operating ratio = 41.6%)
35.From the following information, calculate stock turnover ratio, operating ratio and capital turnover ratio.
Rs.Opening Stock 28,000Closing Stock 22,000Purchases 46,000Sales 90,000Sales return 10,000Carriage inwards 4,000Office expenses 4,000Selling and distribution expenses 2,000Capital employed 2,00,000
( Ans. (a) 2.24 times (b) 77.5% (c) .4 times)
36. Calculate the following ratios, from the details given as under :(a) Current ratio
85

(b) Acid test ratio(c) Operating ratio(d) Gross profit ratio
Rs.Liquid assets 40,000Current liabilities 20,000Stock 10,000Sales 50,000Operating expenses 15,000Cost of goods sold 20,000
(Ans. (i) 5:2 (ii) 2:1 (iii) 70% (iv) 60%)
37. Balance sheet of ‘A’ Ltd. is given below :
Liabilities Amount(Rs.) Assets Amount(Rs.)Paid up equityShare capital :15% debenturesP&L a/c( for the currentEar after taxes)General reserveCurrent liabilities
4,00,000 2,00,000
3,00,000 3,00,000 5,80,000
BuildingMachineryDebtorsStockBank
6,00,000 1,20,000 6,50,000 3,50,000 60,000
17,80,000 17,80,000
Additional Information:Net sales for the current year Rs. 57,60,000Compute any three of the following ratios:(a) Net profit ratio(b) Fixed assets turnover ratio,(c) Debt equity ratio(Ans. Net profit ratio 5.21(Approx), Current ratio 1.83 :1, Fixed asset turnover ratio 8 times, Debt lequity ratio 1:5)
38. From the following information calculate any three of the following ratios:(a) Gross Profit ratio(b) Working capital turnover ratio (c) Debt-equity ratio(d) Proprietary ratioInformation:Net sales Rs 5,00,000; Cost of goods sold Rs. 3,00,000; Current assets Rs. 2,00,000; Current liabilities Rs. 1,40,000; paid up share capital Rs. 2,50,000; 13% Debentures Rs 1,00,000.(Ans. G.P. Ratio 40%; Working Capital T.O. Ratio 8.83 times; Debt Equity Ratio 40%; Proprietary Ratio 51%)
39. From the following information, calculate the stock turnover ratio and the gross profit ratio.
Rs.Opening stock 18,000Closing stock 22,000Purchases 46,000Wages 14,000Sales 80,000Carriage inwards 4,000
86

[Ans. Gross profit ratio 25%; stock turnover ratio 3 times]
40. A company has a loan of Rs. 50,00,000 as part of its capital employed. The interest payable on the loan is 10% and the R.O.I. of the company is 15%. Assuming that the rate of income tax is 50%, calculate the amount of gain to the shareholders’ because of the loan obtained by the company.[Ans. Gian to shareholders Rs. 1,25,000]
41. Calculate any three of the following ratios with the help of the information given below:-
a) Operating ratiob) Gross profit ratioc) Quick ratiod) Working capital turnover ratioe) Proprietary ratio
Information:Equity share capital Rs. 1,00,000; 8% preference share capital Rs. 80,000; 9% debentures Rs. 60,000; General Reserve Rs. 10,000; Sales Rs. 2,00,000; Opening stock Rs. 12,000; Purchases Rs. 1,20,000; Wages Rs. 8,000; Closing Stock Rs. 18,000; selling and distribution expenses Rs. 2,000; other current assets Rs. 50,000, fixed assets Rs. 2,12,000 and current liabilities Rs. 30,000[(a) 62%; (b) 39%; (c) 1.67:1; 9d) 3.21 times; (e) 67.86 %]
42. The following is the Balance Sheet of Vinod Mills Ltd. as on 31st December, 2006:
Rs.Sundry CreditorsBills payableTax provisionOutstanding expenses12% Debentures10% Preference share capitalEquity share capitalReserve Fund
60,0001,00,0001,30,000
10,0007,00,0001,00,0005,00,0004,00,000
BankTrade investmentsBook Debts (Debtors)StockFixed Assets 18,00,000Less: Depreciation 5,00,000
50,0001,50,0002,00,0003,00,000
13,00,000
20,00,000 20,00,000 Other information supplied is as follows
Rs.Net sales 30,00,000Cost of goods sold 25,80,000Operating expenses 2,20,000
(a) Quick ratio; (b) Total assets to debt ratio; (c) Current ratio; (d) Gross profit ratio; (e) Operating ratio (f) Net profit ratio.
[Ans. (a) 1.33:1, (b) 2.86:1; (c) 2.33:1; (d) 14%; (e) 93.33%; (f) 6.67%]
43. From the following information, calculate stock turnover ratio, operating ratio; fixed assets turnover ratio and current assets turnover ratio:-
Rs.
87

Opening stock 56,000
Closing stock 44,000
Purchases 92,000
Sales 1,80,000
Sales returns 20,000
Carriage inwards 8,000
Office Expenses 8,000
Selling & Distribution Expenses 4,000
Fixed assets 70,000
Current assets 60,000
[Ans. Stock Turnover Ratio 2.24 times; Operating Ratio 77.5%, Fixed assets Turnover Ratio 1.6 times, Current Assets turnover ratio 1.87 times]
44 From the following data, calculate:-a) Gross profit ratio,b)Net profit ratioc) Working capital turnover ratio,d)Debt-equity ratio,e) Proprietary ratio
Rs. Net sales 30,00,000
Cost of sales 20,00,000Net profit 3,00,000Fixed assets 6,50,000Current assets 6,00,000Current liabilities 2,00,000Paid-up share capital 5,00,000Debentures 2,50,000
[Ans. G.P. ratio= 33 1/3%; N.P. Ratio=10%; Working capital turnover ratio= 5 times; Debt equity ratio=0.31:1, Proprietary ratio i.e. shareholder’s funds/total assets = 64%]
45. With the help of the given information, calculate any three of the following ratios:
(a) Operating ratio(b) Quick ratio(c) Working capital turnover ratio(d) Debt equity ratio.
Information: Equity share capital Rs. 50,000; 12% preference share capital Rs. 40,000; 12% debentures Rs. 30,000; General Reserve Rs. 40,000; Sales Rs. 3,00,000; Opening stock Rs. 20,000; Purchases Rs. 1,40,000; Wages Rs. 30,000; Closing stock Rs. 40,000; Selling and distribution expenses Rs. 18,000; Other Current assets Rs. 1,00,000 and current liabilities Rs. 60,000.
88

[Ans. (a) 56%; (b) 1.67:1; (c) 1.875 times; (d) 0.23.1
OBJECTIVE TYPE QUESTIONS
I. Indicate whether increase in debtors / current assets results in :(i) Increase in cash(ii) Decrease in cash(iii) Non of the above.
II. Indicate whether increase in current liabilities results in :(i) Increase in cash(ii) Decrease in cash(iii) None of the above.
III. State whether the following would result in inflow or outflow of cash :(i) Issue of shares(ii) Payment of dividend(iii) Purchase of fixed assets(iv) Cash from operations (profits)(v) Sale of fixed assets(vi) Redemption of debentures
IV. Fill in the blanks :
(a) Net profit are Rs. 20,000. There is an increase in the amount of debtors of Rs. 5,00. What would be the amount of cash flow from operating activities
(Rs. 20,000, Rs.15,000 Rs. 25,000)
I II III
(b) Net profit are Rs. 12,500, after debiting depreciation Rs. ,3500 andn there is a decrease in stock worth Rs. 2,700. The cash flow from operating activities would be
(Rs. 16,000, Rs.15,200 Rs. 18,700)
I II III
Ans. I. decrease in cash (II) Increase in Cash (III) i) in Flow (ii) out flow (iii) out flow (iv) in flow (v) in flow (vi) outflow. (IV) (a) 1500 (b) 18700
B. SHORT ANSWER QUESTIONS
1. What is ‘Cash Flow Statement’? Explain.
2. Write what is inflow of each and outflow of cash?
3. What are non-operating Expenses and Incomes.
4. Write about treatment of depreciation in a Cash Flow Statement.
5. What do you know about Treatment of Dividend declared and paid in a Cash Flow Statement
6. Write about treatment of provision for tax and tax paid in Cash Flow Statement.
89

EXERCISE :
1. Calculate cash flow from operating activities from the following information :
Rs.
Sales 1,20,000
Purchases 70,000
Wages 25,000
Assume that all the transactions were in cash. Ans (Rs 25,000)
2. Calculate cash flow from operating activities from the following figures :
(Rs.)
Sales 2,75,000
Cost of Sales 2,25,000
Opening Balance of Debtors 20,000
Closing Balance of Debtors 20,000
Opening Balance of Creditors 5,000
Closing Balance of Creditors 10,000
Opening Balance of Outstanding Expenses 1,250
Closing Balance of Outstanding Expenses 2,750
Ans. (51500)
3. Calculate cash flow from operating activities after calculating adjusted profit from the following : Rs.(i) Depreciation allowed 15,000(ii) Loss on Sale of Machine 2,500(iii) Discount on Issue of Shares written off 1,000(iv) Goodwill written off 1,500(v) Transfer to General Reserve 2,000(vi) Net Profit after above adjustments 15,000(vii) Increase in Current Assets 2,500(viii) Decrease in Current Liabilities 3,500
Ans. (31,000)
5. Calculate cash flow from operating activities from the following :
Particulars 2004
Rs
2005
(Rs.)Profit and Loss Appropriation A/cBills ReceivablesProvisions for DepreciationRent OutstandingPrepaid InsuranceGoodwillStock
20,00014,00030,000
1,6001,400
20,00014,000
30,00018,00032,000
4,0001,200
16,00018,000
Ans. (Rs. 10,600)
6. Calculate cash flow from operating activities from the following Profit and Loss A/c of a business for the year ended on 31.3.2005 :
90

Particulars Rs. Particulars Rs.To SalariesTo Depreciation on fixed assetsTo Preliminary Exp. w/off.To Discount on issue of deb.To General ReserveTo Discount on SalesTo GoodwillTo Net Profit
22,3008,2001,5001,000
12,0004,1803,220
16,600
By Gross ProfitBy Rent ReceivedBy Profit on Sale of fixed assets
54,5003,200
11,300
69,000
Ans. (Rs. 31,220)
7. Calculate cash flow from operating activities from the following details:Particulars 31.3.07
Rs
31.3.08
(Rs.)Profit and Loss A/cGeneral ReserveProvisions for DepreciationPrepaid ExpensesUnearned IncomesOutstanding ExpensesGoodwillSundry CreditorsBills Receivable
45,0005,000
18,0002,4001,500
80010,000
5,0006,400
60,00010,00028,000
1,8002,5001,2007,0003,0009,600
Ans. (Rs 29,800)
8. Calculate cash flow from operating activities from the following data :
I. Profits made during the year Rs. 1,45,000 after considering the following items :
(Rs)
a) Amortisation of Goodwill 3,000
b) Depreciation of Fixed Assets 17,000
c) Loss on Sale of Fixed Assets 2,500
d) Transfer to General Reserve 15,000
II. The following is the position of current assets and current liabilities :
Particulars 31.3.07
Rs
31.3.08
(Rs.)
CreditorsDebtorsPrepaid ExpensesBills Payable
12,00016,200
2505,000
8,20012,000
7507,000
Ans. (Rs. 1,84,400)
9. Compute cash flow from operating activities from the following Profit and Loss A/c :
Particulars Rs. Particulars Rs.
To ExpensesTo Depreciation
3,00,00070,000
By Gross ProfitBy Gain on Sale of Fixed
4,50,00060,000
91

To Loss on Sale of MachineTo DiscountTo GoodwillTo Net Profit
4,000200
20,0001,15,8005,10,000
Assets
5,10,000
Ans. (Rs. 1,50,000)
10. Compute cash flow from operating activities from the following data :
Particulars 31.3.07
Rs
31.3.08
(Rs.)
Profit and Loss A/cGeneral ReserveGoodwillDepreciationDiscount on Issue of DebentureSundry DebtorsSundry CreditorsBills Payable
15,9501,2005,0004,500
5004,1001,5005,3003,300
24,4001,8003,0006,300
3502,8002,1002,9002,100
Ans. (Rs 26,100)
11. The following is the position of current assets and current liabilities of X Ltd. :
2007 (Rs) 2008(Rs.)
Provision for Bad debts 1,000
Short term loans 10,000 19,000
Creditors 15,000 10,000
Bills Receivable 20,000 40,000
The company incurred a loss of Rs. 45,000 during the year. Calculate cash from operating activities. Ans. (Rs. 62,000)
12. The following is the position of current assets and current liabilities :
Particulars 2007
Rs
2008
(Rs.)
Profit & Loss Appropriation A/cBills ReceivableProvision for DepreciationOutstanding Rent PayablePrepaid InsuranceGoodwillStock
2,0001,4003,000
160140
2,0001,400
3,0001,8003,200
480120
1,6001,800
Ans. (Rs. 1060)
92

13. Compute cash flow from operating activities from the following details :
Particulars 2007
Rs
2008
(Rs.)
Profit & Loss A/cDebtorsOutstanding RentGoodwillPrepaid InsuranceCreditors
1,10,00050,00024,00080,000
8,00026,000
1,20,00062,00042,00076,000
4,00038,000
Ans. (Rs. 36,000)
14. Calculate cash flow from operating acidities during 2007-08 from the following :
Liabilities 2007 2008 Assets 2007 2008
CapitalDebenturesAccumulated ProfitsTrade Creditors
50603060
200
70405090
250
Cash & BankTrade DebtorsStockGoodwillMachinery
3040503050
200
4060602070
250
Ans. (Rs. 40,000)
15. From the following information, calculate cash from operating activities :
Particulars 2007
Rs
2008
(Rs.)
StockDebtorsCreditorsExpenses OutstandingBills PayableAccrued IncomeProfit & Loss A/c
6,0002,5003,200
3503,500
8008,000
5,0002,3002,800
4502,200
9009,000
Ans. (Rs. 500)
16. Calculate cash from operating activities from the following Profit and Loss account.
Profit and Loss Account
(for the year ending on 31.3.08)Dr. Cr.
.Particulars Rs. Particulars Rs.
To Salaries 1,800 By Gross Profit 6,500
93

To RentTo Provision for Bad debtsTo DepreciationTo Loss on Sale of landTo Goodwill written offTo Proposed dividendTo Provision for taxTo Net Profit
1,000200400300500700400
2,5007,800
By Profit on Sale of PlantBy Income Tax Refund
700600
7,800
Ans. (Rs. 3700)
17. From the following information prepare a Cash Flow Statement :-
(Rs)
Operating Cash Balance 15,000
Closing Cash Balance 19,000
Increase in Creditors 13,000
Decrease in Debtors 17,000
Fixed assets purchase 30,000
Redemption of 12% debentures 14,000
Profit for the year 18,000
Ans. Cash flow from operating investing and financing activities = Rs. 48000, Rs. 30,000 Rs. 14,000).
18. From the following information prepare a Cash Flow Statement :-
(Rs)
Operating Cash Balance 1,00,000
Closing Cash Balance 1,20,000
Increase in Creditors 50,000
Decrease in Debtors 70,000
Fixed assets purchase 2,00,000
Redemption of 12% debentures 5,00,000
Profit for the year 2,00,000
Ans. Cash flow from operating investing and financing activities = Rs. 320,000 Rs. 2,00,000 & Rs. 5,00,000).
19. Calculate Cash Flow operating acidities from the following Profit and Loss A/c for the year ending on 31.3.05:
Liabilities 2007 Particulars 2008(Rs.)
To SalariesTo DepreciationTo Loss on Sale of Plant
2,500200100
By Gross ProfitBy Profit on Sale of landBy Income tax Refund
4,500400400
94

To Goodwill written offTo Provision for taxTo Net Profit
4001,0001,100
5,300 5,300
Ans. (Rs 2,000)
20. From the following Balance Sheets of M/s Rahman & Bros. Ltd. prepare a Cash Flow Statement as per (AS-3 (Revised) :
Liabilities 2007(Rs.)
2008(Rs.)
Assets 2007(Rs
2008(Rs.)
Equity Share Capital
15% Preference Share
Capital
General Reserve
Profit & Loss A/c
Creditors
1,50,000
75,000
20,000
20,000
32,500
2,97,500
2,00,000
50,000
35,000
24,000
49,500
3,58,500
Goodwill
Buildings
Plant
Debtors
Stock
Cash
36,000
80,000
40,000
1,19,000
10,000
12,500
2,97,500
20,000
60,000
1,00,000
1,54,500
15,000
9,000
3,58,500
Depreciation charged on Plant was Rs. 10,000 and on building was Rs. 20,000. Ans. (Rs. 41,500 Rs. 70,000 & Rs. 25,000)
21. Prepare Cash Flow Statement as per AS.3 (Revised) from the following Balance Sheets of 2007 and 2008.
Liabilities 2007(Rs.)
2008(Rs.)
Assets 2007(Rs
2008(Rs.)
Equity Share CapitalReserve & SurplusBank LoanCreditorsBank OverdraftProposed Dividend
30,000 8,50010,00031,000—4,500
84,000
40,00011,000
7,50039,000
5006,000
1,04,000
Fixed AssetsLess: Accumulated Depreciation
InvestmentsStockDebtorsBank
40,000
8,00032,000
8,00020,00021,000
3,00084,000
65,000
13,50051,50011,00022,50019,000
—1,04,000
Ans. (Rs. 14,500, Rs. 2,500, Rs. 7,500)
22. Following are the comparative Balance Sheets of Washi & Bros. Ltd.. for the year 2007 and 2008.
Liabilities 31.3.07(Rs.)
31.3.08(Rs.)
Assets 31.3.07(Rs
31.3.08(Rs.)
Share Capital15% DebenturesTrade CreditorsProvision for
70,00012,00010,360700
74,0006,000
11,840800
CashTrade Debtors
(good)Stock in trade
9,00014,90049,20020,000
7,80017,70042,70030,000
95
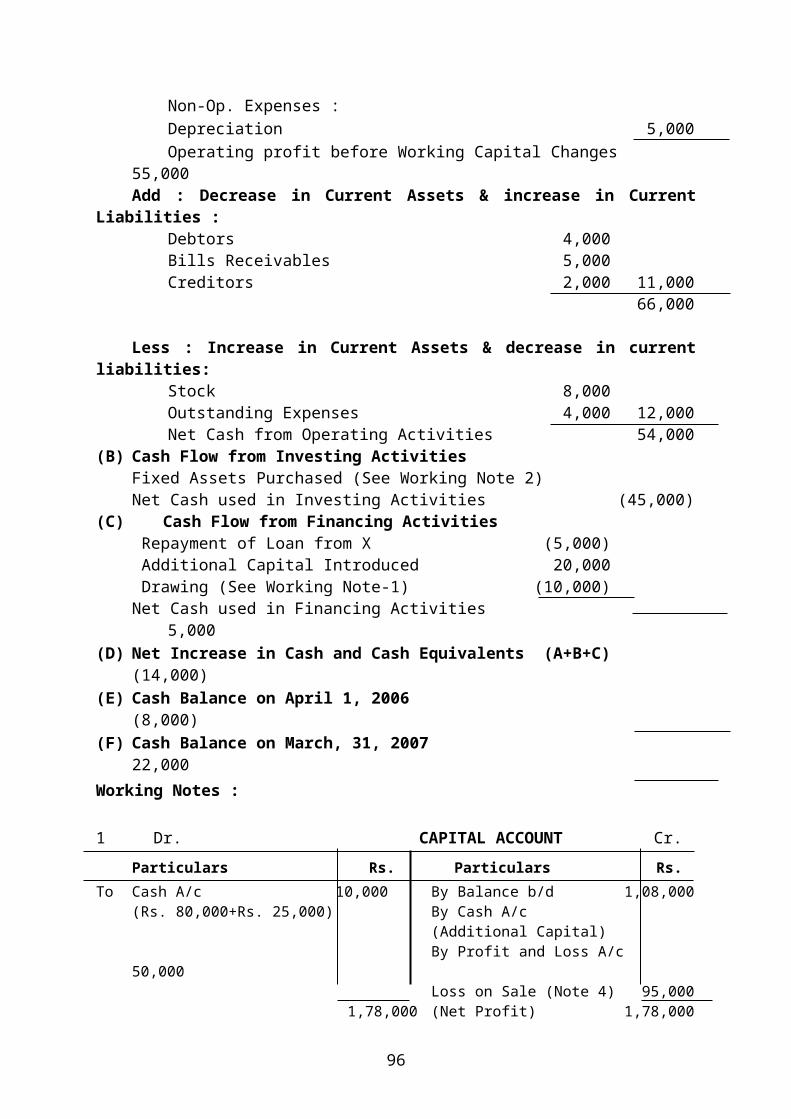
doubtfuldebtsProfit & Loss A/c
10,0401,03,100
10,5601,03,200
LandGoodwill
10,000
1,03,100
5,000
1,03,200
Ans. (Rs. 10,800, Rs 10,000 & Rs. 2000)
Additional Information :
(i) Dividends were paid totaling Rs. 3,500
(ii) Land was purchased for Rs. 10,000
(iii) Amount provided for amortization of goodwill Rs 5,000
(iv) Debenture loan was repaid Rs 6,000
You are required to prepare a Cash Flow Statement as per AS-3 (Revised)
23. The Balance Sheets of MD & Sons Ltd. as on 31.3.07 and 31.3.08 were as follows :
Liabilities 31.3.07(Rs.)
31.3.08(Rs.)
Assets 31.3.07(Rs
31.3.08(Rs.)
Equity Share CapitalGeneral ReserveProfit & Loss A/c15% DebenturesCreditors
90,00010,00020,000—37,400
1,57,400
1,30,00015,00030,00020,00042,000
2,37,000
Fixed AssetsStockDebtorsBankPreliminary
Expenses
93,40022,00036,000
4,0002,000
1,57,400
1,66,00026,00039,000
5,0001,000
2,37,000
Additional Information :
(i) Depreciation written off on Fixed Assets Rs. 23,400
(ii) Dividend paid on Equity Share Capital Rs. 20,000
Prepaid Cash Flow Statement as per AS-3 (Revised)
Ans. (Rs. 57000, Rs. 96,000 & Rs. 40,000)
24. Following are the Balance Sheets of Ali & Bros. Ltd.
Liabilities 31.3.07(Rs.)
31.3.08(Rs.)
Assets 31.3.07(Rs
31.3.08(Rs.)
Equity Share Capital15% RedeemablePreference ShareCapitalGeneral ReserveProfit & Loss A/cCurrent Liabilities:
4,80,0002,60,000
48,000—
67,20070,00017,200
7,20,0001,20,000
72,00064,800
93,6001,00,000
27,200
InvestmentsDiscount onIssue of SharesFactory
BuildingsMachineryFixed DepositsPreliminary
ExpensesCurrent
AssetsSundry Debtors
42,200
1,20,0002,00,0002,16,000
24,00024,000
1,80,0002,04,000
30,600
—
96,0001,20,0004,58,400
84,00016,800
2,59,2001,87,200
50,000
96

Proposed DividendSundry CreditorsBills PayableOutstanding SalaryProvision for Tax
39,20067,200
10,48,800
14,40076,800
12,88,800
StockBankCash
7,000
10,48,000
17,200
12,88,800
Ans. (Rs. 1,76,000, Rs. 1,79,200 & Rs. 32,800)
Prepare Cash Flow Statement as per AS-3 (Revised)
25. Following are the Balance Sheets of Shafi & Bros. Ltd. as at 31st March, 2008
Liabilities 31.3.07(Rs.)
31.3.08(Rs.)
Assets 31.3.07(Rs
31.3.08(Rs.)
Share Capital15% DebenturesGeneral ReserveProfit & Loss A/cProv. for Income TaxCreditorsBills PayableProv. for doubtful debts
1,00,00050,00020,00011,0004,0005,0002,0003,0001,95,000
1,10,00030,00020,00019,00011,000
4,0003,0002,400
1,99,400
GoodwillLandMachineryStockDebtorsPreliminary
ExpensesCash
5,00042,00060,00025,00030,000
3,00030,000
1,95,000
4,00066,00080,00021,00024,000
2,0002,400
1,99,400
Ans. (Rs. 35,900, Rs. 53,500 & Rs. 10,000)
Additional Information :
(i) During the year 2008, a part of Machine costing Rs. 7,500 (Accumulated depreciation thereon being Rs. 2,500) was sold for Rs. 3,000.
(ii) Income tax was paid Rs, 4,000 during 2008.
(iii) Depreciation on Machinery for 2008 was provided at Rs. 5,000. Prepare Cash Flow Statement as per AS-3 (revised)
26. From the following Balance Sheets of M/s Neyamat & Bros. Ltd. for two years 2007 and 2008, prepare cash Flow Statement
Liabilities 31.3.07(Rs.)
31.3.08(Rs.)
Assets 31.3.07(Rs
31.3.08(Rs.)
Share CapitalP & L A/c15% DebenturesCreditors
36,00020,000—9,000
65,000
30,00014,000
5,00011,000
60,000
GoodwillMachineryStockDebtorsCash
5,00020,00018,00019,000
3,00065,000
6,00025,00012,00015,000
2,00060,000
Additional Information :
(i) A Machine of the book value of Rs 6,000 was sold for Rs.6,500 during 2008.
(ii) Debentures were redeemed for Rs. 4,900.
97

(iii) Cash dividend of Rs. 2,500 was paid during 2008.
(iv) Depreciation on Machinery was provided Rs. 1,000
Ans. (Rs. 2100, 4500 & Rs. 4900)
27. From the following Balance Sheets of Shahid & Bros. Ltd. prepare Cash Flow Statement as per AS-3 (Revised)
Balance Sheet
Liabilities 31.3.07(Rs.)
31.3.08(Rs.)
Assets 31.3.07(Rs
31.3.08(Rs.)
Share Capital15% DebenturesGeneral ReserveP & L A/cCreditorsBills PayableProv. for tax
3,00,0001,50,000
40,00072,00055,00020,00040,000
6,77,000
4,00,0001,00,000
70,00098,00083,00016,00050,000
8,17,000
GoodwillBuildingsDebtorsCashBills ReceivableStock
1,15,0002,00,0001,60,000
25,00020,000
1,57,000
6,77,000
90,0001,70,0002,00,000
18,00030,000
3,09,000
8,17,000
Additional Information :
(i) Depreciation on Building is 15%.
(ii) Income Tax paid is Rs. 40,000.
Note : Provision for tax is to be treated as a non-current liability.
Ans. (Rs. 57,000, Rs NIL & Rs. 50,000)
28. Following are the comparative Balance Sheets of ABC Co. Ltd. for the year 2007 and 2008.
Liabilities 31.3.07(Rs.)
31.3.08(Rs.)
Assets 31.3.07(Rs
31.3.08(Rs.)
Equity Share Capital15% DebenturesTrade CreditorsGeneral ReserveProfit & Loss A/c
45,00010,0008,7005,00010,00078,700
65,00020,00011,000
7,50015,000
1,18,500
Fixed AssetsStockDebtorsCashPreliminary Exp.
46,70011,00018,000
2,0001,000
78,700
83,00013,00019,500
2,500500
1,18,500
Prepare Cash Flow Statement. As per AS-3 (revised)
Ans. (Rs. 6,800 Rs. 36,500 & Rs. 30,000)
29. From the following Balance Sheets of Zia-ul-Haque & Co, Prepare Cash Flow Statement as per AS-3 (revised)
Liabilities 31.3.07(Rs.)
31.3.08(Rs.)
Assets 31.3.07(Rs
31.3.08(Rs.)
Share CapitalDepreciation Reserve
80,00040,00030,000
1,00,00043,00050,000
Machinery (at cost)
Debtors
1,20,00040,00030,000
1,44,00035,00032,000
98

Profit and Loss A/c15% DebenturesCreditors
40,00020,000
2,10,000
20,00017,000
2,30,000
StockPreliminary
ExpensesBank Balance
4,00016,000
2,10,000
3,00016,000
2,30,000
Ans. (Rs. 24,000, Rs. 24,000, Rs. NIL)
30. From the following Balance Sheets of Bakhte Munaeem Co. Ltd., prepare the Cash Flow Statement. As per AS-3 (revised)
Liabilities 31.3.07(Rs.)
31.3.08(Rs.)
Assets 31.3.07(Rs
31.3.08(Rs.)
Share CapitalDepreciation ReserveProfit and Loss A/c13% DebenturesBills PayableCreditors
1,20,0009,0006,000
35,00015,00025,000
2,10,000
2,00,0009,5009,000
20,00010,50051,000
3,00,000
Machinery (at cost)
DebtorsStockBank BalancePreliminary
Expenses
20,00095,00037,00043,00015,000
2,10,000
1,25,00080,00062,00025,000
8,000
3,00,000
Ans. (Rs. 22,000, Rs, 1,05,000 & Rs.65,000)
99
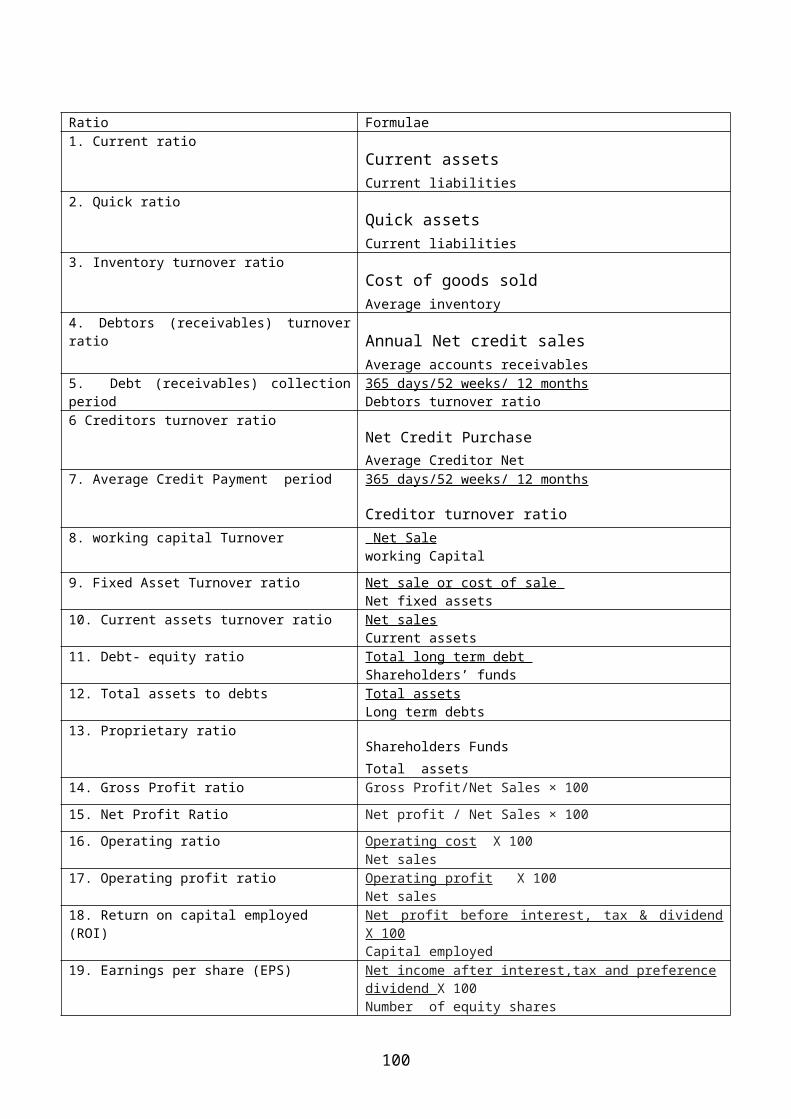
100