short term issues…..long term issues the outlook for
TRANSCRIPT

Terry BossTerry BossINGAAINGAA
Short Term Issues…..Long Term Issues
The Outlook for Natural Gas
Short Term Issues…..Long Term IssuesShort Term Issues…..Long Term Issues
The Outlook for Natural GasThe Outlook for Natural Gas
Energy Summit 2005Energy Summit 2005Baton Rouge, LABaton Rouge, LA
October 19, 2005October 19, 2005

How Did the Market Get Here?How Did the Market Get Here?
H is to ric a l Ga s P r ic e a t H e n ry H u b ($ p e r M M B tu )
$0
$1
$2
$3
$4
$5
$6
$7
$8
$9
$ 10
1 99 5 1 99 6 1 99 7 19 98 19 99 20 00 20 01 20 02 2 00 3 200 4 2 00 5
Source: P la tts G as D aily & E nergy and E nvironm enta lAna lys is, Inc.
R ela tive P rice S tab ility
P rice S p ikeW inter 2000-01
R is ing P ricesW inter 2002-03
40
42
44
46
48
50
52
54
56
1995 1996 1997 1998 1999 2000 2001 2002 2003 2004 2005
Lower-48 Gas Production Versus Deliverability (Bcfd)
Courtesy of EEACourtesy of EEA

Demand Increased Because of Hot SummerDemand Increased Because of Hot SummerHotter than normal summer Hotter than normal summer temperatures have kept upward temperatures have kept upward pressure on gas prices.pressure on gas prices.An early summer heat wave An early summer heat wave covered the Midwestern and covered the Midwestern and Central states in June.Central states in June.July provided extreme heat to July provided extreme heat to the Western United States.the Western United States.Late summer included more Late summer included more heat, with South Atlantic and heat, with South Atlantic and Gulf Coast states seeing the Gulf Coast states seeing the hottest summer in ten years.hottest summer in ten years.
U.S. 2005 CDD Normal % DifferentJune 260 213 22%July 367 321 14%August 348 290 20%MATLJune 205 117 75%July 309 247 25%August 306 205 49%SATLJune 335 319 5%July 462 425 9%August 451 393 15%ENCJune 249 147 69%July 294 245 20%August 258 197 31%ESCJune 335 296 13%July 433 412 5%August 457 376 22%WSCJune 482 431 12%July 558 545 2%August 575 527 9%PACJune 92 100 -8%July 239 188 27%August 223 193 16%
Courtesy of EEACourtesy of EEA

One One -- Two Punch of HurricanesTwo Punch of Hurricanes
U.S. Natural Gas Production
42
44
46
48
50
52
54
May, 0
5Ju
ne, 0
5Ju
ly, 05
Aug, 0
5Sep
t, 05
Oct, 05
Nov, 0
5Dec
, 05
Jan,
06Feb
, 06
March,
06Apri
l, 06
Bcf
d
Projected Before Hurricanes Current Projection
Supply disruptions due to recent hurricanes will persist throughout
the upcoming winter …
-6.1 -6.0
-3.6 -2.6 -1.9 -1.3 -1.0
Cumulative production offline from September through March = 680
Bcf? (about 6% of Total US Production)
Average production offline during the upcoming winter = 2.0 Bcfd?
(about 4% of Total US Production)
CindyDennisKatrina
Rita
EEA’s Assumed Recovery Scenario
Courtesy of EEACourtesy of EEA

Model Used to Analyze Hurricane ImpactsModel Used to Analyze Hurricane Impacts
Courtesy of EEA

Weather Plays a Big Factor in Demand….Weather Plays a Big Factor in Demand….Northeast U.S.Northeast U.S.
Courtesy of EEACourtesy of EEA
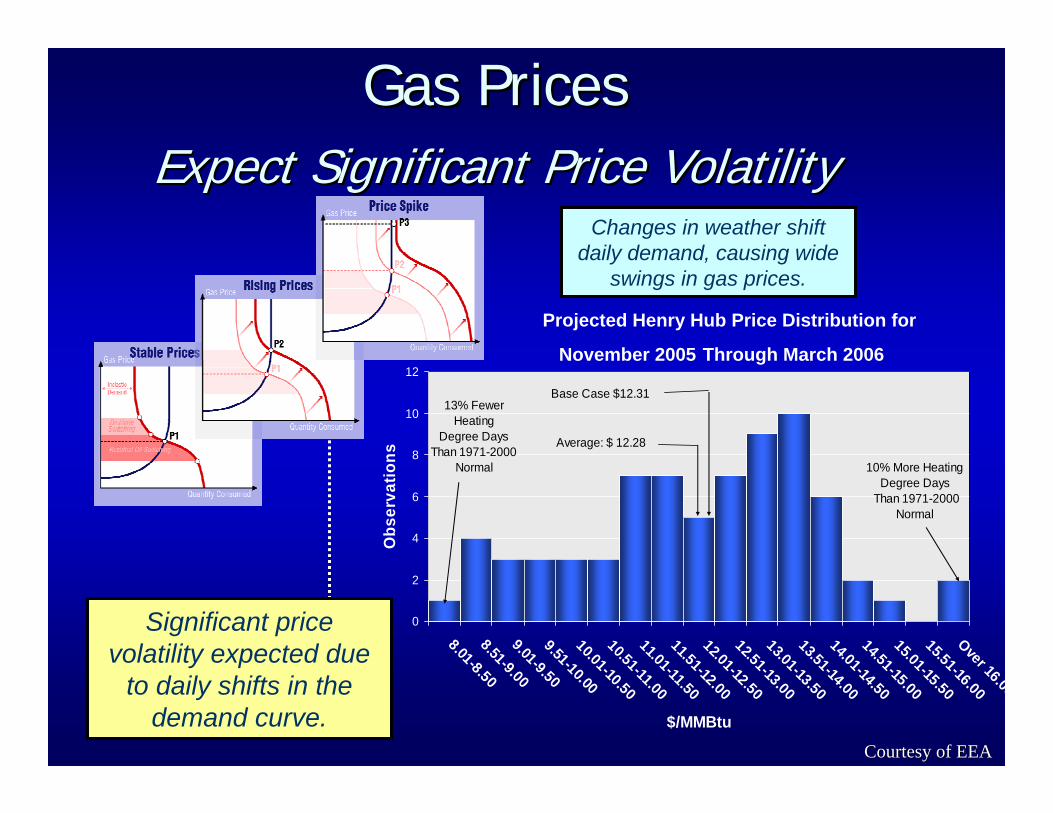
Gas PricesGas PricesExpect Significant Price VolatilityExpect Significant Price Volatility
Changes in weather shift daily demand, causing wide
swings in gas prices.
Significant price volatility expected due
to daily shifts in the demand curve.
Projected Henry Hub Price Distribution for
November 2005 Through March 2006
0
2
4
6
8
10
12
8.01-8.508.51-9.009.01-9.509.51-10.0010.01-10.5010.51-11.0011.01-11.5011.51-12.0012.01-12.5012.51-13.0013.01-13.5013.51-14.0014.01-14.5014.51-15.0015.01-15.5015.51-16.00Over 16.00
$/MMBtu
Obs
erva
tions
Average: $ 12.28
Base Case $12.3113% Fewer
HeatingDegree Days
Than 1971-2000 Normal 10% More Heating
Degree Days Than 1971-2000
Normal
Courtesy of EEACourtesy of EEA

-
200
400
600
800
1,000
1,200
1,400
1,600
-15.0% -12.5% -10.0% -7.5% -5.0% -2.5% 0.0% 2.5% 5.0% 7.5% 10.0% 12.5% 15.0%
Percent Difference from Normal Weather
Wor
king
Gas
Lev
el a
t the
End
of M
arch
The Effect of Weather on Storage The Effect of Weather on Storage (Working Storage Gas March 31, 2006 Level, (Working Storage Gas March 31, 2006 Level, BcfBcf))
Base Case, Normal WeatherBase Case, Normal Weather
Severe Stress with Potential for Load Curtailment, Severe Stress with Potential for Load Curtailment, 11% probability11% probability
Market Stressed but Probably OK, Market Stressed but Probably OK, 20% probability20% probability
Market OK, Market OK, 69% probability69% probability
Courtesy of EEACourtesy of EEA

Getting the Gas to the Right Place….Getting the Gas to the Right Place….

Individual Market Sustainability during Daily Individual Market Sustainability during Daily Peak Load Swings Depends on InfrastructurePeak Load Swings Depends on Infrastructure
Daily Demand for January
0
500
1,000
1,500
2,000
2,500
3,000
1 2 3 4 5 6 7 8 9 10 11 12 13 14 15 16 17 18 19 20 21 22 23 24 25 26 27 28 29 30 31
MM
cfd
1. Includes fuel switching in response to pipeline outage.
Net Monthly Supply for Market Center
Capacity Required to Meet Daily Peak
LNG Peaking and Propane/Air Storage
Courtesy of EEACourtesy of EEA

Will the Gas Market Work?Will the Gas Market Work?Shippers
272,500 Gas Wells
Producers• Majors• Independents
Gathering and Processing
Storage
30 MajorInterstatePipelines
Commercial
Residential
Industrial &Utilities
1200 DistributorsStorage
Gas Equipment Manufacturers

LinepackLinepack vs. vs. ImbalanceImbalance
11,000,000
11,200,000
11,400,000
11,600,000
11,800,000
12,000,000
12,200,000
12,400,000
12,600,000
12,800,000
13,000,000
1 2 3 4 5 6 7 8 9 10 11 12 13 14 15 16 17 18 19 20 21 22 23 24 25 26 27 28 29 30
Days of the Month
Line
pack
(Mcf
)
-800,000
-600,000
-400,000
-200,000
0
200,000
400,000
600,000
800,000
1,000,000
1,200,000
Dai
ly Im
bala
nce
Linepack Imbalance

May be owned/operated by:May be owned/operated by:•• Producers Producers •• MidMid--streamstream•• Gas PipelinesGas Pipelines
Gas Processing Also an Issue……Gas Processing Also an Issue……
Gas Processing
LiquefiableLiquefiableHydrocarbonsHydrocarbons
HeliumHeliumWaterWaterVaporVapor
D EHY
CompressorStation
CompressorStation
City GateCity GateProductionProduction
HydrocarbonLiquids
HydrocarbonHydrocarbonLiquidsLiquidsLiquid
Separation
Liquid
Separation
CO2COCO22 H2SHH22SSFree
WaterFreeFree
WaterWater
Gas Treatment
3
DeliveredDeliveredNaturalNaturalGasGas
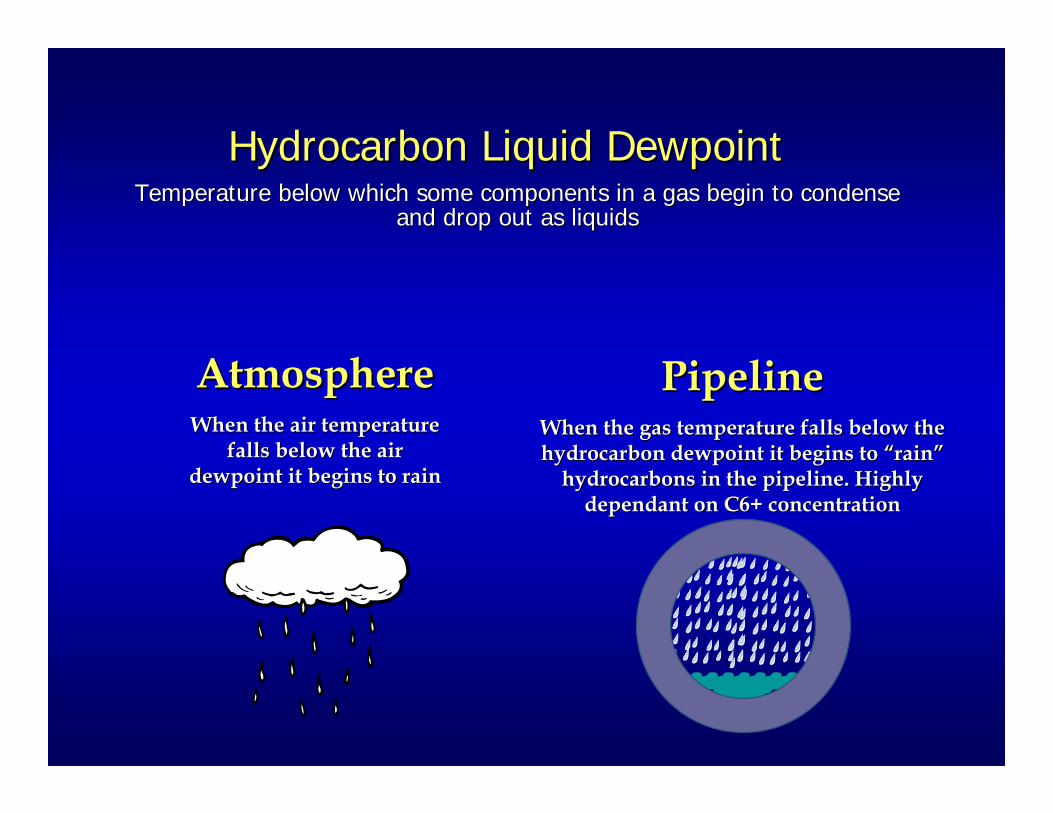
Hydrocarbon Liquid Hydrocarbon Liquid DewpointDewpointTemperature below which some components in a gas begin to condenTemperature below which some components in a gas begin to condense se
and drop out as liquidsand drop out as liquids
AtmosphereAtmosphereWhen the air temperature When the air temperature
falls below the air falls below the air dewpoint it begins to raindewpoint it begins to rain
Pipeline Pipeline When the gas temperature falls below the When the gas temperature falls below the hydrocarbon dewpoint it begins to “rain” hydrocarbon dewpoint it begins to “rain”
hydrocarbons in the pipeline. Highly hydrocarbons in the pipeline. Highly dependant on C6+ concentrationdependant on C6+ concentration

Impact of Pressure Reduction on Flowing Pipeline Impact of Pressure Reduction on Flowing Pipeline GasGas
0
200
400
600
800
1000
1200
-250 -200 -150 -100 -50 0 50
Temp (F)
Flowing Gas Temperature
35 F
DeliveriesTo LDCs
500 # or <
Applying the LineRepresenting7 F per 100 #

Hydrocarbon Liquid Control Hydrocarbon Liquid Control MeasuresMeasures
BlendingBlendingIncidental Incidental –– Open Access NominationsOpen Access NominationsContractual Contractual -- Within the Control of ShippersWithin the Control of Shippers
HeatingHeatingHeat of CompressionHeat of CompressionInstallation of HeatersInstallation of Heaters
Gas ShutGas Shut--inin

Long Term Issues……Long Term Issues……

Gas consumption in the Gas consumption in the power sector will grow power sector will grow substantially.substantially.
Over 200 Over 200 GW’sGW’s of new of new gasgas--based generating based generating capacity in the U.S. will capacity in the U.S. will be used to satisfy be used to satisfy increasing electric load.increasing electric load.
Modest growth in R/C Modest growth in R/C gas consumption.gas consumption.Industrial gas Industrial gas consumption will consumption will fluctuate around current fluctuate around current levels.levels.
Well below preWell below pre--2000 2000 levels.levels.
When necessary, priceWhen necessary, price--induced demand induced demand reductions will balance reductions will balance the market.the market. The North American gas market may be best
characterized as a “demand leads supply market” for the foreseeable future.
U.S. and Canada Gas Consumption (Trillion Cubic Feet, Tcf)
0
5,000
10,000
15,000
20,000
25,000
30,000
35,000
40,000
2001 2006 2011 2016 2021
Residential
Commercial
Industrial
Power Generation
Other
Gas Demand OutlookGas Demand Outlook
Delta 2004-2025
+6.5 Tcf
+1.1 Tcf
+0.6 Tcf
+1.2 Tcf
+0.3 Tcf
Delta 2004-2015
+5.4 Tcf
+0.2 Tcf
+0.3 Tcf
+0.7 Tcf
+0.3 Tcf
Courtesy of EEACourtesy of EEA

Historical BackgroundHistorical Background:: Natural GasNatural Gas1950s to early 1980’s: interstate gas markets highly 1950s to early 1980’s: interstate gas markets highly regulated, longregulated, long--term contracts predominated term contracts predominated
longlong--term contracts for wellhead supplies between pipelines term contracts for wellhead supplies between pipelines and producers lasted for “life of reserves” or a long, fixed and producers lasted for “life of reserves” or a long, fixed periodperiodcontracts between pipeline and LDCs often had 20contracts between pipeline and LDCs often had 20--year termsyear termsexistence of contracts needed for approval of new pipeline existence of contracts needed for approval of new pipeline capacitycapacity
Through 1980’s and 1990’s: gas restructuring periodThrough 1980’s and 1990’s: gas restructuring periodNGPA, Natural Gas Wellhead Decontrol ActNGPA, Natural Gas Wellhead Decontrol ActFERC Orders 380, 436 and 636FERC Orders 380, 436 and 636StateState--level customer choice programs for large industrials and level customer choice programs for large industrials and then othersthen othersResulted in takeResulted in take--oror--pay, stranded cost problemspay, stranded cost problemsLed to many more contracts of shorter durationLed to many more contracts of shorter duration

Production from Production from mature producing mature producing areas will decline areas will decline by about 1% per by about 1% per year.year.
New frontier New frontier supplies will supplies will account for 38% account for 38% and 45% of total and 45% of total U.S. and Canada U.S. and Canada gas supply in gas supply in 2015 and 2025, 2015 and 2025, respectively, respectively, versus only 18% versus only 18% today.today.
Relying On New Frontiers
Where is the Natural Gas Supply?Where is the Natural Gas Supply?
0
5
10
15
20
25
30
35
40
2004 2015 2025
Tcf Per Year
55%
Maritimes
Alaska
LNG Imports
Rockies
MacKenzie Delta
Deep Gulf
TraditionalSupply
Sources
21.1Tcf
82%
18%
38%
62%
45%
20.4Tcf
19.4Tcf
4.8Tcf
12.4Tcf
15.7Tcf
New Supply
U.S. & Canada Gas Supply
Courtesy of EEACourtesy of EEA
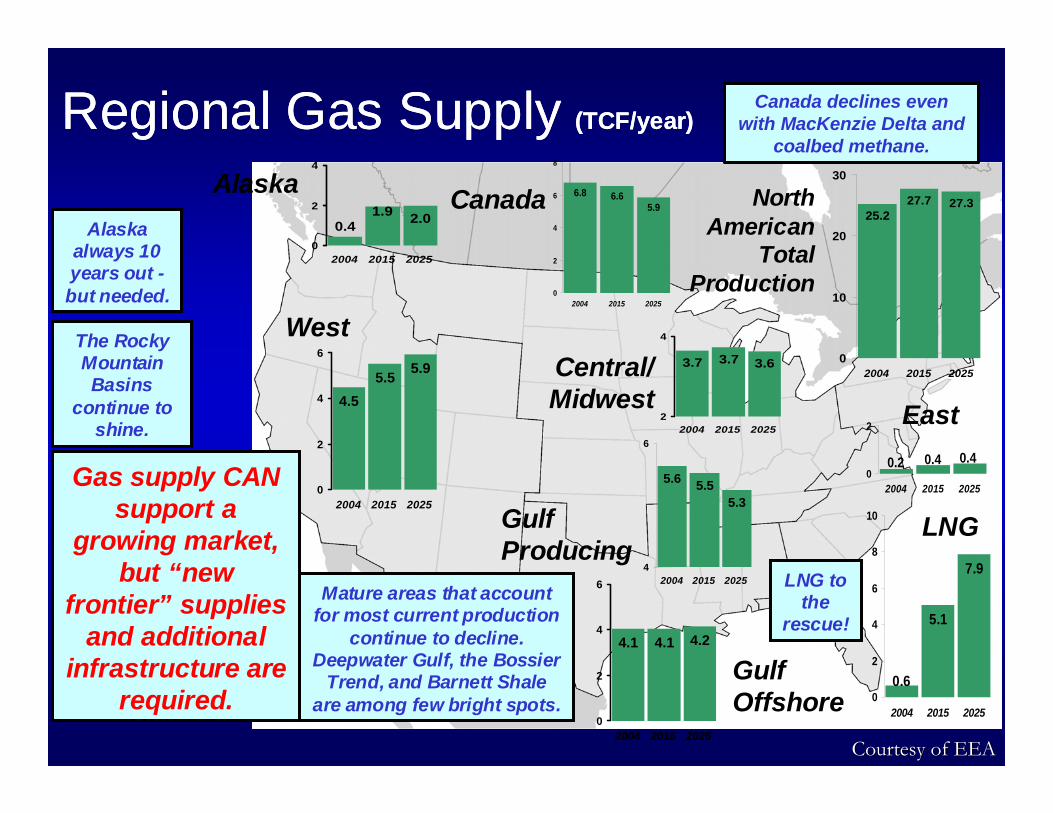
Regional Gas Supply (TCF/year)Canada declines even
with MacKenzie Delta and coalbed methane.
LNG to the
rescue!
LNG to the
rescue!Mature areas that account
for most current production continue to decline.
Deepwater Gulf, the Bossier Trend, and Barnett Shale
are among few bright spots.
Mature areas that account for most current production
continue to decline. Deepwater Gulf, the Bossier
Trend, and Barnett Shale are among few bright spots.
Gas supply CAN support a
growing market, but “new
frontier” supplies and additional
infrastructure are required.
Gas supply CAN support a
growing market, but “new
frontier” supplies and additional
infrastructure are required.
The Rocky Mountain Basins
continue to shine.
The Rocky Mountain Basins
continue to shine.
Alaska always 10 years out -but needed.
Alaska always 10 years out -but needed.
Alaska2.01.9
0.40
2
4
2004 2015 2025
West5.5 5.9
4.5
0
2
4
6
2004 2015 2025
Canada 6.65.9
6.8
0
2
4
6
8
2004 2015 2025
North American
Total Production
27.7 27.325.2
0
10
20
30
2004 2015 2025
East0.40.40.2
0
2
2004 2015 2025
Central/ Midwest
3.7 3.63.7
2
4
2004 2015 2025
GulfProducing
5.55.3
5.6
4
6
2004 2015 2025
GulfOffshore
4.1 4.24.1
0
2
4
6
2004 2015 2025
5.1
7.9
0.60
2
4
6
8
10
2004 2015 2025
LNG
Regional Gas Supply (TCF/year)Canada declines even
with MacKenzie Delta and coalbed methane.
LNG to the
rescue!
LNG to the
rescue!
LNG to the
rescue!
LNG to the
rescue!Mature areas that account
for most current production continue to decline.
Deepwater Gulf, the Bossier Trend, and Barnett Shale
are among few bright spots.
Mature areas that account for most current production
continue to decline. Deepwater Gulf, the Bossier
Trend, and Barnett Shale are among few bright spots.
Mature areas that account for most current production
continue to decline. Deepwater Gulf, the Bossier
Trend, and Barnett Shale are among few bright spots.
Mature areas that account for most current production
continue to decline. Deepwater Gulf, the Bossier
Trend, and Barnett Shale are among few bright spots.
Gas supply CAN support a
growing market, but “new
frontier” supplies and additional
infrastructure are required.
Gas supply CAN support a
growing market, but “new
frontier” supplies and additional
infrastructure are required.
Gas supply CAN support a
growing market, but “new
frontier” supplies and additional
infrastructure are required.
Gas supply CAN support a
growing market, but “new
frontier” supplies and additional
infrastructure are required.
The Rocky Mountain Basins
continue to shine.
The Rocky Mountain Basins
continue to shine.
The Rocky Mountain Basins
continue to shine.
The Rocky Mountain Basins
continue to shine.
Alaska always 10 years out -but needed.
Alaska always 10 years out -but needed.
Alaska always 10 years out -but needed.
Alaska always 10 years out -but needed.
Alaska2.01.9
0.40
2
4
2004 2015 2025
West5.5 5.9
4.5
0
2
4
6
2004 2015 2025
Canada 6.65.9
6.8
0
2
4
6
8
2004 2015 2025
North American
Total Production
27.7 27.325.2
0
10
20
30
2004 2015 2025
East0.40.40.2
0
2
2004 2015 2025
Central/ Midwest
3.7 3.63.7
2
4
2004 2015 2025
GulfProducing
5.55.3
5.6
4
6
2004 2015 2025
GulfOffshore
4.1 4.24.1
0
2
4
6
2004 2015 2025
5.1
7.9
0.60
2
4
6
8
10
2004 2015 2025
LNG
Courtesy of EEACourtesy of EEA

Large Capital Large Capital RequirementsRequirements
Recent Liquidity Recent Liquidity CrunchCrunch
Investor Investor RecogniRecogni--tiontion of Opportunitiesof Opportunities
Price Volatility Price Volatility Creates UncertaintyCreates Uncertainty
There is much uncertainty about future gas supply development.
Obstacles For Supply GrowthObstacles For Supply GrowthUncertainty About Uncertainty About Future Gas DemandFuture Gas Demand
Access RestrictionsAccess Restrictions
Cumbersome Cumbersome Approvals ProcessApprovals Process
Environmental and Environmental and SitingSiting IssuesIssues
Contracting IssuesContracting Issues

960
519
181
500
1400
893
1335
1292
25502233
250
500
165
300
1572
4581350
300
20
625
Capacity (Average MMcfd)Change from 2004 to 2020
373
500800
1276
150
107
300
900
400
310
700
107
750
3500
700
Lake Charles/New LA
1500
6300
Elba Island
Cove Point
Altimira MX
Blue Lines indicate LNGGray Lines indicate an increaseRed Lines indicate a decrease
500
BahamasKaty/HSC
2500Corpus Christi
1000
EEA July Compas
Quebec
SouthernCalifornia
Baja MX
Mid-Atlantic
500Vancouver
Eastern Canada
1000
500Energy Bridge
New Long Haul Pipeline Capacity NeededNew Long Haul Pipeline Capacity Needed
Courtesy of EEACourtesy of EEA

Pipeline Capital Expenditures NeededPipeline Capital Expenditures Needed
North America Pipeline Capital ExpendituresMillions of 2004 Dollars
0
1,000
2,000
3,000
4,000
5,000
6,000
7,000
8,000
9,000
10,000
199719981999200020012002200320042005200620072008200920102011201220132014201520162017201820192020
Replacement Pipe New Pipe 1/ Alaska Project /2/1 Includes estimates for new transmission pipe, production plant hookup, cost for new underground storage, and power plant connection costs./2 Includes cost of new pipe built to Chicago in conjuction with Alaska Pipeline Project and pipe to connect production plants to the pipeline, but excludes cost of gas processing plants in Alaska and natural gas liquids extraction plants in western Canada.
Alaska Pipeline Project
MacKenzie Project
Courtesy of EEACourtesy of EEA
5.2 million horsepower 5.2 million horsepower of compression will beof compression will berequiredrequired
360 360 bcfbcf working gas working gas of underground of underground Storage neededStorage needed

Role of LongRole of Long--term Contractsterm ContractsContracts assign rights and obligations Contracts assign rights and obligations and allocate risks to pipelines, equity and allocate risks to pipelines, equity holders, debt holders, insurers, holders, debt holders, insurers, suppliers, buyers, etc.suppliers, buyers, etc.LongLong--term contracts are an important term contracts are an important way of managing risks to all participants way of managing risks to all participants in new and existing gas supply, in new and existing gas supply, transportation and storage facilitiestransportation and storage facilities
mitigate "volume risk" by assuring that a minimum mitigate "volume risk" by assuring that a minimum amount of sales or throughputamount of sales or throughputmitigate "price risk" by setting a fixed price or by mitigate "price risk" by setting a fixed price or by specifying a pricing formulaspecifying a pricing formula

Holders of U.S. Gas Pipeline Holders of U.S. Gas Pipeline CapacityCapacity
Enduse Consumption1998 2002 2005 2020
LDC 46% 42% 39% 33%Power 12% 15% 25% 39%Industrial 4% 3% 36% 27%Marketer 13% 24%Producer 9% 10%Pipeline 9% 5%Other 7% 1% Total 100% 100% 100% 100%
Sources: NPC, Balancing Natural Gas Policy, Volume V, page T-15EEA July Base Case
Approx. Share of Capacity Held
Percent of Pipeline

Current Views and Perceptions:Current Views and Perceptions: LDCsLDCs
LDCs see “asymmetric risk” in longLDCs see “asymmetric risk” in long--term gas commodity, transportation term gas commodity, transportation and storage contractsand storage contractsLittle prospect for full cost recovery by Little prospect for full cost recovery by LDCsLDCs“Regulatory risk” from prudence “Regulatory risk” from prudence reviewsreviewsFear of stranded costs from market Fear of stranded costs from market loss caused by state regulatory actions, loss caused by state regulatory actions, e.g., customer choice programse.g., customer choice programs

Current Views and Perceptions:Current Views and Perceptions: Power GeneratorsPower GeneratorsReluctant to sign or retain longReluctant to sign or retain long--term firm term firm contracts for anything but capacity on contracts for anything but capacity on service laterals service laterals Recovery of costs for firm pipeline Recovery of costs for firm pipeline capacity generally not available through capacity generally not available through electricity sales contracts or operation of electricity sales contracts or operation of competitive markets competitive markets (e.g. electric generation (e.g. electric generation capacity payments)capacity payments)Willing to shut down or pay high spot gas Willing to shut down or pay high spot gas prices in gasprices in gas--constrained days constrained days -- because because electricity prices also go up electricity prices also go up (i.e., don’t feel (i.e., don’t feel consumers’ pain caused by price volatility)consumers’ pain caused by price volatility)

Current Views and Perceptions:Current Views and Perceptions: Gas SuppliersGas Suppliers
Domestic producers generally prefer to sell at Domestic producers generally prefer to sell at the wellhead or use interruptible pipeline the wellhead or use interruptible pipeline service to avoid firm chargesservice to avoid firm chargesHowever, producers need outlets for supplies However, producers need outlets for supplies and have been willing to sign supply area and have been willing to sign supply area pipeline contracts to reach liquid trading pointspipeline contracts to reach liquid trading points
Eastern Canada Offshore (M&N)Eastern Canada Offshore (M&N)RockiesRockiesDeepwater GOMDeepwater GOMEast TexasEast Texas
New LNG terminal builders want pipeline New LNG terminal builders want pipeline capacity to interconnect to gridcapacity to interconnect to grid

Current Views and Perceptions:Current Views and Perceptions: Gas PipelinesGas Pipelines
Incentives and regulatory policies do not Incentives and regulatory policies do not encourage “speculative” or “at risk” encourage “speculative” or “at risk” pipeline or storage constructionpipeline or storage constructionShippers’ preferences for contract lengths Shippers’ preferences for contract lengths of 5 years or less, do not match 20of 5 years or less, do not match 20-- to to 3030--year cost recovery period for new year cost recovery period for new projects projects -- financing more difficult and financing more difficult and expensiveexpensiveFewer and shorterFewer and shorter--term firm contracts term firm contracts also undermine pipelines’ ability to also undermine pipelines’ ability to maintain existing capacity maintain existing capacity
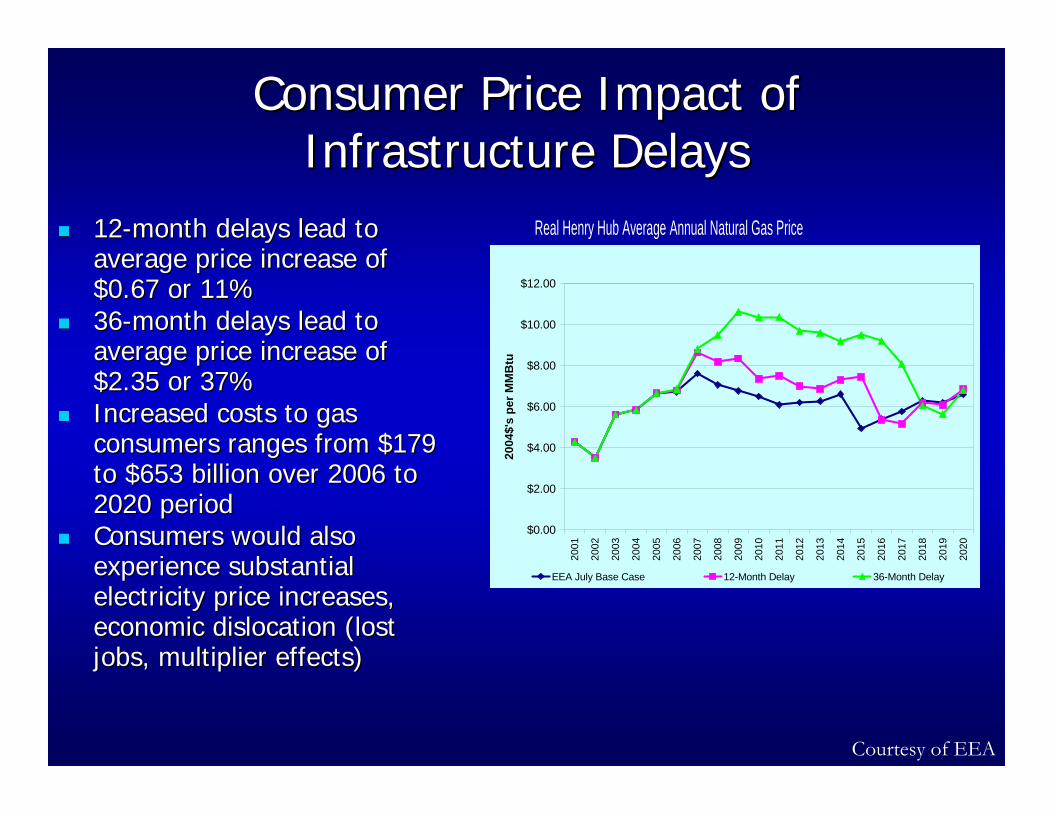
Consumer Price Impact of Consumer Price Impact of Infrastructure DelaysInfrastructure Delays
$0.00
$2.00
$4.00
$6.00
$8.00
$10.00
$12.00
2001
2002
2003
2004
2005
2006
2007
2008
2009
2010
2011
2012
2013
2014
2015
2016
2017
2018
2019
2020
2004
$'s
per M
MB
tu
EEA July Base Case 12-Month Delay 36-Month Delay
Real Henry Hub Average Annual Natural Gas Price 1212--month delays lead to month delays lead to average price increase of average price increase of $0.67 or 11%$0.67 or 11%3636--month delays lead to month delays lead to average price increase of average price increase of $2.35 or 37%$2.35 or 37%Increased costs to gas Increased costs to gas consumers ranges from $179 consumers ranges from $179 to $653 billion over 2006 to to $653 billion over 2006 to 2020 period2020 periodConsumers would also Consumers would also experience substantial experience substantial electricity price increases, electricity price increases, economic dislocation (lost economic dislocation (lost jobs, multiplier effects)jobs, multiplier effects)
Courtesy of EEA

Long Term Contract OptionsLong Term Contract Options::State Natural Gas RegulationsState Natural Gas Regulations
States Could Grant PreStates Could Grant Pre--approval of LDC approval of LDC Contracting Practices for Cost RecoveryContracting Practices for Cost RecoveryState Could Review Customer Choice State Could Review Customer Choice ProgramsPrograms

Long Term Contract OptionsLong Term Contract Options:: Electricity Electricity MarketsMarkets
Incorporate firmness of fuel supplies and Incorporate firmness of fuel supplies and transportation into power generation transportation into power generation capacity paymentscapacity paymentsIncorporate firmness of fuel supplies and Incorporate firmness of fuel supplies and transportation into electric reliability rulestransportation into electric reliability rulesAllowing ISO/RTO's or states to contract Allowing ISO/RTO's or states to contract gas pipeline and storage capacity for gas pipeline and storage capacity for reliability benefitsreliability benefits

Other OptionsOther Options:: Federal and State Aid to Federal and State Aid to FinancingFinancing
Offer flexible loan guarantees to large, highOffer flexible loan guarantees to large, high--risk projectsrisk projectsProvide tax certainty and incentivesProvide tax certainty and incentivesContract directly for capacity for royalty gas Contract directly for capacity for royalty gas or for reliability benefitsor for reliability benefitsContinue loans and loan guarantees for LNG Continue loans and loan guarantees for LNG development projects through Exdevelopment projects through Ex--Im Bank, Im Bank, OPIC, MIGA and similar agenciesOPIC, MIGA and similar agencies

LNG, an International LNG, an International Solution…..Solution…..

LNG Production to MarketLNG Production to Market
ProductionProductionProduction
Gas Gas TreatmentTreatment Gas
ProcessingGasProcessing
D EHY
LiquidLiquidSeparationSeparation
CompressorStation
CompressorCompressorStationStation City GateCity GateCity Gate
LiquefactionPlant
LiquefactionLiquefactionPlantPlant
LNG Cargo Ship
LNG Cargo LNG Cargo ShipShip
LNGLNG
LNG ProductionLNG Production Domestic ConsumptionDomestic Consumption
PipelinesPipelinesPipelinesVaporizationVaporization
LNG Wobbe can be managed by:
• Processing at LNG production
• Processing at LNG vaporization
• Injecting inert gases
• Blending with domestic natural gas
LNG Wobbe can be managed by:
• Processing at LNG production
• Processing at LNG vaporization
• Injecting inert gases
• Blending with domestic natural gas
36
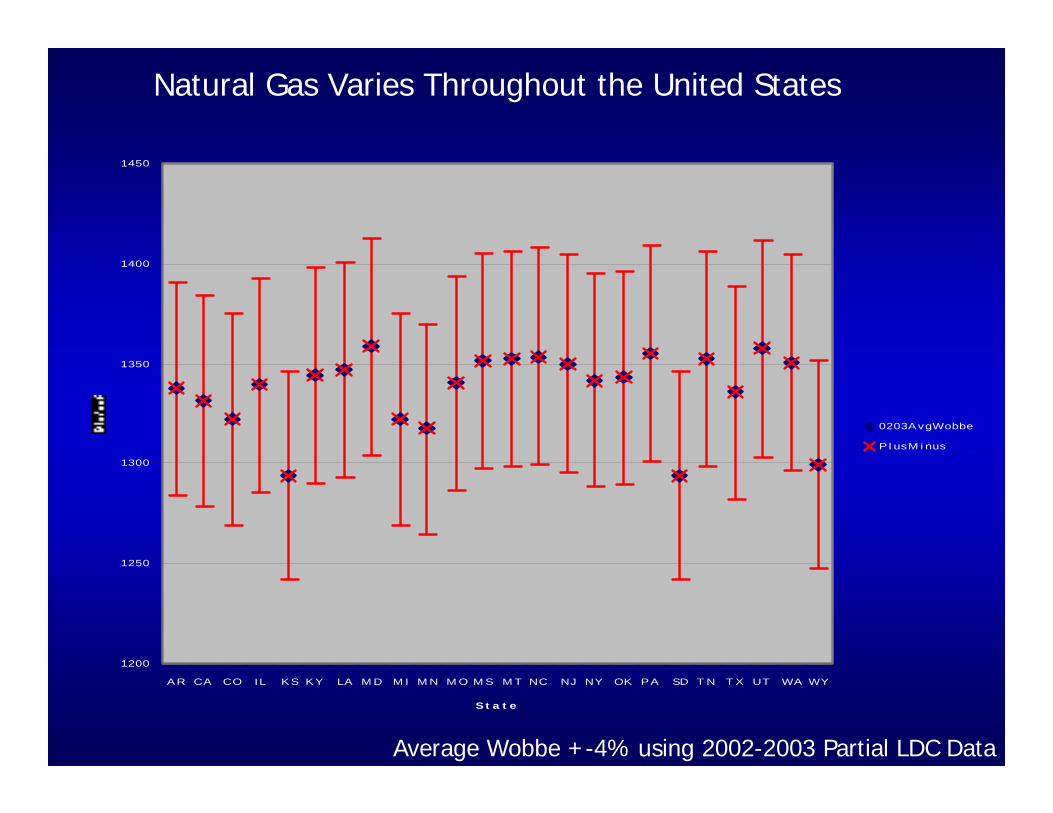
1200
1250
1300
1350
1400
1450
AR CA CO IL KS KY LA M D M I M N M O M S M T NC NJ NY OK PA SD T N T X UT WA WY
St a t e
0203AvgWobbe
P l usM i nus
Average Wobbe +-4% using 2002-2003 Partial LDC Data
Natural Gas Varies Throughout the United States

Gas Interchangeability ConcernsGas Interchangeability Concerns
EquipmentEquipmentEfficiency Efficiency Environmental PerformanceEnvironmental PerformanceMaintenanceMaintenanceLongevityLongevity
Natural Gas Supply CostNatural Gas Supply CostFungibilityFungibility of Natural Gas Transportation of Natural Gas Transportation MarketMarket

New high efficiency, low emission New high efficiency, low emission natural gas uses are sensitive to gas natural gas uses are sensitive to gas
compositioncomposition
Pictures and Diagrams courtesy John Zink Co. LLC & Sempra
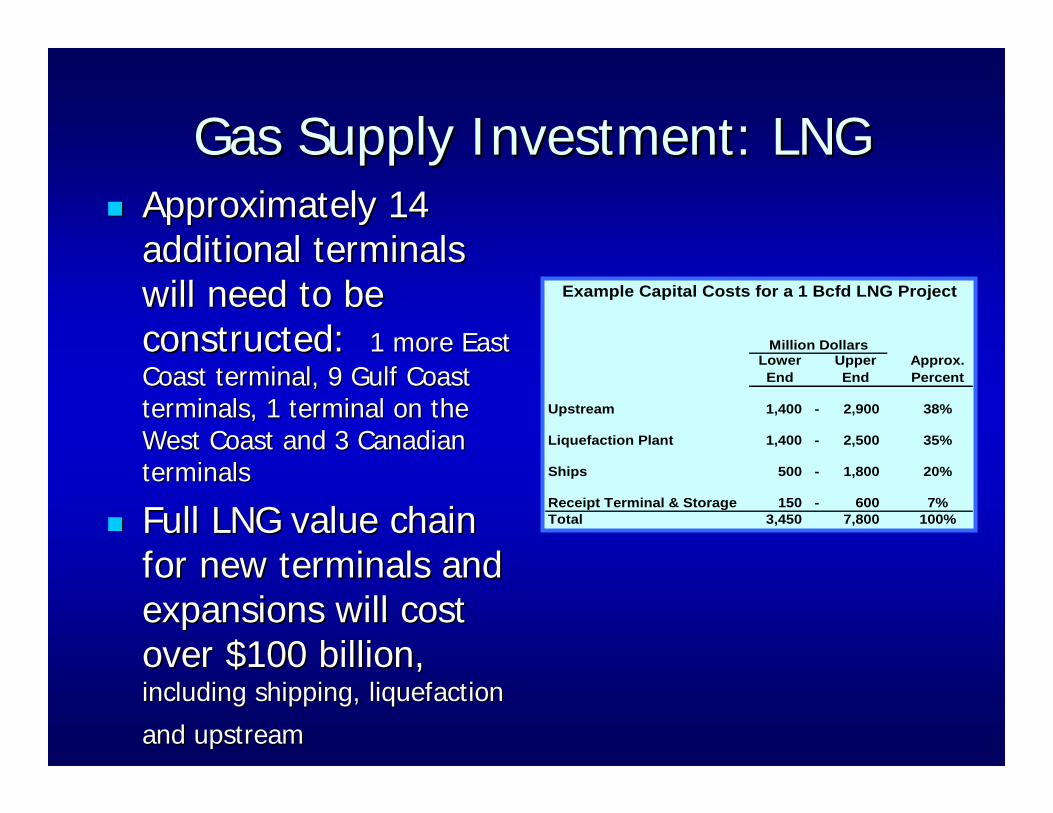
Gas Supply Investment: LNGGas Supply Investment: LNGApproximately 14 Approximately 14 additional terminals additional terminals will need to be will need to be constructed: constructed: 1 more East 1 more East Coast terminal, 9 Gulf Coast Coast terminal, 9 Gulf Coast terminals, 1 terminal on the terminals, 1 terminal on the West Coast and 3 Canadian West Coast and 3 Canadian terminalsterminals
Full LNG value chain Full LNG value chain for new terminals and for new terminals and expansions will cost expansions will cost over $100 billion, over $100 billion, including shipping, liquefaction including shipping, liquefaction
and upstreamand upstream
Lower End
Upper End
Approx. Percent
Upstream 1,400 - 2,900 38%
Liquefaction Plant 1,400 - 2,500 35%
Ships 500 - 1,800 20%
Receipt Terminal & Storage 150 - 600 7%Total 3,450 7,800 100%
Million Dollars
Example Capital Costs for a 1 Bcfd LNG Project

LNG imports will likely become the most important determinant ofLNG imports will likely become the most important determinant of market conditions in the market conditions in the next 10 years.next 10 years.Many different scenarios are possible:Many different scenarios are possible:
LNG Supply to U.S. is limited by demand growth elsewhere.LNG Supply to U.S. is limited by demand growth elsewhere.Base Case Base Case -- Approximately 16 Approximately 16 BcfdBcfd of imports by 2015.of imports by 2015.10 10 BcfdBcfd of LNG added to the Base Case by 2015.of LNG added to the Base Case by 2015.
LNG Imports - A Wildcard
0.0
3.0
6.0
9.0
12.0
15.0
18.0
21.0
24.0
27.0
2003 2005 2007 2009 2011 2013 2015
U.S
. and
Can
ada
Impo
rts
(Bill
ion
cubi
c fe
et p
er d
ay)
Base Case Limit 10
Courtesy of EEA

Key ConclusionsKey ConclusionsPrices will be high this winter, but there will be Prices will be high this winter, but there will be delivered gas…. if repair work is on schedule, it is a delivered gas…. if repair work is on schedule, it is a reasonable winter and the market and government acts reasonable winter and the market and government acts rationallyrationallyU.S. and Canadian gas infrastructure investments for U.S. and Canadian gas infrastructure investments for pipeline, storage and LNG terminals will cost $60 billion pipeline, storage and LNG terminals will cost $60 billion by 2020 are neededby 2020 are needed
To provide outlet for new supply sourcesTo provide outlet for new supply sourcesTo ensure continued service on traditional corridorsTo ensure continued service on traditional corridorsTo integrate new gas consumers to gridTo integrate new gas consumers to grid
LongLong--term contracts are one important way of term contracts are one important way of managing risks to all participants in pipeline and managing risks to all participants in pipeline and storage facilities and LNG terminalsstorage facilities and LNG terminalsLNG is needed to satisfy demand, diversify supply, LNG is needed to satisfy demand, diversify supply, reduce prices and dampen volatilityreduce prices and dampen volatility