washington/outlook farm bill – issues – elections
DESCRIPTION
Washington/outlook farm bill – Issues – elections. Volatility to Continue Jim Wiesemeyer Senior VP, Farm & Trade Policy Informa Economics. Economy. European crisis: Progress, but… China and India: Slower growth U.S.: Fed weighing action U.S. debt/ceiling: Could go into early ‘ 13. - PowerPoint PPT PresentationTRANSCRIPT

Volatility to ContinueJim Wiesemeyer
Senior VP, Farm & Trade PolicyInforma Economics

European crisis: Progress, but…
China and India: Slower growth
U.S.: Fed weighing action
U.S. debt/ceiling: Could go into early ‘13


75
100
125
150
175
200
225
Index (1990-92=100)
Prices received: crops
Prices paid*
*Prices paid commodities & services, interest, taxes and wage rates
Prices received: livestock
Sector is operating at higher price and cost levels with greater volatility …… more working
capital to play, less leverage permitted and more emphasis on well-defined risk
management policies
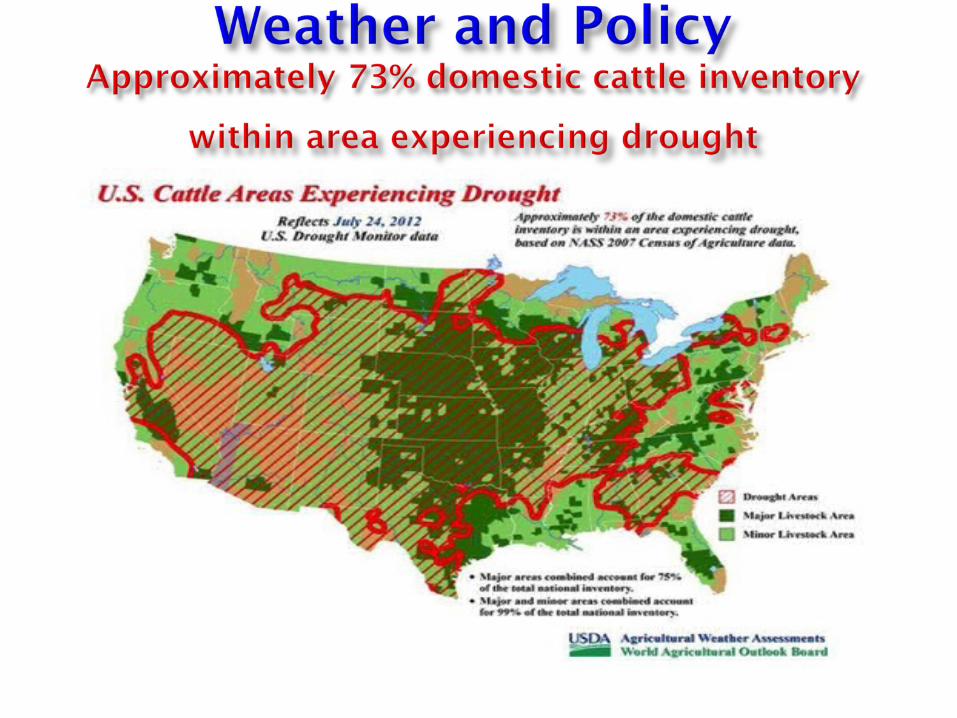
Drought Will Push Commodity Prices and Input Costs Higher

Farm Income : Agriculture Continues Strong Performance Despite Drought
75 77 79 81 83 85 87 89 91 93 95 97 99 01 03 05 07 09 11
0
20
40
60
80
100
120
Billion dollars
Net Farm Cash Income
Direct government payments*
* emergency payments are striped area of government payments)
Net cash income in agriculture reached nearly $110 billion in 2011. However a below normal
harvest and weak global economy signal declines in 2012. But insurance payments will limit
decline. Any transition to a new plateau is on hold…

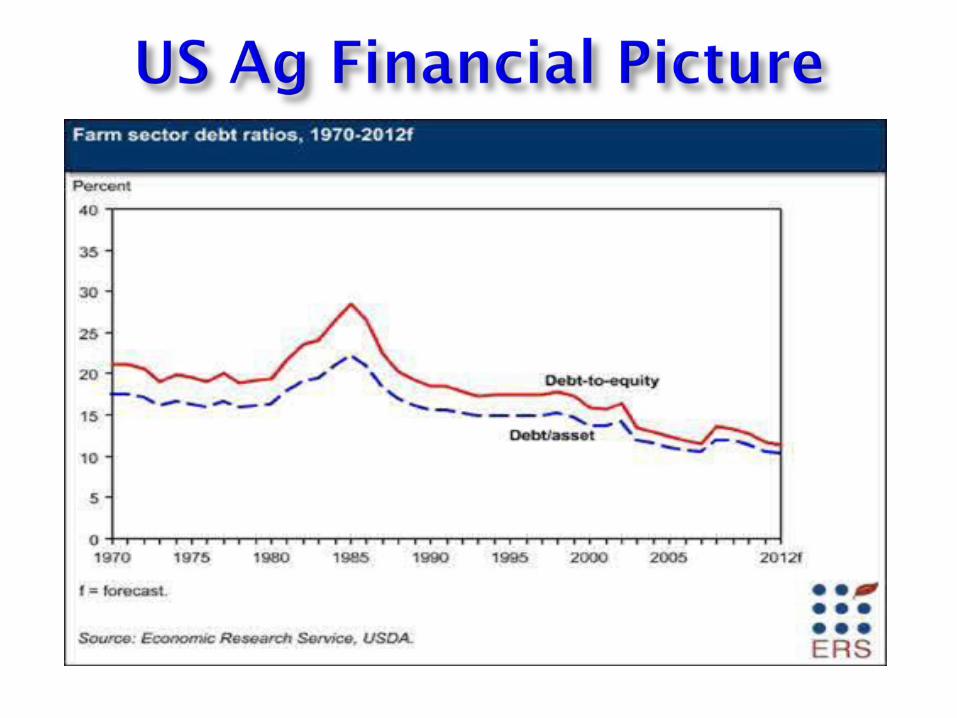
Farm Debt Leveraging Has Not Fueled Land Price Increases; Values to Moderate
0
500
1000
1500
2000
2500
3000
Billion dollars
0
100
200
300
400
500
600
Billion dollars
Change 1970-1980Assets ... +259%Debt ....... +235%
Change 1980-1990Assets ... -16%Debt ....... -19%
Change 1990-2000Assets ... +43%Debt ....... +25%
Change 2000-2010Assets ... +82%Debt ....... +51%
Farm assets(left scale)
Farm debt(right scale)
Change 2010-2012Assets ... +13%Debt ....... +3%
?

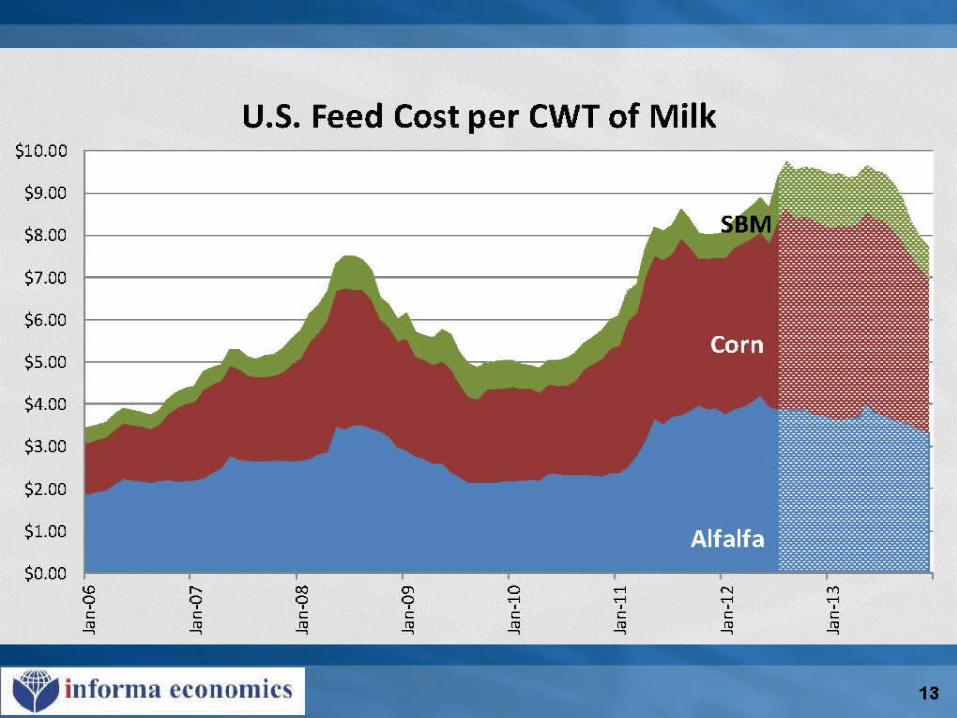
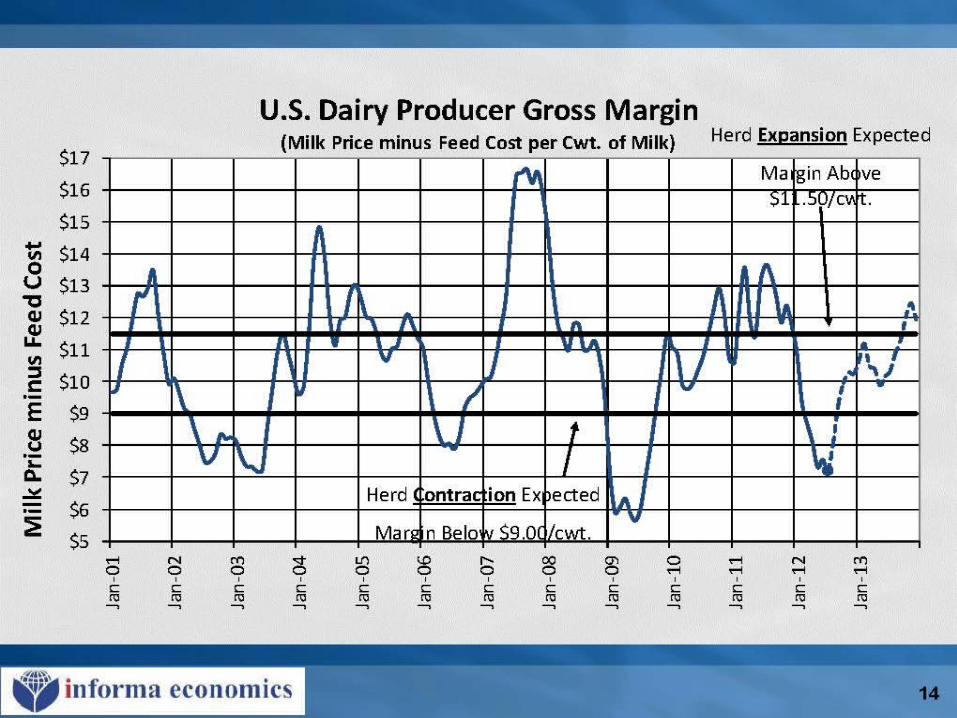
Protein and dairy sectors must take a cautious approach
Weak U.S. and global economy combined with continued low
grain inventories make impacts of
black swan events severe
Black Swan Events Are Amplified
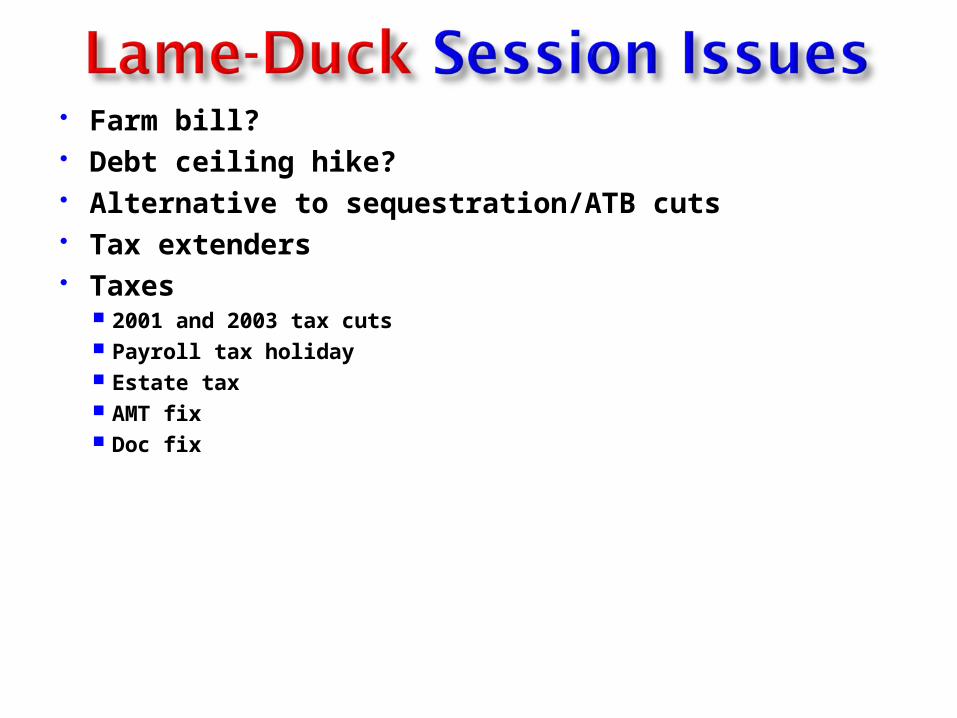
Farm bill? Debt ceiling hike? Alternative to sequestration/ATB cuts Tax extenders Taxes
2001 and 2003 tax cuts Payroll tax holiday Estate tax AMT fix Doc fix

Fiscal Cliff Would Remove $528 Billion from U.S. Economy in Fiscal 2013
$528 billion = 3.3% of U.S. economy in 2013
Expiration of: certain income tax cuts, reduced rates for estate and gift tax provisions, and the indexing of the AMT for inflation.
Expiration of the payroll tax holiday.
Defense cuts mandated by sequester
Non-defense spending cuts mandated by sequester
Expiration of emergency unemployment insurance benefits.
Doc fix
Expiring tax extenders
Cost of the expiring tax provisions and spending cuts for fiscal 2013. (billion dollars)
Sources; Congressional Budget Office, Bipartisan Policy Center and Eurasia Group

White House: Vilsack briefs Obama, Cabinet
Congress: Livestock disaster programs, but blame it on 2008 Farm Bill…
Farm Bill: Obama, Dems use drought to urge House farm bill vote, but House GOP balks
Food price impact: Delayed, but…

Food prices: Higher ahead 2012: 2.5 to 3.5% increase 2013: 3% to 4% rise Food prices in 2007 rose 4.0% from 2006 Food prices in 2008 rose 5.5% from 2007
But focus in 2007 and 2008 was more on world prices, especially wheat, rice and vegoil


Uncertainties Over U.S. Crops Dominate Market Developments
Major Concern About New Crop Prospects

70 73 76 79 82 85 88 91 94 97 00 03 06 09 12
60
70
80
90
100
110
120
130
140
150
160
170
Bushels per acre for corn
Crop year
actual corn yield
1990-2010 trend yield
Trend 163.9 bushels per acreJune USDA proj. at 166.0July USDA proj. at 146.0
Aug. USDA est.: 123.4
U.S. Corn Yield Will Be Well Below Trend for Third Consecutive Year

0
50
100
150
200
250
Million metric tons
Brazil and Argentina
United States
World
-11%
+13%
World Soybean Production on Roller Coaster Ride But Critical in 2012/13
Elephant in the market!

0
50
100
150
200
250
Million metric tons
Brazil and Argentina
United States
World
-11%
+13%
World Soybean Production on Roller Coaster Ride But Critical in 2012/13
Elephant in the market!

0
25
50
75
100
125
150
Million metric tons of coarse grains
+32 mmt
World Wheat Feeding Will Remain Strong
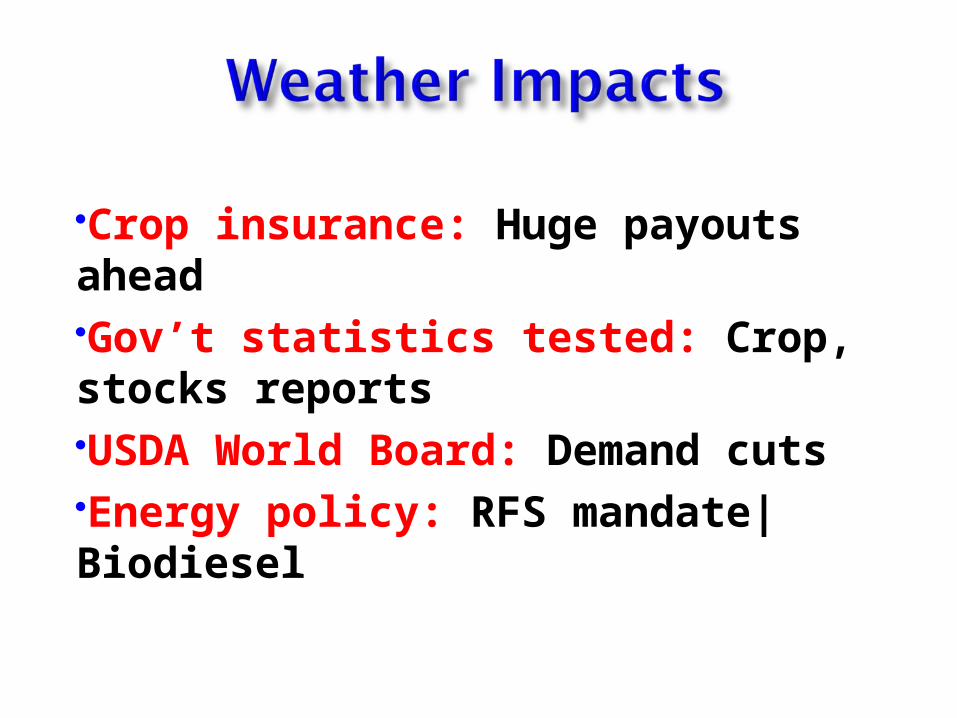
Crop insurance: Huge payouts ahead Gov’t statistics tested: Crop, stocks reportsUSDA World Board: Demand cuts Energy policy: RFS mandate|Biodiesel
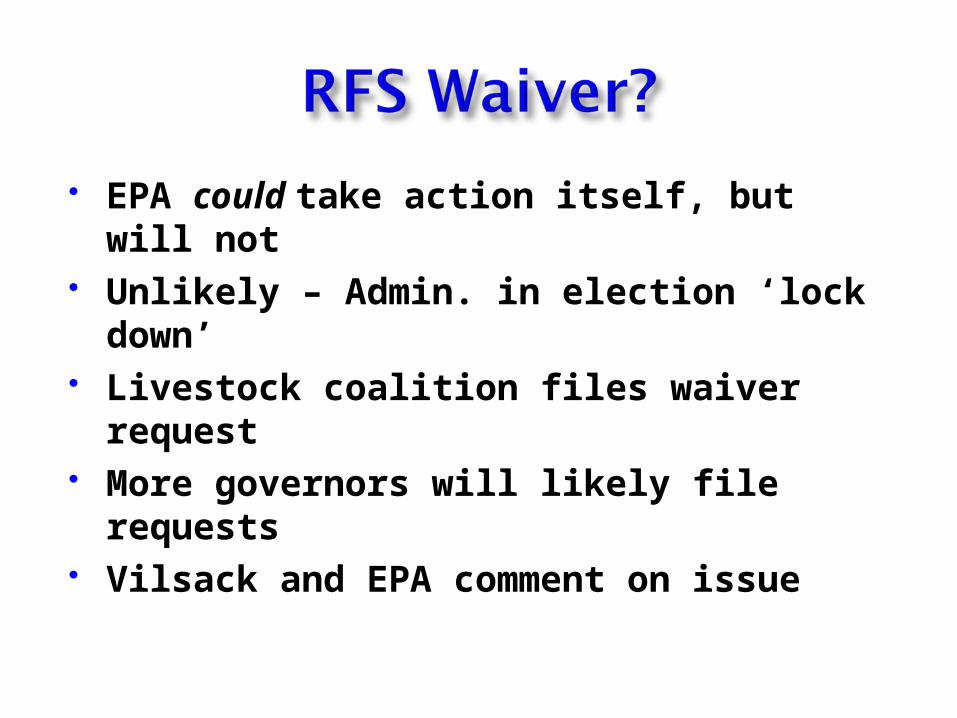
EPA could take action itself, but will not Unlikely – Admin. in election ‘lock down’ Livestock coalition files waiver request More governors will likely file requests Vilsack and EPA comment on issue
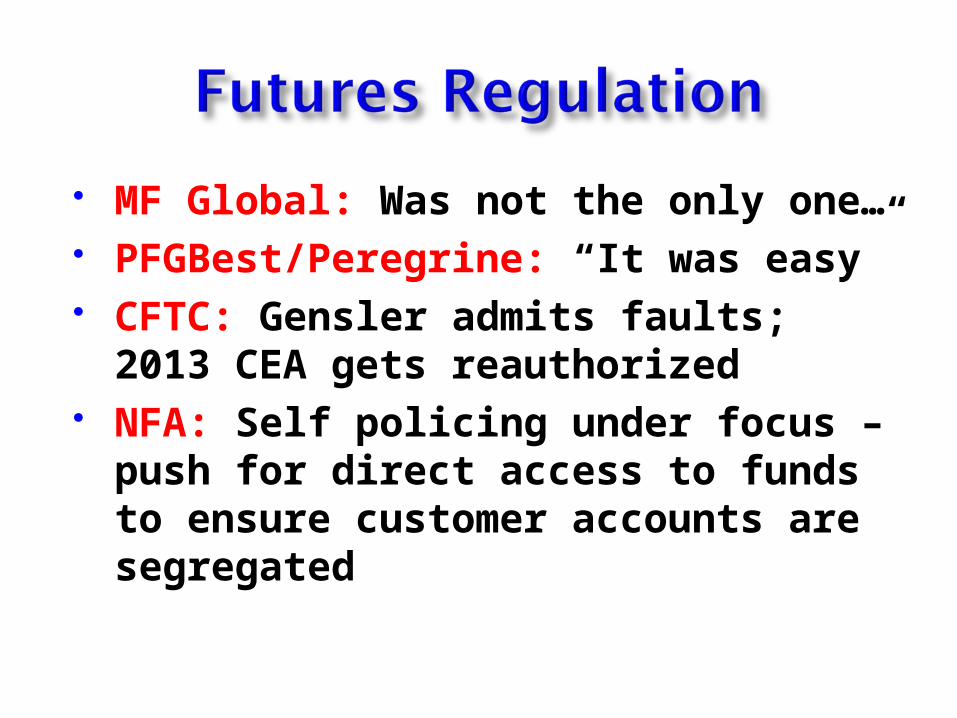
MF Global: Was not the only one… PFGBest/Peregrine: “It was easy” CFTC: Gensler admits faults; 2013 CEA gets
reauthorized NFA: Self policing under focus – push for
direct access to funds to ensure customer accounts are segregated
U.S. and Russia’s WTO accession
TPP
New farm bill WTO challenges? New USDA Undersecretary for trade?
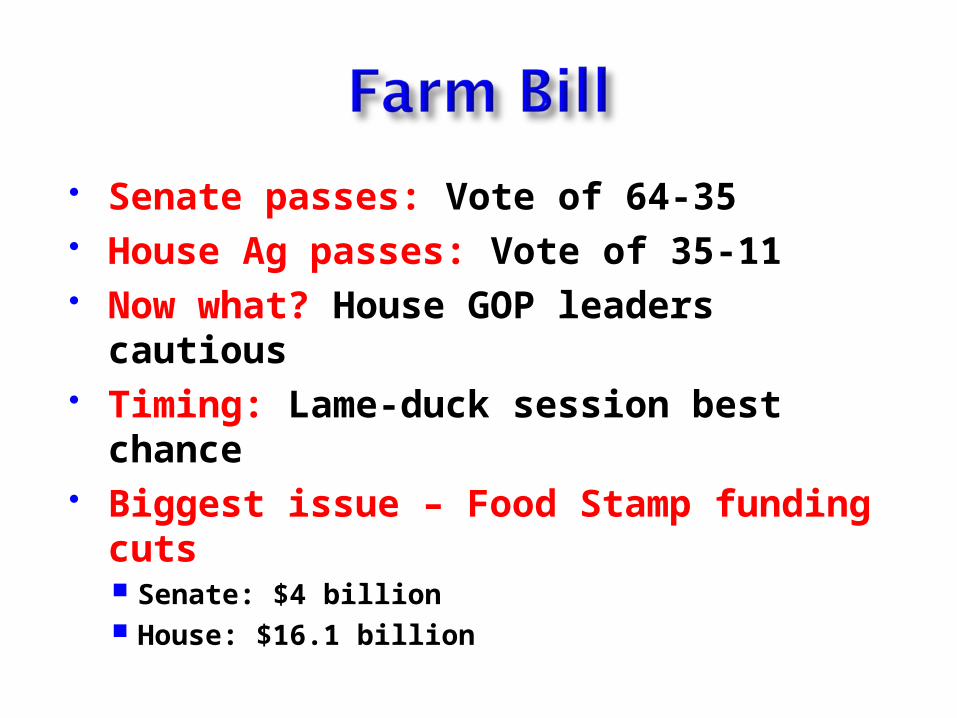
Senate passes: Vote of 64-35 House Ag passes: Vote of 35-11 Now what? House GOP leaders cautious Timing: Lame-duck session best chance Biggest issue – Food Stamp funding cuts
Senate: $4 billion House: $16.1 billion

Focus: Revenue assurance, SCO, crop insurance, food stamps, target prices
Key: Move from base to planted acres Direct payments: Eliminated Pay cap changes won by Sen. Grassley
AGI at $750,000 in Senate; House at $950,000 Pay cap $50,000 Senate; House $125,000 Actively engaged definition change in Senate, not House
Dairy: Supply management

Estimated total spending: $970 billion over 10 years

Source: National Journal Member Research, 2012.
Elections:The Factors That Matter Most
Watch with a Critical Eye – Not Every CampaignTwist and Turn Is Important
But… The LIKEABILITY Factor…
Which Is It?:•Retrospective referendum?
(or)
•Prospective choice?
Campaign Story
Swing-State Analysis:•Swing-state economic fortunes
•Swing-state demographics
Swing States
Economic Trajectory:•Historical growth rate
•Future economic expectations
Economic Outlook
I II III

Key states… Obama immigration change key Nevada (Hispanics 17% of voters) Iowa Ohio Virginia Colorado (Hispanics 13% of voters) New Hampshire North Carolina Wisconsin Florida (Hispanics 19% of voters)
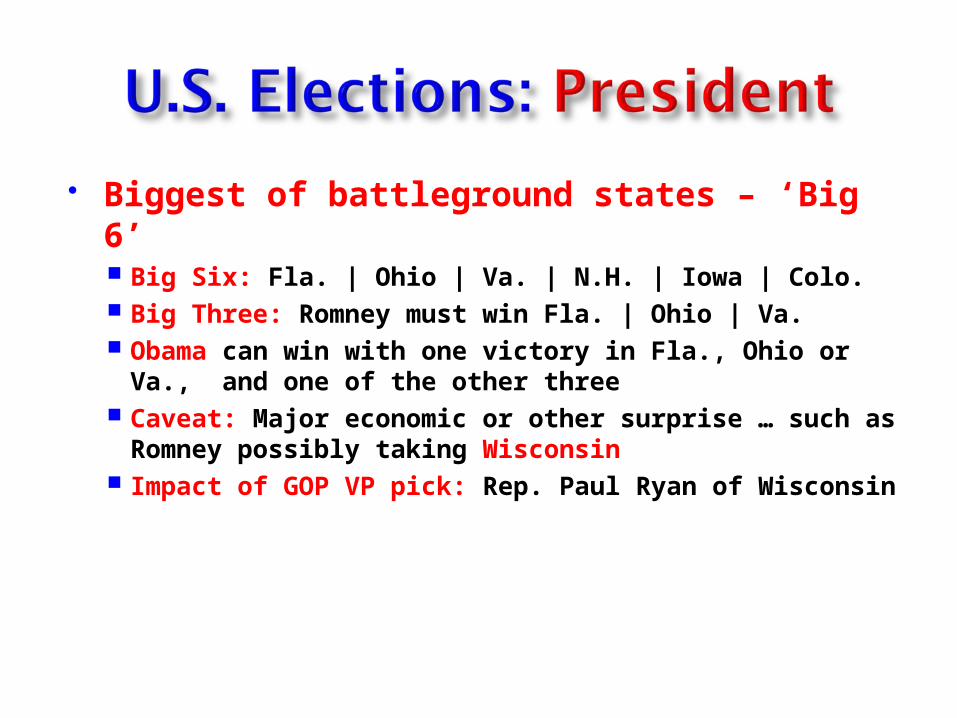
Biggest of battleground states – ‘Big 6’ Big Six: Fla. | Ohio | Va. | N.H. | Iowa | Colo. Big Three: Romney must win Fla. | Ohio | Va. Obama can win with one victory in Fla., Ohio or Va., and one
of the other three Caveat: Major economic or other surprise … such as Romney
possibly taking Wisconsin Impact of GOP VP pick: Rep. Paul Ryan of Wisconsin

Bottom Line: Who Will Win?Predictions
President Obama WinsRe-Election
Republicans Retain Control
of the House
Senate in 50/50 Split???
55%, but… 75%Presidential election key
???

