short- and medium-term effects of tillage systems on soil
TRANSCRIPT
i
Short- and medium-term effects of tillage systems on soil properties
and organic spring wheat performance
Student name: Shuyao Wang Period: 2014.3-2014.8
Farming Systems Ecology Group Droevendaalsesteeg 1 – 6708 PB Wageningen - The Netherlands ___________________________________________________________________________

i
Short- and medium-term effects of tillage systems on soil properties and organic spring wheat performance
Student name: Shuyao Wang Registration student number:881122927100 Credits:36 Code number: FSE-80436 Course name :MSc Thesis Farming Systems Ecology Period:2014.3-2014.8 Supervisor(s):Egbert Lantinga Examiner: Jeroen Groot

ii
Abstract This research was conducted at the organic experimental farm of Droevendaal at Wageningen UR in the central Netherlands. The objectives of this study are to investigate effects of three tillage methods by quantifying the soil’s physical, chemical, biological, and crop growth aspects in organic wheat production over short and medium-timescales. Two fields were selected for the experiment, and three different tillage systems were implemented in this project, including deep mouldboard-plough (CON 20-30cm), ECO shallow mouldboard-plough (ECO 12-18cm) and non-inversion tillage (NIT 10cm). One has been continuous practiced for five years and another is carried out in the first year. Field samples were collected to measure SOM and N min. Subsamples were used to determine soil moisture. Bulk density, porosity, water-filled pore space and soil penetration resistance were measured to determine soil physical aspects. Plant parameters were collected in different wheat growth stage to determined LAI, SPAD values, plant height, crop dry matter yield and final grain yield were measured during growing season. Number of earthworms was counted after harvesting. Soil bulk density of NIT was found to be lower in the 1st year field and higher in the 5th year field. A 30cm plough pan was found in the 1st year field, but this was alleviated in the 5th year field. NIT was found to have higher SOM in both soil layers in both fields. A faster mineralization rate was found for CON in both fields. As to wheat growth performance, lower soil temperature and lower seed emergence were found in NIT in both fields. However, NIT was found to perform better in terms of plant height, LAR, LAI, LWR, SLA, and SPAD in the crop foundation and construction period. Due to a high amount of precipitation, nitrogen deficiency was found in both fields in the crop production period. The wheat crop in CON caught up in the later production stage in the 1st year field and had a higher yield. Key words: Non-inversion tillage, compaction, seed emergence, wheat performance, earthworm, N mineralization, Netherlands

iii
Contents Abstract ...................................................................................................................................... ii 1.Introduction ............................................................................................................................. 1 2. Materials and methods ........................................................................................................... 4
2.1 Site condition .................................................................................................................... 4
2.2 Climate conditions ............................................................................................................ 4 2.3 Soil measurements ............................................................................................................ 5
2.3.1 Soil temperature ........................................................................................................ 5 2.3.2 Seed emergence ......................................................................................................... 5 2.3.3 Bulk density ............................................................................................................... 5
2.3.4 Penetration resistance (PR) ....................................................................................... 6 2.3.5 Earthworm number .................................................................................................... 6 2.3.6 Soil mineral nitrogen content .................................................................................... 6
2.3.7 Soil organic matter .................................................................................................... 6 2.4 Plant measurements .......................................................................................................... 6 2.5 Statistical analysis ............................................................................................................ 6
3.Results ..................................................................................................................................... 8
3.1 Effect of different tillage methods on soil properties ....................................................... 8 3.1.1 Bulk density ............................................................................................................... 8
3.1.2 Soil porosity and soil water-filled pore space ........................................................... 9 3.1.3 Penetration resistance .............................................................................................. 10 3.1.4 Soil moisture ........................................................................................................... 11 3.1.5 Earthworm numbers ................................................................................................ 11 3.1.6 Soil mineral nitrogen (Nmin) .................................................................................... 12
3.1.7 Soil organic matter (SOM) ...................................................................................... 13
3.1.8 Soil temperature and seed emergence. .................................................................... 14
3.2 Effect of different tillage methods on plant growth ....................................................... 15 3.2.1 Plant height .............................................................................................................. 15 3.2.2 SPAD ....................................................................................................................... 16 3.2.3 Plant growth index .................................................................................................. 16
3.2.5 Yield components .................................................................................................... 17 4. Discussion ............................................................................................................................ 18
4.1 Effect of tillage on soil properties .................................................................................. 18 4.2 Effect of tillage on plant growth .................................................................................... 19
5.Conclusions ........................................................................................................................... 21
6.Acknowledgements ............................................................................................................... 22 References ................................................................................................................................ 23 Appendix .................................................................................................................................. 26
Appendix1 ............................................................................................................................ 26

1
1.Introduction
Tillage is an essential aspect of farm management that aims to create a favourable environment for plant growth. The role of tillage in agricultural production is to loosen and aerate the soil, thereby increasing the soil porosity to facilitate the acceptance and storage of water and promote the extension of crop roots. In addition, tillage buries crop residue, which improves weed and disease control (Vakali, Zaller et al. 2011). As per the FAO definition, tillage can change the soil’s fertility status; loosen, granulate, crush or compact soil structure; and change soil properties such as bulk density, pore size distribution and composition of the soil atmosphere, all of which affect plant growth. Tillage is often classified into two types, primary and secondary. Primary tillage is used to improve soil workability in the spring and tends to produce a rough surface finish. Secondary tillage has a tendency to produce a smoother surface finish to make a good seedbed for weed removal and to enhance seed germination and seedling development. Harrowing and rototilling often combine primary and secondary tillage into one operation (Cannell 1985). Mouldboard ploughing is a traditional cultural operation that has been the most widely used primary tillage method in many countries including the Netherlands (Cannell 1985; Koepke 2003). Generally, conventional systems of tillage leave less crop residues and inverse the soil to 20-35cm depths (Peigné, Ball et al. 2007). This farming system is fed on petroleum and creates big problems with erosion and compaction (D’Haene, Vermang et al. 2008). Due to compaction of deeper soil layer by heavy farm machinery, farmers in Western Europe are tending to increase the ploughing depth using even more powerful machinery (Kouwenhoven, Perdok et al. 2002). Conservation tillage was introduced by the FAO as a concept for resource-efficient agriculture crop production. It is aimed at sustainable and profitable agriculture. As defined by the FAO, conservation tillage is set of practices that leave crop residues on the surface, which in turn increases water infiltration and reduces erosion. The principle is to minimize the soil disturbance and let the soil microorganisms and soil fauna take over the tillage function and soil nutrient balancing. Reducing the intensity of soil tillage would decrease energy consumption and increase carbon sequestration (Holland 2004). In the short-term, conservation agriculture increased soil water availability and reduced soil temperature oscillations, and in the long- term conservation agriculture increased soil organic matter and improved the soil structure. Thus, conventional tillage is perceived to be less sustainable compared to conservation tillage (ACT 2008). Optimal soil tilth is of paramount importance in organic farming systems. As documented in IFOAM basic standards, operators should minimize loss of topsoil through minimal tillage maintenance of soil plant cover and other management practices that conserve soil, and operators should take measures to prevent erosion, compaction, salinization, and other forms of soil degradation (IFOAM 2002). In organic farming, a more diverse crop rotation and application of organic amendments would lead to a high soil biological activity and better aggregate stability (Köpke 1995; Koepke 2003). From these aspects, conservation tillage and organic agriculture have same objective of soil conservation. The potential advantages of conservation tillage in organic farming are reduced erosion, greater macro porosity in the soil surface due to the larger number of earthworms, more microbial activity and carbon storage, and less run-off and leaching of nutrients. Nevertheless, compared with USA, Brazil, Argentina, Canada, and Australia, conservation tillage is not widely used in most of the European countries (Koepke 2003; Peigné, Ball et al. 2007; Mäder and Berner 2012). In a temperate climate, the greatest disadvantage of reduced tillage in organic farming is that it may lead to a reduced crop development due to greater pressure from grass weed growth and mainly caused by a delay and low soil nitrogen mineralization .Often a higher nitrogen input is

2
necessary to maintain yields, due to reduced net mineralisation in the early growth stage (Köpke 1995; Koepke 2003; Peigné, Ball et al. 2007). Conservation tillage (no-tillage and reduced tillage) mostly is a non-inversion tillage practice. Organic researchers in the EU are focusing on reduced tillage, while organic researchers in the U.S. are focusing on no-tillage (Mäder and Berner 2012). A study by Dedelice and Carter et al. (2006) reports that conservation tillage in Canada and northern U.S. shows a negative effect compared to conventional tillage, while in the southern and western U.S. conservation tillage has a positive effect compared to conventional. A possible reason is that the spring soil temperature in Canada and the northern U.S tends to be lower. Lower soil temperatures would cause a delay in seed emergence (Soane, Ball et al. 2012), which often leads to postponement of vegetative growth, flowering, and grain dry down. The reduced tillage system is perceived as having lower soil temperatures and wetter soil conditions compared with conventional tillage systems. Soil temperatures can be influenced by the tillage practice and can significantly affect crop growth rates (Johnson and Lowery 1985). Reduced growth rates can result in a significant yield loss (Licht and Al-Kaisi 2005; DeFelice, Carter et al. 2006), although yield reductions due to conservation tillage have occurred mainly in the high latitudes. A good farmer always feeds the soil than feeds the crop. Soil quality is generally evaluated on physical, chemical and biological factors (Karlen, Mausbach et al. 1997). Tillage is the most common way to modify the soil structure and soil aggregation. Doubt about conventional tillage from a physical aspect mainly is that continuous tillage will work against the build-up of organic matter by increasing the rate of decomposition and thus destroy soil structure (Gajri, Arora et al. 2002; Gadermaier, Berner et al. 2012). Ball, Cheshire and colleagues (1996) concluded that soil nitrate was vulnerable to loss by denitrification, particularly in wet, fine-textured soil. In both organic farming and conservation farming, the top soil is more dense than when conventional tillage is used due to more soil organic material (Munkholm, Schjønning et al. 2001; Kouwenhoven, Perdok et al. 2002; Koepke 2003; Peigné, Ball et al. 2007). Soil organic matter concentrated to the top soil layer with conservation tillage encourages microbial activity, leading to increased soil aggregate stability and improvements in soil structure (Mäder and Berner 2012). Earthworm and soil microbiota have a positive effect on enhancing soil quality by their abundance and activity. Some reports have documented mouldboard ploughing as negatively affecting earthworm abundances in the short term. While some reported that there is no significant effect of total earthworm population in different tillage systems (Chan 2001; Peigné, Ball et al. 2007; Crittenden, Eswaramurthy et al. 2014) However, they also indicate that earthworms are not only affected by mechanical damage and predation during ploughing but also due to changes in the habitat of the earthworm. Soil quality will be affect by changing the population of different species (Capowiez, Cadoux et al. 2009). Anectic earthworms prefer plant residues in the upper layer, which accumulates by reduced tillage depth (Kouwenhoven, Perdok et al. 2002).They mainly contribute to soil structure by increasing porosity and pore continuity with their vertical burrows (Capowiez, Cadoux et al. 2009; Keith and Robinson 2012; Kuntz, Berner et al. 2013). In the long term, continuous soil pores maintained and improved by increased earthworm populations improve the water-holding and drainage capacity of the soil and promote root growth (Schjønning and Rasmussen 2000). Soil erosion is not considered in most of the Netherlands (Winteraeken and Spaan 2010). However, in terms of sandy gleyicpodzols and fine-textured fluvisols, a sensitivity for compaction and high water tables are commonly found in the Netherlands (Cannell 1985). The high risk for compaction is caused by poorly drained soils due to high water tables. Compaction can result in deterioration of both topsoil and subsoil structure. It is mainly caused by vehicle traffic. Here, three kinds of compaction can be distinguished: short-term compaction, long term topsoil compaction, and long-term subsoil compaction (Ehlers, Köpke et al. 1983; Peigné, Ball et al. 2007). Top soil compaction may be a problem, particularly during the first year of transition from conventional to conservation tillage,

3
leading to impeded drainage, restricted crop emergence, and poorer root development (Peigné, Ball et al. 2007). The average soil penetration resistance in the arable layer increased with increasing ploughing depth. In the transition period, the resistance was greater increased when plough depth was started to reduce to the minimum depth (Kouwenhoven, Perdok et al. 2002; Aikins and Afuakwa 2012). Several researchers (Schjonning and Rasmussen 2000; Olaoye 2002; Geerse 2010;) reported that compaction was reduced with reduced tillage-systems, and an increased volume of macro pores was found in the lower soil-layers, resulting in an improved soil aeration. This decrease could be caused by an enriched soil life and corresponding increase in earthworm channels and pore-volume (Hermawan and Cameron, 1993). This may imply that the plough pan disappears with NIT. This decrease counteracts soil compaction in the longer term. Conversely, Lopéz et al. (1996) found a higher compaction under non-inversion tillage, and Arshad, Franzluebbers, and colleagues (1999) found greater soil bulk density in the untilled layer and the whole topsoil. Further, Nkakini and Fubara-Manuel (2012) determined that different tillage treatments had no significant effect on penetration resistance and the total porosity of soil. Organic agriculture is increasing in the Netherlands. While farmers still use deep mouldboard ploughing both for weed control and soil incorporation of farm-yard manure or slurry, few farmers adopted conservation tillage into organic management. A possible reason for slow acceptance of organic tillage methods is the negative effect during the transition period. In the transition, soil compaction and lack of available nutrient lead to a yield decrease, but many papers report that yield will catch up after a few years due to the soil quality improvement. However, ploughing in organic methods has a main function of weed control. An added advantage is that mouldboard ploughing reduces ammonia emission in comparison with non-inversion cultivation (Kouwenhoven, Perdok et al. 2002). There was generally little difference in spring wheat yield between conventional and reduced tillage (Smolik and Dobbs 1991). The aim of this study was to adapt reduced tillage to organic farming by quantifying effects of tillage during and after a transition. An extensive literature search revealed few studies that have quantified the effects of different tillage systems over short and medium timescales simultaneously in organic farming systems in the Netherlands. The study was achieved by investigating effects of three tillage practices on soil physical, chemical, biology, and crop growth aspects of organic wheat production in the first transition year and fifth year of practice in the Netherlands. We hypothesized that:
The average soil penetration resistance in the arable layer decreased with increasing
ploughing depth .
Soil temperature will be lower in no-inversion tillage compare to conventional tillage. And lower soil temperature led to a lower seed emergence.
Earthworm activity (density and biomass) will be higher in non-inversion tillage compare to eco mould board plough and deep mould board plough
Crop performance better in conventional tillage than non-inversion tillage and eco mouldboard ploughing, while after five years practice, yield of non-inversion increased.
The Nmin will be lower in the initial stage at reduced stage and nutrient in the surface will higher than in the deeper soil layer. SOM will be higher in the top layer in non-inversion tillage compared to eco mouldboard plough and conventional deep mouldboard plough.

4
2. Materials and methods
2.1 Site condition This research was conducted in 2014 at the organic e perimental farm of Droevendaal at ageningen in the central etherlands ( ’ 2’’ , ’ ’’ ) on loamy sand soil (USDA) containing 88% sand, 7% loam, and 4% silt. Annual precipitation amounted to 823.7mm and average annual air temperature was 11oC (Appendix2). Three different tillage treatments were implemented in this project, including deep mouldboard–plough (CON), ECO shallow mouldboard-plough (ECO) and non-inversion tillage (NIT). Deep mouldboard-plough is a conventional treatment with mouldboard ploughing to 25-30cm depth. ECO-plough is a shallow mouldboard plough developed by Rumptstad Industries. The plough has seven or eight bottoms for ploughing depth of 12-20cm, and a working width of 2.1 m. The tractor runs on the top of the land with wide low pressure tyres instead of running in the furrow with narrower normal preassure tyres. Non-inversion plough is turning the upper 10cm layer with a rotary tiller. To evaluate short and medium term consequences of transition to organic practices, two fields were designated. Field No2+3 had been five years practices for three different tillage methods. The field was divided equally into three different tillage systems. The preceeding crop was maize, summer wheat, spring barley. In August 2013, radish, rye grass, and mustard mixed as cover crop planted in both fields was incorporated into the soil during the fertilizer incorporation. Cattle slurry was injected before tillage. The field was tilled on 10-April, 2014, and 190kg/ha spring wheat was sown on 11-April at a row distance of 12.5cm. There were no replications or random blocks of fields with different plough depths in the past practice. Thus, for this work, three 10*10m2 areas were selected for each tillage system (Appendix1). Seedbed preparation was carried out similarly on the entire field using a rototiller. Field No4 is a newly started experiment. The preceeding crop was Triticale, grass/clover for two years, spring wheat. In August 2013, radish, rye grass, and mustard mixed as cover crop planted in both fields was incorporated into the soil during the fertilizer incorporation. The field was tilled on 22-April, 2014, and 190kg/ha spring wheat was sown on 23-April. Row distance is 12.5cm. Due to the limit of field size and equipment, a partly split plot design with the main factor of three tillage system, sub-factor is two different types of fertilization, slurry and solid cattle manure. Each treatment was replicated 3 times (Appendix 1). Seedbed preparation was carried out similarly on the entire field using a rototiller. Plot of solid cattle manure is not being considered as the comparison need be the same. During the growing season, mechanical weed control (harrowing and hoeing) was applied several times using a 3.15 meter wide tractor with a GPS system on permanent tracks.
Table 1. Description of different levels of experimental factors.
Factors Levels
Tillage system 3 levels: Deep mouldboard -plough(CON) shallow mouldboard= plough (ECO) Non-inversion tillage (NIT)
Timescales 2 levels: First year practice (1st-yr) Fifth year practice (5th-yr)
2.2 Climate conditions

5
Figure 1. Daily mean temperature and precipitation in crop growth period (Source: Knmi).
2.3 Soil measurements
2.3.1 Soil temperature
Soil temperature was measured by Thermocouple thermometer, produced by Eijkelkamp ART.NO16.34. Sensors placed at a soil depth of 10 cm located between two adjacent wheat plants. Sensors were connected to a data logger and data was collected the first and second weeks after ploughing.
2.3.2 Seed emergence
Emergence was determined when the bud broke up the soil. Three 1m long row sections of were sampled in each plot (Gozubuyuk, Sahin et al. 2014), to determine the mean emergence time (MET), the emergence rate index (ERI), and the percentage of emergency (PE). Field 4 was measured at 7 and 9 days after planting. Field 2+3 was measured at 10 days after planting Weeding took place at 10 and 11 days after planting in both fields, so no further measurements of seed emergence were possible..
2.3.3 Bulk density
Samples were taken from six different soil depths (0-5, 5-10, 10-15, 15-20, and 25-30cm) using 50mm diameter rings. Six soil cores were obtained from each plot in May and June 2014. Dry bulk density, soil porosity, and soil water filled pore space were calculated using the formula provided by (Avnimelech, Ritvo et al. 2001).
Soil water content (g/g) = (weight of moist soil - weight of oven dry soil)/ weight of oven dry soil
Soil bulk density (g/cm3) = oven dry weight of soil/volume of soil

6
Soil water-filled pore space (%) = volumetric water content x 100/soil porosity
Volumetric water content (g/cm3) = soil water content (g/g) x bulk density (g/cm3)
Soil Porosity(%)=1- soil bulk density/2.65
2.3.4 Penetration resistance (PR)
The soil penetration resistance was measured after milking stage. A digitalpenetrologger (1.00, Eijkelkamp) was used to measure the penetration resistance to a depth of 75cm (Kouwenhoven, Perdok et al. 2002). A cone with a base area of 1 cm2 and a 60° angle was used.
2.3.5 Earthworm number
To investigate number of earthworms present, the method of hand sorting according to Berner,Hildermann et al. (2008) was used. The sampling unit was 0.3m*0.3m per experimental plot to a soil depth of 30cm. Earthworms were hand-sorted and stored in Petri dishes, rinsed with DI water, and blotted before couning.
2.3.6 Soil mineral nitrogen content
Soil Nmin content was assessed at 0, 4, and 12 weeks after planting (GS13,GS39,GS87) at the depth of 0-10cm, 10-20cm , 20-30cm, and 30- 60cm. Soil available N-NO3 and N-NH4+ were measured using the methods described in Houba et al. (1990). Approximately 3.8g samples were extracted by shaking in 0.01mol CaCl2 for two hours and analysed using a segmented-flow system (Auto-analyzer II, Technicon).
2.3.7 Soil organic matter
A subsample of the soil taken at the GS87 stage was used to determin N min. For analysing soil organic matter content, approximately 20g of each samples was oven-dried at 105 C and measured by incineration of dry material at 0 C for three hours. Each batch was turned 1.5 hour after the temperature reached 0 to avoid the effect of uneven temperature between furnaces door side and the opposite side.
2.4 Plant measurements LAI were measured at 4 and 8 WAP (GS23,GS43). From each plot, 1m2 area was harvested and separated into stems and leaves. Leaf area was measured using a LICOR leaf-area meter (LI-COR LAI-2000,USA) (Deblonde, Penner et al. 1994). The total and separated biomass was measured by weight. Then subsamples were taken to the laboratory and dried at 70°C at least three days to obtain leaf and stem dry biomass. Leaf area ratio (LAR), leaf weight ratio (LWR), and specific leaf ratio(SLA) were calculated using the equation below (Amanullah, Nawab et al. 2007). SLA=A/WL LAR=A/W A =leaf area WL = leaf dry mass W=total dry mass Plant heights were measured at GS25, GS47, GS61, and GS71 in 1-yr field using a tape from soil level to the top meristem. Height in the 5-yr field were measured at GS47 and GS61. Chlorophyll content was measured at flag leaf using a SPAD meter. Fifteen plants per net plot were measured for this measurement. Yield of net plots were determined by manual harvesting in a 1m2 block at the end of the growing period.
2.5 Statistical analysis

7
Data from the different fields (1st year field and 5th year field) were treated as different datasets because of the different crop rotation and manure rotation in the recent year. The data sets were therefore analysed separately with software program IBM SPSS statistic 20. The effect of tillage methods on soil temperature, emergence, earthworm number, SPAD, plant height, yield, and plant growth index were analysed using one way ANOVA. When more than two tillage methods were used and the one way ANOVA showed a significant effect, a post hoc multiple comparison test (LSD) was performed to explore which treatments were significantly different from each other. For analysis of bulk density, water filled pore space, porosity, penetration resistance, soil moisure, Nmin, and SOM, soil layer was included as second independent factor in a two way ANOVA. P-values <0.05 were considered to be significant.

8
3.Results
3.1 Effect of different tillage methods on soil properties
3.1.1 Bulk density
Table and figure 2. Effect of three different tillage system (non-inversion (NIT), ECO-shallow
mouldboard plough (ECO), conventional mouldboard plough (CON)) on soil bulk density. Different
letters indicate significant differences according to the LSD-test (<0.05).
1st-yr 5th -yr
BD (Mg m-3)
Soil layers(cm) NIT ECO CON NIT ECO CON
0-5 1.0 1.1 1.2 1.2 1.2 1.3
5-10 1.2b 1.2b 1.4a 1.3 1.4 1.3
10-15 1.0b 1.1b 1.4a 1.5A 1.4B 1.3B
15-20 1.3 1.2 1.3 1.4 1.4 1.3
20-25 1.2 1.4 1.3 1.4AB 1.4A 1.3B
25-30 1.3 1.3 1.4 1.4 1.4 1.4
From the table and figures above, in the 1st year field, the bulk density tends to be lower in the NIT and ECO in the 0-20 cm soil layer. In the 20-30cm layer, similar observations were made, though less pronounced. In the 5th year field, at 10-15cm soil layer, the NIT and ECO had significantly higher bulk density compared to the CON. For other soil layers, no significant differences among the three tillage types were found.

9
3.1.2 Soil porosity and soil water-filled pore space
0-5c
m
5-10
cm
10-1
5cm
15-2
0cm
20-2
5cm
25-3
0cm
30
40
50
60
70
1st-yr
Po
ros
ity
(%) NIT
ECO
CON
0-5c
m
5-10
cm
10-1
5cm
15-2
0cm
20-2
5cm
25-3
0cm
35
40
45
50
55
60
5th-yr
Po
ros
ity
(%) NIT
ECO
CON
0-5c
m
5-10
cm
10-1
5cm
15-2
0cm
20-2
5cm
25-3
0cm
0
20
40
60
80
100
1st-yr
So
il w
ate
r-fi
lled
po
re s
pac
e(%
)
NIT
ECO
CON
0-5c
m
5-10
cm
10-1
5cm
15-2
0cm
20-2
5cm
25-3
0cm
40
50
60
70
80
90
100
5th-yr
So
il w
ate
r-fi
lled
po
re s
pac
e(%
)
NIT
ECO
CON
A B
C D
Table and figure 3. Soil porosity (A,B) and water filled pore space (C,D) under three different tillage
systems (non-inversion (NIT), ECO-shallow mouldboard plough (ECO), conventional mouldboard plough
(CON)) of the 1st year (A,C) and 5th year (B,D). Different letters indicate significant differences according
to the LSD-test (<0.05).
Soil Porosity (%)
Soil layers (cm)
0-5 5-10 10-15 15-20 20-25 25-30 0-30 1st -year NIT 59a 53a 54b 50 53a 52a 54a
ECO 55ab 51a 60a 52 46b 47ab 52a CON 53b 46b 44c 47 49ab 42b 47b
5th -year NIT 52 47 43 45 46 46 46
ECO 51 45 47 47 43 43 46 CON 49 50 50 48 50 44 49
Soil water-filled pore space (%)
1st -year NIT 31 36b 37b 37b 41b 38b 37c ECO 38 48ab 44b 52ab 72a 64a 53b CON 43 63a 72a 65a 67a 73a 64a
5th -year NIT 56 68 77 73 76 73 73
ECO 60 71 70 74 82 79 79 CON 63 61 63 66 65 75 75

10
In the 1st year field, CON had a lower soil porosity compared to ECO and NIT. There was no significant difference in soil porosity between ECO and NIT. NIT had the lowest percentage of water filled pore space while ECO was intermediate. In the 5th year field, CON had a higher porosity and lower soil water filled pore space, around 60% at all depths. ECO and NIT had a higher soil water filled pore space, above 60% and lower porosity.
3.1.3 Penetration resistance
Figure 4. Effect of different tillage methods on penetration resistance in the short and medium timescales.
In the 1st year field, the same trends were found for all three tillage treatments (Figure4). They had less penetration resistance down to the 30cm soil layer. Top soil compaction was not found in either field this year. The visual observation of a compact plough pan at 30cm in the 1st year field was confirmed by the penetrologger. In the 5th year field, a higher penetration resistance was found in NIT at untilled layers between 10-30cm. While this is not obvious from the results of penetrologger, but as detected during the measurement that the 30cm plough pan has been alleviated in ECO and NIT fields.
11
3.1.4 Soil moisture
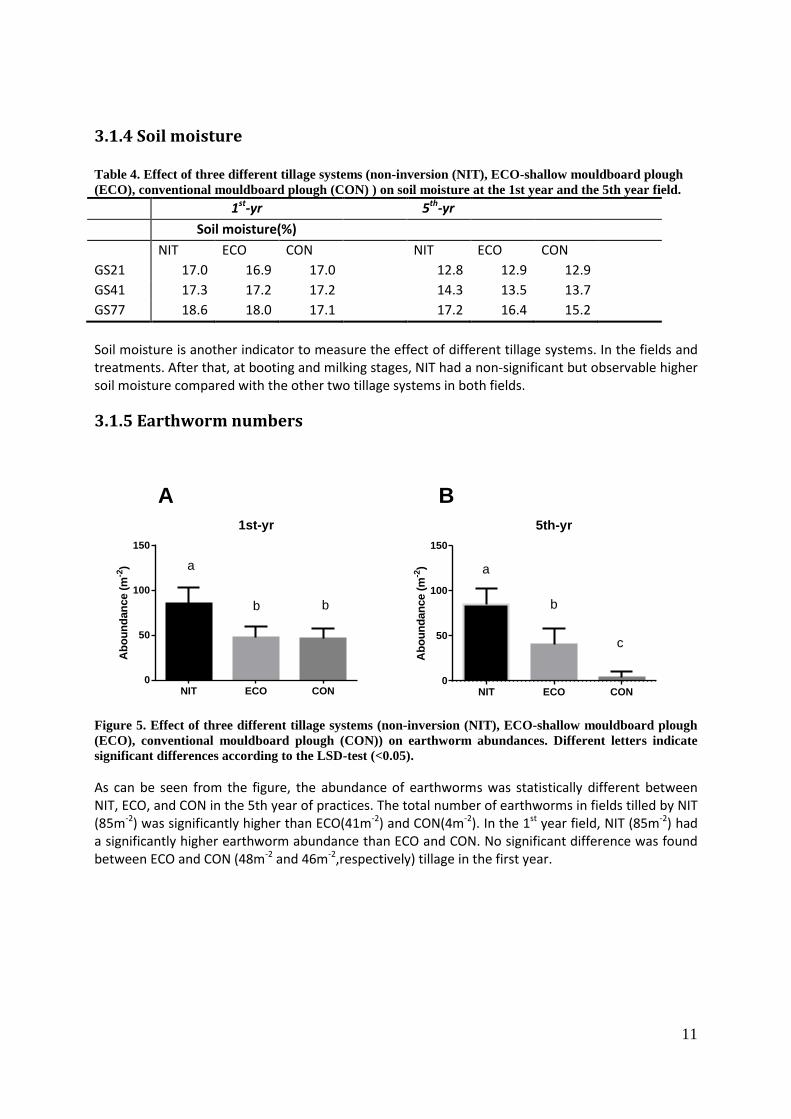
Table 4. Effect of three different tillage systems (non-inversion (NIT), ECO-shallow mouldboard plough
(ECO), conventional mouldboard plough (CON) ) on soil moisture at the 1st year and the 5th year field.
1st-yr 5th-yr
Soil moisture(%)
NIT ECO CON NIT ECO CON
GS21 17.0 16.9 17.0 12.8 12.9 12.9
GS41 17.3 17.2 17.2 14.3 13.5 13.7
GS77 18.6 18.0 17.1 17.2 16.4 15.2
Soil moisture is another indicator to measure the effect of different tillage systems. In the fields and treatments. After that, at booting and milking stages, NIT had a non-significant but observable higher soil moisture compared with the other two tillage systems in both fields.
3.1.5 Earthworm numbers
NIT ECO CON0
50
100
150
1st-yr
Ab
ou
nd
an
ce (
m-2
) a
b b
NIT ECO CON0
50
100
150
5th-yr
Ab
ou
nd
an
ce (
m-2
) a
b
c
A B
Figure 5. Effect of three different tillage systems (non-inversion (NIT), ECO-shallow mouldboard plough
(ECO), conventional mouldboard plough (CON)) on earthworm abundances. Different letters indicate
significant differences according to the LSD-test (<0.05).
As can be seen from the figure, the abundance of earthworms was statistically different between NIT, ECO, and CON in the 5th year of practices. The total number of earthworms in fields tilled by NIT (85m-2) was significantly higher than ECO(41m-2) and CON(4m-2). In the 1st year field, NIT (85m-2) had a significantly higher earthworm abundance than ECO and CON. No significant difference was found between ECO and CON (48m-2 and 46m-2,respectively) tillage in the first year.

12
3.1.6 Soil mineral nitrogen (Nmin)
0-10
cm
10-2
0cm
20-3
0cm
30-6
0cm
0
10
20
30
40
50
60
1st-yr
Nit
rog
en
( k
g h
a-1
)
NIT-GS13
ECO-GS13
CON-GS13
NIT-GS39
ECO-GS39
CON-GS39
0-10
cm
10-2
0cm
20-3
0cm
30-6
0cm
0
10
20
30
40
50
60
5th-yr
Nit
rog
en
( k
g h
a-1
)
NIT-GS13
ECO-GS13
CON-GS13
NIT-GS39
ECO-GS39
CON-GS39
Figure 6. Means of nitrogen mineralization affected by the interaction of depth and tillage for 1st year and
5th year for three different tillage system (non-inversion (NIT), ECO-shallow mouldboard plough (ECO),
and conventional mouldboard plough (CON) at GS13 and GS39 stages.
Both fields showed a similar trend. The Nmin content under NIT was the highest in the first soil layer 30 days after sowing. In the 10-20cm layer, ECO and CON had a higher Nmin compared to NIT, and in the third soil layer, the Nmin content under CON was higher than other two. The Nmin content was very low at 60 days after sowing, due to a high precipitation during that time. The leaching led to an Nmin increase in 30-60cm layer. In the 5-yr field, Nmin content at 20-30cm was significantly higher compared to other two tillage operations.

13
3.1.7 Soil organic matter (SOM)
0-10
cm
10-2
0cm
20-3
0cm
3.0
3.5
4.0
4.5
5.0
5.5
1st-yr
SO
M%
NIT
ECO
CON
0-10
cm
10-2
0cm
20-3
0cm
2.5
3.0
3.5
4.0
4.5
5th-yr
SO
M%
NIT
ECO
CON
Figure 7. Means of soil organic matter content (SOM) affected by the interaction of depth and tillage
method for 1st year and 5th year for three different tillage system (non-inversion (NIT), ECO-shallow
mouldboard plough (ECO), conventional mouldboard plough (CON).
A significant interactive effect on SOM content was found from the factors tillage and depth in both fields. In the 1st year field, the lowest soil organic matter contents in CON were 3.94% (0-10cm layer) and 3.79% (20-30cm layer). It was higher in NIT plots in these two depths (4.75% and 4.67%, respectively). ECO was intermediate in these two layers, but highest in 10-20cm (4.68%) compared to NIT(4.44%) and CON (4.45%). In the 5th year field, results showed that the NIT has the highest SOM in all the three soil layers (0-10cm 3.89%, 10-20cm 3.81%, 20-30cm 3.70%). CON had the lowest SOM in all the three layers(0-10cm 3.49%, 10-20cm 3.28%, 20-30cm 3.20%). The result of ECO were intermediate (0-10cm 3.74%, 10-20cm 3.71%, 20-30cm 3.26%).

14
3.1.8 Soil temperature and seed emergence.
NIT ECO CON14
15
16
17
18
19
5th-yr
So
il t
em
pera
ture
NIT ECO CON16
17
18
19
20
21
1st-yr
So
il t
em
pera
ture
NIT ECO CON0
20
40
60
80
1st-yr
Nu
mb
er
of
em
erg
en
ce/m
NIT ECO CON0
20
40
60
5th-yr
Nu
mb
er
of
em
erg
en
ce/m
A B
C D
a
ab
b
aa
b b
a a
a
abb
Figure 8. Effect of three different tillage systems (non-inversion (NIT), ECO-shallow mouldboard plough
(ECO), conventional mouldboard plough (CON)) on soil temperature (A,B) and spring wheat seed
emergence (C,D) for the 1st year and the 5th year experiment. Different letters indicate significant
differences according to the LSD-test (<0.05). Error-bars relate to the standard error of the mean.
In 1st-yr experiment, soil temperature of NIT was significantly lower than the CON and ECO. There is not a great deal of difference between ECO and CON. In the 5th-yr experiment, NIT results in a significantly lower soil temperature compares with CON. No significantly difference was found between NIT and ECO, ECO and CON A lower level of seed emergence was found in NIT compared with ECO and CON both in 1st-yr and 5th-yr experiments. There is no significant difference between ECO and CON for seed emergence in either experiment.

15
3.2 Effect of different tillage methods on plant growth
3.2.1 Plant height
GS25
GS47
GS61
GS71
0
50
100
150
1st-yr
Pla
nt
heig
ht
cm
NIT
ECO
CON
a a b
a ab
a b b a a b
GS47
GS61
0
50
100
150
5th-yr
Pla
nt
heig
ht
cm
NIT
ECO
CON
ba b
Figure 9. Effect of three different tillage system (non-inversion (NIT), ECO-shallow mouldboard plough
(ECO), conventional mouldboard plough (CON)) on plant height at different growth stages in 1st year (A)
and 5th year (B) experiments. Different letters indicate significant differences according to the LSD-test
(<0.05).
This bar chart illustrates that in the 1st-yr experiment, at tilling stage (GS25) and booting stage (GS47), the plant height of both NIT and ECO was significantly higher than CON. There was no significant difference between NIT and ECO. At flowering stage (GS61), the plant height of NIT is significantly higher than ECO and CON. No significant difference between ECO and CON was seen. This difference was likely caused by a bit earlier growth stage of NIT. At the milking development stage, plants in the ECO fields catch up with NIT and both of them were significantly higher than CON. In the 5th year field, due to a heavy weed problem in the last stage, no good result was obtained.

16
3.2.2 SPAD
GS41
GS61
GS71
25
30
35
40
45
50
1st-yr
SP
AD
NIT
ECO
CON
ab b aa a ab
a a
GS47
GS61
30
35
40
45
50
55
5th-yr
SP
AD
NIT
ECO
CON
a a b
a a a
A B
Figure 10. Effect of three different tillage systems (non-inversion (NIT), ECO-shallow mouldboard
plough (ECO), conventional mouldboard plough (CON)) on SPAD value. Different letters indicate
significant differences according to the LSD-test (<0.05).
As is demonstrated in figure 10, in the 1st yr experiment there is no difference of SPAD value between treatments at booting stage in either experimental field. In the 1-yr field experiment, less green colour of leaf was observed in NIT and ECO at GS61, which can be partly supported by a significantly lower SPAD value from plants in ECO fields. At the latest stage, GS71, a lower SPAD value was found in NIT of the 1st-yr field. The reason is that NIT matures faster than the other two tillage systems. In the 5th-yr experiment, SPAD value was significantly lower in CON. GS71 was not obtained for the 5 year field due to the weeds problem.
3.2.3 Plant growth index
Table 5. Effect of three different tillage systems (non-inversion (NIT), ECO-shallow mouldboard plough
(ECO), conventional mouldboard plough (CON)) on growth index. Different letters indicate significant
differences according to the LSD-test (<0.05).
Specific leaf area is a measure of leaf thickness, and leaf area ratio is the ratio of leaf area to the total weight. Leaf area index is a measure of leafiness per unit ground area and denotes the extent of photosynthetic machinery. As table 5 shows, NIT had a significantly higher LAR at the initial growth stage (GS23) both in 1st-yr and 5th-yr fields, while at booting stage (GS43), CON showed a significantly higher LAR compared to ECO and NIT. There was no significant difference of LAR between tillage systems in the 5th-yr field. No significant result was observed in 1st-yr experiment field of SLA across treatment. In the 5th-yr experiment field, CON was found to have higher SLA than ECO, and there was no significant difference between ECO and NIT, and CON and NIT. For leaf area index, a higher result
1st -yr 5th-yr
Growth index NIT ECO CON NIT ECO CON LAR (m2g-1) GS23 780a 716b 697b 1080a 930b 980ab GS43 429b 454b 520a 397ns 400ns 413ns SLA (cm2g-1) GS43 1326ns 1417ns 1400ns 1212ab 1190b 1292a LAI LWR
GS23 GS43 GS43
0.4a 2.3ns 0.3b
0.3b 2.6ns 0.3b
0.2b 2.0ns 0.4a
0.9a 1.6b 0.3ns
0.4b 1.7b 0.3ns
0.6ab 2.3a 0.3ns
Total plant dry matter (g m-2)
GS23 30a 27ab 24b 50 27 38 GS43 361a 346a 250b 258b 274b 355a GS77 694b 752a 820a 641 839 830

17
was observed NIT in the GS23 stage but lower in GS43 stage. Plant dry matter was higher in NIT at initial stages, after which CON caught up and became highest among all three tillage types in both fields.
3.2.5 Yield components
NIT ECO CON0
2000
4000
6000
8000
Yield(DM)
kg
h
a-1
a
b b
NIT ECO CON0
100
200
300
400
500
Ear m-2
Nu
mb
ers
m-2
b ba
NIT ECO CON0
10
20
30
1000- kernel weight(DM)
weig
ht
(g)
a a a
NIT ECO CON0.0
0.5
1.0
1.5
2.0
Average ear weight
weig
ht
(g)
a a
a
A B
C D
Figure 11. Yield components of three different tillage systems (non-inversion (NIT), ECO-shallow
mouldboard plough (ECO), conventional mouldboard plough (CON) in the 1st year.
For 1st year field, yield was recorded to be significantly higher under CON tillage (5438kg DM/ha) compared with ECO and NIT. There were no substantial differences between ECO and NIT (4041kg DM/ha and 4097kg DM/ha, respectively). CON had a significantly higher plant population compared to ECO and NIT, and no differences were found between NIT and ECO. For thousand kernel weight and average ear weight, there were no significant differences among the three different tillage systems. For the 5th year field, yield components were not obtained due to weed disaster.

18
4. Discussion
4.1 Effect of tillage on soil properties According to Holland (2004), there was some evidence that long-term use of conservation tillage can in certain situations lead to soil compaction and thereby to decreased yields. In the first year experiment, for three different treatments, there were no significant compaction problems detected in ECO and NIT systems, and hard 30cm plough layers were still found in all three differently tilled fields. After five years of reduce tillage depth, a higher soil penetration resistance was found in NIT, but otherwise our results were similar to those reported by most others. Further, a number of studies conclude that subsoil compaction is hard to alleviate in conservation agriculture, especially in organic farming, because of the higher frequency of mechanical weeding. For example, Alakukku (1996) found subsoil compaction was still measurable after 9 years under conservation tillage operation in organic clay-loam soils. As our experiment found, in 5 year experiments, the 30cm plough pan was alleviated in NIT and ECO, instead of being transferred to the upper layer. This shows that reduced tillage depth for five years of organic operation had successfully broken up the strong, restricting plough pan in loam sandy soil in the Netherlands. The most common indicators used to assess soil strength are bulk density and penetration resistance. They are interrelated and it would be misleading if the results only use one of these variables. Bulk density is inversely related to porosity and soil water filled pore space. Tillage operation would decrease bulk density while increasing soil porosity. This effect on bulk density is temporary; after tillage, the soil will rapidly settle, recovering its former bulk density (Lampurlanés and Cantero-Martínez 2003). For this reason, we only selected the result measured before harvest. Numerous experiments have compared bulk density under different tillage methods. Most of them showed a greater bulk density and higher soil water content in less intensive tillage, resulting in lower total soil porosity and greater water-filled pore space in comparison with deep mouldboard plough tillage. However, a lower soil bulk density and higher soil porosity were found for NIT and ECO in the 1st year fields in our experiment. Nevertheless, some others reported similar results (Moran, Koppi et al. 1988; Pikul and Aase 1995; Crovetto 1998). Compared with previous bulk density measurements, the CON were generally similar to the previous year. The reason NIT and ECO had a lower bulk density is not clear. In the fifth year field, the result is supported by most other published research. CON had a better structure through all the soil layers except the 0-5cm top soil. NIT had a plough pan at 15cm. NIT and ECO had greater than 60% soil water filled pore space in untilled soil layers. A positive effect of reduced tillage on total earthworm numbers was found in both first and fifth year practice fields. In the fifth year field, the highest amount of earthworm was found in the NIT, while CON had the lowest, and ECO in the middle. This result demonstrated a stronger effect on earthworm numbers of decreased plough activity. While in the new field, NIT also showed a significantly higher number of earthworms, ECO and CON were not seen to be significantly different. This result showed that reduced tillage does indeed protect earthworm abundance. This is supported by other authors that indicate plough less tillage will lead to increasing activity and biomass of earthworms (Crittenden, Eswaramurthy et al. 2014) In this experiment, a higher SOM was found in both tilled soil layer and untilled layer in NIT compared with ECO and CON in first year field and fifth year fields. This result is totally opposite from results published by others. A mass of authors reported that a higher SOM was found in the upper tilled layer and a lower or similar SOM in untilled layer in NIT (Sommerfeldt, Chang et al. 1988; Reicosky, Kemper et al. 1995; Stockfisch, Forstreuter et al. 1999; Ding, Novak et al. 2002; Franzluebbers 2002; Kay and VandenBygaart 2002; Shi, Yang et al. 2012). The incorporation did not

19
affect the total amount of OM or total N accumulated in the soil, but it did affect their distribution in the surface 30cm of soil. Since conventional tillage has a higher decomposition rate of SOM and a higher mineralisation rate, the combination of factors could lead to a lower SOM content in the deep soil layer. In the 1st year field, 30 days after planting, NIT had a higher mineral nitrogen content in upper soil layer. Due to organic matter and soil biota gathering at the top soil layer from ECO and NIT, mineralisation might be accelerated (Kouwenhoven, Perdok et al. 2002). Later, 60 days after planting, after a heavy rainfall period, CON had a higher mineralization rate in first year field since tillage loosens the soil, which speeds up the decomposition of organic matter resulting in increased Nmin levels. An improved nitrogen release in NIT and ECO would happen after a certain number of years practice of reducing tillage intensity. Increased earthworm abundance will physically break down organic residues and thereby increase microbial activity. As expected, after five years of organic practices, a relatively higher N mineralization in NIT and ECO was found. Thus, a better performance in NIT could be suggested although the plant growth and yield measurements were influenced by a weed problem.
4.2 Effect of tillage on plant growth For the spring wheat, the mouldboard plough convers the soil and disturbs soil activity, which is likely to improve the soil temperature. Our results indicated, both in the first and fifth year experiment, a slightly lower soil temperature for fields under NIT. It is generally accepted that a lower soil temperature leads to a lower seed emergence rate. In this experiment, a mean emergence day could not be measured because of weeding activity. However, in our early results, seed emergence of NIT were only around half day behind the other two treatments. This year was a warmer year and we sowed the seed a bit late, so there was not a huge difference in soil temperature and emergence among different tillage types. This is supported by arguments by Licht and Al-Kaisi (2005) that, when the cool air temperature after planting was dominant, the emergence rate will be greatly reduced in NIT due to a lower soil temperature. In warm years, the small differences in emergence value among all tillage treatments can be attributed to the slight differences observed in soil temperatures among three tillage systems. Also as De Vita (2007) found, in southern Italy the wheat seed emergence was faster in NIT than CON.
Crop growth and development is also influenced by soil temperature, gaining biomass and developing more rapidly as temperature increases. Several methods have been used to monitor crop growth and development. A better performance was observed in the NIT in the beginning in both fields, in contrast to other reports. NIT had less weed problems in the initial stages compared to the other two methods. As the result showed, NIT have a bigger LAI, LAR and higher plant height in the crop foundation period (GS1 to GS31). In contrast, at construction period (GS31 to GS59), plant growth of CON and ECO catches up with NIT. This result is contradictory to most of the research that found reduced initial crop growth under reduced tilth operation (Koepke 200 ; Fabrizzi, Garcıa et al. 2005; Govaerts, Sayre et al. 2009; Vakali, Zaller et al. 2011). As observed, growth stage of NIT was faster a bit than other two in both fields. This was likely caused by different temperature, as vegetative development is accelerated through increasing soil temperature. Crops in NIT have a faster temperature accumulate speed. One of the reasons is heat flux in the soil depends on the heat capacity and thermal conductivity of soils changed by tillage, which is affected by soil structure, bulk density, and water content (Johnson and Lowery 1985; Licht and Al-Kaisi 2005). NIT tend to have a higher soil moisture, which will have an influence on heat transfer. Because soil particles have a lower heat capacity and greater heat conductivity than water, dry soils potentially warm and cool

20
faster than wet soils. Another reason is that a better seedbed preparation was found in NIT. Thus in this experiment, under a warm year and late sowing, a faster growth period was found in NIT before ear emergence. In the construction period, due to a high precipitation (390mm) during the growth period, nitrogen deficiencies were found in both fields. As CON was found had a higher mineralisation rate and higher amount nitrogen, plants in areas of CON tillage catch up in later production stage and ultimately had a higher yield. This phenomenon correlates with conclusions by Berner, Hildermann et al. (2008) that N is expected not to be synchronous to the cereal N needs under reduced tillage, leading to an N shortage. Thus, application of large amounts of manure would increase yield and avoid N deficiency (Köpke 1995; Koepke 2003).

21
5.Conclusions Soil plough pan was positively affected and mostly alleviated by ECO and NIT after five years of reduced tillage in sandy loam soils. A lower soil bulk density and higher soil porosity were found in NIT and ECO in 1st year field. In the fifth year the result was reversed, CON had better soil physical structure. No significant change of penetration resistance was found in 1st year field. A higher penetration resistance was found in NIT after five year operation. In both fields, a positive effect of tillage operations on earthworm abundance was found with reduced tillage. The study supports the conclusion that NIT tillage treatments have a negative impact on soil temperature and seed emergence. In a warm year and a delayed sowing might lead to a better performance in the NIT in the initial stages due to a higher soil moisture and a high amount of mineralisation of nitrogen in upper soil layer. In the later stage, in first year practice, due to a high amount precipitation, Nitrogen deficiency was observed in NIT and ECO. CON plants were able to catch up due to a higher nitrogen mineralisation. After five years of practice, soil structure of NIT in deep untilled soil layer has tended to become similar with CON and a higher N mineralisation rate was found in the NIT.

22
6.Acknowledgements My sincere thanks goes to my supervisor Egbert Lantinga for organising and supervising this thesis project. I would like to thank Hennie Halm for analylsis of the samples. Special thanks to Andries Siepel for organization and help during the field operation and sampling. I would like to thank my friend and colleague Gu Xiangqian, who was working on the same project, it was an unforgettable time working with you. To my friend Yi Huang, thanks for your support and company. Last but not least, thanks to all my family members and friends, especially my parents for supporting me.

23
References Aikins, S. and J. Afuakwa (2012). "Effect of four different tillage practices on soil physical
properties under cowpea." Agriculture and Biology Journal of North America 3(1): 17-24.
Amanullah, M. J. H., K. Nawab, et al. (2007). "Response of specific leaf area (SLA), leaf area
index (LAI) and leaf area ratio (LAR) of maize (Zea mays L.) to plant density, rate and timing
of nitrogen application." World Applied Sciences Journal 2(3): 235-243.
Arshad, M., A. Franzluebbers, et al. (1999). "Components of surface soil structure under
conventional and no-tillage in northwestern Canada." Soil and Tillage Research 53(1): 41-47.
Avnimelech, Y., G. Ritvo, et al. (2001). "Water content, organic carbon and dry bulk density
in flooded sediments." Aquacultural Engineering 25(1): 25-33.
Ball, B., M. Cheshire, et al. (1996). "Carbohydrate composition in relation to structural
stability, compactibility and plasticity of two soils in a long-term experiment." Soil and
Tillage Research 39(3): 143-160.
Cannell, R. (1985). "Reduced tillage in north-west Europe—a review." Soil and Tillage
Research 5(2): 129-177.
Capowiez, Y., S. Cadoux, et al. (2009). "The effect of tillage type and cropping system on
earthworm communities, macroporosity and water infiltration." Soil and Tillage Research
105(2): 209-216.
Chan, K. (2001). "An overview of some tillage impacts on earthworm population abundance
and diversity—implications for functioning in soils." Soil and Tillage Research 57(4): 179-
191.
Ciha, A. (1982). "Yield and yield components of four spring wheat cultivars grown under
three tillage systems." Agronomy Journal 74(2): 317-320.
Crittenden, S., T. Eswaramurthy, et al. (2014). "Effect of tillage on earthworms over short-and
medium-term in conventional and organic farming." Applied Soil Ecology.
D’Haene, K., J. Vermang, et al. (2008). "Reduced tillage effects on physical properties of silt
loam soils growing root crops." Soil and Tillage Research 99(2): 279-290.
Deblonde, G., M. Penner, et al. (1994). "Measuring leaf area index with the LI-COR LAI-
2000 in pine stands." Ecology 1507-1511.
DeFelice, M. S., P. R. Carter, et al. (2006). "Influence of Tillage on Corn and Soybean Yield
in the United States and Canada." cm??? 5(1).
Ding, G., J. Novak, et al. (2002). "Soil organic matter characteristics as affected by tillage
management." Soil Science Society of America Journal 66(2): 421-429.
Ehlers, W., U. Köpke, et al. (1983). "Penetration resistance and root growth of oats in tilled
and untilled loess soil." Soil and Tillage Research 3(3): 261-275.
24
Fabrizzi, K., F. Garcıa, et al. (2005). "Soil water dynamics, physical properties and corn and
wheat responses to minimum and no-tillage systems in the southern Pampas of Argentina."
Soil and Tillage Research 81(1): 57-69.
Franzluebbers, A. (2002). "Soil organic matter stratification ratio as an indicator of soil
quality." Soil and Tillage Research 66(2): 95-106.
Gadermaier, F., A. Berner, et al. (2012). "Impact of reduced tillage on soil organic carbon and
nutrient budgets under organic farming." Renewable Agriculture and Food Systems 27(01):
68-80.
Gajri, P., V. Arora, et al. (2002). Tillage for sustainable cropping, Food Products Press.
Govaerts, B., K. D. Sayre, et al. (2009). "Conservation agriculture as a sustainable option for
the central Mexican highlands." Soil and Tillage Research 103(2): 222-230.
Gozubuyuk, Z., U. Sahin, et al. (2014). "Tillage effects on certain physical and hydraulic
properties of a loamy soil under a crop rotation in a semi-arid region with a cool climate."
CATENA 118: 195-205.
Holland, J. (2004). "The environmental consequences of adopting conservation tillage in
Europe: reviewing the evidence." Agriculture, Ecosystems & Environment 103(1): 1-25.
Johnson, M. and B. Lowery (1985). "Effect of three conservation tillage practices on soil
temperature and thermal properties." Soil Science Society of America Journal 49(6): 1547-
1552.
Karlen, D., M. Mausbach, et al. (1997). "Soil quality: a concept, definition, and framework
for evaluation (a guest editorial)." Soil Science Society of America Journal 61(1): 4-10.
Kay, B. and A. VandenBygaart (2002). "Conservation tillage and depth stratification of
porosity and soil organic matter." Soil and Tillage Research 66(2): 107-118.
Keith, A. M. and D. A. Robinson (2012). "Earthworms as natural capital: ecosystem service
providers in agricultural soils." Economology Journal 2: 91-99.
Koepke, U. (2003). Conservation agriculture with and without use of agrochemicals.
Proceedings of the 2nd World Congress on Conservation agriculture, Iguassu Falls, Paraná,
Brazil.
Köpke, U. (1995). "Nutrient management in organic farming systems: the case of nitrogen."
Biological Agriculture & Horticulture 11(1-4): 15-29.
Kouwenhoven, J., U. Perdok, et al. (2002). "Soil management by shallow mouldboard
ploughing in The Netherlands." Soil and Tillage Research 65(2): 125-139.
Kuntz, M., A. Berner, et al. (2013). "Influence of reduced tillage on earthworm and microbial
communities under organic arable farming." Pedobiologia 56(4): 251-260.

25
Licht, M. A. and M. Al-Kaisi (2005). "Strip-tillage effect on seedbed soil temperature and
other soil physical properties." Soil and Tillage Research 80(1): 233-249.
Linn, D. and J. Doran (1984). "Effect of water-filled pore space on carbon dioxide and nitrous
oxide production in tilled and nontilled soils." Soil Science Society of America Journal 48(6):
1267-1272.
Mäder, P. and A. Berner (2012). "Development of reduced tillage systems in organic farming
in Europe." Renewable Agriculture and Food Systems 27(01): 7-11.
Munkholm, L. J., P. Schjønning, et al. (2001). "Non-inversion tillage effects on soil
mechanical properties of a humid sandy loam." Soil and Tillage Research 62(1): 1-14.
Peigné, J., B. Ball, et al. (2007). "Is conservation tillage suitable for organic farming? A
review." Soil Use and Management 23(2): 129-144.
Reicosky, D., W. Kemper, et al. (1995). "Soil organic matter changes resulting from tillage
and biomass production." Journal of Soil and Water Conservation 50(3): 253-261.
Schjønning, P. and K. J. Rasmussen (2000). "Soil strength and soil pore characteristics for
direct drilled and ploughed soils." Soil and Tillage Research 57(1): 69-82.
Shi, X., X. Yang, et al. (2012). "Impact of ridge tillage on soil organic carbon and selected
physical properties of a clay loam in southwestern Ontario." Soil and Tillage Research 120: 1-
7.
Smolik, J. D. and T. L. Dobbs (1991). "Crop yields and economic returns accompanying the
transition to alternative farming systems." Journal of Production Agriculture 4(2): 153-161.
Soane, B. D., B. C. Ball, et al. (2012). "No-till in northern, western and south-western Europe:
a review of problems and opportunities for crop production and the environment." Soil and
Tillage Research 118: 66-87.
Sommerfeldt, T., C. Chang, et al. (1988). "Long-term annual manure applications increase
soil organic matter and nitrogen, and decrease carbon to nitrogen ratio." Soil Science Society
of America Journal 52(6): 1668-1672.
Stockfisch, N., T. Forstreuter, et al. (1999). "Ploughing effects on soil organic matter after
twenty years of conservation tillage in Lower Saxony, Germany." Soil and Tillage Research
52(1): 91-101.
Vakali, C., J. G. Zaller, et al. (2011). "Reduced tillage effects on soil properties and growth of
cereals and associated weeds under organic farming." Soil and Tillage Research 111(2): 133-
141.
Winteraeken, H. and W. Spaan (2010). "A new approach to soil erosion and runoff in south
Limburg—The Netherlands." Land Degradation & Development 21(4): 346-352.

26
Appendix
Appendix1