effects of different soil tillage-sowing systems on …
TRANSCRIPT

2092
Bioscience Journal Original Article
Biosci. J., Uberlândia, v. 36, n. 6, p. 2092-2107, Nov./Dec. 2020 http://dx.doi.org/10.14393/BJ-v36n6a2020-49949
EFFECTS OF DIFFERENT SOIL TILLAGE-SOWING SYSTEMS ON PLANT
DEVELOPMENT AND EMERGENCE TRAITS OF SECOND CROP
SOYBEAN
EFEITOS DE DIFERENTES SISTEMAS DE SEMEADURA DIRETA NO
DESENVOLVIMENTO DE PLANTAS E CARACTERÍSTICAS DE EMERGÊNCIA DE
SOJA EM SEGUNDA SAFRA
Onder KABAS1; Mehmet KOCATURK
2; Cevdet Fehmi OZKAN
2; Emine GUMRUKCU
2;
Murad CANAKCI3; Davut KARAYEL
3
1. Akdeniz University, Vocational School of Technical Science, Antalya, Turkey. [email protected]; 2. Agricultural Research
Institute, Bati Akdeniz, Antalya, Turkey; 3. Akdeniz University, Faculty of Agriculture, Department of Agricultural Machinery and
Technologies Engineering, Antalya, Turkey,
ABSTRACT: Effects of different soil tillage and sowing systems (Conventional Soil Tillage – CST:
Moldboard plow + gobble disc + disk harrow + harrow + sowing machine; Reduced Soil Tillage – RST:
rototiller-combined soil tillage machine + sowing machine; Ridge Sowing – RS: gobble disc + ridge-sowing
machine; Direct Sowing – DS – no-till) on plant development and emergence traits of second-crop soybean
were investigated in this study under Antalya provincial conditions. Experiments were conducted over the
experimental fields of the Aksu Branch of Bati Akdeniz Agricultural Research Institute for 3 years (2013, 2014,
2015) as a fixed experiment. The number of days to 50% emergence, number of days to 50% flowering, plant
height, number of pods per plant, the first pod height, number of plants per m2, 1000-seed weight, and yield
were considered as plant development parameters. Mean emergence time, germination rate index, emergence
ratio, space ratio, tillering ratio, and acceptable plant spacing ratio were considered as plant emergence
parameters. Different soil tillage and sowing systems generally had significant effects on investigated traits at
p<0.01 and p<0.05 levels.
KEYWORDS: Conversation. Emergence. Soil. Tillering.
INTRODUCTION
Soil fertility is the primary condition for
optimum plant growth and development since plants
get entire nutrient and water needs from the soil.
Soil fertility largely depends on available biological,
physical, and chemical processes within the seedbed
or root zone of the plants. Sustainability of such
processes is possible only with proper soil tillage
practices (TEZER; SABANCI, 1990). Soil upper
zones are mixed mechanically through soil tillage.
Such a mixing process alters soil physical, chemical,
and biological characteristics. Such an effect
influences not only the microorganisms living in
soil but also ongoing biochemical cycles within the
soil profile (YALCIN; SUNGUR, 1991). Soil tillage
significantly influences plant growth and
development, physicochemical soil characteristics,
soil microbial activity, and ultimately crop yields. In
brief, soil biological, physical, and chemical
balances are preserved and regulated by soil tillage.
Among the plant production factors, soil tillage has
a contribution of up to 20% (GOZUBUYUK et al.,
2017). Soil tillage methods are composed of
overturning, loosening, crumbling, mixing, and
leveling processes (DEMIR et al., 2000). However,
soil compaction is evident while soil stillage
because of heavy traffic over the field, and resultant
compaction then negatively influences plant growth
and development (OZGUVEN; AYDINBELGE,
1990). Frequent soil tillage to get a good soil
structure also negatively influences soil structure.
Redundant soil tillage increases crop costs and
results in excessive decomposition of organic
matter, thus negatively influences soil fertility
(KAYISOGLU et al., 1996).
Recently, conservation soil tillage methods
(mulch tillage, reduced tillage, strip tillage, zero
tillage) are getting common in Turkey and different
countries of the world to minimize or eliminate the
negative aspects of soil tillage.
Several studies have been conducted to
determine the effects of soil tillage practices on
plant emergence, growth, and development. Jalota et
al. (2008) compared conservation and conventional
tillage systems in cotton and found that the
minimum tillage system had lower yield and water
productivity as compared to the conventional tillage.
Received: 01/05/2019
Accepted: 30/01/2020
2093
Effects of different… KABAS, O. et al
Biosci. J., Uberlândia, v. 36, n. 6, p. 2092-2107, Nov./Dec. 2020 http://dx.doi.org/10.14393/BJ-v36n6a2020-49949
Karamanos et al. (2004) showed that conservation
tillage systems (no-tillage and minimum tillage
systems) provided higher soil water content, cotton
root growth, and cotton yield as compared to the
conventional tillage. Merrill et al. (1996) showed
that wheat root development increased up to 112%
in the no-tillage system as compared to the
conventional tillage. Reduced crop yields were
reported for no-tillage systems (YALCIN; CAKIR,
2006; KORZENIOWSKA; STANISŁAWSKA-
GLUBIAK, 2009). Eker and Ulger (1988)
investigated the effects of different soil tillage
equipment on soil and plant characteristics and
determined germination, the number of leaves, plant
height, and yield of sunflower plants. Based on plant
leaf development and yield levels, researchers
indicated subsoiler – chisel plow as the best soil
tillage equipment under experimental conditions.
Maurya (1988) comparatively assessed the
conventional and zero-tillage in wheat and maize
culture under different soil and climate conditions in
Nigeria. Aykas and Onal (1996) investigated the
operational characteristics and effects of different
seedbed preparation equipment on wheat yield.
Yalcin et al. (2009) investigated the potential use of
ridge-sowing besides conventional production
techniques in grain and silage maize culture.
Soybean is an important oil crop. Soybean
seeds contain about 18-24% oil. The yellow and
aromatic soybean oil is mostly consumed as
margarine. Soybean oil is either used as foodstuff or
raw material in the industry for various purposes.
Soybean seeds contain about 36-40% protein. Soy
protein includes highly valuable amino acids, thus
nutritional value is quite high, almost equal to
animal proteins (ARIOGLU, 2013).
In this study, effects of different soil tillage
and sowing systems on plant emergence, growth,
and development were investigated, relationships
among these attributes were assessed and alternative
soil tillage – sowing methods allowing crop culture
with the minimum soil disturbance and without any
degradations in soil physical, chemical and
biological structure instead of conventional soil
tillage -sowing methods for second-crop soybean
culture in the region were put forth.
MATERIAL AND METHOD
The soybean cultivar of “ATAEM-7”
registered by the Bati Akdeniz Agricultural
Research Institute in 2006 was used as the plant
material. ATAEM-7 is a mid-early high-yield
cultivar. Flower color is white, 1000-seed weight is
around 150-160 g, ripening duration is 110-145 days
and yield is around 350-450 kg da-1
.
Experiments were conducted over the
experimental fields of Aksu-Central Enterprise
(36°56'37.9"N - 30°52'45.1"E) of Directorate of
Bati Akdeniz Agricultural Research Institute during
the second crop growing season after wheat harvest.
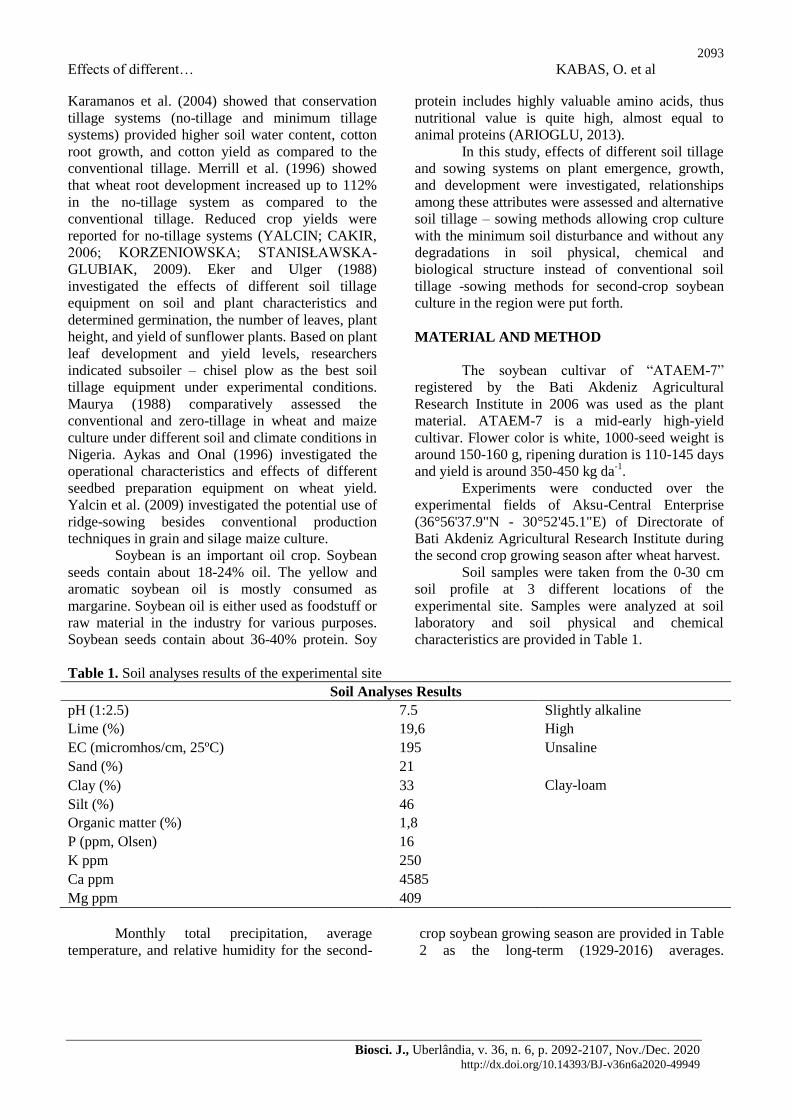
Soil samples were taken from the 0-30 cm
soil profile at 3 different locations of the
experimental site. Samples were analyzed at soil
laboratory and soil physical and chemical
characteristics are provided in Table 1.
Table 1. Soil analyses results of the experimental site
Soil Analyses Results
pH (1:2.5) 7.5 Slightly alkaline
Lime (%) 19,6 High
EC (micromhos/cm, 25ºC) 195 Unsaline
Sand (%) 21
Clay-loam Clay (%) 33
Silt (%) 46
Organic matter (%) 1,8
P (ppm, Olsen) 16
K ppm 250
Ca ppm 4585
Mg ppm 409
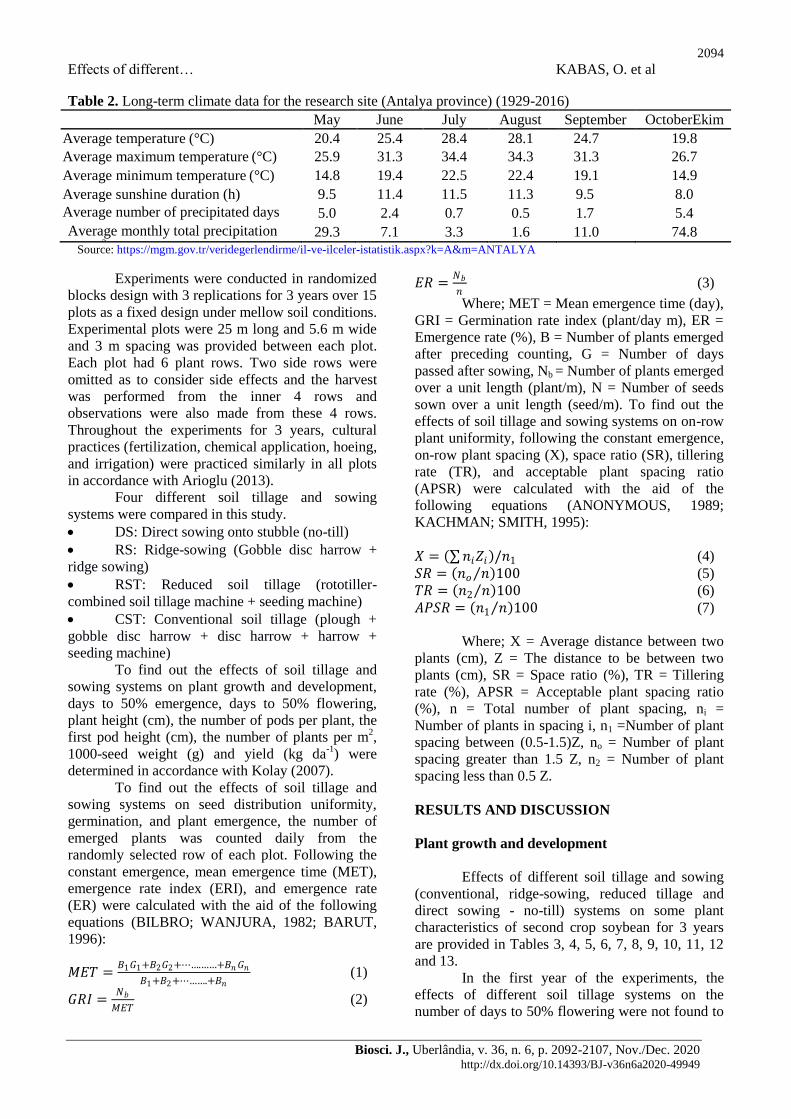
Monthly total precipitation, average
temperature, and relative humidity for the second-
crop soybean growing season are provided in Table
2 as the long-term (1929-2016) averages.
2094
Effects of different… KABAS, O. et al
Biosci. J., Uberlândia, v. 36, n. 6, p. 2092-2107, Nov./Dec. 2020 http://dx.doi.org/10.14393/BJ-v36n6a2020-49949
Table 2. Long-term climate data for the research site (Antalya province) (1929-2016)
May June July August September OctoberEkim
Average temperature (°C) 20.4 25.4 28.4 28.1 24.7 19.8
Average maximum temperature (°C) 25.9 31.3 34.4 34.3 31.3 26.7
Average minimum temperature (°C) 14.8 19.4 22.5 22.4 19.1 14.9
Average sunshine duration (h) 9.5 11.4 11.5 11.3 9.5 8.0
Average number of precipitated days
(day) 5.0 2.4 0.7 0.5 1.7 5.4
Average monthly total precipitation
(kgm-2
) 29.3 7.1 3.3 1.6 11.0 74.8
Source: https://mgm.gov.tr/veridegerlendirme/il-ve-ilceler-istatistik.aspx?k=A&m=ANTALYA
Experiments were conducted in randomized
blocks design with 3 replications for 3 years over 15
plots as a fixed design under mellow soil conditions.
Experimental plots were 25 m long and 5.6 m wide
and 3 m spacing was provided between each plot.
Each plot had 6 plant rows. Two side rows were
omitted as to consider side effects and the harvest
was performed from the inner 4 rows and
observations were also made from these 4 rows.
Throughout the experiments for 3 years, cultural
practices (fertilization, chemical application, hoeing,
and irrigation) were practiced similarly in all plots
in accordance with Arioglu (2013).
Four different soil tillage and sowing
systems were compared in this study.
DS: Direct sowing onto stubble (no-till)
RS: Ridge-sowing (Gobble disc harrow +
ridge sowing)
RST: Reduced soil tillage (rototiller-
combined soil tillage machine + seeding machine)
CST: Conventional soil tillage (plough +
gobble disc harrow + disc harrow + harrow +
seeding machine)
To find out the effects of soil tillage and
sowing systems on plant growth and development,
days to 50% emergence, days to 50% flowering,
plant height (cm), the number of pods per plant, the
first pod height (cm), the number of plants per m2,
1000-seed weight (g) and yield (kg da-1
) were
determined in accordance with Kolay (2007).
To find out the effects of soil tillage and
sowing systems on seed distribution uniformity,
germination, and plant emergence, the number of
emerged plants was counted daily from the
randomly selected row of each plot. Following the
constant emergence, mean emergence time (MET),
emergence rate index (ERI), and emergence rate
(ER) were calculated with the aid of the following
equations (BILBRO; WANJURA, 1982; BARUT,
1996):
𝑀𝐸𝑇 =𝐵1𝐺1+𝐵2𝐺2+⋯….……+𝐵𝑛𝐺𝑛
𝐵1+𝐵2+⋯…….+𝐵𝑛 (1)
𝐺𝑅𝐼 =𝑁𝑏
𝑀𝐸𝑇 (2)
𝐸𝑅 =𝑁𝑏
𝑛 (3)
Where; MET = Mean emergence time (day),
GRI = Germination rate index (plant/day m), ER =
Emergence rate (%), B = Number of plants emerged
after preceding counting, G = Number of days
passed after sowing, Nb = Number of plants emerged
over a unit length (plant/m), N = Number of seeds
sown over a unit length (seed/m). To find out the
effects of soil tillage and sowing systems on on-row
plant uniformity, following the constant emergence,
on-row plant spacing (X), space ratio (SR), tillering
rate (TR), and acceptable plant spacing ratio
(APSR) were calculated with the aid of the
following equations (ANONYMOUS, 1989;
KACHMAN; SMITH, 1995):
𝑋 = 𝑛𝑖𝑍𝑖 /𝑛1 (4)
𝑆𝑅 = 𝑛𝑜 𝑛 100 (5)
𝑇𝑅 = 𝑛2 𝑛 100 (6)
𝐴𝑃𝑆𝑅 = 𝑛1 𝑛 100 (7)
Where; X = Average distance between two
plants (cm), Z = The distance to be between two
plants (cm), SR = Space ratio (%), TR = Tillering
rate (%), APSR = Acceptable plant spacing ratio
(%), n = Total number of plant spacing, ni =
Number of plants in spacing i, n1 =Number of plant
spacing between (0.5-1.5)Z, no = Number of plant
spacing greater than 1.5 Z, n2 = Number of plant
spacing less than 0.5 Z.
RESULTS AND DISCUSSION
Plant growth and development
Effects of different soil tillage and sowing
(conventional, ridge-sowing, reduced tillage and
direct sowing - no-till) systems on some plant
characteristics of second crop soybean for 3 years
are provided in Tables 3, 4, 5, 6, 7, 8, 9, 10, 11, 12
and 13.
In the first year of the experiments, the
effects of different soil tillage systems on the
number of days to 50% flowering were not found to

2095
Effects of different… KABAS, O. et al
Biosci. J., Uberlândia, v. 36, n. 6, p. 2092-2107, Nov./Dec. 2020 http://dx.doi.org/10.14393/BJ-v36n6a2020-49949
be significant (Table 3). Soil tillage systems had
significant effects on the number of days to 50%
emergence, plant height, number of pods per plant,
number of plants per m2, 1000-seed weight, and
yield at p<0.01 level and had significant effects on
the first pod height at p<0.05 level. The greatest
plant height (82.66 cm), number of pods per plant
(92 pods), number of plants per m2 (55 plants),
1000-seed weight (181.17 g), and yield (373.39 kg
da-1
) were obtained from the reduced soil tillage
system. The greatest number of days to 50%
emergence (5.20 days) was obtained from the
conventional soil tillage system.
Table 3. Variance analysis and comparison of means for plant characteristics of the first year.
Parameters Treatments Variance analysis
DS RS CST RST CV LSD SL
Days to 50% emergence 5.00 c 4.80 d 5.20 a 5.12 b 0.54 0.05 **
Days to 50% flowering 41.66 42.20 43.40 43.07 - - n.s
Plant height (cm) 69.69 d 74.67 c 80.00 b 82.66 a 1.08 1.66 **
Number of pods per
plant 83.45 c 87.97 b 89.20 ab 92.00 a 1.88 3.31 **
First pod height (cm) 7.00 a 6.00 b 7.00 a 7.00 a 5.46 0.73 *
Number of plants per m2 46.75 b 50.60 b 54.80 a 55.00 a 0.61 0.63 **
1000-seed weight (g) 166.00 c 176.83 a 176.71 b 181.17 a 1.02 3.57 **
Yield (kg da-1
) 280.46 c 350.33 b 346.25 b 373.39 a 1.23 8.29 **
** Significant at P< 0.01; * Significant at P< 0.05; 1 The means indicated with the same letters in the same row are not significantly
different; DS: Direct sowing, RS: Ridge sowing, CST: Conventional soil tillage, RST: Reduced soil tillage, CV: Coefficient of variation,
LSD: Least significant difference, SL: Significance level
In the second year, the effects of different
soil tillage and sowing systems on the first pod
height were not found to be significant (Table 4).
Soil tillage systems had significant effects on the
number of days to 50% emergence, number of days
to 50% flowering, plant height, number of pods per
plant, number of plants per m2, 1000-seed weight,
and yield at p<0.01 level. The greatest plant height
(82.32 cm), number of pods per plant (92.65 pods),
number of plants per m2 (55.65 plants), 1000-seed
weight (188.43 g), and yield (374.03 kg da-1
) were
obtained from reduced soil tillage system. The
greatest number of days to 50% emergence (5.02
days) and the greatest number of days to 50%
flowering (44.05 days) were obtained from the
conventional soil tillage system.
Table 4. Variance analysis and comparison of means for plant characteristics of the second year
Parameters Treatments Variance analysis
DS RS CST RST CV LSD SL
Days to 50%
emergence
4.83 c 4.63 d 5.02 a 4.95 b 0.46 0.04 **
Days to 50%
flowering 40.36 c 42.03 b 44.05 a 42.90 ab 1.66 1.40 **
Plant height (cm) 68.10 d 74.49 c 80.65 b 82.32 a 0.71 1.09 **
Number of pods per
plant 84.52 d 88.03 c 89.84 b 92.65 a 0.97 1.73 **
First pod height (cm) 6.00 7.00 6.00 6.00 - - n.s
Number of plants per
m2
47.89 c 50.42 b 55.44 a 55.65 a 1.63 1.70 **
1000-seed weight (g) 163.43 d 179.04 b 175.68 c 188.43 a 0.23 0.82 **
Yield (kg da-1
) 282.27 c 352.69 b 346.89 b 374.03 a 1.49 10.15 ** ** Significant at P< 0.01; * Significant at P< 0.05; 1 The means indicated with the same letters in the same row are not significantly
different; DS: Direct sowing, RS: Ridge sowing, CST: Conventional soil tillage, RST: Reduced soil tillage, CV: Coefficient of variation,
LSD: Least significant difference, SL: Significance level
In the third year, soil tillage systems had
significant effects on the number of days to 50%
emergence, plant height, number of pods per plant,
number of plants per m2, 1000-seed weight and
yield at p<0.01 level and had significant effects on
the number of days to 50% flowering and the first
pod height at p<0.05 level (Table 5). The greatest
plant height (85.45 cm), number of pods per plant
(93.45 pods), number of plants per m2 (56.68
plants), 1000-seed weight (189.07 g), and yield
(382.10 kg da-1
) were obtained from the reduced soil
tillage system. The greatest number of days to 50%

2096
Effects of different… KABAS, O. et al
Biosci. J., Uberlândia, v. 36, n. 6, p. 2092-2107, Nov./Dec. 2020 http://dx.doi.org/10.14393/BJ-v36n6a2020-49949
flowering (44.13 days) was obtained from the
conventional soil tillage system. The greatest first
pod height (7.00 cm) was observed in the
conventional and reduced soil tillage systems. The
greatest number of days to 50% emergence (5.13
days) was obtained from the direct sowing system.
Table 5. Variance analysis and comparison of means for plant characteristics of the third year
Parameters Treatments Variance analysis
DS RS CST RST CV LSD SL
Days to 50% emergence 5.13 a 4.76 c 4.95 b 4.65 d 0.69 0.06 **
Days to 50% flowering 41.11 b 42.34 b 44.13 a 42.26 b 1.62 1.38 *
Plant height (cm) 72.10 d 76.25 c 80.65 b 85.45 a 1.20 1.88 **
Number of pods per plant 85.80 c 89.10 b 88.48 b 93.45 a 1.10 1.96 **
First pod height (cm) 6.00 b 6.00 b 7.00 a 7.00 a 6.58 0.85 *
Number of plants per m2 49.13 c 51.62 bc 54.71 ab 56.68 a 3.32 3.52 **
1000-seed weight (g) 164.77 d 184.43 b 175.03 c 189.07 a 0.94 3.38 **
Yield (kg da-1
) 283.50 c 352.85 b 353.82 b 382.10 a 1.10 7.58 **
** Significant at P< 0.01; * Significant at P< 0.05; 1 The means indicated with the same letters in the same row are not significantly
different; DS: Direct sowing, RS: Ridge sowing, CST: Conventional soil tillage, RST: Reduced soil tillage, CV: Coefficient of variation,
LSD: Least significant difference, SL: Significance level
The numbers of days to 50% emergence of
different years for different soil tillage systems are
provided in Table 6. Year*treatment interactions
were found to be significant (p<0.01). Therefore, the
years were assessed separately. Ridge-sowing had
positive impacts on plant emergence in 2013 and
2014 and resulted in relatively early emergences. In
2015, reduced tillage had positive impacts on
emergence. Such a case may be attributed to the
increased temperature of the ridges. Ozturk (2015)
reported the number of days to 50% emergence as
5.5 days. Kolay (2007) indicated insignificant
effects of soil tillage systems on the number of days
to 50% emergence.
Table 6. Days to 50% emergence values of tillage and sowing methods
Treatments Years
2013 2014 2015 Average
DS 5.00 c 4.83 c 5.13 a 4.98
RS 4.80 d 4.63 d 4.76 c 4.73
CST 5.20 a 5.02 a 4.95 b 5.05
RST 5.12 b 4.95 b 4.65 d 4.91
Average 5.03 4.86 4.87
CV 0.54 0.46 0.69
LSD 0.05** 0.04** 0.06**
Year x Treatment: Significant ** ** Significant at P< 0.01; * Significant at P< 0.05; 1 The means indicated with the same letters in the same columns are not significantly
different; DS: Direct sowing, RS: Ridge sowing, CST: Conventional soil tillage, RST: Reduced soil tillage, CV: Coefficient of variation,
LSD: Least significant difference
The numbers of days to 50% flowering of
different years for different soil tillage systems are
provided in Table 7. Year*treatment interactions
were not found to be significant. Therefore, the
years were not assessed separately. Three-year
(2013, 2014, 2015) results of treatments were
assessed together. The earliest number of days to
50% flowering was obtained from the direct sowing
and the latest number of days to 50% flowering was
obtained from the conventional tillage. Ozturk
(2015) reported the average number of days to 50%
flowering as 40 days. Kolay (2007) also reported
similar findings with the present ones.

2097
Effects of different… KABAS, O. et al
Biosci. J., Uberlândia, v. 36, n. 6, p. 2092-2107, Nov./Dec. 2020 http://dx.doi.org/10.14393/BJ-v36n6a2020-49949
Table 7. Days to 50% flowering values of tillage and sowing methods
Treatments Years
2013 2014 2015 Average
DS 41.66 40.36 41.12 41.05 c
RS 42.20 42.03 42.34 42.19 b
CST 43.40 44.05 44.14 43.86 a
RST 43.07 42.90 42.27 42.75 b
Average 42.58 42.34 42.47 42.46
CV 1.59
LSD 0.67
Year x Treatment: Insignificant
** Significant at P< 0.01; * Significant at P< 0.05; 1 The means indicated with the same letters in the same columns are not significantly
different; DS: Direct sowing, RS: Ridge sowing, CST: Conventional soil tillage, RST: Reduced soil tillage, CV: Coefficient of variation,
LSD: Least significant difference
Concerning plant heights (cm) of different
soil tillage systems in different years, again
year*treatment interactions were found to be
significant (p<0.05) (Table 8). Therefore, the years
were assessed separately. Reduced soil tillage had
positive impacts on plant heights in 2013, 2014, and
2015. The lowest plant heights in 3 years were
obtained from the direct sowing treatments and the
greatest plant heights were obtained from the
reduced soil tillage systems.
Table 8. Plant height values of tillage and sowing methods
Treatments Years
2013 2014 2015 Average
DS 69.69 d 68.10 d 72.10 d 69.96
RS 74.67 c 74.49 c 76.25 c 75.14
CST 80.00 b 80.65 b 80.65 b 80.43
RST 82.66 a 82.32 a 85.45 a 83.48
Average 76.76 76.39 78.61
CV 1.08 0.71 1.2
LSD 1.66** 1.09** 1.88**
Year x Treatment: Significant * ** Significant at P< 0.01; * Significant at P< 0.05; 1 The means indicated with the same letters in the same columns are not significantly
different; DS: Direct sowing, RS: Ridge sowing, CST: Conventional soil tillage, RST: Reduced soil tillage, CV: Coefficient of variation,
LSD: Least significant difference
Present plant heights were similar to the
ones reported by Arslan and Arıoglu (2001) but
were conflicting with the ones reported by Temperly
and Borges (2006) reporting greater and
significantly different plant heights for no-till
systems (88.7 cm) than the conventional soil tillage
systems (82.5 cm). Onat (2012) reported the lowest
plant height as 71.95 cm and the greatest plant
height as 97.37 cm.
Regarding the number of pods per plant of
different soil tillage systems in different years,
year*treatment interactions were not found to be
significant (Table 9). Therefore, the years were not
assessed separately. Three-year (2013, 2014, 2015)
results of treatments were assessed together. The
greatest number of pods per plant was obtained from
the reduced soil tillage and the lowest number of
pods per plant was obtained from the direct sowing
treatments. Arslan and Arioglu (2001) conducted a
study on second-crop soybean in the Çukurova
region and reported similar findings with the present
ones. Yetim (2008) reported the lowest number of
pods per plant as 55.75 and the greatest number of
pods per plant as 91.92.

2098
Effects of different… KABAS, O. et al
Biosci. J., Uberlândia, v. 36, n. 6, p. 2092-2107, Nov./Dec. 2020 http://dx.doi.org/10.14393/BJ-v36n6a2020-49949
Table 9. Number of pods per plant of tillage and sowing methods
Treatments Years
2013 2014 2015 Average
DS 83.45 84.52 85.80 84.59 c
RS 87.97 88.03 89.11 88.37 b
CST 89.20 89.85 88.48 89.17 b
RST 92.00 92.65 93.46 92.71 a
Average 88.16 88.76 89.21 88.71
CV 1.37
LSD 1.21
Year x Treatment: Insignificant
** Significant at P< 0.01; * Significant at P< 0.05; 1 The means indicated with the same letters in the same columns are not significantly
different; DS: Direct sowing, RS: Ridge sowing, CST: Conventional soil tillage, RST: Reduced soil tillage, CV: Coefficient of variation,
LSD: Least significant difference
The first pod heights (cm) of different soil
tillage and sowing systems in different years are
provided in Table 10. The year*treatment
interactions were found to be significant (p<0.01).
The greatest first pod heights were obtained from
the conventional and reduced soil tillage systems.
Onat (2012) reported the lowest first pod
height as 10.58 cm and the greatest first pod height
as 15.10 cm. Sessiz et al. (2009) reported the first
fruit height as 3.70 cm in conventional soil tillage,
4.70 cm in reduced soil tillage, and 3.66 cm in no-
till systems.
Table 10. First pod height values of tillage and sowing methods
Treatments Years
2013 2014 2015 Average
DS 7.00 a 6.00 6.00 b 6.33
RS 6.00 b 7.00 6.00 b 6.33
CST 7.00 a 6.00 7.00 a 6.67
RST 7.00 a 6.00 7.00 a 6.67
Average 6.75 6.25 6.50
CV 5.46 6.84 6.58
LSD 0.73* 0.85 0.85
Year x Treatment: Significant ** ** Significant at P< 0.01; * Significant at P< 0.05; 1 The means indicated with the same letters in the same columns are not significantly
different; DS: Direct sowing, RS: Ridge sowing, CST: Conventional soil tillage, RST: Reduced soil tillage, CV: Coefficient of variation,
LSD: Least significant difference
About the number of plants per m2 of
different soil tillage systems in different years,
year*treatment interactions were not found to be
significant (Table 11). Therefore, the years were not
assessed separately. Three-year (2013, 2014, 2015)
results of treatments were assessed together. The
greatest number of plants per m2 was obtained from
the reduced soil tillage and the lowest number of
plants m2 was obtained from the direct sowing
treatments.
Bakoglu and Aycicegi, (2005) reported the
number of plants per m2 as 29.80. Also, Oztürk
(2015) indicated insignificant effects of different
soil tillage systems on the number of plants per m2.
Arslan and Arioglu, (2001) conducted a study with
second-crop soybean in the Çukurova region and
reported the lowest number of plants per m2 for
direct sowing in both years and the greatest number
of plants per m2 for gobble disc + gobble disc soil
tillage in the first year and for plow + gobble disc
soil tillage in the second year.

2099
Effects of different… KABAS, O. et al
Biosci. J., Uberlândia, v. 36, n. 6, p. 2092-2107, Nov./Dec. 2020 http://dx.doi.org/10.14393/BJ-v36n6a2020-49949
Table 11. Number of plants per m2 values
of tillage and sowing methods
Treatments Years
2013 2014 2015 Average
DS 46.75 47.90 49.13 47.93 c
RS 50.60 50.43 51.62 50.88 b
CST 54.80 55.45 54.71 54.99 a
RST 55.00 55.65 56.68 55.78 a
Average 51.79 52.36 53.04 52.39
CV 2.19
LSD 1.13
Year x Treatment: Insignificant
** Significant at P< 0.01; * Significant at P< 0.05; 1 The means indicated with the same letters in the same columns are not significantly
different; DS: Direct sowing, RS: Ridge sowing, CST: Conventional soil tillage, RST: Reduced soil tillage, CV: Coefficient of variation,
LSD: Least significant difference
The 1000-seed weights (g) of different soil
tillage systems in different years are provided in
Table 12. The year*treatment interactions were
found to be significant (p<0.01).
Reduced soil tillage systems had positive
impacts on 1000-seed weights in the third year of
the experiments. The lowest 1000-seed weights
were obtained from the direct sowing treatments of
3 years. Yetim (2008) reported the lowest 1000-seed
weight as 146.9 g and the greatest 1000-seed weight
as 163.7 g. Pedersen and Lauer (2003) reported
about 2% greater 1000-seed weight for no-till
systems than for conventional soil tillage. Singer et
al. (2008) indicated insignificant differences in
1000-seed weights of soil tillage systems in the first
year (11.4 g), reported the greatest 1000-seed
weight (15.2 g) for no-till system and the no-till
system was significantly different from the plow
tillage system.
Table 12. 1000-seed weight values of tillage and sowing methods
Treatments Years
2013 2014 2015 Average
DS 166.00 c 163.43 d 164.77 d 164.74
RS 176.83 b 179.04 b 184.43 b 180.10
CST 176.71 b 175.68 c 175.03 c 175.81
RST 181.17 a 188.43 a 189.08 a 186.23
Average 175.18 176.65 178.33
CV 1.02 0.23 0.94
LSD 3.57** 3.82** 3.38**
Year x Treatment: Significant ** ** Significant at P< 0.01; * Significant at P< 0.05; 1 The means indicated with the same letters in the same columns are not significantly
different; DS: Direct sowing, RS: Ridge sowing, CST: Conventional soil tillage, RST: Reduced soil tillage, CV: Coefficient of variation,
LSD: Least significant difference
Regarding yields (kg da-1
) of different soil
tillage systems in different years, year*treatment
interactions were not found to be significant (Table
13). Therefore, the years were not assessed
separately. Three-year (2013, 2014, 2015) results of
treatments were assessed together. The greatest
yield was obtained from the reduced soil tillage and
the lowest yield was obtained from the direct
sowing treatments. Kosutic et al. (2005) reported the
greatest yield for reduced soil tillage and the lowest
yield for direct sowing onto stubble. Helaloglu et al.
(1989) reported the greatest yield for no-till stubble
drill. Ocaktan (1989) reported the greatest yield for
Anatolian plow + disc harrow + harrow and chisel +
disc harrow + harrow treatments in heavy-textured
soils and for gobble disc + harrow treatments
besides the previous ones in medium-textured soils.
Borin and Sartori (1995) reported that among
conventional tillage, minimum tillage, and no-tillage
in maize culture, the greatest yield was obtained
from the conventional tillage.

2100
Effects of different… KABAS, O. et al
Biosci. J., Uberlândia, v. 36, n. 6, p. 2092-2107, Nov./Dec. 2020 http://dx.doi.org/10.14393/BJ-v36n6a2020-49949
Table 13. Yield (kg da
-1) values of tillage and sowing methods
Treatments Years
2013 2014 2015 Average
DS 280.46 282.28 283.51 282.08 c
RS 350.33 352.69 352.86 351.96 b
CST 346.25 346.90 353.82 348.99 b
RST 373.39 374.04 382.11 376.51 a
Average 337.61 338.98 343.07 339.89
CV 1.28
LSD 4.33
Year x Treatment: Insignificant
** Significant at P< 0.01; * Significant at P< 0.05; 1 The means indicated with the same letters in the same columns are not significantly
different; DS: Direct sowing, RS: Ridge sowing, CST: Conventional soil tillage, RST: Reduced soil tillage, CV: Coefficient of variation,
LSD: Least significant difference
Plant emergence
In second-crop soybean culture, effects of
different soil tillage and sowing systems
(conventional tillage, ridge-sowing, reduced tillage,
and direct sowing) on mean emergence time (MET),
germination rate index (GRI), emergence rate (ER),
space ratio (SR), tillering ratio (TR) and acceptable
plant spacing ratio (APSR) are provided in Tables
14, 15, 16, 17, 18, 19, 20, 21 and 22 for 3 years.
In the first year, soil tillage and sowing systems had
significant effects on germination rate, emergence
rate, space ratio, tillering ratio, and APSR at p<0.01
level, and effects on mean emergence time were
found to be significant at p<0.05 level (Table 14).
The greatest emergence time and space ratio values
were obtained from the direct sowing (no-till)
system. The greatest germination rate was observed
in ridge-sowing and reduced soil tillage systems.
The greatest emergence ratio was observed in
reduced tillage, the greatest tillering ratio was
observed in conventional tillage and the lowest
emergence and tillering ratios were observed in
direct sowing systems.
Table 14. Variance analysis and comparison of means for plant emergence in the first year
Parameters Treatments Variance analysis
DS RS CST RST CV LSD SL
Mean emergence time (day) 12.10 a 10.57 b 11.42 ab 10.78 b 3.80 0.85 *
Germination rate index (plant/day) 1.25 c 1.43 a 1.33 b 1.43 a 2.85 0.07 **
Emergence rate (%) 0.756 c 0.793 b 0.813 ab 0.816 a 1.37 0.02 **
Space ratio (%) 11.26 a 8.67 b 6.40 d 7.45 c 3.50 0.59 **
Tillering ratio (%) 0.53 c 1.11 b 1.83 A 0.90 b 0.78 0.01 **
APSR (%) 88.21 c 90.21 b 91.89 a 91.50 a 0.27 0.49 ** ** Significant at P< 0.01; * Significant at P< 0.05; 1 The means indicated with the same letters in the same row are not significantly
different; CV: Coefficient of variation, LSD: Least significant difference, SL: Significance level
In the second year, soil tillage systems did
not have significant effects on mean emergence time
and germination ratio (Table 15). Different soil
tillage systems had significant effects on emergence
rate, space ratio, tillering ratio, and APSR at p<0.01
level. The greatest emergence rate was obtained
from the conventional soil tillage and the lowest
emergence rate was obtained from the direct sowing
(no-till) system. The greatest space ratio was
observed in direct sowing and the greatest tillering
ratio and APSR were observed in the ridge-sowing
system.

2101
Effects of different… KABAS, O. et al
Biosci. J., Uberlândia, v. 36, n. 6, p. 2092-2107, Nov./Dec. 2020 http://dx.doi.org/10.14393/BJ-v36n6a2020-49949
Table 15. Variance analysis and comparison of means for plant emergence in the second year
Parameters Treatments Variance analysis
DS RS CST RST CV LSD LS
Mean emergence time
(day) 12.23 11.25 11.12 10.55 - - n.s
Germination rate index
(plant/day) 1.38 1.42 1.45 1.36 - - n.s
Emergence rate (%) 0.650 c 0.746 b 0.786 a 0.753 b 1.83 0.026 **
Space ratio (%) 14.31 a 5.42 d 8.64 b 7.51 c 2.88 0.51 **
Tillering ratio (%) 0.60 d 1.62 a 0.85 c 1.13 b 2.89 0.06 **
APSR (%) 85.08 d 92.97 a 90.50 c 91.65 b 0.57 1.04 ** ** Significant at P< 0.01; * Significant at P< 0.05; 1 The means indicated with the same letters in the same row are not significantly
different; CV: Coefficient of variation, LSD: Least significant difference, SL: Significance level
In the third year, different soil tillage
systems did not have significant effects on mean
emergence time, germination rate index, and
germination rates (Table 16). But different soil
tillage systems had significant effects on space ratio,
tillering ratio, and APSR at p<0.01 level.
Table 16. Variance analysis and comparison of means for plant emergence in the third year
Parameters Treatments Variance analysis
DS RS CST RST CV LSD LS
Mean emergence time
(day) 12.25 11.31 11.12 11.46 - - n.s
Germination rate index
(plant/day) 1.60 1.52 1.46 1.50 - - n.s
Emergence rate (%) 0.653 0.803 0.809 0.786 - - n.s
Space ratio (%) 10.62 a 4.22 c 9.29 ab 7.92 b 8.66 1.38 **
Tillering ratio (%) 0.69 c 2.02 a 0.77 c 1.32 b 4.08 0.097 **
APSR (%) 88.68 c 93.77 a 89.96 b 90.76 b 0.69 1.25 ** ** Significant at P< 0.01; * Significant at P< 0.05; 1 The means indicated with the same letters in the same row are not significantly
different. CV: Coefficient of variation, LSD: Least significant difference, SL: Significance level
Regarding the mean emergence times of
soybean plants, the lowest value (10.57 days) was
observed in the ridge-sowing treatment of the first
year and the greatest value (12.25 days) was
observed in direct sowing treatment of the third
year. Mean germination times of direct sowing (no-
till) systems were greater than the other soil tillage
systems. Taser and Kara (2005) reported mean
germination times of maize at different soil
compaction levels as between 12.08 - 12.25 days.
Bayhan et al. (2006) reported the shortest plant
emergence time for direct sowing systems.
Regarding the effects of different soil tillage
systems on the emergence rate index and APSR,
ridge-sowing, conventional soil tillage, and reduced
soil tillage were placed in the same statistical group.
Taser and Kara (2005) experimented with different
soil compaction levels in second-crop silage maize
and reported the lowest germination rate index as
0.47 seed/m.day. Based on 3-year data, conventional
soil tillage yielded greater field emergence levels
than the no-till system. As can be inferred from the
present tables that the lowest field emergence level
(65.00%) was observed in direct sowing treatments
of the second year and the greatest value (81.60%)
was observed in reduced soil tillage systems of the
first year. Bayhan et al. (2006) reported the greatest
emergence levels for direct sowing treatments.
Cakır et al. (2006) compared conversation
soil tillage and direct sowing systems and reported
the greatest field emergence level as 74%. Ozpinar
and Isik (2004) experimented with conventional and
reduced soil tillage systems and ridge and normal
row sowing methods and reported field emergence
levels of cotton as between 72 – 88%.
Mean emergence times of different soil
tillage systems in different years are provided in
Table 17. Year*treatment interactions were not
found to be significant. Therefore, the years were
not assessed separately. Three-year (2013, 2014,
2015) results of treatments were assessed together.
The earliest emergence was observed in reduced soil
tillage and the latest emergence was observed in the
direct sowing system.

2102
Effects of different… KABAS, O. et al
Biosci. J., Uberlândia, v. 36, n. 6, p. 2092-2107, Nov./Dec. 2020 http://dx.doi.org/10.14393/BJ-v36n6a2020-49949
Table 17. Mean emergence time (day) values of tillage and sowing methods
Treatments Years
2013 2014 2015 Average
DS 12.11 12.23 12.25 12.20 a
RS 10.57 11.25 11.32 11.05 b
CST 11.42 11.12 11.12 11.22 b
RST 10.78 10.55 11.46 10.93 b
Average 11.22 11.29 11.54 11.35
CV 5.08
LSD 0.57
Year x Treatment: Insignificant ** Significant at P< 0.01; * Significant at P< 0.05; 1 The means indicated with the same letters in the same columns are not significantly
different; DS: Direct sowing, RS: Ridge sowing, CST: Conventional soil tillage, RST: Reduced soil tillage, CV: Coefficient of variation,
LSD: Least significant difference
Germination rate index values of different
soil tillage and sowing systems in different years are
provided in Table 18. Year*treatment interactions
were found to be significant (p<0.01). Ridge-sowing
and reduced soil tillage systems had positive
impacts on the germination rate in 2013.
Conventional soil tillage had positive impacts on the
germination rate in 2014 and direct sowing in 2015.
Table 18. Germination rate index values of tillage and sowing methods
Treatments Years
2013 2014 2015 Average
DS 1.25 c 1.38 1.60 1.41
RS 1.43 a 1.42 1.52 1.46
CST 1.33 b 1.45 1.46 1.39
RST 1.43 a 1.36 1.50 1.43
Average 1.36 1.40 1.52
CV 2.86 4.51 4.23
LSD 0.07** 0.12 0.12
Year x Treatment: Significant ** ** Significant at P< 0.01; * Significant at P< 0.05; 1 The means indicated with the same letters in the same columns are not significantly
different; DS: Direct sowing, RS: Ridge sowing, CST: Conventional soil tillage, RST: Reduced soil tillage, CV: Coefficient of variation,
LSD: Least significant difference
Emergence rates (%) of different soil tillage
and sowing systems in different years are provided
in Table 19. Year*treatment interactions were not
found to be significant. Therefore, the years were
not assessed separately. Three-year (2013, 2014,
2015) results of treatments were assessed together.
The greatest emergence rate was observed in
conventional soil tillage and the lowest value was
observed in the direct sowing system.
Table 19. Emergence rate values of tillage and sowing methods
Treatments Years
2013 2014 2015 Average
DS 0.76 0.65 0.65 0.69 b
RS 0.80 0.75 0.80 0.78 ab
CST 0.82 0.79 0.81 0.89 a
RST 0.82 0.75 0.79 0.78 ab
Average 0.79
CV 16.23
LSD 0.12
Year x Treatment: Insignificant ** Significant at P< 0.01; * Significant at P< 0.05; 1 The means indicated with the same letters in the same columns are not significantly
different; DS: Direct sowing, RS: Ridge sowing, CST: Conventional soil tillage, RST: Reduced soil tillage, CV: Coefficient of variation,
LSD: Least significant difference

2103
Effects of different… KABAS, O. et al
Biosci. J., Uberlândia, v. 36, n. 6, p. 2092-2107, Nov./Dec. 2020 http://dx.doi.org/10.14393/BJ-v36n6a2020-49949
Space ratios of different soil tillage and
sowing systems in different years are provided in
Table 20. Year*treatment interactions were found to
be significant (p<0.01). Conventional soil tillage
system had positive impacts on space ratios in 2013.
Ridge-sowing had positive impacts on space ratios
in 2014 and 2015.
Table 20. Space ratio rate values of tillage and sowing methods
Treatments Years
2013 2014 2015 Average
DS 11.26 a 14.31 a 10.63 a 12.07
RS 8.67 b 5.42 d 4.22 c 6.11
CST 6.41 d 8.64 b 9.29 ab 8.11
RST 7.45 c 7.51 c 7.92 b 7.63
Average 8.45 8.97 8.01
CV 3.5 2.88 8.66
LSD 0.59** 0.51** 1.38**
Year x Treatment: Significant**
** Significant at P< 0.01; * Significant at P< 0.05; 1 The means indicated with the same letters in the same columns are not significantly
different; DS: Direct sowing, RS: Ridge sowing, CST: Conventional soil tillage, RST: Reduced soil tillage, CV: Coefficient of variation,
LSD: Least significant difference
Tillering ratios (%) of different soil tillage
systems in different years are provided in Table 21.
Year*treatment interactions were found to be
significant (p<0.01). Direct sowing had positive
impacts on tillering ratios in 2013, 2014, and 2015.
Table 21. Tillering ratio values of tillage and sowing methods
Treatments Years
2013 2014 2015 Average
DS 0.54 d 0.60 d 0.69 c 0.61
RS 8.67 a 1.62 a 2.02 a 4.11
CST 6.41 c 0.85 c 0.76 c 2.67
RST 7.45 b 1.13 b 1.32 b 3.30
Average 5.76 1.05 1.19
CV 4.97 2.89 4.08
LSD 0.57** 0.06** 0.09**
Year x Treatment: Significant**
** Significant at P< 0.01; * Significant at P< 0.05; 1 The means indicated with the same letters in the same columns are not significantly
different; DS: Direct sowing, RS: Ridge sowing, CST: Conventional soil tillage, RST: Reduced soil tillage, CV: Coefficient of variation,
LSD: Least significant difference
APSR values of different soil tillage
systems in different years are provided in Table 22.
Year*treatment interactions were found to be
significant (p<0.01). Direct sowing had positive
impacts on APSR values in 3 years.
Table 22. APSR (%) values of tillage and sowing methods
Treatments Years
2013 2014 2015 Average
DS 88.21 c 85.08 d 88.68 c 87.32
RS 90.21 b 92.97 a 93.77 a 92.32
CST 91.90 a 90.50 c 89.96 b 90.79
RST 91.51 a 91.65 b 90.76 b 91.31
Average 90.45 90.05 90.79
CV 0.27 0.57 0.69
LSD 0.49** 1.04** 1.25**
Year x Treatment: Significant**
** Significant at P< 0.01; * Significant at P< 0.05; 1 The means indicated with the same letters in the same columns are not significantly
different; DS: Direct sowing, RS: Ridge sowing, CST: Conventional soil tillage, RST: Reduced soil tillage, CV: Coefficient of variation,
LSD: Least significant difference

2104
Effects of different… KABAS, O. et al
Biosci. J., Uberlândia, v. 36, n. 6, p. 2092-2107, Nov./Dec. 2020 http://dx.doi.org/10.14393/BJ-v36n6a2020-49949
CONCLUSION
Present experiments were conducted over
the experimental fields of the Bati Akdeniz
Agricultural Research Institute in Aksu town of
Antalya province for 3 years in 2013, 2014, and
2015 as a fixed experiment. Soybean was sown as a
second crop after the wheat harvest in June. Besides
conventional soil tillage, three different alternative
soil tillage and sowing systems (direct sowing – no-
till, ridge-sowing, and reduced soil tillage) were
experimented and the effects of different soil tillage
and sowing systems on plant growth, development,
and emergence traits were investigated.
Assessments on 3-year data separately revealed that.
According to 2013 data, different soil tillage
and sowing systems had significant effects on the
first pod height at p<0.05 level and the other traits,
except for the number of days to 50% flowering at
p<0.01 level. In 2014, different soil tillage and
sowing systems had significant effects on all traits,
except for the first pod height, at p<0.01 level. In
2015, different soil tillage and sowing systems had
significant effects on the number of days to 50%
flowering and the first pod height at p<0.05 level
and the other traits at p<0.01 level.
With regard to the effects of different soil
tillage and sowing systems on plant growth and
development, assessments on year*treatment
interactions based on 3-year averages revealed that.
With regard to the effects of different soil
tillage systems on the number of days to 50%
emergence, year*treatment interactions were found
to be significant at p<0.01 level. The greatest value
(5.05 days) was obtained from conventional soil
tillage and the lowest value (4.73 days) was
obtained from the ridge-sowing system.
With regard to the effects of different soil
tillage systems on plant heights, year*treatment
interactions were found to be significant at p < 0.05
level. The greatest value (83.48 cm) was obtained
from the reduced soil tillage and the lowest value
(69.96 cm) was obtained from the direct sowing
(no-till) system.
With regard to the effects of different soil
tillage systems on the first pod height,
year*treatment interactions were found to be
significant at p<0.01 level. The greatest value (6.67
cm) was obtained from the reduced and
conventional soil tillage and the lowest value (6.33
cm) was obtained from the direct sowing (no-till)
and ridge-sowing systems.
With regard to the effects of different soil
tillage systems on 1000-seed weight, year*treatment
interactions were found to be significant at p<0.01
level. The greatest value (186.23 g) was obtained
from the reduced soil tillage and the lowest value
(164.74 g) was obtained from the direct sowing (no-
till) system.
With regard to effects of different soil
tillage and sowing systems on the number of days to
50% flowering, number of pods per plant, number
of plants per m² and yield, year*treatment
interactions were not found to be significant. The
greatest values were observed in the reduced soil
tillage system.
With regard to the effects of different soil
tillage and sowing systems on plant emergence
traits, assessments on 3-year data separately
revealed that.
According to 2013 data, different soil tillage
and sowing systems had significant effects on mean
emergence time at p<0.05 level and the other traits
at p<0.01 level. In 2014, different soil tillage and
sowing systems had significant effects on all traits,
except for mean emergence time and germination
rate, at p<0.01 level. In 2015, different soil tillage
and sowing systems did not have any significant
effects on mean emergence time, germination rate
index, and emergence ratio, but had significant
effects on the other traits at p<0.01 level.
With regard to the effects of different soil
tillage and sowing systems on plant emergence
traits, assessments on year*treatment interactions
based on 3-year averages revealed that.
With regard to the effects of different soil
tillage systems on germination rate index values,
year*treatment interactions were found to be
significant at p<0.01 level. The greatest value (1.46
plant/day) was obtained from the ridge-sowing
system.
With regard to the effects of different soil
tillage systems on space ratios, year*treatment
interactions were found to be significant at p<0.01
level. The greatest value (12.07%) was obtained
from the direct sowing (no-till) system.
With regard to the effects of different soil
tillage systems on tillering ratios, year*treatment
interactions were found to be significant at p<0.01
level. The greatest values were obtained from the
ridge-sowing.
With regard to the effects of different soil
tillage systems on APSR values, year*treatment
interactions were found to be significant at p<0.01
level. The greatest values were obtained from the
ridge-sowing.
With regard to the effects of different soil
tillage systems on mean emergence time and
2105
Effects of different… KABAS, O. et al
Biosci. J., Uberlândia, v. 36, n. 6, p. 2092-2107, Nov./Dec. 2020 http://dx.doi.org/10.14393/BJ-v36n6a2020-49949
emergence ratio, year*treatment interactions were not found to be significant.
RESUMO: Efeitos de diferentes sistemas de preparo do solo e de semeadura (preparo convencional do
solo - CST: arado de aiveca + disco de pastilha + grade de disco + grade + semeadora; preparo do solo reduzido
- RST: máquina de preparo do solo combinada com rototiller + máquina de semeadura; semeadura em crista -
RS: disco de gobble + semeadora em crista; semeadura direta - DS - plantio direto) sobre o desenvolvimento da
planta e as características de emergência da soja de segunda safra foram investigadas neste estudo nas
condições da província de Antalya. Os experimentos foram conduzidos nos campos experimentais da filial de
Aksu do Bati Akdeniz Agricultural Research Institute por 3 anos (2013, 2014, 2015) como um experimento
fixo. O número de dias para 50% de emergência, número de dias para 50% de floração, altura da planta,
número de vagens por planta, altura da primeira vagem, número de plantas por m2, peso de 1000 sementes e
rendimento foram considerados como parâmetros de desenvolvimento da planta. Tempo médio de emergência,
índice de taxa de germinação, razão de emergência, razão de espaço, razão de perfilhamento e razão de
espaçamento de plantas aceitável foram considerados como parâmetros de emergência das plantas. Diferentes
sistemas de preparo do solo e de semeadura geralmente tiveram efeitos significativos nas características
investigadas nos níveis p <0,01 e p <0,05.
PALAVRAS-CHAVE: Conversação. Emergência. Perfilhamento. Solo.
REFERENCES
ANONYMOUS. Test methods of precision sowing machines. Ankara: Turkish Standards Institution. 1989.
ARIOGLU, F. Cultivation of soybean. Adana: C.U. Faculty of Agriculture. 2013.
ARSLAN, M.; ARIOGLU, H. Determination of the effects of different tillage methods on growth and
development of some soybean varieties under second crop conditions in Çukurova region. In: 4. Field
Crops Congress, Tekirdağ, Turkiye, 2001.
AYKAS, E.; ONAL, I. Effects of different type of seed bed preparation machines on operating
characteristics and wheat yield. In: 6. International Agriculture Machinery and Energy Congres, Ankara,
Turkiye, 1996.
BAKOGLU, A.; AYCICEGI, M. Agricultural characteristic and seed yield of soybean (Glycine max L.) under
Elazig conditions. F.U. Journal of Science and Engineering Sciences, v.17, p.52-58. 2005.
BARUT, Z.B. Determination of the appropriate working conditions of the vertical plate air suction
precision planter used for sowing different seeds. Adana: University of Çukuroava, 1996. Doctoral
Dissertation
BAYHAN, Y.; KAYISOGLU, B.; GONULOL, E.; YALCIN, H.; SUNGUR, N. Possibilities of direct drilling
and reduced tillage in second crop silage corn. Soil and Tillage Research, v.88, p.1-7. 2006.
https://doi.org/10.1016/j.still.2005.04.012
BILBRO, J.D.; WANJURA, D.F. Soil cruts and cotton emergence relationships. Transactions of the ASAE,
25:1484-1487. 1982. https://doi.org/10.13031/2013.33750
BORIN, M.; SARTORI, L. Barley, soybean and maize production using ridge tillage, no-tillage, and
conventional tillage in North-East Italy. Journal of Agricultural Engineering Research, v.62, p.229-236.
1995. https://doi.org/10.1006/jaer.1995.1081
CAKIR, E.; YALCIN, H.; AYKAS, E.; GULSOYLU, E.; OKUR, B.; DELIBACAK, S.; ONGUN, A.R.;
KORUCU, T. Effects of soil tillage and direct sowing on second crop maize yield. In: 23. National
Agricultural Machinery Congress, Canakkale, Turkey, 2006.

2106
Effects of different… KABAS, O. et al
Biosci. J., Uberlândia, v. 36, n. 6, p. 2092-2107, Nov./Dec. 2020 http://dx.doi.org/10.14393/BJ-v36n6a2020-49949
DEMIR, F., HACISEFEROGULLARI, H.; DOGAN, H. Determination of the effects of vertical spindle pile
to some physical properties of soil and power requirement. In: 19. National Agricultural Machinery
Congress, Erzurum, Turkey, 2000.
EKER, B., and P. ULGER. 1988. Investigation of the effects of soil tillage tools used in sunflower
cultivation on soil and plant characteristics. In: 11. National Agricultural Machinery Congress, Erzurum,
Turkey, 1988.
GOZUBUYUK, Z.; OZTAŞ, T.; CELIK, A.; YILDIZ, T.; ADIGUZEL, M.C. The effect of different tillage and
sowing methods on some physical properties of soil. Soil Science and Plant Nutrition, v.5, p.48-52. 2017.
HELALOGLU, C.; FERHATOGLU, H.I. Soil cultivation technique of second crop soy in Harran plain.
Sanliurfa: Research Institute Publication No: 50, 1989.
JALOTA, S.K.; BUTTAR, G.S.; SOOD, A.L.; CHAHAL, G.B.S.; RAY, S.S.; PANIGRAHY, S. Effects of
sowing date, tillage and residue management on productivity of cotton (Gossypium hirsutum L.)–wheat
(Triticum aestivum L.) system in Northwest India. Soil and Tillage Research, v.99, p.76-83. 2008.
https://doi.org/10.1016/j.still.2008.01.005
KACHMAN, S.D.; SMITH, J.A. Alternative measures of accuracy in plant spacing for planters using single
seed metering. Transactions of the ASAE, v.38, p.379-387. 1995. https://doi.org/10.13031/trans.57.10466
KARAMANOS, A.J.; BILALIS, D.; SIDIRAS, N. Effects of reduced tillage and fertilization practices on soil
characteristics, plant water status, growth, and yield of upland cotton. Journal of Agronomy and Crop
Science, v.190, p.262–276. 2004. https://doi.org/10.1111/j.1439-037X.2004.00101.x
KAYISOGLU, B.; TASERI, L.; BAYHAN, Y. The effects of second-class soil tillage tools on some physical
properties of soil and aggregate stability. In: 6. International Agricultural Machinery and Energy Congress,
Adana, Turkey, 1996.
KOLAY, B. Effects of different soil tillage methods on second crop soybean yield and some soil properties
at Diyarbakır conditions. Şanlıurfa: University of Harran, 2007. Master's Dissertation.
KORZENIOWSKA, J.; STANISŁAWSKA-GLUBIAK, E. Comparison of production effects of zero and
conventional tillage on sandy soil of South-west Poland. Fragmenta Agronomica, v.26, p.65-73. 2009.
KOŠUTIĆ, S.; FILIPOVIĆ, D.; GOSPODARIĆ, Z.; HUSNJAK, S.; KOVAČEV, I.; ČOPEC, K. Effects of
different soil tillage systems on yield of maize, winter wheat and soybean on albic luvisol in North-West
Slavonia. Journal of Central European Agriculture 6:241-248. 2005.
MAURYA, P.R. Comparison of zero-tillage and conventional tillage in wheat and maize production under
different soils and climates in Nigeria. AMA Agricultural Mechanization in Asia Africa and Latin
America, v.19, p.30-32. 1988.
MERRILL, S.D.; BLACK, A.L.; BAUER, A. Conservation tillage affects root growth of dryland spring wheat
under drought. Soil Science Society of American Journal, v.60, p.575-583. 1996.
https://doi.org/10.2136/sssaj1996.03615995006000020034x
OCAKTAN, A. Soil tillage technique of second crop soybean after wheat cultivation in irrigated
conditions of Bafra and Carsamba plains. Samsun: Research Institute Publication No: 57, 1989.
ONAT, F.B.Z. Effects of different plant densities obtained in skip row system of earlier and late sown
double crop soybean on seed yield and yield components. Adana: University of Çukuroava, 2012. Doctoral
Dissertation

2107
Effects of different… KABAS, O. et al
Biosci. J., Uberlândia, v. 36, n. 6, p. 2092-2107, Nov./Dec. 2020 http://dx.doi.org/10.14393/BJ-v36n6a2020-49949
OZGUVEN, F.; AYDINBELGE, M. A research on the effect of soil cultivation tools used in the
preparation of the second crop seed on soil compaction. In: 4. International Agricultural Machinery and
Energy Congress, Adana, Turkey, 1999.
OZPINAR, S.; ISIK, A. Effects of tillage, ridging and row spacing on seedling emergence and yield of cotton.
Soil & Tillage Research, v.75, p.19–26. 2004. https://doi.org/10.1016/j.still.2003.07.004
OZTURK, F. The effects of tillage methods and plant density on growth, development, and yield of
soybean [Glycine max (L.) Merrill] grown under main and second cropping system. Diyarbakır:
University of Dicle, 2015. Doctoral Dissertation
PEDERSEN, P.; LAUER, J.G. Corn and soybean response to rotation sequence, row spacing, and tillage
system. Agronomy Journal, v.95, p.965–971. 2003. https://doi.org/10.2134/agronj2003.0965
SESSIZ, A.; SOGUT, T.; TEMIZ, M.G.; GURSOY, S. Yield and quality of soybean (Glycine max.L.) sown as
double crop under conservation and conventional tillage system in Turkey. Res.on Crops, v.10, p.558-565.
2009.
SINGER, J.W.; LOGSDON, S.D.; MEEK, D.W. Soybean growth and seed yield response to tillage and
compost. Agronomy Journal, v.100, p.1039-1046. 2008. https://doi.org/10.2134/agronj2007.0360
TASER, O.F.; KARA, O. Silage maize (Zea mays L.) seedlings emergenceas influenced by soil compaction
treatmentsand contact pressures. Plant Soil Environ., v.51, p.289–295. 2005.
https://doi.org/10.17221/3588.PSE
TEMPERLY, R.J.; BORGES, R. Tillage and crop rotation impact on soybean grain yield and composition.
Agronomy Journal, v.98, p.999-1004. 2006. https://doi.org/10.2134/agronj2005.0215
TEZER, E.; SABANCI, A. Agricultural mechanization. Adana: University of Çukurova, 1990.
YALCIN, H.; SUNGUR, N. A research effects of two different seed bed preparation methods on yield in
second crop corn farming. In: 13. National Agricultural Machinery Congress, Konya, Turkey, 1991.
YALCIN, H.; CAKIR, E. Tillage effects and energy efficiencies of subsoiling and direct seeding in light soil on
yield of second crop corn for silage in Western Turkey. Soil and Tillage Research v.90, p.250-255. 2006.
https://doi.org/10.1016/j.still.2005.10.003
YALCIN, I., TOPUZ, N.; YAVAŞ, I.; ÜNAY, A. The determination of practicability of ridge tillage method in
second crop maize. ADU Agriculture Faculty Journal, v.6, p.35-40. 2009.
YETIM, S. The effect of nitrogen and ıron fertilization on yield and some quality parameters of soybean
(glycine max l. merill) plant grown as second crop in harran plain conditions of south-east anatolia
project region. Ankara: University of Ankara, 2008. Doctoral Dissertation