soil structure as influenced by simulated tillage h. … · soil structure as influenced by...
TRANSCRIPT
Reprinted from the Soil Science Society of America Journal Volume 48. no. 4. July-August 1984
677 South Segoe Rd., Madison, WI 5371 1 USA
Soil Structure as Influenced by Simulated Tillage D. H. POWERS AND E. L. SKIDMORE
Soil Structure as Influenced by Simulated Tillage' D. H. POWERS AND E. L. SKID MORE^
ABSTRACT Soil is often intensively manipulated by tillage, equipment traffic,
and preparation for laboratory analysis. Realizing that manipulated and reconstituted soils have been and are being used in soil structure research, we used surface-soil samples of cultivated and nonculti- vated Reading silt loam (fine, mixed, mesic, Typic Argiudolls) to evaluate the effects of simulated tillage on soil structure and to de- termine how well the structures of disturbed soils represent the structures of nondisturbed soils of similar composition. Soil cores 86 by 60 mm were formed after the following treatments had been applied: ultrasonically dispersed and freeze-dried, crushed and passed through a 2-mm sieve, and nondisturbed. The soil structural differ- ences were evaluated by soil-water-characteristic curves, saturated- hydraulic conductivities, compression indices, bulk densities, wet- and dry-aggregate stabilities, and scanning-electron-microscopy. The results show that the soil structures of reconstituted, intensively or even mildly manipulated soils differ considerably from the nondis- turbed soils of the same makeup. The greater the disturbance, the greater the differences between the nondisturbed and disturbed soils. The main differences were caused by the destruction of cements and bridges between individual aggregates, which create large, com- pound-unit (ped) structures.
Additional Index Words: dry-aggregate stability, wet-aggregate stability, compression indices, soil-water-characteristic, scanning- electron microscopy.
Powers, D. H., and E. L. Skidmore. 1984. Soil structure as influ- enced by simulated tillage. Soil Sci. SOC. Am. J. 489794384.
OIL STRUCTURAL properties have been evaluated S by various techniques. Many studies have looked at the aggregate stabilities (wet and dry) and aggregate distributions of noncultivated and cultivated, nondis- turbed and disturbed soils (1, 2, 6, 7, 8, 15, 20, 21, 22, 24, 27, p. 753, 29). Most of the tests were completed in the laboratory and the results showed that manip- ulating soils in the field almost always weakened the soils' structural integrity. Weaker structures were ob- served in lower wet- and dry-aggregate stabilities (7, 20, 24, 27, p. 753, 29), higher bulk densities (2, 24), and lower porosites (2, 28). Other measurements that have evaluated soil structure included compressions (1 1, 13, 19, 23), penetration resistances (14, 23, 28), saturated-hydraulic conductivities and permeabilities (4, 24), and clod strengths (12, 24).
Our objective was to evaluate the effects of simu- lated tillage on soil structure and determine how well the structure of disturbed soils represented the struc- ture of nondisturbed soils of similar composition.
MATERIALS AND METHODS Nondisturbed and disturbed samples of the Reading silt
loam (fine, mixed, mesic, Typic Argiudolls) from nonculti- vated prairie and an adjacent cultivated field were obtained for testing from the Konza Prairie Research Natural Area 16 km south of Manhattan, KS. The non-cultivated soil had never been tilled; the cultivated soil was mainly used be- tween 1940 and 1970 for grazing with legumes that were frequently plowed under. Since 1970, conventional tillage with grain crops has been the practice.
879
Samples were taken from the surface soils (1 0 to 70 mm deep) on two occasions, July 1979 and 1980. Five replica- tions of nondisturbed, soil-core samples (86 by 60 mm) were taken with a double cylinder, hammer-driven, soil core sam- pler (3, 23). Several kilograms of soil were obtained with a shovel for the disturbed samples. Approximately one-half of the disturbed sample was ultrasonically dispersed (soni- cated) and then freeze-dried. The remaining portion was crushed and passed through a 2-mm sieve.
The disturbed soils, both sonicated and crushed, were re- molded into soil cores (86 by 60 mm) similar to the method of Chen and Banin (6). The soil was poured through a funnel into the cylinders and compacted by dropping the cylinders and soil 100 times through a distance of 1 cm. They were then soaked by capillarity and dried at 2 1 "C.
The physical and structural differences among treated samples were measured by the following methods. The soil- core and clod-bulk densities of all initial samples were de- termined by methods similar to those of Blake (3) except we dried the cores at 2 1 "C and used kerosene as the known- density liquid in testing the clods. Wet-aggregate stability was determined by direct immersion of the 2.0 and 0.84 mm aggregate-size fraction by method described by Kemper (1 6). We used a 152-mm-diam sieve (60 mesh screen, 0.25 mm in diam) and a 30-g soil sample. Our mechanical sieving machine lowered and raised the sieve holder through a dis- tance of 27 mm 25 times per min. Results are reported as the fraction of the initial soil sample remaining on the sieve after sieving.
The procedure described by Skidmore and Powers (25) was used to determine dry-aggregate stability of the treated samples. Soil aggregates were crushed by diametrically load- ing between parallel plates of an Instron3 universal-testing instrument. The energy of crushing was determined and the surface area of aggregates after crushing was calculated to give energy of crushing per unit of new surface area (J/m2). Saturated-hydraulic conductivities were measured by fall- inghead methods similar to those outlined by Klute (1 8).
Compression indices were determined by the procedure of Larson et al. (1 9). Nine successive increments of load stress ranging from 0.01 to 2.45 MPa were applied to soils in 86- by 60-mm brass cylinders. The soil sample rested on a porous ceramic plate. Replicates were run with the soil initially at two soil-water contents corresponding to soil-water pressures of - 30 and - 1UO kPa. The volume of the sample was measured at each equilibrium point, and bulk densities were calculated. The slope of bulk density vs. the logarithm of the applied stress of the linear portion of the curve (0.07- 1.5 MPa range) determined the compression index.
Soil clods 5 to 10 mm in diam, from before and after compression, were mounted and glued with a colloidal paste on aluminum biological stubs. The mounted samples were stored in a dessicator until viewing on the scanning-electron microscope (SEM) was possible. The specimens were coated with carbon and with a 60/40 gold palladium alloy before viewing on the SEM (IO). The prepared samples were ex- amined for differences in structure of soil aggregates with a ETEC U-1 scanning-electron microscope3 at 2.5, 5.0, and
Contribution from the USDA, ARS in cooperation with the Dep. of Agron., Kansas Agric. Exp. Stn., contribution 8 1-4495. Received 17 Aug. 1983. Aproved 5 Mar 1984.
2Former Research Assistant, Agron. Dep., and Soil Scientist, USDA, ARS, respectively, Kansas State Univ., Manhattan, KS 66506.
Trade and compan names are included for the benefit of the reader and do not imply endorsement or preferential treatment of the product listed by the U.S. Dep. of Agric.
880 SOIL SCI. SOC. AM. J., VOL. 48, 1984
Table 1-Dry-aggregate stabilities of indicated soils as indicated by specific crushing energy.
Compressed (2.45 MPa)
Soil-water pressure Treatments Noncompressed - 30 kPa - 100 kPa
Jlm’ Cultivated
Nondisturbed 7.18 + 3.10(a)** 33.54 + 7.97(a) 30.46 f 9.94(a) Crushhieve 0.17 f 0.05(b) 23.69 f 3.46(b) 22.35 + 5.02(b) Sonicated 0.08 + 0.01(b) 20.41 A 5.75(b) 22.07 + 3.91(b)
Nondisturbed 12.52 f 2.821a) 40.25 + 5.991a) 38.97 A 5.40(a) Crus Wsieve 0.05 f 0.01(b) 20.16 + 4.76(b) 22.21 + 2.74(b) Sonicated 0.09 + O.Olib) 19.49 A 4.08fb) 27.61 A 6.87(b)
Noncultivated
** Values followed by a common letter in each column do not differ sig- nificantly (P = 0.01).
10.0 kV accelerating voltage. Photographs were taken at 15, 30, 120, 500, and 2030 X the original sample size.
Analyses of variance and least significant differences were determined at 0.05 and 0.01 confidences.
RESULTS AND DISCUSSION The aggregates formed from the soil that had been
previously crushed or dispersed were very weak unless compressed (Table 1). Their resistance to breaking into smaller units was low. Less than 0.2 J of energy was required for each m2 of newly exposed surface area on all samples, whereas before disruption, 7.2 and 12.5 J/m2 were required for the cultivated and nonculti- vated surface soils, respectively. The wetting and drying cycles of the soil-packed cylinders did not re- form firm aggregates.
Compression of the soils at 2.45 MPa greatly in- creased the clods’ stability. The stability of the crush/ sieve and sonicated samples both increased more than a hundredfold. After compression, the disturbed sam- ples were two to three times more stable than the orig- inal disturbed samples but still only half to two-thirds as stable as the nondisturbed after compression.
The samples of the noncultivated, nondisturbed soil may be thought of as ped fragments. Considering the definition of peds and clods, we are to some extent comparing stabilities of clods and peds (in this paper we are referring to both as aggregates). Peds are de- fined (26, p. 36, 5 , 2 5 ) as individual units of soil struc- ture formed in natural processes, whereas clods are coherent masses of soil formed or molded by such activities of man as plowing or digging (9, 17).
n E
E \ n
c z W t- z 0 0 IT W
5 0.21 1 1 1 I 1
-I - 2 - 3 - 5 -10 -30 - I O 0
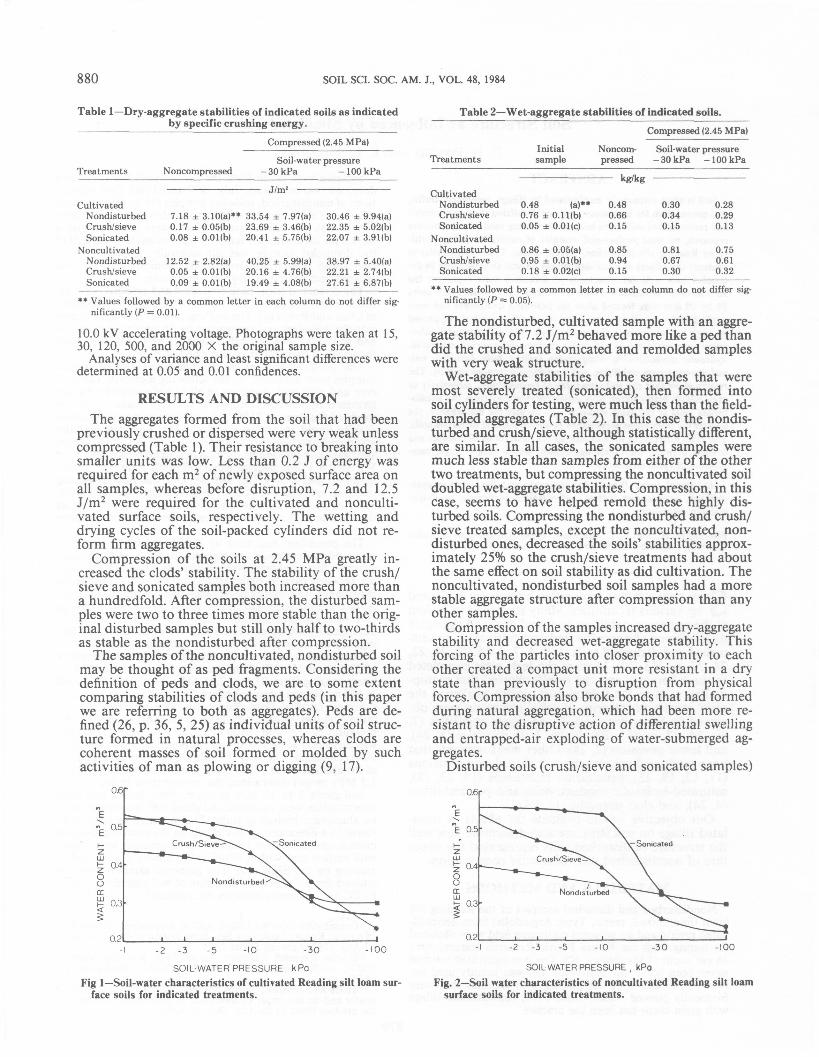
SOIL WATER PRESSURE kPo Fig 1-Soil-water characteristics of cultivated Reading silt loam sur-
face soils for indicated treatments.
Table 2-Wet-aggregate stabilities of indicated soils. ~
Compressed (2.45 MPa)
Treatments sample pressed - 30 kPa - 100 kPa Initial Noncom- Soil-water pressure
kdkg Cultivated
Nondisturbed 0.48 (a)** 0.48 0.30 0.28 CrusWsieve 0.76 + O.ll(b) 0.66 0.34 0.29 sonicated 0.05 + O.Ol(c) 0.15 0.15 0.13
Nondisturbed 0.86 + 0.05(a) 0.85 0.81 0.75 Crushhieve 0.95 + 0.01(b) 0.94 0.67 0.61 Sonicated 0.18 f O.O2(c) 0.15 0.30 0.32
Noncultivated
** Values followed by a common letter in each column do not differ sig- nificantly (P = 0.05).
The nondisturbed, cultivated sample with an aggre- gate stability of 7.2 J/m2 behaved more like a ped than did the crushed and sonicated and remolded samples with very weak structure.
Wet-aggregate stabilities of the samples that were most severely treated (sonicated), then formed into soil cylinders for testing, were much less than the field- sampled aggregates (Table 2). In this case the nondis- turbed and crush/sieve, although statistically different, are similar. In all cases, the sonicated samples were much less stable than samples from either of the other two treatments, but compressing the noncultivated soil doubled wet-aggregate stabilities. Compression, in this case, seems to have helped remold these highly dis- turbed soils. Compressing the nondisturbed and crush/ sieve treated samples, except the noncultivated, non- disturbed ones, decreased the soils’ stabilities approx- imately 25% so the crush/sieve treatments had about the same effect on soil stability as did cultivation. The noncultivated, nondisturbed soil samples had a more stable aggregate structure after compression than any other samples.
Compression of the samples increased dry-aggregate stability and decreased wet-aggregate stability. This forcing of the particles into closer proximity to each other created a compact unit more resistant in a dry state than previously to disruption from physical forces. Compression also broke bonds that had formed during natural aggregation, which had been more re- sistant to the disruptive action of differential swelling and entrapped-air exploding of water-submerged ag- gregates.
Disturbed soils (crush/sieve and sonicated samples)
0 . 6 ~
2 0.3
- I -2 -3 -5 -10 -3 0 - ! O O
SOILWATER PRESSURE, kPo
Fig. 2-Soil water characteristics of noncultivated Reading silt loam surface soils for indicated treatments.
POWERS & SKIDMORE SOIL STRUCTURE AS INFLUENCED BY SIMULATED TILLAGE 88 1
Table 3-Saturated-hydraulic conductivities and bulk densities of noncompressed soils.
Falling-head Noncompressed Treatments conductivity bulk density
d s x 106 Mg/mS Cultivated
Nondisturbed 0.01 f 0.001(a)** 1.42 f 0.03(a) Crushhieve 1.98 f 0.13 (b) 1.22 f 0.01(b) Sonicated 0.13 i 0.01 (c) 1.12 f O.Ol(C)
Noncultivated Nondisturbed 3.67 f 0.50 (a) 1.12 f 0.03(a) Crushlsieve 6.25 f 2.04 (a) 1.01 + 0.02(b) Sonicated 0.23 f 0.12 (b) 1.05 f O.Ol(c)
** Values followed by a common letter in each column do not differ sig- nificantly (P = 0.05).
had soil-water-characteristic curves considerably dif- ferent from those for the nondisturbed samples (Fig. 1 and 2). The general trend was for sonicated soils to have the highest volumetric water content at each soil- water pressure between - 1 and - 10 kPa and the non- disturbed soils to have the lowest water contents in this range. In the - 10 to - 100 kPa range, all dis- turbed samples lost water content until they had less soil water at corresponding pressure than did the non- disturbed samples. The cultivated soils also had higher water contents at each soil-water pressure than the noncultivated, which showed the same general trend in cultivation and manipulation effect.
The higher water contents in the - 1 to - 10 kPa
Table 4-Compression indices and compressed bulk densities from increment loading of indicated soils to 2.45 MPa.
Soil-water pressure
Treatments - 30 kPa - 100 kPa
Cultivated C Mg/mS C Mglms Nondisturbed 0.31 1.76 + 0.02(a)** 0.28 1.73 + 0.03(a) Crushhieve 0.33 1.81 f 0.02(a) 0.35 1.88 f 0.02(a) Sonicated 0.37 1.86 f 0.05(a) 0.35 1.76 f 0.04(a)
Nondisturbed 0.29 1.61 f 0.01(a) 0.22 1.62 f 0.03(a) Crushisieve 0.36 1.68 f 0.02(a) 0.38 1.57 f 0.02(a) Sonicated 0.39 1.66 i 0.01(a) 0.38 1.85 f 0.13fal
Noncultiva ted
** Values followed by a common letter in each column do not differ sig- nificantly ( P = 0.05).
range for disturbed soils might stem from their large aggregate surface areas attracting more water than the nondisturbed, and their early drainage in the - 10 to - 30 kPa range might stem from their larger percent- age of small pore spaces, which drain out at these pres- sures.
The nondisturbed samples seemed to have more uniform distribution of pore space. The sonicated samples, as expected, had the highest water contents between -1 and -10 kPa and lost the most water between - 10 and - 30 kPa of any samples. They were followed by the crush/sieve and then the nondisturbed samples, which had increasingly lower water contents between - 1 and - 10 kPa and lost increasingly less
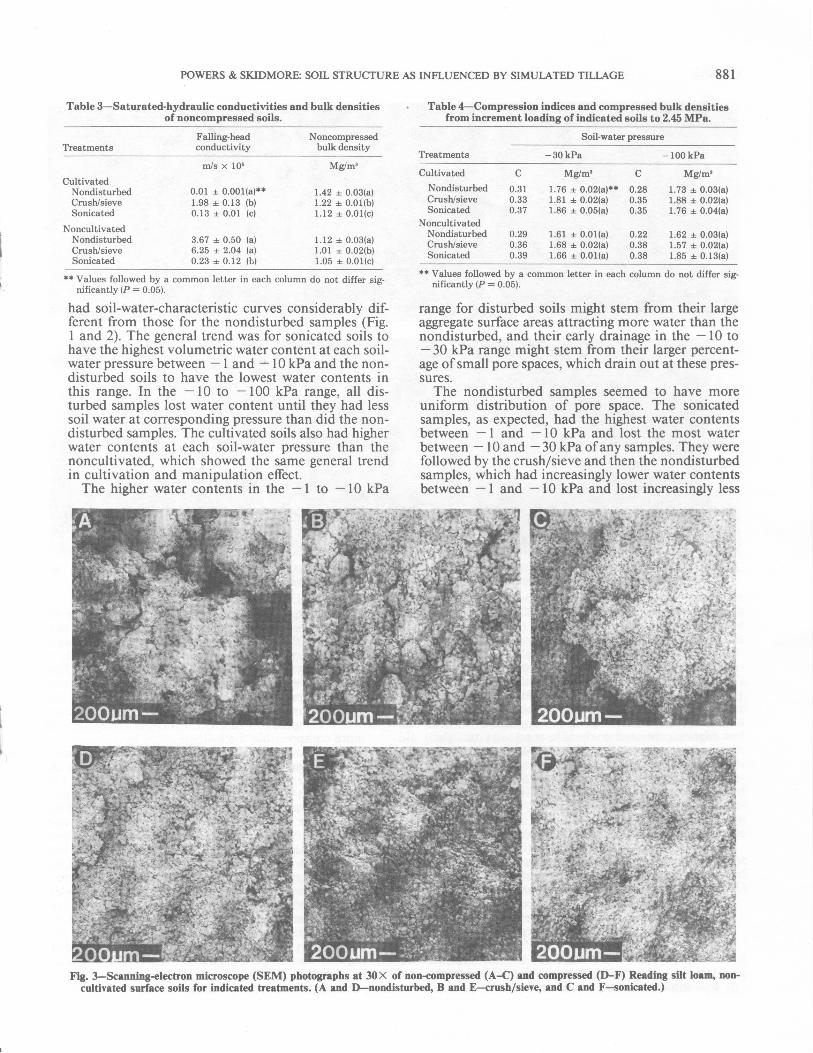
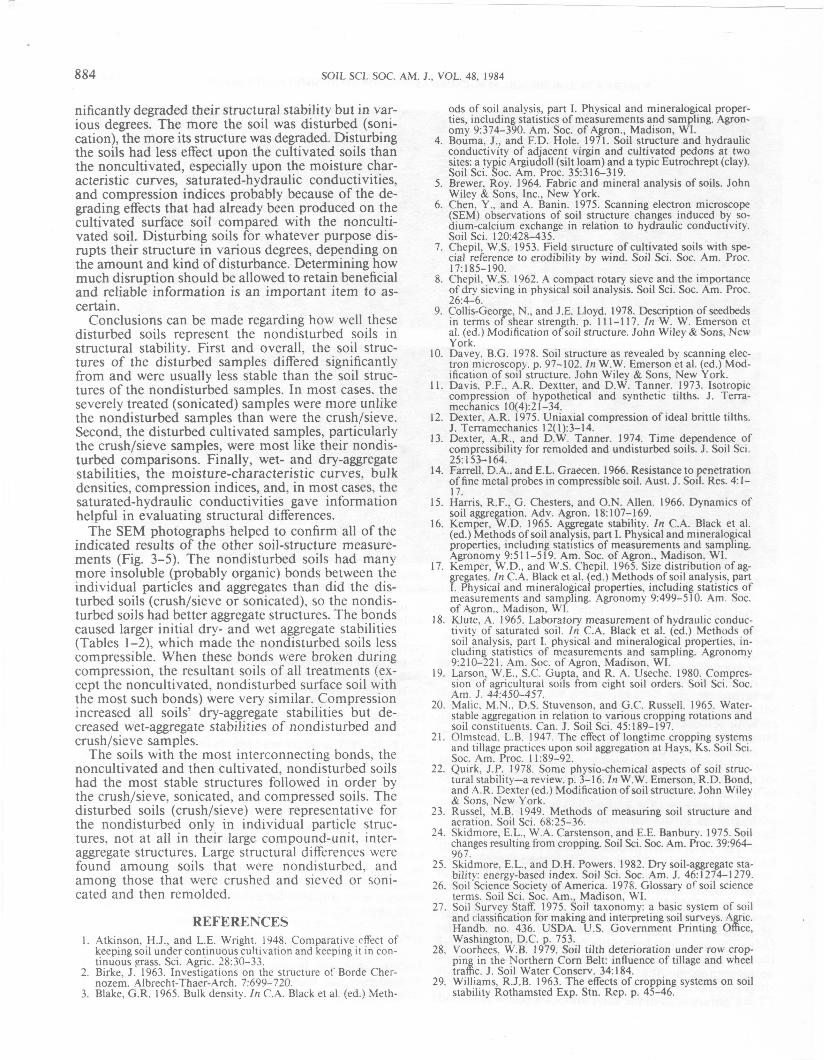
Fig. 3-Scanning-electron microscope (SEM) photographs at 30X of non-compressed ( A X ) and compressed (D-F) Reading silt loam, non- cultivated surface soils for indicated treatments. (A and D-nondisturbed, B and E-crush/sieve, and C and F-sonicated.)
882 SOIL SCI. SOC. AM. J., VOL. 48, 1984
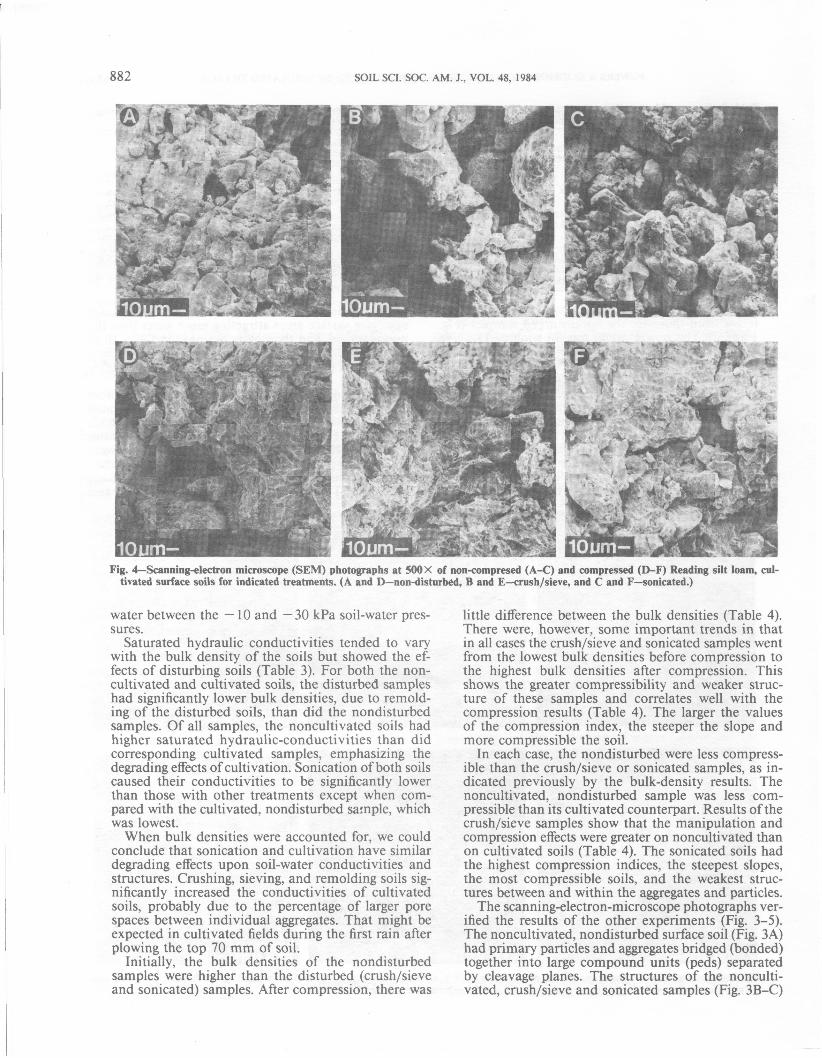
Fig. 4-Scanning-electron microscope (SEM) photographs at 500 X of non-compresed (A-C) and compressed (D-F) Reading silt loam, cul- tivated surface soils for indicated treatments. (A and D-non-disturbed, B and E-crush/sieve, and C and F-sonicated.)
water between the - 10 and - 30 kPa soil-water pres- sures.
Saturated hydraulic conductivities tended to vary with the bulk density of the soils but showed the ef- fects of disturbing soils (Table 3). For both the non- cultivated and cultivated soils, the disturbed samples had significantly lower bulk densities, due to remold- ing of the disturbed soils, than did the nondisturbed samples. Of all samples, the noncultivated soils had higher saturated hydraulic-conductivities than did corresponding cultivated samples, emphasizing the degrading effects of cultivation. Sonication of both soils caused their conductivities to be significantly lower than those with other treatments except when com- pared with the cultivated, nondisturbed sample, which was lowest.
When bulk densities were accounted for, we could conclude that sonication and cultivation have similar degrading effects upon soil-water conductivities and structures. Crushing, sieving, and remolding soils sig- nificantly increased the conductivities of cultivated soils, probably due to the percentage of larger pore spaces between individual aggregates. That might be expected in cultivated fields during the first rain after plowing the top 70 mm of soil.
Initially, the bulk densities of the nondisturbed samples were higher than the disturbed (crush/sieve and sonicated) samples. After compression, there was
little difference between the bulk densities (Table 4). There were, however, some important trends in that in all cases the crush/sieve and sonicated samples went from the lowest bulk densities before compression to the highest bulk densities after compression. This shows the greater compressibility and weaker struc- ture of these samples and correlates well with the compression results (Table 4). The larger the values of the compression index, the steeper the slope and more compressible the soil.
In each case, the nondisturbed were less compress- ible than the crush/sieve or sonicated samples, as in- dicated previously by the bulk-density results. The noncultivated, nondisturbed sample was less com- pressible than its cultivated counterpart. Results of the crush/sieve samples show that the manipulation and compression effects were greater on noncultivated than on cultivated soils (Table 4). The sonicated soils had the highest compression indices, the steepest slopes, the most compressible soils, and the weakest struc- tures between and within the aggregates and particles.
The scanning-electron-microscope photographs ver- ified the results of the other experiments (Fig. 3-5). The noncultivated, nondisturbed surface soil (Fig. 3A) had primary particles and aggregates bridged (bonded) together into large compound units (peds) separated by cleavage planes. The structures of the nonculti- vated, crush/sieve and sonicated samples (Fig. 3B-C)
POWERS & SKIDMORE SOIL STRUCTURE AS INFLUENCED BY SIMULATED TILLAGE 883
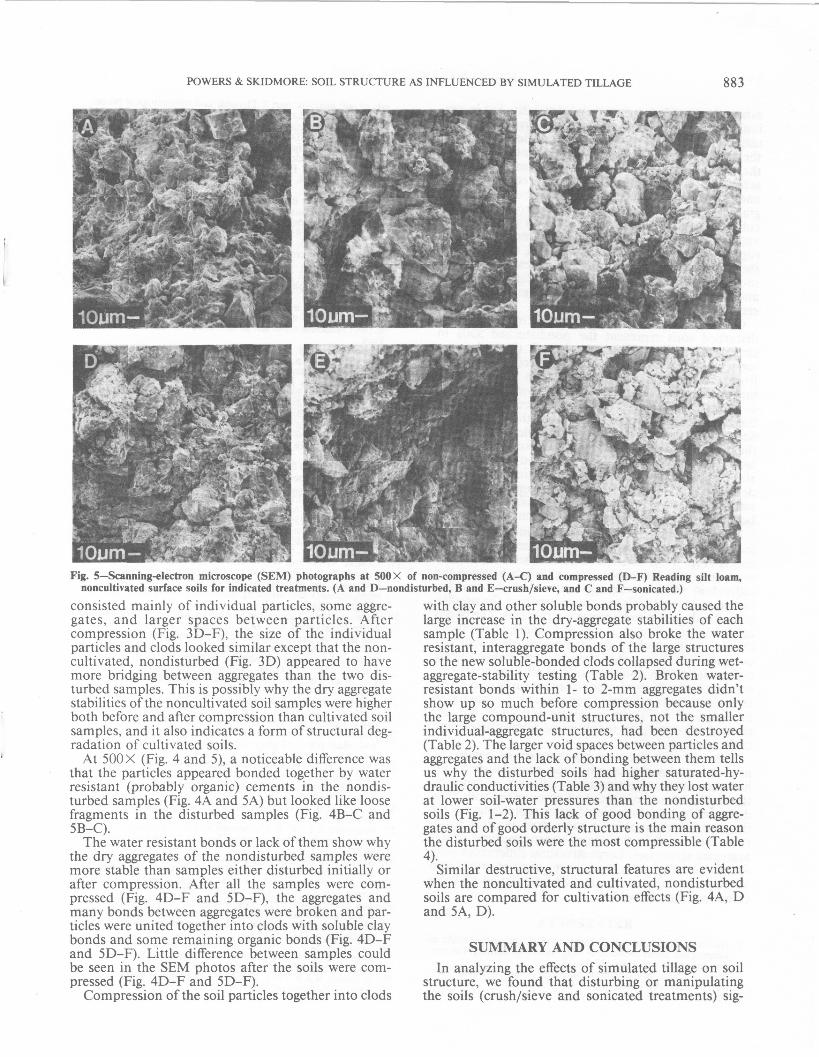
Fig. 5-Scanning-electron microscope (SEM) photographs at 500 X of non-compressed (A-C) and compressed (D-F) Reading silt loam,
consisted mainly of individual particles, some aggre- with clay and other soluble bonds probably caused the gates, and larger spaces between particles. After large increase in the dry-aggregate stabilities of each compression (Fig. 3D-F), the size of the individual sample (Table 1). Compression also broke the water particles and clods looked similar except that the non- resistant, interaggregate bonds of the large structures cultivated, nondisturbed (Fig. 3D) appeared to have so the new soluble-bonded clods collapsed during wet- more bridging between aggregates than the two dis- aggregate-stability testing (Table 2). Broken water- turbed samples. This is possibly why the dry aggregate resistant bonds within 1- to 2-mm aggregates didn’t stabilities of the noncultivated soil samples were higher show up so much before compression because only both before and after compression than cultivated soil the large compound-unit structures, not the smaller samples, and it also indicates a form of structural deg- individual-aggregate structures, had been destroyed radation of cultivated soils. (Table 2). The larger void spaces between particles and
At 500X (Fig. 4 and 5 ) , a noticeable difference was aggregates and the lack of bonding between them tells that the particles appeared bonded together by water us why the disturbed soils had higher saturated-hy- resistant (probably organic) cements in the nondis- draulic conductivities (Table 3) and why they lost water turbed samples (Fig. 4A and 5A) but looked like loose at lower soil-water pressures than the nondisturbed fragments in the disturbed samples (Fig. 4B-C and soils (Fig. 1-2). This lack of good bonding of aggre- 5B-C). gates and of good orderly structure is the main reason
The water resistant bonds or lack of them show why the disturbed soils were the most compressible (Table the dry aggregates of the nondisturbed samples were 4). more stable than samples either disturbed initially or Similar destructive, structural features are evident after compression. After all the samples were com- when the noncultivated and cultivated, nondisturbed pressed (Fig. 4D-F and 5D-F), the aggregates and soils are compared for cultivation effects (Fig. 4A, D many bonds between aggregates were broken and par- and 5A, D). ticles were united together into clods with soluble clay
noncultivated surface soils for indicated treatments. (A and D-nondisturbed, B and E-crush/sieve, and C and F-sonicated.)
bonds and some reGaining organic bonds (Fig. 4D-F and 5D-F). Little difference between samdes could SUMMARY AND CONCLUSIONS be seen in’the SEM photos after the soils were com- pressed (Fig. 4D-F and 5D-F).
Compression of the soil particles together into clods
In analyzing the effects of simulated tillage on soil structure, we found that disturbing or manipulating the soils (crush/sieve and sonicated treatments) sig-
884 SOIL SCI. SOC. AM. J., VOL. 48, 1984
nificantly degraded their structural stability but in var- ious degrees. The more the soil was disturbed (soni- cation), the more its structure was degraded. Disturbing the soils had less effect upon the cultivated soils than the noncultivated, especially upon the moisture char- acteristic curves, saturated-hydraulic conductivities, and compression indices probably because of the de- grading effects that had already been produced on the cultivated surface soil compared with the nonculti- vated soil. Disturbing soils for whatever purpose dis- rupts their structure in various degrees, depending on the amount and kind of disturbance. Determining how much disruption should be allowed to retain beneficial and reliable information is an important item to as- certain.
Conclusions can be made regarding how well these disturbed soils represent the nondisturbed soils in structural stability. First and overall, the soil struc- tures of the disturbed samples differed significantly from and were usually less stable than the soil struc- tures of the nondisturbed samples. In most cases. the severely treated (sonicated) samples were more unlike the nondisturbed samples than were the crush/sieve. Second, the disturbed cultivated samples, particularly the crush/sieve samples, were most like their nondis- turbed comparisons. Finally, wet- and dry-aggregate stabilities, the moisture-characteristic curves, bulk densities, compression indices, and, in most cases, the saturated-hydraulic conductivities gave information helpful in evaluating structural differences.
The SEM photographs helped to confirm all of the indicated results of the other soil-structure measure- ments (Fig. 3-5). The nondisturbed soils had many more insoluble (probably organic) bonds between the individual particles and aggregates than did the dis- turbed soils (crush/sieve or sonicated), so the nondis- turbed soils had better aggregate structures. The bonds caused larger initial dry- and wet aggregate stabilities (Tables 1-2), which made the nondisturbed soils less compressible. When these bonds were broken during compression, the resultant soils of all treatments (ex- cept the noncultivated, nondisturbed surface soil with the most such bonds) were very similar. Compression increased all soils' dry-aggregate stabilities but de- creased wet-aggregate stabilities of nondisturbed and crush/sieve samples.
The soils with the most interconnecting bonds. the noncultivated and then cultivated, nondisturbed soils had the most stable structures followed in order by the crush/sieve, sonicated, and compressed soils. The disturbed soils (crush/sieve) were representative for the nondisturbed only in individual particle struc- tures, not at all in their large compound-unit. inter- aggregate structures. Large structural differences were found amoung soils that were nondisturbed, and among those that were crushed and sieved or soni- cated and then remolded.
REFERENCES 1. Atkinson, H.J., and L.E. Wnght. 1348. Comparative effect of
keeping soil under continuous cultivarion and keeping i t in con- tinuous mass. Sci. Aenc. ?8:30-33
2. Birke, J. 1963. Inve&gations on the structure of Borde Cher-
3. Blake, G.R. 1965 Bulk density. In C.A. Black et al (ed.) Meth- nozem. Albrecht-Thaer-Arch. 7.699-720.
ods of soil analysis, part I. Physical and mineralogical proper- ties, including statistics of measurements and sampling. Agron- omy 9:374-390. Am. SOC. of Agron., Madison, WI.
4. Bouma, J., and F.D. Hole. 1971. Soil structure and hydraulic conductivity of adjacent virgin and cultivated pedons at two sites: a typic Argiudoll (silt loam) and a typic Eutrochrept (clay). Soil Sci. SOC. Am. Proc. 35:316-319.
5. Brewer, Roy. 1964. Fabric and mineral analysis of soils. John Wiley &. Sons, Inc., New York.
6. Chen, Y., and A. Banin. 1975. Scanning electron microscope (SEM) observations of soil structure changes induced by so- dium-calcium exchange in relation to hydraulic conductivity. Soil Sci. 120:428-435.
7. Chepil, W.S. 1953. Field structure of cultivated soils with spe- cial reference to erodibility by wind. Soil Sci. SOC. Am. Proc.
8. Chepil, W.S. 1962. A compact rotary sieve and the importance of dry sieving in physical soil analysis. Soil Sci. SOC. Am. Proc.
9. Collis-Geo e, N , and J.E. Lloyd. 1978. Description of seedbeds in terms o7shear strength. p. Ill-117. In W. W. Emerson et al. (ed.) Modification of soil structure. John Wiley & Sons, New
17: 185-190.
26:4-6.
IO.
11.
12.
13.
14.
15.
16.
17.
18.
19.
20.
21.
22.
23.
24.
York. Davey, B.G. 1978. Soil structure as revealed by scanning elec- tron microscopy. p. 97-102. In W.W. Emerson et al. (ed.) Mod- ification of soil structure. John Wiley & Sons, New York. Davis, P.F., A.R. Dextter, and D.W. Tanner. 1973. Isotropic compression of hypothetical and synthetic tilths. J. Terra- mechanics 10(4):21-34. Dexter, A.R. 1975. Uniaxial compression of ideal brittle tilths. J. Terramechanics l2(1):3-14. Dexter, A.R., agd D.W. Tanner. 1974. Time dependence of compressibility for remolded and undisturbed soils. J. Soil Sci.
Farrell, D.A.. a d E.L. Graecen. 1966. Resistance to penetration of fine metal probes in compressible soil. Aust. J. Soil. Res. 4:l- 17. Hams, R.F., G. Chesters, and O.N. Allen. 1966. Dynamics of soil aggregation. Adv. Agron. 18:107-169. Kemper, W.D. 1965. Aggregate stability. In C.A. Black et al. (ed.) Methods of soil analysis, part I. Physical and mineralogical properties, including statistics of measurements and sampling Agronomy 9:5 1 1-5 19. Am. SOC. of Agron., Madison. Wl. Kemper, W.D., and W.S. Chepil. 1965. Size distribution of ag- gregates. In C.A. Black et al. (ed.) Methods of soil analysis, part I. Physical and mineralogical properties, including statistics of measurements and sampling. Agronomy 9:499-5 10. Am. SOC. of Agron., Madison. W I . Klutc, A. 1965. Laboratory measurement of hydraulic conduc- tivity of saturated soil. In C.A. Black et al. (ed.) Methods of soil analysis, part I. physical and mineralogical properties, in- cluding statistics of measurements and sampling. Agronomy 9:210-221. Am. SOC. of Agron, Madison, WI. Larson, W.E., S.C. Gupta, and R. A. IJseche. 1980. Compres- sion of agricultural soils from eight soil orders. Soil Sci. SOC. Am. J. 44:450-457. Malic. M.N., D.S. Stuvenson, and G.C. Russell. 1965. Water- stable aggregation in relation to various cropping rotations and soil constituents. Can. J. Soil Sci. 45: 189-1 97. Olmstead, L.B. 1947. The effect of longtime cropping systcms and tillage practices upon soil aggregation at Hays, Ks. Soil Sci. Soc. Am. Proc. 11:89-92. Quirk, J.P. 1978. Some physio-chemical aspects of soil struc- tural stability-a review. p. 3-1 6. In W.W. Emerson, R.D. Bond. and A.R. Cexter (ed.) Modification of soil structure. John Wiley & Sons. New York.
25: 1 53- 164.
Russel,' M.B. 1949. Methods of measuring soil structure and aeration. Soil Sci. 68:25-36. Skidmore, E.L., W.A. Carstenson, and E.E. Banbury. 1975. Soil changes resulting from cropping. Soil Sci. SOC. Am. Proc. 39:964- OA7 , " I .
25. Skidmore, E.L., and D.H. Powers. 1982. Dry soil-aggregate sta- bility: energy-based index. Soil Sci. SOC. Am. J. 46:1274-1279.
26. Soil Science Society of Amenca. 1978. Glossary o f soil science terms. Soil Sci. SOC. Am., Madison, U'I.
27. Soil Survey Staff. 1975. Soil taxonomy: a basic system of soil and classification for making and interpreting soil surveys. A Handb. no. 436. USDA. U.S. Government Printing OK:; Washington. D.C. p. 753.
28. Voorhees, W.B. 1979. Soil tilth deterioration under row crop- ping in the Northern Corn Belt: influence of tillage and wheel traffic. J. Soil Water Conserv. 34 184.
29. Williams, R.J.B. 1963. The effects of cropping systems on soil stability Rothamsted Exp. Stn. Rep. p. 45-46.