shipping sector - theme report - 060109
TRANSCRIPT

8/8/2019 Shipping Sector - Theme Report - 060109
http://slidepdf.com/reader/full/shipping-sector-theme-report-060109 1/20
6 January 2009

8/8/2019 Shipping Sector - Theme Report - 060109
http://slidepdf.com/reader/full/shipping-sector-theme-report-060109 2/20
Water transport remains the backbone of the global economy and moves 90% of international trade cargo. The recent decline in freight rates (Baltic Dry Bulk Index dropped by 94% since May 2008) and asset prices is expected to significantly impact the earnings and valuation of shipping companies. The downward shift
in freight curve due to all time high order book and declining trade is expected to impact profitability going ahead. We believe the next two years will be challenging for ship owners particularly for the leveraged players. We expect supply to adjust with the demand with increased scrapping and order cancellation. The fall inasset prices is also expected to erode net asset value of these companies leaving no value for older ships.
The sharp fall in freight has already impacted the Indian shipping stocks. The stock prices of leading players in dry bulk segment like GE Shipping and Mercator Lines have fallen by 60% and 80% respectively from their 52 week high. The Indian companies keep significant portion of fleet (50% to 80%) on long termcontracts varying from six months to five year which is expected to provide stability from short term. However recent sharp decline in BDI increases the risk of downward revision or default on existing long term contracts.
We have revised our freight estimated downwards considering the demand supply scenario over next two years. We have assumed the freight rates to remain weak over next two years at average levels of 2001 to 2003. We believe the Net Asset Based (NAV) valuation will act as better support in uncertain and volatile freight market scenario.
We expect Varun shipping to outperform considering no exposure to dry bulk segment and recent expansion into offshore support services. Varun is also expected to benefit from being largest player in (~80% share) domestic LPG market where freight rates are less volatile and market is supply driven. The diversified revenue streams and expansion in offshore is expected to help The Great Eastern Shipping
from further downside. The Mercator line with high leverage and significant exposure to dry bulk sector (Singapore subsidiary is pure play on dry bulk) along withrecent vessel acquisition at peak asset price may find next two years challenging.
Stock RatingsStock RatingsStock RatingsStock RatingsStock Ratings
Company Company Company Company Company CMP (Rs)CMP (Rs)CMP (Rs)CMP (Rs)CMP (Rs) TTTTTarararararget (Rs)get (Rs)get (Rs)get (Rs)get (Rs) RatingsRatingsRatingsRatingsRatings
GE Shipping 234 210 Underperformer
Varun Shipping 47 58 Outperformer
Mercator Lines 39 23 Underperformer
Overview Overview Overview Overview Overview
• Dry bulk index fell by 94% ................................................................................ 3
• Led by demand slowdown ................................................................................ 4
• Ships are running on marginal costing ............................................................ 6
• Supply overhang - big concern ......................................................................... 7
• Shift in freight curve ........................................................................................... 8
• Supply side to adjust .......................................................................................... 9
• Downward revision in earnings and NAV .................................................... 10
3

8/8/2019 Shipping Sector - Theme Report - 060109
http://slidepdf.com/reader/full/shipping-sector-theme-report-060109 3/20
3
BDI drBDI drBDI drBDI drBDI dropped bopped bopped bopped bopped b y 94% since Ma y 94% since Ma y 94% since Ma y 94% since Ma y 94% since Ma y 2008 leading to liquidity damage y 2008 leading to liquidity damage y 2008 leading to liquidity damage y 2008 leading to liquidity damage y 2008 leading to liquidity damage
The recent slowdown in global trade has significantly impacted seabornetrade. Baltic Dry Bulk Index, (BDI) which is measure of the shipping costfor dry bulk commodity on major shipping routes and for different size of vessels has declined by 94% (see exhibit 1) after reaching an all-timehigh of 11,793 points on May 20, 2008.
BDI index covers Capesize (vessel size of greater than 80,000 dwt) Panamax(60,000 to 80000 dwt), Supramax (50,000 to 60,000 dwt) and Handysize(30,000 dwt to 50,000 dwt) carriers carrying a range of commodities,including coal, iron ore and grain. The index is composite of the BalticCapesize, Panamax, Supramax and Handysize indices based on dry bulkshipping routes measured on a time charter and voyage basis.
The current level of index shows the dry up of global commodity trade
and the freight earnings has been significantly impacted with severecorrection (see Exhibit 2). Historically, the index had moved in range of 1,000 to 2,000 from 2001 to 2003 and had shifted to higher level of 2,000to 6,000 from 2003 to 2006. The index had strong run up since December2006 and touched high of 11,771 in May 2008. The current level ~ 800 islower by 60% from seven year average level of 4,038. The earrings fordifferent type of ships in dry bulk segment have fallen by 90% to 95% YoY as shown in exhibit 2.
Exhibit 2:Exhibit 2:Exhibit 2:Exhibit 2:Exhibit 2: TTTTTime charter yield (TCE) in spot carime charter yield (TCE) in spot carime charter yield (TCE) in spot carime charter yield (TCE) in spot carime charter yield (TCE) in spot cargogogogogo
V V V V V esselesselesselesselesselTTTTT ype ype ype ype ype CurrentCurrentCurrentCurrentCurrent Y Y Y Y Y ear agoear agoear agoear agoear ago % change% change% change% change% change
Capesize 10,478 168,530 (93.78)
Panamax 3,860 74,255 (94.80)
Supramax 5,032 62,966 (92.01)
Source: KSBL Research
Exhibit 1: BDI movement since 2008Exhibit 1: BDI movement since 2008Exhibit 1: BDI movement since 2008Exhibit 1: BDI movement since 2008Exhibit 1: BDI movement since 2008
Source: Bloomberg
BDIY INDEX
0
2000
4000
6000
8000
10000
12000
14000
Jan-00 Jan-02 Jan-04 Jan-06 Jan-08

8/8/2019 Shipping Sector - Theme Report - 060109
http://slidepdf.com/reader/full/shipping-sector-theme-report-060109 4/20
4
TTTTTanker still a better marketanker still a better marketanker still a better marketanker still a better marketanker still a better market
The freight rate decline in tanker segment is relatively lower as comparedto decline in dry bulk segment. The fall in Very Large Crude Carrier (VLCC)and Suezmax is ~57% and ~37% respectively as compared to 94% fall indry index since May 2008. (See exhibit 3) The charter rates in tanker areable to cover total cost of voyage giving some relief to the shippers. Again, with starting of winter season, the seasonal demand improvement isexpected to provide some relief to the diversified shipping payers.
FFFFFall w all w all w all w all w as led bas led bas led bas led bas led b y demand slowdown y demand slowdown y demand slowdown y demand slowdown y demand slowdown
Ore and coal accounts for 52% of dry bulk trade and Panamax andCapesize are mainly used to carry iron ore and coal while Panamax shipsalso carry grains. The relatively smaller size ships viz. Supramax,Handymax and Handysize are used for grains and sub products. These vessels are not suitable for the coal and iron ore and due to onboardequipments to load and discharge cargo which can lead to congestion atthe port.
Exhibit 4: Classification of dry bulk vesselsExhibit 4: Classification of dry bulk vesselsExhibit 4: Classification of dry bulk vesselsExhibit 4: Classification of dry bulk vesselsExhibit 4: Classification of dry bulk vessels
V V V V V esselesselesselesselessel Capacity (dwt)Capacity (dwt)Capacity (dwt)Capacity (dwt)Capacity (dwt) TTTTT ypical car ypical car ypical car ypical car ypical cargogogogogo
Handymax 10,000-30,000 Grains, sub products
Handy size 30,000-49,999 Grains, sub products
Panamax 50,000-79,999 Minerals, grains and sub products
Capsize 80,000 + Minerals
Source: KSBL Research
Exhibit 3: Relative movement in freight rates for crude and dry bulk segmentExhibit 3: Relative movement in freight rates for crude and dry bulk segmentExhibit 3: Relative movement in freight rates for crude and dry bulk segmentExhibit 3: Relative movement in freight rates for crude and dry bulk segmentExhibit 3: Relative movement in freight rates for crude and dry bulk segment
Source: KSBL Research
Freight rates in tanker segment has outperformed
since May2008
0
20
40
60
80
100
120
May-08 Jun-08 Jul-08 Aug-08 Sep-08 Oct-08 Nov-08 Dec-08
VLCC Suezmax Drybulk index

8/8/2019 Shipping Sector - Theme Report - 060109
http://slidepdf.com/reader/full/shipping-sector-theme-report-060109 5/20
5
The decline in shipment from Australia and Brazil due to slowdown incomodity consumption adversly freight rates for large vessels. The capesize segment has taken hardest heat by a low physical demand for bothcoal and iron ore while penamax segment is somewhat stronger which
can be used for grain transport. Again, the inventory built up both in raw material and finished goods resulted in sharp decline in demand forshipping capacity resulting in drop in freight rates.
The Slowdown and falling commodity prices initiated the fallThe Slowdown and falling commodity prices initiated the fallThe Slowdown and falling commodity prices initiated the fallThe Slowdown and falling commodity prices initiated the fallThe Slowdown and falling commodity prices initiated the fall
The demand for dry bulk shipping is mainly driven by three goods: ironore, coal (both used in steel production) and grain. The increase in Chinesesteel production derived the demand for iron ore and coal andsubsequently export demand for steel. The resurgence of Chinese demandand severe post congestion (mainly at Australian ports a major raw material
exporter), lead to a substantial run up in freights since 2004. However,steel which was major driver for incremental shipping demand hasdeclined by 49% in value since peak of August 2008. (Reference: ChinaHR prices). Benchmark Australian coal prices have declined to $80 pertone from peak of $201 per tone in July 2008. With decline in commodity prices, the manufacturers started to use raw material inventories built upearlier rather than importing new stocks. The companies also reducedthe parcel size significantly in declining prices to minimize the inventory losses leading lower cargo movements and further fall in commodity prices.
Iron Ore
26%
Steam Coal
18%
Coking Coal
8%
Grain
9%
Other Minor
Bulk
39%
Exhibit 5: Dry Bulk seaborne trade 2007Exhibit 5: Dry Bulk seaborne trade 2007Exhibit 5: Dry Bulk seaborne trade 2007Exhibit 5: Dry Bulk seaborne trade 2007Exhibit 5: Dry Bulk seaborne trade 2007
Source: Drewry
Exhibit 6: Steel price trendExhibit 6: Steel price trendExhibit 6: Steel price trendExhibit 6: Steel price trendExhibit 6: Steel price trend
Source: Bloomberg
HR Prices (USD Per Ton)
400
500
600
700
800
900
1000
1100
1200
Jan-07 May-07 Sep-07 Jan-08 May-08 Sep-08
Steel prices dropped by ~49% since August 2008.
Importers reduced parcel size
Steel along with its raw material remains major driver
for freight rates in dry bulk segment

8/8/2019 Shipping Sector - Theme Report - 060109
http://slidepdf.com/reader/full/shipping-sector-theme-report-060109 6/20
6
Lack of credit availability further accelerated and dampened theLack of credit availability further accelerated and dampened theLack of credit availability further accelerated and dampened theLack of credit availability further accelerated and dampened theLack of credit availability further accelerated and dampened theprospectsprospectsprospectsprospectsprospects
The global trade is significantly influenced by availability of credit andsecures instruments for payment because of time gap between cargodelivery by the seller and cargo receipt by the purchaser. It takes around15 to 45 days to complete one voyage and parcel size typically rangesfrom 10,000 tons to 300,000 tones. The shipping industry relies heavily on Letters of Credit (LC), which is a guarantee issued by a bank that thebuyers' funds will be transferred to the seller at the completion of thetransaction (i.e. traded goods properly received). The tightening liquidity around the world impacted issuance of LCs further slowing global tradeas number of issuers to postponed or cut back their expansion plans asthey tried to maintain adequate liquidity and financial flexibility.
Dry bulk running on marginal costing Dry bulk running on marginal costing Dry bulk running on marginal costing Dry bulk running on marginal costing Dry bulk running on marginal costing
The shipping companies are expected to be adversely affected if the indexremains at ~1,000. At the current BDI level of ~800, the earnings in spotmarket have significantly deteriorated as shown in exhibit 7 and exhibit8. The freight rates are below their break even points and difficult tosecure time charter to cover their operating cost. The time charter earningsfrom Cape Size vessels have declined from USD 168,530 per day to USD10,478 per day over one year period. As ships are operating on marginalpricing and some have already fixed at zero charter rates leaving no gainto ship-owners.
Exhibit 7: Freight rate movement over one year (Dry bulk)Exhibit 7: Freight rate movement over one year (Dry bulk)Exhibit 7: Freight rate movement over one year (Dry bulk)Exhibit 7: Freight rate movement over one year (Dry bulk)Exhibit 7: Freight rate movement over one year (Dry bulk)
$ / Day $ / Day $ / Day $ / Day $ / Day CurrentCurrentCurrentCurrentCurrent Y Y Y Y Y earearearearear Ago Ago Ago Ago Ago % change% change% change% change% change
Capesize 10,478 168,530 (93.78)Panamax 3,860 74,255 (94.80)
Supramax 5,032 62,966 (92.01)
Source: KSBL Research
Shipping companies reduce the peak speed of ships to reduce oilconsumption and contract supply to counter short term slowdown indemand. However, the severe fall in freight rates have left the shipping companies with marginal profits and companies are focusing on
Exhibit 8:Exhibit 8:Exhibit 8:Exhibit 8:Exhibit 8: W W W W W eekly tripcharter reekly tripcharter reekly tripcharter reekly tripcharter reekly tripcharter rates for bulk carriers in $1000/daates for bulk carriers in $1000/daates for bulk carriers in $1000/daates for bulk carriers in $1000/daates for bulk carriers in $1000/da y y y y y
Source: Dryship
0
50
100
150
200
01.2008 03.2008 05.2008 07.2008 09.2008 12.2008
CAPESIZE
PANAMAX
SUPRAMAX
HANDYSIZE
8/8/2019 Shipping Sector - Theme Report - 060109
http://slidepdf.com/reader/full/shipping-sector-theme-report-060109 7/20
7
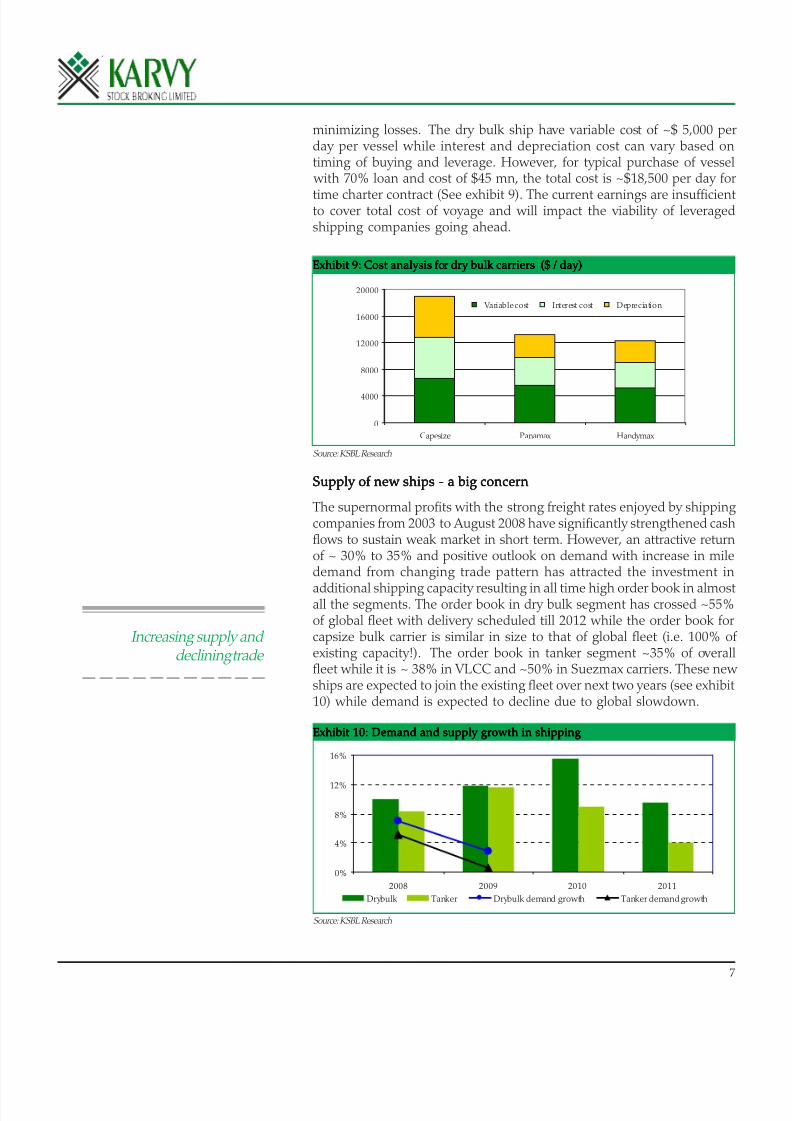
minimizing losses. The dry bulk ship have variable cost of ~$ 5,000 perday per vessel while interest and depreciation cost can vary based ontiming of buying and leverage. However, for typical purchase of vessel with 70% loan and cost of $45 mn, the total cost is ~$18,500 per day for
time charter contract (See exhibit 9). The current earnings are insufficientto cover total cost of voyage and will impact the viability of leveragedshipping companies going ahead.
Supply of new ships - a big concernSupply of new ships - a big concernSupply of new ships - a big concernSupply of new ships - a big concernSupply of new ships - a big concern
The supernormal profits with the strong freight rates enjoyed by shipping companies from 2003 to August 2008 have significantly strengthened cashflows to sustain weak market in short term. However, an attractive returnof ~ 30% to 35% and positive outlook on demand with increase in miledemand from changing trade pattern has attracted the investment in
additional shipping capacity resulting in all time high order book in almostall the segments. The order book in dry bulk segment has crossed ~55%of global fleet with delivery scheduled till 2012 while the order book forcapsize bulk carrier is similar in size to that of global fleet (i.e. 100% of existing capacity!). The order book in tanker segment ~35% of overallfleet while it is ~ 38% in VLCC and ~50% in Suezmax carriers. These new ships are expected to join the existing fleet over next two years (see exhibit10) while demand is expected to decline due to global slowdown.
Exhibit 9: Cost analysis for dry bulk carriers ($ / day)Exhibit 9: Cost analysis for dry bulk carriers ($ / day)Exhibit 9: Cost analysis for dry bulk carriers ($ / day)Exhibit 9: Cost analysis for dry bulk carriers ($ / day)Exhibit 9: Cost analysis for dry bulk carriers ($ / day)
Source: KSBL Research
0
4000
8000
12000
16000
20000
Capesize Panamax Handymax
Variable cost Interest cost Depreciation
Exhibit 10: Demand and supply growth in shipping Exhibit 10: Demand and supply growth in shipping Exhibit 10: Demand and supply growth in shipping Exhibit 10: Demand and supply growth in shipping Exhibit 10: Demand and supply growth in shipping
Source: KSBL Research
0%
4%
8%
12%
16%
2008 2009 2010 2011
Drybulk Tanker Drybulk demand growth Tanker demand growth
Increasing supply and declining trade

8/8/2019 Shipping Sector - Theme Report - 060109
http://slidepdf.com/reader/full/shipping-sector-theme-report-060109 8/20
8
The supply in tanker is expected to increase by 8.2% in 2008 and by 11.5% in 2009. However, the demand growth for tanker tonnage is expectedto decline significantly from 5.1% in 2008 to flat to negative in 2009. Thesupply in dry bulk is expected to increase by 11.8% in 2009 and by 15.4%
in 2010 with tonnage demand growth of ~2.8% in 2009. We believe thesupply issue is more critical in dry bulk as unlike tanker segment, dry bulk vessels do not have the mandatory phasing out dates. (Note: As per International Maritime Organization (IMO) single hull tankers will be phased out after life of 25 years or 2010 whichever is earlier) . The new delivery of vessels particularly in 2010 and 2011 (see exhibit 11) is expected to extendthe weak freight rate scenario in dry bulk sector.
Excess supply and falling demand will erode profitability sharply Excess supply and falling demand will erode profitability sharply Excess supply and falling demand will erode profitability sharply Excess supply and falling demand will erode profitability sharply Excess supply and falling demand will erode profitability sharply
The contraction in demand for shipping capacity and increasing supply of
new vessels over next two years is expected to shift the freight rate curvedownwards. The supply of cargo ships is both tight and inelastic-it takesaround two years to build a new ship and ships are too expensive to takeout of circulation. The significant increases in demand can push the indexsharply higher or vice versa. As shown in exhibit 12, an increase in supply of shipping capacity will shift the freight earnings line from S1 to S2. Theshift in demand from D1 to D2 will lead to sharp fall in freight rates fromF1 to F2 with rates taking support at marginal costing of efficient players. With expected surplus supply, we believe the supply side will adjust withthe demand by increasing scrapping and cancellation of order book.
Exhibit 11: Supply scenario in dry bulk segment (no. of vessels)Exhibit 11: Supply scenario in dry bulk segment (no. of vessels)Exhibit 11: Supply scenario in dry bulk segment (no. of vessels)Exhibit 11: Supply scenario in dry bulk segment (no. of vessels)Exhibit 11: Supply scenario in dry bulk segment (no. of vessels)
Source: KSBL Research
0
200
400
600
800
1000
1200
1400
2008 2009 2010 2011 2012 2013+
VL OC Capesize Smal l cap P anamax Supramax Handysize
Exhibit 12: Demand supply dynamics in shipping Exhibit 12: Demand supply dynamics in shipping Exhibit 12: Demand supply dynamics in shipping Exhibit 12: Demand supply dynamics in shipping Exhibit 12: Demand supply dynamics in shipping
Source: KSBL Research
0
20000
40000
60000
80000
100000
120000
140000increasing supply and declinging
demand will lead to sharp drop in
earnigs
F2
D1
S1
S2
F1
D2Oversupply to shift freight rates downwards

8/8/2019 Shipping Sector - Theme Report - 060109
http://slidepdf.com/reader/full/shipping-sector-theme-report-060109 9/20
9
Supply side to adjust with scrapping and order book cancellationSupply side to adjust with scrapping and order book cancellationSupply side to adjust with scrapping and order book cancellationSupply side to adjust with scrapping and order book cancellationSupply side to adjust with scrapping and order book cancellation
With lower freight rates and increase in new vessel supply, the old shipsare expected to be scrapped due to their higher cost for maintenance andfor mandatory special surveys. In tanker segment single hull and vesselsover 25years need to go for mandatory scrapping by 2010 as per IMOregulation. The tighter credit market will also cancel speculative orders.In case of BDI below 1,000 on sustained basis, we expect ships evenbelow 15 years to be scrapped.
Encouraging FFA marketEncouraging FFA marketEncouraging FFA marketEncouraging FFA marketEncouraging FFA market
In dry bulk segment the freight future market is quite active and shipowners can sell their capacity (go long) and cargo owner can lock freightrates in future market. Forward Freight Agreements (FFA) are paperinstruments (hence no environmental risk) and are a derivative of thephysical shipping market. Contracts are available to buy or sell the priceof freight for a specific cargo route for a defined future period. Thecompanies can trade whole or part of vessel in FFA market for riskmanagement or speculative purpose.
Currently even though the spot market is weak, the future contracts areavailable at significant premium showing positive outlook in freight ratesby market participants. (See exhibit 14)
Exhibit 13: Monthly scrapping in mn dwtExhibit 13: Monthly scrapping in mn dwtExhibit 13: Monthly scrapping in mn dwtExhibit 13: Monthly scrapping in mn dwtExhibit 13: Monthly scrapping in mn dwt
Source: R.S. Platou
Exhibit 14: BDI Futures pricesExhibit 14: BDI Futures pricesExhibit 14: BDI Futures pricesExhibit 14: BDI Futures pricesExhibit 14: BDI Futures prices
BidBidBidBidBid Ask Ask Ask Ask Ask CLOSECLOSECLOSECLOSECLOSE
BDI SPOT 773BDI JAN09 975 1,375 1,275
BDI Q109 1,100 1,500 1,275
BDI Q209 1,375 1,775 1,550
BDI Q309 1,725 2,125 1,900
BDI CAL09 1,500 1,850 1,675
BDI CAL10 1,950 2,350 2,125
as on 02.01.09
Strong freight rates since 2004 reduced scrapping of
old vasseles. However trend is expected to reverse
0
0,2
0,4
0,6
0,8
1
1,2
1,4
‘1/98 Jan-99 ‘ 1/00 ‘1/0 1 ‘ 1/02 ‘1/ 03 ‘1/04 ‘1/05 ‘1/0 6
Strong freight rates reducedscrapping of old vasseles
Exhibit 14: BDI Future pricesExhibit 14: BDI Future pricesExhibit 14: BDI Future pricesExhibit 14: BDI Future pricesExhibit 14: BDI Future prices
Source: Irmarex
600
1,600
2,600
BDI SPOT BDI JAN09 BDI Q109 BDI Q209 BDI Q309 BDI CAL09 BDI CAL10
02.01.2009
31-Dec-08
24-Dec-08

8/8/2019 Shipping Sector - Theme Report - 060109
http://slidepdf.com/reader/full/shipping-sector-theme-report-060109 10/20
Downw Downw Downw Downw Downw ararararard rd rd rd rd reeeee vision in earnings and N vision in earnings and N vision in earnings and N vision in earnings and N vision in earnings and N A A A A A V V V V V
The sharp fall in freight has already impacted the shipping stocks.However, in short term the shipping companies may not be significantly affected as most of the Indian companies keep significant portion of fleet(50% to 80%) on long term contracts varying from six months to five year.The term contracts are expected to provide stability from short term variation in freight index. However, if market remained weak, the shipping companies will have significant negative impact with renewal of contractsat much lower rates.
We have revised our freight estimated downwards considering thedemand supply scenario over next two years. We believe the demandsupply adjustment will take 6 months to 1 year and freight rates can bounceback to marginal normal profit levels. We have assumed the freight ratesto remain weak over next two years at average levels of 2001 to 2003 asshown in following table.
Exhibit 15: Freight rate (TCE $/ day) and asset price (mn$) asumptionExhibit 15: Freight rate (TCE $/ day) and asset price (mn$) asumptionExhibit 15: Freight rate (TCE $/ day) and asset price (mn$) asumptionExhibit 15: Freight rate (TCE $/ day) and asset price (mn$) asumptionExhibit 15: Freight rate (TCE $/ day) and asset price (mn$) asumption
We believe the Net Asset Based (NAV) valuation will act as better support
in uncertain and volatile freight market scenario. For NAV based valuation, we have revised the valuation considering current fall in asset prices (Seeexhibit 16) with 94% drop in BDI.
Dry bulkDry bulkDry bulkDry bulkDry bulk TCE $/ day TCE $/ day TCE $/ day TCE $/ day TCE $/ day mn $mn $mn $mn $mn $
Capesize 19,018 37.10
Panamax 11,874 22.45
Handymax 9,420 19.43
Handysize 7,293 15.60
Source: KSBL Research
TTTTTankerankerankerankeranker TCE $/ day TCE $/ day TCE $/ day TCE $/ day TCE $/ day mn $mn $mn $mn $mn $
VLCC 32,565 70.475
Suezmax 25,348 46.625
Aframax 19,508 37.825
Panamax 16,004 33.1
MR product 14,914 28.2
Exhibit 16: Dry bulk carriers second-hand pricesExhibit 16: Dry bulk carriers second-hand pricesExhibit 16: Dry bulk carriers second-hand pricesExhibit 16: Dry bulk carriers second-hand pricesExhibit 16: Dry bulk carriers second-hand prices
Source: Bloomberg
10
180
160
140
120
100
80
60
40
20
$46.0m
$26.0m$25.0m
Current
Value
$M
CAPESIZEPANAMAXSUPRAMAX
(5 year old ships weekly update)

8/8/2019 Shipping Sector - Theme Report - 060109
http://slidepdf.com/reader/full/shipping-sector-theme-report-060109 11/20
S e c
t o r U p d a t e
S e c
t o r U p d a t e
S e c
t o r U p d a t e
S e c
t o r U p d a t e
S e c
t o r U p d a t e
G l o b a l E q u i t y
G l o b a l E q u i t y
G l o b a l E q u i t y
G l o b a l E q u i t y
G l o b a l E q u i t y
R e s e a r c h - I n d i a
R e s e a r c h - I n d i a
R e s e a r c h - I n d i a
R e s e a r c h - I n d i a
R e s e a r c h - I n d i a
The Great Eastern Shipping Co. (Rs234)The Great Eastern Shipping Co. (Rs234)The Great Eastern Shipping Co. (Rs234)The Great Eastern Shipping Co. (Rs234)The Great Eastern Shipping Co. (Rs234) UnderperformUnderperformeUnderperformUnderperformeUnderperformeTarget Price: Rs21Target Price: Rs21Target Price: Rs21Target Price: Rs21Target Price: Rs21
Reuters/Bloomberg Code GESC.BO / GESCI IN Revenues 21,660 31,308 35,707 25,231 33,1
Market Cap (Rs bn) 35.6 Op Profit 10,675 13,856 14,339 9,036 11,7Market Cap (US$ mn) 902.1 Net Profit 7,679 9,689 10,631 2,537 3,6
Shares Outstanding (mn) 152.3 EPS (Rs) 50.5 63.6 69.8 16.7 24
52-week High/Low (Rs) 572 / 138 EPS Growth (%) 29.4 26.1 9.7 (76.1) 45
Operating Margin (%) 49.3 44.3 40.2 35.8 35
Major Shareholders (%) PER (x) 4.6 3.7 3.4 14.0 9
Promoters 29.4 EV/EBITDA (x) 4.2 3.4 2.5 6.8 4
FIIs 22.9 Price/Sales (x) 1.6 1.1 1.0 1.4
Banks/ MFs 11.8 Dividend yield (%) 4.9 6.4 6.0 3.4 2
Others 6.8 RoCE (%) 18.8 18.9 16.5 6.0
Public 29.1 ROE (%) 24.6 22.4 20.5 4.8 6
Source: Company and Karvy Estimates
GE Shipping GE Shipping GE Shipping GE Shipping GE Shipping Y/E March (Rs Mn) Y/E March (Rs Mn) Y/E March (Rs Mn) Y/E March (Rs Mn) Y/E March (Rs Mn) FY2007FY2007FY2007FY2007FY2007 FY2008FY2008FY2008FY2008FY2008 FY2009EFY2009EFY2009EFY2009EFY2009E FY2010EFY2010EFY2010EFY2010EFY2010E FY201FY201FY201FY201FY201
Sector: Shipping Sector: Shipping Sector: Shipping Sector: Shipping Sector: Shipping Vikram Suryavan Vikram Suryavan Vikram Suryavan Vikram Suryavan Vikram [email protected]
Great Eastern Shipping (GE Shipping), India's largest private shipping company is operating in tankeGreat Eastern Shipping (GE Shipping), India's largest private shipping company is operating in tankeGreat Eastern Shipping (GE Shipping), India's largest private shipping company is operating in tankeGreat Eastern Shipping (GE Shipping), India's largest private shipping company is operating in tankeGreat Eastern Shipping (GE Shipping), India's largest private shipping company is operating in tankedrdrdrdrdr y bulk with a fleet of 42 vessels (12 crude + 18 pr y bulk with a fleet of 42 vessels (12 crude + 18 pr y bulk with a fleet of 42 vessels (12 crude + 18 pr y bulk with a fleet of 42 vessels (12 crude + 18 pr y bulk with a fleet of 42 vessels (12 crude + 18 product + 10 droduct + 10 droduct + 10 droduct + 10 droduct + 10 dr y bulk +2 gas). y bulk +2 gas). y bulk +2 gas). y bulk +2 gas). y bulk +2 gas). The expansion in offshoThe expansion in offshoThe expansion in offshoThe expansion in offshoThe expansion in offsho
business thrbusiness thrbusiness thrbusiness thrbusiness through Grough Grough Grough Grough Greatship (India) is expected to preatship (India) is expected to preatship (India) is expected to preatship (India) is expected to preatship (India) is expected to prooooo vide downside support in v vide downside support in v vide downside support in v vide downside support in v vide downside support in v aluation.aluation.aluation.aluation.aluation. W W W W W e beliee beliee beliee beliee belie
strong balance sheet and diversified revenue streams will help the company in possible extended dowstrong balance sheet and diversified revenue streams will help the company in possible extended dowstrong balance sheet and diversified revenue streams will help the company in possible extended dowstrong balance sheet and diversified revenue streams will help the company in possible extended dowstrong balance sheet and diversified revenue streams will help the company in possible extended dow
cycle in shipping.cycle in shipping.cycle in shipping.cycle in shipping.cycle in shipping.
Diversified rDiversified rDiversified rDiversified rDiversified reeeee venue str venue str venue str venue str venue stream:eam:eam:eam:eam: The company's shipping business derives ~40% revenue from crude segment a
product segment each and around 20% from dry bulk segment reducing dependency on any single segment.
operates ships on mix of time charter or voyage charter basis to improve earnings visibility. GE Shipping cove
its operating cost by 1 to 1.5 times by employing vessels on time charter (long term contact) to give earnin
protection.
OffshorOffshorOffshorOffshorOffshore business to support v e business to support v e business to support v e business to support v e business to support v aluations:aluations:aluations:aluations:aluations: The company is expanding offshore fleet under wholly owned subsidiaGreatship (India) Ltd from 4 support vessels in FY08 to 22 support vessels and drilling rig by FY10 with capi
expenditure of USD 667 mn (Rs 26.5 bn). We expect the revenue from offshore activity to grow at a 187% CAG
from Rs 920 mn in FY08 to Rs 7.57 bn by FY10. We expect the re-rating in valuation with increasing contributio
from higher multiple offshore business from 4% in FY08 to ~24.% by FY10.
Committed capital expansion to strain cash flow:Committed capital expansion to strain cash flow:Committed capital expansion to strain cash flow:Committed capital expansion to strain cash flow:Committed capital expansion to strain cash flow: GE shipping has strong order book for 12 new vessels
Product and 8 dry bulks) with delivery starting from FY09 to FY12. The fleet addition is expected to increase t
tonnage by 11.4% from 3.14 mn dwt in FY08 to 3.5 mn dwt in FY12. We expect committed capital expenditure of
23 bn in shipping segment and slim cash flows going ahead will drain the current cash of ~ Rs 17 bn on balan
sheet.
V V V V V aluations:aluations:aluations:aluations:aluations: At current market price of Rs 234, the stock is trading at 3.4xFY09E and 14xFY10E earnings of Rs69and Rs16.7 respectively and 2.5x FY09E and 6.8xFY10E, EV/EBITDA. In view of 87% fall from previous estimat
in FY10 earnings and failure of asset to hold the value with sharp fall in freight rates, we are discontinuin
earnings based valuation methods (of 4x FY10 earnings )and using only asset based valuation method. We ha
revised our NAV valuation from Rs 610 to Rs 306 per share, however considering down cycle valuation, w
have lowered the discount to NAV from 50% form peak valuation to 30 % with target price of Rs. 210 (previou
Rs 305)
8/8/2019 Shipping Sector - Theme Report - 060109
http://slidepdf.com/reader/full/shipping-sector-theme-report-060109 12/20
1212
Downward revision in earningsDownward revision in earningsDownward revision in earningsDownward revision in earningsDownward revision in earnings
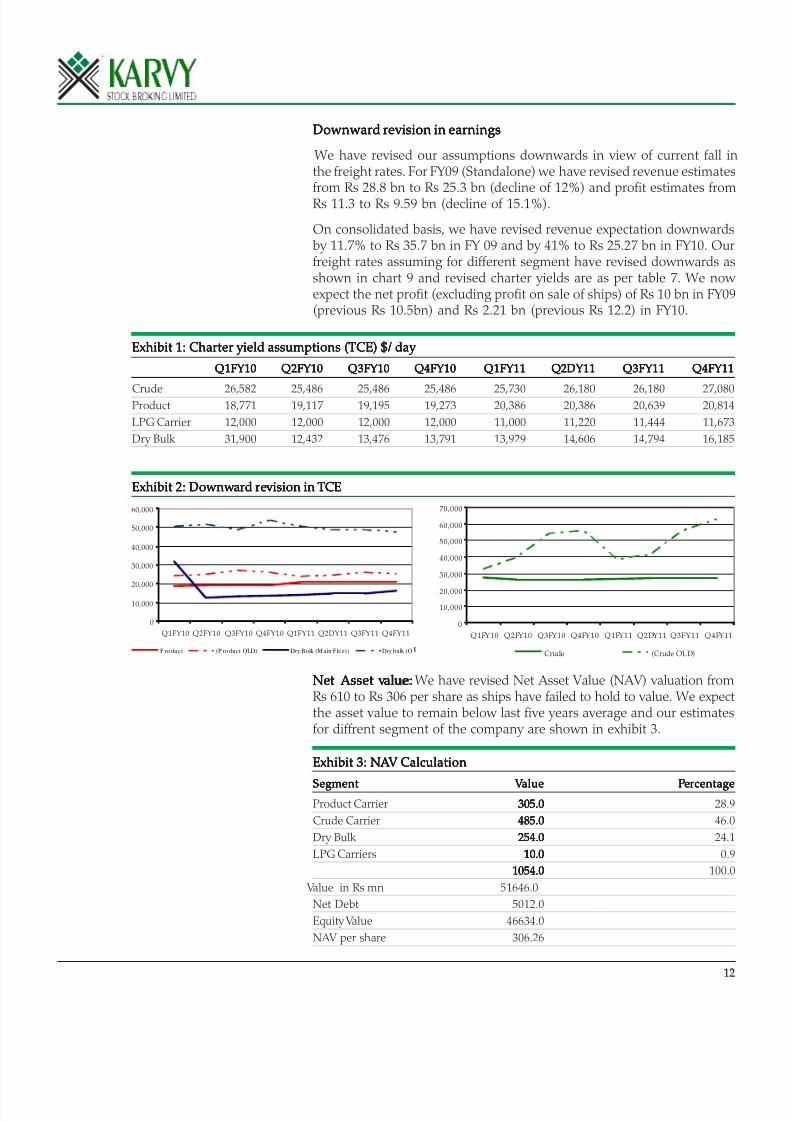
We have revised our assumptions downwards in view of current fall inthe freight rates. For FY09 (Standalone) we have revised revenue estimatesfrom Rs 28.8 bn to Rs 25.3 bn (decline of 12%) and profit estimates fromRs 11.3 to Rs 9.59 bn (decline of 15.1%).
On consolidated basis, we have revised revenue expectation downwardsby 11.7% to Rs 35.7 bn in FY 09 and by 41% to Rs 25.27 bn in FY10. Ourfreight rates assuming for different segment have revised downwards asshown in chart 9 and revised charter yields are as per table 7. We now expect the net profit (excluding profit on sale of ships) of Rs 10 bn in FY09(previous Rs 10.5bn) and Rs 2.21 bn (previous Rs 12.2) in FY10.
NetNetNetNetNet Asset v Asset v Asset v Asset v Asset v alue:alue:alue:alue:alue: We have revised Net Asset Value (NAV) valuation fromRs 610 to Rs 306 per share as ships have failed to hold to value. We expectthe asset value to remain below last five years average and our estimatesfor diffrent segment of the company are shown in exhibit 3.
Exhibit 3: NExhibit 3: NExhibit 3: NExhibit 3: NExhibit 3: N A A A A A V Calculation V Calculation V Calculation V Calculation V Calculation
SegmentSegmentSegmentSegmentSegment V V V V V aluealuealuealuealue PPPPPererererercentagecentagecentagecentagecentageProduct Carrier 305.0305.0305.0305.0305.0 28.9
Crude Carrier 485.0485.0485.0485.0485.0 46.0
Dry Bulk 254.0254.0254.0254.0254.0 24.1
LPG Carriers 10.010.010.010.010.0 0.9
1054.01054.01054.01054.01054.0 100.0
Value in Rs mn 51646.0
Net Debt 5012.0
Equity Value 46634.0
NAV per share 306.26
Exhibit 1: Charter yield assumptions (TCE) $/ day Exhibit 1: Charter yield assumptions (TCE) $/ day Exhibit 1: Charter yield assumptions (TCE) $/ day Exhibit 1: Charter yield assumptions (TCE) $/ day Exhibit 1: Charter yield assumptions (TCE) $/ day
Q1FY10Q1FY10Q1FY10Q1FY10Q1FY10 Q2FY10Q2FY10Q2FY10Q2FY10Q2FY10 Q3FY10Q3FY10Q3FY10Q3FY10Q3FY10 Q4FY10Q4FY10Q4FY10Q4FY10Q4FY10 Q1FY11Q1FY11Q1FY11Q1FY11Q1FY11 Q2DQ2DQ2DQ2DQ2D Y11 Y11 Y11 Y11 Y11 Q3FY11Q3FY11Q3FY11Q3FY11Q3FY11 Q4FY11Q4FY11Q4FY11Q4FY11Q4FY11
Crude 26,582 25,486 25,486 25,486 25,730 26,180 26,180 27,080Product 18,771 19,117 19,195 19,273 20,386 20,386 20,639 20,814
LPG Carrier 12,000 12,000 12,000 12,000 11,000 11,220 11,444 11,673
Dry Bulk 31,900 12,432 13,476 13,791 13,929 14,606 14,794 16,185
Exhibit 2: Downw Exhibit 2: Downw Exhibit 2: Downw Exhibit 2: Downw Exhibit 2: Downw ararararard rd rd rd rd reeeee vision in vision in vision in vision in vision in TCETCETCETCETCE
0
10,000
20,000
30,000
40,000
50,000
60,000
Q1FY10 Q2FY10 Q3FY10 Q4FY10 Q1FY11 Q2DY11 Q3FY11 Q4FY11
P ro duc t (P ro duct OLD) Dry Bulk (M ain Flee t) Dry bulk (O
0
10,000
20,000
30,000
40,000
50,000
60,000
70,000
Q1FY10 Q2FY10 Q3FY10 Q4FY10 Q1FY11 Q2DY11 Q3FY11 Q4FY11
Crude (Crude OLD)

8/8/2019 Shipping Sector - Theme Report - 060109
http://slidepdf.com/reader/full/shipping-sector-theme-report-060109 13/20
Balance sheetBalance sheetBalance sheetBalance sheetBalance sheet
(Rsmn)(Rsmn)(Rsmn)(Rsmn)(Rsmn) FY2007FY2007FY2007FY2007FY2007 FY2008EFY2008EFY2008EFY2008EFY2008E FY2009EFY2009EFY2009EFY2009EFY2009E FY2010EFY2010EFY2010EFY2010EFY2010E FY2011EFY2011EFY2011EFY2011EFY2011E
Equity capital 1,522.7 1,522.7 1,522.7 1,522.7 1,522.7
Reserves & surplus 29,737.2 41,793.7 50,457.9 51,594.0 54,221.5
Shareholders funds 31,259.9 43,316.4 51,980.6 53,116.7 55,744.2
Long term loans 22,537.9 27,469.3 29,882.9 36,212.6 35,897.0
Shore term loans 0.0 0.0 0.0 0.0 0.0
Total loans 22,537.9 27,469.3 29,882.9 36,212.6 35,897.0
Deferred tax liability 0.0 0.0 0.0 0.0 0.0
Capital Employed 53,797.8 70,785.7 81,863.4 89,329.3 91,641.2
Gross block 54,505.4 65,896.8 71,761.3 101,386.6 107,860.6
Depreciation 17,299.4 17,470.0 21,072.4 26,445.9 32,809.7
Net block 37,206.0 48,426.8 50,688.9 74,940.6 75,050.9
Capital WIP 3,181.0 8,378.3 586.5 2,962.5 647.4
Investments 1,594.7 3,174.5 12,850.0 4,385.0 6,000.0
Inventory 370.1 611.7 704.3 566.8 835.2
Sundry debtors 1,766.1 1,497.3 3,521.7 2,557.6 3,449.6
Cash & bank 11,734.6 12,232.7 16,687.6 6,204.0 8,109.8
Loans & advances 1,126.7 1,075.8 2,142.4 1,513.8 1,988.0
Other assets 326.9 247.0 571.3 454.2 563.3
Current Assets 15,324.4 15,664.5 23,627.4 11,296.5 14,945.8
Sundry Creditors 1,453.0 2,498.6 3,032.6 2,212.0 2,995.7
Other liabilities 1,004.1 747.6 1,336.0 1,027.7 1,145.0
Provision for dividend 801.4 1,336.2 1,225.8 700.4 525.3
Other provisions 249.8 276.1 295.0 315.2 336.9
Current Liabilities 3,508.3 4,858.4 5,889.3 4,255.3 5,002.9
Net current assets 11,816.1 10,806.1 17,738.1 7,041.1 9,942.9
Deffered Tax Assets 0.0 0.0 0.0 0.0 0.0
Capital Deployed 53,797.8 70,785.7 81,863.4 89,329.3 91,641.2
Profit & loss statementProfit & loss statementProfit & loss statementProfit & loss statementProfit & loss statement
(Rs mn)(Rs mn)(Rs mn)(Rs mn)(Rs mn) FY2007FY2007FY2007FY2007FY2007 FY2008EFY2008EFY2008EFY2008EFY2008E FY2009EFY2009EFY2009EFY2009EFY2009E FY2010EFY2010EFY2010EFY2010EFY2010E FY2011EFY2011EFY2011EFY2011EFY2011E
Net revenues 21,659.5 31,308.3 35,706.5 25,230.6 33,133.8
% Growth 6.4 44.5 14.0 (29.3) 31.3
Direct Operating Exp. 4,008.0 5,504.2 6,302.3 5,672.1 7,657.3
Charter hire exp. 2,380.9 5,923.3 8,845.1 4,332.6 6,085.0
Other Operating Exp. 1,414.0 1,776.3 1,865.1 1,902.4 2,359.0
Increase/Decrease in Stock in Trade 0.0 0.0 0.0 0.0 0.0
Staff Cost 1,843.3 2,464.9 2,625.1 2,730.1 3,549.2
Repairs & Maintenance Fleet & Rigs 1,338.5 1,783.7 1,730.2 1,557.2 1,744.0
Total Expenditure 10,984.7 17,452.4 21,367.8 16,194.4 21,394.5
EBIDTA 10,674.8 13,855.9 14,338.7 9,036.3 11,739.3
% Growth 14.1 29.8 3.5 (37.0) 29.9
EBIDTA margin (%) 49.3 44.3 40.2 35.8 35.4
Other income 1,126.8 1,474.2 1,838.0 1,487.8 1,184.0
Interest 1,110.0 1,616.3 1,670.7 2,217.6 2,232.4
Depreciation 2,683.6 3,550.8 3,602.4 5,373.5 6,363.8
Pre-tax profits 8,008.0 10,163.0 10,903.6 2,932.9 4,327.2
% Growth 27.5 26.9 7.3 (73.1) 47.5
Provision for tax 325.4 473.6 272.6 395.9 649.1
Effective tax rate 4.1% 4.7% 2.5% 13.5% 15.0%
Adjusted Net Profit 7,682.6 9,689.4 10,631.0 2,537.0 3,678.1
% Growth 29.4 26.1 9.7 (76.1) 45.0
Share in profit / loss of Associate (2.5) 0.0 0.0 0.0 0.0
Minority Interest (1.0) 0.0 0.0 0.0 0.0
Consolidated Profits form ordianry activity 7,679.1 9,689.4 10,631.0 2,537.0 3,678.1
Net Margin (%) 35.5% 30.9% 29.8% 10.1% 11.1%
Profit on sale of assets & Misc inc 1390.9 2894.2 2539.2 0.0 0.0
Extra-Ordinary Inc/(Exp) 54.2 (1,953.1) 1,827.8 0.0 0.0
Reported Net Profit 9,124.2 10,630.5 14,998.0 2,537.0 3,678.1
% Growth 7.1 16.5 41.1 (83.1) 45.0
EPS (Rs) 50.5 63.6 69.8 16.7 24.2
% Growth 29.4 26.1 9.7 (76.1) 45.0
DPS (Rs) 11.5 15.0 14.0 8.0 6.0
Dividend payout (%) 19.2% 15.7% 16.2% 48.0% 24.8%
RatiosRatiosRatiosRatiosRatios
Rs mnRs mnRs mnRs mnRs mn FY2007FY2007FY2007FY2007FY2007 FY2008EFY2008EFY2008EFY2008EFY2008E FY2009EFY2009EFY2009EFY2009EFY2009E FY2010EFY2010EFY2010EFY2010EFY2010E FY2011EFY2011EFY2011EFY2011EFY2011E
ROCE (%) 18.8 18.9 16.5 6.0 7.2
ROE (%) 24.6 22.4 20.5 4.8 6.6
Debt/Equity (x) 0.7 0.6 0.6 0.7 0.6
Interest Cover (x) 7.2 6.4 6.4 1.7 2.4
Cost StructureCost StructureCost StructureCost StructureCost Structure
Direct Operating Exp.(%) 18.50 17.58 17.65 22.48 23.11
Charter hire exp.(%) 10.99 18.92 24.77 17.17 18.36
Other Operating Exp.(%) 6.53 5.67 5.22 7.54 7.12
Staff Cost(%) 8.51 7.87 7.35 10.82 10.71
Repairs & Maintenance Fleet & Rigs(%) 6.18 5.70 4.85 6.17 5.26
Total assets turnover ratio (x) 0.54 0.55 0.70 0.32 0.44
Avg. collection period (Days) 29.8 17.5 36.0 37.0 38.0
Avg. payment period (Days) 24.5 29.1 31.0 32.0 33.0
Cash & bank/share (Rs) 87.5 101.2 194.0 69.5 92.7
Cash flow Cash flow Cash flow Cash flow Cash flow
(Rs mn)(Rs mn)(Rs mn)(Rs mn)(Rs mn) FY2007FY2007FY2007FY2007FY2007 FY2008FY2008FY2008FY2008FY2008 FY2009EFY2009EFY2009EFY2009EFY2009E FY2010EFY2010EFY2010EFY2010EFY2010E FY2011EFY2011EFY2011EFY2011EFY2011E
EBIT 7,991.2 10,305.1 10,736.3 3,662.8 5,375.6
(Inc)/Dec in working capital (2,121.5) 849.1 (2,055.6) 608.1 (725.5)
Cash flow from operations 5,869.7 11,154.2 8,680.7 4,270.9 4,650.0
Other income 1,126.8 1,474.2 1,838.0 1,487.8 1,184.0
Extra-ordinary income 1,445.1 941.1 711.4 0.0 0.0
Depreciation 2,683.6 3,550.8 3,602.4 5,373.5 6,363.8
Interest paid (1,110.0) (1,616.3) (1,670.7) (2,217.6) (2,232.4)
Dividends paid (1,751.1) (1,749.4) (2,242.2) (1,743.5) (1,088.7)
Tax paid (591.4) (861.8) (607.3) (595.9) (805.9)
Net cash from operations 7,672.7 12,892.8 10,312.4 6,575.1 8,070.8
Capital expenditure (13,135.5) (16,588.7) 1,927.4 (32,001.3) (4,158.9)
Free Cash Flow (5,462.8) (3,695.9) 12,239.7 (25,426.2) 3,912.0
Inc/(Dec) in long term 3,847.1 4,931.4 2,413.6 6,329.7 (315.6)
Inc/(Dec) in short term (75.4) 0.0 0.0 0.0 0.0
(Inc)/Dec in investments 79.6 (1,579.8) (9,675.5) 8,465.0 (1,615.0)
Inc/(Dec) in Equity capital 0.0 0.0 0.0 0.0 0.0
Miscellaneous (834.2) 842.4 (522.8) 147.8 (75.5)
Cash from Financial Activit ies 3,017.2 4,194.0 (7,784.8) 14,942.5 (2,006.1)
Opening Cash 14,180.2 11,734.6 12,232.7 16,687.7 6,204.0
Closing Cash 11,734.6 12,232.7 16,687.7 6,204.0 8,109.9
Change in Cash (2,445.6) 498.1 4,455.0 (10,483.7) 1,905.9
13

8/8/2019 Shipping Sector - Theme Report - 060109
http://slidepdf.com/reader/full/shipping-sector-theme-report-060109 14/20
S e c
t o r U p d a t e
S e c
t o r U p d a t e
S e c
t o r U p d a t e
S e c
t o r U p d a t e
S e c
t o r U p d a t e
G l o b a l E q u i t y
G l o b a l E q u i t y
G l o b a l E q u i t y
G l o b a l E q u i t y
G l o b a l E q u i t y
R e s e a r c h - I n d i a
R e s e a r c h - I n d i a
R e s e a r c h - I n d i a
R e s e a r c h - I n d i a
R e s e a r c h - I n d i a
Varun Shipping (Rs47) Varun Shipping (Rs47) Varun Shipping (Rs47) Varun Shipping (Rs47) Varun Shipping (Rs47) OutperformeOutperformeOutperformeOutperformeOutperformeTarget Price: Rs5Target Price: Rs5Target Price: Rs5Target Price: Rs5Target Price: Rs5
Reuters/Bloomberg Code VRNS.BO / VRNS.IN Revenues 6,845 8,508 9,673 8,920 9,4
Market Cap (Rs mn) 7047.7 Op Profit 3,824 4,916 5,425 4,928 5,1Market Cap (US$ mn) 146.8 Net Profit 952 1,425 1,783 1,056 1,0
Shares Outstanding (mn) 150.0 EPS (Rs) 6.4 9.5 11.9 7.0
52-week High/Low (Rs) 110 / 40 EPS Growth (%) (59.4) 49.5 25.2 (40.8) 0
Operating Margin (%) 55.9 57.8 56.1 55.2 53
Major Shareholders (%) PER (x) 7.4 4.9 4.0 6.7 6
Promoters 43.6 EV/EBITDA (x) 6.5 5.9 5.6 6.5 6
FIIs 7.2 Dividend Payout (%) 41.8 33.2 42.1 56.8 56
Banks/MFs 6.2 Dividend yield (%) 8.6 10.6 10.6 8.5 8
Others 5.2 Dvidend Per Share (Rs) 4.0 5.0 5.0 4.0 4
Public 37.7 ROE (%) 12.5 15.1 17.2 9.8 9
Source: Company and Karvy Estimates
V V V V V arun Shipping arun Shipping arun Shipping arun Shipping arun Shipping Y/E March (Rs Mn) Y/E March (Rs Mn) Y/E March (Rs Mn) Y/E March (Rs Mn) Y/E March (Rs Mn) FY2007FY2007FY2007FY2007FY2007 FY2008FY2008FY2008FY2008FY2008 FY2009EFY2009EFY2009EFY2009EFY2009E FY2010EFY2010EFY2010EFY2010EFY2010E FY201FY201FY201FY201FY201
Sector: Shipping Sector: Shipping Sector: Shipping Sector: Shipping Sector: Shipping Vikram Suryavan Vikram Suryavan Vikram Suryavan Vikram Suryavan Vikram [email protected]
V V V V V arun Shipping Ltd (VSL) is a leading harun Shipping Ltd (VSL) is a leading harun Shipping Ltd (VSL) is a leading harun Shipping Ltd (VSL) is a leading harun Shipping Ltd (VSL) is a leading h ydr ydr ydr ydr ydrocarbon oriented Indian shipping companocarbon oriented Indian shipping companocarbon oriented Indian shipping companocarbon oriented Indian shipping companocarbon oriented Indian shipping compan y oper y oper y oper y oper y operating withating withating withating withating withdiversified fleet of 20 vessels acrdiversified fleet of 20 vessels acrdiversified fleet of 20 vessels acrdiversified fleet of 20 vessels acrdiversified fleet of 20 vessels across thross thross thross thross three segments viz.ee segments viz.ee segments viz.ee segments viz.ee segments viz. the Liquefied Pthe Liquefied Pthe Liquefied Pthe Liquefied Pthe Liquefied Petretretretretroleum Gas (LPG),oleum Gas (LPG),oleum Gas (LPG),oleum Gas (LPG),oleum Gas (LPG), offshoroffshoroffshoroffshoroffshore ae ae ae ae a
tankertankertankertankertanker..... VSL is planning to pr VSL is planning to pr VSL is planning to pr VSL is planning to pr VSL is planning to prooooo vide compr vide compr vide compr vide compr vide comprehensive shipping solutions acrehensive shipping solutions acrehensive shipping solutions acrehensive shipping solutions acrehensive shipping solutions across the entiross the entiross the entiross the entiross the entire he he he he h ydr ydr ydr ydr ydrocarbon procarbon procarbon procarbon procarbon produoduoduoduodu
chain with an aggressive fleet expansion.chain with an aggressive fleet expansion.chain with an aggressive fleet expansion.chain with an aggressive fleet expansion.chain with an aggressive fleet expansion.
No impact of fall in BDI:No impact of fall in BDI:No impact of fall in BDI:No impact of fall in BDI:No impact of fall in BDI: The company has exited form dry bulk segment in FY08 and is cushioned to an exte
from a downside in international freight rates as it derives about 65% revenue from transportation of LP
Varun controls 76% of domestic LPG and the freight rates for LPG carriers are more stable as compared to cru
or dry bulk carrying vessels due to long term nature of contracts and demand supply characteristics of th
business.
OffshorOffshorOffshorOffshorOffshore to pre to pre to pre to pre to prooooo vide support in earnings: vide support in earnings: vide support in earnings: vide support in earnings: vide support in earnings: The company has five anchor handling tugs (2 high end) operati
in offshore support business. We expect the charter rates for support service to remain strong as demand
mainly driven by committed capital expenditure for exploration by oil companies. The revenue contributio
from offshore segment is expected to increase from 20% in FY09 to 40% in FY11 with vessel addition and stron
freight rates.
Right of first refusal:Right of first refusal:Right of first refusal:Right of first refusal:Right of first refusal: Under the right of first refusal, the Indian ships have cargo preference to carry Indian good
As per Indian regulations the import of crude and LPG is done on FOB (Free on board) basis. We believe th
represents huge business opportunity as currently Indian shipping transport only 13% of country's total cargo.
also ensures the full utilization of its fleet for Varun even in shipping down cycle.
Remains faRemains faRemains faRemains faRemains fa vorite dividend Pla vorite dividend Pla vorite dividend Pla vorite dividend Pla vorite dividend Pla y: y: y: y: y: The stock is trading at attractive dividend yield of 11%. Varun shipping remai
preferred dividend play investment with focus on LPG trade. With relatively stable cash flow and support frooffshore business, we expect the company to maintain attractive dividend payout ratio going ahead.
V V V V V aluation:aluation:aluation:aluation:aluation: We have lowered the profit expectation from Rs 2.27 bn to Rs 1.07bn in FY10 and introduced th
estimates of Rs 1.19 bn for FY11. At current price of Rs 47, the stock is trading at 4xFY2009E and 6.7xFY10 earnin
and EV/EBIDTA it is trading at 5.6xFY09E and 6.5xFY10E. We have revised our valuation from 5xFY10 to 30
discount to NAV. We rate the stock an outperformeroutperformeroutperformeroutperformeroutperformer (previous buy) with target price of Rs58 (previous Rs 76)

8/8/2019 Shipping Sector - Theme Report - 060109
http://slidepdf.com/reader/full/shipping-sector-theme-report-060109 15/20
15
Capacity ExpansionCapacity ExpansionCapacity ExpansionCapacity ExpansionCapacity Expansion
The company had announced a capital expansion plan of USD 400 mn,out of which the company has already acquired one offshore vessel (AHTS)for ~USD 100 mn. We believe the falling asset prices in all the segments will help the company to complete its expansion plan with attractive shipprices going ahead.
We have maintained our assumption of further addition of vessels withone crude carrier in FY09 and one cruder carrier and one offshore vesselin FY10. However, we have revised our estimates for cost of vessels fromUSD 75 mn to USD 65 mn in FY09 and from USD 175 mn to USD 102 mnin FY10. We have assumed total capital expenditure of ~ USD 146 mn inFY11. Our fleet assumptions are shown in exhibit 1.
NNNNN A A A A A V is at Rs 83 per shar V is at Rs 83 per shar V is at Rs 83 per shar V is at Rs 83 per shar V is at Rs 83 per shareeeee
We have estimated the asset value of existing fleet at Rs 33.7 bn translating into net asset value per share of Rs 83.5. We have valued the company at30% discount to the down cycle NAV at Rs 58
Exhibit 2: NExhibit 2: NExhibit 2: NExhibit 2: NExhibit 2: N A A A A A V Calculation V Calculation V Calculation V Calculation V Calculation
V V V V V esselsesselsesselsesselsessels mn $mn $mn $mn $mn $
Crude 3 95
Product 1 8
Gas 11 397
AHTS 5 202
Dry bulk 0 0
TTTTTotalotalotalotalotal 2020202020 702702702702702
Market value of fleet Rs mn 33,696.0
Net debt Rs mn 21,166.3
Equity value Rs mn 12,529.7
No. of shares mn 150
NAV per share Rs 83.5
Exhibit 1: Fleet detailsExhibit 1: Fleet detailsExhibit 1: Fleet detailsExhibit 1: Fleet detailsExhibit 1: Fleet details
Mar-04Mar-04Mar-04Mar-04Mar-04 Mar-05Mar-05Mar-05Mar-05Mar-05 Mar-06Mar-06Mar-06Mar-06Mar-06 Mar-07Mar-07Mar-07Mar-07Mar-07 Mar-08Mar-08Mar-08Mar-08Mar-08 Mar-09Mar-09Mar-09Mar-09Mar-09 Mar-10Mar-10Mar-10Mar-10Mar-10 Mar-11Mar-11Mar-11Mar-11Mar-11
LPG Carriers 5 7 11 12 12 11 11 11
Crude Carriers 0 1 2 3 3 4 5 7
Product Carriers 5 3 3 2 1 1* 0 0
Bulk Carriers 1 1 1 0 0 0 0 0
Offshore Vessels 2 2 1 2 5 5 6 7
Total fleet 13 14 18 19 21 21 22 25
Note: * assumed sale of vessel during the year.

8/8/2019 Shipping Sector - Theme Report - 060109
http://slidepdf.com/reader/full/shipping-sector-theme-report-060109 16/20
Balance sheetBalance sheetBalance sheetBalance sheetBalance sheet
(Rsmn)(Rsmn)(Rsmn)(Rsmn)(Rsmn) FY2007FY2007FY2007FY2007FY2007 FY2008FY2008FY2008FY2008FY2008 FY2009EFY2009EFY2009EFY2009EFY2009E FY2010EFY2010EFY2010EFY2010EFY2010E FY2011EFY2011EFY2011EFY2011EFY2011E
Equity capital 1,499.5 1,500.0 1,500.0 1,500.0 1,500.0
Reserves & surplus 6,092.1 7,952.3 8,874.8 9,250.7 9,632.7
Shareholders funds 7,591.6 9,452.3 10,374.8 10,750.7 11,132.7
Long term loans 17,930.5 22,008.2 23,000.8 24,451.5 27,214.7
Shore term loans 0.0 0.0 185.0 310.0 455.0
Total loans 17,930.5 22,008.2 23,185.8 24,761.5 27,669.7
Difference in Exchange on Consolidation19.2 (16.0) 4.0 29.0 44.0
Capital Employed 25,541.2 31,444.5 33,564.5 35,541.3 38,846.5
Gross block 29,144.1 37,550.7 40,540.7 44,824.7 50,518.7
Depreciation 4,758.9 6,307.2 8,543.8 10,963.1 13,530.4
Net block 24,385.2 31,243.4 31,996.8 33,861.6 36,988.3
Lease Fleet 0.0 0.0 0.0 0.0 0.0
Investments 205.0 221.3 221.3 236.3 286.3
Stock of Bunkars 43.3 125.4 156.7 195.9 244.9
Debtors 528.4 570.0 604.2 634.4 729.5
Cash & Bank Bal 711.4 702.7 1,943.2 1,902.6 2,067.2
Loans & Advances 520.8 155.6 171.2 188.3 207.1
Other Assets 0.1 0.4 0.6 0.9 1.3
Current Assets 1,803.9 1,554.0 2,875.8 2,922.0 3,250.1
Sundry Creditors 455.0 525.3 588.3 600.1 619.3
Other liabilities 94.6 86.9 104.3 126.1 153.3
Provision for dividend 250.5 351.0 351.0 175.5 175.5
Other provisions 52.8 611.2 485.9 577.0 730.2
Current Liabilities 852.9 1,574.3 1,529.5 1,478.7 1,678.3
Net current assets 951.0 (20.3) 1,346.4 1,443.3 1,571.9
Capital Deployed 25,541.2 31,444.5 33,564.5 35,541.3 38,846.5
Profit & loss statementProfit & loss statementProfit & loss statementProfit & loss statementProfit & loss statement
(Rs mn)(Rs mn)(Rs mn)(Rs mn)(Rs mn) FY2007FY2007FY2007FY2007FY2007 FY2008FY2008FY2008FY2008FY2008 FY2009EFY2009EFY2009EFY2009EFY2009E FY2010EFY2010EFY2010EFY2010EFY2010E FY2011EFY2011EFY2011EFY2011EFY2011E
Net revenues 6,844.9 8,508.2 9,673.3 8,920.2 9,494.8
% Growth 3.4 24.3 13.7 (7.8) 6.4
Staff Cost 746.6 914.8 954.1 1,027.8 1,100.5
Bunker Cost 378.9 528.9 729.9 627.7 684.2
Port Expenses 116.0 165.9 141.0 124.1 146.5
Cost of Spares 1,206.9 1,111.0 1,333.2 1,122.5 1,242.8
Other Expenditure 573.0 871.2 1,090.0 1,089.8 1,208.1
Operating expenses 3,021.4 3,591.9 4,248.2 3,992.0 4,382.0
EBIDTA 3,823.5 4,916.3 5,425.1 4,928.2 5,112.8
% Growth (1.0) 28.6 10.4 (9.2) 3.7
EBIDTA margin (%) 55.9 57.8 56.1 55.2 53.8
Other income 19.6 47.9 38.0 56.2 58.6
Interest 1,191.9 1,395.2 1,407.0 1,481.8 1,518.5
Depreciation 1,629.1 2,120.0 2,236.6 2,419.3 2,567.3
Pre-tax profits 1,022.1 1,449.0 1,819.6 1,083.3 1,085.6
% Growth (45.3) 41.8 25.6 (40.5) 0.2
Provision for tax 69.7 24.5 36.4 27.1 27.1
Effective tax rate 6.8 1.7 2.0 2.5 2.5
Adjusted Net Profit 952.4 1,424.5 1,783.2 1,056.2 1,058.4
% Growth (48.2) 49.6 25.2 (40.8) 0.2
Net Margin (%) 13.9 16.7 18.4 11.8 11.1
Extra-Ordinary Inc/(Exp) 496.5 836.8 0.0 0.0 0.0
Reported Net Profit 1,449.0 2,261.3 1,783.2 1,056.2 1,058.4
% Growth (21.3) 56.1 (21.1) (40.8) 0.2
EPS (Rs) 6.4 9.5 11.9 7.0 7.1
% Growth (59.4) 49.5 25.2 (40.8) 0.2
DPS (Rs) 4.0 5.0 5.0 4.0 4.0
Dividend payout (%) 41.8 33.2 42.1 56.8 56.7
RatiosRatiosRatiosRatiosRatios
Rs mnRs mnRs mnRs mnRs mn FY2007FY2007FY2007FY2007FY2007 FY2008FY2008FY2008FY2008FY2008 FY2009EFY2009EFY2009EFY2009EFY2009E FY2010EFY2010EFY2010EFY2010EFY2010E FY2011EFY2011EFY2011EFY2011EFY2011E
ROCE (%) 8.6 8.9 9.5 7.1 6.6ROE (%) 12.5 15.1 17.2 9.8 9.5
Debt/Equity (x) 2.4 2.3 2.2 2.3 2.5
Interest Cover (x) 1.8 2.0 2.3 1.7 1.7
Cost StructureCost StructureCost StructureCost StructureCost Structure
Staff Cost/ Sales(%) 10.9 10.8 9.9 11.5 11.6
Bunker Cost/Sales(%) 5.5 6.2 7.5 7.0 7.2
Port Expenses/ Sales (%) 1.7 2.0 1.5 1.4 1.5
Cost of Spares/ Sales(%) 17.6 13.1 13.8 12.6 13.1
Other Expenditure / Sales (%) 8.4 10.2 11.3 12.2 12.7
Pre-tax margin (%) 14.6 16.5 18.4 11.5 10.8
Net margin (%) 13.9 16.7 18.4 11.8 11.1
Total assets turnover ratio (x) 0.3 0.3 0.3 0.3 0.2
Avg. collection period (Days) 27.8 24.1 22.5 25.6 27.7
Avg. payment period (Days) 23.9 22.2 21.9 24.2 23.5
Cash & bank/share (Rs) 4.7 4.7 13.0 12.7 13.8Other inc/pre-tax (%) 2.0 3.4 2.1 5.5 5.7
Cash flow Cash flow Cash flow Cash flow Cash flow
(Rs mn)(Rs mn)(Rs mn)(Rs mn)(Rs mn) FY2007FY2007FY2007FY2007FY2007 FY2008FY2008FY2008FY2008FY2008 FY2009EFY2009EFY2009EFY2009EFY2009E FY2010EFY2010EFY2010EFY2010EFY2010E FY2011EFY2011EFY2011EFY2011EFY2011E
EBIT 2,194.4 2,796.3 3,188.5 2,508.9 2,545.5(Inc)/Dec in working capital (613.1) 962.6 (126.1) (137.6) 36.2
Cash flow from operations 1,581.3 3,758.9 3,062.4 2,371.3 2,581.6
Other income 19.6 47.9 38.0 56.2 58.6
Extra-ordinary income (935.8) 133.3 30.1 215.5 33.8
Depreciation 1,629.1 2,120.0 2,236.6 2,419.3 2,567.3
Interest paid (1,191.9) (1,395.2) (1,407.0) (1,481.8) (1,518.5)
Dividends paid (566.8) (664.0) (750.0) (750.0) (600.0)
Tax paid (149.2) (137.3) (157.1) (147.8) (122.4)
Net cash from operations 386.3 3,863.6 3,052.9 2,682.6 3,000.4
Capital expenditure (7,103.0) (8,406.6) (2,990.0) (4,284.0) (5,694.0)
Free Cash Flow (6,716.7) (4,543.0) 62.9 (1,601.4) (2,693.6)
Inc/(Dec) in long term 5,171.5 4,092.5 992.6 1,450.7 2,763.2
Inc/(Dec) in short term 14.7 (14.7) 185.0 125.0 145.0
(Inc)/Dec in investments (21.6) (16.3) 0.0 (15.0) (50.0)
Inc/(Dec) in Equity capital 1,843.0 472.9 0.0 0.0 0.0Cash from Financial Activities 7,007.7 4,534.3 1,177.6 1,560.7 2,858.2
Opening Cash 420.4 711.4 702.7 1,943.2 1,902.6
Closing Cash 711.4 702.7 1,943.2 1,902.6 2,067.2
Change in Cash 291.0 (8.7) 1,240.5 (40.6) 164.7
16

8/8/2019 Shipping Sector - Theme Report - 060109
http://slidepdf.com/reader/full/shipping-sector-theme-report-060109 17/20
S e c
t o r U p d a t e
S e c
t o r U p d a t e
S e c
t o r U p d a t e
S e c
t o r U p d a t e
S e c
t o r U p d a t e
G l o b a l E q u i t y
G l o b a l E q u i t y
G l o b a l E q u i t y
G l o b a l E q u i t y
G l o b a l E q u i t y
R e s e a r c h - I n d i a
R e s e a r c h - I n d i a
R e s e a r c h - I n d i a
R e s e a r c h - I n d i a
R e s e a r c h - I n d i a
Mercator Lines (Rs39)Mercator Lines (Rs39)Mercator Lines (Rs39)Mercator Lines (Rs39)Mercator Lines (Rs39) UnderperformUnderperformeUnderperformUnderperformeUnderperformeTarget Price: 2Target Price: 2Target Price: 2Target Price: 2Target Price: 2
Reuters/Bloomberg Code MRCT.BO / MRLN@IN Revenues 11,228 14,549 20,995 15,531 17,4
Market Cap (Rs mn) 10724.8 Op Profit 2,957 5,874 9,293 5,877 6,0Market Cap (US$ mn) 255.4 Net Profit 1,309 2,635 4,441 655 8
Shares Outstanding (mn) 275.0 Adj. EPS (Rs) 6.7 11.2 16.9 2.4 3
52-week High/Low (Rs) 185 / 22 EPS Growth (%) (34.3) 66.3 50.3 (85.9) 25
Operating Margin (%) 26.3 40.4 44.3 37.8 34
Major Shareholders (%) PER (x) 5.8 3.5 2.3 16.4 13
Promoters 41.7 EV/EBITDA (x) 8.3 4.0 3.2 7.2 6
FIIs 20.5 Dividend Payout (%) 14.1 7.4 5.8 22.1 16
Banks//MFs 3.5 Dividend yield (%) 2.6 2.8 2.6 1.3
Others 8.9 RoCE (%) 10.0 14.1 16.0 5.3 5
Public 21.7 ROE (%) 22.4 23.4 23.3 2.9 3
Source: Company and Karvy Estimates
Mercator linesMercator linesMercator linesMercator linesMercator lines Y/E March (Rs Mn) Y/E March (Rs Mn) Y/E March (Rs Mn) Y/E March (Rs Mn) Y/E March (Rs Mn) FY2007FY2007FY2007FY2007FY2007 FY2008FY2008FY2008FY2008FY2008 FY2009FY2009FY2009FY2009FY2009 FY2010FY2010FY2010FY2010FY2010 FY20FY20FY20FY20FY20
Sector: Shipping Sector: Shipping Sector: Shipping Sector: Shipping Sector: Shipping Vikram Suryavan Vikram Suryavan Vikram Suryavan Vikram Suryavan Vikram [email protected]
Mercator Lines has 15 vessels (7 crude + 2 product + 1 dry bulk + 5 dredgers) in parent company and 11 dMercator Lines has 15 vessels (7 crude + 2 product + 1 dry bulk + 5 dredgers) in parent company and 11 dMercator Lines has 15 vessels (7 crude + 2 product + 1 dry bulk + 5 dredgers) in parent company and 11 dMercator Lines has 15 vessels (7 crude + 2 product + 1 dry bulk + 5 dredgers) in parent company and 11 dMercator Lines has 15 vessels (7 crude + 2 product + 1 dry bulk + 5 dredgers) in parent company and 11 dbulk vessels under Singaporbulk vessels under Singaporbulk vessels under Singaporbulk vessels under Singaporbulk vessels under Singapore subsidiare subsidiare subsidiare subsidiare subsidiar y y y y y ..... MerMerMerMerMercator lines (MLL) is one of the fastest grcator lines (MLL) is one of the fastest grcator lines (MLL) is one of the fastest grcator lines (MLL) is one of the fastest grcator lines (MLL) is one of the fastest growing shippiowing shippiowing shippiowing shippiowing shippicompanies and has the highest sensitivity to BDI as compared to other shipping companies.companies and has the highest sensitivity to BDI as compared to other shipping companies.companies and has the highest sensitivity to BDI as compared to other shipping companies.companies and has the highest sensitivity to BDI as compared to other shipping companies.companies and has the highest sensitivity to BDI as compared to other shipping companies.
SingaporSingaporSingaporSingaporSingapore subsidiare subsidiare subsidiare subsidiare subsidiar y (72.35%) is pur y (72.35%) is pur y (72.35%) is pur y (72.35%) is pur y (72.35%) is pure plae plae plae plae pla y on dr y on dr y on dr y on dr y on dr y bulk: y bulk: y bulk: y bulk: y bulk: MLL (Singapore) owns 11 dry bulk vessels (7 Panam+4 post Panamax) focused on transportation of coal into India and other high growth markets, such as China. Itlargest fleet owner of geared Panamax amongst Indian-Owned Shipping Companies and provides customizlogistics solutions from the load to port to the point of usage to its customers in India.
ReneReneReneReneRene w w w w w al of contral of contral of contral of contral of contracts maacts maacts maacts maacts ma y happen at significant discount: y happen at significant discount: y happen at significant discount: y happen at significant discount: y happen at significant discount: The company has six vessels on spot market aremaining 6 are on time charter. We expect the significant decline in spot earnings as well as risk of re-pricin(downward) in existing long term contacts going ahead. Again, the company had in chartered 3 Post Panam
vessels at charter rates ~ $27,000 per day which increases the business risk.
High leHigh leHigh leHigh leHigh le ver ver ver ver verage incrage incrage incrage incrage increases the balance sheet risk:eases the balance sheet risk:eases the balance sheet risk:eases the balance sheet risk:eases the balance sheet risk: The recent acquisition of one VLCC (~$ 160 mn), two dry bu vessels ($ 65.5 mn each) and one dredger has utilized the cash. The company has debt of ~ Rs 24.9 bn against tmarket cap of Rs 8.8 bn. The D/E of 1.23 and declining asset prices may result in breaching the security maintenanclause ie difficulty in maintaining loan value premium to the ship price.
Diversification in to dredging and offshore to provide limited hedge:Diversification in to dredging and offshore to provide limited hedge:Diversification in to dredging and offshore to provide limited hedge:Diversification in to dredging and offshore to provide limited hedge:Diversification in to dredging and offshore to provide limited hedge: MLL has one oil drilling rig on ordfrom Singapore shipyard with capital expenditure of Rs 1.81 bn. Rig is contracted at bareboat charter rates at baprice ~ USD 92,500 per day plus profit sharing for 3 years and is expected to join the fleet in Q1FY09. The fohopper dredgers are employed with Dredging corporation of India (3 are on long term contract for 1+1 year) wiaverage charter yield of ~ $18, 000 per day. We expect the total revenue from dredging and offshore to contribu~25% in next two years providing limited hedge from shipping down cycle.
V V V V V aluations:aluations:aluations:aluations:aluations: We have revised our financial estimates from standalone to consolidated basis. We expect thconsolidated revenue increase by 47.5% to Rs 21.45 bn and net profit to increase by 70.4% to Rs 4.49 bn in FY0 We expect the revenue decline of 24.2% to Rs 16.26bn and profit decline of 80.8% to Rs 963 mn in FY10. At curreprice of Rs 39, the stock is trading at 2.3xFY2009E and 16.4xFY10 earnings and EV/EBIDTA it is trading at 3.2xFY0and 7.2xFY10E. We have revised our valuation from 5xFY10 consolidated earnings to 30% discount to NAV witarget price of Rs23 (previous Rs 68).

8/8/2019 Shipping Sector - Theme Report - 060109
http://slidepdf.com/reader/full/shipping-sector-theme-report-060109 18/20
18
Downward revision in earningsDownward revision in earningsDownward revision in earningsDownward revision in earningsDownward revision in earnings
We have revised our assumptions downwards in view of current fall inthe freight rates. Our freight rates assuming for different segment are asshown in exhibit 1. We expect the company to report revenue decline of 26.7% to Rs 15.7 bn in FY10 from expected revenue of Rs 21.45 bn in FY09on consolidated basis. We expect the consolidated profits of Rs 4.47 bn inFY09 and Rs 896 mn in FY10.
Exhibit 1:Exhibit 1:Exhibit 1:Exhibit 1:Exhibit 1: A A A A A ver ver ver ver verageageageageage TCE ($ /daTCE ($ /daTCE ($ /daTCE ($ /daTCE ($ /da y) y) y) y) y)
OwnedOwnedOwnedOwnedOwned FY09FY09FY09FY09FY09 FY10FY10FY10FY10FY10 FY11FY11FY11FY11FY11
Crude 41,259 23,509 24,919
Product 34,250 22,750 23,750
Drybulk 42,632 20,607 22,783
Dredger 22,813 18,000 18,000
NNNNN A A A A A V estimated at Rs 32.5 per shar V estimated at Rs 32.5 per shar V estimated at Rs 32.5 per shar V estimated at Rs 32.5 per shar V estimated at Rs 32.5 per shareeeee
The net asset value for consolidated fleet is estimated at Rs 30 per share which includes the valuation of Rs 21.8 per share from standalone andRs 10.79 per share from fleet under subsidiary companies. Our segment wise break up of fleet value is as shown in exhibit 2 & 3. We have notassigned any present value for the charter in fleet in view of very low freight rates going ahead.
Exhibit 2: Standalone FleetExhibit 2: Standalone FleetExhibit 2: Standalone FleetExhibit 2: Standalone FleetExhibit 2: Standalone Fleet
Tanker Segment (mn $) 204
Product Segment (mn $) 33
Dry bulk (mn $) 25
Dredging (mn $) 76
Total Flee t value (Rs mn) 15,548
Less Net Debt (Rs mn) 9,800
Equity value (Rs mn) 5,748
NAV (Rs / share) 21.8
Exhibit 3: For Subsidiary fleetExhibit 3: For Subsidiary fleetExhibit 3: For Subsidiary fleetExhibit 3: For Subsidiary fleetExhibit 3: For Subsidiary fleet
Gross value of fleet (mn $) 333.0
Gross value of fleet (Rs mn ) 15,318
Less Net Debt (Rs mn) 11,390
Net value of fleet (Rs mn) 3,928
MLL holding (%) 72.35
MLL share (Rs mn) 2,841.0
NAV (Rs / share) 10.79

8/8/2019 Shipping Sector - Theme Report - 060109
http://slidepdf.com/reader/full/shipping-sector-theme-report-060109 19/20
19
Balance sheetBalance sheetBalance sheetBalance sheetBalance sheet
(Rsmn)(Rsmn)(Rsmn)(Rsmn)(Rsmn) FY2007FY2007FY2007FY2007FY2007 FY2008EFY2008EFY2008EFY2008EFY2008E FY2009EFY2009EFY2009EFY2009EFY2009E FY2010EFY2010EFY2010EFY2010EFY2010E FY2011EFY2011EFY2011EFY2011EFY2011E
Equity capital 189.2 234.9 263.4 275.0 275.0
Preferance share and warrents 448.8 166.7 0.0 0.0 0.0
Reserves & surplus 5,645.6 15,805.1 21,644.7 22,887.1 23,583.1
Shareholders funds 6,283.7 16,206.8 21,908.1 23,162.1 23,858.1
Long term loans 12,080.2 18,655.7 24,955.7 34,955.7 33,455.7
Shore term loans 3,326.5 1,228.1 1,350.9 1,485.9 1,634.5
Other Loans 2,941.9 1,227.5 1,152.5 1,077.5 1,002.5
Total loans 18,348.6 21,111.3 27,459.1 37,519.1 36,092.7
Deferred tax liability 0.0 0.0 0.0 0.0 0.0
Minority Interest 0.0 1,548.3 2,643.1 2,609.3 2,647.4
Capital Employed 24,632.3 38,866.4 52,010.2 63,290.5 62,598.2
Gross block 18,944.6 31,419.6 46,688.0 63,754.0 64,779.0
Depreciation 2,054.7 3,528.7 5,845.0 8,929.2 12,062.1
Net block 16,889.9 27,890.9 40,843.0 54,824.8 52,716.9
Capital WIP 958.6 4,510.2 0.0 0.0 1.0
Investments 870.7 42.5 44.6 46.9 49.2
Inventory 250.0 270.5 324.6 389.5 467.4
Sundry debtors 1,859.3 2,079.6 2,453.9 3,386.4 4,673.2
Cash & bank 3,787.8 8,531.4 8,482.8 5,645.6 7,143.9
Loans & advances 2,087.9 4,195.5 4,824.8 5,548.5 6,380.8
Current Assets 7,984.9 15,077.0 16,086.0 14,970.0 18,665.3
Sundry Creditors 1,644.7 5,469.0 3,828.3 5,283.0 7,290.6
Other liabilities 203.7 2,878.1 950.3 1,167.7 1,441.8
Provision for dividend 189.2 258.4 131.7 68.7 68.7
Other provisions 35.4 48.7 53.2 31.7 33.1
Current Liabilities 2,073.1 8,654.2 4,963.5 6,551.2 8,834.2
Net current assets 5,911.9 6,422.8 11,122.5 8,418.8 9,831.1
Capital Deployed 24,631.0 38,866.4 52,010.2 63,290.5 62,598.2
Profit & loss statementProfit & loss statementProfit & loss statementProfit & loss statementProfit & loss statement
(Rs mn)(Rs mn)(Rs mn)(Rs mn)(Rs mn) FY2007FY2007FY2007FY2007FY2007 FY2008EFY2008EFY2008EFY2008EFY2008E FY2009EFY2009EFY2009EFY2009EFY2009E FY2010EFY2010EFY2010EFY2010EFY2010E FY2011EFY2011EFY2011EFY2011EFY2011E
Net revenues 11,227.6 14,548.7 20,994.7 15,531.3 17,455.0
% Growth 295.8 131.4 10.9 26.0 -0.3
Ship Operating Expenses 7,100.1 7,398.4 10,262.7 8,293.6 9,749.8
Staff Cost 49.8 137.8 240.2 355.0 441.8
Other Expenses 1,121.1 1,138.7 1,198.8 1,005.7 1,182.3
Operating expenses 8,271.0 8,674.9 11,701.7 9,654.3 11,373.8
EBIDTA 2,956.6 5,873.9 9,293.0 5,877.0 6,081.1
% Growth (15.1) 98.7 58.2 (36.8) 3.5
EBIDTA margin (%) 26.3 40.4 44.3 37.8 34.8
Other income 232.6 271.8 296.5 260.5 277.0
Interest 807.7 1,446.4 1,563.4 2,374.1 2,289.2
Depreciation 1,038.0 1,675.0 2,316.3 3,084.2 3,132.9
Pre-tax profits 1,343.5 3,024.3 5,709.8 679.2 936.0
% Growth (32.9) 125.1 88.8 (88.1) 37.8
Provision for tax 34.1 90.1 174.0 57.6 78.8
Effective tax rate 2.5 3.0 3.0 8.5 8.4
Adjusted Net Profit 1,309.4 2,934.2 5,535.9 621.7 857.3
% Growth (33.7) 124.1 88.7 (88.8) 37.9
Net Margin (%) 11.7 20.2 26.4 4.0 4.9
Minority interest 0.8 298.9 1094.8 (33.8) 38.1
Profit after Minority interest 1308.6 2635.3 4441.1 655.5 819.2
Extra-Ordinary Inc/(Exp) 35.8 641.5 (1,023.3) 0.0 0.0
Reported Net Profit 1,345.2 3,575.7 4,512.5 621.7 857.3
% Growth (33.0) 165.8 26.2 (86.2) 37.9
Adj. EPS 6.7 11.2 16.9 2.4 3.0
% Growth (34.3) 66.3 50.3 (85.9) 25.0
DPS (Rs) 1.0 1.1 1.0 0.5 0.5
Dividend payout (%) 6.0 7.7 18.8 26.6 17.4
RatiosRatiosRatiosRatiosRatios
Rs mnRs mnRs mnRs mnRs mn FY2007FY2007FY2007FY2007FY2007 FY2008EFY2008EFY2008EFY2008EFY2008E FY2009EFY2009EFY2009EFY2009EFY2009E FY2010EFY2010EFY2010EFY2010EFY2010E FY2011EFY2011EFY2011EFY2011EFY2011E
ROCE (%) 38.7 25.2 17.2 12.0 11.1ROE (%) 22.4 23.4 23.3 2.9 3.5
Debt/Equity (x) 2.9 1.3 1.3 1.6 1.5
Interest Cover (x) 2.7 3.1 4.7 1.3 1.4
Cost StructureCost StructureCost StructureCost StructureCost Structure
Ship Operating Expenses 63.2 50.9 48.9 53.4 55.9
Staff Cost 0.4 0.9 1.1 2.3 2.5
Other Expenses 10.0 7.8 5.7 6.5 6.8
Operating margin (%) 26.3 40.4 44.3 37.8 34.8
Pre-tax margin (%) 12.0 20.8 27.2 4.4 5.4
Net margin (%) 11.7 20.2 26.4 4.0 4.9
Total assets turnover ratio (x) 0.5 0.4 0.4 0.2 0.3
Cash flow Cash flow Cash flow Cash flow Cash flow
(Rs mn)(Rs mn)(Rs mn)(Rs mn)(Rs mn) FY2007FY2007FY2007FY2007FY2007 FY2008FY2008FY2008FY2008FY2008 FY2009EFY2009EFY2009EFY2009EFY2009E FY2010EFY2010EFY2010EFY2010EFY2010E FY2011EFY2011EFY2011EFY2011EFY2011E
EBIT 1,918.6 4,198.9 6,976.7 2,792.8 2,948.2(Inc)/Dec in working capital 598.5 4,151.9 (4,625.2) (47.8) 86.1
Cash flow from operations 2,517.0 8,350.7 2,351.5 2,745.0 3,034.3
Other income 232.6 271.8 296.5 260.5 277.0
Extra-ordinary income 35.8 641.5 (1,023.3) 0.0 0.0
Depreciation 1,038.0 1,675.0 2,316.3 3,084.2 3,132.9
Interest paid (807.7) (1,446.4) (1,563.4) (2,374.1) (2,289.2)
Dividends paid (88.8) (197.2) (390.1) (200.4) (137.5)
Tax paid (30.6) (128.8) (217.9) (105.0) (103.5)
Net cash from operations 2,896.4 9,166.5 1,769.6 3,410.2 3,914.0
Capital expenditure (5,120.1 ) (16 ,026 .6 ) (10,758.2) (17,066.0) (1,026.0 )
Free Cash Flow (2,223.7) (6,860.0) (8,988.7) (13,655.8) 2,888.0
Inc/(Dec) in long term 6,086.7 6,575.5 6,300.0 10,000.0 (1,500.0)
Inc/(Dec) in short term 634.9 (2,098.5) 122.8 135.1 148.6
Inc/(Dec) in other (1,476.2) (1,714.4) (75.0) (75.0) (75.0)
(Inc)/Dec in investments 127.1 828.2 (2.1) (2.2) (2.3)Inc/(Dec) in Equity capital 0.0 (236.4) (138.2) 11.6 0.0
Others (543.1) 8,249.3 2,732.5 749.2 39.1
Cash from Financial Activit ies 4,829.5 11,603.7 8,940.0 10,818.7 (1,389.6)
Opening Cash 1,182.0 3,787.8 8,531.5 8,482.8 5,645.6
Closing Cash 3,787.8 8,531.5 8,482.8 5,645.6 7,144.0
Change in Cash 2,605.8 4,743.7 (48.7) (2,837.1) 1,498.3
19

8/8/2019 Shipping Sector - Theme Report - 060109
http://slidepdf.com/reader/full/shipping-sector-theme-report-060109 20/20
Resear Resear Resear Resear Resear ch Desk (T ch Desk (T ch Desk (T ch Desk (T ch Desk (T el: 91-22-22895000) el: 91-22-22895000) el: 91-22-22895000) el: 91-22-22895000) el: 91-22-22895000)
Hemindra Hazari Head of Research [email protected]
Institutional Sales (T Institutional Sales (T Institutional Sales (T Institutional Sales (T Institutional Sales (T el: 91-22-22895000) el: 91-22-22895000) el: 91-22-22895000) el: 91-22-22895000) el: 91-22-22895000)
N Subramaniam Head of Institutional Sales [email protected]
Stock RatingsStock RatingsStock RatingsStock RatingsStock Ratings Absolute Returns Absolute Returns Absolute Returns Absolute Returns Absolute Returns Stock RatingsStock RatingsStock RatingsStock RatingsStock Ratings Absolute Returns Absolute Returns Absolute Returns Absolute Returns Absolute ReturnsBuy : > 25% Market Performer : 0 - 15%Out Performer : 16 - 25% Under Performer : < 0%Sell : <(25%)
DisclaimerDisclaimerDisclaimerDisclaimerDisclaimerThe information and views presented in this report are prepared by Karvy Stock Broking Limited. The information contained herein is based on our analysis and up on sources that we
consider reliable. We, however, do not vouch for the accuracy or the completeness thereof. This material is for personal information and we are not responsible for any loss incurredbased upon it.The investments discussed or recommended in this report may not be suitable for all investors. Investors must make their own investment decisions based on their specific investmentobjectives and financial position and using such independent advice, as they believe necessary. While acting upon any information or analysis mentioned in this report, investors may pleasenote that neither Karvy nor any person connected with any associated companies of Karvy accepts any liability arising from the use of this information and views mentioned in this document.
The author, directors and other employees of Karvy and its affiliates may hold long or short positions in the above-mentioned companies from time to time. Every employee of Karvy andits associated companies are required to disclose their individual stock holdings and details of trades, if any, that they undertake. The team rendering corporate analysis and investmentrecommendations are restricted in purchasing/selling of shares or other securities till such a time this recommendation has either been displayed or has been forwarded to clients of Karvy.
All employees are further restricted to place orders only through Karvy Stock Broking Ltd.
Karvy Stock Broking LimitedKarvy Stock Broking LimitedKarvy Stock Broking LimitedKarvy Stock Broking LimitedKarvy Stock Broking Limited
Regd Off : 46, Road No 4, Street No 1, Banjara Hills, Hyderabad – 500 034. Tel: 040-23351988, 23354283.