sherri seligson - homeschool 101homeschool-101.com/.../how-to-write-a-lab-report-1.pdf · simply...
TRANSCRIPT

www.apologia.com
WHAT IS A LAB REPORT? Simply put, a lab report is a way to explain what you have done in an experiment. You describe the results you obtained and then discuss what you learned. There are several ways to write a lab report, and depending on your class or your instructor, the requirements will vary. But this guide is to help you understand the reason why writing a lab report is an important part of the science process. It will also introduce the basic structure of one type of write-up.
In college, any science course you take will require you to do a lab report. But they are not just busy-work. They actually serve a purpose. You see, a written report is one of the main ways to share infor-mation to other scientists. It communicates the major points of an investigation to others who are in a similar field. This is a systematic way to spread information!
Lab reports have their own unique style and format, too. Though you may have been taught to write poetically and with artistry, lab reports require clarity and accuracy. They convey information in a concise and clear manner as you explain your investigation and results.
These reports should only be about two to three pages in length, so excessive background or intensive explanations are not necessary. Just get to the major points. Additionally, when doing these, do not use pronouns in your writing. Instead of, “We took three milliliters of vinegar and added it to our
HOW TO WRITE A LAB REPORTSHERRI SELIGSON

www.apologia.com
beaker,” you would write, “Three milliliters of vinegar were added to a beaker.” See? It is more concise and yet still very clear. In a conclusion, don’t say, “I learned that when you take salt water and place it in a container with fresh water, the salt water will sink because I know that salt water is denser than fresh water.” Again, think clear and concise, while removing pronouns: “In a container, salt water will sink below fresh water because salt water is more dense.”
Of course, as in all writing, proper grammar, spelling, and punctuation are important. And definitely avoid using slang. Though a lab might have been “really cool,” you do not want to write that in your report. Lab reports are technical documents, using correct technical terms and incorporating graphs and tables within the body of the text. So think of this lab-writing process as an opportunity to add one more type of writing style to your skill set. It will take a little practice at first, but as you continue to write more, you will eventually master this style. If you are college bound, you will likely have to take AT LEAST one science course, and lab reports will surely play a part in your grade, so this is an-other way to better prepare yourself for the future. Even in a career environment, there will be times when technical writing skills will be useful.
STRUCTURE OF LAB REPORTSSo what do lab reports look like? I will give you descriptions of the major sections in a lab report. Note that some of these sections will not be required for a high school level course, but it is good to understand all the possible parts. For most courses, the underlined sections are what should be in-cluded, but if you are taking a course under an instructor, you should include those sections assigned to you.
Title page: Lab reports are written in sections. In college, most courses require you to provide a title page. This is like a cover page to your report, and it includes the title of your experiment, your name, any lab partners’ names, and the date the lab was performed.
Experiment Title: Often the experiment title is given to you, but if it isn’t you will need to create one. The title basically states what you did. It should be about ten words or less and describe the major point of the experiment. For search purposes, lab report titles should begin with a key word instead of an article such as “A,” “An,” or “The.” So instead of writing, “The Several Effects of Temperature Changes and Varying Salinities on the Density of Water,” you might write, “Effects of Temperature and Salinity on Water’s Density.”
Abstract: This is another section that will not be required for high school-level work, but is always included in college lab reports, so I want to just go over the basics of an abstract so you will be famil-iar with what it is. Abstracts are a completely self-contained way to briefly summarize the procedures, results, and conclusions of an experiment. This way, when other scientists want to search through experimental data, they can quickly scan the abstract to see if the information in your experiment would be relevant to their interests. An abstract is usually a single short paragraph and is written in the present tense. It comes first in the lab report, right after the title but is usually written after the entire lab report is done, because scientists need to first work through and make conclusions about an experiments’ results.
Here is a sample abstract for shark behavior research:

www.apologia.com
Swimming Habits of Carcharhinid Sharks at the Living Seas Pavilion, Epcot CenterSeligson, S A and Weber
The swimming habits of three species of carcharhinid sharks, a tiger (Galeocerdo cuvier), a bull (Carcharhinus leucas) and four brown sharks (Carcharhinus plumbeus), held at The Living Seas Pavilion, were observed over a two year period (1988 and 1989). All of the sharks are females with the exception of the bullshark. Alterations in swimming habits relative to frequent-ly visited areas and depths of the tank were noted throughout a variety of environmental changes. Changes included the introduction and removal of sharks, and the placement of a divider which decreased available space. Daily environmental stimuli consisted of diver and dolphin confrontation and artificial feeding operations. Throughout the study, sharks showed an avoidance of the areas near the dolphin. All the sharks swam next to the outer wall of the aquarium. Dimly lit, open areas near the sharks’ feeding station were frequented. Divers seemed to have little effect on shark habits excepting the bull shark. The introduction of the divider produced no observable changes in the sharks’ habits.
Introduction: The introduction explains the purpose and objectives of the experiment. A good way to approach this section is to attempt to provide the reader with background, discussing the what and why of the experiment. Beginning with a bit of prior knowledge on which the experiment is based, you then try to explain the purpose of the experiment and why it was conducted in a certain way. Often, background information and purpose of the experiment will be found in your science text. The introduction is also the place where you state your hypothesis.
Procedure (sometimes called Materials and Methods): This section is important as it explains to the reader exactly what you used to perform the experiment and how you did it. It is highly detailed so that another scientist could reproduce your experimental methods in order to obtain the same results and gain extra data. In the case of high school or even undergraduate college labs, most of these procedures will be well-known experiments with expected results. So for your purposes, you will not have to detail every single item or step you performed in the lab. But it is important to describe the steps in a way that shows you have a good understanding of the experi-mental procedure. Again, write in third person, and use past tense. You might say, “The beaker was filled with 200 mL of distilled water and placed over an alcohol burner. As the beaker was heated, the temperature was taken every two minutes until the water began to boil.”
In some cases, it might be helpful to include a diagram of your experimental setup.
Results: The Results section will include any data or observations (quantitative and/or qualitative) you made in the experiment. Quantitative data may be more easily represented in a table or graph. When you make any type of diagram, be sure to give it a title. And give numbers to your diagrams. For example, you would call the first diagram Figure 1, the next Figure 2, and so on. That way you can refer to these diagrams in your discussions. If you create a graph, label the axes, such as Tempera-ture and Time and include the units of measurement, such as mL, °C, hours, and so on. The inde-pendent variable will always be on the x-axis. This variable doesn’t change, based on another variable. A good example of an independent variable would be Time. Time will not vary its rate no matter how much the temperature changes. The dependent variable, then, will be on the y-axis. This vari-
www.apologia.com
able is often the one you are measuring. For a table, make sure you label the columns and rows, and include the units of measure, as well.
Some labs will require you to make mathematical calculations with your data. This section is where you will include those. If you are using the same calculation for several points of data, you can demonstrate the mathematical process a single time as an example of what you did. For example, you might write, “At 25°C, the mass of gas was calculated to be: (include full calculation here). The rest of the data in the Mass column of Figure 2 were found using this same calculation.”
Now, it might be pretty self-explanatory what to include in the Results section, but it is important to remember that only information you recorded when you performed the experiment will be included here. Do not give any interpretation of the data; just include the results you obtained. You will dis-cuss what the data mean and any conclusions you may have in the next sections. Additionally, only include information you found when you did the lab, not what you expected to find. That can be discussed later, too. This section is also written in the third person and past tense.
Discussion: The Discussion section is where you can logically think through your data and inter-pret it. The purpose of this section is to consider your results as to how they support your original hypothesis or the previously stated objectives of the lab. If you get an unexpected result, here is where you explain why you might have gotten errant data. Perhaps you did not have an accurate way to measure liquid volume. Or you were using a balloon that was old and may have lost its elasticity. As a matter of fact, if you had a lab where nothing worked correctly, you can still write an excellent lab report. Just explain what may have gone wrong and the results you expected to get and why. It is tempting to revert to using pronouns here, but please continue to write in the third person and avoid any opinions or emotions. Remember, this is technical writing.
Conclusion: The Conclusion is often a single paragraph and is a brief summation of what hap-pened in the experiment, whether it supported the hypothesis, and what that means. Any errors in your experiment are briefly stated again, along with the expected results. It mirrors the introduction section and includes your findings and their implications.
References or Literature Cited: Some lab reports will require you to mention previous research studies. If so, make sure you list them at the end of your report. For high school lab courses, this section is most likely not necessary.
The entire lab report should be neatly written or typed, and without spelling or grammatical errors. Pay attention to significant figures in calculations and report your measurements with proper accura-cy. Though this has already been mentioned several times, do not use personal pronouns, write in the third person, and use past tense. You may be tempted to copy some information straight out of your text when it comes to introductory information and for materials and methods, but word for word copying is plagiarism, and you need to put this information into your own words.
Sample Lab Reports. Take a look at the following sample lab reports from three types of experiments: a General Biology lab, a Chemistry lab, and an Advanced Biology lab.

www.apologia.com
EXPERIMENT 14.2HOW ANTHOCYANINS AND PH HELP DETERMINE LEAF COLOR
Introduction:The leaves of plants often appear green in color, however, some plants have leaves that are only par-tially green or not green at all. Some plant species have green leaves that change color in the fall. The green color comes from the presence of chlorophyll, which is the pigment responsible for photosyn-thesis. Other leaf pigments include carotenoids (which are yellow or orange in color) and anthocya-nins (which are red or purple in color). This experiment explored how anthocyanins affect the color in leaves. Anthocyanins are expected to change color under varying pH.
Procedure:A few leaves of red cabbage were placed into a pot filled with one cup of water, and the pot was set on the stove until the water boiled. After five minutes at a low boil, the pot was removed from the heat, allowed to cool, and the leaves were discarded. Two glasses were prepared, one with two table-spoons of clear ammonia solution mixed with 1 ¼ cups of water, and the other with white vinegar. Next, ¼ cup of the boiled cabbage water was placed into a third clear glass container. The container was placed on a white sheet of paper and the color of the solution was noted. Using an eyedropper, ammonia solution was added to the cabbage water in five-drop increments and stirred until the color turned green. Then, using a different eyedropper, vinegar was added to the same cabbage water in two-drop increments and stirred until the solution turned pink and remained pink for three consecu-tive two-drop additions.
Results:The solution color and number of drops of added materials are listed in Table 1.
Table 1Drops of Ammonia and Vinegar added to Cabbage Solution and Color Change
Run 1 Run 2Cabbage Water Color Total # Drops
of AmmoniaCabbage Water Color Total # Drops
of Vinegarblue 0 green 0
blue-green 5 blue-green 12
blue-green 10 blue 16
blue-green 15 dark blue 26
blue-green 20 purple 30
green 25 pinkish-purple 36
pink 44
www.apologia.com
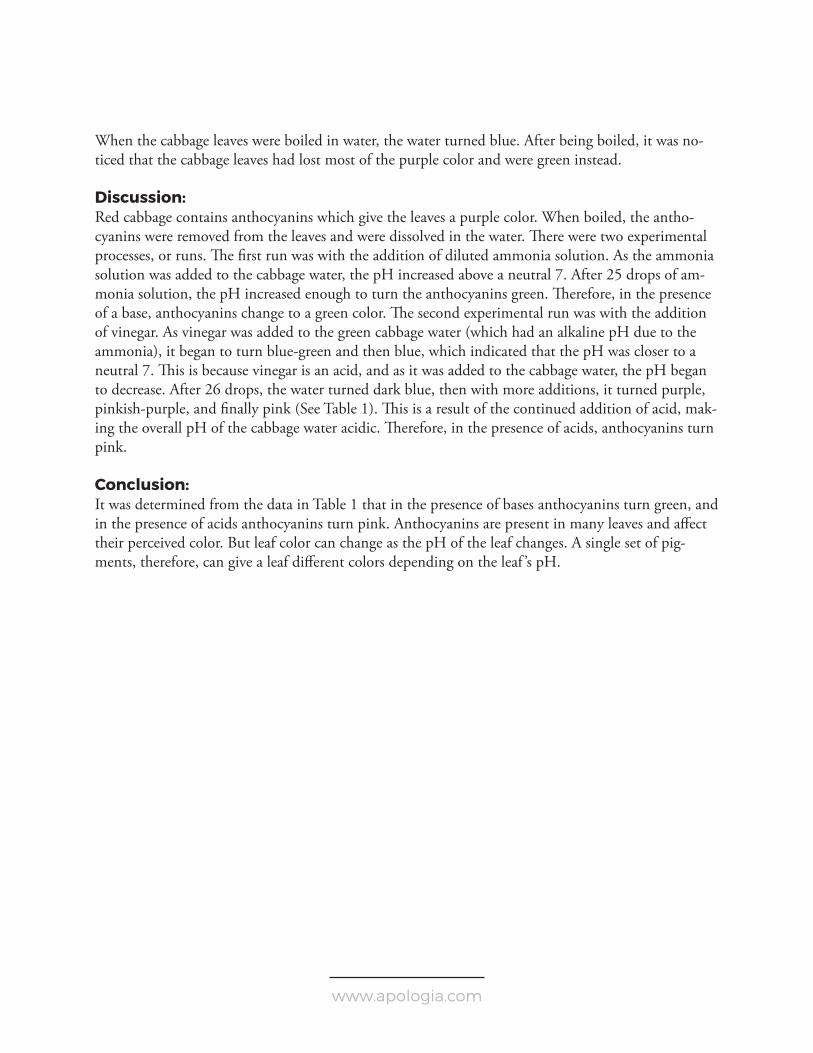
When the cabbage leaves were boiled in water, the water turned blue. After being boiled, it was no-ticed that the cabbage leaves had lost most of the purple color and were green instead.
Discussion:Red cabbage contains anthocyanins which give the leaves a purple color. When boiled, the antho-cyanins were removed from the leaves and were dissolved in the water. There were two experimental processes, or runs. The first run was with the addition of diluted ammonia solution. As the ammonia solution was added to the cabbage water, the pH increased above a neutral 7. After 25 drops of am-monia solution, the pH increased enough to turn the anthocyanins green. Therefore, in the presence of a base, anthocyanins change to a green color. The second experimental run was with the addition of vinegar. As vinegar was added to the green cabbage water (which had an alkaline pH due to the ammonia), it began to turn blue-green and then blue, which indicated that the pH was closer to a neutral 7. This is because vinegar is an acid, and as it was added to the cabbage water, the pH began to decrease. After 26 drops, the water turned dark blue, then with more additions, it turned purple, pinkish-purple, and finally pink (See Table 1). This is a result of the continued addition of acid, mak-ing the overall pH of the cabbage water acidic. Therefore, in the presence of acids, anthocyanins turn pink.
Conclusion:It was determined from the data in Table 1 that in the presence of bases anthocyanins turn green, and in the presence of acids anthocyanins turn pink. Anthocyanins are present in many leaves and affect their perceived color. But leaf color can change as the pH of the leaf changes. A single set of pig-ments, therefore, can give a leaf different colors depending on the leaf ’s pH.

www.apologia.com
EXPERIMENT 2.2ELECTRICAL CONDUCTIVITY OF COMPOUNDS DISSOLVED IN WATER
Introduction:Chemical compounds are classified based on their unique properties. One of the most basic classifica-tions is designating a compound to be ionic or covalent. A compound is classified as ionic if electrici-ty is able to be conducted when that compound is dissolved in pure water. If electricity is not able to be conducted, then that compound is classified as covalent. This experiment tested two compounds, baking soda and table sugar, in order to classify them into one of these two groups. It is anticipated that baking soda will be classified as ionic and sugar will be classified as covalent.
Procedure:A glass beaker was washed and carefully rinsed twice with distilled water to remove any potential contaminating residue. 80mL of distilled water was then added to the beaker. Two 15cm lengths of plastic-coated copper wire were prepared by removing 2cm of the casing from each of the ends. Then one end from each wire was attached to a post of a 9-volt battery using electrical tape. The other ends of the wires were immersed in the beaker filled with distilled water as in Diagram 1, and it was noted if any bubbles formed on the exposed ends. After removing the wires from the water, ½ teaspoon of baking soda was added to the beaker and allowed to dissolve. The wires were placed back in the beaker and it was noted if any bubbles formed on the exposed ends. A second beaker was cleaned and filled with 80mL of distilled water to which ½ teaspoon of sugar was added and dissolved. The wires from the battery assembly were inserted into the sugar water and it was noted if any bubbles formed on the exposed ends.
Results:When the wire ends were placed in the beaker filled with distilled water, no bubbles formed. After baking soda was dissolved in the water and the wires were returned to the solution, bubbles rapidly formed on each of the ends. Finally, when sugar was dissolved into distilled water and the wires were placed into the solution, no bubbles formed.
www.apologia.com
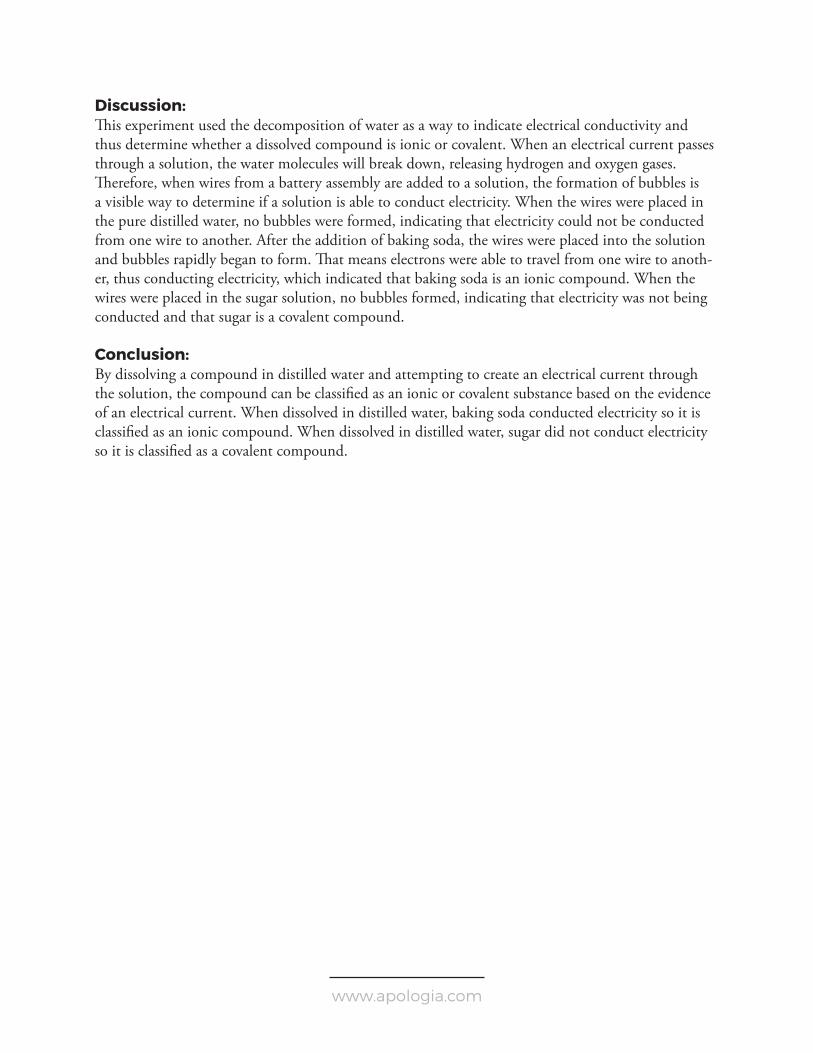
Discussion:This experiment used the decomposition of water as a way to indicate electrical conductivity and thus determine whether a dissolved compound is ionic or covalent. When an electrical current passes through a solution, the water molecules will break down, releasing hydrogen and oxygen gases. Therefore, when wires from a battery assembly are added to a solution, the formation of bubbles is a visible way to determine if a solution is able to conduct electricity. When the wires were placed in the pure distilled water, no bubbles were formed, indicating that electricity could not be conducted from one wire to another. After the addition of baking soda, the wires were placed into the solution and bubbles rapidly began to form. That means electrons were able to travel from one wire to anoth-er, thus conducting electricity, which indicated that baking soda is an ionic compound. When the wires were placed in the sugar solution, no bubbles formed, indicating that electricity was not being conducted and that sugar is a covalent compound.
Conclusion:By dissolving a compound in distilled water and attempting to create an electrical current through the solution, the compound can be classified as an ionic or covalent substance based on the evidence of an electrical current. When dissolved in distilled water, baking soda conducted electricity so it is classified as an ionic compound. When dissolved in distilled water, sugar did not conduct electricity so it is classified as a covalent compound.
www.apologia.com
EXPERIMENT 3.2A CLOSER LOOK AT FOLLICLES
Introduction:Within the epidermis layer of skin, there are epidermal cell derivatives. A hair follicle is a part of the skin which anchors a hair as it grows. At the base of the hair follicle is the hair bulb. It is helpful to study a hair follicle more closely in order to better understand its unique features.
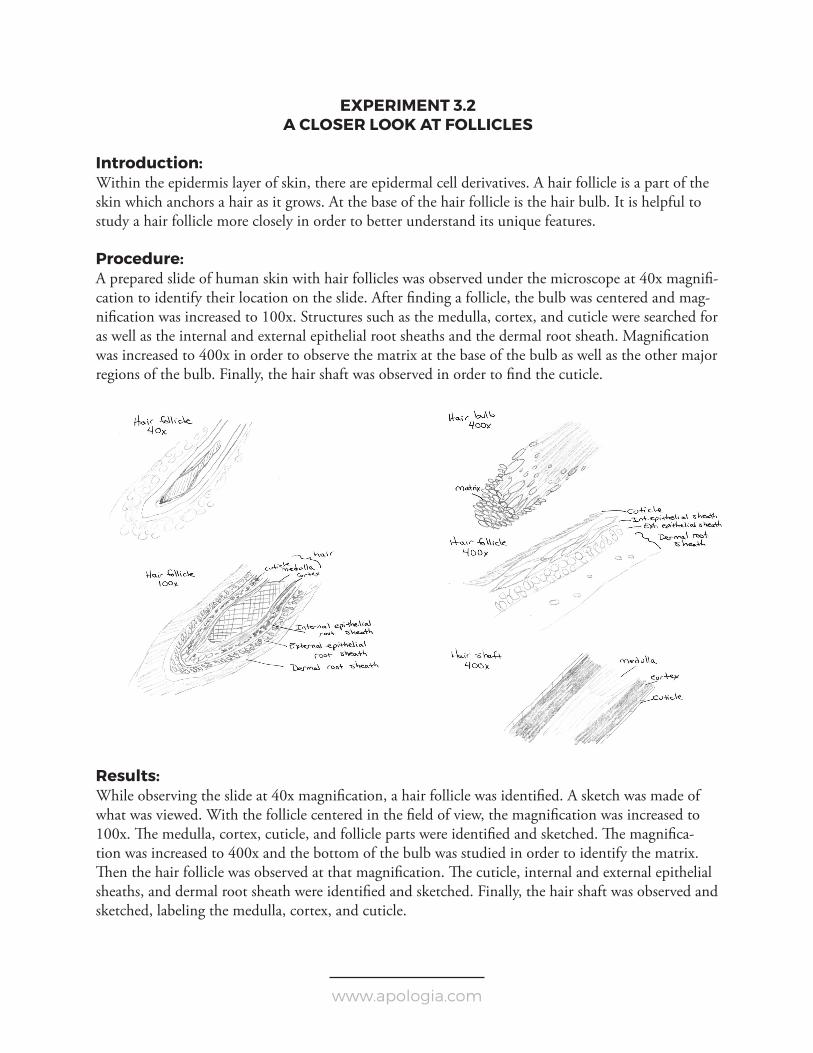
Procedure:A prepared slide of human skin with hair follicles was observed under the microscope at 40x magnifi-cation to identify their location on the slide. After finding a follicle, the bulb was centered and mag-nification was increased to 100x. Structures such as the medulla, cortex, and cuticle were searched for as well as the internal and external epithelial root sheaths and the dermal root sheath. Magnification was increased to 400x in order to observe the matrix at the base of the bulb as well as the other major regions of the bulb. Finally, the hair shaft was observed in order to find the cuticle.
Results:While observing the slide at 40x magnification, a hair follicle was identified. A sketch was made of what was viewed. With the follicle centered in the field of view, the magnification was increased to 100x. The medulla, cortex, cuticle, and follicle parts were identified and sketched. The magnifica-tion was increased to 400x and the bottom of the bulb was studied in order to identify the matrix. Then the hair follicle was observed at that magnification. The cuticle, internal and external epithelial sheaths, and dermal root sheath were identified and sketched. Finally, the hair shaft was observed and sketched, labeling the medulla, cortex, and cuticle.
www.apologia.com
Discussion:The prepared slide used in this experiment had a good specimen of hair follicle, making it possible to identify each of the features and regions of the hair bulb, hair shaft, and sheaths.
Conclusion:Examining a prepared slide of a hair follicle under a microscope provided a clearer understanding of the details of its structure. By observing the follicle at three magnifications – 40x, 100x, and 400x – each of the regions could be more easily studied. Creating illustrations of the regions at each magnifi-cation was a helpful exercise to better learn and understand the unique features of a hair follicle.

www.apologia.com
About Sherri SeligsonBefore Sherri Seligson was “promoted” to the position of homes-chooling mother of four, she worked as a marine biologist at Walt Disney World’s Living Seas pavilion and published shark behavior research. Sherri Seligson is the author of the following products from Apologia: Exploring Creation with Marine Biology, 2nd Edition (Coming Summer 2017), Exploring Creation with Biology Instruc-tional DVD, Exploring Creation with Chemistry Instructional DVD, Exploring Creation with Advanced Biology Instructional DVD, and Internship for High School Credit. She has also written companion curricula for feature films such as Dolphin Tale and War Horse. Sherri and her husband, David, live in Orlando, Florida.