shedding light on solar technologies – a techno-economic assessment … · ·...
TRANSCRIPT
Shedding light on solar technologies –
a techno-economic assessment and its policy implications
Michael PETERS*, Tobias S. SCHMIDT, David WIEDERKEHR, Malte SCHNEIDER
ETH Zurich, Department of Management, Technology, and Economics, Chair of Sustainability and
Technology, Kreuzplatz 5, CH-8032 Zurich, Switzerland
* Corresponding author contact details: [email protected]
Abstract Solar power technologies will have to become a major pillar in the world’s future energy system to combat
climate change and resource depletion. However, it is unclear which solar technology is and will prove most
viable. Therefore, a comprehensive comparative assessment of solar technologies along the key quantitative and
qualitative competitiveness criteria is needed. Based on a literature review and detailed techno-economic
modelling for 2010 and 2020 in five locations, we provide such an assessment for the three currently leading
large-scale solar technologies. We show that today these technologies cannot yet compete with conventional
forms of power generation but approach competitiveness around 2020 in favourable locations. Furthermore,
from a global perspective we find that none of the solar technologies emerges as a clear winner and that cost of
storing energy differs by technology and can change the order of competitiveness in some instances. Importantly,
the competitiveness of the different technologies varies considerably across locations due to differences in, e.g.,
solar resource and discount rates. Based on this analysis, we discuss policy implications with regard to fostering
the diffusion of solar technologies while increasing the efficiency of policy support through an adequate
geographical allocation of solar technologies.
Keywords: photovoltaics (PV); concentrating solar power (CSP); technology policy
Published in Energy Policy. (doi: 10.1016/j.enpol.2011.07.045)
Please cite this article as: Peters, M., Schmidt, T. S., Wiederkehr, D., & Schneider, M. (2011). Shedding light
on solar technologies—a techno-economic assessment and its policy implications. Energy Policy, 39(10), 6422-
6439.
1
1 Introduction
Society is facing serious problems such as climate change, resource depletion, and pollution. To meet these
challenges a "technology revolution" (Galiana and Green, 2009) in the field of clean energy technologies is
required in order to decouple economic growth from adverse environmental impacts. Solar power has the
potential to become a protagonist in this “revolution”. According to forecasts of the International Energy
Agency, solar technology could contribute 20% to global electricity generation in 2050 (IEA, 2010a). However,
in 2010 the share of solar power has been well below 0.5% as the cost of solar technologies cannot yet compete
with other forms of electricity generation. Significant innovations in solar power technologies are a prerequisite
to unlocking the enormous potential of solar energy. A wide set of solar technologies is available in the field of
photovoltaics (PV) and concentrating solar power (CSP) with differing performance characteristics.
Which technology is and will prove most viable in our electricity systems is heavily contested among scholars
and industry experts (Fthenakis et al., 2009; PricewaterhouseCoopers, 2010). While the competitiveness of solar
power generation differs by technology, time and location the extant literature lacks a holistic assessment of
solar power based on these three dimensions. Integrating existing studies into one overall picture is not possible
since they rely on a variety of methods and mostly inconsistent assumptions. Hence, there is a clear need to
holistically and accurately assess key solar technologies on a common basis to guide users, investors, technology
providers and policymakers in terms of investment and policy funding. In this paper we concentrate on
recommendations for future policymaking as policy is likely to be the single most important lever to lead solar
power towards competitiveness.
In order to provide a sound basis for our policy discussion (see section 6), this paper, therefore, focuses on the
following research question: What is the competitiveness of leading solar technologies depending on time and
location? Building on Tushman and Rosenkopf (1992), we assess solar technologies based on their key merit
dimensions. While the levelized cost of generating and storing electricity (LCOE) is undisputedly the most
important dimension of merit, qualitative aspects of solar technologies also impact their overall competitiveness.
Therefore, we will focus more specifically on the following four sub research questions:
(1) In 2010, how do PV and CSP technologies compare in terms of LCOE?
(2) In 2020, how will PV and CSP technologies compare in terms of LCOE?
(3) How do 2010 and 2020 LCOE of PV and CSP technologies change depending on local financing and
weather conditions in present and future leading solar markets?
(4) How do PV and CSP technologies compare along qualitative merit dimensions?
Methodologically, we construct a LCOE model, which is capable of quantifying the generation as well as the
storage cost of PV and CSP electricity. To assure accuracy we choose a high degree of granularity in the input
data. For projections we use a combination of bottom-up and top-down estimates (Neij, 2008). The qualitative
evaluation of the remaining merit dimensions is conducted based on an extensive literature review and expert
interviews.
This paper is structured as follows: In the subsequent section, we provide a short overview of solar technologies
and markets. In section 3 the existing literature on techno- economic assessments of solar power technologies is
2
reviewed. We describe the method and assumptions used in section 4. Based on the results, presented in section
5, we derive policy recommendations in section 6 before concluding in section 7.
2 An overview of solar technologies and markets
Solar power technologies can be divided into two main classes: photovoltaics (PV) and concentrating solar
power (CSP). PV exploits the photovoltaic effect exhibited by semiconductors and thus directly converts solar
irradiation into electricity. CSP systems use mirrors to focus sunlight onto a receiver in which a fluid (e.g.,
thermo oil or molten salt) is heated up to several hundred degrees Celsius. In a heat engine (e.g., a steam turbine)
this thermal energy is then converted into electricity (Jacobson, 2009).
2.1 Photovoltaics Since the patenting of the first solar cell in 1954 two principal types of PV technologies have emerged: wafer
based crystalline silicon (c-Si) and thin film. While the former typically had market shares of 80%-90% in
previous years, recently thin film technologies have been gaining ground. Even though the efficiencies of thin
film modules are poorer, their cost per watt is lower due to less material usage (Bagnall and Boreland, 2008). In
particular, cadmium telluride (CdTe) based modules have been successful lately due to their low cost position.
Their market share increased from 1% in 2005 to 9% in 2009 (Photon, 2010). Other commercial thin film
technologies such as copper indium gallium selenide (CIGS) and thin film silicon also increased their market
shares in recent years. Dye sensitized (Graetzel, 2001) and organic solar cells (Brabec and Sariciftci, 2001) have
developed quickly. However, these technologies are still in a pre-commercial phase (Photon, 2010). In addition,
in the coming decades, so called third generation photovoltaics have the potential to lower the levelized cost of
electricity by combining thin film approaches with high efficiency concepts (Green, 2006).
Although annual PV capacity additions have grown, on average, with more than 40% since 2000 (EPIA, 2010a),
it is still at a very low level compared to globally installed power plant capacity (Figure 1). Driven by an
attractive feed-in tariff scheme effective since 2000, Germany has gained a 42% share in installed PV capacity
while only accounting for 3% of globally installed power plant capacity (Figure 1). Following the German
example, other European countries have also introduced PV feed-in tariffs incentivizing capacity installations. In
the past, PV policy support was rather limited outside of Europe resulting in a low non-European share of the
world market. However, PV policy support is currently expanding globally and this will lead to an increasing
share of non-European PV markets – particularly in China and the US (EPIA 2010).
3
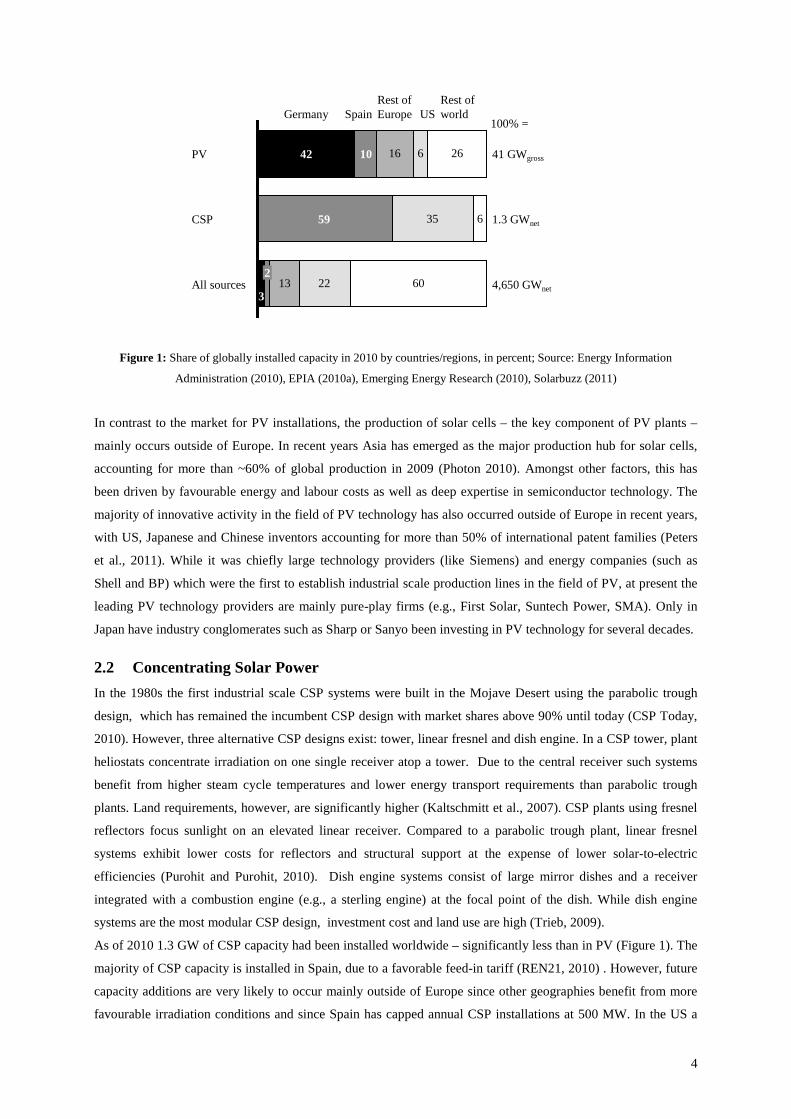
Figure 1: Share of globally installed capacity in 2010 by countries/regions, in percent; Source: Energy Information
Administration (2010), EPIA (2010a), Emerging Energy Research (2010), Solarbuzz (2011)
In contrast to the market for PV installations, the production of solar cells – the key component of PV plants –
mainly occurs outside of Europe. In recent years Asia has emerged as the major production hub for solar cells,
accounting for more than ~60% of global production in 2009 (Photon 2010). Amongst other factors, this has
been driven by favourable energy and labour costs as well as deep expertise in semiconductor technology. The
majority of innovative activity in the field of PV technology has also occurred outside of Europe in recent years,
with US, Japanese and Chinese inventors accounting for more than 50% of international patent families (Peters
et al., 2011). While it was chiefly large technology providers (like Siemens) and energy companies (such as
Shell and BP) which were the first to establish industrial scale production lines in the field of PV, at present the
leading PV technology providers are mainly pure-play firms (e.g., First Solar, Suntech Power, SMA). Only in
Japan have industry conglomerates such as Sharp or Sanyo been investing in PV technology for several decades.
2.2 Concentrating Solar Power In the 1980s the first industrial scale CSP systems were built in the Mojave Desert using the parabolic trough
design, which has remained the incumbent CSP design with market shares above 90% until today (CSP Today,
2010). However, three alternative CSP designs exist: tower, linear fresnel and dish engine. In a CSP tower, plant
heliostats concentrate irradiation on one single receiver atop a tower. Due to the central receiver such systems
benefit from higher steam cycle temperatures and lower energy transport requirements than parabolic trough
plants. Land requirements, however, are significantly higher (Kaltschmitt et al., 2007). CSP plants using fresnel
reflectors focus sunlight on an elevated linear receiver. Compared to a parabolic trough plant, linear fresnel
systems exhibit lower costs for reflectors and structural support at the expense of lower solar-to-electric
efficiencies (Purohit and Purohit, 2010). Dish engine systems consist of large mirror dishes and a receiver
integrated with a combustion engine (e.g., a sterling engine) at the focal point of the dish. While dish engine
systems are the most modular CSP design, investment cost and land use are high (Trieb, 2009).
As of 2010 1.3 GW of CSP capacity had been installed worldwide – significantly less than in PV (Figure 1). The
majority of CSP capacity is installed in Spain, due to a favorable feed-in tariff (REN21, 2010) . However, future
capacity additions are very likely to occur mainly outside of Europe since other geographies benefit from more
favourable irradiation conditions and since Spain has capped annual CSP installations at 500 MW. In the US a
16
35
13
6
6
22
26
60
USRest of Europe
4,650 GWnet3
100% =Germany Spain
Rest of world
2All sources
1042PV
CSP
41 GWgross
59 1.3 GWnet
4

multiple gigawatt (GW) project pipeline is expected to be executed in the coming years. Additionally the Middle
East, North Africa, China and India all offer growth prospects for CSP (REN21, 2010).
CSP system and component providers are mainly based in Germany, Spain and the US. While German and
Spanish CSP companies focus largely on the parabolic trough design (e.g., Siemens and Abengoa), US
headquartered firms rather rely on power tower (e.g., Brightsource) and linear fresnel technology (e.g., Ausra).
Until recently primarily startups and medium sized enterprises developed CSP technology. Yet since 2009
several leading European technology providers have invested in CSP firms: Siemens bought Solel, Areva
acquired Ausra and Alstom invested equity in Brightsource.
3 Techno-economic assessment of solar power technologies – a review of
the literature
In recent years various scholars have conducted techno-economic assessments of solar technologies. A focus of
these analyses has been on the levelized cost of electricity since it is the key competitiveness metric for fossil-
fired and renewable power generation technologies (Rubin et al., 2007; Sunpower Corporation, 2008). We
compiled a comprehensive review of the recent literature, which uses LCOE as a metric in assessing solar power
technologies (Table 1), allowing us to identify crucial research gaps. The aggregate analytical scope of the
literature reviewed is quite broad. Analyses have focused on the three key determinants of LCOE, i.e.,
technology, time and location. Some studies complement the quantitative assessment with qualitative merit
dimensions: Technological uncertainty (Sargent and Lundy, 2003), the addressable market (e.g.,
PricewaterhouseCoopers, 2010; Trieb et al., 1997), quality of electricity (e.g., Estela, 2010) and water
requirements (e.g., PricewaterhouseCoopers, 2010; Trieb, 2009) are evaluated.
Integrating the existing studies into one overall picture is not possible since they rely on a variety of methods and
partly inconsistent assumptions. In addition, some determinants of LCOE require further scrutiny. Eventually we
identified four research gaps: First, there is a lack of literature assessing and comparing the two leading solar
technologies, i.e., PV c-Si and PV CdTe on a granular level. Second, although most studies in the field of CSP
include energy storage in their analyses (e.g., German Aerospace Center, 2006), this is not common in the field
of PV – even though the intermittency of PV electricity is one of the major challenges of this technology (Trieb,
2009). Only recently have scholars begun to analyze storage options such as compressed air energy storage
(CAES) and batteries (Estela, 2010; Mason et al., 2008) for PV. Third, while some scholars have run sensitivity
analyses to understand the impact of variations in discount rate on LCOE (Pitz-Paal et al., 2005), location-
specific realistic discount rates have not yet been included in LCOE analyses. Fourth, the extant literature also
offers room for further enhancements of methodological rigor. Concerning the future cost reduction potential of
solar technologies the majority of studies presented in Table 1 solely rely on a top down learning curve approach
(IEA, 2010c; Kost and Schlegl, 2010), yet such a method is exposed to very high uncertainty in the field of solar
technologies (Neij, 2008; Nemet, 2006). In addition, some studies are not very transparent regarding the
underlying assumptions. For example, it is often unclear whether real or nominal price levels are used or whether
CSP production figures are based on gross power sold, or net power after adjustment for purchased electricity.
5
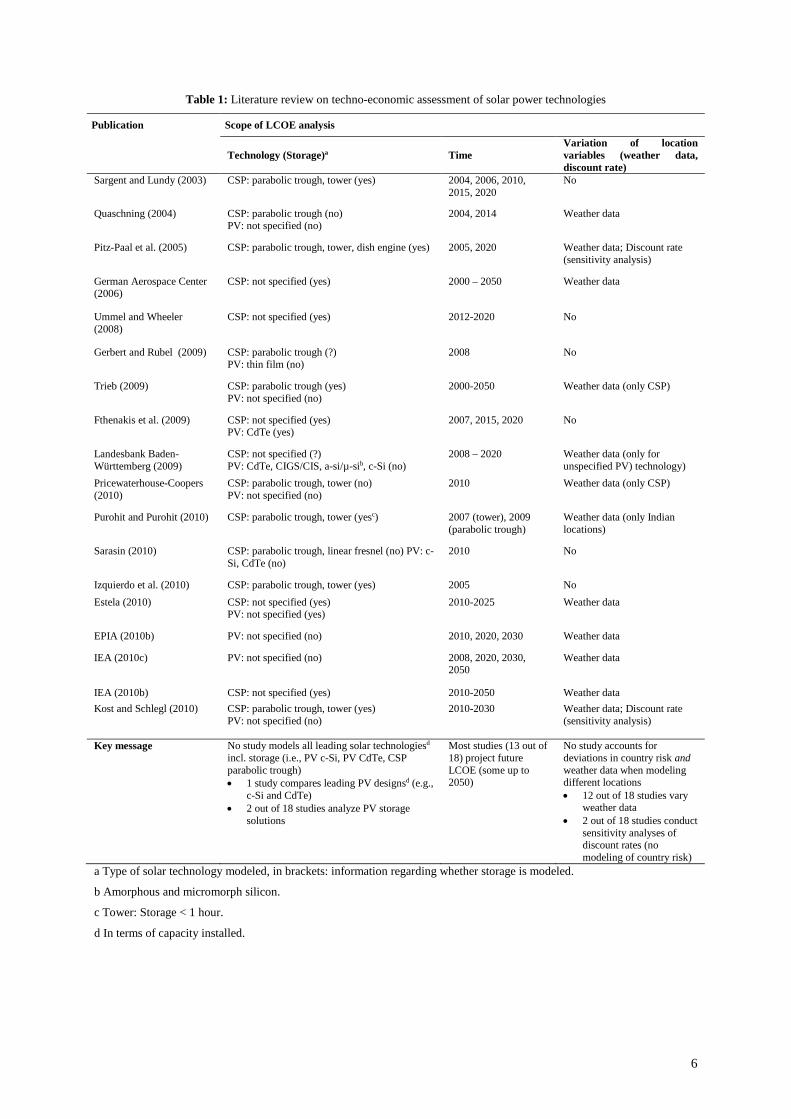
Table 1: Literature review on techno-economic assessment of solar power technologies
Publication Scope of LCOE analysis
Technology (Storage)a Time Variation of location variables (weather data, discount rate)
Sargent and Lundy (2003) CSP: parabolic trough, tower (yes) 2004, 2006, 2010, 2015, 2020
No
Quaschning (2004) CSP: parabolic trough (no) PV: not specified (no)
2004, 2014 Weather data
Pitz-Paal et al. (2005) CSP: parabolic trough, tower, dish engine (yes) 2005, 2020 Weather data; Discount rate (sensitivity analysis)
German Aerospace Center (2006)
CSP: not specified (yes) 2000 – 2050 Weather data
Ummel and Wheeler (2008)
CSP: not specified (yes) 2012-2020 No
Gerbert and Rubel (2009) CSP: parabolic trough (?) PV: thin film (no)
2008 No
Trieb (2009) CSP: parabolic trough (yes) PV: not specified (no)
2000-2050 Weather data (only CSP)
Fthenakis et al. (2009) CSP: not specified (yes) PV: CdTe (yes)
2007, 2015, 2020 No
Landesbank Baden-Württemberg (2009)
CSP: not specified (?) PV: CdTe, CIGS/CIS, a-si/µ-sib, c-Si (no)
2008 – 2020 Weather data (only for unspecified PV) technology)
Pricewaterhouse-Coopers (2010)
CSP: parabolic trough, tower (no) PV: not specified (no)
2010 Weather data (only CSP)
Purohit and Purohit (2010) CSP: parabolic trough, tower (yesc) 2007 (tower), 2009 (parabolic trough)
Weather data (only Indian locations)
Sarasin (2010) CSP: parabolic trough, linear fresnel (no) PV: c-Si, CdTe (no)
2010 No
Izquierdo et al. (2010) CSP: parabolic trough, tower (yes) 2005 No Estela (2010) CSP: not specified (yes)
PV: not specified (yes) 2010-2025 Weather data
EPIA (2010b) PV: not specified (no) 2010, 2020, 2030 Weather data
IEA (2010c) PV: not specified (no) 2008, 2020, 2030, 2050
Weather data
IEA (2010b) CSP: not specified (yes) 2010-2050 Weather data Kost and Schlegl (2010) CSP: parabolic trough, tower (yes)
PV: not specified (no) 2010-2030 Weather data; Discount rate
(sensitivity analysis)
Key message No study models all leading solar technologiesd incl. storage (i.e., PV c-Si, PV CdTe, CSP parabolic trough) • 1 study compares leading PV designsd (e.g.,
c-Si and CdTe) • 2 out of 18 studies analyze PV storage
solutions
Most studies (13 out of 18) project future LCOE (some up to 2050)
No study accounts for deviations in country risk and weather data when modeling different locations • 12 out of 18 studies vary
weather data • 2 out of 18 studies conduct
sensitivity analyses of discount rates (no modeling of country risk)
a Type of solar technology modeled, in brackets: information regarding whether storage is modeled.
b Amorphous and micromorph silicon.
c Tower: Storage < 1 hour.
d In terms of capacity installed.
6
As a result of technological uncertainty as well as the use of differing methods and assumptions, it is heavily
contested among scholars and industry experts, which technology is and will prove most viable in electricity
systems. Some years ago scholars agreed that the LCOE of CSP parabolic trough systems is significantly below
that of PV plants (Quaschning, 2004; Trieb et al., 1997). This is also supported by the feed-in tariffs granted
under the Spanish Royal decree 661 in 2007 and 2008 (Del Río González, 2008). However, significant cost
reductions in the field of PV eliminated the former consensus (Sarasin, 2010). In very recent studies, which
technologies offer and will offer the more competitive product in terms of LCOE is highly contested. For
example, according to PricewaterhouseCoopers (2010) CSP LCOE is significantly below PV LCOE whereas
Fthenakis and colleagues (2009) consider PV to be more competitive than CSP1 in terms of LCOE. Furthermore,
studies do not reach a consistent picture regarding the competitiveness of solar technologies with fossil based
electricity generation. According to Estela (2010) and Trieb (2009) PV2 and CSP will reach competitiveness
with gas fired power plants between 2015 and 2020, while the IEA (2010b, c) expects competitiveness of PV
and CSP plants past 2020. Assessing solar power generation technologies on a common basis and in a granular
manner can help to shed some light on the research gaps presented above.
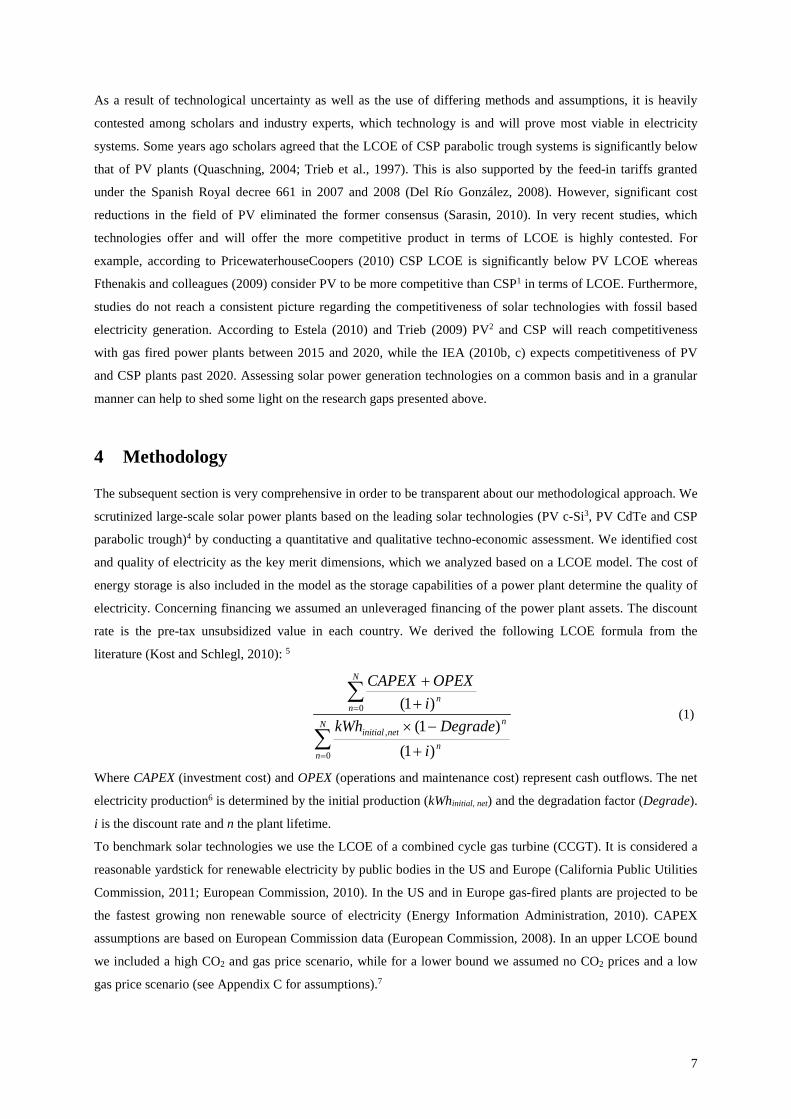
4 Methodology
The subsequent section is very comprehensive in order to be transparent about our methodological approach. We
scrutinized large-scale solar power plants based on the leading solar technologies (PV c-Si3, PV CdTe and CSP
parabolic trough)4 by conducting a quantitative and qualitative techno-economic assessment. We identified cost
and quality of electricity as the key merit dimensions, which we analyzed based on a LCOE model. The cost of
energy storage is also included in the model as the storage capabilities of a power plant determine the quality of
electricity. Concerning financing we assumed an unleveraged financing of the power plant assets. The discount
rate is the pre-tax unsubsidized value in each country. We derived the following LCOE formula from the
literature (Kost and Schlegl, 2010): 5
∑
∑
=
=
+
−×++
N
nn
nnetinitial
N
nn
iDegradekWh
iOPEXCAPEX
0
,
0
)1()1(
)1( (1)
Where CAPEX (investment cost) and OPEX (operations and maintenance cost) represent cash outflows. The net
electricity production6 is determined by the initial production (kWhinitial, net) and the degradation factor (Degrade).
i is the discount rate and n the plant lifetime.
To benchmark solar technologies we use the LCOE of a combined cycle gas turbine (CCGT). It is considered a
reasonable yardstick for renewable electricity by public bodies in the US and Europe (California Public Utilities
Commission, 2011; European Commission, 2010). In the US and in Europe gas-fired plants are projected to be
the fastest growing non renewable source of electricity (Energy Information Administration, 2010). CAPEX
assumptions are based on European Commission data (European Commission, 2008). In an upper LCOE bound
we included a high CO2 and gas price scenario, while for a lower bound we assumed no CO2 prices and a low
gas price scenario (see Appendix C for assumptions).7
7
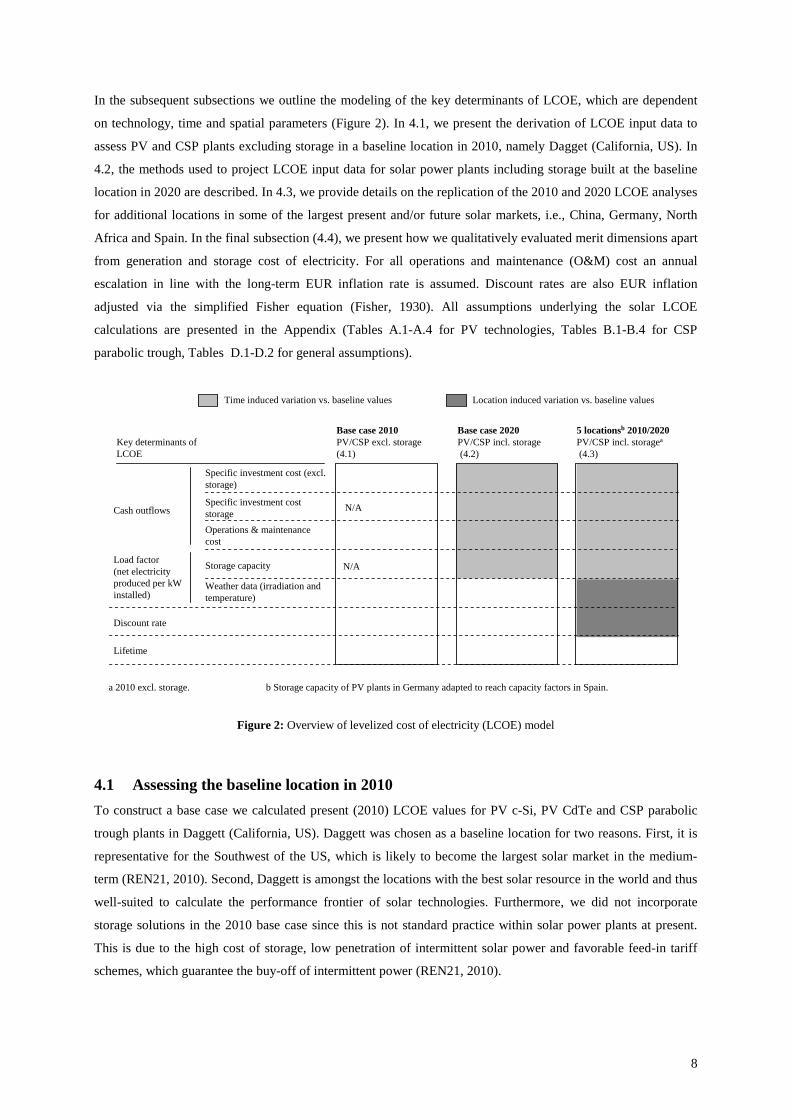
In the subsequent subsections we outline the modeling of the key determinants of LCOE, which are dependent
on technology, time and spatial parameters (Figure 2). In 4.1, we present the derivation of LCOE input data to
assess PV and CSP plants excluding storage in a baseline location in 2010, namely Dagget (California, US). In
4.2, the methods used to project LCOE input data for solar power plants including storage built at the baseline
location in 2020 are described. In 4.3, we provide details on the replication of the 2010 and 2020 LCOE analyses
for additional locations in some of the largest present and/or future solar markets, i.e., China, Germany, North
Africa and Spain. In the final subsection (4.4), we present how we qualitatively evaluated merit dimensions apart
from generation and storage cost of electricity. For all operations and maintenance (O&M) cost an annual
escalation in line with the long-term EUR inflation rate is assumed. Discount rates are also EUR inflation
adjusted via the simplified Fisher equation (Fisher, 1930). All assumptions underlying the solar LCOE
calculations are presented in the Appendix (Tables A.1-A.4 for PV technologies, Tables B.1-B.4 for CSP
parabolic trough, Tables D.1-D.2 for general assumptions).
Figure 2: Overview of levelized cost of electricity (LCOE) model
4.1 Assessing the baseline location in 2010 To construct a base case we calculated present (2010) LCOE values for PV c-Si, PV CdTe and CSP parabolic
trough plants in Daggett (California, US). Daggett was chosen as a baseline location for two reasons. First, it is
representative for the Southwest of the US, which is likely to become the largest solar market in the medium-
term (REN21, 2010). Second, Daggett is amongst the locations with the best solar resource in the world and thus
well-suited to calculate the performance frontier of solar technologies. Furthermore, we did not incorporate
storage solutions in the 2010 base case since this is not standard practice within solar power plants at present.
This is due to the high cost of storage, low penetration of intermittent solar power and favorable feed-in tariff
schemes, which guarantee the buy-off of intermittent power (REN21, 2010).
a 2010 excl. storage. b Storage capacity of PV plants in Germany adapted to reach capacity factors in Spain.
Key determinants of LCOE
Base case 2010PV/CSP excl. storage (4.1)
Base case 2020PV/CSP incl. storage (4.2)
5 locationsb 2010/2020PV/CSP incl. storagea
(4.3)
Specific investment cost (excl. storage)
Specific investment cost storageOperations & maintenance cost
Weather data (irradiation and temperature)
Storage capacity
N/A
Discount rate
Lifetime
Cash outflows
Load factor (net electricity produced per kW installed)
Time induced variation vs. baseline values
N/A
Location induced variation vs. baseline values
8
For all solar technologies we assumed identical discount rates, which reflect typical return requirements in the
power industries of industrialized countries (Salomons and Grootveld, 2003). Plant lifetime is chosen based on
typical assumptions in the PV industry (EPIA, 2010b) and does not vary between technologies, 2010 and 2020,
or location.
4.1.1 PV c-Si and PV CdTe
4.1.1.1 Specific cash outflows
Cash outflows per kW depend on investment cost consisting of component cost, project development and EPC8
cost as well as O&M cost. While investment cost per kW of PV plants are usually quoted based on gross values
under standard test conditions we use net capacity to be consistent with CSP parabolic trough capacity, which is
typically provided in net values.9 For PV c-Si and CdTe component price assumptions we relied on investor
reports of leading PV module and inverter companies (i.e., First Solar, Yingli, Suntech Power and SMA). Since
current PV component profit margins partly differ significantly by company and component we calculated two
cases, one based on “as is” profit margins the other based on expected long-term profit margins by component.10
Expenses for project development and EPC cost were derived from First Solar investor communication, the
world’s leading CdTe module manufacturer. O&M cost are taken from EPIA (2010b) and expressed as a fraction
of the initial investment on an annual basis.
4.1.1.2 Specific electricity production
The initial PV electricity production per kWnet depends on the solar resource available at a certain location and
the outside temperature. Global solar irradiation consists of two components: direct and diffuse irradiation. PV
converts both types of irradiation into electricity. We calculated the amount of solar irradiation received by a
fixed module with optimal tilt based on global solar irradiation data.11 We derived an average annual weighted
module temperature factor based on dry bulb temperature data (U.S. DOE, 2011) for PV c-Si and PV CdTe in
our baseline location.12 Since the initial net electrical energy output of PV plants per kW slowly decreases over
time we assumed a typical annual degradation rate of PV c-Si and PV CdTe module capacity (Jordan et al.,
2010).
4.1.2 CSP parabolic trough
4.1.2.1 Specific cash outflows
We relied on investment cost data from the NREL Solar Advisor Model (NREL 2010) which splits up the cost of
a wet-cooled 100 MW CSP parabolic trough reference plant in the Southwest of the US into roughly 50 cost
items13. The profit margin of the EPC company is adapted to be in line with PV plants. Using scaling factors also
provided by NREL (2010) we scaled the reference plant down to 50 MW – a typical size for a plant built in 2010
or in previous years. The NREL installation cost data is also consistent with the turnkey price of a recently
commissioned CSP parabolic trough plant in the US, i.e., Nevada Solar One (64 MW). O&M cost data was taken
from the European Commission (2007) and expressed as a fraction of the initial investment on an annual
inflation adjusted basis.
9
4.1.2.2 Specific electricity production
Unlike PV, CSP only makes use of direct irradiation. The amount of solar resource that hits the solar field
aperture of a CSP system is given by the DNI (direct normal irradiation). Irradiation data was obtained from
EnergyPlus weather data sets (U.S. DOE, 2011). We fed the NREL SAM model (NREL 2010) with the assumed
DNI to thermodynamically model the net electrical energy output of the CSP parabolic trough plant. We
optimized the field sizes via iterative model runs, ultimately choosing the configuration with the lowest LCOE.14
4.2 Assessing the baseline location in 2020 A replication of the base case in 2020 yields two time induced variations. First, the specific investment and
O&M costs of solar technologies decrease due to technical and industry evolution. Second, PV and CSP power
plants are assumed to have storage. Given the high uncertainty around cost estimates based on learning curve
data (Nemet, 2006) we used – where possible – a bottom-up approach to estimate different sources of cost
reduction (Neij, 2008). We considered three types of cost reduction: 1) R&D driven, i.e., technical
improvements, 2) production driven, i.e., component cost reductions through economies of scale and learning-
by-doing, and 3) scaling of power plant size (Sargent and Lundy, 2003). In the case of CSP we separately
analyzed all three types. In the case of PV, R&D and production driven cost reductions were treated on an
aggregate level for data availability reasons and cost reduction through scaling of plant size was not included due
to the high modularity of PV power plants.
As the penetration of solar electricity increases, storage solutions will become ever more important for grid
integration and matching of demand and supply. We modeled a molten salt storage solution in the case of CSP.
For CSP we assumed six hours storage in all locations yielding load factors between 34% and 46%. For PV, a
compressed air energy storage (CAES) is assumed, which is accepted as a low cost and widely available solution
(Fthenakis et al., 2009). For each location we modeled PV CAES plants with six hours storage thus reaching the
same level of electricity quality.15 Since scholars also model CSP plants with more than six hours storage to
approach base load profiles (e.g., Trieb et al., 2011) we, in addition, analyzed CSP and PV power plants with 16
hours storage (see Appendix E).
4.2.1 PV c-Si and PV CdTe including compressed air energy storage
4.2.1.1 Specific cash outflows excluding storage
We modeled future component cost and profit margins on a granular basis and kept the share of project
development and EPC in the total investment cost constant. O&M cost for PV plants was also kept constant in
terms of the annual fraction of the initial investment. Below we outline the methods used to derive PV c-Si and
CdTe module prices as well as inverter and other component prices including R&D and production driven cost
reductions.
We projected 2020 PV c-Si module prices by modeling silicon, silicon to wafer and wafer to module cost and
profit margins16. To calculate future PV CdTe module cost we used First Solar’s cost roadmap including R&D
and production driven cost reduction potentials until 2014. Beyond 2014 we chose a learning curve approach17.
Profit margin assumptions correspond to long-term expected profit margins in 2010 (see 4.1.1).
For both PV c-Si and CdTe, 2020 inverter costs were calculated based on the SMA specific learning curve
observed between 2005 and 2009 assuming long-term expected profit margins. Remaining balance of system
10
cost (BOS) was assumed to develop according to the First Solar technology roadmap until 2014. Thereafter, unit
cost reduction was projected based on a learning rate calculated using prior cost reductions in BOS18. Our overall
PV system costs estimates (c-Si and CdTe) for 2020 appear to occupy a middle ground between more aggressive
(Fthenakis et al., 2009) and more conservative projections (IEA, 2010c).
4.2.1.2 Specific cash outflows CAES
Scholars widely agree that CAES and pumped hydro storage are the lowest cost options for large scale daily
cycle electricity storage (Calaminus, 2010; Hannig et al., 2009; Leonhard W. et al., 2009). Both technologies
are frequently cited as options to store intermittent PV and wind power (e.g., Mason et al., 2008). In this study
we modeled CAES since underground storage capacity (e.g., in caverns) is widely available across the globe
(Calaminus, 2010; Huang et al., 2009; Succar and Williams, 2008; Taylor and Halnes, 2010). Furthermore, we
assumed that in 2020 advanced adiabatic (AA) CAES will be available (RWE, 2010)19. We used cost data on a
component level (turbine, compressor, thermal storage and balance of plant) to model the 2020 cost structure of
AA-CAES (Mason et al., 2008; Pickard et al., 2009). Our estimates are roughly in line with top down
assumptions of AA CAES investment cost (e.g., Zunft et al., 2006).
4.2.1.3 Specific electricity production
To model PV power plants with load factors in the range of CSP plants, we increased the size of the PV field
without increasing the nominal capacity of the total plant. Based on hourly EnergyPlus irradiation data (2010)
we calculated the amount of electricity fed directly into the grid (i.e., up to the nominal capacity) and the amount
which is stored beforehand. To calculate the electricity production of the PV plant the same method as in 4.1.1
was used. For electricity being channeled through storage the CAES efficiency factor was applied in addition.
4.2.2 CSP parabolic trough cost structure including molten salt storage in 2020
4.2.2.1 Specific cash outflows including molten salt storage
As in the case of PV we modeled future component costs on a granular basis and kept the share of project
development and EPC in the total investment cost constant. O&M cost for PV plants was also kept constant in
terms of the annual share of the initial investment. Below we present cost reduction potentials induced by R&D
as well as by production and scaling of plant size.
Regarding R&D driven cost reduction, the most crucial technical lever to reduce cost per watt installed is an
increase in steam cycle temperatures from what is today ~400°C to more than 500°C, which improves solar-to-
electric efficiency. There are two technical pathways available to do so for which prototypes already exist
(Archimede Solar Energy, 2011; Zarza et al., 2004). First, direct steam plants, second, plants in which salt is
used as a heat transfer fluid. Since direct steam plants with storage units are still in an early research phase
(Steinmann and Tamme, 2008) we modeled a molten salt system20. In addition, we assumed that today’s two
tank storage systems are replaced with a one tank thermocline solution further reducing cost per watt installed
(Price et al., 2002).21
Primarily production driven cost reductions in the solar field and the HTF are calculated using a learning curve
approach (Trieb, 2009)22. In contrast to PV, scaling of plant size is a crucial cost reduction lever in the case of
11
CSP parabolic trough plants. The storage unit and the power block in particular benefit from larger plant scales.
We used NREL scaling factors (2010) to model a plant size increase from 50 MW in 2010 to 300 MW in 2020.23
4.2.2.2 Specific electricity production
We used the NREL SAM model (NREL 2010) to calculate the electricity output of a CSP parabolic trough plant
including six hours of molten salt energy storage. An LCOE optimal solar field size was chosen (compare
section 4.1.2).
4.3 Comparative assessment of five locations in 2010 and 2020 Replicating the LCOE analysis for favourable locations (in terms of solar resource) in Spain, Germany, China
and Egypt requires a variation in two input variables: discount rates reflecting local project risks and local
weather conditions.24 We assumed project risks to be the same in Spain, the US and Germany (Salomons and
Grootveld, 2003) and used discount rates recommended by the UNFCCC for energy projects under the CDM in
Egypt and China (UNFCCC, 2010). Local weather data was obtained again from EnergyPlus weather data sets
(U.S. DOE, 2011). Based on this data we calculated location-specific temperature derate factors for PV plants.
CSP solar-to-electric efficiencies are directly influenced by the amount of direct irradiation as well as the latitude
determining the seasonality of irradiation. Therefore, using the NREL SAM model (2010) we iteratively
optimized the solar field size of CSP systems in each location to always assure the lowest LCOE configuration.
4.4 Qualitative assessment of technologies In a first step we selected merit dimensions other than cost using archival as well as interview sources. Based on
the literature reviewed in section 3 (i.e., academic studies, industry reports) and three discussions with solar
industry experts of about one hour each, we compiled seven qualitative merit dimensions: 1) technological
uncertainty, 2) long distance transmission, 3) storage potential, 4) resource bottlenecks, 5) addressable market, 6)
environmental impact and 7) potential for local value creation and employment. We chose these dimensions as
they, according to the literature and industry experts, are or will become relevant for users, investors, technology
providers and policymakers in terms of investment and policy funding. In a second step, we assessed PV c-Si,
PV CdTe and CSP parabolic trough technologies along the above merit dimension using the same sources as in
step one. For each dimension – if possible – the technology with a competitive advantage was selected based on
industry expert knowledge.
5 Results
The results chapter is structured along the four research questions presented in chapter 1. In 5.1-5.3 we compare
the solar LCOE results against the CCGT benchmark. In 5.4 we conclude with the results of the qualitative
assessment.
5.1 Baseline location 2010 Figure 3, showing the LCOE for Daggett-based PV c-Si, PV CdTe and CSP parabolic trough plants in 2010,
yields two key insights. First, compared to the benchmark technology CCGT solar technologies are 80% to
200% more expensive. Second, assuming long-term profit margins of manufacturers the current competitive
12
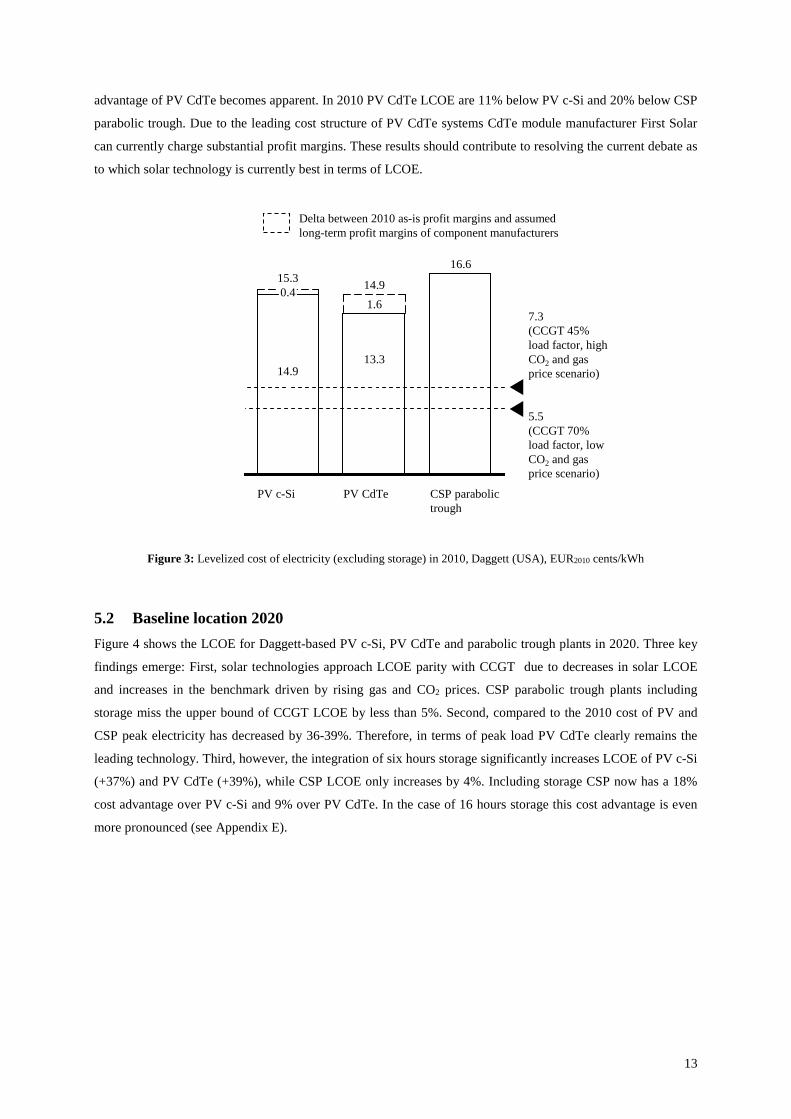
advantage of PV CdTe becomes apparent. In 2010 PV CdTe LCOE are 11% below PV c-Si and 20% below CSP
parabolic trough. Due to the leading cost structure of PV CdTe systems CdTe module manufacturer First Solar
can currently charge substantial profit margins. These results should contribute to resolving the current debate as
to which solar technology is currently best in terms of LCOE.
Figure 3: Levelized cost of electricity (excluding storage) in 2010, Daggett (USA), EUR2010 cents/kWh
5.2 Baseline location 2020 Figure 4 shows the LCOE for Daggett-based PV c-Si, PV CdTe and parabolic trough plants in 2020. Three key
findings emerge: First, solar technologies approach LCOE parity with CCGT due to decreases in solar LCOE
and increases in the benchmark driven by rising gas and CO2 prices. CSP parabolic trough plants including
storage miss the upper bound of CCGT LCOE by less than 5%. Second, compared to the 2010 cost of PV and
CSP peak electricity has decreased by 36-39%. Therefore, in terms of peak load PV CdTe clearly remains the
leading technology. Third, however, the integration of six hours storage significantly increases LCOE of PV c-Si
(+37%) and PV CdTe (+39%), while CSP LCOE only increases by 4%. Including storage CSP now has a 18%
cost advantage over PV c-Si and 9% over PV CdTe. In the case of 16 hours storage this cost advantage is even
more pronounced (see Appendix E).
5.5 (CCGT 70% load factor, low CO2 and gas price scenario)
7.3 (CCGT 45% load factor, highCO2 and gas price scenario)
CSP parabolic trough
16.6
PV CdTe
14.9
13.3
1.6
PV c-Si
15.3
14.9
0.4
Delta between 2010 as-is profit margins and assumed long-term profit margins of component manufacturers
13
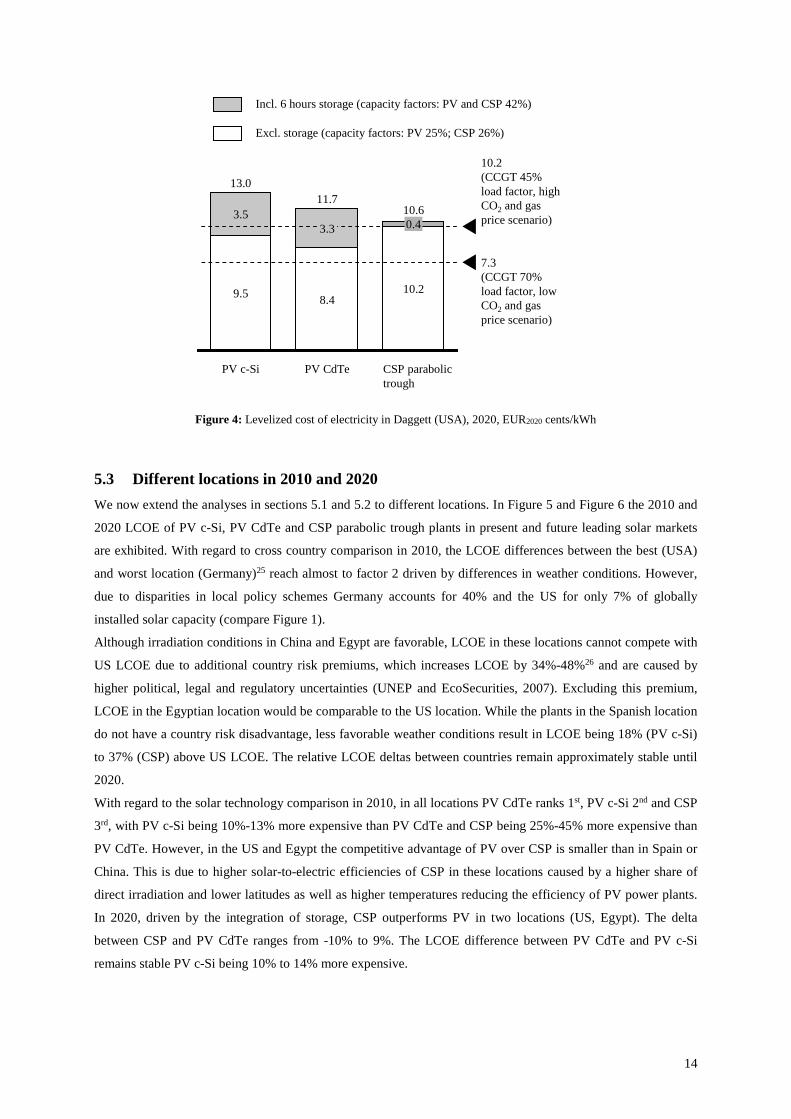
Figure 4: Levelized cost of electricity in Daggett (USA), 2020, EUR2020 cents/kWh
5.3 Different locations in 2010 and 2020 We now extend the analyses in sections 5.1 and 5.2 to different locations. In Figure 5 and Figure 6 the 2010 and
2020 LCOE of PV c-Si, PV CdTe and CSP parabolic trough plants in present and future leading solar markets
are exhibited. With regard to cross country comparison in 2010, the LCOE differences between the best (USA)
and worst location (Germany)25 reach almost to factor 2 driven by differences in weather conditions. However,
due to disparities in local policy schemes Germany accounts for 40% and the US for only 7% of globally
installed solar capacity (compare Figure 1).
Although irradiation conditions in China and Egypt are favorable, LCOE in these locations cannot compete with
US LCOE due to additional country risk premiums, which increases LCOE by 34%-48%26 and are caused by
higher political, legal and regulatory uncertainties (UNEP and EcoSecurities, 2007). Excluding this premium,
LCOE in the Egyptian location would be comparable to the US location. While the plants in the Spanish location
do not have a country risk disadvantage, less favorable weather conditions result in LCOE being 18% (PV c-Si)
to 37% (CSP) above US LCOE. The relative LCOE deltas between countries remain approximately stable until
2020.
With regard to the solar technology comparison in 2010, in all locations PV CdTe ranks 1st, PV c-Si 2nd and CSP
3rd, with PV c-Si being 10%-13% more expensive than PV CdTe and CSP being 25%-45% more expensive than
PV CdTe. However, in the US and Egypt the competitive advantage of PV over CSP is smaller than in Spain or
China. This is due to higher solar-to-electric efficiencies of CSP in these locations caused by a higher share of
direct irradiation and lower latitudes as well as higher temperatures reducing the efficiency of PV power plants.
In 2020, driven by the integration of storage, CSP outperforms PV in two locations (US, Egypt). The delta
between CSP and PV CdTe ranges from -10% to 9%. The LCOE difference between PV CdTe and PV c-Si
remains stable PV c-Si being 10% to 14% more expensive.
7.3 (CCGT 70% load factor, low CO2 and gas price scenario)
10.2 (CCGT 45% load factor, highCO2 and gas price scenario)
CSP parabolic trough
10.6
10.2
0.4
PV CdTe
11.7
8.4
3.3
PV c-Si
13.0
9.5
3.5
Incl. 6 hours storage (capacity factors: PV and CSP 42%)
Excl. storage (capacity factors: PV 25%; CSP 26%)
14
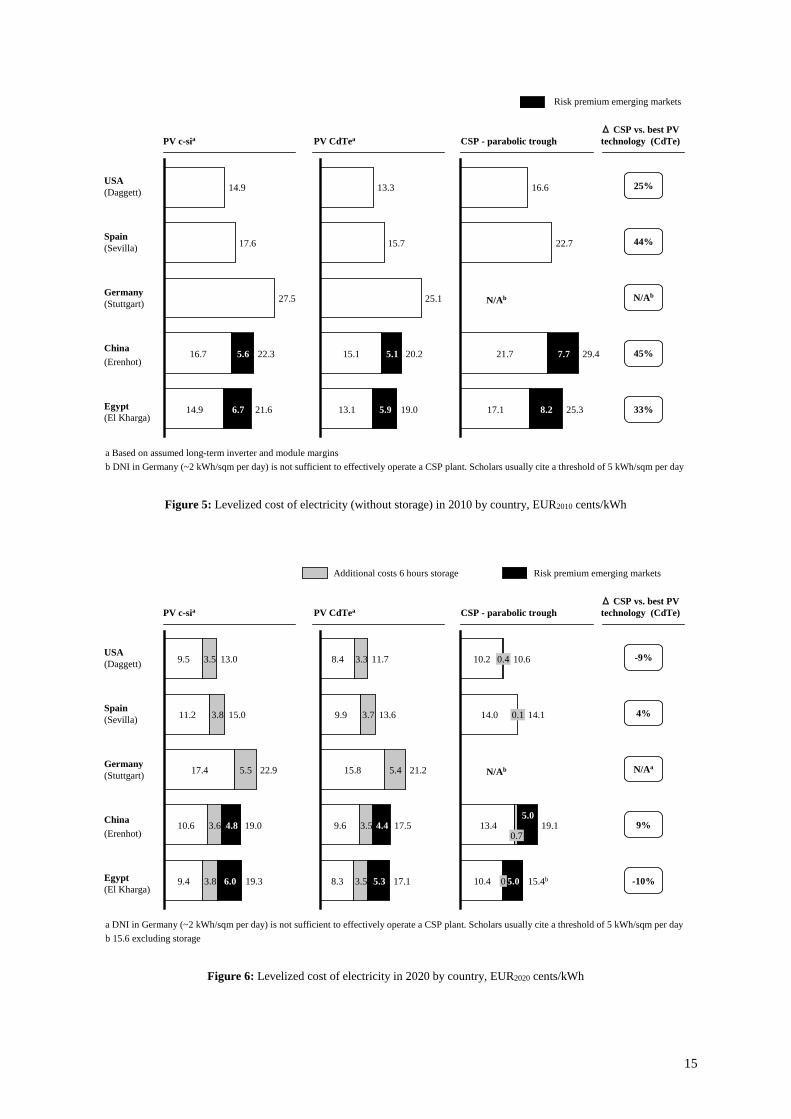
Figure 5: Levelized cost of electricity (without storage) in 2010 by country, EUR2010 cents/kWh
Figure 6: Levelized cost of electricity in 2020 by country, EUR2020 cents/kWh
21.614.9 6.7
22.3
27.5
17.6
5.616.7
14.9
PV c-sia PV CdTea CSP - parabolic trough
USA (Daggett)
Egypt(El Kharga)
Spain (Sevilla)
China (Erenhot)
Risk premium emerging markets
Germany (Stuttgart)
Δ CSP vs. best PV technology (CdTe)
25%
44%
45%
33%
N/Ab
a Based on assumed long-term inverter and module marginsb DNI in Germany (~2 kWh/sqm per day) is not sufficient to effectively operate a CSP plant. Scholars usually cite a threshold of 5 kWh/sqm per day
13.1 19.0
15.1 5.1
25.1
15.7
13.3
5.9
20.2
N/Ab
8.2
29.4
25.3
7.7
17.1
22.7
16.6
21.7
6.0
19.010.6 3.6 4.8
22.917.4 5.5
15.011.2 3.8
13.09.5 3.5
19.39.4 3.8
PV c-sia PV CdTea CSP - parabolic trough
USA (Daggett)
Egypt(El Kharga)
Spain (Sevilla)
China (Erenhot)
Germany (Stuttgart)
Δ CSP vs. best PV technology (CdTe)
N/Ab
13.69.9
3.5 17.18.3
11.78.4
5.415.8
9.6 17.5
5.3
3.7
3.5 4.4
21.2
3.3
0.114.0
0.410.2
15.4b0 5.0
19.10.7
5.0
14.1
10.6
10.4
13.4
-9%
4%
9%
-10%
N/Aa
a DNI in Germany (~2 kWh/sqm per day) is not sufficient to effectively operate a CSP plant. Scholars usually cite a threshold of 5 kWh/sqm per dayb 15.6 excluding storage
Risk premium emerging marketsAdditional costs 6 hours storage
15
Regarding the benchmark with CCGT in 2010, solar technologies in all locations are not yet competitive. This is
illustrated by the fact that even in the US Southwest – the location with the lowest LCOE – (see 5.1) solar power
cannot yet compete with CCGT. Even in geographies with relatively high gas prices such as Europe, the upper
bound of our LCOE calculations remains below 10 EUR cents/kWh. In countries like Egypt which have enacted
fuel subsidies (Wuppertal Institut für Klima Umwelt Energie, 2006) CCGT LCOE are below the US level. In
2020, however, solar LCOE in the US and Spain approach parity with CCGT. While for the US this is already
shown in 5.2, our analyses for Europe yielded a CCGT LCOE band of 8.3 to 12.2 EUR cents/kWh, which is in
the range of solar peak load LCOE in Spain. In Germany, solar LCOE is still clearly above the benchmark. Gas
price forecasts for Egypt and China are not available. Yet even assuming the relatively high European
benchmark, solar LCOE in Egypt and China do not yet reach parity with CCGT.
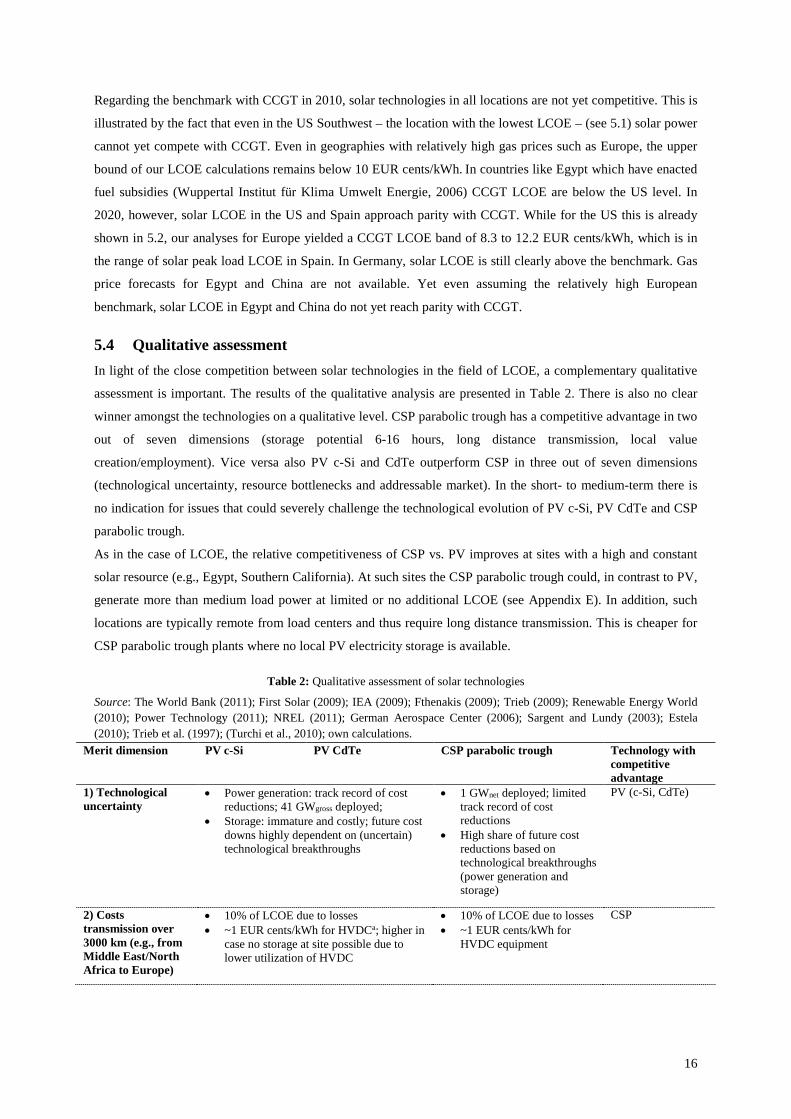
5.4 Qualitative assessment In light of the close competition between solar technologies in the field of LCOE, a complementary qualitative
assessment is important. The results of the qualitative analysis are presented in Table 2. There is also no clear
winner amongst the technologies on a qualitative level. CSP parabolic trough has a competitive advantage in two
out of seven dimensions (storage potential 6-16 hours, long distance transmission, local value
creation/employment). Vice versa also PV c-Si and CdTe outperform CSP in three out of seven dimensions
(technological uncertainty, resource bottlenecks and addressable market). In the short- to medium-term there is
no indication for issues that could severely challenge the technological evolution of PV c-Si, PV CdTe and CSP
parabolic trough.
As in the case of LCOE, the relative competitiveness of CSP vs. PV improves at sites with a high and constant
solar resource (e.g., Egypt, Southern California). At such sites the CSP parabolic trough could, in contrast to PV,
generate more than medium load power at limited or no additional LCOE (see Appendix E). In addition, such
locations are typically remote from load centers and thus require long distance transmission. This is cheaper for
CSP parabolic trough plants where no local PV electricity storage is available.
Table 2: Qualitative assessment of solar technologies
Source: The World Bank (2011); First Solar (2009); IEA (2009); Fthenakis (2009); Trieb (2009); Renewable Energy World (2010); Power Technology (2011); NREL (2011); German Aerospace Center (2006); Sargent and Lundy (2003); Estela (2010); Trieb et al. (1997); (Turchi et al., 2010); own calculations.
Merit dimension PV c-Si PV CdTe CSP parabolic trough Technology with competitive advantage
1) Technological uncertainty
• Power generation: track record of cost reductions; 41 GWgross deployed;
• Storage: immature and costly; future cost downs highly dependent on (uncertain) technological breakthroughs
• 1 GWnet deployed; limited track record of cost reductions
• High share of future cost reductions based on technological breakthroughs (power generation and storage)
PV (c-Si, CdTe)
2) Costs transmission over 3000 km (e.g., from Middle East/North Africa to Europe)
• 10% of LCOE due to losses • ~1 EUR cents/kWh for HVDCa; higher in
case no storage at site possible due to lower utilization of HVDC
• 10% of LCOE due to losses • ~1 EUR cents/kWh for
HVDC equipment
CSP
16
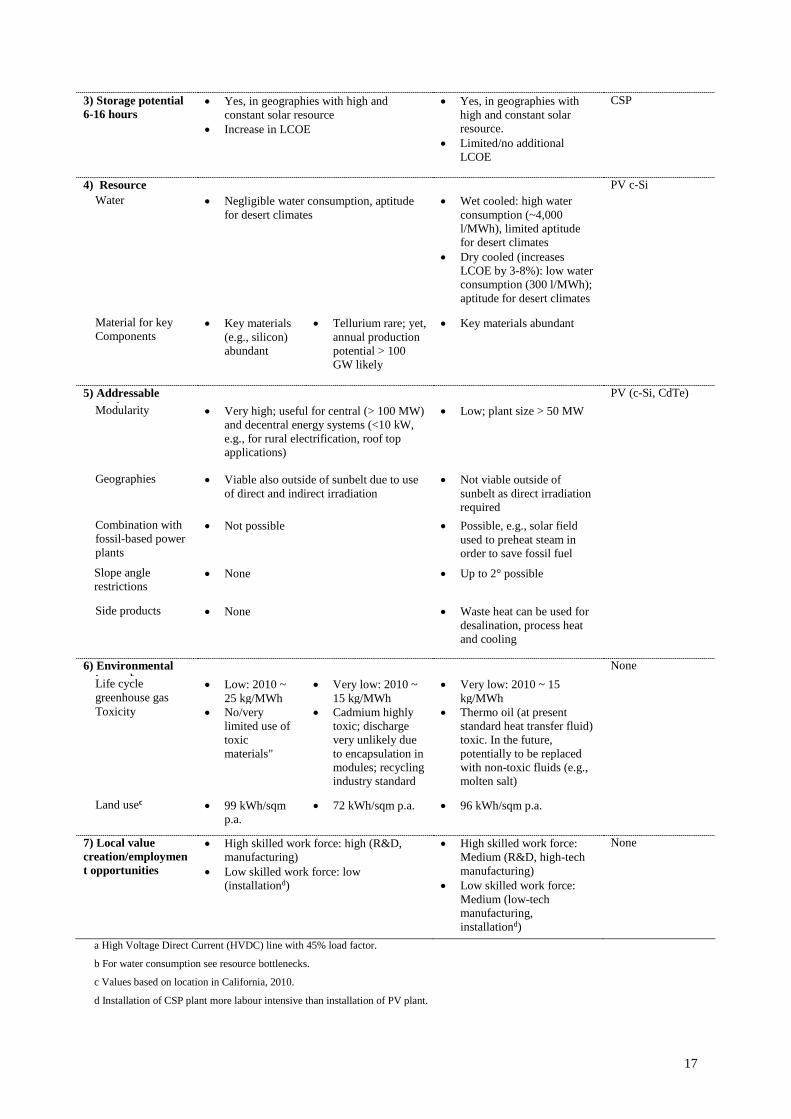
3) Storage potential 6-16 hours
• Yes, in geographies with high and constant solar resource
• Increase in LCOE
• Yes, in geographies with high and constant solar resource.
• Limited/no additional LCOE
CSP
4) Resource
PV c-Si Water • Negligible water consumption, aptitude
for desert climates • Wet cooled: high water
consumption (~4,000 l/MWh), limited aptitude for desert climates
• Dry cooled (increases LCOE by 3-8%): low water consumption (300 l/MWh); aptitude for desert climates
Material for key Components
• Key materials (e.g., silicon) abundant
• Tellurium rare; yet, annual production potential > 100 GW likely
• Key materials abundant
5) Addressable k
PV (c-Si, CdTe) Modularity • Very high; useful for central (> 100 MW)
and decentral energy systems (<10 kW, e.g., for rural electrification, roof top applications)
• Low; plant size > 50 MW
Geographies • Viable also outside of sunbelt due to use of direct and indirect irradiation
• Not viable outside of sunbelt as direct irradiation required
Combination with fossil-based power plants
• Not possible • Possible, e.g., solar field used to preheat steam in order to save fossil fuel
Slope angle restrictions
• None • Up to 2° possible
Side products • None • Waste heat can be used for desalination, process heat and cooling
6) Environmental i tb
None Life cycle greenhouse gas
• Low: 2010 ~ 25 kg/MWh
• Very low: 2010 ~ 15 kg/MWh
• Very low: 2010 ~ 15 kg/MWh
Toxicity • No/very limited use of toxic materials"
• Cadmium highly toxic; discharge very unlikely due to encapsulation in modules; recycling industry standard
• Thermo oil (at present standard heat transfer fluid) toxic. In the future, potentially to be replaced with non-toxic fluids (e.g., molten salt)
Land usec • 99 kWh/sqm p.a.
• 72 kWh/sqm p.a. • 96 kWh/sqm p.a.
7) Local value creation/employment opportunities
• High skilled work force: high (R&D, manufacturing)
• Low skilled work force: low (installationd)
• High skilled work force: Medium (R&D, high-tech manufacturing)
• Low skilled work force: Medium (low-tech manufacturing, installationd)
None
a High Voltage Direct Current (HVDC) line with 45% load factor.
b For water consumption see resource bottlenecks.
c Values based on location in California, 2010.
d Installation of CSP plant more labour intensive than installation of PV plant.
17
6 Policy implications
Solar power technologies will have to become a major pillar in the world’s future energy system to mitigate
environmental problems such as resource scarcity and climate change. However, large-scale solar technologies
cannot yet compete with fossil-fired electricity generation technologies. Thus, in order to foster and exploit the
‘solar option’ smart policy action on global and national levels is required. Essentially, four aspects must be
addressed that relate to the main variables analyzed above. First, further policy support should incentivize
innovators to exploit the technology-specific learning potentials in the field of PV and CSP technologies.
Second, capitalizing on the solar resource available in sunbelt countries is crucial in order to efficiently deploy
large-scale solar technologies. Third, policymakers can increase the efficiency of policy support by incentivizing
investors and technology providers to exploit location-specific strengths of PV and CSP technologies. Fourth,
due to the substantial cost, which is still involved in supporting these technologies at present, policymakers need
to assess whether there are strategic co-benefits that enhance the political feasibility and stability of such support.
Below, we discuss these four dimensions by relying on the quantitative and qualitative results obtained. This
allows us to provide policy recommendations on how to unleash the potential of solar power.
6.1 Improving solar power technologies Our analyses show that solar power technologies in the US and Spain are likely to approach competitiveness
with fossil-fired generation by around 2020. Hence, policy support will be indispensable until at least 2020 for
enabling innovation and deployment in the field of solar technologies. This will involve the creation of markets
(e.g., via feed-in tariffs) as well as public R&D funding. The results of our study also underscore the fact that a
dominant design in the field of solar power technologies is not yet emerging: In 2020 the LCOE of different
solar technologies are rather close and their absolute levels are subject to technological uncertainty. Also the
qualitative assessment does not yield a technology with a clear competitive advantage. For the policymaker this
implies a need to maintain and develop a variety of technologies, otherwise the risk of picking the “wrong”
design as a winner increases.
Moreover, the policymaker should account for varying improvement potentials by technology, which implies the
need for tailoring policy schemes to specific technologies. Regarding LCOE reduction we pointed out the three
principal potentials: R&D driven, production driven and scaling of power plant size. We show that in the case of
CSP the scaling of plant size from 50 MW to 300 MW and R&D efforts targeting technological breakthroughs
are crucial to reduce LCOE. Hence, policymakers should – unlike in the Spanish feed-in tariff regime – enable
and incentivize large plant sizes. In addition, public R&D funding is important to support the high risk, high
return R&D projects which contribute to technological breakthroughs. While our analysis indicates that the
scaling of PV power plants beyond 50 MW has little effect on LCOE, R&D efforts and the scaling of production
reduces LCOE. Finding an adequate balance between public R&D funding and deployment policies such as
feed-in tariffs and designing more efficient deployment policy schemes in terms of innovation effect are the key
challenges for policymaking in this context (Peters et al., 2011). In addition, the increasing share of solar and
other intermittent renewable electricity calls for action: Policymakers ought to intensify policy support for
storage and demand side management technologies, as well as enact regulations which simplify and incentivize
the integration of such technologies into the grid, for example, dedicated public R&D funding for smart grid
technologies and a feed-in tariff premium for stored electricity.
18
6.2 Efficiently deploying large-scale solar technologies by capitalizing on the solar
resource Our results clearly indicate that the location variables solar irradiation, discount rate and fuel prices heavily
influence the competitiveness of solar power compared to a market benchmark. We show that the
competitiveness of solar technologies is best in developed countries with a good solar resource and high fossil-
fuel prices. Therefore, deploying solar power in the Southwest of the US or Spain is significantly more efficient
than in Germany as it causes lower costs to society. In this respect the current distribution of installed PV
capacity presented in 2.1 is highly suboptimal. Our 2010 LCOE results imply that in Germany the required feed-
in tariff per kWh is around three times higher than in the Southwest of the US. While in the past in particular
solar feed-in tariffs in Germany triggered the flourishing of the global PV market, in the years to come countries
with an attractive solar resource should ideally drive the deployment of large-scale solar technologies.
Our analyses point out that relatively high discount rates and fuel subsidies put solar technologies at a significant
disadvantage in emerging economies such as Egypt – despite their substantial solar resource. If these countries
aim to develop a green growth strategy (Project Catalyst, 2010), for example under the UNFCCC, several levers
could be pulled to increase the attractiveness of solar technologies. Our analyses indicate for example that
excluding country risk premiums solar LCOE in Egypt would be comparable to the level in the US Southwest.
Thus, policymakers should focus on reducing or taking over project risks in emerging countries in order to
improve LCOE. Governments of emerging economies could act as investors themselves as illustrated by the
Chinese state, employ governmental low-interest loans and provide state guarantees in combination with an
international insurance for long-term power purchase agreements (Trieb et al., 2011). A second important lever
is the gradual removal of fossil fuel subsidies, which is however an intricate endeavor. All these activities could
be internationally supported, e.g. via the Clean Technology Fund of the World Bank or the Green Climate Fund
established under the UNFCCC. Also bilateral support from developed countries is conceivable. For some
developed countries with a limited solar resource there is a particular rationale to provide financing as they could
import solar electricity from emerging economies in the sunbelt (e.g., within the scope of the Desertec project).
6.3 Exploiting location-specific strengths of PV and CSP technologies For policymakers an understanding of the location-specific strengths of different solar technologies is key in
order to focus on the most competitive technology for the respective location. In this context, three key findings
emerge from our research. First, in locations with a relatively high share of diffuse irradiation, medium average
temperature and a latitude of above 35 degrees such as Spain and Inner Mongolia in China our research suggests
that policymakers and investors should focus on PV technologies. Second, locations with a high share of DNI,
high temperatures and low latitude such as the Southwest of the US or Egypt are relatively favourable for CSP.
In 2020 CSP is more competitive than PV in such locations if storage is included in plants. In addition, our
research indicates CSP, in contrast to PV, can offer storage at no or only very limited additional costs in such
locations. Hence, in these geographies CSP should account for a substantial share in the solar portfolio.
However, water scarcity in the Southwest of the US and in North Africa could require CSP plants to be air-
cooled, increasing LCOE by around 3-8% vs. wet-cooled systems (Turchi et al., 2010). Third, the choice of solar
technology depends on the value of storage at a specific location. If solar power is deployed in a market with a
low share of intermittent electricity where storage is not yet required PV is more attractive than CSP due its
19
lower peak load LCOE. If the share of intermittent electricity, however, is high and thus storage is valuable CSP
gains a competitive edge due to its limited LCOE increase due to storage.
6.4 Strategic search for co-benefits to increase political feasibility of solar power To lead solar technologies towards competitiveness significant policy support is still needed, which will be paid
for society. Therefore, political feasibility of solar support plans might be limited due to public acceptance
issues. The results of our qualitative assessment are helpful in deriving three strategic co-benefits, which could
increase the political feasibility of solar power. First, the diffusion of solar technologies in a country has the
potential to offer local value creation and employment opportunities in R&D, manufacturing and installation. To
exploit this potential a country should consider its specific competences when selecting a solar design. For
example, if labor in a country is rather low skilled and low cost, CSP could offer more local value creation and
employment opportunities than PV since CSP is more labor intensive and requires a less skilled workforce than
in the case of PV. If a country lacks key competencies to establish a successful domestic industry in the field of
PV or CSP, it could strive for acquiring such competencies through, e.g., funding public R&D or other capacity-
building measures before investing significant funds in market creation. If successful, such strategies could allow
a country to increase local value creation.
Second, solar power cannot only be deployed centrally in large-scale plants, but -in the case of PV- also in
highly modular decentral generation units. It is widely accepted that in the emerging and least developed
countries rural electrification can significantly contribute to economic development. As a result, in such
countries policymakers should not exclusively focus on large-scale applications but also on rural electrification
to generate ‘high value’ electricity.
Third, on an international level policymakers could strive for finding synergies between industrial strategies. The
Desertec project is potentially a prominent example for bilateral synergies in this context. European states are
likely to pay the majority of policy support needed to realize the project. This ’investment’ translates into
business for the companies in the Desertec consortia. In addition, Europe benefits from excellent irradiation
conditions and low labor cost in the Middle East North Africa (MENA) region. Conversely, MENA states will
gain from additional power supply, local value creation and employment. On the multilateral level, i.e.,
especially within the UNFCCC discussions, countries should develop roadmaps for the diffusion of solar
technologies, reflecting their specific situation regarding natural resources, and social and techno-economic
aspects. International institutions such as the Technology Executive Group or the Green Climate Fund, which are
to be founded according to the Cancun agreement, should then coordinate and in the case of non-OECD
countries financially support these activities.
7 Conclusion
This paper addressed a gap in the current discussions on the potential role of solar power technology in the
world’s energy systems by providing a comparative assessment of the three leading large-scale solar
technologies in 2010 and 2020 as well as for different locations. We show that today these technologies cannot
yet compete with conventional forms of power generation but approach competitiveness around 2020 in
favourable locations. In addition, we find that none of the solar technologies emerges as a clear winner and that
costs of storing energy differs by technology and can change the order of competitiveness in some instances.
20
Importantly, the competitiveness of the different technologies varies considerably across locations due to
differences in, e.g., solar resource and discount rates.
Based on these results we derive four policy implications. First, policy support should facilitate the
implementation of cost reduction levers and enable the integration of solar technologies on a system level.
Second, policymakers ought to increase the efficiency of policy support by particularly fostering solar market
growth in countries with an attractive solar resource. Third, the exploitation of location-specific strengths of PV
and CSP technologies could further increase the efficiency of policy support. Lastly, policymakers need to
leverage strategic co-benefits of solar power deployment in order to enhance the political feasibility and stability
of policy support.
In order to further refine policy recommendations, some areas for future research are especially promising.
Policymakers need to be assisted by coming up with more precise advice on which policy mixes are most
warranted to improve the different technologies, which are subject to different underlying learning mechanisms.
In addition, while this study has shed light on the competitiveness of typical solar power plant projects, more
detailed analyses of the total potential for these technologies in different countries are required. Lastly, future
research should support policymakers in exploiting this potential by evaluating in more detail the needs for
accompanying measures in the areas of storage and grid management.
21
References Archimede Solar Energy, 2011. Company Presentation, Massa Martana,
http://www.ice.gov.it/sedi/umbria/energia/angelantoni/Archimede%20Company%20Profile.pdf.
Bagnall, D.M., Boreland, M., 2008. Photovoltaic technologies. Energy Policy 36, 4390-4396.
Bloomberg New Energy Finance, 2011. Sun sets on oil for sun power generation, http://www.bnef.com/free-
publications/white-papers/.
Brabec, C.J., Sariciftci, S.N., 2001. Recent Developments in Conjugated Polymer Based Plastic Solar Cells.
Monatshefte für Chemie / Chemical Monthly 132, 421-431.
Calaminus, B., 2010. Perspectives on the role(s) of storage seen from a German utility. ENBW, Düsseldorf,
http://www.cedren.no/LinkClick.aspx?fileticket=1nZD6bjxGNU%3D&tabid=3597.
California Public Utilities Commission, 2011. Market Price Referent,
http://www.cpuc.ca.gov/PUC/energy/Renewables/mpr.
Cohen, G., 2008. Nevada Solar One - Case Study, CSP Today Conference, San Francisco.
CSP Today, 2010. The Concentrated Solar Power Markets Report - Free Selected Findings.
Del Río González, P., 2008. Ten years of renewable electricity policies in Spain: An analysis of successive feed-
in tariff reforms. Energy Policy 36, 2917-2929.
Emerging Energy Research, 2010. Global concentrated solar power markets and strategies: 2010-2025,
Cambridge, MA, http://www.emerging-
energy.com/uploadDocs/GlobalConcentratedSolarPowerMarketsandStrategies2010.pdf.
Energy Information Administration, 2010. International Energy Outlook 2010. U.S. Department of Energy.
EPIA, 2004. EPIA Roadmap, Brussels.
EPIA, 2010a. Global market outlook for photovoltaics until 2014. EPIA, Brussels.
EPIA, 2010b. Unlocking the sunbelt potential of photovoltaics (second edition), Brussels.
Estela, 2010. Solar Thermal Electricity 2025: Clean electricity on demand: attractive STE cost stabilize energy
production.
European Commission, 2007. Concentrating Solar Power - From Research to Implementation, Luxembourg.
European Commission, 2008. Energy Sources, Production Costs and Performance of Technologies for Power
Generation, Heating and Transport, Brussels.
22
European Commission, 2010. Reference Plants in the NER 300 process - Meeting with Member States
10th January 2010, http://ec.europa.eu/clima/funding/ner300/docs/presentation_en.pdf.
Eurostat, 2010. HICP (2005=100) - Monthly data (annual rate of change). Eurostat.
Ferrostaal, 2009. Solar thermal power Unlimited resources. Ferrostaal, Essen,
http://www.ferrostaal.com/uploads/tx_mfsmatrix/110107_FST_Brosch_Solar_GB_secured.pdf.
First Solar, 2009. Analyst/Investor Meeting June 24, 2009, Las Vegas, http://phx.corporate-
ir.net/External.File?item=UGFyZW50SUQ9OTA4M3xDaGlsZElEPS0xfFR5cGU9Mw==&t=1.
First Solar, 2010a. Q1 2010 Earnings Call, http://investor.firstsolar.com/events.cfm.
First Solar, 2010b. Q2 2010 Earnings Call, http://investor.firstsolar.com/events.cfm.
Fisher, I., 1930. The theory of interest as determined by impatience to spend income and opportunity to invest it.
Macmillan, New York.
Fthenakis, V., 2009. Sustainability of photovoltaics: The case for thin-film solar cells. Renewable and
Sustainable Energy Reviews 13, 2746-2750.
Fthenakis, V., Mason, J.E., Zweibel, K., 2009. The technical, geographical, and economic feasibility for solar
energy to supply the energy needs of the US. Energy Policy 37, 387-399.
Galiana, I., Green, C., 2009. Let the global technology race begin. Nature 462, 570-571.
Gatzen, C., 2005. Nutzung und Potentiale von Speichertechnologien, MEX V Abschlussworkshop. EWI, Bonn.
Gerbert, P., Rubel, H., 2009. Solar Storm - navigating Through the Turbukence to Reap Value in Solar Energy.
German Aerospace Center, 2006. Trans-Mediterranean Interconnection for Concentrating Solar Power. German
Aerospace Center, Stuttgart.
Graetzel, M., 2001. Photoelectrochemical cells. Nature 414, 338-344.
Green, M., 2006. Third-Generation Photovoltaics: Advanced Solar Energy Conversion. Springer, Berlin.
Haase, C., Podewils, C., 2011. Schwachlichtverhalten zählt, Photon, pp. 52-61.
Hannig, F., Smolinka, T., Bretschneider, P., Nicolai, S., Krüger, S., Meißner, F., Voigt, M., 2009. Stand und
Entwicklungspotenzial der Speichertechniken für Elektroenergie – Ableitung von Anforderungen an und
Auswirkungen auf die Investitionsgüterindustrie. BMWi.
23
Huang, X., Yang, C., Li, Y., 2009. Discussion on Underground Energy Storage in Salt Cavern and Its Tightness
Evaluation Method, Proceedings of 2009 International Conference on Management Science and
Engineering, Beijing.
IEA, 2009. Renewable Energy Essentials: Concentrating Solar Thermal Power, Paris.
IEA, 2010a. Renewable Energy Technology Roadmaps, Paris.
IEA, 2010b. Technology Roadmap - Concentrating Solar Power, Paris.
IEA, 2010c. Technology Roadmap - Solar photovoltaic energy, Paris.
IEA, 2010d. World Energy Outlook 2010, Paris.
Izquierdo, S., Montañés, C., Dopazo, C., Fueyo, N., 2010. Analysis of CSP plants for the definition of energy
policies: The influence on electricity cost of solar multiples, capacity factors and energy storage. Energy
Policy 38, 6215-6221.
Jacobson, M.Z., 2009. Review of solutions to global warming, air pollution, and energy security. Energy &
Environmental Science 2, 148-173.
Joint Research Centre European Commission, 2011. PVGIS Solar Irradiation Data,
http://re.jrc.ec.europa.eu/pvgis/apps/radmonth.php?lang=en&map=europe.
Jordan, D.C., Smith, R.M., Osterwald, C.R., Gelak, E., Kurtz, S.R., 2010. Outdoor PV Degradation Comparison.
NREL, Golden, CO.
Kaltschmitt, M., Wiese, A., Streicher, W., 2007. Renewable energy technology, economics and environment.
Springer, Berlin.
Kost, C., Schlegl, T., 2010. Studie Stromgestehungskosten Erneuerbare Energien. Fraunhofer ISE.
Landesbank Baden-Württemberg, 2009. Solardarwinismus - die Besten bleiben... Stuttgart.
Leonhard W., Buenger U., Crotogino F., Gatzen Ch., Glaunsinger W., Huebner S., Kleimaier M., Koenemund
M., Landinger H., Lebioda T., Sauer D. U., Weber H., Wenzel A., Wolf E., Woyke W., Zunft S., 2009.
Energiespeicher in Stromversorgungssystemen mit hohem Anteil erneuerbarer Energieträger. Verband der
Elektrotechnik, Elektronik und Informationstechnik (VDE), Frankfurt a.M.
Mason, J., Fthenakis, V., Zweibel, K., Hansen, T., Nikolakakis, T., 2008. Coupling PV and CAES power plants
to transform intermittent PV electricity into a dispatchable electricity source. Progress in Photovoltaics:
Research and Applications 16, 649-668.
Mason, N.B., 2007. Industry Developments that Sustain the Growth of Crystalline Silicon PV Output,
Photovoltaic Science, Applications & Technology Conference, Durham.
24
McKinsey & Company, 2007. Kosten und Potenziale der Vermeidung von Treibhausgasen in Deutschland -
Sektorperspektive Energie.
Meteotest, 2010. METEONORM: Global Meteorological Database for Engineers, Planners and Education.
Meteotest, Berne, http://www.meteonorm.com/pages/en/meteonorm.php?lang=EN.
Neij, L., 2008. Cost development of future technologies for power generation--A study based on experience
curves and complementary bottom-up assessments. Energy Policy 36, 2200-2211.
Nemet, G.F., 2006. Beyond the learning curve: factors influencing cost reductions in photovoltaics. Energy
Policy 34, 3218-3232.
NREL, 2010. System Advisor Model - Version 2010.11.9, https://www.nrel.gov/analysis/sam/.
NREL, 2011. Parabolic Trough FAQs, http://www.nrel.gov/csp/troughnet/faqs.html#water.
Peters, M., Schneider, M., Griesshaber, T., Hoffmann, V.H., 2011. The Quest for Adequate Technology-Push
and Demand-Pull Policies: Country-Level Spillovers and Incentives for Non-Incremental Innovation"
Working Paper SSRN.
Photon, 2010. Von wegen Krise, Photon. Photon Europe, Aachen.
Pickard, W.F., Hansing, N.J., Shen, A.Q., 2009. Can large-scale advanced-adiabatic compressed air energy
storage be justified economically in an age of sustainable energy? Journal of Renewable and Sustainable
Energy 1, 033102.
Pitz-Paal, R., Dersch, J., Milow, B., Ferriere, A., Romero, M., Tellez, F., Steinfeld, A., Langnickel, U., Shpilrain,
E., Popel, O., Epstein, M., Karni, J., 2005. ECOSTAR Road Map Document.
Power Technology, 2011. Solar One Concentrated Solar Power (CSP) Plant, Nevada, USA, http://www.power-
technology.com/projects/solaronesolar/.
Price, H., Lupfert, E., Kearney, D., Zarza, E., Cohen, G., Gee, R., Mahoney, R., 2002. Advances in Parabolic
Trough Solar Power Technology. Journal of Solar Energy Engineering 124, 109-125.
PricewaterhouseCoopers, 2010. 100% renewable electricity - a roadmap to 2050 for Europe and North Africa.
Project Catalyst, 2010. From Climate Finance to Financing Green Growth - Briefing Paper.
Purohit, I., Purohit, P., 2010. Techno-economic evaluation of concentrating solar power generation in India.
Energy Policy 38, 3015-3029.
Quaschning, V., 2004. Technical and economical system comparison of photovoltaic and concentrating solar
thermal power systems depending on annual global irradiation. Solar Energy 77, 171-178.
25
REN21, 2010. Renewables 2010 Global Status Report. REN21 Secretariat, Paris.
Renewable Energy World, 2010. America's Largest PV Power Plant Is Now Live, Renewable Energy World.
Rubin, E.S., Yeh, S., Antes, M., Berkenpas, M., Davison, J., 2007. Use of experience curves to estimate the
future cost of power plants with CO2 capture. International Journal of Greenhouse Gas Control 1, 188-197.
RWE, 2010. Adele – Adiabatic Compressed-Air Energy Storage For Electricity Supply, Essen.
Salomons, R., Grootveld, H., 2003. The equity risk premium: emerging vs. developed markets. Emerging
Markets Review 4, 121-144.
Sarasin, 2010. Solarwirtschaft - unterwegs in neue Dimensionen, Basel.
Sargent and Lundy, 2003. Assessment of Parabolic Trough and Power Tower Solar Technology Cost and
Performance Forecasts.
SMA, 2010. Quartalsfinanzbericht Januar bis März 2010, http://www.sma.de/de/investor-
relations/publikationen/finanzberichte.html.
Solar Millennium, 2008. The parabolic trough power plants Andasol 1 to 3, Erlangen,
http://www.solarmillennium.de/upload/Download/Technologie/eng/Andasol1-3engl.pdf.
Solarbuzz, 2011. Solarbuzz Reports World Solar Photovoltaic Market Grew to 18.2 Gigawatts in 2010, Up 139%
Y/Y, San Francisco, http://solarbuzz.com/our-research/recent-findings/solarbuzz-reports-world-solar-
photovoltaic-market-grew-182-gigawatts-20.
Steinmann, W.-D., Tamme, R., 2008. Latent Heat Storage for Solar Steam Systems. Journal of Solar Energy
Engineering 130, 011004-011005.
Strategies-Unlimited, 2003. Photovoltaic five-year market forecast, 2002-2007, Technical Report PM-52.
Succar, S., Williams, R.H., 2008. Compressed Air Energy Storage: Theory, Resources, And Applications For
Wind Power. Princeton University, Princeton.
Sunpower Corporation, 2008. The drivers of the Levelized Cost of electricity for Utility-Scale Photovoltaics,
http://fr.sunpowercorp.be/downloads/SunPower_levelized_cost_of_electricity.pdf.
Suntech Power, 2010. Suntech Power - A Solar Leader: First Quarter 2010, http://ir.suntech-
power.com/phoenix.zhtml?c=192654&p=irol-reportsOther.
Suntech Power, 2011. STP280 - 24/Vd polycrystalline solar module, data sheet, http://am.suntech-
power.com/images/stories/pdf/datasheets/2011/STP280_24Vd_UL.pdf.
Taylor, J., Halnes, A., 2010. Analysis of Compressed Air Energy Storage, PCIC Europe 2010, Oslo.
26
The World Bank, 2011. Middle East and North Africa Region Assessment of the Local Manufacturing Potential
for Concentrated Solar Power (CSP) Projects Washington, D.C.
Trieb, F., 2009. Characterisation of Solar Electricity Import Corridors from MENA to Europe: Potentials,
Infrastructure, and Cost. German Aerospace Center Instituteof Technical Thermodynamics, Stuttgart,
Germany.
Trieb, F., Langni, O., Klai, H., 1997. Solar electricity generation--A comparative view of technologies, costs and
environmental impact. Solar Energy 59, 89-99.
Trieb, F., Müller-Steinhagen, H., Kern, J., 2011. Financing concentrating solar power in the Middle East and
North Africa - Subsidy or investment? 39, 307-317.
Turchi, C.S., Wagner, M.J., Kutscher, C.F., 2010. Water Use in Parabolic Trough Power Plants: Summary
Results from Worley Parsons' Analyses NREL, Golden, Colorado.
Tushman, M.L., Rosenkopf, L., 1992. Organizational Determinants of Technological-Change - toward a
Sociology of Technological Evolution. Research in Organizational Behavior 14, 311-347.
U.S. DOE, 2011. EnergyPlus: Weather data,
http://apps1.eere.energy.gov/buildings/energyplus/cfm/weather_data.cfm.
Ummel, K., Wheeler, D., 2008. Desert Power: The Economics of Solar Thermal Electricity for Europe, North
Africa, and the Middle East. SSRN eLibrary.
UNEP and EcoSecurities, 2007. Guidebook to Financing CDM Projects. UNEP.
UNFCCC, 2010. Draft Revision to the Guidelines on the Assessment of Investment Analysis. United Nations
Framework Convention on Climate Change.
Wuppertal Institut für Klima Umwelt Energie, 2006. Promoting Renewable Energy Technologies in Developing
Countries through the CLean Development Mechanism. for the German Federal Environmental Agency,
Wuppertal, Germany.
Yingli Green Energy, 2011. Yingli Green Energy Reports Fourth Quarter and Full Year 2010 Results,
http://ir.yinglisolar.com/preview/phoenix.zhtml?c=213018&p=irol-newsArticle&ID=1530462&highlight=.
Zarza, E., Valenzuela, L., León, J., Hennecke, K., Eck, M., Weyers, H.D., Eickhoff, M., 2004. Direct steam
generation in parabolic troughs: Final results and conclusions of the DISS project. Energy 29, 635-644.
Zunft, S., Jakiel, C., Koller, M., Bullough, C., 2006. Adiabatic Compressed Air Energy Storage for the Grid
Integration of Wind Power Sixth International Workshop on Large-Scale Integration of Wind Power and
Transmission Networks for Offshore Windfarms, Delft.
27
Notes 1 2007, excluding storage, California. 2 Excluding storage. 3 There are two types of c-Si multicrystalline and monocrystalline. As multicyrstalline has the higher market
share our analysis is based on multicrystalline silicon. 4 We focused on large-scale solar power plants for two reasons. First, as CSP plants are of large scale1 it
allows for a fair comparison between CSP and PV technologies. Second, in 2010 “the trend toward large-
scale PV plants continued around the globe” (REN21, 2010, p.19). 5 A salvage value of 0 is assumed at the end of a plant’s lifetime; potential LCOE reduction effects of carbon
credits are not included since a CO2 price is already reflected in the benchmark technology. 6 It is assumed that electricity consumed at site is covered by electricity produced at site and not by purchased
electricity. 7 When comparing solar technologies with the benchmark two aspects should be considered. First, the quality
of CCGT electricity is higher than of any solar technology: CCGT can offer full load at any time of the year
while solar plants with storage at most locations are at times – particularly during the winter months – not
capable of operating at full load. Second, however, LCOE of CCGT plants heavily depends on fuel and CO2
price developments and hence is more uncertain. 8 Engineering, procurement and construction. 9 Differences between PV net and gross values are particularly driven by soiling and inverter losses. 10 This particularly allows for the reflection of significant profit margin differences between PV c-Si and CdTe
modules, thus better reflecting the intrinsic LCOE performance of PV c-Si and CdTe. 11 Irradiation data was obtained from EnergyPlus weather data sets (U.S. DOE, 2011). It provides TMY (typical
meteorological year) weather data with an hourly resolution for more than 2100 locations worldwide. Data is
either based on long-term ground measurement or on satellite derived data in combination with ground
measurement. We cross-checked irradiation data for our locations with specific project data (Cohen, 2008;
Solar Millennium, 2008) and alternative meteorological data (Joint Research Centre European Commission,
2011; Meteotest, 2010). Deviations were below 15%. 12 The temperature within PV modules can account for performance variations of more than 10%. 13 As there is hardly any information on profit margins in the CSP industry available we do not model profit
margins separately as in the case of PV. However, we assume that implicit component profit margins in the
NREL data are rather on the low end given that CSP in the US faces significant competition from other
power technologies such as wind and PV. 14 “SAM is based on an hourly simulation engine that interacts with performance, cost, and finance models to
calculate energy output, energy costs, and cash flows.” (https://www.nrel.gov/analysis/sam/). In the case of
CSP plants the SAM performance model also considers thermodynamic parameters. For each location (USA,
Egypt, China and Spain) we integrated EnergyPlus weather data in the model and specified the type of
storage (no storage, six hours storage). We then iteratively optimized the solar field to generate the LCOE
optimal plant design. 15 As we do not model a CSP plant in Germany, we assumed the Spanish load factor (34%) for the PV plant in
Germany.
28
16 Silicon cost estimates are based on a medium-term forecast by LBBW (2009). Specific silicon utilization per
watt is projected by accounting for higher efficiencies, thinner wafers and reduction in kerf loss (Mason,
2007). Silicon to wafer cost and wafer to module costs are forecasted by applying a typical PV c-Si learning
rate. 17 Based on 2005-2009 First Solar production data we computed a PV CdTe module learning rate, which we
used to estimate cost reductions between 2014 and 2020. 18 In addition, BOS cost reductions driven by increases in module efficiency are considered. 19 Compared to today’s diabatic CAES technology this solution is likely to need no gas firing and round cycle
efficiencies are significantly higher. 20 Further technical measures include front surface mirrors, which improve the optical efficiency of the solar
field. Overall, we assumed a solar-to-electric efficiency increase to 19% in the baseline location (see also
Table B.3). 21 A single tank storage energy system, which uses a low-cost filler material to replace the more expensive
molten salt (35% cost reductionreal). Using molten salt has further positive and negative effects on investment
costs, which we assume to offset each other. On the one hand such systems offer additional cost reduction
potentials since less molten salt is needed due to higher temperatures and heat exchangers can be displaced.
On the other hand, higher temperatures could require the use of more costly materials and O&M costs could
increase as at times gas firing might be needed to prevent molten salt from freezing in the receiver tubes. 22 For the HTF and the solar field a 10 % learning ratereal is assumed; for the power block a constant annual unit
cost reduction of 2% is assumed as cost reductionsreal for steam power blocks are rather driven by
developments of conventional electricity technology. 23 The scaling effect is calculated as follows: (baseline plant cost) x (project plant size / baseline plant
size)^(scaling factor); assumed scaling factors: solar field (1), except civil work (0.9), power block (0.8),
HTF (0.9) except solar field piping and HTF fluid (1), storage (0.8) except storage fluid (1). 24 In addition, construction and project development cost differ between locations as they are dependent on
local labour and permitting cost. However, as these costs are below 20% of the total PV and CSP system
prices we assumed these costs to be the same across all locations (NREL, 2010). 25 Feed- in tariffs for large-scale open-space PV power plants ranged between 25.4 and 24.3 EUR cents/kWh in
2010. While this is below the c-Si LCOE value in Figure 5, a market for such installations still existed since
investors accepted an unleveraged internal rate below 8%. 26 The risk premium in China relates to private investments. State investments or investments being backed by
the state, a common practice in China, will have a lower risk premium. For example, First Solar’s 2 GW
Ordos project is backed by the city of Ordos.
29
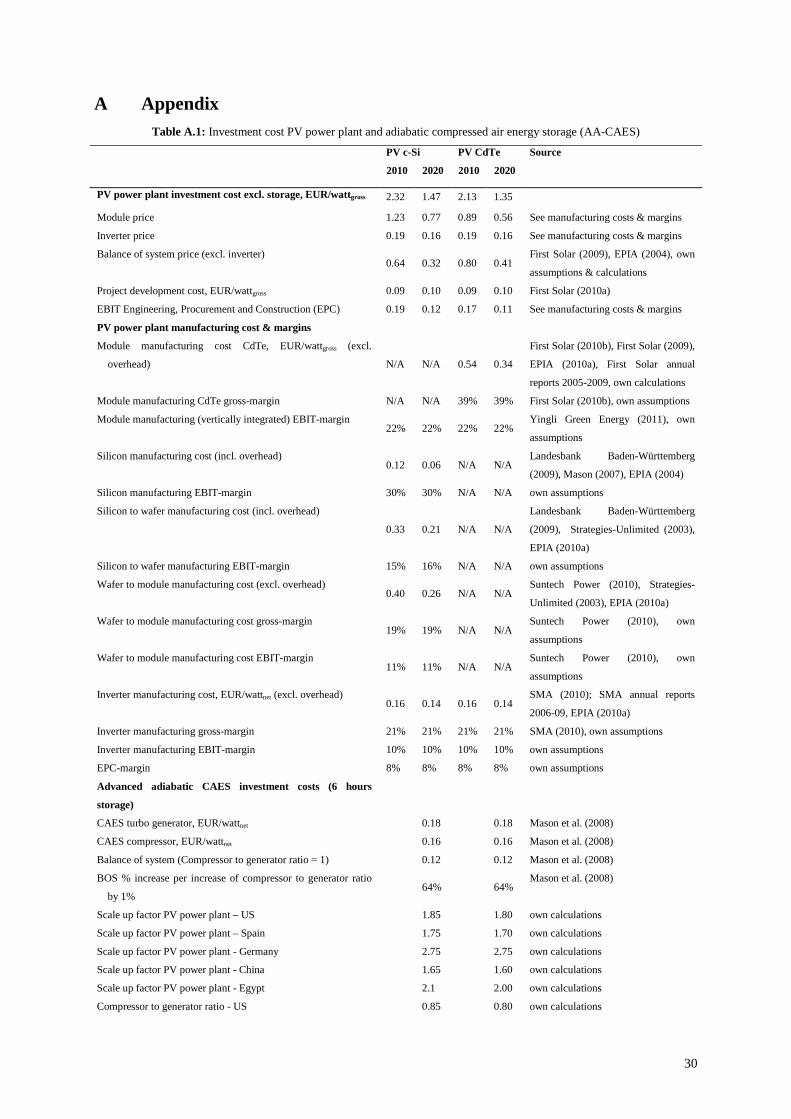
A Appendix Table A.1: Investment cost PV power plant and adiabatic compressed air energy storage (AA-CAES)
PV c-Si PV CdTe Source
2010 2020 2010 2020 PV power plant investment cost excl. storage, EUR/wattgross 2.32 1.47 2.13 1.35 Module price 1.23 0.77 0.89 0.56 See manufacturing costs & margins
Inverter price 0.19 0.16 0.19 0.16 See manufacturing costs & margins
Balance of system price (excl. inverter) 0.64 0.32 0.80 0.41
First Solar (2009), EPIA (2004), own
assumptions & calculations
Project development cost, EUR/wattgross 0.09 0.10 0.09 0.10 First Solar (2010a)
EBIT Engineering, Procurement and Construction (EPC) 0.19 0.12 0.17 0.11 See manufacturing costs & margins
PV power plant manufacturing cost & margins
Module manufacturing cost CdTe, EUR/wattgross (excl.
overhead) N/A N/A 0.54 0.34
First Solar (2010b), First Solar (2009),
EPIA (2010a), First Solar annual
reports 2005-2009, own calculations
Module manufacturing CdTe gross-margin N/A N/A 39% 39% First Solar (2010b), own assumptions
Module manufacturing (vertically integrated) EBIT-margin 22% 22% 22% 22%
Yingli Green Energy (2011), own
assumptions
Silicon manufacturing cost (incl. overhead) 0.12 0.06 N/A N/A
Landesbank Baden-Württemberg
(2009), Mason (2007), EPIA (2004)
Silicon manufacturing EBIT-margin 30% 30% N/A N/A own assumptions
Silicon to wafer manufacturing cost (incl. overhead)
0.33 0.21 N/A N/A
Landesbank Baden-Württemberg
(2009), Strategies-Unlimited (2003),
EPIA (2010a)
Silicon to wafer manufacturing EBIT-margin 15% 16% N/A N/A own assumptions
Wafer to module manufacturing cost (excl. overhead) 0.40 0.26 N/A N/A
Suntech Power (2010), Strategies-
Unlimited (2003), EPIA (2010a)
Wafer to module manufacturing cost gross-margin 19% 19% N/A N/A
Suntech Power (2010), own
assumptions
Wafer to module manufacturing cost EBIT-margin 11% 11% N/A N/A
Suntech Power (2010), own
assumptions
Inverter manufacturing cost, EUR/wattnet (excl. overhead) 0.16 0.14 0.16 0.14
SMA (2010); SMA annual reports
2006-09, EPIA (2010a)
Inverter manufacturing gross-margin 21% 21% 21% 21% SMA (2010), own assumptions
Inverter manufacturing EBIT-margin 10% 10% 10% 10% own assumptions
EPC-margin 8% 8% 8% 8% own assumptions
Advanced adiabatic CAES investment costs (6 hours
storage)
CAES turbo generator, EUR/wattnet 0.18 0.18 Mason et al. (2008)
CAES compressor, EUR/wattnet 0.16 0.16 Mason et al. (2008)
Balance of system (Compressor to generator ratio = 1) 0.12 0.12 Mason et al. (2008)
BOS % increase per increase of compressor to generator ratio
by 1% 64% 64%
Mason et al. (2008)
Scale up factor PV power plant – US 1.85 1.80 own calculations
Scale up factor PV power plant – Spain 1.75 1.70 own calculations
Scale up factor PV power plant - Germany 2.75 2.75 own calculations
Scale up factor PV power plant - China 1.65 1.60 own calculations
Scale up factor PV power plant - Egypt 2.1 2.00 own calculations
Compressor to generator ratio - US 0.85 0.80 own calculations
30
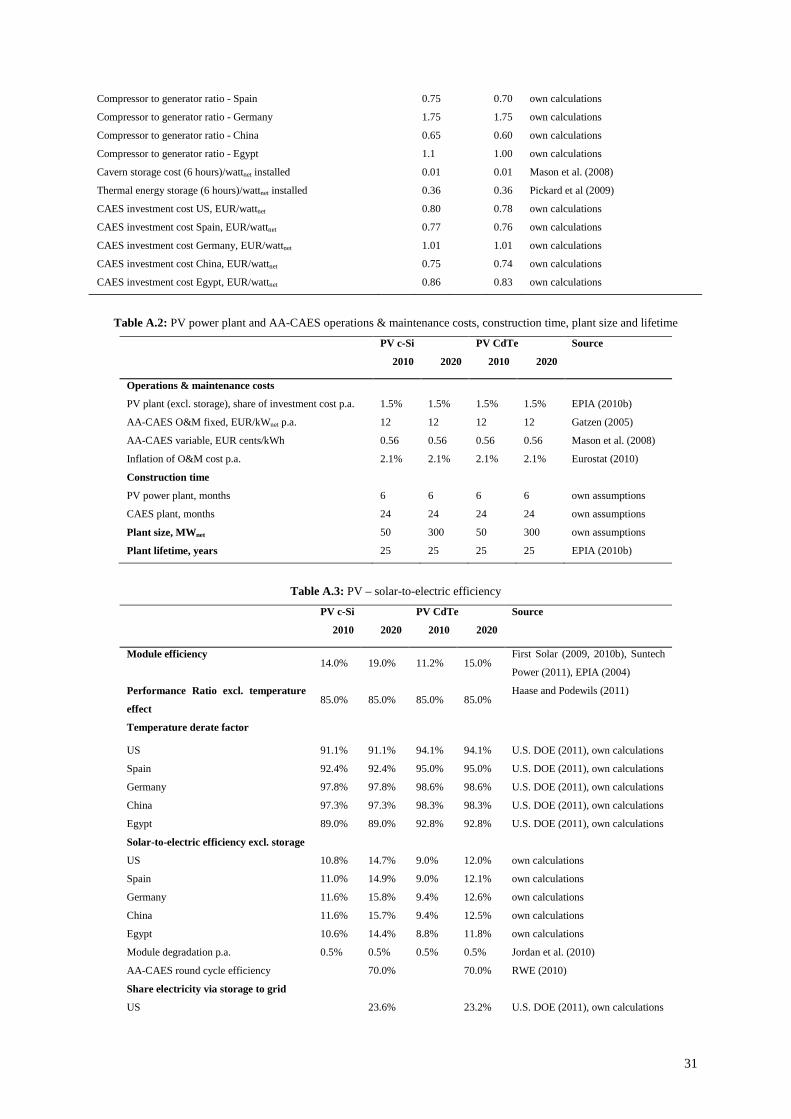
Compressor to generator ratio - Spain 0.75 0.70 own calculations
Compressor to generator ratio - Germany 1.75 1.75 own calculations
Compressor to generator ratio - China 0.65 0.60 own calculations
Compressor to generator ratio - Egypt 1.1 1.00 own calculations
Cavern storage cost (6 hours)/wattnet installed 0.01 0.01 Mason et al. (2008)
Thermal energy storage (6 hours)/wattnet installed 0.36 0.36 Pickard et al (2009)
CAES investment cost US, EUR/wattnet 0.80 0.78 own calculations
CAES investment cost Spain, EUR/wattnet 0.77 0.76 own calculations
CAES investment cost Germany, EUR/wattnet 1.01 1.01 own calculations
CAES investment cost China, EUR/wattnet 0.75 0.74 own calculations
CAES investment cost Egypt, EUR/wattnet 0.86 0.83 own calculations
Table A.2: PV power plant and AA-CAES operations & maintenance costs, construction time, plant size and lifetime
PV c-Si PV CdTe Source
2010 2020 2010 2020 Operations & maintenance costs
PV plant (excl. storage), share of investment cost p.a. 1.5% 1.5% 1.5% 1.5% EPIA (2010b)
AA-CAES O&M fixed, EUR/kWnet p.a. 12 12 12 12 Gatzen (2005)
AA-CAES variable, EUR cents/kWh 0.56 0.56 0.56 0.56 Mason et al. (2008)
Inflation of O&M cost p.a. 2.1% 2.1% 2.1% 2.1% Eurostat (2010)
Construction time
PV power plant, months 6 6 6 6 own assumptions
CAES plant, months 24 24 24 24 own assumptions
Plant size, MWnet 50 300 50 300 own assumptions
Plant lifetime, years 25 25 25 25 EPIA (2010b)
Table A.3: PV – solar-to-electric efficiency
PV c-Si PV CdTe Source
2010 2020 2010 2020 Module efficiency
14.0% 19.0% 11.2% 15.0% First Solar (2009, 2010b), Suntech
Power (2011), EPIA (2004)
Performance Ratio excl. temperature
effect 85.0% 85.0% 85.0% 85.0%
Haase and Podewils (2011)
Temperature derate factor US 91.1% 91.1% 94.1% 94.1% U.S. DOE (2011), own calculations
Spain 92.4% 92.4% 95.0% 95.0% U.S. DOE (2011), own calculations
Germany 97.8% 97.8% 98.6% 98.6% U.S. DOE (2011), own calculations
China 97.3% 97.3% 98.3% 98.3% U.S. DOE (2011), own calculations Egypt 89.0% 89.0% 92.8% 92.8% U.S. DOE (2011), own calculations Solar-to-electric efficiency excl. storage
US 10.8% 14.7% 9.0% 12.0% own calculations
Spain 11.0% 14.9% 9.0% 12.1% own calculations
Germany 11.6% 15.8% 9.4% 12.6% own calculations
China 11.6% 15.7% 9.4% 12.5% own calculations
Egypt 10.6% 14.4% 8.8% 11.8% own calculations
Module degradation p.a. 0.5% 0.5% 0.5% 0.5% Jordan et al. (2010)
AA-CAES round cycle efficiency 70.0% 70.0% RWE (2010)
Share electricity via storage to grid
US 23.6% 23.2% U.S. DOE (2011), own calculations
31
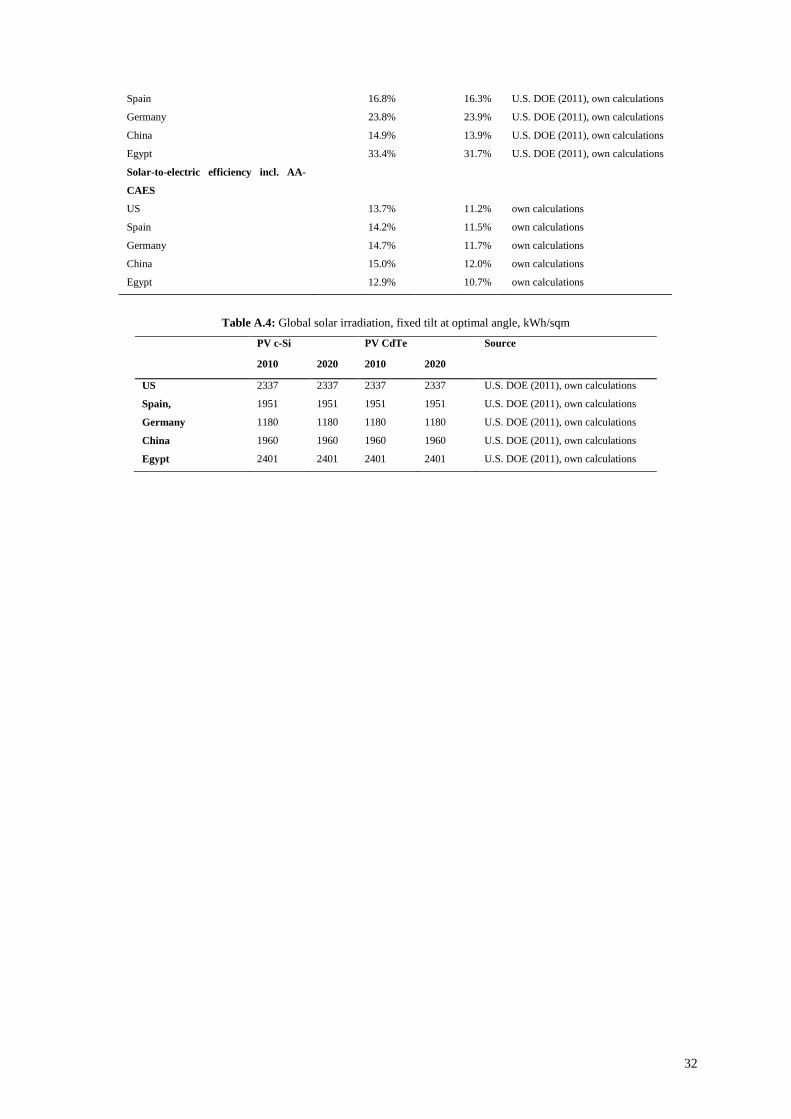
Spain 16.8% 16.3% U.S. DOE (2011), own calculations
Germany 23.8% 23.9% U.S. DOE (2011), own calculations
China 14.9% 13.9% U.S. DOE (2011), own calculations Egypt 33.4% 31.7% U.S. DOE (2011), own calculations Solar-to-electric efficiency incl. AA-
CAES
US 13.7% 11.2% own calculations
Spain 14.2% 11.5% own calculations
Germany 14.7% 11.7% own calculations
China 15.0% 12.0% own calculations
Egypt 12.9% 10.7% own calculations
Table A.4: Global solar irradiation, fixed tilt at optimal angle, kWh/sqm
PV c-Si PV CdTe Source
2010 2020 2010 2020 US 2337 2337 2337 2337 U.S. DOE (2011), own calculations
Spain, 1951 1951 1951 1951 U.S. DOE (2011), own calculations
Germany 1180 1180 1180 1180 U.S. DOE (2011), own calculations
China 1960 1960 1960 1960 U.S. DOE (2011), own calculations Egypt 2401 2401 2401 2401 U.S. DOE (2011), own calculations
32
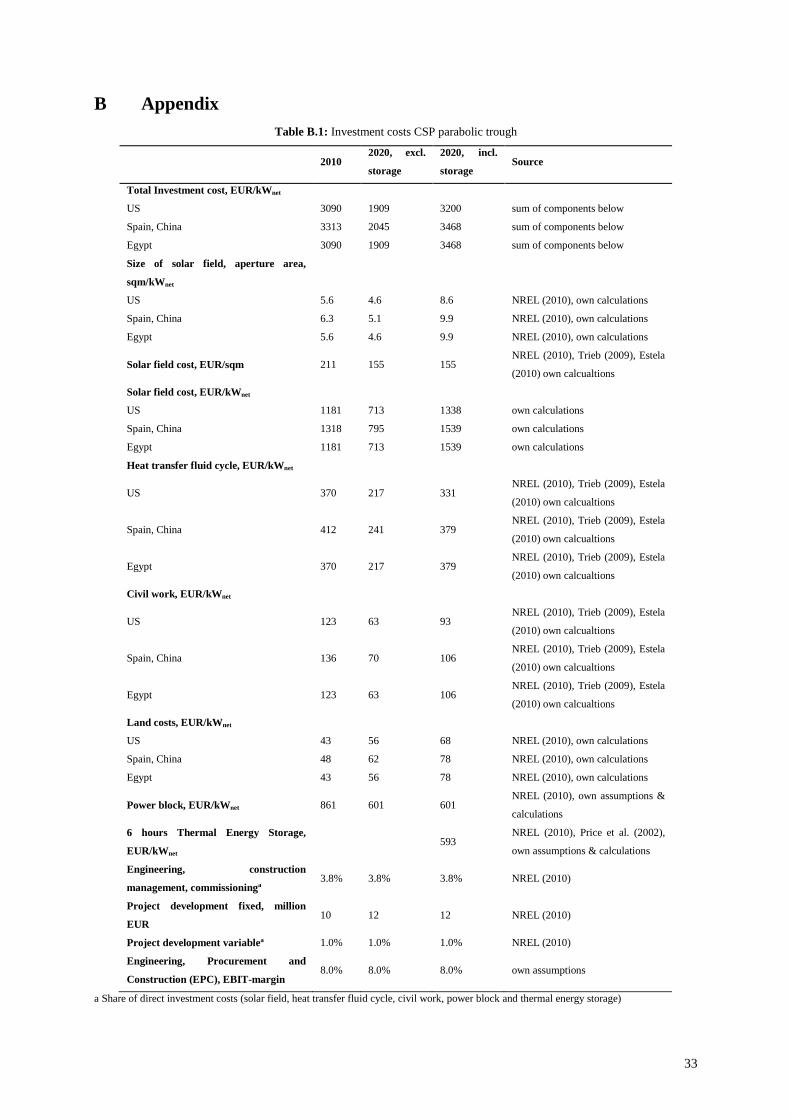
B Appendix Table B.1: Investment costs CSP parabolic trough
2010 2020, excl.
storage
2020, incl.
storage Source
Total Investment cost, EUR/kWnet
US 3090 1909 3200 sum of components below
Spain, China 3313 2045 3468 sum of components below
Egypt 3090 1909 3468 sum of components below
Size of solar field, aperture area,
sqm/kWnet
US 5.6 4.6 8.6 NREL (2010), own calculations
Spain, China 6.3 5.1 9.9 NREL (2010), own calculations Egypt 5.6 4.6 9.9 NREL (2010), own calculations
Solar field cost, EUR/sqm 211 155 155 NREL (2010), Trieb (2009), Estela
(2010) own calcualtions
Solar field cost, EUR/kWnet
US 1181 713 1338 own calculations
Spain, China 1318 795 1539 own calculations
Egypt 1181 713 1539 own calculations
Heat transfer fluid cycle, EUR/kWnet
US 370 217 331 NREL (2010), Trieb (2009), Estela
(2010) own calcualtions
Spain, China 412 241 379 NREL (2010), Trieb (2009), Estela
(2010) own calcualtions
Egypt 370 217 379 NREL (2010), Trieb (2009), Estela
(2010) own calcualtions Civil work, EUR/kWnet
US 123 63 93 NREL (2010), Trieb (2009), Estela
(2010) own calcualtions
Spain, China 136 70 106 NREL (2010), Trieb (2009), Estela
(2010) own calcualtions
Egypt 123 63 106 NREL (2010), Trieb (2009), Estela
(2010) own calcualtions Land costs, EUR/kWnet
US 43 56 68 NREL (2010), own calculations Spain, China 48 62 78 NREL (2010), own calculations Egypt 43 56 78 NREL (2010), own calculations
Power block, EUR/kWnet 861 601 601 NREL (2010), own assumptions &
calculations
6 hours Thermal Energy Storage,
EUR/kWnet 593
NREL (2010), Price et al. (2002),
own assumptions & calculations
Engineering, construction
management, commissioninga 3.8% 3.8% 3.8% NREL (2010)
Project development fixed, million
EUR 10 12 12 NREL (2010)
Project development variablea 1.0% 1.0% 1.0% NREL (2010) Engineering, Procurement and
Construction (EPC), EBIT-margin 8.0% 8.0% 8.0% own assumptions
a Share of direct investment costs (solar field, heat transfer fluid cycle, civil work, power block and thermal energy storage)
33
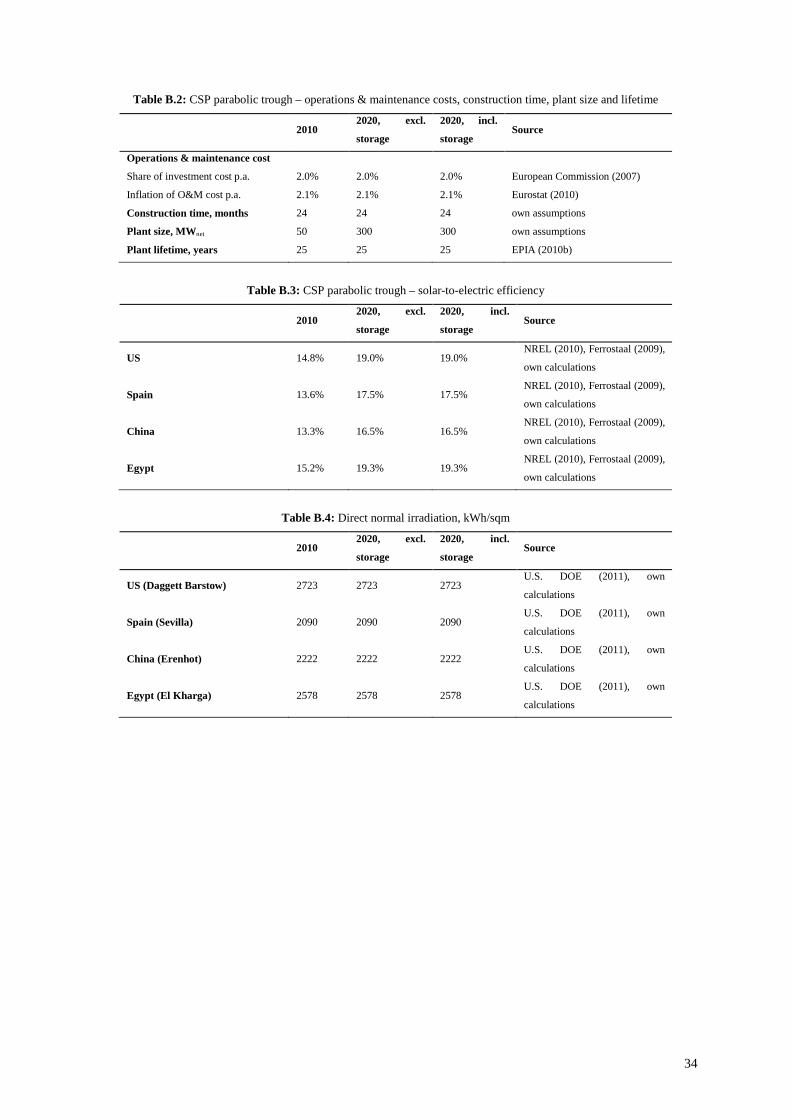
Table B.2: CSP parabolic trough – operations & maintenance costs, construction time, plant size and lifetime
2010 2020, excl.
storage
2020, incl.
storage Source
Operations & maintenance cost
Share of investment cost p.a. 2.0% 2.0% 2.0% European Commission (2007)
Inflation of O&M cost p.a. 2.1% 2.1% 2.1% Eurostat (2010)
Construction time, months 24 24 24 own assumptions
Plant size, MWnet 50 300 300 own assumptions
Plant lifetime, years 25 25 25 EPIA (2010b)
Table B.3: CSP parabolic trough – solar-to-electric efficiency
2010 2020, excl.
storage
2020, incl.
storage Source
US 14.8% 19.0% 19.0% NREL (2010), Ferrostaal (2009),
own calculations
Spain 13.6% 17.5% 17.5% NREL (2010), Ferrostaal (2009),
own calculations
China 13.3% 16.5% 16.5% NREL (2010), Ferrostaal (2009),
own calculations
Egypt 15.2% 19.3% 19.3% NREL (2010), Ferrostaal (2009),
own calculations
Table B.4: Direct normal irradiation, kWh/sqm
2010 2020, excl.
storage
2020, incl.
storage Source
US (Daggett Barstow) 2723 2723 2723 U.S. DOE (2011), own
calculations
Spain (Sevilla) 2090 2090 2090 U.S. DOE (2011), own
calculations
China (Erenhot) 2222 2222 2222 U.S. DOE (2011), own
calculations
Egypt (El Kharga) 2578 2578 2578 U.S. DOE (2011), own
calculations
34
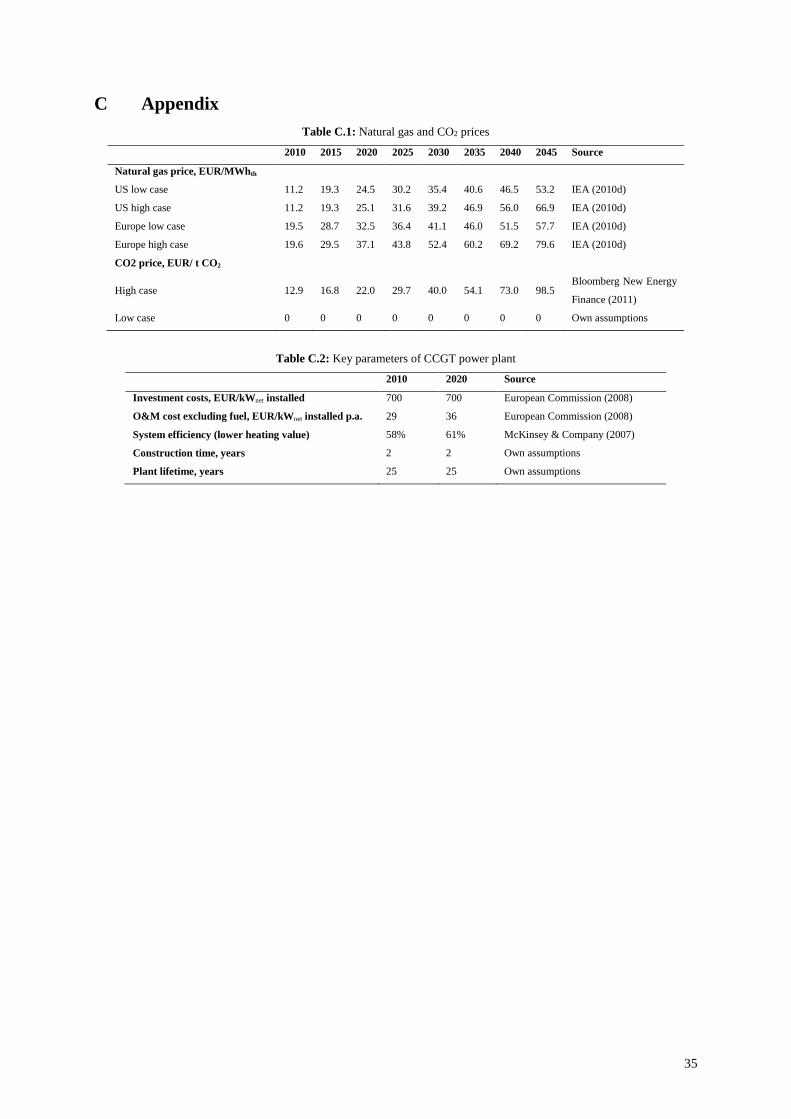
C Appendix Table C.1: Natural gas and CO2 prices
2010 2015 2020 2025 2030 2035 2040 2045 Source
Natural gas price, EUR/MWhth
US low case 11.2 19.3 24.5 30.2 35.4 40.6 46.5 53.2 IEA (2010d)
US high case 11.2 19.3 25.1 31.6 39.2 46.9 56.0 66.9 IEA (2010d)
Europe low case 19.5 28.7 32.5 36.4 41.1 46.0 51.5 57.7 IEA (2010d)
Europe high case 19.6 29.5 37.1 43.8 52.4 60.2 69.2 79.6 IEA (2010d)
CO2 price, EUR/ t CO2
High case 12.9 16.8 22.0 29.7 40.0 54.1 73.0 98.5 Bloomberg New Energy
Finance (2011)
Low case 0 0 0 0 0 0 0 0 Own assumptions
Table C.2: Key parameters of CCGT power plant
2010 2020 Source
Investment costs, EUR/kWnet installed 700 700 European Commission (2008)
O&M cost excluding fuel, EUR/kWnet installed p.a. 29 36 European Commission (2008)
System efficiency (lower heating value) 58% 61% McKinsey & Company (2007)
Construction time, years 2 2 Own assumptions
Plant lifetime, years 25 25 Own assumptions
35

D Appendix Table D.1: Nominal discount rates for PV and CSP power plants
2010 2020 Source
US 8.0% 8.0% Own assumptions
Spain 8.0% 8.0% Own assumptions
China 12.6% 12.6% (UNFCCC, 2010)
Egypt 14.1% 14.1% (UNFCCC, 2010)
Table D.2: Natural gas and CO2 prices
2010 2020 Source
Inflation rate, p.a. 2.1% 2.1% Eurostat (2010)
USD/EUR exchange rate 1.40 1.40 own assumptions
36
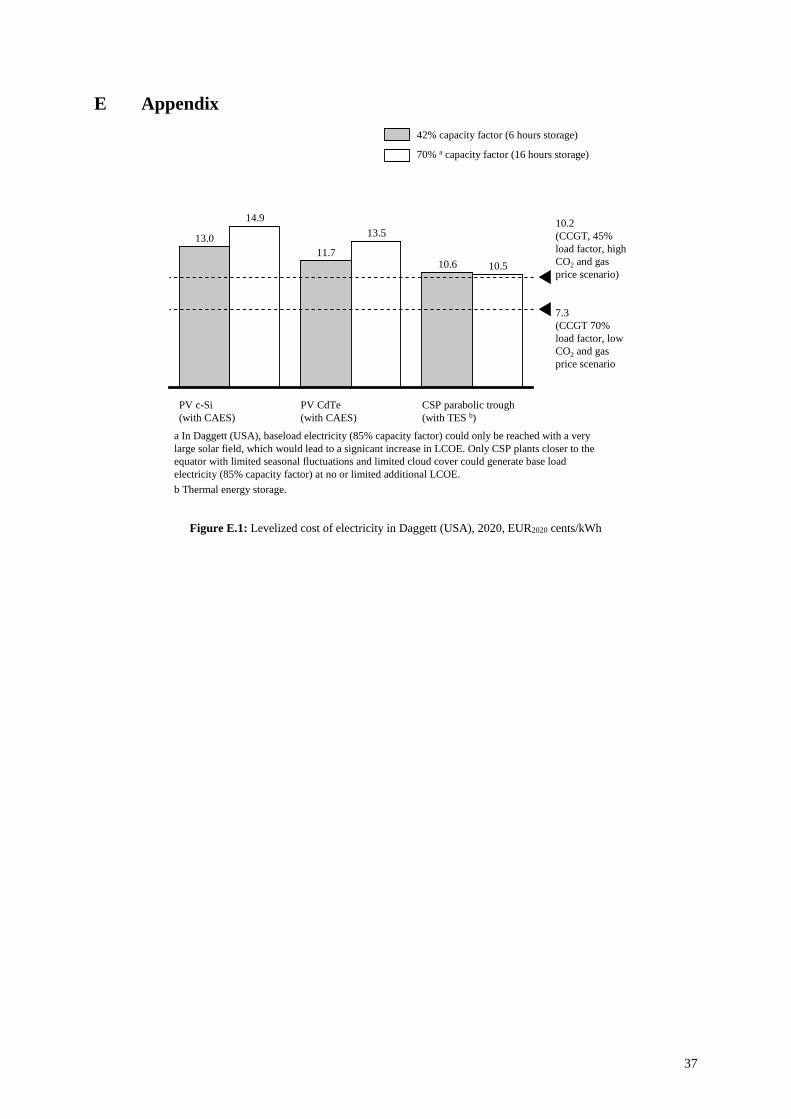
E Appendix
Figure E.1: Levelized cost of electricity in Daggett (USA), 2020, EUR2020 cents/kWh
7.3 (CCGT 70% load factor, lowCO2 and gas price scenario
10.2 (CCGT, 45%load factor, highCO2 and gas price scenario)
CSP parabolic trough (with TES b)
10.510.6
PV CdTe(with CAES)
13.5
11.7
PV c-Si (with CAES)
14.9
13.0
a In Daggett (USA), baseload electricity (85% capacity factor) could only be reached with a very large solar field, which would lead to a signicant increase in LCOE. Only CSP plants closer to the equator with limited seasonal fluctuations and limited cloud cover could generate base load electricity (85% capacity factor) at no or limited additional LCOE.b Thermal energy storage.
42% capacity factor (6 hours storage)
70% a capacity factor (16 hours storage)
37