sharing data between mobile devices, connected vehicles and infrastructure · 2019-02-19 ·...
TRANSCRIPT

Sharing Data between Mobile Devices Connected Vehicles and Infrastructure
Task 8 D2X Hub Proof-of-Concept Test Evaluation Report
wwwitsdotgovindexhtm Final Report mdash October 25 2017 FHWA-JPO-18-623
Produced by Battelle Memorial Institute under DTFH61-12-D-00046 US Department of Transportation
Office of the Assistant Secretary for Research and Technology Federal Highway Administration
Picture Source US DOT Office of the Assistant Secretary for Research and Technology Intelligent Transportation Systems Joint Program Office
Notice
This document is disseminated under the sponsorship of the Department of Transportation in the interest of information exchange The United States Government assumes no liability for its contents or use thereof
The US Government is not endorsing any manufacturers products or services cited herein and any trade name that may appear in the work has been included only because it is essential to the contents of the work
Quality Assurance Statement
The Federal Highway Administration provides high quality information to serve Government industry and the public in a manner that promotes public understanding Standards and policies are used to ensure and maximize the quality objectivity utility and integrity of its information FHWA periodically reviews quality issues and adjusts its programs and processes to ensure continuous quality improvement
Technical Report Documentation Page 1 Report No
FHWA-JPO-18-623 2 Government Accession No 3 Recipientrsquos Catalog No
4 Title and Subtitle
Sharing Data between Mobile Devices Connected Vehicles and Infrastructure Task 8 D2X Hub Proof-of-Concept Test Evaluation Report
5 Report Date
October 25 2017 6 Performing Organization Code
7 Author(s)
David Valentine Kristina Guspan Margaret Hailemariam Rama Krishna Boyapati Ben Paselsky Greg Baumgardner
8 Performing Organization Report No
9 Performing Organization Name and Address
Battelle 505 King Avenue Columbus Ohio 43201
10 Work Unit No (TRAIS)
11 Contract or Grant No
DTFH61-12-D-00046 5015
12 Sponsoring Agency Name and Address
United States Department of Transportation ITS Joint Program Office Office of the Assistant Secretary for Research and Technology 1200 New Jersey Avenue SE Washington DC 20590
13 Type of Report and Period Covered
Final Report
14 Sponsoring Agency Code
15 Supplementary Notes
Government Task Monitor ndash Jon Obenberger
16 Abstract
The Task 8 D2X Hub Proof-of-Concept Test Evaluation Report provides results of the experimental data analysis performed in accordance with the experimental plan for the proof-of-concept version of the prototype system The data set analyzed includes the tests formally conducted at Battelle facilities as well as those conducted at Turner-Fairbank Highway Research Center (TFHRC) during January 2017 and concluding February 1 2017 The findings from these tests provide the basis for recommended prototype system changes and enhancements to be implemented for the larger-scale Prototype Field Test to be conducted in June 2017 at Battelle and the Ohio State University (OSU)
17 Key Words
Connected Vehicle Mobile Device Personal Mobility Message Personal Safety Message Basic Safety Message Test Case Coordinated Message Experimental Prototype System Experimental Plan Test Evaluation Report
18 Distribution Statement
19 Security Classif (of this report)
Unclassified 20 Security Classif (of this page)
Unclassified 21 No of Pages
64 22 Price
NA
Form DOT F 17007 (8-72) Reproduction of completed page authorized
Revision History
Revision Date Change Description Affected SectionsPages
1 6282017 Draft Release
2 10252017 Final Release addressing comments All Chapters
US Department of Transportation Office of the Assistant Secretary for Research and Technology
Intelligent Transportation Systems Joint Program Office
Task 8 D2X Hub Proof-of-Concept Test Evaluation Report ndash Final | i
US Department of Transportation Office of the Assistant Secretary for Research and Technology
Intelligent Transportation Systems Joint Program Office
Task 8 D2X Hub Proof-of-Concept Test Evaluation Report ndash Final | iii
Table of Contents
Revision History i Table of Contents iii Chapter 1 Scope 1 Chapter 2 Referenced Documents 3 Chapter 3 Test Conduct 5 Chapter 4 Experimental Analysis Results Summary 7 Chapter 5 Experimental Analysis 9
Hypothesis 1 The MDEA only broadcasts PSMs when in the range of a vehicle broadcasting a BSM 9
Hypothesis 2 The overall MDEA DSRC message broadcast rate is lower during travel group coordination 10
Hypothesis 3 MDEA Log ndash Travel Mode Status PSM send occurrences 11 Hypothesis 4 The Mobile Device can broadcast a PSM a ra dius of 250 meters 10
Hz under clear unobstructed conditions regardless of where the mobile device is located on the pedestrianrsquos person or clothing 12
Hypothesis 5 Vehicles OBUs can capture and process Mobile Device PSMs and issue warnings at sufficient distance for drivers to avoid imminent pedestrian collision 13
Hypothesis 6 Mobile Devices can capture and process Vehicle BSMs and issue warnings in time for pedestrians to avoid imminent vehicle collision 15
Hypothesis 7 MDEA Log ndash GPS Location SafeUnsafe Zone Status and MAP Message Contents 18
Hypothesis 8 amp 9 The VEA can coordinate taxi travel requests from an MDEA20 Hypothesis 10 The traveler can receive arrival updates from a taxi or transit
vehicle 22 Hypothesis 11 amp 12 The MDEA can detect when a traveler transitions from a
pedestrian to a light duty vehicle o r from a light duty vehicle to a pe destrian 23 Hypothesis 13 The MDEA can coordinate maintain and cancel travel with
another MDEA via Wi-Fi Direct 24 Hypothesis 14 The RSU can broadcast a SPaT and MAP message via DSRC that
can be received by mobile devices 26 Hypothesis 15 The RSU can store all messages received via DSRC 27
Chapter 6 Lessons Learned and Recommendations 29
Lessons Learned 29 Recommendations 30
APPENDIX A Comprehensive Data Analysis Tables A-1 APPENDIX B Acronyms and Abbreviations B-1 APPENDIX C Terms and Definitions C-1
Table of Contents
List of Tables
Table 4-1 Experimental Analysis Results Summary 7 Table 5-1 Hypothesis 1 Analysis Data Sample 9 Table 5-2 Hypothesis 2 Analysis Data Sample 10 Table 5-3 Hypothesis 3 Analysis Data Sample 11 Table 5-4 Hypothesis 4 Analysis Data Sample 12 Table 5-5 Hypothesis 5 Analysis Data Sample 14 Table 5-6 Total and Average Differences between Actual and Calculated Advisories
Alerts and Warnings (VEA) 14 Table 5-7 Hypothesis 6 Analysis Data Sample 16 Table 5-8 Total and Average Differences between Actual and Calculated Advisories
Alerts and Warnings (MDEA) 16 Table 5-9 Hypothesis 7 Analysis Data Sample 18 Table 5-10 Hypothesis 8 amp 9 Analysis Data Sample 20 Table 5-11 Hypothesis 10 Analysis Data Sample 22 Table 5-12 Hypothesis 11 amp 12 Analysis Data Sample 23 Table 5-13 Hypothesis 13 Analysis Data Sample 25 Table 5-14 Hypothesis 14 Analysis Data Sample 26 Table 5-15 Hypothesis 15 Analysis Data Sample 27 Table 5-16 Data Usage Statistics 28 Table A-1 Complete Data Analysis ndash Hypothesis 1 4 amp 15 A-1 Table A-2 Complete Data Analysis ndash Hypothesis 2 A-6 Table A-3 Complete Data Analysis ndash Hypothesis 3 A-7 Table A-4 Complete Data Analysis ndash Hypothesis 5 (VEA) A-8 Table A-5 Complete Data Analysis ndash Hypothesis 6 (MDEA)A-10 Table A-6 Complete Data Analysis ndash Hypothesis 7 A-12 Table A-7 Complete Data Analysis ndash Hypothesis 8 amp 9 A-13 Table A-8 Complete Data Analysis ndash Hypothesis 10 A-15 Table A-9 Complete Data Analysis ndash Hypothesis 13 (Part A) A-16 Table A-10 Complete Data Analysis ndash Hypothesis 13 (Part B) A-18
List of Figures
Figure 3-1 Turner-Fairbank Highway Research Center ndash Testing Location 6 Figure 5-1 Advisory Alert and Warning Distances with Respect to VEA 13 Figure 5-2 Advisory Alert and Warning Distances with Respect to MDEA 15 Figure 5-3 Cross Track Distance between Pedestrian and Vehicle Path 17 Figure 5-4 Safe and Unsafe Zones at TFHRC Test Site 19
US Department of Transportation Office of the Assistant Secretary for Research and Technology
Intelligent Transportation Systems Joint Program Office
Task 8 D2X Hub Proof-of-Concept Test Evaluation Report ndash Final | iv
Chapter 1 Scope
This D2X Hub Proof-of-Concept Test Evaluation Report presents results of the experimental data analysis performed in accordance with the Experimental Plan for the proof-of-concept version of the D2X Hub prototype system The data set analyzed includes the tests formally conducted at Battelle facilities (ie prototype acceptance test) as well as those conducted at Turner-Fairbank Highway Research Center (TFHRC) during January 2017 and concluding February 1 2017 Since the same experimental plan was used for tests conducted at Battelle facilities as well as TFHRC data from both the tests were fused to perform the data analysis This report provides the results of the data analysis Detailed test logs and digital data logs are not included in their entirety
The Proof-of-Concept testing and subsequent data analysis was conducted in accordance with the Proof-of-Concept Experimental Plan The Experimental Plan was designed to answer the research questions posed by the subject contract The same Acceptance Test Plan (ATP) procedures used for Acceptance Testing were used to supply the data for Proof-of-Concept testing and analysis
The purpose of the Proof-of-Concept testing was to evaluate the technical functionality of the system but not to test the systemrsquos ability to address user needs Further the Proof-of-Concept testing will provide basis for recommended prototype system changes and enhancements to be implemented for the larger-scale Prototype Field Test to be conducted in June 2017 at Battelle and the Ohio State University (OSU) Additionally this testing provided the first step towards answering the research questions in the contract
Finally it should be noted that the subject system is an experimental system for the purpose of answering research questions System performance is limited by the quality of input data and the limits of the underlying technology and equipment employed As such there is not a specific threshold for an ldquoacceptablerdquo level of overall system performance All results whether ldquopassrdquo or ldquofailrdquo are instructive outcomes of this testing to answer the subject research questions
US Department of Transportation Office of the Assistant Secretary for Research and Technology
Intelligent Transportation Systems Joint Program Office
Task 8 D2X Hub Proof-of-Concept Test Evaluation Report ndash Final | 1
Chapter 2 Referenced Documents
Battelle Memorial Institute
FHWA-JPO-16-423 Task 3 System Requirements Specifications (SyRS) for Sharing Data between Mobile Devices Connected Vehicles and Infrastructure (July 14 2016)
FHWA-JPO-17-476 Task 4 System Architecture and Design Document for Sharing Data between Mobile Devices Connected Vehicles and Infrastructure (October 26 2016)
FHWA-JPO-17-475 Task 5 Prototype Proof-of-Concept Field Demonstration Experimental Field Demonstration Site Plan for Sharing Data between Mobile Devices Connected Vehicles and Infrastructure (October 6 2016)
FHWA-JPO-17-477 Task 6 Prototype Acceptance Test Plan for Sharing Data between Mobile Devices Connected Vehicles and Infrastructure (December 21 2016)
FHWA-JPO-17-507 Task 6 Prototype Acceptance Test Summary Report for Sharing Data between Mobile Devices Connected Vehicles and Infrastructure (February 10 2017)
US Department of Transportation Office of the Assistant Secretary for Research and Technology
Intelligent Transportation Systems Joint Program Office
Task 8 D2X Hub Proof-of-Concept Test Evaluation Report ndash Final | 3
Chapter 3 Test Conduct
Prototype Proof-of-Concept tests for safety and mobility were conducted at TFHRC on January 30 through February 1 2017 in a controlled environment A two-lane undivided road at TFHRC with light traffic was selected as the test route The parking lot adjacent to the selected route was used to establish a temporary Road Side Unit (RSU) and a traveler taxi stop Three vehicles were used in this test one each for a simulated taxi a light-duty vehicle and to power the RSU The RSU Experimental Application (REA) and Vehicle Experimental Application (VEA) were installed in the RSU and taxi vehicles respectively The light-duty vehicle had an OBU installed that generated BSMs only Up to three mobile devices installed with the Mobile Device Experimental Application (MDEA) were used in this testing depending on the test case requirements After installation of test equipment at the test location checks were conducted to ensure message generation transmission and reception
Seven Battelle staff participated in the testing by carrying out the roles of travelers pedestrians vehicle operator and test engineers A total of sixteen (16) test cases were employed at both TFHRC and Battelle facilities to generate the data necessary for experimental analysis Five (5) iterations were performed for each test case at TFHRC while 15 iterations performed at Battelle facilities were also included in the data set
The tests associated with coordination of mobile devices were performed in a highly-controlled environment This meant selection of specific devices and designating them with specific roles This approach was chosen due to poor Wi-Fi Direct performance that would have otherwise hindered the ability to conduct the testing and collect the necessary data
Detection of a pedestrian within a 2 meter cluster radius was a challenge based on earlier testing This error in GPS accuracy was balanced by increasing the cluster radius to 7 meters for all the tests at TFHRC This modification in cluster radius increased the efficiency of pedestrian detection by closing out the difference in Cross Track Distancersquo Cross track distance is the perpendicular distance between pedestrian and light duty vehicle path
The TFHRC test site location and route are shown in Figure 3-1
US Department of Transportation Office of the Assistant Secretary for Research and Technology
Intelligent Transportation Systems Joint Program Office
Task 8 D2X Hub Proof-of-Concept Test Evaluation Report ndash Final | 5
Chapter 3 Test Conduct
Source Battelle Google Maps January 2017
Figure 3-1 Turner-Fairbank Highway Research Center ndash Testing Location
US Department of Transportation Office of the Assistant Secretary for Research and Technology
Intelligent Transportation Systems Joint Program Office
Task 8 D2X Hub Proof-of-Concept Test Evaluation Report ndash Final | 6
Chapter 4 Experimental Analysis Results Summary
Overall the testing and subsequent analysis showed the ability to reliably generate transmit and receive messages between mobile devices and connected vehicles The messages to incorporate mobile devices into the CV environment functioned as designed and provided the necessary data for the prototype mobility and safety applications to perform their functions While the prototype safety and mobility software applications functioned well (as designed) the performance shortfalls that were observed are largely attributed to current technology limitations and hardware issues
Mixed results were achieved for the various communication methods tested Cellular functioned well while Wi-Fi Direct connectivity was unreliable and DSRC hardware problems caused communication problems with our system GPS accuracy limitations were observed as expected
Table 4-1 provides a summary of the experimental analysis results by hypothesis while Chapter 5 provides more in depth coverage of the analysis
Table 4-1 Experimental Analysis Results Summary
US Department of Transportation Office of the Assistant Secretary for Research and Technology
Intelligent Transportation Systems Joint Program Office
Task 8 D2X Hub Proof-of-Concept Test Evaluation Report ndash Final | 7
Test Case No Hypothesis Description Data Analysis Results
5411 ndash PSM Hypothesis 1 ndash The MDEA only broadcasts PSMs
when in the range of a vehicle broadcasting a BSM No False Negatives Satisfied at
100 Level of Confidence (LOC)
5413 ndash PSM Hypothesis 2 ndash The overall MDEA DSRC message
broadcast rate is lower during travel group coordination
Wi-Fi Direct Grouping Issue 8 False Negatives Satisfied at
875 LOC
5412 ndash PSM Hypothesis 3 ndash The MDEA can cease the broadcast
of PSMs when in a vehicle No False negatives Satisfied at
100 LOC
5411 ndash PSM
Hypothesis 4 ndash The Mobile Device can broadcast a PSM a radius of 250 meters 10 Hz under clear unobstructed conditions regardless of where the mobile device is located on the pedestrianrsquos person
or clothing
Radius limited to 100 m
Satisfied at a 43 level of confidence
5471 ndash SFY
Hypothesis 5 ndash Vehicles OBUs can capture and process Mobile Device PSMs and issue warnings at sufficient distance for drivers to avoid imminent pedestrian collision
No False negatives TFHRC satisfied at 100 LOC
5471 ndash SFY Hypothesis 6 ndash Mobile Devices can capture and process Vehicle BSMs and issue warnings in time for pedestrians to avoid imminent vehicle collision
No False negatives TFHRC satisfied at 100 LOC
5414 ndash PSM Hypothesis 7 ndash Mobile Device applications can detect No False negatives TFHRC
if a pedestrian is in a safe or unsafe zone satisfied at 100 LOC
Chapter 4 Experimental Analysis Results Summary
Test Case No Hypothesis Description Data Analysis Results
5421 5422 5423 ndash PMM
Hypothesis 8 amp 9 ndash The VEA can coordinate taxi travel requests from an MDEA
No False negatives TFHRC satisfied at 100 LOC
5424 ndash PMM Hypothesis 10 ndash The traveler can receive arrival updates from a taxi or transit vehicle
2 False Negatives out of 14 TFHRC Satisfied at 8571 LOC
5451 5452 ndash LDV
Hypothesis 11 amp 12 ndash The MDEA can detect when a traveler transitions from a pedestrian to a light duty vehicle or from a light duty vehicle to a pedestrian
No False negatives Accelerator tests Satisfied at 100 LOC Bluetooth tests failed
5441 5443 5444 ndash ATG
Hypothesis 13 ndash The MDEA can coordinate maintain and cancel travel with another MDEA via Wi-Fi Direct
Wi-Fi Direct Grouping Failure 30 False Negatives out of 198 Satisfied at 8484 LOC
5481 ndash SMP Hypothesis 14 ndash The RSU can broadcast a SPaT and MAP message via DSRC that can be received by mobile devices
No False negatives Satisfied at 100 LOC
5411 5444 5471 ndash MSG
Hypothesis 15 - The RSU can store all messages received via DSRC
RSU - CCP logging issues Not satisfied at 100 LOC
Note The LOC was calculated as a ratio of the total number of successful steps in the test script divided by the total number of steps in the test script (Each hypothesis has a specific test script)
US Department of Transportation Office of the Assistant Secretary for Research and Technology
Intelligent Transportation Systems Joint Program Office
Task 8 D2X Hub Proof-of-Concept Test Evaluation Report ndash Final | 8
US Department of Transportation Office of the Assistant Secretary for Research and Technology
Intelligent Transportation Systems Joint Program Office
Task 8 D2X Hub Proof-of-Concept Test Evaluation Report ndash Final | 9
Chapter 5 Experimental Analysis
Hypothesis 1 The MDEA only broadcasts PSMs when in the range of a vehicle broadcasting a BSM
Data logs verified MDEA Log ndash BSM received and PSM send occurrences
Analysis
Determination of vehicle range from mobile device based on vehicle speed Analysis of PSMs sent with respect to vehicle range (In range and out of range scenarios)
Observations In all the test cases PSMs were broadcasted by MDEA when the vehicle was in its range with respect to vehicle speed (ldquofast enough close enoughrdquo)
Table 5-1 Hypothesis 1 Analysis Data Sample
Vehicle Range and Advisory Speed In Out of Distance Date Time Distance wrt Speed (mph) Range Range (m)
13117 101316 IsBsmClose Dist 975500061708885lt
AdvDist 1024200201024 255 X 98
13117 101332 IsBsmClose Dist 570797651794001lt
AdvDist 666000057888 173 X 57
13117 101340 IsBsmClose Dist 57448436831453lt
AdvDist 601199821728 149 X 57
13117 101529 IsBsmClose Dist 975729907380225lt
AdvDist 102240014976 254 X 98
For the complete analysis please refer to Table A-1 in Appendix A
ݐݑݍܧ ݎ ݑ ݐ dݒݏݕݎ ݐݏ ݓݎݐ ݏ
ௗ௩௦௬= lowastݒ9
Where
is the advisory display distance (meters) ௗ௩௦௬ ݒ is the velocity of the vehicle (meters per second)
Results There were no outliers (False Negatives) in the dat a analyzed Hence Hypothesis 1 is satisfied at a 100 level of confidence
Chapter 5 Experimental Analysis
Hypothesis 2 The overall MDEA DSRC message broadcast rate is lower during travel group coordination
Data logs verified MDEA Log ndash Coordination Status PSM send occurrences before and after coordination
Analysis
Determination of coordination status Analysis of PSMs sent while not part of the travel group and while part of the travel group
(Travel group leader) Analysis of PSMs sent while not part of the travel group and while part of the travel group
(Travel group Member)
Observations Out of 64 log checks performed 56 true positives were observed Two tests had a grouping failure due to Wi-Fi Direct issues
Table 5-2 Hypothesis 2 Analysis Data Sample
Date 13117 13117 13117 13117 13117
Description Test Number TFHRC 1 TFHRC 3 TFHRC 4 TFHRC 5 TFHRC 6
PSMs Generated by Traveler X and Traveler Y 111116 112346 114208 114609 115222
Transition to In Group 111240 112448 114301 114658 115313
Traveler Y PSM ceased Check Check Check Check Check
only Traveler X PSM received 111305 112508 114345 114721 115342
For the complete analysis please refer to Table A-2 in Appendix A
Results There were 8 False Negatives in the data analyzed Hence Hypothesis 2 is satisfied at 875 level of confidence
US Department of Transportation Office of the Assistant Secretary for Research and Technology
Intelligent Transportation Systems Joint Program Office
Task 8 D2X Hub Proof-of-Concept Test Evaluation Report ndash Final | 10
Chapter 5 Experimental Analysis
Hypothesis 3 MDEA Log ndash Travel Mode Status PSM send occurrences
Data logs verified MDEA Log ndash BSM received and PSM send occurrences
Analysis
Determination of mobile device travel mode status Analysis of PSMs sent before and after transition of travel mode (on-foot and In-vehicle)
Observations All the test logs indicate that the PSMs were ceased after the MDEA transitioned its travel mode to In-vehicle
Table 5-3 Hypothesis 3 Analysis Data Sample
Description Test Number
TFHRC 1 TFHRC 2 TFHRC 3 TFHRC 4 TFHRC 5 TFHRC 6
MDEA not in vehicle Check Check Check Check Check Check
MDEA Transmits PSMs
Check Check Check Check Check Check
Time of MDEA Mode Transition
103804 104109 104430 104624 104805 105024
MDEA Ceases Transmitting PSMs
Check Check Check Check Check Check
For the complete analysis please refer to Table A-3 in Appendix A
Results There were no outliers (False Negatives) in the data analyzed Hence Hypothesis 3 is satisfied at a 100 level of confidence
US Department of Transportation Office of the Assistant Secretary for Research and Technology
Intelligent Transportation Systems Joint Program Office
Task 8 D2X Hub Proof-of-Concept Test Evaluation Report ndash Final | 11
US Department of Transportation Office of the Assistant Secretary for Research and Technology
Intelligent Transportation Systems Joint Program Office
Task 8 D2X Hub Proof-of-Concept Test Evaluation Report ndash Final | 12
Chapter 5 Experimental Analysis
Hypothesis 4 The Mobile Device can broadcast a PSM a radius of 250 meters 10 Hz under clear unobstructed conditions regardless of where the mobile device is located on the pedestrianrsquos person or clothing
Data logs verified VEA Log ndash PSM receive occurrences at a d istance of 10 m 50 m 100 m
Analysis
The rate at which PSMs were received by the RSU had been assessed The mobile device was placed in multiple locations on the pedestrian including in-hand in-pocket and in a backpack
Observations Due to DSRC limitations in the CCPs tests could not be performed beyond 100 m range Considering the RSU logging issues VEA Logs were used to analyze PSM broadcasting capacity of MDEA All the tests logged PSMs at a ra te o f 10sec Therefore 150 200 250 300 m radius could no t be a nalyzed Only three (10 50 and 100m) out of seven (10 50 100 150 200 250 and 300 m) cases were tested which resulted in a 43 Level of Confidence
Table 5-4 Hypothesis 4 Analysis Data Sample
Date Time
Vehicle Range and Advisory Distance wrt Speed
Speed (mph)
In Range
Out of Range
True Distance (m)
VEA Log PSM Message Rate
13117 101316 IsBsmClose Dist 975500061708885lt AdvDist 1024200201024
255 98 10
13117 101332 IsBsmClose Dist 570797651794001lt AdvDist 666000057888
173 57 10
13117 101340 IsBsmClose Dist 57448436831453lt AdvDist 601199821728
149 57 10
13117 101529 IsBsmClose Dist 975729907380225lt AdvDist 102240014976
254 98 10
13117 101538 IsBsmClose Dist 399317028326919lt AdvDist 102240014976
250 4 10
For the complete analysis please refer to Table A-1 in Appendix A
Results Due to the DSRC limitations the radius was limited to 100 m Hence Hypothesis 4 is satisfied at a 43 level of confidence
Chapter 5 Experimental Analysis
Hypothesis 5 Vehicles OBUs can capture and process Mobile Device PSMs and issue warnings at sufficient distance for drivers to avoid imminent pedestrian collision
Data logs verified VEA Log ndash PSM Location GPS Location Advisory Display Alert Display and Warning Display
Analysis
Assessing the distance at which an Advisory Alert and Warning were issued based on the speed of the vehicle (in the VEA Log)
Observations a Considering TFHRC tests the average difference in distance for VEA Logging of Advisories
Alerts and Warnings were on average 2028 m 275 m and 194 m respectively b The higher difference in advisory was due to the delay in the time between VEA deciding to
send PSM and Arada sending a PSM c Latency of less than a second was observed between PSM received and the message
display time on MDEA and VEA Logs
sݐݑݍܧ ݎ ݑݐ dݒݏwarningandalertݕݎ ݐݏ ݓݎݐ ݏ
ௗ௩௦௬= lowastݒ9
lowast ሻ05ݒ 25ሾሺൌ 11 lowast ቊ ௧ଶݒ
ሿ 2ሺ34ሻ
ቋ
Where
lowast ሻ05ݒ 25ሾሺൌ 11 lowast ቊ ௪
is the advisory display distance (meters) ௗ௩௦௬
is the alert display distance (meters) ௧
is the warning display distance (meters) ௐ
ଶݒሿ 2ሺ56ሻ
ቋ
ݒ is the velocity of the vehicle (meters per second)
TF 71 Run 2 - VEA
Source Battelle Google Maps February 2017
Figure 5-1 Advisory Alert and Warning Distances with Respect to VEA
US Department of Transportation Office of the Assistant Secretary for Research and Technology
Intelligent Transportation Systems Joint Program Office
Task 8 D2X Hub Proof-of-Concept Test Evaluation Report ndash Final | 13
Chapter 5 Experimental Analysis
Table 5-5 Hypothesis 5 Analysis Data Sample
TFHRC1 TFHRC2 TFHRC3
Advisory Alert Warning Advisory Alert Warning Advisory Alert Warning
True Distance (m) 7584 5545 4874 8552 5167 4515 7876 5827 5124
Speed (MPH) 2471 2523 2498 2595 2461 2433 2381 2590 2624
Expected Distance (m)
9942 5780 4910 10441 5588 4751 9580 5989 5222
Difference (m) 2358 235 036 1889 421 236 1704 162 098
For the complete analysis please refer to Table A-4 in Appendix A
Table 5-6 Total and Average Differences between Actual and Calculated Advisories Alerts and Warnings (VEA)
TFHRC Advisory Alert Warning
Total Difference (m) 10139 1376 971
Average Difference (m) 2028 275 194
Results There were no outliers (False Negatives) in the data analyzed Hence Hypothesis 5 is satisfied at a 100 level of confidence
US Department of Transportation Office of the Assistant Secretary for Research and Technology
Intelligent Transportation Systems Joint Program Office
Task 8 D2X Hub Proof-of-Concept Test Evaluation Report ndash Final | 14
Hypothesis 6 Mobile Devices can capture and process Vehicle BSMs and issue warnings in time for pedestrians to avoid imminent vehicle collision
Data logs verified MDEA Log ndash BSM Location GPS Location Advisory Display Alert Display and Warning Display
Analysis
Assessing the distance at which an Advisory Alert and Warning were issued based on the speed of the vehicle (in the BSM received by the mobile device)
Observations a Considering the TFHRC results the average difference in distance for MDEA logging of
Advisories Alerts and Warnings were on average 278 m 323 m and 334 m respectively b Latency of less than a second was observed on MDEA and VEA Logs
sݐݑݍܧ ݎ ݑݐ dݒݏwarningandalertݕݎ ݐݏ ݓݎݐ ݏ
ௗ௩௦௬= lowastݒ9
lowast ሻ05ݒ 25ሾሺൌ 11 lowast ቊ ௧ଶݒ
ሿ 2ሺ34ሻ
ቋ
ଶݒሿ 2ሺ56ሻ
ቋ
Where
lowast ሻ05ݒ 25ሾሺൌ 11 lowast ቊ ௪
is the advisory display distance (meters) ௗ௩௦௬
is the alert display distance (meters) ௧
is the warning display distance (meters) ௐ
ݒ is the velocity of the vehicle (meters per second)
Chapter 5 Experimental Analysis
TF 71 Run 2 - MDEA
US Department of Transportation Office of the Assistant Secretary for Research and Technology
Intelligent Transportation Systems Joint Program Office
Task 8 D2X Hub Proof-of-Concept Test Evaluation Report ndash Final | 15
Source Battelle Google Maps February 2017
Figure 5-2 Advisory Alert and Warning Distances with Respect to MDEA
Chapter 5 Experimental Analysis
Table 5-7 Hypothesis 6 Analysis Data Sample
TFHRC1 TFHRC2 TFHRC3
Advisory Alert Warning Advisory Alert Warning Advisory Alert Warning
True Distance (m) 8756 5320 4651 9928 5276 4624 8952 5595 4890
Speed (mph) 2290 2509 2487 2514 2447 2415 2304 2603 2617
Expected distance (m) 9213 5736 4883 10115 5546 4707 9270 6030 5205
Difference (m) 458 416 232 187 270 084 318 436 315
For the complete analysis please refer to Table A-5 in Appendix A
Table 5-8 Total and Average Differences between Actual and Calculated Advisories Alerts and Warnings (MDEA)
TFHRC Advisory Alert Warning
Total Difference (m) 1392 1617 1671
Average Difference (m) 278 323 334
Results There were no false alarms detected at neither of the TFHRCATP tests performed Hence Hypothesis 6 is satisfied at a 100 level of confidence
Issues Identified GPS Inaccuracy ndash Cross Track Distance Issue
The accuracy of GPS as per the US government claims is +- 4 m This error in GPS accuracy was balanced by increasing the cluster radius to 7 m for all the tests at TFHRC This modification in cluster radius increased the efficiency of pedestrian detection by closing out the difference in Cross Track Distancersquo
There were no false alarms detected at neither of the TFHRCATP tests performed
US Department of Transportation Office of the Assistant Secretary for Research and Technology
Intelligent Transportation Systems Joint Program Office
Task 8 D2X Hub Proof-of-Concept Test Evaluation Report ndash Final | 16
Chapter 5 Experimental Analysis
Source Battelle Google Maps February 2017
Figure 5-3 Cross Track Distance between Pedestrian and Vehicle Path
US Department of Transportation Office of the Assistant Secretary for Research and Technology
Intelligent Transportation Systems Joint Program Office
Task 8 D2X Hub Proof-of-Concept Test Evaluation Report ndash Final | 17
Chapter 5 Experimental Analysis
Hypothesis 7 MDEA Log ndash GPS Location SafeUnsafe Zone Status and MAP Message Contents
Data logs verified MDEA Log ndash GPS Location SafeUnsafe Zone Status and MAP Message Contents
Analysis
Analyzed the percentage of properly classified safeunsafe zone detections The device was placed in the roadway ndash mobile device location was properly classified if it positions itself in an unsafe zone
Observations User State Change from Safe to Unsafe (when placed 20 m in the roadway) and Unsafe to Safe (when placed 50 m from the roadway) were captured accurate and timely
Table 5-9 Hypothesis 7 Analysis Data Sample
TFHRC 1 TFHRC 2 TFHRC 3 TFHRC 4 TFHRC 5
User State Change Is Safe Icon False (2 m in the roadway)
111438 112533 114400 114801 115408
Properly Processed
User State Change Is Safe Icon True (5 m from the roadway)
111504 112619 114438 114829 115444
Properly Processed
For the complete analysis please refer to Table A-6 in Appendix A
US Department of Transportation Office of the Assistant Secretary for Research and Technology
Intelligent Transportation Systems Joint Program Office
Task 8 D2X Hub Proof-of-Concept Test Evaluation Report ndash Final | 18
Chapter 5 Experimental Analysis
Source Battelle Google Maps February 2017
Figure 5-4 Safe and Unsafe Zones at TFHRC Test Site
Results There were no outliers (False Negatives) in the data analyzed Hence Hypothesis 7 is satisfied at a 100 level of confidence
US Department of Transportation Office of the Assistant Secretary for Research and Technology
Intelligent Transportation Systems Joint Program Office
Task 8 D2X Hub Proof-of-Concept Test Evaluation Report ndash Final | 19
Chapter 5 Experimental Analysis
Hypothesis 8 amp 9 The VEA can coordinate taxi travel requests from an MDEA
Data logs verified MDEA Log ndash PMM Send Occurrence PMM contents PMM-RSP Receive Occurrence Coordination Status and PMM-Cancel Sent Occurrence
Analysis
Analyzed the percentage of PMM and PMM ndash Cancel messages properly processed by in-vehicle devices
Analyzed the percentage of PMM-RSP messages properly processed by mobile devices This analysis was performed for PMM Messages communicated through both DSRC and
Cellular
Observations 16 out of 204 checks had a failure during tests performed under ATP
Table 5-10 Hypothesis 8 amp 9 Analysis Data Sample
TFHRC 1 TFHRC 2 TFHRC 3 TFHRC 4 TFHRC 5
Analyze the percentage of PMM messages properly processed by in-vehicle devices
MDEA Log ndash PMM Send occurrence
Check Check Check Check Check
MDEA Log ndash PMM contents
All Present All Present All Present All Present All Present
Experimental Log ndash Information entered into
Mobile Device by Traveler
VEA Log ndash PMM Receive occurrence
Check Check Check Check Check
Analyze the percentage of PMM-RSP messages properly processed by mobile devices
Experimental Log ndash Driver Acceptance
VEA Log ndash Driver acceptance
Check Check Check Check Check
VEA Log ndash PMM-RSP Send occurrence
Check Check Check Check Check
MDEA Log ndash PMM-RSP Receive occurrence
Check Check Check Check Check
MDEA Log ndash Coordination Status
Check Check Check Check Check
Experimental Log ndash Coordination Success
Display
US Department of Transportation Office of the Assistant Secretary for Research and Technology
Intelligent Transportation Systems Joint Program Office
Task 8 D2X Hub Proof-of-Concept Test Evaluation Report ndash Final | 20
Chapter 5 Experimental Analysis
TFHRC 1 TFHRC 2 TFHRC 3 TFHRC 4 TFHRC 5
Analyze the percentage of PMM-Cancel messages properly processed by in-vehicle devices
MDEA Log ndash PMM-Cancel Sent Occurrence
Check Check Check Check Check
VEA Log ndash PMM-Cancel Received
Occurrence Check Check Check Check Check
For the complete analysis please refer to Table A-7 in Appendix A
Results Considering the tests performed at TFHRC Hypothesis 8 is satisfied at a 100 level of confidence However ATP tests satisfied the hypothesis at a confidence level of 9215
Issues Identified
Some issues observed for cloud communication during ATP testing at Columbus OH
Delay in Cloud PMM-cancel for VEA ndash 8 instances Adding a trip twice ndash 5 instances Some PMMs not being cancelled ndash 3 instances
All these issues were addressed prior to TFHRC tests
TFHRC tests did not have any of the above issues
US Department of Transportation Office of the Assistant Secretary for Research and Technology
Intelligent Transportation Systems Joint Program Office
Task 8 D2X Hub Proof-of-Concept Test Evaluation Report ndash Final | 21
Chapter 5 Experimental Analysis
Hypothesis 10 The traveler can receive arrival updates from a taxi or transit vehicle
Data logs verified VEA Log ndash PMM-ARRIVE Send Occurrence
MDEA Log ndash PMM-ARRIVE receive occurrence
Analysis
Analyzed the success rate of receiving a PMM-Arrive message via DSRC
Observations One test case at TFHRC failed due to equipment failure (CCP lost its location) All other tests satisfied the hypothesis
Table 5-11 Hypothesis 10 Analysis Data Sample
TFHRC 1
TFHRC 2
TFHRC 3
TFHRC 4
TFHRC 5
TFHRC 6
TFHRC 7
DSRC (Taxi)
Analyze the success rate of receiving a PMM-Arrive message
VEA Log ndash PMM-ARRIVE
Send occurrence
Fail Check Check Check Check Check Check
MDEA Log ndash PMM-ARRIVE
Receive occurrence
Fail Check Check Check Check Check Check
For the complete analysis please refer to Table A-8 in Appendix A
Results Considering the tests at TFHRC the hypothesis is satisfied at a confidence level of 8571 12 out of 14 tests were successful
US Department of Transportation Office of the Assistant Secretary for Research and Technology
Intelligent Transportation Systems Joint Program Office
Task 8 D2X Hub Proof-of-Concept Test Evaluation Report ndash Final | 22
Chapter 5 Experimental Analysis
Hypothesis 11 amp 12 The MDEA can detect when a traveler transitions from a pedestrian to a light duty vehicle or from a light duty vehicle to a pedestrian
Data logs verified MDEA Log ndash Travel Mode Status Change Experimental Log ndash Mode Transition Detection Log
Analysis 1 Assessed the change in ldquoTravel Mode Statusrdquo after the pedestrian enters the vehicle
(The threshold value for Travel Mode Status Change is 10 secs) 2 Assessed the false positive rate of transition detection
Observations Accelerometer tests on average took 75 secs and 44 secs to detect in-vehicle and on-foot respectively However Bluetooth beacon tests on a verage took 17 secs and 1 1 secs to detect in-vehicle and on-foot respectively This quantifies the unreliable nature of Bluetooth Beacons as used in this system
Table 5-12 Hypothesis 11 amp 12 Analysis Data Sample
Mode Detection Method On-foot to In-Vehicle Transition time (Sec)
In-Vehicle to On-foot Transition Time (Sec)
Accelerometer 75 44
Bluetooth Beacon 17 11
Results Hypothesis is proved as 100 confident during the accelerometer tests However none of the tests with Bluetooth Beacon satisfied the hypothesis (all false negatives)
US Department of Transportation Office of the Assistant Secretary for Research and Technology
Intelligent Transportation Systems Joint Program Office
Task 8 D2X Hub Proof-of-Concept Test Evaluation Report ndash Final | 23
Chapter 5 Experimental Analysis
Hypothesis 13 The MDEA can coordinate maintain and cancel travel with another MDEA via Wi-Fi Direct
Data logs verified MDEA (1) Log ndash Coordination Request Received Occurrence Coordination Request Contents Coordination Acceptance Sent Occurrence Coordination Acceptance Notification Coordination Heartbeat Received Occurrence Coordination Cancel Response Sent occurrence and Coordination Disband Sent occurrence
MDEA (2) Log ndash Coordination Request Sent Occurrence Coordination Confirmation received Occurrence Coordination Heartbeat Response Sent Occurrence Coordination Acceptance received Occurrence
Analysis 1 Determined the percentage of Coordination Request Acceptance Heartbeat Cancel and
Disband messages properly processed by mobile devices 2 Assessed the message contents for consistency
Observations This test is performed in a highly-controlled environment This means selection of specific devices and designating them with specific roles This approach was chosen due to poor Wi-Fi direct performance with our system that would have otherwise hindered the ability to conduct the testing and collect the necessary data
US Department of Transportation Office of the Assistant Secretary for Research and Technology
Intelligent Transportation Systems Joint Program Office
Task 8 D2X Hub Proof-of-Concept Test Evaluation Report ndash Final | 24
Chapter 5 Experimental Analysis
Table 5-13 Hypothesis 13 Analysis Data Sample
13117 2117
TFHRC 1
TFHRC 2
TFHRC 3
TFHRC 4
TFHRC 5
TFHRC 6
TFHRC 7
TFHRC 8
TFHRC 9
TFHRC 10
Coordination Request Sent by
Y
Fai
l T
rave
ler
Y c
ould
no
t joi
n th
e ad
-hoc
trav
el g
roup
40951 Check
F
ail
Tra
vele
r Y
cou
ld
not j
oin
the
ad-h
oc tr
avel
gro
up
Check Check Check Check Check Check
Coordination Request Received
by X check Check Check Check Check Check Check Check
Request Confirmed by X
check Check Check Check Check Check Check Check
Confirmation Received by Y
Coordination Request Sent by
Z
check Check Check Check Check Check Check Check
41047 Check Check Check Check Check Check Check
Coordination Request Received
by X check Check Check Check Check Check Check Check
Request Confirmed by X
check Check Check Check Check Check Check Check
Confirmation Received by Z
Coordination Heart Beat
Transmitted by Y amp Z
check Check Check Check Check Check Check Check
check Check Check Check Check Check Check Check
Heart Beat Response
received by X
Ride Arrived Messages
check Check Check Check Check Check Check Check
41303 Check Check Check Check Check Check Check
Coordination Cancel by walking
away Check Check Check Check Check This step not tested on this day
Coordination Cancel by Manual
request This step not tested on this day
Check Check Check Check Check
Disband Group after entering into
vehicle Check Check Check Check Check
For the complete analysis please refer to Table A-9 and Table A-10 in Appendix A
Results There were 30 outliers out of 198 checks (False Negatives) in the data analyzed Hence Hypothesis 13 is satisfied at an 8484 level of confidence
US Department of Transportation Office of the Assistant Secretary for Research and Technology
Intelligent Transportation Systems Joint Program Office
Task 8 D2X Hub Proof-of-Concept Test Evaluation Report ndash Final | 25
US Department of Transportation Office of the Assistant Secretary for Research and Technology
Intelligent Transportation Systems Joint Program Office
Task 8 D2X Hub Proof-of-Concept Test Evaluation Report ndash Final | 26
Chapter 5 Experimental Analysis
Hypothesis 14 The RSU can broadcast a SPaT and MAP message via DSRC that can be received by mobile devices
Data logs verified MDEA Log ndash BSM received and PSM send occurrences
Analysis 1 Determined the percentage of SPaT messages received by mobile devices when within
100 meters of RSE Assessed message contents for consistency 2 Determined the percentage of MAP messages received by mobile devices when within
100 meters of RSE Assessed message contents for consistency
Observations Considering test 5444 all the SPa T messages were transmitted and received at a rate of 1sec Similarly all the MAP messages were transmitted and received at a rate better than 5sec
Table 5-14 Hypothesis 14 Analysis Data Sample
ID Date Message
5 13117 163842 Dsrc Rx Spat id19
6 13117 163842 Dsrc Rx Map id18
9 13117 163843 Dsrc Rx Spat id19
10 13117 163843 Dsrc Rx Bsm Lat389546323 Long -771488295 Head 2713375 Sp 0
12 13117 163843 Dsrc Rx Bsm Lat389546138 Long -771483988 Head 2559125 Sp 0
13 13117 163844 Dsrc Rx Spat id19
14 13117 163844 Dsrc Rx Bsm Lat389546323 Long -771488297 Head 2713375 Sp 0
16 13117 163844 Dsrc Rx Bsm Lat389546138 Long -771483987 Head 2559125 Sp 0
17 13117 163844 Dsrc Rx Map id18
18 13117 163844 Dsrc Rx Bsm Lat389546322 Long -7714883 Head 2713375 Sp 0
20 13117 163845 Dsrc Rx Bsm Lat389546137 Long -771483987 Head 2559125 Sp 0
21 13117 163845 Dsrc Rx Bsm Lat389546322 Long -771488302 Head 2713375 Sp 0
22 13117 163845 Dsrc Rx Spat id19
23 13117 163845 Dsrc Rx Bsm Lat389546137 Long -771483987 Head 2559125 Sp 0
25 13117 163845 Dsrc Rx Bsm Lat38954632 Long -771488302 Head 2713375 Sp 0
26 13117 163846 Dsrc Rx Bsm Lat389546135 Long -771483987 Head 2559125 Sp 0
27 13117 163846 Dsrc Rx Spat id19
29 13117 163846 Dsrc Rx Bsm Lat389546318 Long -771488303 Head 2713375 Sp 0
31 13117 163846 Dsrc Rx Map id18
Results There were no outliers (False Negatives) in the data analyzed Hence Hypothesis 14 is satisfied at a 100 level of confidence
Chapter 5 Experimental Analysis
Hypothesis 15 The RSU can store all messages received via DSRC
Data logs verified MDEA Log ndash All Occurrences of messages sent via DSRC and Message Contents RSU Log ndash Message Received Occurrence and Message Contents
Analysis 1 Assessed the percentage of messages received from mobile devices within 100 meters of
RSE Assess message contents to make sure they are consistent
Observations a Considering the message logs from test cases 5411 5444 5471 there were instances
where PSMs were logged at a rate of less than 10sec Also there were test cases that had no reception of PSMs This clearly indicates the reception issues with RSU CCP unit One prime focus for the Large-Scale Field Test is to improve the reliability of the hardware associated with RSU
b The message contents in all the DSRC messages were consistent throughout the test logs
Table 5-15 Hypothesis 15 Analysis Data Sample
Date Time
Vehicle Range and Advisory Distance wrt
Speed Speed (mph)
In Range
Out of Range
Distance (m)
RSU Log PSM
Message RateSec
13117 101316 IsBsmClose Dist
975500061708885lt AdvDist 1024200201024
255 98 8
13117 101332 IsBsmClose Dist
570797651794001lt AdvDist 666000057888
173 57 6
13117 101340 IsBsmClose Dist
57448436831453lt AdvDist 601199821728
149 57 1
13117 101529 IsBsmClose Dist
975729907380225lt AdvDist 102240014976
254 98 0
13117 101538 IsBsmClose Dist
399317028326919lt AdvDist 102240014976
250 4 1
For the complete analysis please refer to Table A-1 in Appendix A
US Department of Transportation Office of the Assistant Secretary for Research and Technology
Intelligent Transportation Systems Joint Program Office
Task 8 D2X Hub Proof-of-Concept Test Evaluation Report ndash Final | 27
Chapter 5 Experimental Analysis
Table 5-16 Data Usage Statistics
17-Jan 18-Jan 19-Jan 20-Jan 31-Jan 1-Feb Average Maximum
Total Usage (MB) 3805 626 714 2713 4873 1355 984 2713
TMX core usage (MB) 271 450 468 1991 345 90 705 1991
of TMX usage 71 72 66 73 71 66 71 73
Results The hypothesis statement of RSU being able to store all messages received via DSRC is not satisfied at 100 level of confidence due to hardware issues
US Department of Transportation Office of the Assistant Secretary for Research and Technology
Intelligent Transportation Systems Joint Program Office
Task 8 D2X Hub Proof-of-Concept Test Evaluation Report ndash Final | 28
Chapter 6 Lessons Learned and Recommendations
Lessons Learned
The Lessons Learned from the Proof-of-Concept testing are summarized as follows
The ability to reliably generate transmit and receive messages between mobile devices and connected vehicles was demonstrated
The messages to incorporate mobile devices into the C V environment functioned as designed and provided the necessary data for the prototype mobility and safety applications
The prototype safety and mobility software applications functioned well (as designed)
Limitations of technology and hardware issues caused the majority of performance shortfalls
Mixed results were achieved for the various communication methods tested
a Cellular functioned well with our system
b Wi-Fi Direct connectivity was unreliable with our system
c DSRC hardware problems caused communication problems with our system
GPS accuracy limitations were observed as expected
Wi-Fi Direct Connectivity
The connection process was prone to failure at multiple points with no indication to the application why connection failed
TFHRC success rate was achieved by selecting specific devices that worked best for specific roles otherwise a failure rate gt50 would have been expected based on earlier testing
Canvasing of developer community found similar observations no solutions for our system
Wi-Fi Direct connection process requires authorization from the user of the target device in a real world environment such a request would most likely be denied if noticed at all
US Department of Transportation Office of the Assistant Secretary for Research and Technology
Intelligent Transportation Systems Joint Program Office
Task 8 D2X Hub Proof-of-Concept Test Evaluation Report ndash Final | 29
Chapter 6 Lessons Learned and Recommendations
DSRC Hardware
Common Computer Platform (CCP) Pre-production engineering units were used which were determined to have an impedance mismatch between the DSRC chip and RF connector that caused reduction of signal strength
Arada LocoMate ME There were occasional Bluetooth connection failures to mobile devices as well as occasional DSRC transmissionreception failures Longer term it is assumed that DSRC radios will be integrated into smartphones thus obviating the current issues
Recommendations
Based on outcomes of Proof-of-Concept Testing the following prototype system design changes are recommended to be implemented prior to the larger-scale prototype field test
Add Cellular-based communication for Travel Group coordination between mobile devices
New and improved CCP units will be used for the larger-scale field test
For in-vehicle detection use Accelerometer method as the most reliable option
US Department of Transportation Office of the Assistant Secretary for Research and Technology
Intelligent Transportation Systems Joint Program Office
Task 8 D2X Hub Proof-of-Concept Test Evaluation Report ndash Final | 30
APPENDIX A Comprehensive Data Analysis Tables
Note For all the analysis results depicted below the term ldquocheckrdquo refers to the ldquosuccessrdquo of desired action
Table A-1 Complete Data Analysis ndash Hypothesis 1 4 amp 15
Date Time Vehicle Range and Advisory
Distance wrt Speed Speed In
Range Out of
Range Distance
RSU Log PSM
Message RateSec
VEA Log PSM
Message Rate
1312017 101316 IsBsmClose Dist 975500061708885lt
AdvDist 1024200201024 255 X 98 8 10
1312017 101332 IsBsmClose Dist 570797651794001lt
AdvDist 666000057888 173 X 57 6 10
1312017 101340 IsBsmClose Dist 57448436831453lt
AdvDist 601199821728 149 X 57 1 10
1312017 101529 IsBsmClose Dist 975729907380225lt
AdvDist 102240014976 254 X 98 0 10
1312017 101538 IsBsmClose Dist 399317028326919lt
AdvDist 102240014976 250 X 4 1 10
1312017 101553 IsBsmClose Dist 600719107941917lt
AdvDist 70199987616 174 X 60 0 10
1312017 102029 IsBsmClose Dist 944643508928866lt
AdvDist 1008000141984 251 X 95 0 9
1312017 102048 IsBsmClose Dist 592561932680623lt
AdvDist 628200188352 156 X 59 0 9
US Department of Transportation Office of the Assistant Secretary for Research and Technology
Intelligent Transportation Systems Joint Program Office
Task 8 D2X Hub Proof-of-Concept Test Evaluation Report ndash Final | A-1
APPENDIX A Comprehensive Data Analysis Tables
Date Time Vehicle Range and Advisory
Distance wrt Speed Speed In
Range Out of Range Distance
RSU Log PSM
Message RateSec
VEA Log PSM
Message Rate
1312017 102054 IsBsmClose Dist 616348297460404lt
AdvDist 644399845056 160 X 62 3 11
1312017 102105 IsBsmClose Dist 871180496389495lt
AdvDist 1092600137376 247 X 87 4 9
1312017 102206 IsBsmClose Dist 977301610734722lt
AdvDist 1130400006912 295 X 98 0 10
1312017 102228 IsBsmClose Dist 577576034007057lt
AdvDist 60659997552 151 X 58 2 10
1312017 102332 IsBsmClose Dist 101193300977461lt
AdvDist 10386002088 258 X 101 10 10
1312017 102356 IsBsmClose Dist 595641466972855lt
AdvDist 660599904096 164 X 60 6 10
1312017 102623 IsBsmClose Dist 100217014111125lt
AdvDist 1024200201024 253 X 100 7 10
1312017 102650 IsBsmClose Dist 540919707235241lt
AdvDist 887399925984 221 X 54 0 10
1172017 111504 IsBsmClose Dist 100564061581794lt
AdvDist 1169999927712 291 X 101 10 10
1172017 112437 IsBsmClose Dist 992912014791515lt
AdvDist 10386002088 258 X 99 10 10
1172017 112837 IsBsmClose Dist 106684353810469lt
AdvDist 1076400078336 261 X 107 10 10
US Department of Transportation Office of the Assistant Secretary for Research and Technology
Intelligent Transportation Systems Joint Program Office
Task 8 D2X Hub Proof-of-Concept Test Evaluation Report ndash Final | A-2
APPENDIX A Comprehensive Data Analysis Tables
Date Time Vehicle Range and Advisory
Distance wrt Speed Speed In
Range Out of Range Distance
RSU Log PSM
Message RateSec
VEA Log PSM
Message Rate
1172017 113148 IsBsmClose Dist 1124753473133lt AdvDist
1186199986752 268 X 112 10 10
1172017 113332 IsBsmClose Dist 106022149777593lt
AdvDist 1126799904384 260 X 106 10 10
1172017 113336 IsBsmClose Dist 59429630331283lt
AdvDist 1196999892 298 X 59 10 10
1172017 113357 IsBsmClose Dist 657937887214709lt
AdvDist 1193400191808 297 X 66 10 10
1172017 113627 IsBsmClose Dist 965542357439439lt
AdvDist 1080000180864 260 X 97 10 10
1172017 113629 IsBsmClose Dist 821301583410616lt
AdvDist 1074600027072 270 X 82 10 10
1172017 113803 IsBsmClose Dist 994884887192582lt
AdvDist 104580001152 251 X 99 10 10
1172017 113811 IsBsmClose Dist 16809952777894lt
AdvDist 106200007056 257 X 17 10 10
1172017 114114 IsBsmClose Dist 948985801452811lt
AdvDist 986399929152 245 X 95 10 10
1172017 114133 IsBsmClose Dist 141255704529106lt
AdvDist 963000067392 242 X 14 10 10
1172017 114136 IsBsmClose Dist 377627357471613lt
AdvDist 977400075168 243 X 38 10 10
US Department of Transportation Office of the Assistant Secretary for Research and Technology
Intelligent Transportation Systems Joint Program Office
Task 8 D2X Hub Proof-of-Concept Test Evaluation Report ndash Final | A-3
APPENDIX A Comprehensive Data Analysis Tables
Date Time Vehicle Range and Advisory
Distance wrt Speed Speed In
Range Out of Range Distance
RSU Log PSM
Message RateSec
VEA Log PSM
Message Rate
1172017 114403 IsBsmClose Dist 114490146784404lt
AdvDist 1225799907552 266 X 114 10 10
1172017 114415 IsBsmClose Dist 280463490772458lt
AdvDist 71100013248 161 X 28 10 10
1172017 114735 IsBsmClose Dist 102043927314914lt
AdvDist 1040399857728 259 X 102 10 10
1172017 114755 IsBsmClose Dist 185020887331204lt
AdvDist 112499985312 275 X 19 10 10
1192017 35605 IsBsmClose Dist 107928079653642lt
AdvDist 1107000145152 272 X 108 9 9
1192017 35630 IsBsmClose Dist 99759104887202lt
AdvDist 1184399935488 294 X 100 10 10
1192017 35837 IsBsmClose Dist 110291146846666lt
AdvDist 115020016848 286 X 110 10 10
1192017 40057 IsBsmClose Dist 998997459961241lt
AdvDist 1260000076896 313 X 100 10 10
1192017 40300 IsBsmClose Dist 100209094247195lt
AdvDist 106919987328 260 X 100 10 10
1192017 40410 IsBsmClose Dist 100723184500334lt
AdvDist 1097999888832 273 X 101 6 10
1192017 41103 IsBsmClose Dist 977354295877856lt
AdvDist 1008000141984 251 X 98 10 10
US Department of Transportation Office of the Assistant Secretary for Research and Technology
Intelligent Transportation Systems Joint Program Office
Task 8 D2X Hub Proof-of-Concept Test Evaluation Report ndash Final | A-4
APPENDIX A Comprehensive Data Analysis Tables
Date Time Vehicle Range and Advisory
Distance wrt Speed Speed In
Range Out of Range Distance
RSU Log PSM
Message RateSec
VEA Log PSM
Message Rate
1192017 41311 IsBsmClose Dist 10190842581135lt
AdvDist 1040399857728 259 X 102 10 10
1192017 41423 IsBsmClose Dist 995536361906761lt
AdvDist 1009799790912 251 X 100 10 10
1192017 41534 IsBsmClose Dist 10075608603652lt
AdvDist 106919987328 264 X 101 10 10
US Department of Transportation Office of the Assistant Secretary for Research and Technology
Intelligent Transportation Systems Joint Program Office
Task 8 D2X Hub Proof-of-Concept Test Evaluation Report ndash Final | A-5
APPENDIX A Comprehensive Data Analysis Tables
Table A-2 Complete Data Analysis ndash Hypothesis 2
US Department of Transportation Office of the Assistant Secretary for Research and Technology
Intelligent Transportation Systems Joint Program Office
Task 8 D2X Hub Proof-of-Concept Test Evaluation Report ndash Final | A-6
Date Test
Number PSMs Generated by
Trav X and Trav Y Transition to In Group Trav Y PSM Ceased Only Trav X PSM
Received
1312017 TFHRC 1 111116 111240 Check 111305
1312017 TFHRC 2 Grouping Failed Grouping Failed Grouping Failed Grouping Failed
1312017 TFHRC 3 112346 112448 Check 112508
1312017 TFHRC 4 114208 114301 Check 114345
1312017 TFHRC 5 114609 114658 Check 114721
1312017 TFHRC 6 115222 115313 Check 115342
1182017 ATP 1 104400 104527 Check 104601
1182017 ATP 2 105356 105455 Check 105546
1182017 ATP 3 110059 110150 Check 110322
1182017 ATP 4 111222 111310 Check 111329
1182017 ATP 5 111515 111616 Check 111630
1182017 ATP 6 111823 111906 Check 111917
1182017 ATP 7 112116 112157 Check 112209
1182017 ATP 8 112814 112855 Check 112917
1182017 ATP 9 113142 113230 Check 113248
1182017 ATP 10 113501 113545 Check 113608
1192017 ATP 11 44728 44842 Check 45007
1192017 ATP 12 Radio Failure Test Terminated Radio Failure Test Terminated Radio Failure Test Terminated Radio Failure Test Terminated
1192017 ATP 13 45548 45637 Check 45728
1192017 ATP 14 45946 50047 Check 50107
1192017 ATP 15 50353 50444 Check 50513
1192017 ATP 16 50730 50823 Check 50839
APPENDIX A Comprehensive Data Analysis Tables
Table A-3 Complete Data Analysis ndash Hypothesis 3
US Department of Transportation Office of the Assistant Secretary for Research and Technology
Intelligent Transportation Systems Joint Program Office
Task 8 D2X Hub Proof-of-Concept Test Evaluation Report ndash Final | A-7
Date Description
MDEA not in Vehicle
MDEA Transmits
PSMs Time of MDEA
Mode Transition
MDEA Ceases Transmitting
PSMs
1312017 TFHRC 1 Check Check 0443101852 Check
1312017 TFHRC 2 Check Check 0445243056 Check
1312017 TFHRC 3 Check Check 0447569444 Check
1312017 TFHRC 4 Check Check 0448888889 Check
1312017 TFHRC 5 Check Check 045005787 Check
1312017 TFHRC 6 Check Check 0451666667 Check
1172017 ATP 1 Check Check 0501898148 Check
1172017 ATP 2 Check Check 0504201389 Check
1172017 ATP 3 Check Check 0506215278 Check
1172017 ATP 4 Check Check 0507858796 Check
1172017 ATP 5 Check Check 0508981481 Check
1172017 ATP 6 Check Check 0510219907 Check
1172017 ATP 7 Check Check 0511736111 Check
1172017 ATP 8 Check Check 05128125 Check
1172017 ATP 9 Check Check 0513831019 Check
1172017 ATP 10 Check Check 0514884259 Check
1172017 ATP 11 Check Check 0185590278 Check
1172017 ATP 12 Check Check 0187210648 Check
1172017 ATP 13 Check Check 0188425926 Check
1172017 ATP 14 Check Check 0190289352 Check
1172017 ATP 15 Check Check 0191863426 Check
APPENDIX A Comprehensive Data Analysis Tables
Table A-4 Complete Data Analysis ndash Hypothesis 5 (VEA)
Test Number
Type of Message
True Distance (m)
Speed (MPH)
Expected Distance (m)
Difference (m)
TFHRC1
Advisory 7584 2471 9942 2358
Alert 5545 2523 5780 235
Warning 4874 2498 4910 036
TFHRC2
Advisory 8552 2595 10441 1889
Alert 5167 2461 5588 421
Warning 4515 2433 4751 236
TFHRC3
Advisory 7876 2381 9580 1704
Alert 5827 2590 5989 162
Warning 5124 2624 5222 098
TFHRC4
Advisory 7529 2818 11338 3809
Alert 6047 2744 6482 435
Warning 5323 2714 5450 127
TFHRC5
Advisory 9292 2404 9672 380
Alert 5350 2423 5472 122
Warning 4081 2352 4556 475
ATP1
Advisory 000 000
Alert 000 000
Warning 000 000
ATP2
Advisory 5787 1644 6614 827
Alert 3074 1640 3289 215
Warning 2627 1640 2947 320
ATP3
Advisory 4204 1685 6779 2575
Alert 3300 1672 3370 070
Warning 2854 1658 2985 131
ATP4
Advisory 4296 1753 7053 2757
Alert 3346 1791 3679 333
Warning 2871 1755 3194 323
ATP5
Advisory 000 000
Alert 000 000
Warning 1069 1706 3088 2019
ATP6
Advisory 3632 1640 6598 2966
Alert 000 000
Warning 2770 1594 2850 080
US Department of Transportation Office of the Assistant Secretary for Research and Technology
Intelligent Transportation Systems Joint Program Office
Task 8 D2X Hub Proof-of-Concept Test Evaluation Report ndash Final | A-8
APPENDIX A Comprehensive Data Analysis Tables
Test Number
Type of Message
True Distance (m)
Speed (MPH)
Expected Distance (m)
Difference (m)
ATP7
Advisory 000 000
Alert 000 000
Warning 1919 1887 3483 1564
ATP8
Advisory 4492 1741 7005 2513
Alert 3113 1687 3409 296
Warning 2661 1680 3032 371
ATP9
Advisory 4694 1628 6550 1856
Alert 2991 1570 3113 122
Warning 2572 1549 2756 184
ATP10
Advisory 000 000
Alert 000 000
Warning 650 2505 4927 4277
ATP11
Advisory 000 000
Alert 000 000
Warning 1914 2398 4666 2752
ATP12
Advisory 000 000
Alert 000 000
Warning 460 2293 4415 3955
ATP13
Advisory 000 000
Alert 000 000
Warning 2732 2535 5001 2269
ATP14
Advisory 000 000
Alert 000 000
Warning 2358 2361 4577 2219
ATP15
Advisory 000 000
Alert 000 000
Warning 1107 2459 4814 3707
ATP16
Advisory 5668 1982 7974 2306
Alert 000 000
Warning 1502 1906 3525 2023
ATP17
Advisory 000 000
Alert 000 000
Warning 3183 2420 4720 1537
US Department of Transportation Office of the Assistant Secretary for Research and Technology
Intelligent Transportation Systems Joint Program Office
Task 8 D2X Hub Proof-of-Concept Test Evaluation Report ndash Final | A-9
Table A-5 Complete Data Analysis ndash Hypothesis 6 (MDEA)
Test Number
Type of Message
True Distance (m)
Speed (MPH)
Expected Distance (m)
Difference (m)
TFHRC1
Advisory 8756 2290 9213 457
Alert 5320 2509 5736 416
Warning 4651 2487 4883 232
TFHRC2
Advisory 9928 2514 10115 187
Alert 5276 2447 5546 270
Warning 4624 2415 4707 084
TFHRC3
Advisory 8952 2304 9270 318
Alert 5595 2603 6030 436
Warning 4890 2617 5205 315
TFHRC4
Advisory 9752 2514 10115 363
Alert 6290 2769 6564 274
Warning 4844 2693 5396 552
TFHRC5
Advisory 9613 2406 9680 067
Alert 5242 2420 5463 221
Warning 4080 2357 4568 488
ATP1
Advisory 5938 2183 8783 2845
Alert 4314 2120 4580 266
Warning 3644 2111 3989 345
ATP2
Advisory 6452 1641 6602 150
Alert 3296 1691 3419 123
Warning 2600 1601 2865 265
ATP3
Advisory 6212 1628 6550 338
Alert 3200 1655 3327 127
Warning 2707 1641 2949 242
ATP4
Advisory 6420 1646 6622 202
Alert 3300 1780 3650 350
Warning 2878 1704 3084 206
ATP5
Advisory 6673 1677 6747 074
Alert 3400 1847 3828 428
Warning 2972 1807 3307 335
ATP6
Advisory 6100 1628 6550 450
Alert 3100 1637 3281 181
Warning 2500 1597 2857 357
APPENDIX A Comprehensive Data Analysis Tables
US Department of Transportation Office of the Assistant Secretary for Research and Technology
Intelligent Transportation Systems Joint Program Office
Task 8 D2X Hub Proof-of-Concept Test Evaluation Report ndash Final | A-10
APPENDIX A Comprehensive Data Analysis Tables
Test Number
Type of Message
True Distance (m)
Speed (MPH)
Expected Distance (m)
Difference (m)
ATP7
Advisory 7500 1972 7934 434
Alert 3882 1914 4008 126
Warning 3400 1946 3614 214
ATP8
Advisory 6659 1744 7017 358
Alert 3263 1682 3396 133
Warning 2900 1682 3037 137
ATP9
Advisory 6605 1659 6675 070
Alert 2900 1556 3078 178
Warning 2365 1561 2781 416
ATP10
Advisory 9214 2491 10022 808
Alert 5859 2688 6301 442
Warning 5200 2644 5273 073
ATP11
Advisory 8485 2487 10006 1521
Alert 5376 2487 5668 292
Warning 4716 2483 4873 157
ATP12
Advisory 9001 2433 9789 788
Alert 5395 2420 5463 068
Warning 4103 2330 4503 400
ATP13
Advisory 8615 2559 10296 1681
Alert 000 000 000 000
Warning 4930 2581 5115 185
ATP14
Advisory 6119 2491 10022 3903
Alert 5500 2491 5681 181
Warning 3800 2402 4676 876
ATP15
Advisory 7546 2603 10473 2927
Alert 6000 2661 6215 215
Warning 3100 2603 5170 2070
ATP16
Advisory 7931 2089 8405 474
Alert 3995 1950 4106 111
Warning 3500 1923 3563 063
ATP17
Advisory 8243 2049 8244 001
Alert 5260 2465 5601 341
Warning 4718 2438 4763 045
US Department of Transportation Office of the Assistant Secretary for Research and Technology
Intelligent Transportation Systems Joint Program Office
Task 8 D2X Hub Proof-of-Concept Test Evaluation Report ndash Final | A-11
Table A-6 Complete Data Analysis ndash Hypothesis 7
Date Test
Number
User State Change Is
Safe Icon False
Properly Processed
User State Change Is
Safe Icon True
Properly Processed
1312017 TFHRC 1 111438 X 111504 X
1312017 TFHRC 3 112533 X 112619 X
1312017 TFHRC 4 114400 X 114438 X
1312017 TFHRC 5 114801 X 114829 X
1312017 TFHRC 6 115408 X 115444 X
1182017 ATP 1 105056 X 105116 X
1182017 ATP 2 105622 X 105656 X
1182017 ATP 3 110348 X 110436 X
1182017 ATP 4 111355 X 111417 X
1182017 ATP 5 111655 X 111717 X
1182017 ATP 6 111947 X 112007 X
1182017 ATP 7 112235 X 112305 X
1182017 ATP 8 112937 X 113013 X
1182017 ATP 9 113313 X 113353 X
1182017 ATP 10 113636 X 113708 X
1192017 ATP 11 45035 X 45057 X
1192017 ATP 13 45806 X 45828 X
1192017 ATP 14 50144 X 50202 X
1192017 ATP 15 50542 X 50600 X
1192017 ATP 16 50903 X 50929 X
APPENDIX A Comprehensive Data Analysis Tables
US Department of Transportation Office of the Assistant Secretary for Research and Technology
Intelligent Transportation Systems Joint Program Office
Task 8 D2X Hub Proof-of-Concept Test Evaluation Report ndash Final | A-12
APPENDIX A Comprehensive Data Analysis Tables
Table A-7 Complete Data Analysis ndash Hy pothesis 8 amp 9
US Department of Transportation Office of the Assistant Secretary for Research and Technology
Intelligent Transportation Systems Joint Program Office
Task 8 D2X Hub Proof-of-Concept Test Evaluation Report ndash Final | A-13
Test Number
Analyze the percentage of PMM messages properly processed by
in-vehicle devices Analyze the percentage of PMM-RSP messages
properly processed by mobile devices
Analyze the percentage of PMM-Cancel messages
properly processed by in-vehicle devices
MDEA Log ndash PMM Send
occurrence
MDEA Log ndash
PMM contents
VEA Log ndash PMM
Receive occurrence
VEA Log ndash Driver
acceptance
VEA Log ndash PMM-RSP
Send occurrence
MDEA Log ndash PMM-RSP
Receive occurrence
MDEA Log ndash Coordination
Status
MDEA Log ndash PMM-
Cancel Sent Occurrence
VEA Log ndash PMM-
Cancel Received
Occurrence
TFHRC 1 Check All Present Check Check Check Check Check Check Check
TFHRC 2 Check All Present Check Check Check Check Check Check Check
TFHRC 3 Check All Present Check Check Check Check Check Check Check
TFHRC 4 Check All Present Check Check Check Check Check Check Check
TFHRC 5 Check All Present Check Check Check Check Check Check Check
ATP 1 Check All Present Check Check Check Check Check Check Check
ATP 2 Check All Present Check Check Check Check Check Check Check
ATP 3 Check All Present Check Check Check Check Check Check Check
ATP 4 Check All Present Check Check Check Check Check Check Check
ATP 5 Check All Present Check Check Check Check Check Check Check
ATP 6 Check All Present Check Check Check Check Check Check Check
ATP 7 Check All Present Check Check Check Check Check Check Check
ATP 8 Check All Present Check Check Check Check Check Check Check
ATP 9 Check All Present Check Check Check Check Check Check Check
ATP 10 Check All Present Check Check Check Check Check Check Check
APPENDIX A Comprehensive Data Analysis Tables
Test Number
Analyze the percentage of PMM messages properly processed by
in-vehicle devices Analyze the percentage of PMM-RSP messages
properly processed by mobile devices
Analyze the percentage of PMM-Cancel messages
properly processed by in-vehicle devices
MDEA Log ndash PMM Send occurrence
MDEA Log ndash PMM
contents
VEA Log ndash PMM
Receive occurrence
VEA Log ndash Driver
acceptance
VEA Log ndash PMM-RSP
Send occurrence
MDEA Log ndash PMM-RSP
Receive occurrence
MDEA Log ndash Coordination
Status
MDEA Log ndash PMM-
Cancel Sent Occurrence
VEA Log ndash PMM-
Cancel Received
Occurrence
ATP 11 Check All Present Check Check Check Check Check Check Check
ATP 12 Check All Present Check Check Check Check Check Check Check
ATP 13 Check All Present Check Check Check Check Check Check Check
ATP 14 Check All Present Check Check Check Check Check Check Check
ATP 15 Check All Present Check Check Check Check Check Check Check
ATP 16 Check All Present Check Check Check Check Check Check Check
ATP 17 Check All Present Check Check Check Check Check Check Check
US Department of Transportation Office of the Assistant Secretary for Research and Technology
Intelligent Transportation Systems Joint Program Office
Task 8 D2X Hub Proof-of-Concept Test Evaluation Report ndash Final | A-14
Table A-8 Complete Data Analysis ndash Hy pothesis 10
Date Test Number
Analyze the Success Rate of Receiving a PMM-Arrive Message
VEA Log ndash PMM-ARRIVE Send Occurrence MDEA Log ndash PMM-ARRIVE Receive Occurrence
1312017 TFHRC 1 Fail Fail
1312017 TFHRC 2 Check Check
1312017 TFHRC 3 Check Check
1312017 TFHRC 4 Check Check
1312017 TFHRC 5 Check Check
1312017 TFHRC 6 Check Check
1312017 TFHRC 7 Check Check
1182017 ATP 1 Not Available Check
1182017 ATP 2 Not Available Check
1182017 ATP 3 Not Available Check
1182017 ATP 4 Not Available Check
1182017 ATP 5 Not Available Check
1182017 ATP 6 Not Available Check
1182017 ATP 7 Not Available Check
1182017 ATP 8 Not Available Check
1182017 ATP 9 Not Available Check
1182017 ATP 10 Not Available Check
1202017 ATP 11 Check Check
1202017 ATP 12 Check Check
1202017 ATP 13 Check Check
1202017 ATP 14 Check Check
1202017 ATP 15 Check Check
APPENDIX A Comprehensive Data Analysis Tables
US Department of Transportation Office of the Assistant Secretary for Research and Technology
Intelligent Transportation Systems Joint Program Office
Task 8 D2X Hub Proof-of-Concept Test Evaluation Report ndash Final | A-15
APPENDIX A Comprehensive Data Analysis Tables
Table A-9 Complete Data Analysis ndash Hypothesis 13 (Part A)
US Department of Transportation Office of the Assistant Secretary for Research and Technology
Intelligent Transportation Systems Joint Program Office
Task 8 D2X Hub Proof-of-Concept Test Evaluation Report ndash Final | A-16
Test Number
Coordination Request Sent
by Y
Coordination Request
Received by X
Request Confirmed
by X Confirmation Received by Y
Coordination Request Sent
by Z
Coordination Request
Received by X
Request Confirmed
by X Confirmation Received by Z
Coordination Heart Beat
Transmitted by Y amp Z
Heart Beat Response received
by X
Ride Arrived
Messages
TFHRC 1
Fail Traveler Y could not join the ad-hoc travel group
TFHRC 2
Check check check check 41047 check check check check check 41303
TFHRC 3
Check Check Check Check Check Check Check Check Check Check Check
TFHRC 4
Fail Traveler Y could not join the ad-hoc travel group
TFHRC 5
Check Check Check Check Check Check Check Check Check Check Check
TFHRC 6
Check Check Check Check Check Check Check Check Check Check Check
TFHRC 7
Check Check Check Check Check Check Check Check Check Check Check
TFHRC 8
Check Check Check Check Check Check Check Check Check Check Check
TFHRC 9
Check Check Check Check Check Check Check Check Check Check Check
TFHRC 10
Check Check Check Check Check Check Check Check Check Check Check
ATP 1 Check Check Check Check Check Check Check Check Check Check Check
ATP 2 Check Check Check Check Check Check Check Check Check Check Check
Test Number
Coordination Request Sent
by Y
Coordination Request
Received by X
Request Confirmed
by X Confirmation Received by Y
Coordination Request Sent
by Z
Coordination Request
Received by X
Request Confirmed
by X Confirmation Received by Z
Coordination Heart Beat
Transmitted by Y amp Z
Heart Beat Response received
by X
Ride Arrived
Messages
ATP 3 Check Check Check Check Check Check Check Check Check Check Check
ATP 4 Check Check Check Check Check Check Check Check Check Check Check
ATP 5 Check Check Check Check Check Check Check Check Check Check Check
ATP 6 Check Check Check Check Check Check Check Check Check Check Check
ATP 7 Check Check Check Check Check Check Check Check Check Check No ride
arrives received
ATP 8 Check Check Check Check Check Check Check Check Check Check Check
ATP 9 Check Check Check Check Check Check Check Check Check Check No ride
arrives received
ATP 10 Check Check Check Check Check Check Check Check Check Check Check
ATP 11 Check Check Check Check Check Check Check Check Check Check Check
ATP 12 Check Check Check Check Check Check Check Check Check Check No ride
arrives received
ATP 13 Check Check Check Check Check Check Check Check Check Check Check
ATP 14 Check Check Check Check Check Check Check Check Check Check Check
ATP 15 Check Check Check Check Check Check Check Check Check Check Check
APPENDIX A Comprehensive Data Analysis Tables
US Department of Transportation Office of the Assistant Secretary for Research and Technology
Intelligent Transportation Systems Joint Program Office
Task 8 D2X Hub Proof-of-Concept Test Evaluation Report ndash Final | A-17
APPENDIX A Comprehensive Data Analysis Tables
Table A-10 Complete Data Analysis ndash Hypothesis 13 (Part B)
US Department of Transportation Office of the Assistant Secretary for Research and Technology
Intelligent Transportation Systems Joint Program Office
Task 8 D2X Hub Proof-of-Concept Test Evaluation Report ndash Final | A-18
Test Number Coordination Cancel by
Walking Away Coordination Cancel by
Manual Request Disband Group after
Entering into Vehicle
TFHRC 1 Check This step not tested on this day
TFHRC 2 Check This step not tested on this day
TFHRC 3 Check This step not tested on this day
TFHRC 4 Check This step not tested on this day
TFHRC 5 Check This step not tested on this day
TFHRC 6 This step not tested on this day Check Check
TFHRC 7 This step not tested on this day Check Check
TFHRC 8 This step not tested on this day Check Check
TFHRC 9 This step not tested on this day Check Check
TFHRC 10 This step not tested on this day Check Check
ATP 1 Check Check Check
ATP 2 Check Check Check
ATP 3 Check Check Check
ATP 4 Check Check Check
ATP 5 Check Check Check
ATP 6 Check Check Check
ATP 7 Check Check Check
ATP 8 Check Check Check
ATP 9 Check Check Check
APPENDIX A Comprehensive Data Analysis Tables
Test Number Coordination Cancel by
Walking Away Coordination Cancel by
Manual Request Disband Group after Entering into Vehicle
ATP 10 Check Check Check
ATP 11 Fail Could not cancel by distance Check Check
ATP 12 Check Check Check
ATP 13 Fail Could not cancel by distance Check Check
ATP 14 Check Check Check
ATP 15 Check Check Check
US Department of Transportation Office of the Assistant Secretary for Research and Technology
Intelligent Transportation Systems Joint Program Office
Task 8 D2X Hub Proof-of-Concept Test Evaluation Report ndash Final | A-19
APPENDIX A Comprehensive Data Analysis Tables
APPENDIX B Acronyms and Abbreviations
ATG Ad-Hoc Travel Group
ATP Acceptance Test Plan
BSM Basic Safety Message
CCP Common Computing Platform
CV Connected Vehicle
DSRC Dedicated Short Range Communications
EPS Experimental Prototype System
FHWA Federal Highway Administration
FR Functional Requirement
ITS Intelligent Transportation Systems
LDV Light-Duty Vehicle
MAP Map Data
MDEA Mobile Device Experimental Application
MGL Message Logging
OBU On-board Unit
PMM Personal Mobility Message
PMM-ARRIVE Personal Mobility Message Arrival Message
PMM-CANCEL Personal Mobility Message Cancel Message
PMM-RSP Personal Mobility Message Response Message
PR Performance Requirement
PSM Personal Safety Message
REA Roadside Experimental Application
RSU Roadside Unit
SFY Safety
SIR System Interface Requirement
SMP SPaT and MAP
SPaT Signal Phasing and Timing
SyRS System Requirements Specifications
TFHRC Turner-Fairbank Highway Research Center
US DOT US Department of Transportation
US Department of Transportation Office of the Assistant Secretary for Research and Technology
Intelligent Transportation Systems Joint Program Office
Task 8 D2X Hub Proof-of-Concept Test Evaluation Report ndash Final |B-1
VEA Vehicle Experimental Application
Wi-Fi Wireless Fidelity
APPENDIX B Acronyms and Abbreviations
US Department of Transportation Office of the Assistant Secretary for Research and Technology
Intelligent Transportation Systems Joint Program Office
Task 8 D2X Hub Proof-of-Concept Test Evaluation Report ndash Final | B-2
APPENDIX C Terms and Definitions
Basic Safety Message (BSM)
Connected vehicle message type which contains vehicle safety-related information that is broadcast to surrounding vehicles
Bluetooth Short range wireless technology used to exchange data between enabled devices
Cellular Uses short-range radio stations to cover areas of communication
Connected Vehicle A vehicle that can communicate with other vehicles and infrastructure via communication media such as DSRC Wi-Fi cellular or Bluetooth
Coordinated Messages are coordinated when two or more mobile devices have establish a travel group based on the same origin destination and
time and function as a single cohesive senderrecipient
CV Inspector An application that verifies if the Mobile Device is broadcasting messages to Connected Vehicles
Destination The end point of a travelerrsquos trip
DSRC Dedicated Short-Range Communications a low-latency high-reliability two-way communications tool used for sending transportation safety
messages
Light-Duty Vehicle Of or relating to vehicles that way less than 4000 lbs
Message Type Type of personal safety or personal mobility message that is transmitted based on the technology used and level of coordination available
Personal Mobility Message (PMM)
Similar to PDM message intended for the exchange of mobility messages between individual travelers and vehiclesinfrastructure via
mobile device
Personal Safety Message (PSM)
Similar to BSM message intended to transmit low-latency urgent safety messages between individual travelers and vehiclesinfrastructure via
mobile device
Test Case A set of conditions or variables that a Tester can determine if system meets requirements
Transit Vehicle Large vehicles mainly used for public transportation as well as support services
Transmitting The state in which a traveler has opted in and is sendingreceiving messages via mobile device
Uncoordinated Messages are uncoordinated when travel groups are not established (see coordinated definition)
Wi-Fi Local area wireless technology that allows enabled devices to connect to the Internet
APPENDIX A Comprehensive Data Analysis Tables
US Department of Transportation Office of the Assistant Secretary for Research and Technology
Intelligent Transportation Systems Joint Program Office
Task 8 D2X Hub Proof-of-Concept Test Evaluation Report ndash Final |C-1
ITS Joint Program Office-HOIT 1200 New Jersey Avenue SE
Washington DC 20590
Toll-Free ldquoHelp Linerdquo 866-367-7487 wwwitsdotgov
FHWA-JPO-18-263
- Structure Bookmarks
-
- Sharing Data between Mobile Devices Connected Vehicles and Infrastructure Task 8 D2X Hub Proof-of-Concept Test Evaluation Report wwwitsdotgovindexhtm Final Report mdash October 25 2017 FHWA-JPO-18-623
- Revision History
- Table of Contents
- Chapter 1 Scope
- Chapter 2 Referenced Documents
- Chapter 3 Test Conduct
- Chapter 4 Experimental Analysis Results Summary
- Chapter 5 Experimental Analysis
- Chapter 6 Lessons Learned and Recommendations
- APPENDIX A Comprehensive Data Analysis Tables
- APPENDIX B Acronyms and Abbreviations
- APPENDIX C Terms and Definitions
-

US Department of Transportation Office of the Assistant Secretary for Research and Technology
Intelligent Transportation Systems Joint Program Office
Task 8 D2X Hub Proof-of-Concept Test Evaluation Report ndash Final | iii
Table of Contents
Revision History i Table of Contents iii Chapter 1 Scope 1 Chapter 2 Referenced Documents 3 Chapter 3 Test Conduct 5 Chapter 4 Experimental Analysis Results Summary 7 Chapter 5 Experimental Analysis 9
Hypothesis 1 The MDEA only broadcasts PSMs when in the range of a vehicle broadcasting a BSM 9
Hypothesis 2 The overall MDEA DSRC message broadcast rate is lower during travel group coordination 10
Hypothesis 3 MDEA Log ndash Travel Mode Status PSM send occurrences 11 Hypothesis 4 The Mobile Device can broadcast a PSM a ra dius of 250 meters 10
Hz under clear unobstructed conditions regardless of where the mobile device is located on the pedestrianrsquos person or clothing 12
Hypothesis 5 Vehicles OBUs can capture and process Mobile Device PSMs and issue warnings at sufficient distance for drivers to avoid imminent pedestrian collision 13
Hypothesis 6 Mobile Devices can capture and process Vehicle BSMs and issue warnings in time for pedestrians to avoid imminent vehicle collision 15
Hypothesis 7 MDEA Log ndash GPS Location SafeUnsafe Zone Status and MAP Message Contents 18
Hypothesis 8 amp 9 The VEA can coordinate taxi travel requests from an MDEA20 Hypothesis 10 The traveler can receive arrival updates from a taxi or transit
vehicle 22 Hypothesis 11 amp 12 The MDEA can detect when a traveler transitions from a
pedestrian to a light duty vehicle o r from a light duty vehicle to a pe destrian 23 Hypothesis 13 The MDEA can coordinate maintain and cancel travel with
another MDEA via Wi-Fi Direct 24 Hypothesis 14 The RSU can broadcast a SPaT and MAP message via DSRC that
can be received by mobile devices 26 Hypothesis 15 The RSU can store all messages received via DSRC 27
Chapter 6 Lessons Learned and Recommendations 29
Lessons Learned 29 Recommendations 30
APPENDIX A Comprehensive Data Analysis Tables A-1 APPENDIX B Acronyms and Abbreviations B-1 APPENDIX C Terms and Definitions C-1
Table of Contents
List of Tables
Table 4-1 Experimental Analysis Results Summary 7 Table 5-1 Hypothesis 1 Analysis Data Sample 9 Table 5-2 Hypothesis 2 Analysis Data Sample 10 Table 5-3 Hypothesis 3 Analysis Data Sample 11 Table 5-4 Hypothesis 4 Analysis Data Sample 12 Table 5-5 Hypothesis 5 Analysis Data Sample 14 Table 5-6 Total and Average Differences between Actual and Calculated Advisories
Alerts and Warnings (VEA) 14 Table 5-7 Hypothesis 6 Analysis Data Sample 16 Table 5-8 Total and Average Differences between Actual and Calculated Advisories
Alerts and Warnings (MDEA) 16 Table 5-9 Hypothesis 7 Analysis Data Sample 18 Table 5-10 Hypothesis 8 amp 9 Analysis Data Sample 20 Table 5-11 Hypothesis 10 Analysis Data Sample 22 Table 5-12 Hypothesis 11 amp 12 Analysis Data Sample 23 Table 5-13 Hypothesis 13 Analysis Data Sample 25 Table 5-14 Hypothesis 14 Analysis Data Sample 26 Table 5-15 Hypothesis 15 Analysis Data Sample 27 Table 5-16 Data Usage Statistics 28 Table A-1 Complete Data Analysis ndash Hypothesis 1 4 amp 15 A-1 Table A-2 Complete Data Analysis ndash Hypothesis 2 A-6 Table A-3 Complete Data Analysis ndash Hypothesis 3 A-7 Table A-4 Complete Data Analysis ndash Hypothesis 5 (VEA) A-8 Table A-5 Complete Data Analysis ndash Hypothesis 6 (MDEA)A-10 Table A-6 Complete Data Analysis ndash Hypothesis 7 A-12 Table A-7 Complete Data Analysis ndash Hypothesis 8 amp 9 A-13 Table A-8 Complete Data Analysis ndash Hypothesis 10 A-15 Table A-9 Complete Data Analysis ndash Hypothesis 13 (Part A) A-16 Table A-10 Complete Data Analysis ndash Hypothesis 13 (Part B) A-18
List of Figures
Figure 3-1 Turner-Fairbank Highway Research Center ndash Testing Location 6 Figure 5-1 Advisory Alert and Warning Distances with Respect to VEA 13 Figure 5-2 Advisory Alert and Warning Distances with Respect to MDEA 15 Figure 5-3 Cross Track Distance between Pedestrian and Vehicle Path 17 Figure 5-4 Safe and Unsafe Zones at TFHRC Test Site 19
US Department of Transportation Office of the Assistant Secretary for Research and Technology
Intelligent Transportation Systems Joint Program Office
Task 8 D2X Hub Proof-of-Concept Test Evaluation Report ndash Final | iv
Chapter 1 Scope
This D2X Hub Proof-of-Concept Test Evaluation Report presents results of the experimental data analysis performed in accordance with the Experimental Plan for the proof-of-concept version of the D2X Hub prototype system The data set analyzed includes the tests formally conducted at Battelle facilities (ie prototype acceptance test) as well as those conducted at Turner-Fairbank Highway Research Center (TFHRC) during January 2017 and concluding February 1 2017 Since the same experimental plan was used for tests conducted at Battelle facilities as well as TFHRC data from both the tests were fused to perform the data analysis This report provides the results of the data analysis Detailed test logs and digital data logs are not included in their entirety
The Proof-of-Concept testing and subsequent data analysis was conducted in accordance with the Proof-of-Concept Experimental Plan The Experimental Plan was designed to answer the research questions posed by the subject contract The same Acceptance Test Plan (ATP) procedures used for Acceptance Testing were used to supply the data for Proof-of-Concept testing and analysis
The purpose of the Proof-of-Concept testing was to evaluate the technical functionality of the system but not to test the systemrsquos ability to address user needs Further the Proof-of-Concept testing will provide basis for recommended prototype system changes and enhancements to be implemented for the larger-scale Prototype Field Test to be conducted in June 2017 at Battelle and the Ohio State University (OSU) Additionally this testing provided the first step towards answering the research questions in the contract
Finally it should be noted that the subject system is an experimental system for the purpose of answering research questions System performance is limited by the quality of input data and the limits of the underlying technology and equipment employed As such there is not a specific threshold for an ldquoacceptablerdquo level of overall system performance All results whether ldquopassrdquo or ldquofailrdquo are instructive outcomes of this testing to answer the subject research questions
US Department of Transportation Office of the Assistant Secretary for Research and Technology
Intelligent Transportation Systems Joint Program Office
Task 8 D2X Hub Proof-of-Concept Test Evaluation Report ndash Final | 1
Chapter 2 Referenced Documents
Battelle Memorial Institute
FHWA-JPO-16-423 Task 3 System Requirements Specifications (SyRS) for Sharing Data between Mobile Devices Connected Vehicles and Infrastructure (July 14 2016)
FHWA-JPO-17-476 Task 4 System Architecture and Design Document for Sharing Data between Mobile Devices Connected Vehicles and Infrastructure (October 26 2016)
FHWA-JPO-17-475 Task 5 Prototype Proof-of-Concept Field Demonstration Experimental Field Demonstration Site Plan for Sharing Data between Mobile Devices Connected Vehicles and Infrastructure (October 6 2016)
FHWA-JPO-17-477 Task 6 Prototype Acceptance Test Plan for Sharing Data between Mobile Devices Connected Vehicles and Infrastructure (December 21 2016)
FHWA-JPO-17-507 Task 6 Prototype Acceptance Test Summary Report for Sharing Data between Mobile Devices Connected Vehicles and Infrastructure (February 10 2017)
US Department of Transportation Office of the Assistant Secretary for Research and Technology
Intelligent Transportation Systems Joint Program Office
Task 8 D2X Hub Proof-of-Concept Test Evaluation Report ndash Final | 3
Chapter 3 Test Conduct
Prototype Proof-of-Concept tests for safety and mobility were conducted at TFHRC on January 30 through February 1 2017 in a controlled environment A two-lane undivided road at TFHRC with light traffic was selected as the test route The parking lot adjacent to the selected route was used to establish a temporary Road Side Unit (RSU) and a traveler taxi stop Three vehicles were used in this test one each for a simulated taxi a light-duty vehicle and to power the RSU The RSU Experimental Application (REA) and Vehicle Experimental Application (VEA) were installed in the RSU and taxi vehicles respectively The light-duty vehicle had an OBU installed that generated BSMs only Up to three mobile devices installed with the Mobile Device Experimental Application (MDEA) were used in this testing depending on the test case requirements After installation of test equipment at the test location checks were conducted to ensure message generation transmission and reception
Seven Battelle staff participated in the testing by carrying out the roles of travelers pedestrians vehicle operator and test engineers A total of sixteen (16) test cases were employed at both TFHRC and Battelle facilities to generate the data necessary for experimental analysis Five (5) iterations were performed for each test case at TFHRC while 15 iterations performed at Battelle facilities were also included in the data set
The tests associated with coordination of mobile devices were performed in a highly-controlled environment This meant selection of specific devices and designating them with specific roles This approach was chosen due to poor Wi-Fi Direct performance that would have otherwise hindered the ability to conduct the testing and collect the necessary data
Detection of a pedestrian within a 2 meter cluster radius was a challenge based on earlier testing This error in GPS accuracy was balanced by increasing the cluster radius to 7 meters for all the tests at TFHRC This modification in cluster radius increased the efficiency of pedestrian detection by closing out the difference in Cross Track Distancersquo Cross track distance is the perpendicular distance between pedestrian and light duty vehicle path
The TFHRC test site location and route are shown in Figure 3-1
US Department of Transportation Office of the Assistant Secretary for Research and Technology
Intelligent Transportation Systems Joint Program Office
Task 8 D2X Hub Proof-of-Concept Test Evaluation Report ndash Final | 5
Chapter 3 Test Conduct
Source Battelle Google Maps January 2017
Figure 3-1 Turner-Fairbank Highway Research Center ndash Testing Location
US Department of Transportation Office of the Assistant Secretary for Research and Technology
Intelligent Transportation Systems Joint Program Office
Task 8 D2X Hub Proof-of-Concept Test Evaluation Report ndash Final | 6
Chapter 4 Experimental Analysis Results Summary
Overall the testing and subsequent analysis showed the ability to reliably generate transmit and receive messages between mobile devices and connected vehicles The messages to incorporate mobile devices into the CV environment functioned as designed and provided the necessary data for the prototype mobility and safety applications to perform their functions While the prototype safety and mobility software applications functioned well (as designed) the performance shortfalls that were observed are largely attributed to current technology limitations and hardware issues
Mixed results were achieved for the various communication methods tested Cellular functioned well while Wi-Fi Direct connectivity was unreliable and DSRC hardware problems caused communication problems with our system GPS accuracy limitations were observed as expected
Table 4-1 provides a summary of the experimental analysis results by hypothesis while Chapter 5 provides more in depth coverage of the analysis
Table 4-1 Experimental Analysis Results Summary
US Department of Transportation Office of the Assistant Secretary for Research and Technology
Intelligent Transportation Systems Joint Program Office
Task 8 D2X Hub Proof-of-Concept Test Evaluation Report ndash Final | 7
Test Case No Hypothesis Description Data Analysis Results
5411 ndash PSM Hypothesis 1 ndash The MDEA only broadcasts PSMs
when in the range of a vehicle broadcasting a BSM No False Negatives Satisfied at
100 Level of Confidence (LOC)
5413 ndash PSM Hypothesis 2 ndash The overall MDEA DSRC message
broadcast rate is lower during travel group coordination
Wi-Fi Direct Grouping Issue 8 False Negatives Satisfied at
875 LOC
5412 ndash PSM Hypothesis 3 ndash The MDEA can cease the broadcast
of PSMs when in a vehicle No False negatives Satisfied at
100 LOC
5411 ndash PSM
Hypothesis 4 ndash The Mobile Device can broadcast a PSM a radius of 250 meters 10 Hz under clear unobstructed conditions regardless of where the mobile device is located on the pedestrianrsquos person
or clothing
Radius limited to 100 m
Satisfied at a 43 level of confidence
5471 ndash SFY
Hypothesis 5 ndash Vehicles OBUs can capture and process Mobile Device PSMs and issue warnings at sufficient distance for drivers to avoid imminent pedestrian collision
No False negatives TFHRC satisfied at 100 LOC
5471 ndash SFY Hypothesis 6 ndash Mobile Devices can capture and process Vehicle BSMs and issue warnings in time for pedestrians to avoid imminent vehicle collision
No False negatives TFHRC satisfied at 100 LOC
5414 ndash PSM Hypothesis 7 ndash Mobile Device applications can detect No False negatives TFHRC
if a pedestrian is in a safe or unsafe zone satisfied at 100 LOC
Chapter 4 Experimental Analysis Results Summary
Test Case No Hypothesis Description Data Analysis Results
5421 5422 5423 ndash PMM
Hypothesis 8 amp 9 ndash The VEA can coordinate taxi travel requests from an MDEA
No False negatives TFHRC satisfied at 100 LOC
5424 ndash PMM Hypothesis 10 ndash The traveler can receive arrival updates from a taxi or transit vehicle
2 False Negatives out of 14 TFHRC Satisfied at 8571 LOC
5451 5452 ndash LDV
Hypothesis 11 amp 12 ndash The MDEA can detect when a traveler transitions from a pedestrian to a light duty vehicle or from a light duty vehicle to a pedestrian
No False negatives Accelerator tests Satisfied at 100 LOC Bluetooth tests failed
5441 5443 5444 ndash ATG
Hypothesis 13 ndash The MDEA can coordinate maintain and cancel travel with another MDEA via Wi-Fi Direct
Wi-Fi Direct Grouping Failure 30 False Negatives out of 198 Satisfied at 8484 LOC
5481 ndash SMP Hypothesis 14 ndash The RSU can broadcast a SPaT and MAP message via DSRC that can be received by mobile devices
No False negatives Satisfied at 100 LOC
5411 5444 5471 ndash MSG
Hypothesis 15 - The RSU can store all messages received via DSRC
RSU - CCP logging issues Not satisfied at 100 LOC
Note The LOC was calculated as a ratio of the total number of successful steps in the test script divided by the total number of steps in the test script (Each hypothesis has a specific test script)
US Department of Transportation Office of the Assistant Secretary for Research and Technology
Intelligent Transportation Systems Joint Program Office
Task 8 D2X Hub Proof-of-Concept Test Evaluation Report ndash Final | 8
US Department of Transportation Office of the Assistant Secretary for Research and Technology
Intelligent Transportation Systems Joint Program Office
Task 8 D2X Hub Proof-of-Concept Test Evaluation Report ndash Final | 9
Chapter 5 Experimental Analysis
Hypothesis 1 The MDEA only broadcasts PSMs when in the range of a vehicle broadcasting a BSM
Data logs verified MDEA Log ndash BSM received and PSM send occurrences
Analysis
Determination of vehicle range from mobile device based on vehicle speed Analysis of PSMs sent with respect to vehicle range (In range and out of range scenarios)
Observations In all the test cases PSMs were broadcasted by MDEA when the vehicle was in its range with respect to vehicle speed (ldquofast enough close enoughrdquo)
Table 5-1 Hypothesis 1 Analysis Data Sample
Vehicle Range and Advisory Speed In Out of Distance Date Time Distance wrt Speed (mph) Range Range (m)
13117 101316 IsBsmClose Dist 975500061708885lt
AdvDist 1024200201024 255 X 98
13117 101332 IsBsmClose Dist 570797651794001lt
AdvDist 666000057888 173 X 57
13117 101340 IsBsmClose Dist 57448436831453lt
AdvDist 601199821728 149 X 57
13117 101529 IsBsmClose Dist 975729907380225lt
AdvDist 102240014976 254 X 98
For the complete analysis please refer to Table A-1 in Appendix A
ݐݑݍܧ ݎ ݑ ݐ dݒݏݕݎ ݐݏ ݓݎݐ ݏ
ௗ௩௦௬= lowastݒ9
Where
is the advisory display distance (meters) ௗ௩௦௬ ݒ is the velocity of the vehicle (meters per second)
Results There were no outliers (False Negatives) in the dat a analyzed Hence Hypothesis 1 is satisfied at a 100 level of confidence
Chapter 5 Experimental Analysis
Hypothesis 2 The overall MDEA DSRC message broadcast rate is lower during travel group coordination
Data logs verified MDEA Log ndash Coordination Status PSM send occurrences before and after coordination
Analysis
Determination of coordination status Analysis of PSMs sent while not part of the travel group and while part of the travel group
(Travel group leader) Analysis of PSMs sent while not part of the travel group and while part of the travel group
(Travel group Member)
Observations Out of 64 log checks performed 56 true positives were observed Two tests had a grouping failure due to Wi-Fi Direct issues
Table 5-2 Hypothesis 2 Analysis Data Sample
Date 13117 13117 13117 13117 13117
Description Test Number TFHRC 1 TFHRC 3 TFHRC 4 TFHRC 5 TFHRC 6
PSMs Generated by Traveler X and Traveler Y 111116 112346 114208 114609 115222
Transition to In Group 111240 112448 114301 114658 115313
Traveler Y PSM ceased Check Check Check Check Check
only Traveler X PSM received 111305 112508 114345 114721 115342
For the complete analysis please refer to Table A-2 in Appendix A
Results There were 8 False Negatives in the data analyzed Hence Hypothesis 2 is satisfied at 875 level of confidence
US Department of Transportation Office of the Assistant Secretary for Research and Technology
Intelligent Transportation Systems Joint Program Office
Task 8 D2X Hub Proof-of-Concept Test Evaluation Report ndash Final | 10
Chapter 5 Experimental Analysis
Hypothesis 3 MDEA Log ndash Travel Mode Status PSM send occurrences
Data logs verified MDEA Log ndash BSM received and PSM send occurrences
Analysis
Determination of mobile device travel mode status Analysis of PSMs sent before and after transition of travel mode (on-foot and In-vehicle)
Observations All the test logs indicate that the PSMs were ceased after the MDEA transitioned its travel mode to In-vehicle
Table 5-3 Hypothesis 3 Analysis Data Sample
Description Test Number
TFHRC 1 TFHRC 2 TFHRC 3 TFHRC 4 TFHRC 5 TFHRC 6
MDEA not in vehicle Check Check Check Check Check Check
MDEA Transmits PSMs
Check Check Check Check Check Check
Time of MDEA Mode Transition
103804 104109 104430 104624 104805 105024
MDEA Ceases Transmitting PSMs
Check Check Check Check Check Check
For the complete analysis please refer to Table A-3 in Appendix A
Results There were no outliers (False Negatives) in the data analyzed Hence Hypothesis 3 is satisfied at a 100 level of confidence
US Department of Transportation Office of the Assistant Secretary for Research and Technology
Intelligent Transportation Systems Joint Program Office
Task 8 D2X Hub Proof-of-Concept Test Evaluation Report ndash Final | 11
US Department of Transportation Office of the Assistant Secretary for Research and Technology
Intelligent Transportation Systems Joint Program Office
Task 8 D2X Hub Proof-of-Concept Test Evaluation Report ndash Final | 12
Chapter 5 Experimental Analysis
Hypothesis 4 The Mobile Device can broadcast a PSM a radius of 250 meters 10 Hz under clear unobstructed conditions regardless of where the mobile device is located on the pedestrianrsquos person or clothing
Data logs verified VEA Log ndash PSM receive occurrences at a d istance of 10 m 50 m 100 m
Analysis
The rate at which PSMs were received by the RSU had been assessed The mobile device was placed in multiple locations on the pedestrian including in-hand in-pocket and in a backpack
Observations Due to DSRC limitations in the CCPs tests could not be performed beyond 100 m range Considering the RSU logging issues VEA Logs were used to analyze PSM broadcasting capacity of MDEA All the tests logged PSMs at a ra te o f 10sec Therefore 150 200 250 300 m radius could no t be a nalyzed Only three (10 50 and 100m) out of seven (10 50 100 150 200 250 and 300 m) cases were tested which resulted in a 43 Level of Confidence
Table 5-4 Hypothesis 4 Analysis Data Sample
Date Time
Vehicle Range and Advisory Distance wrt Speed
Speed (mph)
In Range
Out of Range
True Distance (m)
VEA Log PSM Message Rate
13117 101316 IsBsmClose Dist 975500061708885lt AdvDist 1024200201024
255 98 10
13117 101332 IsBsmClose Dist 570797651794001lt AdvDist 666000057888
173 57 10
13117 101340 IsBsmClose Dist 57448436831453lt AdvDist 601199821728
149 57 10
13117 101529 IsBsmClose Dist 975729907380225lt AdvDist 102240014976
254 98 10
13117 101538 IsBsmClose Dist 399317028326919lt AdvDist 102240014976
250 4 10
For the complete analysis please refer to Table A-1 in Appendix A
Results Due to the DSRC limitations the radius was limited to 100 m Hence Hypothesis 4 is satisfied at a 43 level of confidence
Chapter 5 Experimental Analysis
Hypothesis 5 Vehicles OBUs can capture and process Mobile Device PSMs and issue warnings at sufficient distance for drivers to avoid imminent pedestrian collision
Data logs verified VEA Log ndash PSM Location GPS Location Advisory Display Alert Display and Warning Display
Analysis
Assessing the distance at which an Advisory Alert and Warning were issued based on the speed of the vehicle (in the VEA Log)
Observations a Considering TFHRC tests the average difference in distance for VEA Logging of Advisories
Alerts and Warnings were on average 2028 m 275 m and 194 m respectively b The higher difference in advisory was due to the delay in the time between VEA deciding to
send PSM and Arada sending a PSM c Latency of less than a second was observed between PSM received and the message
display time on MDEA and VEA Logs
sݐݑݍܧ ݎ ݑݐ dݒݏwarningandalertݕݎ ݐݏ ݓݎݐ ݏ
ௗ௩௦௬= lowastݒ9
lowast ሻ05ݒ 25ሾሺൌ 11 lowast ቊ ௧ଶݒ
ሿ 2ሺ34ሻ
ቋ
Where
lowast ሻ05ݒ 25ሾሺൌ 11 lowast ቊ ௪
is the advisory display distance (meters) ௗ௩௦௬
is the alert display distance (meters) ௧
is the warning display distance (meters) ௐ
ଶݒሿ 2ሺ56ሻ
ቋ
ݒ is the velocity of the vehicle (meters per second)
TF 71 Run 2 - VEA
Source Battelle Google Maps February 2017
Figure 5-1 Advisory Alert and Warning Distances with Respect to VEA
US Department of Transportation Office of the Assistant Secretary for Research and Technology
Intelligent Transportation Systems Joint Program Office
Task 8 D2X Hub Proof-of-Concept Test Evaluation Report ndash Final | 13
Chapter 5 Experimental Analysis
Table 5-5 Hypothesis 5 Analysis Data Sample
TFHRC1 TFHRC2 TFHRC3
Advisory Alert Warning Advisory Alert Warning Advisory Alert Warning
True Distance (m) 7584 5545 4874 8552 5167 4515 7876 5827 5124
Speed (MPH) 2471 2523 2498 2595 2461 2433 2381 2590 2624
Expected Distance (m)
9942 5780 4910 10441 5588 4751 9580 5989 5222
Difference (m) 2358 235 036 1889 421 236 1704 162 098
For the complete analysis please refer to Table A-4 in Appendix A
Table 5-6 Total and Average Differences between Actual and Calculated Advisories Alerts and Warnings (VEA)
TFHRC Advisory Alert Warning
Total Difference (m) 10139 1376 971
Average Difference (m) 2028 275 194
Results There were no outliers (False Negatives) in the data analyzed Hence Hypothesis 5 is satisfied at a 100 level of confidence
US Department of Transportation Office of the Assistant Secretary for Research and Technology
Intelligent Transportation Systems Joint Program Office
Task 8 D2X Hub Proof-of-Concept Test Evaluation Report ndash Final | 14
Hypothesis 6 Mobile Devices can capture and process Vehicle BSMs and issue warnings in time for pedestrians to avoid imminent vehicle collision
Data logs verified MDEA Log ndash BSM Location GPS Location Advisory Display Alert Display and Warning Display
Analysis
Assessing the distance at which an Advisory Alert and Warning were issued based on the speed of the vehicle (in the BSM received by the mobile device)
Observations a Considering the TFHRC results the average difference in distance for MDEA logging of
Advisories Alerts and Warnings were on average 278 m 323 m and 334 m respectively b Latency of less than a second was observed on MDEA and VEA Logs
sݐݑݍܧ ݎ ݑݐ dݒݏwarningandalertݕݎ ݐݏ ݓݎݐ ݏ
ௗ௩௦௬= lowastݒ9
lowast ሻ05ݒ 25ሾሺൌ 11 lowast ቊ ௧ଶݒ
ሿ 2ሺ34ሻ
ቋ
ଶݒሿ 2ሺ56ሻ
ቋ
Where
lowast ሻ05ݒ 25ሾሺൌ 11 lowast ቊ ௪
is the advisory display distance (meters) ௗ௩௦௬
is the alert display distance (meters) ௧
is the warning display distance (meters) ௐ
ݒ is the velocity of the vehicle (meters per second)
Chapter 5 Experimental Analysis
TF 71 Run 2 - MDEA
US Department of Transportation Office of the Assistant Secretary for Research and Technology
Intelligent Transportation Systems Joint Program Office
Task 8 D2X Hub Proof-of-Concept Test Evaluation Report ndash Final | 15
Source Battelle Google Maps February 2017
Figure 5-2 Advisory Alert and Warning Distances with Respect to MDEA
Chapter 5 Experimental Analysis
Table 5-7 Hypothesis 6 Analysis Data Sample
TFHRC1 TFHRC2 TFHRC3
Advisory Alert Warning Advisory Alert Warning Advisory Alert Warning
True Distance (m) 8756 5320 4651 9928 5276 4624 8952 5595 4890
Speed (mph) 2290 2509 2487 2514 2447 2415 2304 2603 2617
Expected distance (m) 9213 5736 4883 10115 5546 4707 9270 6030 5205
Difference (m) 458 416 232 187 270 084 318 436 315
For the complete analysis please refer to Table A-5 in Appendix A
Table 5-8 Total and Average Differences between Actual and Calculated Advisories Alerts and Warnings (MDEA)
TFHRC Advisory Alert Warning
Total Difference (m) 1392 1617 1671
Average Difference (m) 278 323 334
Results There were no false alarms detected at neither of the TFHRCATP tests performed Hence Hypothesis 6 is satisfied at a 100 level of confidence
Issues Identified GPS Inaccuracy ndash Cross Track Distance Issue
The accuracy of GPS as per the US government claims is +- 4 m This error in GPS accuracy was balanced by increasing the cluster radius to 7 m for all the tests at TFHRC This modification in cluster radius increased the efficiency of pedestrian detection by closing out the difference in Cross Track Distancersquo
There were no false alarms detected at neither of the TFHRCATP tests performed
US Department of Transportation Office of the Assistant Secretary for Research and Technology
Intelligent Transportation Systems Joint Program Office
Task 8 D2X Hub Proof-of-Concept Test Evaluation Report ndash Final | 16
Chapter 5 Experimental Analysis
Source Battelle Google Maps February 2017
Figure 5-3 Cross Track Distance between Pedestrian and Vehicle Path
US Department of Transportation Office of the Assistant Secretary for Research and Technology
Intelligent Transportation Systems Joint Program Office
Task 8 D2X Hub Proof-of-Concept Test Evaluation Report ndash Final | 17
Chapter 5 Experimental Analysis
Hypothesis 7 MDEA Log ndash GPS Location SafeUnsafe Zone Status and MAP Message Contents
Data logs verified MDEA Log ndash GPS Location SafeUnsafe Zone Status and MAP Message Contents
Analysis
Analyzed the percentage of properly classified safeunsafe zone detections The device was placed in the roadway ndash mobile device location was properly classified if it positions itself in an unsafe zone
Observations User State Change from Safe to Unsafe (when placed 20 m in the roadway) and Unsafe to Safe (when placed 50 m from the roadway) were captured accurate and timely
Table 5-9 Hypothesis 7 Analysis Data Sample
TFHRC 1 TFHRC 2 TFHRC 3 TFHRC 4 TFHRC 5
User State Change Is Safe Icon False (2 m in the roadway)
111438 112533 114400 114801 115408
Properly Processed
User State Change Is Safe Icon True (5 m from the roadway)
111504 112619 114438 114829 115444
Properly Processed
For the complete analysis please refer to Table A-6 in Appendix A
US Department of Transportation Office of the Assistant Secretary for Research and Technology
Intelligent Transportation Systems Joint Program Office
Task 8 D2X Hub Proof-of-Concept Test Evaluation Report ndash Final | 18
Chapter 5 Experimental Analysis
Source Battelle Google Maps February 2017
Figure 5-4 Safe and Unsafe Zones at TFHRC Test Site
Results There were no outliers (False Negatives) in the data analyzed Hence Hypothesis 7 is satisfied at a 100 level of confidence
US Department of Transportation Office of the Assistant Secretary for Research and Technology
Intelligent Transportation Systems Joint Program Office
Task 8 D2X Hub Proof-of-Concept Test Evaluation Report ndash Final | 19
Chapter 5 Experimental Analysis
Hypothesis 8 amp 9 The VEA can coordinate taxi travel requests from an MDEA
Data logs verified MDEA Log ndash PMM Send Occurrence PMM contents PMM-RSP Receive Occurrence Coordination Status and PMM-Cancel Sent Occurrence
Analysis
Analyzed the percentage of PMM and PMM ndash Cancel messages properly processed by in-vehicle devices
Analyzed the percentage of PMM-RSP messages properly processed by mobile devices This analysis was performed for PMM Messages communicated through both DSRC and
Cellular
Observations 16 out of 204 checks had a failure during tests performed under ATP
Table 5-10 Hypothesis 8 amp 9 Analysis Data Sample
TFHRC 1 TFHRC 2 TFHRC 3 TFHRC 4 TFHRC 5
Analyze the percentage of PMM messages properly processed by in-vehicle devices
MDEA Log ndash PMM Send occurrence
Check Check Check Check Check
MDEA Log ndash PMM contents
All Present All Present All Present All Present All Present
Experimental Log ndash Information entered into
Mobile Device by Traveler
VEA Log ndash PMM Receive occurrence
Check Check Check Check Check
Analyze the percentage of PMM-RSP messages properly processed by mobile devices
Experimental Log ndash Driver Acceptance
VEA Log ndash Driver acceptance
Check Check Check Check Check
VEA Log ndash PMM-RSP Send occurrence
Check Check Check Check Check
MDEA Log ndash PMM-RSP Receive occurrence
Check Check Check Check Check
MDEA Log ndash Coordination Status
Check Check Check Check Check
Experimental Log ndash Coordination Success
Display
US Department of Transportation Office of the Assistant Secretary for Research and Technology
Intelligent Transportation Systems Joint Program Office
Task 8 D2X Hub Proof-of-Concept Test Evaluation Report ndash Final | 20
Chapter 5 Experimental Analysis
TFHRC 1 TFHRC 2 TFHRC 3 TFHRC 4 TFHRC 5
Analyze the percentage of PMM-Cancel messages properly processed by in-vehicle devices
MDEA Log ndash PMM-Cancel Sent Occurrence
Check Check Check Check Check
VEA Log ndash PMM-Cancel Received
Occurrence Check Check Check Check Check
For the complete analysis please refer to Table A-7 in Appendix A
Results Considering the tests performed at TFHRC Hypothesis 8 is satisfied at a 100 level of confidence However ATP tests satisfied the hypothesis at a confidence level of 9215
Issues Identified
Some issues observed for cloud communication during ATP testing at Columbus OH
Delay in Cloud PMM-cancel for VEA ndash 8 instances Adding a trip twice ndash 5 instances Some PMMs not being cancelled ndash 3 instances
All these issues were addressed prior to TFHRC tests
TFHRC tests did not have any of the above issues
US Department of Transportation Office of the Assistant Secretary for Research and Technology
Intelligent Transportation Systems Joint Program Office
Task 8 D2X Hub Proof-of-Concept Test Evaluation Report ndash Final | 21
Chapter 5 Experimental Analysis
Hypothesis 10 The traveler can receive arrival updates from a taxi or transit vehicle
Data logs verified VEA Log ndash PMM-ARRIVE Send Occurrence
MDEA Log ndash PMM-ARRIVE receive occurrence
Analysis
Analyzed the success rate of receiving a PMM-Arrive message via DSRC
Observations One test case at TFHRC failed due to equipment failure (CCP lost its location) All other tests satisfied the hypothesis
Table 5-11 Hypothesis 10 Analysis Data Sample
TFHRC 1
TFHRC 2
TFHRC 3
TFHRC 4
TFHRC 5
TFHRC 6
TFHRC 7
DSRC (Taxi)
Analyze the success rate of receiving a PMM-Arrive message
VEA Log ndash PMM-ARRIVE
Send occurrence
Fail Check Check Check Check Check Check
MDEA Log ndash PMM-ARRIVE
Receive occurrence
Fail Check Check Check Check Check Check
For the complete analysis please refer to Table A-8 in Appendix A
Results Considering the tests at TFHRC the hypothesis is satisfied at a confidence level of 8571 12 out of 14 tests were successful
US Department of Transportation Office of the Assistant Secretary for Research and Technology
Intelligent Transportation Systems Joint Program Office
Task 8 D2X Hub Proof-of-Concept Test Evaluation Report ndash Final | 22
Chapter 5 Experimental Analysis
Hypothesis 11 amp 12 The MDEA can detect when a traveler transitions from a pedestrian to a light duty vehicle or from a light duty vehicle to a pedestrian
Data logs verified MDEA Log ndash Travel Mode Status Change Experimental Log ndash Mode Transition Detection Log
Analysis 1 Assessed the change in ldquoTravel Mode Statusrdquo after the pedestrian enters the vehicle
(The threshold value for Travel Mode Status Change is 10 secs) 2 Assessed the false positive rate of transition detection
Observations Accelerometer tests on average took 75 secs and 44 secs to detect in-vehicle and on-foot respectively However Bluetooth beacon tests on a verage took 17 secs and 1 1 secs to detect in-vehicle and on-foot respectively This quantifies the unreliable nature of Bluetooth Beacons as used in this system
Table 5-12 Hypothesis 11 amp 12 Analysis Data Sample
Mode Detection Method On-foot to In-Vehicle Transition time (Sec)
In-Vehicle to On-foot Transition Time (Sec)
Accelerometer 75 44
Bluetooth Beacon 17 11
Results Hypothesis is proved as 100 confident during the accelerometer tests However none of the tests with Bluetooth Beacon satisfied the hypothesis (all false negatives)
US Department of Transportation Office of the Assistant Secretary for Research and Technology
Intelligent Transportation Systems Joint Program Office
Task 8 D2X Hub Proof-of-Concept Test Evaluation Report ndash Final | 23
Chapter 5 Experimental Analysis
Hypothesis 13 The MDEA can coordinate maintain and cancel travel with another MDEA via Wi-Fi Direct
Data logs verified MDEA (1) Log ndash Coordination Request Received Occurrence Coordination Request Contents Coordination Acceptance Sent Occurrence Coordination Acceptance Notification Coordination Heartbeat Received Occurrence Coordination Cancel Response Sent occurrence and Coordination Disband Sent occurrence
MDEA (2) Log ndash Coordination Request Sent Occurrence Coordination Confirmation received Occurrence Coordination Heartbeat Response Sent Occurrence Coordination Acceptance received Occurrence
Analysis 1 Determined the percentage of Coordination Request Acceptance Heartbeat Cancel and
Disband messages properly processed by mobile devices 2 Assessed the message contents for consistency
Observations This test is performed in a highly-controlled environment This means selection of specific devices and designating them with specific roles This approach was chosen due to poor Wi-Fi direct performance with our system that would have otherwise hindered the ability to conduct the testing and collect the necessary data
US Department of Transportation Office of the Assistant Secretary for Research and Technology
Intelligent Transportation Systems Joint Program Office
Task 8 D2X Hub Proof-of-Concept Test Evaluation Report ndash Final | 24
Chapter 5 Experimental Analysis
Table 5-13 Hypothesis 13 Analysis Data Sample
13117 2117
TFHRC 1
TFHRC 2
TFHRC 3
TFHRC 4
TFHRC 5
TFHRC 6
TFHRC 7
TFHRC 8
TFHRC 9
TFHRC 10
Coordination Request Sent by
Y
Fai
l T
rave
ler
Y c
ould
no
t joi
n th
e ad
-hoc
trav
el g
roup
40951 Check
F
ail
Tra
vele
r Y
cou
ld
not j
oin
the
ad-h
oc tr
avel
gro
up
Check Check Check Check Check Check
Coordination Request Received
by X check Check Check Check Check Check Check Check
Request Confirmed by X
check Check Check Check Check Check Check Check
Confirmation Received by Y
Coordination Request Sent by
Z
check Check Check Check Check Check Check Check
41047 Check Check Check Check Check Check Check
Coordination Request Received
by X check Check Check Check Check Check Check Check
Request Confirmed by X
check Check Check Check Check Check Check Check
Confirmation Received by Z
Coordination Heart Beat
Transmitted by Y amp Z
check Check Check Check Check Check Check Check
check Check Check Check Check Check Check Check
Heart Beat Response
received by X
Ride Arrived Messages
check Check Check Check Check Check Check Check
41303 Check Check Check Check Check Check Check
Coordination Cancel by walking
away Check Check Check Check Check This step not tested on this day
Coordination Cancel by Manual
request This step not tested on this day
Check Check Check Check Check
Disband Group after entering into
vehicle Check Check Check Check Check
For the complete analysis please refer to Table A-9 and Table A-10 in Appendix A
Results There were 30 outliers out of 198 checks (False Negatives) in the data analyzed Hence Hypothesis 13 is satisfied at an 8484 level of confidence
US Department of Transportation Office of the Assistant Secretary for Research and Technology
Intelligent Transportation Systems Joint Program Office
Task 8 D2X Hub Proof-of-Concept Test Evaluation Report ndash Final | 25
US Department of Transportation Office of the Assistant Secretary for Research and Technology
Intelligent Transportation Systems Joint Program Office
Task 8 D2X Hub Proof-of-Concept Test Evaluation Report ndash Final | 26
Chapter 5 Experimental Analysis
Hypothesis 14 The RSU can broadcast a SPaT and MAP message via DSRC that can be received by mobile devices
Data logs verified MDEA Log ndash BSM received and PSM send occurrences
Analysis 1 Determined the percentage of SPaT messages received by mobile devices when within
100 meters of RSE Assessed message contents for consistency 2 Determined the percentage of MAP messages received by mobile devices when within
100 meters of RSE Assessed message contents for consistency
Observations Considering test 5444 all the SPa T messages were transmitted and received at a rate of 1sec Similarly all the MAP messages were transmitted and received at a rate better than 5sec
Table 5-14 Hypothesis 14 Analysis Data Sample
ID Date Message
5 13117 163842 Dsrc Rx Spat id19
6 13117 163842 Dsrc Rx Map id18
9 13117 163843 Dsrc Rx Spat id19
10 13117 163843 Dsrc Rx Bsm Lat389546323 Long -771488295 Head 2713375 Sp 0
12 13117 163843 Dsrc Rx Bsm Lat389546138 Long -771483988 Head 2559125 Sp 0
13 13117 163844 Dsrc Rx Spat id19
14 13117 163844 Dsrc Rx Bsm Lat389546323 Long -771488297 Head 2713375 Sp 0
16 13117 163844 Dsrc Rx Bsm Lat389546138 Long -771483987 Head 2559125 Sp 0
17 13117 163844 Dsrc Rx Map id18
18 13117 163844 Dsrc Rx Bsm Lat389546322 Long -7714883 Head 2713375 Sp 0
20 13117 163845 Dsrc Rx Bsm Lat389546137 Long -771483987 Head 2559125 Sp 0
21 13117 163845 Dsrc Rx Bsm Lat389546322 Long -771488302 Head 2713375 Sp 0
22 13117 163845 Dsrc Rx Spat id19
23 13117 163845 Dsrc Rx Bsm Lat389546137 Long -771483987 Head 2559125 Sp 0
25 13117 163845 Dsrc Rx Bsm Lat38954632 Long -771488302 Head 2713375 Sp 0
26 13117 163846 Dsrc Rx Bsm Lat389546135 Long -771483987 Head 2559125 Sp 0
27 13117 163846 Dsrc Rx Spat id19
29 13117 163846 Dsrc Rx Bsm Lat389546318 Long -771488303 Head 2713375 Sp 0
31 13117 163846 Dsrc Rx Map id18
Results There were no outliers (False Negatives) in the data analyzed Hence Hypothesis 14 is satisfied at a 100 level of confidence
Chapter 5 Experimental Analysis
Hypothesis 15 The RSU can store all messages received via DSRC
Data logs verified MDEA Log ndash All Occurrences of messages sent via DSRC and Message Contents RSU Log ndash Message Received Occurrence and Message Contents
Analysis 1 Assessed the percentage of messages received from mobile devices within 100 meters of
RSE Assess message contents to make sure they are consistent
Observations a Considering the message logs from test cases 5411 5444 5471 there were instances
where PSMs were logged at a rate of less than 10sec Also there were test cases that had no reception of PSMs This clearly indicates the reception issues with RSU CCP unit One prime focus for the Large-Scale Field Test is to improve the reliability of the hardware associated with RSU
b The message contents in all the DSRC messages were consistent throughout the test logs
Table 5-15 Hypothesis 15 Analysis Data Sample
Date Time
Vehicle Range and Advisory Distance wrt
Speed Speed (mph)
In Range
Out of Range
Distance (m)
RSU Log PSM
Message RateSec
13117 101316 IsBsmClose Dist
975500061708885lt AdvDist 1024200201024
255 98 8
13117 101332 IsBsmClose Dist
570797651794001lt AdvDist 666000057888
173 57 6
13117 101340 IsBsmClose Dist
57448436831453lt AdvDist 601199821728
149 57 1
13117 101529 IsBsmClose Dist
975729907380225lt AdvDist 102240014976
254 98 0
13117 101538 IsBsmClose Dist
399317028326919lt AdvDist 102240014976
250 4 1
For the complete analysis please refer to Table A-1 in Appendix A
US Department of Transportation Office of the Assistant Secretary for Research and Technology
Intelligent Transportation Systems Joint Program Office
Task 8 D2X Hub Proof-of-Concept Test Evaluation Report ndash Final | 27
Chapter 5 Experimental Analysis
Table 5-16 Data Usage Statistics
17-Jan 18-Jan 19-Jan 20-Jan 31-Jan 1-Feb Average Maximum
Total Usage (MB) 3805 626 714 2713 4873 1355 984 2713
TMX core usage (MB) 271 450 468 1991 345 90 705 1991
of TMX usage 71 72 66 73 71 66 71 73
Results The hypothesis statement of RSU being able to store all messages received via DSRC is not satisfied at 100 level of confidence due to hardware issues
US Department of Transportation Office of the Assistant Secretary for Research and Technology
Intelligent Transportation Systems Joint Program Office
Task 8 D2X Hub Proof-of-Concept Test Evaluation Report ndash Final | 28
Chapter 6 Lessons Learned and Recommendations
Lessons Learned
The Lessons Learned from the Proof-of-Concept testing are summarized as follows
The ability to reliably generate transmit and receive messages between mobile devices and connected vehicles was demonstrated
The messages to incorporate mobile devices into the C V environment functioned as designed and provided the necessary data for the prototype mobility and safety applications
The prototype safety and mobility software applications functioned well (as designed)
Limitations of technology and hardware issues caused the majority of performance shortfalls
Mixed results were achieved for the various communication methods tested
a Cellular functioned well with our system
b Wi-Fi Direct connectivity was unreliable with our system
c DSRC hardware problems caused communication problems with our system
GPS accuracy limitations were observed as expected
Wi-Fi Direct Connectivity
The connection process was prone to failure at multiple points with no indication to the application why connection failed
TFHRC success rate was achieved by selecting specific devices that worked best for specific roles otherwise a failure rate gt50 would have been expected based on earlier testing
Canvasing of developer community found similar observations no solutions for our system
Wi-Fi Direct connection process requires authorization from the user of the target device in a real world environment such a request would most likely be denied if noticed at all
US Department of Transportation Office of the Assistant Secretary for Research and Technology
Intelligent Transportation Systems Joint Program Office
Task 8 D2X Hub Proof-of-Concept Test Evaluation Report ndash Final | 29
Chapter 6 Lessons Learned and Recommendations
DSRC Hardware
Common Computer Platform (CCP) Pre-production engineering units were used which were determined to have an impedance mismatch between the DSRC chip and RF connector that caused reduction of signal strength
Arada LocoMate ME There were occasional Bluetooth connection failures to mobile devices as well as occasional DSRC transmissionreception failures Longer term it is assumed that DSRC radios will be integrated into smartphones thus obviating the current issues
Recommendations
Based on outcomes of Proof-of-Concept Testing the following prototype system design changes are recommended to be implemented prior to the larger-scale prototype field test
Add Cellular-based communication for Travel Group coordination between mobile devices
New and improved CCP units will be used for the larger-scale field test
For in-vehicle detection use Accelerometer method as the most reliable option
US Department of Transportation Office of the Assistant Secretary for Research and Technology
Intelligent Transportation Systems Joint Program Office
Task 8 D2X Hub Proof-of-Concept Test Evaluation Report ndash Final | 30
APPENDIX A Comprehensive Data Analysis Tables
Note For all the analysis results depicted below the term ldquocheckrdquo refers to the ldquosuccessrdquo of desired action
Table A-1 Complete Data Analysis ndash Hypothesis 1 4 amp 15
Date Time Vehicle Range and Advisory
Distance wrt Speed Speed In
Range Out of
Range Distance
RSU Log PSM
Message RateSec
VEA Log PSM
Message Rate
1312017 101316 IsBsmClose Dist 975500061708885lt
AdvDist 1024200201024 255 X 98 8 10
1312017 101332 IsBsmClose Dist 570797651794001lt
AdvDist 666000057888 173 X 57 6 10
1312017 101340 IsBsmClose Dist 57448436831453lt
AdvDist 601199821728 149 X 57 1 10
1312017 101529 IsBsmClose Dist 975729907380225lt
AdvDist 102240014976 254 X 98 0 10
1312017 101538 IsBsmClose Dist 399317028326919lt
AdvDist 102240014976 250 X 4 1 10
1312017 101553 IsBsmClose Dist 600719107941917lt
AdvDist 70199987616 174 X 60 0 10
1312017 102029 IsBsmClose Dist 944643508928866lt
AdvDist 1008000141984 251 X 95 0 9
1312017 102048 IsBsmClose Dist 592561932680623lt
AdvDist 628200188352 156 X 59 0 9
US Department of Transportation Office of the Assistant Secretary for Research and Technology
Intelligent Transportation Systems Joint Program Office
Task 8 D2X Hub Proof-of-Concept Test Evaluation Report ndash Final | A-1
APPENDIX A Comprehensive Data Analysis Tables
Date Time Vehicle Range and Advisory
Distance wrt Speed Speed In
Range Out of Range Distance
RSU Log PSM
Message RateSec
VEA Log PSM
Message Rate
1312017 102054 IsBsmClose Dist 616348297460404lt
AdvDist 644399845056 160 X 62 3 11
1312017 102105 IsBsmClose Dist 871180496389495lt
AdvDist 1092600137376 247 X 87 4 9
1312017 102206 IsBsmClose Dist 977301610734722lt
AdvDist 1130400006912 295 X 98 0 10
1312017 102228 IsBsmClose Dist 577576034007057lt
AdvDist 60659997552 151 X 58 2 10
1312017 102332 IsBsmClose Dist 101193300977461lt
AdvDist 10386002088 258 X 101 10 10
1312017 102356 IsBsmClose Dist 595641466972855lt
AdvDist 660599904096 164 X 60 6 10
1312017 102623 IsBsmClose Dist 100217014111125lt
AdvDist 1024200201024 253 X 100 7 10
1312017 102650 IsBsmClose Dist 540919707235241lt
AdvDist 887399925984 221 X 54 0 10
1172017 111504 IsBsmClose Dist 100564061581794lt
AdvDist 1169999927712 291 X 101 10 10
1172017 112437 IsBsmClose Dist 992912014791515lt
AdvDist 10386002088 258 X 99 10 10
1172017 112837 IsBsmClose Dist 106684353810469lt
AdvDist 1076400078336 261 X 107 10 10
US Department of Transportation Office of the Assistant Secretary for Research and Technology
Intelligent Transportation Systems Joint Program Office
Task 8 D2X Hub Proof-of-Concept Test Evaluation Report ndash Final | A-2
APPENDIX A Comprehensive Data Analysis Tables
Date Time Vehicle Range and Advisory
Distance wrt Speed Speed In
Range Out of Range Distance
RSU Log PSM
Message RateSec
VEA Log PSM
Message Rate
1172017 113148 IsBsmClose Dist 1124753473133lt AdvDist
1186199986752 268 X 112 10 10
1172017 113332 IsBsmClose Dist 106022149777593lt
AdvDist 1126799904384 260 X 106 10 10
1172017 113336 IsBsmClose Dist 59429630331283lt
AdvDist 1196999892 298 X 59 10 10
1172017 113357 IsBsmClose Dist 657937887214709lt
AdvDist 1193400191808 297 X 66 10 10
1172017 113627 IsBsmClose Dist 965542357439439lt
AdvDist 1080000180864 260 X 97 10 10
1172017 113629 IsBsmClose Dist 821301583410616lt
AdvDist 1074600027072 270 X 82 10 10
1172017 113803 IsBsmClose Dist 994884887192582lt
AdvDist 104580001152 251 X 99 10 10
1172017 113811 IsBsmClose Dist 16809952777894lt
AdvDist 106200007056 257 X 17 10 10
1172017 114114 IsBsmClose Dist 948985801452811lt
AdvDist 986399929152 245 X 95 10 10
1172017 114133 IsBsmClose Dist 141255704529106lt
AdvDist 963000067392 242 X 14 10 10
1172017 114136 IsBsmClose Dist 377627357471613lt
AdvDist 977400075168 243 X 38 10 10
US Department of Transportation Office of the Assistant Secretary for Research and Technology
Intelligent Transportation Systems Joint Program Office
Task 8 D2X Hub Proof-of-Concept Test Evaluation Report ndash Final | A-3
APPENDIX A Comprehensive Data Analysis Tables
Date Time Vehicle Range and Advisory
Distance wrt Speed Speed In
Range Out of Range Distance
RSU Log PSM
Message RateSec
VEA Log PSM
Message Rate
1172017 114403 IsBsmClose Dist 114490146784404lt
AdvDist 1225799907552 266 X 114 10 10
1172017 114415 IsBsmClose Dist 280463490772458lt
AdvDist 71100013248 161 X 28 10 10
1172017 114735 IsBsmClose Dist 102043927314914lt
AdvDist 1040399857728 259 X 102 10 10
1172017 114755 IsBsmClose Dist 185020887331204lt
AdvDist 112499985312 275 X 19 10 10
1192017 35605 IsBsmClose Dist 107928079653642lt
AdvDist 1107000145152 272 X 108 9 9
1192017 35630 IsBsmClose Dist 99759104887202lt
AdvDist 1184399935488 294 X 100 10 10
1192017 35837 IsBsmClose Dist 110291146846666lt
AdvDist 115020016848 286 X 110 10 10
1192017 40057 IsBsmClose Dist 998997459961241lt
AdvDist 1260000076896 313 X 100 10 10
1192017 40300 IsBsmClose Dist 100209094247195lt
AdvDist 106919987328 260 X 100 10 10
1192017 40410 IsBsmClose Dist 100723184500334lt
AdvDist 1097999888832 273 X 101 6 10
1192017 41103 IsBsmClose Dist 977354295877856lt
AdvDist 1008000141984 251 X 98 10 10
US Department of Transportation Office of the Assistant Secretary for Research and Technology
Intelligent Transportation Systems Joint Program Office
Task 8 D2X Hub Proof-of-Concept Test Evaluation Report ndash Final | A-4
APPENDIX A Comprehensive Data Analysis Tables
Date Time Vehicle Range and Advisory
Distance wrt Speed Speed In
Range Out of Range Distance
RSU Log PSM
Message RateSec
VEA Log PSM
Message Rate
1192017 41311 IsBsmClose Dist 10190842581135lt
AdvDist 1040399857728 259 X 102 10 10
1192017 41423 IsBsmClose Dist 995536361906761lt
AdvDist 1009799790912 251 X 100 10 10
1192017 41534 IsBsmClose Dist 10075608603652lt
AdvDist 106919987328 264 X 101 10 10
US Department of Transportation Office of the Assistant Secretary for Research and Technology
Intelligent Transportation Systems Joint Program Office
Task 8 D2X Hub Proof-of-Concept Test Evaluation Report ndash Final | A-5
APPENDIX A Comprehensive Data Analysis Tables
Table A-2 Complete Data Analysis ndash Hypothesis 2
US Department of Transportation Office of the Assistant Secretary for Research and Technology
Intelligent Transportation Systems Joint Program Office
Task 8 D2X Hub Proof-of-Concept Test Evaluation Report ndash Final | A-6
Date Test
Number PSMs Generated by
Trav X and Trav Y Transition to In Group Trav Y PSM Ceased Only Trav X PSM
Received
1312017 TFHRC 1 111116 111240 Check 111305
1312017 TFHRC 2 Grouping Failed Grouping Failed Grouping Failed Grouping Failed
1312017 TFHRC 3 112346 112448 Check 112508
1312017 TFHRC 4 114208 114301 Check 114345
1312017 TFHRC 5 114609 114658 Check 114721
1312017 TFHRC 6 115222 115313 Check 115342
1182017 ATP 1 104400 104527 Check 104601
1182017 ATP 2 105356 105455 Check 105546
1182017 ATP 3 110059 110150 Check 110322
1182017 ATP 4 111222 111310 Check 111329
1182017 ATP 5 111515 111616 Check 111630
1182017 ATP 6 111823 111906 Check 111917
1182017 ATP 7 112116 112157 Check 112209
1182017 ATP 8 112814 112855 Check 112917
1182017 ATP 9 113142 113230 Check 113248
1182017 ATP 10 113501 113545 Check 113608
1192017 ATP 11 44728 44842 Check 45007
1192017 ATP 12 Radio Failure Test Terminated Radio Failure Test Terminated Radio Failure Test Terminated Radio Failure Test Terminated
1192017 ATP 13 45548 45637 Check 45728
1192017 ATP 14 45946 50047 Check 50107
1192017 ATP 15 50353 50444 Check 50513
1192017 ATP 16 50730 50823 Check 50839
APPENDIX A Comprehensive Data Analysis Tables
Table A-3 Complete Data Analysis ndash Hypothesis 3
US Department of Transportation Office of the Assistant Secretary for Research and Technology
Intelligent Transportation Systems Joint Program Office
Task 8 D2X Hub Proof-of-Concept Test Evaluation Report ndash Final | A-7
Date Description
MDEA not in Vehicle
MDEA Transmits
PSMs Time of MDEA
Mode Transition
MDEA Ceases Transmitting
PSMs
1312017 TFHRC 1 Check Check 0443101852 Check
1312017 TFHRC 2 Check Check 0445243056 Check
1312017 TFHRC 3 Check Check 0447569444 Check
1312017 TFHRC 4 Check Check 0448888889 Check
1312017 TFHRC 5 Check Check 045005787 Check
1312017 TFHRC 6 Check Check 0451666667 Check
1172017 ATP 1 Check Check 0501898148 Check
1172017 ATP 2 Check Check 0504201389 Check
1172017 ATP 3 Check Check 0506215278 Check
1172017 ATP 4 Check Check 0507858796 Check
1172017 ATP 5 Check Check 0508981481 Check
1172017 ATP 6 Check Check 0510219907 Check
1172017 ATP 7 Check Check 0511736111 Check
1172017 ATP 8 Check Check 05128125 Check
1172017 ATP 9 Check Check 0513831019 Check
1172017 ATP 10 Check Check 0514884259 Check
1172017 ATP 11 Check Check 0185590278 Check
1172017 ATP 12 Check Check 0187210648 Check
1172017 ATP 13 Check Check 0188425926 Check
1172017 ATP 14 Check Check 0190289352 Check
1172017 ATP 15 Check Check 0191863426 Check
APPENDIX A Comprehensive Data Analysis Tables
Table A-4 Complete Data Analysis ndash Hypothesis 5 (VEA)
Test Number
Type of Message
True Distance (m)
Speed (MPH)
Expected Distance (m)
Difference (m)
TFHRC1
Advisory 7584 2471 9942 2358
Alert 5545 2523 5780 235
Warning 4874 2498 4910 036
TFHRC2
Advisory 8552 2595 10441 1889
Alert 5167 2461 5588 421
Warning 4515 2433 4751 236
TFHRC3
Advisory 7876 2381 9580 1704
Alert 5827 2590 5989 162
Warning 5124 2624 5222 098
TFHRC4
Advisory 7529 2818 11338 3809
Alert 6047 2744 6482 435
Warning 5323 2714 5450 127
TFHRC5
Advisory 9292 2404 9672 380
Alert 5350 2423 5472 122
Warning 4081 2352 4556 475
ATP1
Advisory 000 000
Alert 000 000
Warning 000 000
ATP2
Advisory 5787 1644 6614 827
Alert 3074 1640 3289 215
Warning 2627 1640 2947 320
ATP3
Advisory 4204 1685 6779 2575
Alert 3300 1672 3370 070
Warning 2854 1658 2985 131
ATP4
Advisory 4296 1753 7053 2757
Alert 3346 1791 3679 333
Warning 2871 1755 3194 323
ATP5
Advisory 000 000
Alert 000 000
Warning 1069 1706 3088 2019
ATP6
Advisory 3632 1640 6598 2966
Alert 000 000
Warning 2770 1594 2850 080
US Department of Transportation Office of the Assistant Secretary for Research and Technology
Intelligent Transportation Systems Joint Program Office
Task 8 D2X Hub Proof-of-Concept Test Evaluation Report ndash Final | A-8
APPENDIX A Comprehensive Data Analysis Tables
Test Number
Type of Message
True Distance (m)
Speed (MPH)
Expected Distance (m)
Difference (m)
ATP7
Advisory 000 000
Alert 000 000
Warning 1919 1887 3483 1564
ATP8
Advisory 4492 1741 7005 2513
Alert 3113 1687 3409 296
Warning 2661 1680 3032 371
ATP9
Advisory 4694 1628 6550 1856
Alert 2991 1570 3113 122
Warning 2572 1549 2756 184
ATP10
Advisory 000 000
Alert 000 000
Warning 650 2505 4927 4277
ATP11
Advisory 000 000
Alert 000 000
Warning 1914 2398 4666 2752
ATP12
Advisory 000 000
Alert 000 000
Warning 460 2293 4415 3955
ATP13
Advisory 000 000
Alert 000 000
Warning 2732 2535 5001 2269
ATP14
Advisory 000 000
Alert 000 000
Warning 2358 2361 4577 2219
ATP15
Advisory 000 000
Alert 000 000
Warning 1107 2459 4814 3707
ATP16
Advisory 5668 1982 7974 2306
Alert 000 000
Warning 1502 1906 3525 2023
ATP17
Advisory 000 000
Alert 000 000
Warning 3183 2420 4720 1537
US Department of Transportation Office of the Assistant Secretary for Research and Technology
Intelligent Transportation Systems Joint Program Office
Task 8 D2X Hub Proof-of-Concept Test Evaluation Report ndash Final | A-9
Table A-5 Complete Data Analysis ndash Hypothesis 6 (MDEA)
Test Number
Type of Message
True Distance (m)
Speed (MPH)
Expected Distance (m)
Difference (m)
TFHRC1
Advisory 8756 2290 9213 457
Alert 5320 2509 5736 416
Warning 4651 2487 4883 232
TFHRC2
Advisory 9928 2514 10115 187
Alert 5276 2447 5546 270
Warning 4624 2415 4707 084
TFHRC3
Advisory 8952 2304 9270 318
Alert 5595 2603 6030 436
Warning 4890 2617 5205 315
TFHRC4
Advisory 9752 2514 10115 363
Alert 6290 2769 6564 274
Warning 4844 2693 5396 552
TFHRC5
Advisory 9613 2406 9680 067
Alert 5242 2420 5463 221
Warning 4080 2357 4568 488
ATP1
Advisory 5938 2183 8783 2845
Alert 4314 2120 4580 266
Warning 3644 2111 3989 345
ATP2
Advisory 6452 1641 6602 150
Alert 3296 1691 3419 123
Warning 2600 1601 2865 265
ATP3
Advisory 6212 1628 6550 338
Alert 3200 1655 3327 127
Warning 2707 1641 2949 242
ATP4
Advisory 6420 1646 6622 202
Alert 3300 1780 3650 350
Warning 2878 1704 3084 206
ATP5
Advisory 6673 1677 6747 074
Alert 3400 1847 3828 428
Warning 2972 1807 3307 335
ATP6
Advisory 6100 1628 6550 450
Alert 3100 1637 3281 181
Warning 2500 1597 2857 357
APPENDIX A Comprehensive Data Analysis Tables
US Department of Transportation Office of the Assistant Secretary for Research and Technology
Intelligent Transportation Systems Joint Program Office
Task 8 D2X Hub Proof-of-Concept Test Evaluation Report ndash Final | A-10
APPENDIX A Comprehensive Data Analysis Tables
Test Number
Type of Message
True Distance (m)
Speed (MPH)
Expected Distance (m)
Difference (m)
ATP7
Advisory 7500 1972 7934 434
Alert 3882 1914 4008 126
Warning 3400 1946 3614 214
ATP8
Advisory 6659 1744 7017 358
Alert 3263 1682 3396 133
Warning 2900 1682 3037 137
ATP9
Advisory 6605 1659 6675 070
Alert 2900 1556 3078 178
Warning 2365 1561 2781 416
ATP10
Advisory 9214 2491 10022 808
Alert 5859 2688 6301 442
Warning 5200 2644 5273 073
ATP11
Advisory 8485 2487 10006 1521
Alert 5376 2487 5668 292
Warning 4716 2483 4873 157
ATP12
Advisory 9001 2433 9789 788
Alert 5395 2420 5463 068
Warning 4103 2330 4503 400
ATP13
Advisory 8615 2559 10296 1681
Alert 000 000 000 000
Warning 4930 2581 5115 185
ATP14
Advisory 6119 2491 10022 3903
Alert 5500 2491 5681 181
Warning 3800 2402 4676 876
ATP15
Advisory 7546 2603 10473 2927
Alert 6000 2661 6215 215
Warning 3100 2603 5170 2070
ATP16
Advisory 7931 2089 8405 474
Alert 3995 1950 4106 111
Warning 3500 1923 3563 063
ATP17
Advisory 8243 2049 8244 001
Alert 5260 2465 5601 341
Warning 4718 2438 4763 045
US Department of Transportation Office of the Assistant Secretary for Research and Technology
Intelligent Transportation Systems Joint Program Office
Task 8 D2X Hub Proof-of-Concept Test Evaluation Report ndash Final | A-11
Table A-6 Complete Data Analysis ndash Hypothesis 7
Date Test
Number
User State Change Is
Safe Icon False
Properly Processed
User State Change Is
Safe Icon True
Properly Processed
1312017 TFHRC 1 111438 X 111504 X
1312017 TFHRC 3 112533 X 112619 X
1312017 TFHRC 4 114400 X 114438 X
1312017 TFHRC 5 114801 X 114829 X
1312017 TFHRC 6 115408 X 115444 X
1182017 ATP 1 105056 X 105116 X
1182017 ATP 2 105622 X 105656 X
1182017 ATP 3 110348 X 110436 X
1182017 ATP 4 111355 X 111417 X
1182017 ATP 5 111655 X 111717 X
1182017 ATP 6 111947 X 112007 X
1182017 ATP 7 112235 X 112305 X
1182017 ATP 8 112937 X 113013 X
1182017 ATP 9 113313 X 113353 X
1182017 ATP 10 113636 X 113708 X
1192017 ATP 11 45035 X 45057 X
1192017 ATP 13 45806 X 45828 X
1192017 ATP 14 50144 X 50202 X
1192017 ATP 15 50542 X 50600 X
1192017 ATP 16 50903 X 50929 X
APPENDIX A Comprehensive Data Analysis Tables
US Department of Transportation Office of the Assistant Secretary for Research and Technology
Intelligent Transportation Systems Joint Program Office
Task 8 D2X Hub Proof-of-Concept Test Evaluation Report ndash Final | A-12
APPENDIX A Comprehensive Data Analysis Tables
Table A-7 Complete Data Analysis ndash Hy pothesis 8 amp 9
US Department of Transportation Office of the Assistant Secretary for Research and Technology
Intelligent Transportation Systems Joint Program Office
Task 8 D2X Hub Proof-of-Concept Test Evaluation Report ndash Final | A-13
Test Number
Analyze the percentage of PMM messages properly processed by
in-vehicle devices Analyze the percentage of PMM-RSP messages
properly processed by mobile devices
Analyze the percentage of PMM-Cancel messages
properly processed by in-vehicle devices
MDEA Log ndash PMM Send
occurrence
MDEA Log ndash
PMM contents
VEA Log ndash PMM
Receive occurrence
VEA Log ndash Driver
acceptance
VEA Log ndash PMM-RSP
Send occurrence
MDEA Log ndash PMM-RSP
Receive occurrence
MDEA Log ndash Coordination
Status
MDEA Log ndash PMM-
Cancel Sent Occurrence
VEA Log ndash PMM-
Cancel Received
Occurrence
TFHRC 1 Check All Present Check Check Check Check Check Check Check
TFHRC 2 Check All Present Check Check Check Check Check Check Check
TFHRC 3 Check All Present Check Check Check Check Check Check Check
TFHRC 4 Check All Present Check Check Check Check Check Check Check
TFHRC 5 Check All Present Check Check Check Check Check Check Check
ATP 1 Check All Present Check Check Check Check Check Check Check
ATP 2 Check All Present Check Check Check Check Check Check Check
ATP 3 Check All Present Check Check Check Check Check Check Check
ATP 4 Check All Present Check Check Check Check Check Check Check
ATP 5 Check All Present Check Check Check Check Check Check Check
ATP 6 Check All Present Check Check Check Check Check Check Check
ATP 7 Check All Present Check Check Check Check Check Check Check
ATP 8 Check All Present Check Check Check Check Check Check Check
ATP 9 Check All Present Check Check Check Check Check Check Check
ATP 10 Check All Present Check Check Check Check Check Check Check
APPENDIX A Comprehensive Data Analysis Tables
Test Number
Analyze the percentage of PMM messages properly processed by
in-vehicle devices Analyze the percentage of PMM-RSP messages
properly processed by mobile devices
Analyze the percentage of PMM-Cancel messages
properly processed by in-vehicle devices
MDEA Log ndash PMM Send occurrence
MDEA Log ndash PMM
contents
VEA Log ndash PMM
Receive occurrence
VEA Log ndash Driver
acceptance
VEA Log ndash PMM-RSP
Send occurrence
MDEA Log ndash PMM-RSP
Receive occurrence
MDEA Log ndash Coordination
Status
MDEA Log ndash PMM-
Cancel Sent Occurrence
VEA Log ndash PMM-
Cancel Received
Occurrence
ATP 11 Check All Present Check Check Check Check Check Check Check
ATP 12 Check All Present Check Check Check Check Check Check Check
ATP 13 Check All Present Check Check Check Check Check Check Check
ATP 14 Check All Present Check Check Check Check Check Check Check
ATP 15 Check All Present Check Check Check Check Check Check Check
ATP 16 Check All Present Check Check Check Check Check Check Check
ATP 17 Check All Present Check Check Check Check Check Check Check
US Department of Transportation Office of the Assistant Secretary for Research and Technology
Intelligent Transportation Systems Joint Program Office
Task 8 D2X Hub Proof-of-Concept Test Evaluation Report ndash Final | A-14
Table A-8 Complete Data Analysis ndash Hy pothesis 10
Date Test Number
Analyze the Success Rate of Receiving a PMM-Arrive Message
VEA Log ndash PMM-ARRIVE Send Occurrence MDEA Log ndash PMM-ARRIVE Receive Occurrence
1312017 TFHRC 1 Fail Fail
1312017 TFHRC 2 Check Check
1312017 TFHRC 3 Check Check
1312017 TFHRC 4 Check Check
1312017 TFHRC 5 Check Check
1312017 TFHRC 6 Check Check
1312017 TFHRC 7 Check Check
1182017 ATP 1 Not Available Check
1182017 ATP 2 Not Available Check
1182017 ATP 3 Not Available Check
1182017 ATP 4 Not Available Check
1182017 ATP 5 Not Available Check
1182017 ATP 6 Not Available Check
1182017 ATP 7 Not Available Check
1182017 ATP 8 Not Available Check
1182017 ATP 9 Not Available Check
1182017 ATP 10 Not Available Check
1202017 ATP 11 Check Check
1202017 ATP 12 Check Check
1202017 ATP 13 Check Check
1202017 ATP 14 Check Check
1202017 ATP 15 Check Check
APPENDIX A Comprehensive Data Analysis Tables
US Department of Transportation Office of the Assistant Secretary for Research and Technology
Intelligent Transportation Systems Joint Program Office
Task 8 D2X Hub Proof-of-Concept Test Evaluation Report ndash Final | A-15
APPENDIX A Comprehensive Data Analysis Tables
Table A-9 Complete Data Analysis ndash Hypothesis 13 (Part A)
US Department of Transportation Office of the Assistant Secretary for Research and Technology
Intelligent Transportation Systems Joint Program Office
Task 8 D2X Hub Proof-of-Concept Test Evaluation Report ndash Final | A-16
Test Number
Coordination Request Sent
by Y
Coordination Request
Received by X
Request Confirmed
by X Confirmation Received by Y
Coordination Request Sent
by Z
Coordination Request
Received by X
Request Confirmed
by X Confirmation Received by Z
Coordination Heart Beat
Transmitted by Y amp Z
Heart Beat Response received
by X
Ride Arrived
Messages
TFHRC 1
Fail Traveler Y could not join the ad-hoc travel group
TFHRC 2
Check check check check 41047 check check check check check 41303
TFHRC 3
Check Check Check Check Check Check Check Check Check Check Check
TFHRC 4
Fail Traveler Y could not join the ad-hoc travel group
TFHRC 5
Check Check Check Check Check Check Check Check Check Check Check
TFHRC 6
Check Check Check Check Check Check Check Check Check Check Check
TFHRC 7
Check Check Check Check Check Check Check Check Check Check Check
TFHRC 8
Check Check Check Check Check Check Check Check Check Check Check
TFHRC 9
Check Check Check Check Check Check Check Check Check Check Check
TFHRC 10
Check Check Check Check Check Check Check Check Check Check Check
ATP 1 Check Check Check Check Check Check Check Check Check Check Check
ATP 2 Check Check Check Check Check Check Check Check Check Check Check
Test Number
Coordination Request Sent
by Y
Coordination Request
Received by X
Request Confirmed
by X Confirmation Received by Y
Coordination Request Sent
by Z
Coordination Request
Received by X
Request Confirmed
by X Confirmation Received by Z
Coordination Heart Beat
Transmitted by Y amp Z
Heart Beat Response received
by X
Ride Arrived
Messages
ATP 3 Check Check Check Check Check Check Check Check Check Check Check
ATP 4 Check Check Check Check Check Check Check Check Check Check Check
ATP 5 Check Check Check Check Check Check Check Check Check Check Check
ATP 6 Check Check Check Check Check Check Check Check Check Check Check
ATP 7 Check Check Check Check Check Check Check Check Check Check No ride
arrives received
ATP 8 Check Check Check Check Check Check Check Check Check Check Check
ATP 9 Check Check Check Check Check Check Check Check Check Check No ride
arrives received
ATP 10 Check Check Check Check Check Check Check Check Check Check Check
ATP 11 Check Check Check Check Check Check Check Check Check Check Check
ATP 12 Check Check Check Check Check Check Check Check Check Check No ride
arrives received
ATP 13 Check Check Check Check Check Check Check Check Check Check Check
ATP 14 Check Check Check Check Check Check Check Check Check Check Check
ATP 15 Check Check Check Check Check Check Check Check Check Check Check
APPENDIX A Comprehensive Data Analysis Tables
US Department of Transportation Office of the Assistant Secretary for Research and Technology
Intelligent Transportation Systems Joint Program Office
Task 8 D2X Hub Proof-of-Concept Test Evaluation Report ndash Final | A-17
APPENDIX A Comprehensive Data Analysis Tables
Table A-10 Complete Data Analysis ndash Hypothesis 13 (Part B)
US Department of Transportation Office of the Assistant Secretary for Research and Technology
Intelligent Transportation Systems Joint Program Office
Task 8 D2X Hub Proof-of-Concept Test Evaluation Report ndash Final | A-18
Test Number Coordination Cancel by
Walking Away Coordination Cancel by
Manual Request Disband Group after
Entering into Vehicle
TFHRC 1 Check This step not tested on this day
TFHRC 2 Check This step not tested on this day
TFHRC 3 Check This step not tested on this day
TFHRC 4 Check This step not tested on this day
TFHRC 5 Check This step not tested on this day
TFHRC 6 This step not tested on this day Check Check
TFHRC 7 This step not tested on this day Check Check
TFHRC 8 This step not tested on this day Check Check
TFHRC 9 This step not tested on this day Check Check
TFHRC 10 This step not tested on this day Check Check
ATP 1 Check Check Check
ATP 2 Check Check Check
ATP 3 Check Check Check
ATP 4 Check Check Check
ATP 5 Check Check Check
ATP 6 Check Check Check
ATP 7 Check Check Check
ATP 8 Check Check Check
ATP 9 Check Check Check
APPENDIX A Comprehensive Data Analysis Tables
Test Number Coordination Cancel by
Walking Away Coordination Cancel by
Manual Request Disband Group after Entering into Vehicle
ATP 10 Check Check Check
ATP 11 Fail Could not cancel by distance Check Check
ATP 12 Check Check Check
ATP 13 Fail Could not cancel by distance Check Check
ATP 14 Check Check Check
ATP 15 Check Check Check
US Department of Transportation Office of the Assistant Secretary for Research and Technology
Intelligent Transportation Systems Joint Program Office
Task 8 D2X Hub Proof-of-Concept Test Evaluation Report ndash Final | A-19
APPENDIX A Comprehensive Data Analysis Tables
APPENDIX B Acronyms and Abbreviations
ATG Ad-Hoc Travel Group
ATP Acceptance Test Plan
BSM Basic Safety Message
CCP Common Computing Platform
CV Connected Vehicle
DSRC Dedicated Short Range Communications
EPS Experimental Prototype System
FHWA Federal Highway Administration
FR Functional Requirement
ITS Intelligent Transportation Systems
LDV Light-Duty Vehicle
MAP Map Data
MDEA Mobile Device Experimental Application
MGL Message Logging
OBU On-board Unit
PMM Personal Mobility Message
PMM-ARRIVE Personal Mobility Message Arrival Message
PMM-CANCEL Personal Mobility Message Cancel Message
PMM-RSP Personal Mobility Message Response Message
PR Performance Requirement
PSM Personal Safety Message
REA Roadside Experimental Application
RSU Roadside Unit
SFY Safety
SIR System Interface Requirement
SMP SPaT and MAP
SPaT Signal Phasing and Timing
SyRS System Requirements Specifications
TFHRC Turner-Fairbank Highway Research Center
US DOT US Department of Transportation
US Department of Transportation Office of the Assistant Secretary for Research and Technology
Intelligent Transportation Systems Joint Program Office
Task 8 D2X Hub Proof-of-Concept Test Evaluation Report ndash Final |B-1
VEA Vehicle Experimental Application
Wi-Fi Wireless Fidelity
APPENDIX B Acronyms and Abbreviations
US Department of Transportation Office of the Assistant Secretary for Research and Technology
Intelligent Transportation Systems Joint Program Office
Task 8 D2X Hub Proof-of-Concept Test Evaluation Report ndash Final | B-2
APPENDIX C Terms and Definitions
Basic Safety Message (BSM)
Connected vehicle message type which contains vehicle safety-related information that is broadcast to surrounding vehicles
Bluetooth Short range wireless technology used to exchange data between enabled devices
Cellular Uses short-range radio stations to cover areas of communication
Connected Vehicle A vehicle that can communicate with other vehicles and infrastructure via communication media such as DSRC Wi-Fi cellular or Bluetooth
Coordinated Messages are coordinated when two or more mobile devices have establish a travel group based on the same origin destination and
time and function as a single cohesive senderrecipient
CV Inspector An application that verifies if the Mobile Device is broadcasting messages to Connected Vehicles
Destination The end point of a travelerrsquos trip
DSRC Dedicated Short-Range Communications a low-latency high-reliability two-way communications tool used for sending transportation safety
messages
Light-Duty Vehicle Of or relating to vehicles that way less than 4000 lbs
Message Type Type of personal safety or personal mobility message that is transmitted based on the technology used and level of coordination available
Personal Mobility Message (PMM)
Similar to PDM message intended for the exchange of mobility messages between individual travelers and vehiclesinfrastructure via
mobile device
Personal Safety Message (PSM)
Similar to BSM message intended to transmit low-latency urgent safety messages between individual travelers and vehiclesinfrastructure via
mobile device
Test Case A set of conditions or variables that a Tester can determine if system meets requirements
Transit Vehicle Large vehicles mainly used for public transportation as well as support services
Transmitting The state in which a traveler has opted in and is sendingreceiving messages via mobile device
Uncoordinated Messages are uncoordinated when travel groups are not established (see coordinated definition)
Wi-Fi Local area wireless technology that allows enabled devices to connect to the Internet
APPENDIX A Comprehensive Data Analysis Tables
US Department of Transportation Office of the Assistant Secretary for Research and Technology
Intelligent Transportation Systems Joint Program Office
Task 8 D2X Hub Proof-of-Concept Test Evaluation Report ndash Final |C-1
ITS Joint Program Office-HOIT 1200 New Jersey Avenue SE
Washington DC 20590
Toll-Free ldquoHelp Linerdquo 866-367-7487 wwwitsdotgov
FHWA-JPO-18-263
- Structure Bookmarks
-
- Sharing Data between Mobile Devices Connected Vehicles and Infrastructure Task 8 D2X Hub Proof-of-Concept Test Evaluation Report wwwitsdotgovindexhtm Final Report mdash October 25 2017 FHWA-JPO-18-623
- Revision History
- Table of Contents
- Chapter 1 Scope
- Chapter 2 Referenced Documents
- Chapter 3 Test Conduct
- Chapter 4 Experimental Analysis Results Summary
- Chapter 5 Experimental Analysis
- Chapter 6 Lessons Learned and Recommendations
- APPENDIX A Comprehensive Data Analysis Tables
- APPENDIX B Acronyms and Abbreviations
- APPENDIX C Terms and Definitions
-

Chapter 3 Test Conduct
Source Battelle Google Maps January 2017
Figure 3-1 Turner-Fairbank Highway Research Center ndash Testing Location
US Department of Transportation Office of the Assistant Secretary for Research and Technology
Intelligent Transportation Systems Joint Program Office
Task 8 D2X Hub Proof-of-Concept Test Evaluation Report ndash Final | 6
Chapter 4 Experimental Analysis Results Summary
Overall the testing and subsequent analysis showed the ability to reliably generate transmit and receive messages between mobile devices and connected vehicles The messages to incorporate mobile devices into the CV environment functioned as designed and provided the necessary data for the prototype mobility and safety applications to perform their functions While the prototype safety and mobility software applications functioned well (as designed) the performance shortfalls that were observed are largely attributed to current technology limitations and hardware issues
Mixed results were achieved for the various communication methods tested Cellular functioned well while Wi-Fi Direct connectivity was unreliable and DSRC hardware problems caused communication problems with our system GPS accuracy limitations were observed as expected
Table 4-1 provides a summary of the experimental analysis results by hypothesis while Chapter 5 provides more in depth coverage of the analysis
Table 4-1 Experimental Analysis Results Summary
US Department of Transportation Office of the Assistant Secretary for Research and Technology
Intelligent Transportation Systems Joint Program Office
Task 8 D2X Hub Proof-of-Concept Test Evaluation Report ndash Final | 7
Test Case No Hypothesis Description Data Analysis Results
5411 ndash PSM Hypothesis 1 ndash The MDEA only broadcasts PSMs
when in the range of a vehicle broadcasting a BSM No False Negatives Satisfied at
100 Level of Confidence (LOC)
5413 ndash PSM Hypothesis 2 ndash The overall MDEA DSRC message
broadcast rate is lower during travel group coordination
Wi-Fi Direct Grouping Issue 8 False Negatives Satisfied at
875 LOC
5412 ndash PSM Hypothesis 3 ndash The MDEA can cease the broadcast
of PSMs when in a vehicle No False negatives Satisfied at
100 LOC
5411 ndash PSM
Hypothesis 4 ndash The Mobile Device can broadcast a PSM a radius of 250 meters 10 Hz under clear unobstructed conditions regardless of where the mobile device is located on the pedestrianrsquos person
or clothing
Radius limited to 100 m
Satisfied at a 43 level of confidence
5471 ndash SFY
Hypothesis 5 ndash Vehicles OBUs can capture and process Mobile Device PSMs and issue warnings at sufficient distance for drivers to avoid imminent pedestrian collision
No False negatives TFHRC satisfied at 100 LOC
5471 ndash SFY Hypothesis 6 ndash Mobile Devices can capture and process Vehicle BSMs and issue warnings in time for pedestrians to avoid imminent vehicle collision
No False negatives TFHRC satisfied at 100 LOC
5414 ndash PSM Hypothesis 7 ndash Mobile Device applications can detect No False negatives TFHRC
if a pedestrian is in a safe or unsafe zone satisfied at 100 LOC
Chapter 4 Experimental Analysis Results Summary
Test Case No Hypothesis Description Data Analysis Results
5421 5422 5423 ndash PMM
Hypothesis 8 amp 9 ndash The VEA can coordinate taxi travel requests from an MDEA
No False negatives TFHRC satisfied at 100 LOC
5424 ndash PMM Hypothesis 10 ndash The traveler can receive arrival updates from a taxi or transit vehicle
2 False Negatives out of 14 TFHRC Satisfied at 8571 LOC
5451 5452 ndash LDV
Hypothesis 11 amp 12 ndash The MDEA can detect when a traveler transitions from a pedestrian to a light duty vehicle or from a light duty vehicle to a pedestrian
No False negatives Accelerator tests Satisfied at 100 LOC Bluetooth tests failed
5441 5443 5444 ndash ATG
Hypothesis 13 ndash The MDEA can coordinate maintain and cancel travel with another MDEA via Wi-Fi Direct
Wi-Fi Direct Grouping Failure 30 False Negatives out of 198 Satisfied at 8484 LOC
5481 ndash SMP Hypothesis 14 ndash The RSU can broadcast a SPaT and MAP message via DSRC that can be received by mobile devices
No False negatives Satisfied at 100 LOC
5411 5444 5471 ndash MSG
Hypothesis 15 - The RSU can store all messages received via DSRC
RSU - CCP logging issues Not satisfied at 100 LOC
Note The LOC was calculated as a ratio of the total number of successful steps in the test script divided by the total number of steps in the test script (Each hypothesis has a specific test script)
US Department of Transportation Office of the Assistant Secretary for Research and Technology
Intelligent Transportation Systems Joint Program Office
Task 8 D2X Hub Proof-of-Concept Test Evaluation Report ndash Final | 8
US Department of Transportation Office of the Assistant Secretary for Research and Technology
Intelligent Transportation Systems Joint Program Office
Task 8 D2X Hub Proof-of-Concept Test Evaluation Report ndash Final | 9
Chapter 5 Experimental Analysis
Hypothesis 1 The MDEA only broadcasts PSMs when in the range of a vehicle broadcasting a BSM
Data logs verified MDEA Log ndash BSM received and PSM send occurrences
Analysis
Determination of vehicle range from mobile device based on vehicle speed Analysis of PSMs sent with respect to vehicle range (In range and out of range scenarios)
Observations In all the test cases PSMs were broadcasted by MDEA when the vehicle was in its range with respect to vehicle speed (ldquofast enough close enoughrdquo)
Table 5-1 Hypothesis 1 Analysis Data Sample
Vehicle Range and Advisory Speed In Out of Distance Date Time Distance wrt Speed (mph) Range Range (m)
13117 101316 IsBsmClose Dist 975500061708885lt
AdvDist 1024200201024 255 X 98
13117 101332 IsBsmClose Dist 570797651794001lt
AdvDist 666000057888 173 X 57
13117 101340 IsBsmClose Dist 57448436831453lt
AdvDist 601199821728 149 X 57
13117 101529 IsBsmClose Dist 975729907380225lt
AdvDist 102240014976 254 X 98
For the complete analysis please refer to Table A-1 in Appendix A
ݐݑݍܧ ݎ ݑ ݐ dݒݏݕݎ ݐݏ ݓݎݐ ݏ
ௗ௩௦௬= lowastݒ9
Where
is the advisory display distance (meters) ௗ௩௦௬ ݒ is the velocity of the vehicle (meters per second)
Results There were no outliers (False Negatives) in the dat a analyzed Hence Hypothesis 1 is satisfied at a 100 level of confidence
Chapter 5 Experimental Analysis
Hypothesis 2 The overall MDEA DSRC message broadcast rate is lower during travel group coordination
Data logs verified MDEA Log ndash Coordination Status PSM send occurrences before and after coordination
Analysis
Determination of coordination status Analysis of PSMs sent while not part of the travel group and while part of the travel group
(Travel group leader) Analysis of PSMs sent while not part of the travel group and while part of the travel group
(Travel group Member)
Observations Out of 64 log checks performed 56 true positives were observed Two tests had a grouping failure due to Wi-Fi Direct issues
Table 5-2 Hypothesis 2 Analysis Data Sample
Date 13117 13117 13117 13117 13117
Description Test Number TFHRC 1 TFHRC 3 TFHRC 4 TFHRC 5 TFHRC 6
PSMs Generated by Traveler X and Traveler Y 111116 112346 114208 114609 115222
Transition to In Group 111240 112448 114301 114658 115313
Traveler Y PSM ceased Check Check Check Check Check
only Traveler X PSM received 111305 112508 114345 114721 115342
For the complete analysis please refer to Table A-2 in Appendix A
Results There were 8 False Negatives in the data analyzed Hence Hypothesis 2 is satisfied at 875 level of confidence
US Department of Transportation Office of the Assistant Secretary for Research and Technology
Intelligent Transportation Systems Joint Program Office
Task 8 D2X Hub Proof-of-Concept Test Evaluation Report ndash Final | 10
Chapter 5 Experimental Analysis
Hypothesis 3 MDEA Log ndash Travel Mode Status PSM send occurrences
Data logs verified MDEA Log ndash BSM received and PSM send occurrences
Analysis
Determination of mobile device travel mode status Analysis of PSMs sent before and after transition of travel mode (on-foot and In-vehicle)
Observations All the test logs indicate that the PSMs were ceased after the MDEA transitioned its travel mode to In-vehicle
Table 5-3 Hypothesis 3 Analysis Data Sample
Description Test Number
TFHRC 1 TFHRC 2 TFHRC 3 TFHRC 4 TFHRC 5 TFHRC 6
MDEA not in vehicle Check Check Check Check Check Check
MDEA Transmits PSMs
Check Check Check Check Check Check
Time of MDEA Mode Transition
103804 104109 104430 104624 104805 105024
MDEA Ceases Transmitting PSMs
Check Check Check Check Check Check
For the complete analysis please refer to Table A-3 in Appendix A
Results There were no outliers (False Negatives) in the data analyzed Hence Hypothesis 3 is satisfied at a 100 level of confidence
US Department of Transportation Office of the Assistant Secretary for Research and Technology
Intelligent Transportation Systems Joint Program Office
Task 8 D2X Hub Proof-of-Concept Test Evaluation Report ndash Final | 11
US Department of Transportation Office of the Assistant Secretary for Research and Technology
Intelligent Transportation Systems Joint Program Office
Task 8 D2X Hub Proof-of-Concept Test Evaluation Report ndash Final | 12
Chapter 5 Experimental Analysis
Hypothesis 4 The Mobile Device can broadcast a PSM a radius of 250 meters 10 Hz under clear unobstructed conditions regardless of where the mobile device is located on the pedestrianrsquos person or clothing
Data logs verified VEA Log ndash PSM receive occurrences at a d istance of 10 m 50 m 100 m
Analysis
The rate at which PSMs were received by the RSU had been assessed The mobile device was placed in multiple locations on the pedestrian including in-hand in-pocket and in a backpack
Observations Due to DSRC limitations in the CCPs tests could not be performed beyond 100 m range Considering the RSU logging issues VEA Logs were used to analyze PSM broadcasting capacity of MDEA All the tests logged PSMs at a ra te o f 10sec Therefore 150 200 250 300 m radius could no t be a nalyzed Only three (10 50 and 100m) out of seven (10 50 100 150 200 250 and 300 m) cases were tested which resulted in a 43 Level of Confidence
Table 5-4 Hypothesis 4 Analysis Data Sample
Date Time
Vehicle Range and Advisory Distance wrt Speed
Speed (mph)
In Range
Out of Range
True Distance (m)
VEA Log PSM Message Rate
13117 101316 IsBsmClose Dist 975500061708885lt AdvDist 1024200201024
255 98 10
13117 101332 IsBsmClose Dist 570797651794001lt AdvDist 666000057888
173 57 10
13117 101340 IsBsmClose Dist 57448436831453lt AdvDist 601199821728
149 57 10
13117 101529 IsBsmClose Dist 975729907380225lt AdvDist 102240014976
254 98 10
13117 101538 IsBsmClose Dist 399317028326919lt AdvDist 102240014976
250 4 10
For the complete analysis please refer to Table A-1 in Appendix A
Results Due to the DSRC limitations the radius was limited to 100 m Hence Hypothesis 4 is satisfied at a 43 level of confidence
Chapter 5 Experimental Analysis
Hypothesis 5 Vehicles OBUs can capture and process Mobile Device PSMs and issue warnings at sufficient distance for drivers to avoid imminent pedestrian collision
Data logs verified VEA Log ndash PSM Location GPS Location Advisory Display Alert Display and Warning Display
Analysis
Assessing the distance at which an Advisory Alert and Warning were issued based on the speed of the vehicle (in the VEA Log)
Observations a Considering TFHRC tests the average difference in distance for VEA Logging of Advisories
Alerts and Warnings were on average 2028 m 275 m and 194 m respectively b The higher difference in advisory was due to the delay in the time between VEA deciding to
send PSM and Arada sending a PSM c Latency of less than a second was observed between PSM received and the message
display time on MDEA and VEA Logs
sݐݑݍܧ ݎ ݑݐ dݒݏwarningandalertݕݎ ݐݏ ݓݎݐ ݏ
ௗ௩௦௬= lowastݒ9
lowast ሻ05ݒ 25ሾሺൌ 11 lowast ቊ ௧ଶݒ
ሿ 2ሺ34ሻ
ቋ
Where
lowast ሻ05ݒ 25ሾሺൌ 11 lowast ቊ ௪
is the advisory display distance (meters) ௗ௩௦௬
is the alert display distance (meters) ௧
is the warning display distance (meters) ௐ
ଶݒሿ 2ሺ56ሻ
ቋ
ݒ is the velocity of the vehicle (meters per second)
TF 71 Run 2 - VEA
Source Battelle Google Maps February 2017
Figure 5-1 Advisory Alert and Warning Distances with Respect to VEA
US Department of Transportation Office of the Assistant Secretary for Research and Technology
Intelligent Transportation Systems Joint Program Office
Task 8 D2X Hub Proof-of-Concept Test Evaluation Report ndash Final | 13
Chapter 5 Experimental Analysis
Table 5-5 Hypothesis 5 Analysis Data Sample
TFHRC1 TFHRC2 TFHRC3
Advisory Alert Warning Advisory Alert Warning Advisory Alert Warning
True Distance (m) 7584 5545 4874 8552 5167 4515 7876 5827 5124
Speed (MPH) 2471 2523 2498 2595 2461 2433 2381 2590 2624
Expected Distance (m)
9942 5780 4910 10441 5588 4751 9580 5989 5222
Difference (m) 2358 235 036 1889 421 236 1704 162 098
For the complete analysis please refer to Table A-4 in Appendix A
Table 5-6 Total and Average Differences between Actual and Calculated Advisories Alerts and Warnings (VEA)
TFHRC Advisory Alert Warning
Total Difference (m) 10139 1376 971
Average Difference (m) 2028 275 194
Results There were no outliers (False Negatives) in the data analyzed Hence Hypothesis 5 is satisfied at a 100 level of confidence
US Department of Transportation Office of the Assistant Secretary for Research and Technology
Intelligent Transportation Systems Joint Program Office
Task 8 D2X Hub Proof-of-Concept Test Evaluation Report ndash Final | 14
Hypothesis 6 Mobile Devices can capture and process Vehicle BSMs and issue warnings in time for pedestrians to avoid imminent vehicle collision
Data logs verified MDEA Log ndash BSM Location GPS Location Advisory Display Alert Display and Warning Display
Analysis
Assessing the distance at which an Advisory Alert and Warning were issued based on the speed of the vehicle (in the BSM received by the mobile device)
Observations a Considering the TFHRC results the average difference in distance for MDEA logging of
Advisories Alerts and Warnings were on average 278 m 323 m and 334 m respectively b Latency of less than a second was observed on MDEA and VEA Logs
sݐݑݍܧ ݎ ݑݐ dݒݏwarningandalertݕݎ ݐݏ ݓݎݐ ݏ
ௗ௩௦௬= lowastݒ9
lowast ሻ05ݒ 25ሾሺൌ 11 lowast ቊ ௧ଶݒ
ሿ 2ሺ34ሻ
ቋ
ଶݒሿ 2ሺ56ሻ
ቋ
Where
lowast ሻ05ݒ 25ሾሺൌ 11 lowast ቊ ௪
is the advisory display distance (meters) ௗ௩௦௬
is the alert display distance (meters) ௧
is the warning display distance (meters) ௐ
ݒ is the velocity of the vehicle (meters per second)
Chapter 5 Experimental Analysis
TF 71 Run 2 - MDEA
US Department of Transportation Office of the Assistant Secretary for Research and Technology
Intelligent Transportation Systems Joint Program Office
Task 8 D2X Hub Proof-of-Concept Test Evaluation Report ndash Final | 15
Source Battelle Google Maps February 2017
Figure 5-2 Advisory Alert and Warning Distances with Respect to MDEA
Chapter 5 Experimental Analysis
Table 5-7 Hypothesis 6 Analysis Data Sample
TFHRC1 TFHRC2 TFHRC3
Advisory Alert Warning Advisory Alert Warning Advisory Alert Warning
True Distance (m) 8756 5320 4651 9928 5276 4624 8952 5595 4890
Speed (mph) 2290 2509 2487 2514 2447 2415 2304 2603 2617
Expected distance (m) 9213 5736 4883 10115 5546 4707 9270 6030 5205
Difference (m) 458 416 232 187 270 084 318 436 315
For the complete analysis please refer to Table A-5 in Appendix A
Table 5-8 Total and Average Differences between Actual and Calculated Advisories Alerts and Warnings (MDEA)
TFHRC Advisory Alert Warning
Total Difference (m) 1392 1617 1671
Average Difference (m) 278 323 334
Results There were no false alarms detected at neither of the TFHRCATP tests performed Hence Hypothesis 6 is satisfied at a 100 level of confidence
Issues Identified GPS Inaccuracy ndash Cross Track Distance Issue
The accuracy of GPS as per the US government claims is +- 4 m This error in GPS accuracy was balanced by increasing the cluster radius to 7 m for all the tests at TFHRC This modification in cluster radius increased the efficiency of pedestrian detection by closing out the difference in Cross Track Distancersquo
There were no false alarms detected at neither of the TFHRCATP tests performed
US Department of Transportation Office of the Assistant Secretary for Research and Technology
Intelligent Transportation Systems Joint Program Office
Task 8 D2X Hub Proof-of-Concept Test Evaluation Report ndash Final | 16
Chapter 5 Experimental Analysis
Source Battelle Google Maps February 2017
Figure 5-3 Cross Track Distance between Pedestrian and Vehicle Path
US Department of Transportation Office of the Assistant Secretary for Research and Technology
Intelligent Transportation Systems Joint Program Office
Task 8 D2X Hub Proof-of-Concept Test Evaluation Report ndash Final | 17
Chapter 5 Experimental Analysis
Hypothesis 7 MDEA Log ndash GPS Location SafeUnsafe Zone Status and MAP Message Contents
Data logs verified MDEA Log ndash GPS Location SafeUnsafe Zone Status and MAP Message Contents
Analysis
Analyzed the percentage of properly classified safeunsafe zone detections The device was placed in the roadway ndash mobile device location was properly classified if it positions itself in an unsafe zone
Observations User State Change from Safe to Unsafe (when placed 20 m in the roadway) and Unsafe to Safe (when placed 50 m from the roadway) were captured accurate and timely
Table 5-9 Hypothesis 7 Analysis Data Sample
TFHRC 1 TFHRC 2 TFHRC 3 TFHRC 4 TFHRC 5
User State Change Is Safe Icon False (2 m in the roadway)
111438 112533 114400 114801 115408
Properly Processed
User State Change Is Safe Icon True (5 m from the roadway)
111504 112619 114438 114829 115444
Properly Processed
For the complete analysis please refer to Table A-6 in Appendix A
US Department of Transportation Office of the Assistant Secretary for Research and Technology
Intelligent Transportation Systems Joint Program Office
Task 8 D2X Hub Proof-of-Concept Test Evaluation Report ndash Final | 18
Chapter 5 Experimental Analysis
Source Battelle Google Maps February 2017
Figure 5-4 Safe and Unsafe Zones at TFHRC Test Site
Results There were no outliers (False Negatives) in the data analyzed Hence Hypothesis 7 is satisfied at a 100 level of confidence
US Department of Transportation Office of the Assistant Secretary for Research and Technology
Intelligent Transportation Systems Joint Program Office
Task 8 D2X Hub Proof-of-Concept Test Evaluation Report ndash Final | 19
Chapter 5 Experimental Analysis
Hypothesis 8 amp 9 The VEA can coordinate taxi travel requests from an MDEA
Data logs verified MDEA Log ndash PMM Send Occurrence PMM contents PMM-RSP Receive Occurrence Coordination Status and PMM-Cancel Sent Occurrence
Analysis
Analyzed the percentage of PMM and PMM ndash Cancel messages properly processed by in-vehicle devices
Analyzed the percentage of PMM-RSP messages properly processed by mobile devices This analysis was performed for PMM Messages communicated through both DSRC and
Cellular
Observations 16 out of 204 checks had a failure during tests performed under ATP
Table 5-10 Hypothesis 8 amp 9 Analysis Data Sample
TFHRC 1 TFHRC 2 TFHRC 3 TFHRC 4 TFHRC 5
Analyze the percentage of PMM messages properly processed by in-vehicle devices
MDEA Log ndash PMM Send occurrence
Check Check Check Check Check
MDEA Log ndash PMM contents
All Present All Present All Present All Present All Present
Experimental Log ndash Information entered into
Mobile Device by Traveler
VEA Log ndash PMM Receive occurrence
Check Check Check Check Check
Analyze the percentage of PMM-RSP messages properly processed by mobile devices
Experimental Log ndash Driver Acceptance
VEA Log ndash Driver acceptance
Check Check Check Check Check
VEA Log ndash PMM-RSP Send occurrence
Check Check Check Check Check
MDEA Log ndash PMM-RSP Receive occurrence
Check Check Check Check Check
MDEA Log ndash Coordination Status
Check Check Check Check Check
Experimental Log ndash Coordination Success
Display
US Department of Transportation Office of the Assistant Secretary for Research and Technology
Intelligent Transportation Systems Joint Program Office
Task 8 D2X Hub Proof-of-Concept Test Evaluation Report ndash Final | 20
Chapter 5 Experimental Analysis
TFHRC 1 TFHRC 2 TFHRC 3 TFHRC 4 TFHRC 5
Analyze the percentage of PMM-Cancel messages properly processed by in-vehicle devices
MDEA Log ndash PMM-Cancel Sent Occurrence
Check Check Check Check Check
VEA Log ndash PMM-Cancel Received
Occurrence Check Check Check Check Check
For the complete analysis please refer to Table A-7 in Appendix A
Results Considering the tests performed at TFHRC Hypothesis 8 is satisfied at a 100 level of confidence However ATP tests satisfied the hypothesis at a confidence level of 9215
Issues Identified
Some issues observed for cloud communication during ATP testing at Columbus OH
Delay in Cloud PMM-cancel for VEA ndash 8 instances Adding a trip twice ndash 5 instances Some PMMs not being cancelled ndash 3 instances
All these issues were addressed prior to TFHRC tests
TFHRC tests did not have any of the above issues
US Department of Transportation Office of the Assistant Secretary for Research and Technology
Intelligent Transportation Systems Joint Program Office
Task 8 D2X Hub Proof-of-Concept Test Evaluation Report ndash Final | 21
Chapter 5 Experimental Analysis
Hypothesis 10 The traveler can receive arrival updates from a taxi or transit vehicle
Data logs verified VEA Log ndash PMM-ARRIVE Send Occurrence
MDEA Log ndash PMM-ARRIVE receive occurrence
Analysis
Analyzed the success rate of receiving a PMM-Arrive message via DSRC
Observations One test case at TFHRC failed due to equipment failure (CCP lost its location) All other tests satisfied the hypothesis
Table 5-11 Hypothesis 10 Analysis Data Sample
TFHRC 1
TFHRC 2
TFHRC 3
TFHRC 4
TFHRC 5
TFHRC 6
TFHRC 7
DSRC (Taxi)
Analyze the success rate of receiving a PMM-Arrive message
VEA Log ndash PMM-ARRIVE
Send occurrence
Fail Check Check Check Check Check Check
MDEA Log ndash PMM-ARRIVE
Receive occurrence
Fail Check Check Check Check Check Check
For the complete analysis please refer to Table A-8 in Appendix A
Results Considering the tests at TFHRC the hypothesis is satisfied at a confidence level of 8571 12 out of 14 tests were successful
US Department of Transportation Office of the Assistant Secretary for Research and Technology
Intelligent Transportation Systems Joint Program Office
Task 8 D2X Hub Proof-of-Concept Test Evaluation Report ndash Final | 22
Chapter 5 Experimental Analysis
Hypothesis 11 amp 12 The MDEA can detect when a traveler transitions from a pedestrian to a light duty vehicle or from a light duty vehicle to a pedestrian
Data logs verified MDEA Log ndash Travel Mode Status Change Experimental Log ndash Mode Transition Detection Log
Analysis 1 Assessed the change in ldquoTravel Mode Statusrdquo after the pedestrian enters the vehicle
(The threshold value for Travel Mode Status Change is 10 secs) 2 Assessed the false positive rate of transition detection
Observations Accelerometer tests on average took 75 secs and 44 secs to detect in-vehicle and on-foot respectively However Bluetooth beacon tests on a verage took 17 secs and 1 1 secs to detect in-vehicle and on-foot respectively This quantifies the unreliable nature of Bluetooth Beacons as used in this system
Table 5-12 Hypothesis 11 amp 12 Analysis Data Sample
Mode Detection Method On-foot to In-Vehicle Transition time (Sec)
In-Vehicle to On-foot Transition Time (Sec)
Accelerometer 75 44
Bluetooth Beacon 17 11
Results Hypothesis is proved as 100 confident during the accelerometer tests However none of the tests with Bluetooth Beacon satisfied the hypothesis (all false negatives)
US Department of Transportation Office of the Assistant Secretary for Research and Technology
Intelligent Transportation Systems Joint Program Office
Task 8 D2X Hub Proof-of-Concept Test Evaluation Report ndash Final | 23
Chapter 5 Experimental Analysis
Hypothesis 13 The MDEA can coordinate maintain and cancel travel with another MDEA via Wi-Fi Direct
Data logs verified MDEA (1) Log ndash Coordination Request Received Occurrence Coordination Request Contents Coordination Acceptance Sent Occurrence Coordination Acceptance Notification Coordination Heartbeat Received Occurrence Coordination Cancel Response Sent occurrence and Coordination Disband Sent occurrence
MDEA (2) Log ndash Coordination Request Sent Occurrence Coordination Confirmation received Occurrence Coordination Heartbeat Response Sent Occurrence Coordination Acceptance received Occurrence
Analysis 1 Determined the percentage of Coordination Request Acceptance Heartbeat Cancel and
Disband messages properly processed by mobile devices 2 Assessed the message contents for consistency
Observations This test is performed in a highly-controlled environment This means selection of specific devices and designating them with specific roles This approach was chosen due to poor Wi-Fi direct performance with our system that would have otherwise hindered the ability to conduct the testing and collect the necessary data
US Department of Transportation Office of the Assistant Secretary for Research and Technology
Intelligent Transportation Systems Joint Program Office
Task 8 D2X Hub Proof-of-Concept Test Evaluation Report ndash Final | 24
Chapter 5 Experimental Analysis
Table 5-13 Hypothesis 13 Analysis Data Sample
13117 2117
TFHRC 1
TFHRC 2
TFHRC 3
TFHRC 4
TFHRC 5
TFHRC 6
TFHRC 7
TFHRC 8
TFHRC 9
TFHRC 10
Coordination Request Sent by
Y
Fai
l T
rave
ler
Y c
ould
no
t joi
n th
e ad
-hoc
trav
el g
roup
40951 Check
F
ail
Tra
vele
r Y
cou
ld
not j
oin
the
ad-h
oc tr
avel
gro
up
Check Check Check Check Check Check
Coordination Request Received
by X check Check Check Check Check Check Check Check
Request Confirmed by X
check Check Check Check Check Check Check Check
Confirmation Received by Y
Coordination Request Sent by
Z
check Check Check Check Check Check Check Check
41047 Check Check Check Check Check Check Check
Coordination Request Received
by X check Check Check Check Check Check Check Check
Request Confirmed by X
check Check Check Check Check Check Check Check
Confirmation Received by Z
Coordination Heart Beat
Transmitted by Y amp Z
check Check Check Check Check Check Check Check
check Check Check Check Check Check Check Check
Heart Beat Response
received by X
Ride Arrived Messages
check Check Check Check Check Check Check Check
41303 Check Check Check Check Check Check Check
Coordination Cancel by walking
away Check Check Check Check Check This step not tested on this day
Coordination Cancel by Manual
request This step not tested on this day
Check Check Check Check Check
Disband Group after entering into
vehicle Check Check Check Check Check
For the complete analysis please refer to Table A-9 and Table A-10 in Appendix A
Results There were 30 outliers out of 198 checks (False Negatives) in the data analyzed Hence Hypothesis 13 is satisfied at an 8484 level of confidence
US Department of Transportation Office of the Assistant Secretary for Research and Technology
Intelligent Transportation Systems Joint Program Office
Task 8 D2X Hub Proof-of-Concept Test Evaluation Report ndash Final | 25
US Department of Transportation Office of the Assistant Secretary for Research and Technology
Intelligent Transportation Systems Joint Program Office
Task 8 D2X Hub Proof-of-Concept Test Evaluation Report ndash Final | 26
Chapter 5 Experimental Analysis
Hypothesis 14 The RSU can broadcast a SPaT and MAP message via DSRC that can be received by mobile devices
Data logs verified MDEA Log ndash BSM received and PSM send occurrences
Analysis 1 Determined the percentage of SPaT messages received by mobile devices when within
100 meters of RSE Assessed message contents for consistency 2 Determined the percentage of MAP messages received by mobile devices when within
100 meters of RSE Assessed message contents for consistency
Observations Considering test 5444 all the SPa T messages were transmitted and received at a rate of 1sec Similarly all the MAP messages were transmitted and received at a rate better than 5sec
Table 5-14 Hypothesis 14 Analysis Data Sample
ID Date Message
5 13117 163842 Dsrc Rx Spat id19
6 13117 163842 Dsrc Rx Map id18
9 13117 163843 Dsrc Rx Spat id19
10 13117 163843 Dsrc Rx Bsm Lat389546323 Long -771488295 Head 2713375 Sp 0
12 13117 163843 Dsrc Rx Bsm Lat389546138 Long -771483988 Head 2559125 Sp 0
13 13117 163844 Dsrc Rx Spat id19
14 13117 163844 Dsrc Rx Bsm Lat389546323 Long -771488297 Head 2713375 Sp 0
16 13117 163844 Dsrc Rx Bsm Lat389546138 Long -771483987 Head 2559125 Sp 0
17 13117 163844 Dsrc Rx Map id18
18 13117 163844 Dsrc Rx Bsm Lat389546322 Long -7714883 Head 2713375 Sp 0
20 13117 163845 Dsrc Rx Bsm Lat389546137 Long -771483987 Head 2559125 Sp 0
21 13117 163845 Dsrc Rx Bsm Lat389546322 Long -771488302 Head 2713375 Sp 0
22 13117 163845 Dsrc Rx Spat id19
23 13117 163845 Dsrc Rx Bsm Lat389546137 Long -771483987 Head 2559125 Sp 0
25 13117 163845 Dsrc Rx Bsm Lat38954632 Long -771488302 Head 2713375 Sp 0
26 13117 163846 Dsrc Rx Bsm Lat389546135 Long -771483987 Head 2559125 Sp 0
27 13117 163846 Dsrc Rx Spat id19
29 13117 163846 Dsrc Rx Bsm Lat389546318 Long -771488303 Head 2713375 Sp 0
31 13117 163846 Dsrc Rx Map id18
Results There were no outliers (False Negatives) in the data analyzed Hence Hypothesis 14 is satisfied at a 100 level of confidence
Chapter 5 Experimental Analysis
Hypothesis 15 The RSU can store all messages received via DSRC
Data logs verified MDEA Log ndash All Occurrences of messages sent via DSRC and Message Contents RSU Log ndash Message Received Occurrence and Message Contents
Analysis 1 Assessed the percentage of messages received from mobile devices within 100 meters of
RSE Assess message contents to make sure they are consistent
Observations a Considering the message logs from test cases 5411 5444 5471 there were instances
where PSMs were logged at a rate of less than 10sec Also there were test cases that had no reception of PSMs This clearly indicates the reception issues with RSU CCP unit One prime focus for the Large-Scale Field Test is to improve the reliability of the hardware associated with RSU
b The message contents in all the DSRC messages were consistent throughout the test logs
Table 5-15 Hypothesis 15 Analysis Data Sample
Date Time
Vehicle Range and Advisory Distance wrt
Speed Speed (mph)
In Range
Out of Range
Distance (m)
RSU Log PSM
Message RateSec
13117 101316 IsBsmClose Dist
975500061708885lt AdvDist 1024200201024
255 98 8
13117 101332 IsBsmClose Dist
570797651794001lt AdvDist 666000057888
173 57 6
13117 101340 IsBsmClose Dist
57448436831453lt AdvDist 601199821728
149 57 1
13117 101529 IsBsmClose Dist
975729907380225lt AdvDist 102240014976
254 98 0
13117 101538 IsBsmClose Dist
399317028326919lt AdvDist 102240014976
250 4 1
For the complete analysis please refer to Table A-1 in Appendix A
US Department of Transportation Office of the Assistant Secretary for Research and Technology
Intelligent Transportation Systems Joint Program Office
Task 8 D2X Hub Proof-of-Concept Test Evaluation Report ndash Final | 27
Chapter 5 Experimental Analysis
Table 5-16 Data Usage Statistics
17-Jan 18-Jan 19-Jan 20-Jan 31-Jan 1-Feb Average Maximum
Total Usage (MB) 3805 626 714 2713 4873 1355 984 2713
TMX core usage (MB) 271 450 468 1991 345 90 705 1991
of TMX usage 71 72 66 73 71 66 71 73
Results The hypothesis statement of RSU being able to store all messages received via DSRC is not satisfied at 100 level of confidence due to hardware issues
US Department of Transportation Office of the Assistant Secretary for Research and Technology
Intelligent Transportation Systems Joint Program Office
Task 8 D2X Hub Proof-of-Concept Test Evaluation Report ndash Final | 28
Chapter 6 Lessons Learned and Recommendations
Lessons Learned
The Lessons Learned from the Proof-of-Concept testing are summarized as follows
The ability to reliably generate transmit and receive messages between mobile devices and connected vehicles was demonstrated
The messages to incorporate mobile devices into the C V environment functioned as designed and provided the necessary data for the prototype mobility and safety applications
The prototype safety and mobility software applications functioned well (as designed)
Limitations of technology and hardware issues caused the majority of performance shortfalls
Mixed results were achieved for the various communication methods tested
a Cellular functioned well with our system
b Wi-Fi Direct connectivity was unreliable with our system
c DSRC hardware problems caused communication problems with our system
GPS accuracy limitations were observed as expected
Wi-Fi Direct Connectivity
The connection process was prone to failure at multiple points with no indication to the application why connection failed
TFHRC success rate was achieved by selecting specific devices that worked best for specific roles otherwise a failure rate gt50 would have been expected based on earlier testing
Canvasing of developer community found similar observations no solutions for our system
Wi-Fi Direct connection process requires authorization from the user of the target device in a real world environment such a request would most likely be denied if noticed at all
US Department of Transportation Office of the Assistant Secretary for Research and Technology
Intelligent Transportation Systems Joint Program Office
Task 8 D2X Hub Proof-of-Concept Test Evaluation Report ndash Final | 29
Chapter 6 Lessons Learned and Recommendations
DSRC Hardware
Common Computer Platform (CCP) Pre-production engineering units were used which were determined to have an impedance mismatch between the DSRC chip and RF connector that caused reduction of signal strength
Arada LocoMate ME There were occasional Bluetooth connection failures to mobile devices as well as occasional DSRC transmissionreception failures Longer term it is assumed that DSRC radios will be integrated into smartphones thus obviating the current issues
Recommendations
Based on outcomes of Proof-of-Concept Testing the following prototype system design changes are recommended to be implemented prior to the larger-scale prototype field test
Add Cellular-based communication for Travel Group coordination between mobile devices
New and improved CCP units will be used for the larger-scale field test
For in-vehicle detection use Accelerometer method as the most reliable option
US Department of Transportation Office of the Assistant Secretary for Research and Technology
Intelligent Transportation Systems Joint Program Office
Task 8 D2X Hub Proof-of-Concept Test Evaluation Report ndash Final | 30
APPENDIX A Comprehensive Data Analysis Tables
Note For all the analysis results depicted below the term ldquocheckrdquo refers to the ldquosuccessrdquo of desired action
Table A-1 Complete Data Analysis ndash Hypothesis 1 4 amp 15
Date Time Vehicle Range and Advisory
Distance wrt Speed Speed In
Range Out of
Range Distance
RSU Log PSM
Message RateSec
VEA Log PSM
Message Rate
1312017 101316 IsBsmClose Dist 975500061708885lt
AdvDist 1024200201024 255 X 98 8 10
1312017 101332 IsBsmClose Dist 570797651794001lt
AdvDist 666000057888 173 X 57 6 10
1312017 101340 IsBsmClose Dist 57448436831453lt
AdvDist 601199821728 149 X 57 1 10
1312017 101529 IsBsmClose Dist 975729907380225lt
AdvDist 102240014976 254 X 98 0 10
1312017 101538 IsBsmClose Dist 399317028326919lt
AdvDist 102240014976 250 X 4 1 10
1312017 101553 IsBsmClose Dist 600719107941917lt
AdvDist 70199987616 174 X 60 0 10
1312017 102029 IsBsmClose Dist 944643508928866lt
AdvDist 1008000141984 251 X 95 0 9
1312017 102048 IsBsmClose Dist 592561932680623lt
AdvDist 628200188352 156 X 59 0 9
US Department of Transportation Office of the Assistant Secretary for Research and Technology
Intelligent Transportation Systems Joint Program Office
Task 8 D2X Hub Proof-of-Concept Test Evaluation Report ndash Final | A-1
APPENDIX A Comprehensive Data Analysis Tables
Date Time Vehicle Range and Advisory
Distance wrt Speed Speed In
Range Out of Range Distance
RSU Log PSM
Message RateSec
VEA Log PSM
Message Rate
1312017 102054 IsBsmClose Dist 616348297460404lt
AdvDist 644399845056 160 X 62 3 11
1312017 102105 IsBsmClose Dist 871180496389495lt
AdvDist 1092600137376 247 X 87 4 9
1312017 102206 IsBsmClose Dist 977301610734722lt
AdvDist 1130400006912 295 X 98 0 10
1312017 102228 IsBsmClose Dist 577576034007057lt
AdvDist 60659997552 151 X 58 2 10
1312017 102332 IsBsmClose Dist 101193300977461lt
AdvDist 10386002088 258 X 101 10 10
1312017 102356 IsBsmClose Dist 595641466972855lt
AdvDist 660599904096 164 X 60 6 10
1312017 102623 IsBsmClose Dist 100217014111125lt
AdvDist 1024200201024 253 X 100 7 10
1312017 102650 IsBsmClose Dist 540919707235241lt
AdvDist 887399925984 221 X 54 0 10
1172017 111504 IsBsmClose Dist 100564061581794lt
AdvDist 1169999927712 291 X 101 10 10
1172017 112437 IsBsmClose Dist 992912014791515lt
AdvDist 10386002088 258 X 99 10 10
1172017 112837 IsBsmClose Dist 106684353810469lt
AdvDist 1076400078336 261 X 107 10 10
US Department of Transportation Office of the Assistant Secretary for Research and Technology
Intelligent Transportation Systems Joint Program Office
Task 8 D2X Hub Proof-of-Concept Test Evaluation Report ndash Final | A-2
APPENDIX A Comprehensive Data Analysis Tables
Date Time Vehicle Range and Advisory
Distance wrt Speed Speed In
Range Out of Range Distance
RSU Log PSM
Message RateSec
VEA Log PSM
Message Rate
1172017 113148 IsBsmClose Dist 1124753473133lt AdvDist
1186199986752 268 X 112 10 10
1172017 113332 IsBsmClose Dist 106022149777593lt
AdvDist 1126799904384 260 X 106 10 10
1172017 113336 IsBsmClose Dist 59429630331283lt
AdvDist 1196999892 298 X 59 10 10
1172017 113357 IsBsmClose Dist 657937887214709lt
AdvDist 1193400191808 297 X 66 10 10
1172017 113627 IsBsmClose Dist 965542357439439lt
AdvDist 1080000180864 260 X 97 10 10
1172017 113629 IsBsmClose Dist 821301583410616lt
AdvDist 1074600027072 270 X 82 10 10
1172017 113803 IsBsmClose Dist 994884887192582lt
AdvDist 104580001152 251 X 99 10 10
1172017 113811 IsBsmClose Dist 16809952777894lt
AdvDist 106200007056 257 X 17 10 10
1172017 114114 IsBsmClose Dist 948985801452811lt
AdvDist 986399929152 245 X 95 10 10
1172017 114133 IsBsmClose Dist 141255704529106lt
AdvDist 963000067392 242 X 14 10 10
1172017 114136 IsBsmClose Dist 377627357471613lt
AdvDist 977400075168 243 X 38 10 10
US Department of Transportation Office of the Assistant Secretary for Research and Technology
Intelligent Transportation Systems Joint Program Office
Task 8 D2X Hub Proof-of-Concept Test Evaluation Report ndash Final | A-3
APPENDIX A Comprehensive Data Analysis Tables
Date Time Vehicle Range and Advisory
Distance wrt Speed Speed In
Range Out of Range Distance
RSU Log PSM
Message RateSec
VEA Log PSM
Message Rate
1172017 114403 IsBsmClose Dist 114490146784404lt
AdvDist 1225799907552 266 X 114 10 10
1172017 114415 IsBsmClose Dist 280463490772458lt
AdvDist 71100013248 161 X 28 10 10
1172017 114735 IsBsmClose Dist 102043927314914lt
AdvDist 1040399857728 259 X 102 10 10
1172017 114755 IsBsmClose Dist 185020887331204lt
AdvDist 112499985312 275 X 19 10 10
1192017 35605 IsBsmClose Dist 107928079653642lt
AdvDist 1107000145152 272 X 108 9 9
1192017 35630 IsBsmClose Dist 99759104887202lt
AdvDist 1184399935488 294 X 100 10 10
1192017 35837 IsBsmClose Dist 110291146846666lt
AdvDist 115020016848 286 X 110 10 10
1192017 40057 IsBsmClose Dist 998997459961241lt
AdvDist 1260000076896 313 X 100 10 10
1192017 40300 IsBsmClose Dist 100209094247195lt
AdvDist 106919987328 260 X 100 10 10
1192017 40410 IsBsmClose Dist 100723184500334lt
AdvDist 1097999888832 273 X 101 6 10
1192017 41103 IsBsmClose Dist 977354295877856lt
AdvDist 1008000141984 251 X 98 10 10
US Department of Transportation Office of the Assistant Secretary for Research and Technology
Intelligent Transportation Systems Joint Program Office
Task 8 D2X Hub Proof-of-Concept Test Evaluation Report ndash Final | A-4
APPENDIX A Comprehensive Data Analysis Tables
Date Time Vehicle Range and Advisory
Distance wrt Speed Speed In
Range Out of Range Distance
RSU Log PSM
Message RateSec
VEA Log PSM
Message Rate
1192017 41311 IsBsmClose Dist 10190842581135lt
AdvDist 1040399857728 259 X 102 10 10
1192017 41423 IsBsmClose Dist 995536361906761lt
AdvDist 1009799790912 251 X 100 10 10
1192017 41534 IsBsmClose Dist 10075608603652lt
AdvDist 106919987328 264 X 101 10 10
US Department of Transportation Office of the Assistant Secretary for Research and Technology
Intelligent Transportation Systems Joint Program Office
Task 8 D2X Hub Proof-of-Concept Test Evaluation Report ndash Final | A-5
APPENDIX A Comprehensive Data Analysis Tables
Table A-2 Complete Data Analysis ndash Hypothesis 2
US Department of Transportation Office of the Assistant Secretary for Research and Technology
Intelligent Transportation Systems Joint Program Office
Task 8 D2X Hub Proof-of-Concept Test Evaluation Report ndash Final | A-6
Date Test
Number PSMs Generated by
Trav X and Trav Y Transition to In Group Trav Y PSM Ceased Only Trav X PSM
Received
1312017 TFHRC 1 111116 111240 Check 111305
1312017 TFHRC 2 Grouping Failed Grouping Failed Grouping Failed Grouping Failed
1312017 TFHRC 3 112346 112448 Check 112508
1312017 TFHRC 4 114208 114301 Check 114345
1312017 TFHRC 5 114609 114658 Check 114721
1312017 TFHRC 6 115222 115313 Check 115342
1182017 ATP 1 104400 104527 Check 104601
1182017 ATP 2 105356 105455 Check 105546
1182017 ATP 3 110059 110150 Check 110322
1182017 ATP 4 111222 111310 Check 111329
1182017 ATP 5 111515 111616 Check 111630
1182017 ATP 6 111823 111906 Check 111917
1182017 ATP 7 112116 112157 Check 112209
1182017 ATP 8 112814 112855 Check 112917
1182017 ATP 9 113142 113230 Check 113248
1182017 ATP 10 113501 113545 Check 113608
1192017 ATP 11 44728 44842 Check 45007
1192017 ATP 12 Radio Failure Test Terminated Radio Failure Test Terminated Radio Failure Test Terminated Radio Failure Test Terminated
1192017 ATP 13 45548 45637 Check 45728
1192017 ATP 14 45946 50047 Check 50107
1192017 ATP 15 50353 50444 Check 50513
1192017 ATP 16 50730 50823 Check 50839
APPENDIX A Comprehensive Data Analysis Tables
Table A-3 Complete Data Analysis ndash Hypothesis 3
US Department of Transportation Office of the Assistant Secretary for Research and Technology
Intelligent Transportation Systems Joint Program Office
Task 8 D2X Hub Proof-of-Concept Test Evaluation Report ndash Final | A-7
Date Description
MDEA not in Vehicle
MDEA Transmits
PSMs Time of MDEA
Mode Transition
MDEA Ceases Transmitting
PSMs
1312017 TFHRC 1 Check Check 0443101852 Check
1312017 TFHRC 2 Check Check 0445243056 Check
1312017 TFHRC 3 Check Check 0447569444 Check
1312017 TFHRC 4 Check Check 0448888889 Check
1312017 TFHRC 5 Check Check 045005787 Check
1312017 TFHRC 6 Check Check 0451666667 Check
1172017 ATP 1 Check Check 0501898148 Check
1172017 ATP 2 Check Check 0504201389 Check
1172017 ATP 3 Check Check 0506215278 Check
1172017 ATP 4 Check Check 0507858796 Check
1172017 ATP 5 Check Check 0508981481 Check
1172017 ATP 6 Check Check 0510219907 Check
1172017 ATP 7 Check Check 0511736111 Check
1172017 ATP 8 Check Check 05128125 Check
1172017 ATP 9 Check Check 0513831019 Check
1172017 ATP 10 Check Check 0514884259 Check
1172017 ATP 11 Check Check 0185590278 Check
1172017 ATP 12 Check Check 0187210648 Check
1172017 ATP 13 Check Check 0188425926 Check
1172017 ATP 14 Check Check 0190289352 Check
1172017 ATP 15 Check Check 0191863426 Check
APPENDIX A Comprehensive Data Analysis Tables
Table A-4 Complete Data Analysis ndash Hypothesis 5 (VEA)
Test Number
Type of Message
True Distance (m)
Speed (MPH)
Expected Distance (m)
Difference (m)
TFHRC1
Advisory 7584 2471 9942 2358
Alert 5545 2523 5780 235
Warning 4874 2498 4910 036
TFHRC2
Advisory 8552 2595 10441 1889
Alert 5167 2461 5588 421
Warning 4515 2433 4751 236
TFHRC3
Advisory 7876 2381 9580 1704
Alert 5827 2590 5989 162
Warning 5124 2624 5222 098
TFHRC4
Advisory 7529 2818 11338 3809
Alert 6047 2744 6482 435
Warning 5323 2714 5450 127
TFHRC5
Advisory 9292 2404 9672 380
Alert 5350 2423 5472 122
Warning 4081 2352 4556 475
ATP1
Advisory 000 000
Alert 000 000
Warning 000 000
ATP2
Advisory 5787 1644 6614 827
Alert 3074 1640 3289 215
Warning 2627 1640 2947 320
ATP3
Advisory 4204 1685 6779 2575
Alert 3300 1672 3370 070
Warning 2854 1658 2985 131
ATP4
Advisory 4296 1753 7053 2757
Alert 3346 1791 3679 333
Warning 2871 1755 3194 323
ATP5
Advisory 000 000
Alert 000 000
Warning 1069 1706 3088 2019
ATP6
Advisory 3632 1640 6598 2966
Alert 000 000
Warning 2770 1594 2850 080
US Department of Transportation Office of the Assistant Secretary for Research and Technology
Intelligent Transportation Systems Joint Program Office
Task 8 D2X Hub Proof-of-Concept Test Evaluation Report ndash Final | A-8
APPENDIX A Comprehensive Data Analysis Tables
Test Number
Type of Message
True Distance (m)
Speed (MPH)
Expected Distance (m)
Difference (m)
ATP7
Advisory 000 000
Alert 000 000
Warning 1919 1887 3483 1564
ATP8
Advisory 4492 1741 7005 2513
Alert 3113 1687 3409 296
Warning 2661 1680 3032 371
ATP9
Advisory 4694 1628 6550 1856
Alert 2991 1570 3113 122
Warning 2572 1549 2756 184
ATP10
Advisory 000 000
Alert 000 000
Warning 650 2505 4927 4277
ATP11
Advisory 000 000
Alert 000 000
Warning 1914 2398 4666 2752
ATP12
Advisory 000 000
Alert 000 000
Warning 460 2293 4415 3955
ATP13
Advisory 000 000
Alert 000 000
Warning 2732 2535 5001 2269
ATP14
Advisory 000 000
Alert 000 000
Warning 2358 2361 4577 2219
ATP15
Advisory 000 000
Alert 000 000
Warning 1107 2459 4814 3707
ATP16
Advisory 5668 1982 7974 2306
Alert 000 000
Warning 1502 1906 3525 2023
ATP17
Advisory 000 000
Alert 000 000
Warning 3183 2420 4720 1537
US Department of Transportation Office of the Assistant Secretary for Research and Technology
Intelligent Transportation Systems Joint Program Office
Task 8 D2X Hub Proof-of-Concept Test Evaluation Report ndash Final | A-9
Table A-5 Complete Data Analysis ndash Hypothesis 6 (MDEA)
Test Number
Type of Message
True Distance (m)
Speed (MPH)
Expected Distance (m)
Difference (m)
TFHRC1
Advisory 8756 2290 9213 457
Alert 5320 2509 5736 416
Warning 4651 2487 4883 232
TFHRC2
Advisory 9928 2514 10115 187
Alert 5276 2447 5546 270
Warning 4624 2415 4707 084
TFHRC3
Advisory 8952 2304 9270 318
Alert 5595 2603 6030 436
Warning 4890 2617 5205 315
TFHRC4
Advisory 9752 2514 10115 363
Alert 6290 2769 6564 274
Warning 4844 2693 5396 552
TFHRC5
Advisory 9613 2406 9680 067
Alert 5242 2420 5463 221
Warning 4080 2357 4568 488
ATP1
Advisory 5938 2183 8783 2845
Alert 4314 2120 4580 266
Warning 3644 2111 3989 345
ATP2
Advisory 6452 1641 6602 150
Alert 3296 1691 3419 123
Warning 2600 1601 2865 265
ATP3
Advisory 6212 1628 6550 338
Alert 3200 1655 3327 127
Warning 2707 1641 2949 242
ATP4
Advisory 6420 1646 6622 202
Alert 3300 1780 3650 350
Warning 2878 1704 3084 206
ATP5
Advisory 6673 1677 6747 074
Alert 3400 1847 3828 428
Warning 2972 1807 3307 335
ATP6
Advisory 6100 1628 6550 450
Alert 3100 1637 3281 181
Warning 2500 1597 2857 357
APPENDIX A Comprehensive Data Analysis Tables
US Department of Transportation Office of the Assistant Secretary for Research and Technology
Intelligent Transportation Systems Joint Program Office
Task 8 D2X Hub Proof-of-Concept Test Evaluation Report ndash Final | A-10
APPENDIX A Comprehensive Data Analysis Tables
Test Number
Type of Message
True Distance (m)
Speed (MPH)
Expected Distance (m)
Difference (m)
ATP7
Advisory 7500 1972 7934 434
Alert 3882 1914 4008 126
Warning 3400 1946 3614 214
ATP8
Advisory 6659 1744 7017 358
Alert 3263 1682 3396 133
Warning 2900 1682 3037 137
ATP9
Advisory 6605 1659 6675 070
Alert 2900 1556 3078 178
Warning 2365 1561 2781 416
ATP10
Advisory 9214 2491 10022 808
Alert 5859 2688 6301 442
Warning 5200 2644 5273 073
ATP11
Advisory 8485 2487 10006 1521
Alert 5376 2487 5668 292
Warning 4716 2483 4873 157
ATP12
Advisory 9001 2433 9789 788
Alert 5395 2420 5463 068
Warning 4103 2330 4503 400
ATP13
Advisory 8615 2559 10296 1681
Alert 000 000 000 000
Warning 4930 2581 5115 185
ATP14
Advisory 6119 2491 10022 3903
Alert 5500 2491 5681 181
Warning 3800 2402 4676 876
ATP15
Advisory 7546 2603 10473 2927
Alert 6000 2661 6215 215
Warning 3100 2603 5170 2070
ATP16
Advisory 7931 2089 8405 474
Alert 3995 1950 4106 111
Warning 3500 1923 3563 063
ATP17
Advisory 8243 2049 8244 001
Alert 5260 2465 5601 341
Warning 4718 2438 4763 045
US Department of Transportation Office of the Assistant Secretary for Research and Technology
Intelligent Transportation Systems Joint Program Office
Task 8 D2X Hub Proof-of-Concept Test Evaluation Report ndash Final | A-11
Table A-6 Complete Data Analysis ndash Hypothesis 7
Date Test
Number
User State Change Is
Safe Icon False
Properly Processed
User State Change Is
Safe Icon True
Properly Processed
1312017 TFHRC 1 111438 X 111504 X
1312017 TFHRC 3 112533 X 112619 X
1312017 TFHRC 4 114400 X 114438 X
1312017 TFHRC 5 114801 X 114829 X
1312017 TFHRC 6 115408 X 115444 X
1182017 ATP 1 105056 X 105116 X
1182017 ATP 2 105622 X 105656 X
1182017 ATP 3 110348 X 110436 X
1182017 ATP 4 111355 X 111417 X
1182017 ATP 5 111655 X 111717 X
1182017 ATP 6 111947 X 112007 X
1182017 ATP 7 112235 X 112305 X
1182017 ATP 8 112937 X 113013 X
1182017 ATP 9 113313 X 113353 X
1182017 ATP 10 113636 X 113708 X
1192017 ATP 11 45035 X 45057 X
1192017 ATP 13 45806 X 45828 X
1192017 ATP 14 50144 X 50202 X
1192017 ATP 15 50542 X 50600 X
1192017 ATP 16 50903 X 50929 X
APPENDIX A Comprehensive Data Analysis Tables
US Department of Transportation Office of the Assistant Secretary for Research and Technology
Intelligent Transportation Systems Joint Program Office
Task 8 D2X Hub Proof-of-Concept Test Evaluation Report ndash Final | A-12
APPENDIX A Comprehensive Data Analysis Tables
Table A-7 Complete Data Analysis ndash Hy pothesis 8 amp 9
US Department of Transportation Office of the Assistant Secretary for Research and Technology
Intelligent Transportation Systems Joint Program Office
Task 8 D2X Hub Proof-of-Concept Test Evaluation Report ndash Final | A-13
Test Number
Analyze the percentage of PMM messages properly processed by
in-vehicle devices Analyze the percentage of PMM-RSP messages
properly processed by mobile devices
Analyze the percentage of PMM-Cancel messages
properly processed by in-vehicle devices
MDEA Log ndash PMM Send
occurrence
MDEA Log ndash
PMM contents
VEA Log ndash PMM
Receive occurrence
VEA Log ndash Driver
acceptance
VEA Log ndash PMM-RSP
Send occurrence
MDEA Log ndash PMM-RSP
Receive occurrence
MDEA Log ndash Coordination
Status
MDEA Log ndash PMM-
Cancel Sent Occurrence
VEA Log ndash PMM-
Cancel Received
Occurrence
TFHRC 1 Check All Present Check Check Check Check Check Check Check
TFHRC 2 Check All Present Check Check Check Check Check Check Check
TFHRC 3 Check All Present Check Check Check Check Check Check Check
TFHRC 4 Check All Present Check Check Check Check Check Check Check
TFHRC 5 Check All Present Check Check Check Check Check Check Check
ATP 1 Check All Present Check Check Check Check Check Check Check
ATP 2 Check All Present Check Check Check Check Check Check Check
ATP 3 Check All Present Check Check Check Check Check Check Check
ATP 4 Check All Present Check Check Check Check Check Check Check
ATP 5 Check All Present Check Check Check Check Check Check Check
ATP 6 Check All Present Check Check Check Check Check Check Check
ATP 7 Check All Present Check Check Check Check Check Check Check
ATP 8 Check All Present Check Check Check Check Check Check Check
ATP 9 Check All Present Check Check Check Check Check Check Check
ATP 10 Check All Present Check Check Check Check Check Check Check
APPENDIX A Comprehensive Data Analysis Tables
Test Number
Analyze the percentage of PMM messages properly processed by
in-vehicle devices Analyze the percentage of PMM-RSP messages
properly processed by mobile devices
Analyze the percentage of PMM-Cancel messages
properly processed by in-vehicle devices
MDEA Log ndash PMM Send occurrence
MDEA Log ndash PMM
contents
VEA Log ndash PMM
Receive occurrence
VEA Log ndash Driver
acceptance
VEA Log ndash PMM-RSP
Send occurrence
MDEA Log ndash PMM-RSP
Receive occurrence
MDEA Log ndash Coordination
Status
MDEA Log ndash PMM-
Cancel Sent Occurrence
VEA Log ndash PMM-
Cancel Received
Occurrence
ATP 11 Check All Present Check Check Check Check Check Check Check
ATP 12 Check All Present Check Check Check Check Check Check Check
ATP 13 Check All Present Check Check Check Check Check Check Check
ATP 14 Check All Present Check Check Check Check Check Check Check
ATP 15 Check All Present Check Check Check Check Check Check Check
ATP 16 Check All Present Check Check Check Check Check Check Check
ATP 17 Check All Present Check Check Check Check Check Check Check
US Department of Transportation Office of the Assistant Secretary for Research and Technology
Intelligent Transportation Systems Joint Program Office
Task 8 D2X Hub Proof-of-Concept Test Evaluation Report ndash Final | A-14
Table A-8 Complete Data Analysis ndash Hy pothesis 10
Date Test Number
Analyze the Success Rate of Receiving a PMM-Arrive Message
VEA Log ndash PMM-ARRIVE Send Occurrence MDEA Log ndash PMM-ARRIVE Receive Occurrence
1312017 TFHRC 1 Fail Fail
1312017 TFHRC 2 Check Check
1312017 TFHRC 3 Check Check
1312017 TFHRC 4 Check Check
1312017 TFHRC 5 Check Check
1312017 TFHRC 6 Check Check
1312017 TFHRC 7 Check Check
1182017 ATP 1 Not Available Check
1182017 ATP 2 Not Available Check
1182017 ATP 3 Not Available Check
1182017 ATP 4 Not Available Check
1182017 ATP 5 Not Available Check
1182017 ATP 6 Not Available Check
1182017 ATP 7 Not Available Check
1182017 ATP 8 Not Available Check
1182017 ATP 9 Not Available Check
1182017 ATP 10 Not Available Check
1202017 ATP 11 Check Check
1202017 ATP 12 Check Check
1202017 ATP 13 Check Check
1202017 ATP 14 Check Check
1202017 ATP 15 Check Check
APPENDIX A Comprehensive Data Analysis Tables
US Department of Transportation Office of the Assistant Secretary for Research and Technology
Intelligent Transportation Systems Joint Program Office
Task 8 D2X Hub Proof-of-Concept Test Evaluation Report ndash Final | A-15
APPENDIX A Comprehensive Data Analysis Tables
Table A-9 Complete Data Analysis ndash Hypothesis 13 (Part A)
US Department of Transportation Office of the Assistant Secretary for Research and Technology
Intelligent Transportation Systems Joint Program Office
Task 8 D2X Hub Proof-of-Concept Test Evaluation Report ndash Final | A-16
Test Number
Coordination Request Sent
by Y
Coordination Request
Received by X
Request Confirmed
by X Confirmation Received by Y
Coordination Request Sent
by Z
Coordination Request
Received by X
Request Confirmed
by X Confirmation Received by Z
Coordination Heart Beat
Transmitted by Y amp Z
Heart Beat Response received
by X
Ride Arrived
Messages
TFHRC 1
Fail Traveler Y could not join the ad-hoc travel group
TFHRC 2
Check check check check 41047 check check check check check 41303
TFHRC 3
Check Check Check Check Check Check Check Check Check Check Check
TFHRC 4
Fail Traveler Y could not join the ad-hoc travel group
TFHRC 5
Check Check Check Check Check Check Check Check Check Check Check
TFHRC 6
Check Check Check Check Check Check Check Check Check Check Check
TFHRC 7
Check Check Check Check Check Check Check Check Check Check Check
TFHRC 8
Check Check Check Check Check Check Check Check Check Check Check
TFHRC 9
Check Check Check Check Check Check Check Check Check Check Check
TFHRC 10
Check Check Check Check Check Check Check Check Check Check Check
ATP 1 Check Check Check Check Check Check Check Check Check Check Check
ATP 2 Check Check Check Check Check Check Check Check Check Check Check
Test Number
Coordination Request Sent
by Y
Coordination Request
Received by X
Request Confirmed
by X Confirmation Received by Y
Coordination Request Sent
by Z
Coordination Request
Received by X
Request Confirmed
by X Confirmation Received by Z
Coordination Heart Beat
Transmitted by Y amp Z
Heart Beat Response received
by X
Ride Arrived
Messages
ATP 3 Check Check Check Check Check Check Check Check Check Check Check
ATP 4 Check Check Check Check Check Check Check Check Check Check Check
ATP 5 Check Check Check Check Check Check Check Check Check Check Check
ATP 6 Check Check Check Check Check Check Check Check Check Check Check
ATP 7 Check Check Check Check Check Check Check Check Check Check No ride
arrives received
ATP 8 Check Check Check Check Check Check Check Check Check Check Check
ATP 9 Check Check Check Check Check Check Check Check Check Check No ride
arrives received
ATP 10 Check Check Check Check Check Check Check Check Check Check Check
ATP 11 Check Check Check Check Check Check Check Check Check Check Check
ATP 12 Check Check Check Check Check Check Check Check Check Check No ride
arrives received
ATP 13 Check Check Check Check Check Check Check Check Check Check Check
ATP 14 Check Check Check Check Check Check Check Check Check Check Check
ATP 15 Check Check Check Check Check Check Check Check Check Check Check
APPENDIX A Comprehensive Data Analysis Tables
US Department of Transportation Office of the Assistant Secretary for Research and Technology
Intelligent Transportation Systems Joint Program Office
Task 8 D2X Hub Proof-of-Concept Test Evaluation Report ndash Final | A-17
APPENDIX A Comprehensive Data Analysis Tables
Table A-10 Complete Data Analysis ndash Hypothesis 13 (Part B)
US Department of Transportation Office of the Assistant Secretary for Research and Technology
Intelligent Transportation Systems Joint Program Office
Task 8 D2X Hub Proof-of-Concept Test Evaluation Report ndash Final | A-18
Test Number Coordination Cancel by
Walking Away Coordination Cancel by
Manual Request Disband Group after
Entering into Vehicle
TFHRC 1 Check This step not tested on this day
TFHRC 2 Check This step not tested on this day
TFHRC 3 Check This step not tested on this day
TFHRC 4 Check This step not tested on this day
TFHRC 5 Check This step not tested on this day
TFHRC 6 This step not tested on this day Check Check
TFHRC 7 This step not tested on this day Check Check
TFHRC 8 This step not tested on this day Check Check
TFHRC 9 This step not tested on this day Check Check
TFHRC 10 This step not tested on this day Check Check
ATP 1 Check Check Check
ATP 2 Check Check Check
ATP 3 Check Check Check
ATP 4 Check Check Check
ATP 5 Check Check Check
ATP 6 Check Check Check
ATP 7 Check Check Check
ATP 8 Check Check Check
ATP 9 Check Check Check
APPENDIX A Comprehensive Data Analysis Tables
Test Number Coordination Cancel by
Walking Away Coordination Cancel by
Manual Request Disband Group after Entering into Vehicle
ATP 10 Check Check Check
ATP 11 Fail Could not cancel by distance Check Check
ATP 12 Check Check Check
ATP 13 Fail Could not cancel by distance Check Check
ATP 14 Check Check Check
ATP 15 Check Check Check
US Department of Transportation Office of the Assistant Secretary for Research and Technology
Intelligent Transportation Systems Joint Program Office
Task 8 D2X Hub Proof-of-Concept Test Evaluation Report ndash Final | A-19
APPENDIX A Comprehensive Data Analysis Tables
APPENDIX B Acronyms and Abbreviations
ATG Ad-Hoc Travel Group
ATP Acceptance Test Plan
BSM Basic Safety Message
CCP Common Computing Platform
CV Connected Vehicle
DSRC Dedicated Short Range Communications
EPS Experimental Prototype System
FHWA Federal Highway Administration
FR Functional Requirement
ITS Intelligent Transportation Systems
LDV Light-Duty Vehicle
MAP Map Data
MDEA Mobile Device Experimental Application
MGL Message Logging
OBU On-board Unit
PMM Personal Mobility Message
PMM-ARRIVE Personal Mobility Message Arrival Message
PMM-CANCEL Personal Mobility Message Cancel Message
PMM-RSP Personal Mobility Message Response Message
PR Performance Requirement
PSM Personal Safety Message
REA Roadside Experimental Application
RSU Roadside Unit
SFY Safety
SIR System Interface Requirement
SMP SPaT and MAP
SPaT Signal Phasing and Timing
SyRS System Requirements Specifications
TFHRC Turner-Fairbank Highway Research Center
US DOT US Department of Transportation
US Department of Transportation Office of the Assistant Secretary for Research and Technology
Intelligent Transportation Systems Joint Program Office
Task 8 D2X Hub Proof-of-Concept Test Evaluation Report ndash Final |B-1
VEA Vehicle Experimental Application
Wi-Fi Wireless Fidelity
APPENDIX B Acronyms and Abbreviations
US Department of Transportation Office of the Assistant Secretary for Research and Technology
Intelligent Transportation Systems Joint Program Office
Task 8 D2X Hub Proof-of-Concept Test Evaluation Report ndash Final | B-2
APPENDIX C Terms and Definitions
Basic Safety Message (BSM)
Connected vehicle message type which contains vehicle safety-related information that is broadcast to surrounding vehicles
Bluetooth Short range wireless technology used to exchange data between enabled devices
Cellular Uses short-range radio stations to cover areas of communication
Connected Vehicle A vehicle that can communicate with other vehicles and infrastructure via communication media such as DSRC Wi-Fi cellular or Bluetooth
Coordinated Messages are coordinated when two or more mobile devices have establish a travel group based on the same origin destination and
time and function as a single cohesive senderrecipient
CV Inspector An application that verifies if the Mobile Device is broadcasting messages to Connected Vehicles
Destination The end point of a travelerrsquos trip
DSRC Dedicated Short-Range Communications a low-latency high-reliability two-way communications tool used for sending transportation safety
messages
Light-Duty Vehicle Of or relating to vehicles that way less than 4000 lbs
Message Type Type of personal safety or personal mobility message that is transmitted based on the technology used and level of coordination available
Personal Mobility Message (PMM)
Similar to PDM message intended for the exchange of mobility messages between individual travelers and vehiclesinfrastructure via
mobile device
Personal Safety Message (PSM)
Similar to BSM message intended to transmit low-latency urgent safety messages between individual travelers and vehiclesinfrastructure via
mobile device
Test Case A set of conditions or variables that a Tester can determine if system meets requirements
Transit Vehicle Large vehicles mainly used for public transportation as well as support services
Transmitting The state in which a traveler has opted in and is sendingreceiving messages via mobile device
Uncoordinated Messages are uncoordinated when travel groups are not established (see coordinated definition)
Wi-Fi Local area wireless technology that allows enabled devices to connect to the Internet
APPENDIX A Comprehensive Data Analysis Tables
US Department of Transportation Office of the Assistant Secretary for Research and Technology
Intelligent Transportation Systems Joint Program Office
Task 8 D2X Hub Proof-of-Concept Test Evaluation Report ndash Final |C-1
ITS Joint Program Office-HOIT 1200 New Jersey Avenue SE
Washington DC 20590
Toll-Free ldquoHelp Linerdquo 866-367-7487 wwwitsdotgov
FHWA-JPO-18-263
- Structure Bookmarks
-
- Sharing Data between Mobile Devices Connected Vehicles and Infrastructure Task 8 D2X Hub Proof-of-Concept Test Evaluation Report wwwitsdotgovindexhtm Final Report mdash October 25 2017 FHWA-JPO-18-623
- Revision History
- Table of Contents
- Chapter 1 Scope
- Chapter 2 Referenced Documents
- Chapter 3 Test Conduct
- Chapter 4 Experimental Analysis Results Summary
- Chapter 5 Experimental Analysis
- Chapter 6 Lessons Learned and Recommendations
- APPENDIX A Comprehensive Data Analysis Tables
- APPENDIX B Acronyms and Abbreviations
- APPENDIX C Terms and Definitions
-

Chapter 4 Experimental Analysis Results Summary
Test Case No Hypothesis Description Data Analysis Results
5421 5422 5423 ndash PMM
Hypothesis 8 amp 9 ndash The VEA can coordinate taxi travel requests from an MDEA
No False negatives TFHRC satisfied at 100 LOC
5424 ndash PMM Hypothesis 10 ndash The traveler can receive arrival updates from a taxi or transit vehicle
2 False Negatives out of 14 TFHRC Satisfied at 8571 LOC
5451 5452 ndash LDV
Hypothesis 11 amp 12 ndash The MDEA can detect when a traveler transitions from a pedestrian to a light duty vehicle or from a light duty vehicle to a pedestrian
No False negatives Accelerator tests Satisfied at 100 LOC Bluetooth tests failed
5441 5443 5444 ndash ATG
Hypothesis 13 ndash The MDEA can coordinate maintain and cancel travel with another MDEA via Wi-Fi Direct
Wi-Fi Direct Grouping Failure 30 False Negatives out of 198 Satisfied at 8484 LOC
5481 ndash SMP Hypothesis 14 ndash The RSU can broadcast a SPaT and MAP message via DSRC that can be received by mobile devices
No False negatives Satisfied at 100 LOC
5411 5444 5471 ndash MSG
Hypothesis 15 - The RSU can store all messages received via DSRC
RSU - CCP logging issues Not satisfied at 100 LOC
Note The LOC was calculated as a ratio of the total number of successful steps in the test script divided by the total number of steps in the test script (Each hypothesis has a specific test script)
US Department of Transportation Office of the Assistant Secretary for Research and Technology
Intelligent Transportation Systems Joint Program Office
Task 8 D2X Hub Proof-of-Concept Test Evaluation Report ndash Final | 8
US Department of Transportation Office of the Assistant Secretary for Research and Technology
Intelligent Transportation Systems Joint Program Office
Task 8 D2X Hub Proof-of-Concept Test Evaluation Report ndash Final | 9
Chapter 5 Experimental Analysis
Hypothesis 1 The MDEA only broadcasts PSMs when in the range of a vehicle broadcasting a BSM
Data logs verified MDEA Log ndash BSM received and PSM send occurrences
Analysis
Determination of vehicle range from mobile device based on vehicle speed Analysis of PSMs sent with respect to vehicle range (In range and out of range scenarios)
Observations In all the test cases PSMs were broadcasted by MDEA when the vehicle was in its range with respect to vehicle speed (ldquofast enough close enoughrdquo)
Table 5-1 Hypothesis 1 Analysis Data Sample
Vehicle Range and Advisory Speed In Out of Distance Date Time Distance wrt Speed (mph) Range Range (m)
13117 101316 IsBsmClose Dist 975500061708885lt
AdvDist 1024200201024 255 X 98
13117 101332 IsBsmClose Dist 570797651794001lt
AdvDist 666000057888 173 X 57
13117 101340 IsBsmClose Dist 57448436831453lt
AdvDist 601199821728 149 X 57
13117 101529 IsBsmClose Dist 975729907380225lt
AdvDist 102240014976 254 X 98
For the complete analysis please refer to Table A-1 in Appendix A
ݐݑݍܧ ݎ ݑ ݐ dݒݏݕݎ ݐݏ ݓݎݐ ݏ
ௗ௩௦௬= lowastݒ9
Where
is the advisory display distance (meters) ௗ௩௦௬ ݒ is the velocity of the vehicle (meters per second)
Results There were no outliers (False Negatives) in the dat a analyzed Hence Hypothesis 1 is satisfied at a 100 level of confidence
Chapter 5 Experimental Analysis
Hypothesis 2 The overall MDEA DSRC message broadcast rate is lower during travel group coordination
Data logs verified MDEA Log ndash Coordination Status PSM send occurrences before and after coordination
Analysis
Determination of coordination status Analysis of PSMs sent while not part of the travel group and while part of the travel group
(Travel group leader) Analysis of PSMs sent while not part of the travel group and while part of the travel group
(Travel group Member)
Observations Out of 64 log checks performed 56 true positives were observed Two tests had a grouping failure due to Wi-Fi Direct issues
Table 5-2 Hypothesis 2 Analysis Data Sample
Date 13117 13117 13117 13117 13117
Description Test Number TFHRC 1 TFHRC 3 TFHRC 4 TFHRC 5 TFHRC 6
PSMs Generated by Traveler X and Traveler Y 111116 112346 114208 114609 115222
Transition to In Group 111240 112448 114301 114658 115313
Traveler Y PSM ceased Check Check Check Check Check
only Traveler X PSM received 111305 112508 114345 114721 115342
For the complete analysis please refer to Table A-2 in Appendix A
Results There were 8 False Negatives in the data analyzed Hence Hypothesis 2 is satisfied at 875 level of confidence
US Department of Transportation Office of the Assistant Secretary for Research and Technology
Intelligent Transportation Systems Joint Program Office
Task 8 D2X Hub Proof-of-Concept Test Evaluation Report ndash Final | 10
Chapter 5 Experimental Analysis
Hypothesis 3 MDEA Log ndash Travel Mode Status PSM send occurrences
Data logs verified MDEA Log ndash BSM received and PSM send occurrences
Analysis
Determination of mobile device travel mode status Analysis of PSMs sent before and after transition of travel mode (on-foot and In-vehicle)
Observations All the test logs indicate that the PSMs were ceased after the MDEA transitioned its travel mode to In-vehicle
Table 5-3 Hypothesis 3 Analysis Data Sample
Description Test Number
TFHRC 1 TFHRC 2 TFHRC 3 TFHRC 4 TFHRC 5 TFHRC 6
MDEA not in vehicle Check Check Check Check Check Check
MDEA Transmits PSMs
Check Check Check Check Check Check
Time of MDEA Mode Transition
103804 104109 104430 104624 104805 105024
MDEA Ceases Transmitting PSMs
Check Check Check Check Check Check
For the complete analysis please refer to Table A-3 in Appendix A
Results There were no outliers (False Negatives) in the data analyzed Hence Hypothesis 3 is satisfied at a 100 level of confidence
US Department of Transportation Office of the Assistant Secretary for Research and Technology
Intelligent Transportation Systems Joint Program Office
Task 8 D2X Hub Proof-of-Concept Test Evaluation Report ndash Final | 11
US Department of Transportation Office of the Assistant Secretary for Research and Technology
Intelligent Transportation Systems Joint Program Office
Task 8 D2X Hub Proof-of-Concept Test Evaluation Report ndash Final | 12
Chapter 5 Experimental Analysis
Hypothesis 4 The Mobile Device can broadcast a PSM a radius of 250 meters 10 Hz under clear unobstructed conditions regardless of where the mobile device is located on the pedestrianrsquos person or clothing
Data logs verified VEA Log ndash PSM receive occurrences at a d istance of 10 m 50 m 100 m
Analysis
The rate at which PSMs were received by the RSU had been assessed The mobile device was placed in multiple locations on the pedestrian including in-hand in-pocket and in a backpack
Observations Due to DSRC limitations in the CCPs tests could not be performed beyond 100 m range Considering the RSU logging issues VEA Logs were used to analyze PSM broadcasting capacity of MDEA All the tests logged PSMs at a ra te o f 10sec Therefore 150 200 250 300 m radius could no t be a nalyzed Only three (10 50 and 100m) out of seven (10 50 100 150 200 250 and 300 m) cases were tested which resulted in a 43 Level of Confidence
Table 5-4 Hypothesis 4 Analysis Data Sample
Date Time
Vehicle Range and Advisory Distance wrt Speed
Speed (mph)
In Range
Out of Range
True Distance (m)
VEA Log PSM Message Rate
13117 101316 IsBsmClose Dist 975500061708885lt AdvDist 1024200201024
255 98 10
13117 101332 IsBsmClose Dist 570797651794001lt AdvDist 666000057888
173 57 10
13117 101340 IsBsmClose Dist 57448436831453lt AdvDist 601199821728
149 57 10
13117 101529 IsBsmClose Dist 975729907380225lt AdvDist 102240014976
254 98 10
13117 101538 IsBsmClose Dist 399317028326919lt AdvDist 102240014976
250 4 10
For the complete analysis please refer to Table A-1 in Appendix A
Results Due to the DSRC limitations the radius was limited to 100 m Hence Hypothesis 4 is satisfied at a 43 level of confidence
Chapter 5 Experimental Analysis
Hypothesis 5 Vehicles OBUs can capture and process Mobile Device PSMs and issue warnings at sufficient distance for drivers to avoid imminent pedestrian collision
Data logs verified VEA Log ndash PSM Location GPS Location Advisory Display Alert Display and Warning Display
Analysis
Assessing the distance at which an Advisory Alert and Warning were issued based on the speed of the vehicle (in the VEA Log)
Observations a Considering TFHRC tests the average difference in distance for VEA Logging of Advisories
Alerts and Warnings were on average 2028 m 275 m and 194 m respectively b The higher difference in advisory was due to the delay in the time between VEA deciding to
send PSM and Arada sending a PSM c Latency of less than a second was observed between PSM received and the message
display time on MDEA and VEA Logs
sݐݑݍܧ ݎ ݑݐ dݒݏwarningandalertݕݎ ݐݏ ݓݎݐ ݏ
ௗ௩௦௬= lowastݒ9
lowast ሻ05ݒ 25ሾሺൌ 11 lowast ቊ ௧ଶݒ
ሿ 2ሺ34ሻ
ቋ
Where
lowast ሻ05ݒ 25ሾሺൌ 11 lowast ቊ ௪
is the advisory display distance (meters) ௗ௩௦௬
is the alert display distance (meters) ௧
is the warning display distance (meters) ௐ
ଶݒሿ 2ሺ56ሻ
ቋ
ݒ is the velocity of the vehicle (meters per second)
TF 71 Run 2 - VEA
Source Battelle Google Maps February 2017
Figure 5-1 Advisory Alert and Warning Distances with Respect to VEA
US Department of Transportation Office of the Assistant Secretary for Research and Technology
Intelligent Transportation Systems Joint Program Office
Task 8 D2X Hub Proof-of-Concept Test Evaluation Report ndash Final | 13
Chapter 5 Experimental Analysis
Table 5-5 Hypothesis 5 Analysis Data Sample
TFHRC1 TFHRC2 TFHRC3
Advisory Alert Warning Advisory Alert Warning Advisory Alert Warning
True Distance (m) 7584 5545 4874 8552 5167 4515 7876 5827 5124
Speed (MPH) 2471 2523 2498 2595 2461 2433 2381 2590 2624
Expected Distance (m)
9942 5780 4910 10441 5588 4751 9580 5989 5222
Difference (m) 2358 235 036 1889 421 236 1704 162 098
For the complete analysis please refer to Table A-4 in Appendix A
Table 5-6 Total and Average Differences between Actual and Calculated Advisories Alerts and Warnings (VEA)
TFHRC Advisory Alert Warning
Total Difference (m) 10139 1376 971
Average Difference (m) 2028 275 194
Results There were no outliers (False Negatives) in the data analyzed Hence Hypothesis 5 is satisfied at a 100 level of confidence
US Department of Transportation Office of the Assistant Secretary for Research and Technology
Intelligent Transportation Systems Joint Program Office
Task 8 D2X Hub Proof-of-Concept Test Evaluation Report ndash Final | 14
Hypothesis 6 Mobile Devices can capture and process Vehicle BSMs and issue warnings in time for pedestrians to avoid imminent vehicle collision
Data logs verified MDEA Log ndash BSM Location GPS Location Advisory Display Alert Display and Warning Display
Analysis
Assessing the distance at which an Advisory Alert and Warning were issued based on the speed of the vehicle (in the BSM received by the mobile device)
Observations a Considering the TFHRC results the average difference in distance for MDEA logging of
Advisories Alerts and Warnings were on average 278 m 323 m and 334 m respectively b Latency of less than a second was observed on MDEA and VEA Logs
sݐݑݍܧ ݎ ݑݐ dݒݏwarningandalertݕݎ ݐݏ ݓݎݐ ݏ
ௗ௩௦௬= lowastݒ9
lowast ሻ05ݒ 25ሾሺൌ 11 lowast ቊ ௧ଶݒ
ሿ 2ሺ34ሻ
ቋ
ଶݒሿ 2ሺ56ሻ
ቋ
Where
lowast ሻ05ݒ 25ሾሺൌ 11 lowast ቊ ௪
is the advisory display distance (meters) ௗ௩௦௬
is the alert display distance (meters) ௧
is the warning display distance (meters) ௐ
ݒ is the velocity of the vehicle (meters per second)
Chapter 5 Experimental Analysis
TF 71 Run 2 - MDEA
US Department of Transportation Office of the Assistant Secretary for Research and Technology
Intelligent Transportation Systems Joint Program Office
Task 8 D2X Hub Proof-of-Concept Test Evaluation Report ndash Final | 15
Source Battelle Google Maps February 2017
Figure 5-2 Advisory Alert and Warning Distances with Respect to MDEA
Chapter 5 Experimental Analysis
Table 5-7 Hypothesis 6 Analysis Data Sample
TFHRC1 TFHRC2 TFHRC3
Advisory Alert Warning Advisory Alert Warning Advisory Alert Warning
True Distance (m) 8756 5320 4651 9928 5276 4624 8952 5595 4890
Speed (mph) 2290 2509 2487 2514 2447 2415 2304 2603 2617
Expected distance (m) 9213 5736 4883 10115 5546 4707 9270 6030 5205
Difference (m) 458 416 232 187 270 084 318 436 315
For the complete analysis please refer to Table A-5 in Appendix A
Table 5-8 Total and Average Differences between Actual and Calculated Advisories Alerts and Warnings (MDEA)
TFHRC Advisory Alert Warning
Total Difference (m) 1392 1617 1671
Average Difference (m) 278 323 334
Results There were no false alarms detected at neither of the TFHRCATP tests performed Hence Hypothesis 6 is satisfied at a 100 level of confidence
Issues Identified GPS Inaccuracy ndash Cross Track Distance Issue
The accuracy of GPS as per the US government claims is +- 4 m This error in GPS accuracy was balanced by increasing the cluster radius to 7 m for all the tests at TFHRC This modification in cluster radius increased the efficiency of pedestrian detection by closing out the difference in Cross Track Distancersquo
There were no false alarms detected at neither of the TFHRCATP tests performed
US Department of Transportation Office of the Assistant Secretary for Research and Technology
Intelligent Transportation Systems Joint Program Office
Task 8 D2X Hub Proof-of-Concept Test Evaluation Report ndash Final | 16
Chapter 5 Experimental Analysis
Source Battelle Google Maps February 2017
Figure 5-3 Cross Track Distance between Pedestrian and Vehicle Path
US Department of Transportation Office of the Assistant Secretary for Research and Technology
Intelligent Transportation Systems Joint Program Office
Task 8 D2X Hub Proof-of-Concept Test Evaluation Report ndash Final | 17
Chapter 5 Experimental Analysis
Hypothesis 7 MDEA Log ndash GPS Location SafeUnsafe Zone Status and MAP Message Contents
Data logs verified MDEA Log ndash GPS Location SafeUnsafe Zone Status and MAP Message Contents
Analysis
Analyzed the percentage of properly classified safeunsafe zone detections The device was placed in the roadway ndash mobile device location was properly classified if it positions itself in an unsafe zone
Observations User State Change from Safe to Unsafe (when placed 20 m in the roadway) and Unsafe to Safe (when placed 50 m from the roadway) were captured accurate and timely
Table 5-9 Hypothesis 7 Analysis Data Sample
TFHRC 1 TFHRC 2 TFHRC 3 TFHRC 4 TFHRC 5
User State Change Is Safe Icon False (2 m in the roadway)
111438 112533 114400 114801 115408
Properly Processed
User State Change Is Safe Icon True (5 m from the roadway)
111504 112619 114438 114829 115444
Properly Processed
For the complete analysis please refer to Table A-6 in Appendix A
US Department of Transportation Office of the Assistant Secretary for Research and Technology
Intelligent Transportation Systems Joint Program Office
Task 8 D2X Hub Proof-of-Concept Test Evaluation Report ndash Final | 18
Chapter 5 Experimental Analysis
Source Battelle Google Maps February 2017
Figure 5-4 Safe and Unsafe Zones at TFHRC Test Site
Results There were no outliers (False Negatives) in the data analyzed Hence Hypothesis 7 is satisfied at a 100 level of confidence
US Department of Transportation Office of the Assistant Secretary for Research and Technology
Intelligent Transportation Systems Joint Program Office
Task 8 D2X Hub Proof-of-Concept Test Evaluation Report ndash Final | 19
Chapter 5 Experimental Analysis
Hypothesis 8 amp 9 The VEA can coordinate taxi travel requests from an MDEA
Data logs verified MDEA Log ndash PMM Send Occurrence PMM contents PMM-RSP Receive Occurrence Coordination Status and PMM-Cancel Sent Occurrence
Analysis
Analyzed the percentage of PMM and PMM ndash Cancel messages properly processed by in-vehicle devices
Analyzed the percentage of PMM-RSP messages properly processed by mobile devices This analysis was performed for PMM Messages communicated through both DSRC and
Cellular
Observations 16 out of 204 checks had a failure during tests performed under ATP
Table 5-10 Hypothesis 8 amp 9 Analysis Data Sample
TFHRC 1 TFHRC 2 TFHRC 3 TFHRC 4 TFHRC 5
Analyze the percentage of PMM messages properly processed by in-vehicle devices
MDEA Log ndash PMM Send occurrence
Check Check Check Check Check
MDEA Log ndash PMM contents
All Present All Present All Present All Present All Present
Experimental Log ndash Information entered into
Mobile Device by Traveler
VEA Log ndash PMM Receive occurrence
Check Check Check Check Check
Analyze the percentage of PMM-RSP messages properly processed by mobile devices
Experimental Log ndash Driver Acceptance
VEA Log ndash Driver acceptance
Check Check Check Check Check
VEA Log ndash PMM-RSP Send occurrence
Check Check Check Check Check
MDEA Log ndash PMM-RSP Receive occurrence
Check Check Check Check Check
MDEA Log ndash Coordination Status
Check Check Check Check Check
Experimental Log ndash Coordination Success
Display
US Department of Transportation Office of the Assistant Secretary for Research and Technology
Intelligent Transportation Systems Joint Program Office
Task 8 D2X Hub Proof-of-Concept Test Evaluation Report ndash Final | 20
Chapter 5 Experimental Analysis
TFHRC 1 TFHRC 2 TFHRC 3 TFHRC 4 TFHRC 5
Analyze the percentage of PMM-Cancel messages properly processed by in-vehicle devices
MDEA Log ndash PMM-Cancel Sent Occurrence
Check Check Check Check Check
VEA Log ndash PMM-Cancel Received
Occurrence Check Check Check Check Check
For the complete analysis please refer to Table A-7 in Appendix A
Results Considering the tests performed at TFHRC Hypothesis 8 is satisfied at a 100 level of confidence However ATP tests satisfied the hypothesis at a confidence level of 9215
Issues Identified
Some issues observed for cloud communication during ATP testing at Columbus OH
Delay in Cloud PMM-cancel for VEA ndash 8 instances Adding a trip twice ndash 5 instances Some PMMs not being cancelled ndash 3 instances
All these issues were addressed prior to TFHRC tests
TFHRC tests did not have any of the above issues
US Department of Transportation Office of the Assistant Secretary for Research and Technology
Intelligent Transportation Systems Joint Program Office
Task 8 D2X Hub Proof-of-Concept Test Evaluation Report ndash Final | 21
Chapter 5 Experimental Analysis
Hypothesis 10 The traveler can receive arrival updates from a taxi or transit vehicle
Data logs verified VEA Log ndash PMM-ARRIVE Send Occurrence
MDEA Log ndash PMM-ARRIVE receive occurrence
Analysis
Analyzed the success rate of receiving a PMM-Arrive message via DSRC
Observations One test case at TFHRC failed due to equipment failure (CCP lost its location) All other tests satisfied the hypothesis
Table 5-11 Hypothesis 10 Analysis Data Sample
TFHRC 1
TFHRC 2
TFHRC 3
TFHRC 4
TFHRC 5
TFHRC 6
TFHRC 7
DSRC (Taxi)
Analyze the success rate of receiving a PMM-Arrive message
VEA Log ndash PMM-ARRIVE
Send occurrence
Fail Check Check Check Check Check Check
MDEA Log ndash PMM-ARRIVE
Receive occurrence
Fail Check Check Check Check Check Check
For the complete analysis please refer to Table A-8 in Appendix A
Results Considering the tests at TFHRC the hypothesis is satisfied at a confidence level of 8571 12 out of 14 tests were successful
US Department of Transportation Office of the Assistant Secretary for Research and Technology
Intelligent Transportation Systems Joint Program Office
Task 8 D2X Hub Proof-of-Concept Test Evaluation Report ndash Final | 22
Chapter 5 Experimental Analysis
Hypothesis 11 amp 12 The MDEA can detect when a traveler transitions from a pedestrian to a light duty vehicle or from a light duty vehicle to a pedestrian
Data logs verified MDEA Log ndash Travel Mode Status Change Experimental Log ndash Mode Transition Detection Log
Analysis 1 Assessed the change in ldquoTravel Mode Statusrdquo after the pedestrian enters the vehicle
(The threshold value for Travel Mode Status Change is 10 secs) 2 Assessed the false positive rate of transition detection
Observations Accelerometer tests on average took 75 secs and 44 secs to detect in-vehicle and on-foot respectively However Bluetooth beacon tests on a verage took 17 secs and 1 1 secs to detect in-vehicle and on-foot respectively This quantifies the unreliable nature of Bluetooth Beacons as used in this system
Table 5-12 Hypothesis 11 amp 12 Analysis Data Sample
Mode Detection Method On-foot to In-Vehicle Transition time (Sec)
In-Vehicle to On-foot Transition Time (Sec)
Accelerometer 75 44
Bluetooth Beacon 17 11
Results Hypothesis is proved as 100 confident during the accelerometer tests However none of the tests with Bluetooth Beacon satisfied the hypothesis (all false negatives)
US Department of Transportation Office of the Assistant Secretary for Research and Technology
Intelligent Transportation Systems Joint Program Office
Task 8 D2X Hub Proof-of-Concept Test Evaluation Report ndash Final | 23
Chapter 5 Experimental Analysis
Hypothesis 13 The MDEA can coordinate maintain and cancel travel with another MDEA via Wi-Fi Direct
Data logs verified MDEA (1) Log ndash Coordination Request Received Occurrence Coordination Request Contents Coordination Acceptance Sent Occurrence Coordination Acceptance Notification Coordination Heartbeat Received Occurrence Coordination Cancel Response Sent occurrence and Coordination Disband Sent occurrence
MDEA (2) Log ndash Coordination Request Sent Occurrence Coordination Confirmation received Occurrence Coordination Heartbeat Response Sent Occurrence Coordination Acceptance received Occurrence
Analysis 1 Determined the percentage of Coordination Request Acceptance Heartbeat Cancel and
Disband messages properly processed by mobile devices 2 Assessed the message contents for consistency
Observations This test is performed in a highly-controlled environment This means selection of specific devices and designating them with specific roles This approach was chosen due to poor Wi-Fi direct performance with our system that would have otherwise hindered the ability to conduct the testing and collect the necessary data
US Department of Transportation Office of the Assistant Secretary for Research and Technology
Intelligent Transportation Systems Joint Program Office
Task 8 D2X Hub Proof-of-Concept Test Evaluation Report ndash Final | 24
Chapter 5 Experimental Analysis
Table 5-13 Hypothesis 13 Analysis Data Sample
13117 2117
TFHRC 1
TFHRC 2
TFHRC 3
TFHRC 4
TFHRC 5
TFHRC 6
TFHRC 7
TFHRC 8
TFHRC 9
TFHRC 10
Coordination Request Sent by
Y
Fai
l T
rave
ler
Y c
ould
no
t joi
n th
e ad
-hoc
trav
el g
roup
40951 Check
F
ail
Tra
vele
r Y
cou
ld
not j
oin
the
ad-h
oc tr
avel
gro
up
Check Check Check Check Check Check
Coordination Request Received
by X check Check Check Check Check Check Check Check
Request Confirmed by X
check Check Check Check Check Check Check Check
Confirmation Received by Y
Coordination Request Sent by
Z
check Check Check Check Check Check Check Check
41047 Check Check Check Check Check Check Check
Coordination Request Received
by X check Check Check Check Check Check Check Check
Request Confirmed by X
check Check Check Check Check Check Check Check
Confirmation Received by Z
Coordination Heart Beat
Transmitted by Y amp Z
check Check Check Check Check Check Check Check
check Check Check Check Check Check Check Check
Heart Beat Response
received by X
Ride Arrived Messages
check Check Check Check Check Check Check Check
41303 Check Check Check Check Check Check Check
Coordination Cancel by walking
away Check Check Check Check Check This step not tested on this day
Coordination Cancel by Manual
request This step not tested on this day
Check Check Check Check Check
Disband Group after entering into
vehicle Check Check Check Check Check
For the complete analysis please refer to Table A-9 and Table A-10 in Appendix A
Results There were 30 outliers out of 198 checks (False Negatives) in the data analyzed Hence Hypothesis 13 is satisfied at an 8484 level of confidence
US Department of Transportation Office of the Assistant Secretary for Research and Technology
Intelligent Transportation Systems Joint Program Office
Task 8 D2X Hub Proof-of-Concept Test Evaluation Report ndash Final | 25
US Department of Transportation Office of the Assistant Secretary for Research and Technology
Intelligent Transportation Systems Joint Program Office
Task 8 D2X Hub Proof-of-Concept Test Evaluation Report ndash Final | 26
Chapter 5 Experimental Analysis
Hypothesis 14 The RSU can broadcast a SPaT and MAP message via DSRC that can be received by mobile devices
Data logs verified MDEA Log ndash BSM received and PSM send occurrences
Analysis 1 Determined the percentage of SPaT messages received by mobile devices when within
100 meters of RSE Assessed message contents for consistency 2 Determined the percentage of MAP messages received by mobile devices when within
100 meters of RSE Assessed message contents for consistency
Observations Considering test 5444 all the SPa T messages were transmitted and received at a rate of 1sec Similarly all the MAP messages were transmitted and received at a rate better than 5sec
Table 5-14 Hypothesis 14 Analysis Data Sample
ID Date Message
5 13117 163842 Dsrc Rx Spat id19
6 13117 163842 Dsrc Rx Map id18
9 13117 163843 Dsrc Rx Spat id19
10 13117 163843 Dsrc Rx Bsm Lat389546323 Long -771488295 Head 2713375 Sp 0
12 13117 163843 Dsrc Rx Bsm Lat389546138 Long -771483988 Head 2559125 Sp 0
13 13117 163844 Dsrc Rx Spat id19
14 13117 163844 Dsrc Rx Bsm Lat389546323 Long -771488297 Head 2713375 Sp 0
16 13117 163844 Dsrc Rx Bsm Lat389546138 Long -771483987 Head 2559125 Sp 0
17 13117 163844 Dsrc Rx Map id18
18 13117 163844 Dsrc Rx Bsm Lat389546322 Long -7714883 Head 2713375 Sp 0
20 13117 163845 Dsrc Rx Bsm Lat389546137 Long -771483987 Head 2559125 Sp 0
21 13117 163845 Dsrc Rx Bsm Lat389546322 Long -771488302 Head 2713375 Sp 0
22 13117 163845 Dsrc Rx Spat id19
23 13117 163845 Dsrc Rx Bsm Lat389546137 Long -771483987 Head 2559125 Sp 0
25 13117 163845 Dsrc Rx Bsm Lat38954632 Long -771488302 Head 2713375 Sp 0
26 13117 163846 Dsrc Rx Bsm Lat389546135 Long -771483987 Head 2559125 Sp 0
27 13117 163846 Dsrc Rx Spat id19
29 13117 163846 Dsrc Rx Bsm Lat389546318 Long -771488303 Head 2713375 Sp 0
31 13117 163846 Dsrc Rx Map id18
Results There were no outliers (False Negatives) in the data analyzed Hence Hypothesis 14 is satisfied at a 100 level of confidence
Chapter 5 Experimental Analysis
Hypothesis 15 The RSU can store all messages received via DSRC
Data logs verified MDEA Log ndash All Occurrences of messages sent via DSRC and Message Contents RSU Log ndash Message Received Occurrence and Message Contents
Analysis 1 Assessed the percentage of messages received from mobile devices within 100 meters of
RSE Assess message contents to make sure they are consistent
Observations a Considering the message logs from test cases 5411 5444 5471 there were instances
where PSMs were logged at a rate of less than 10sec Also there were test cases that had no reception of PSMs This clearly indicates the reception issues with RSU CCP unit One prime focus for the Large-Scale Field Test is to improve the reliability of the hardware associated with RSU
b The message contents in all the DSRC messages were consistent throughout the test logs
Table 5-15 Hypothesis 15 Analysis Data Sample
Date Time
Vehicle Range and Advisory Distance wrt
Speed Speed (mph)
In Range
Out of Range
Distance (m)
RSU Log PSM
Message RateSec
13117 101316 IsBsmClose Dist
975500061708885lt AdvDist 1024200201024
255 98 8
13117 101332 IsBsmClose Dist
570797651794001lt AdvDist 666000057888
173 57 6
13117 101340 IsBsmClose Dist
57448436831453lt AdvDist 601199821728
149 57 1
13117 101529 IsBsmClose Dist
975729907380225lt AdvDist 102240014976
254 98 0
13117 101538 IsBsmClose Dist
399317028326919lt AdvDist 102240014976
250 4 1
For the complete analysis please refer to Table A-1 in Appendix A
US Department of Transportation Office of the Assistant Secretary for Research and Technology
Intelligent Transportation Systems Joint Program Office
Task 8 D2X Hub Proof-of-Concept Test Evaluation Report ndash Final | 27
Chapter 5 Experimental Analysis
Table 5-16 Data Usage Statistics
17-Jan 18-Jan 19-Jan 20-Jan 31-Jan 1-Feb Average Maximum
Total Usage (MB) 3805 626 714 2713 4873 1355 984 2713
TMX core usage (MB) 271 450 468 1991 345 90 705 1991
of TMX usage 71 72 66 73 71 66 71 73
Results The hypothesis statement of RSU being able to store all messages received via DSRC is not satisfied at 100 level of confidence due to hardware issues
US Department of Transportation Office of the Assistant Secretary for Research and Technology
Intelligent Transportation Systems Joint Program Office
Task 8 D2X Hub Proof-of-Concept Test Evaluation Report ndash Final | 28
Chapter 6 Lessons Learned and Recommendations
Lessons Learned
The Lessons Learned from the Proof-of-Concept testing are summarized as follows
The ability to reliably generate transmit and receive messages between mobile devices and connected vehicles was demonstrated
The messages to incorporate mobile devices into the C V environment functioned as designed and provided the necessary data for the prototype mobility and safety applications
The prototype safety and mobility software applications functioned well (as designed)
Limitations of technology and hardware issues caused the majority of performance shortfalls
Mixed results were achieved for the various communication methods tested
a Cellular functioned well with our system
b Wi-Fi Direct connectivity was unreliable with our system
c DSRC hardware problems caused communication problems with our system
GPS accuracy limitations were observed as expected
Wi-Fi Direct Connectivity
The connection process was prone to failure at multiple points with no indication to the application why connection failed
TFHRC success rate was achieved by selecting specific devices that worked best for specific roles otherwise a failure rate gt50 would have been expected based on earlier testing
Canvasing of developer community found similar observations no solutions for our system
Wi-Fi Direct connection process requires authorization from the user of the target device in a real world environment such a request would most likely be denied if noticed at all
US Department of Transportation Office of the Assistant Secretary for Research and Technology
Intelligent Transportation Systems Joint Program Office
Task 8 D2X Hub Proof-of-Concept Test Evaluation Report ndash Final | 29
Chapter 6 Lessons Learned and Recommendations
DSRC Hardware
Common Computer Platform (CCP) Pre-production engineering units were used which were determined to have an impedance mismatch between the DSRC chip and RF connector that caused reduction of signal strength
Arada LocoMate ME There were occasional Bluetooth connection failures to mobile devices as well as occasional DSRC transmissionreception failures Longer term it is assumed that DSRC radios will be integrated into smartphones thus obviating the current issues
Recommendations
Based on outcomes of Proof-of-Concept Testing the following prototype system design changes are recommended to be implemented prior to the larger-scale prototype field test
Add Cellular-based communication for Travel Group coordination between mobile devices
New and improved CCP units will be used for the larger-scale field test
For in-vehicle detection use Accelerometer method as the most reliable option
US Department of Transportation Office of the Assistant Secretary for Research and Technology
Intelligent Transportation Systems Joint Program Office
Task 8 D2X Hub Proof-of-Concept Test Evaluation Report ndash Final | 30
APPENDIX A Comprehensive Data Analysis Tables
Note For all the analysis results depicted below the term ldquocheckrdquo refers to the ldquosuccessrdquo of desired action
Table A-1 Complete Data Analysis ndash Hypothesis 1 4 amp 15
Date Time Vehicle Range and Advisory
Distance wrt Speed Speed In
Range Out of
Range Distance
RSU Log PSM
Message RateSec
VEA Log PSM
Message Rate
1312017 101316 IsBsmClose Dist 975500061708885lt
AdvDist 1024200201024 255 X 98 8 10
1312017 101332 IsBsmClose Dist 570797651794001lt
AdvDist 666000057888 173 X 57 6 10
1312017 101340 IsBsmClose Dist 57448436831453lt
AdvDist 601199821728 149 X 57 1 10
1312017 101529 IsBsmClose Dist 975729907380225lt
AdvDist 102240014976 254 X 98 0 10
1312017 101538 IsBsmClose Dist 399317028326919lt
AdvDist 102240014976 250 X 4 1 10
1312017 101553 IsBsmClose Dist 600719107941917lt
AdvDist 70199987616 174 X 60 0 10
1312017 102029 IsBsmClose Dist 944643508928866lt
AdvDist 1008000141984 251 X 95 0 9
1312017 102048 IsBsmClose Dist 592561932680623lt
AdvDist 628200188352 156 X 59 0 9
US Department of Transportation Office of the Assistant Secretary for Research and Technology
Intelligent Transportation Systems Joint Program Office
Task 8 D2X Hub Proof-of-Concept Test Evaluation Report ndash Final | A-1
APPENDIX A Comprehensive Data Analysis Tables
Date Time Vehicle Range and Advisory
Distance wrt Speed Speed In
Range Out of Range Distance
RSU Log PSM
Message RateSec
VEA Log PSM
Message Rate
1312017 102054 IsBsmClose Dist 616348297460404lt
AdvDist 644399845056 160 X 62 3 11
1312017 102105 IsBsmClose Dist 871180496389495lt
AdvDist 1092600137376 247 X 87 4 9
1312017 102206 IsBsmClose Dist 977301610734722lt
AdvDist 1130400006912 295 X 98 0 10
1312017 102228 IsBsmClose Dist 577576034007057lt
AdvDist 60659997552 151 X 58 2 10
1312017 102332 IsBsmClose Dist 101193300977461lt
AdvDist 10386002088 258 X 101 10 10
1312017 102356 IsBsmClose Dist 595641466972855lt
AdvDist 660599904096 164 X 60 6 10
1312017 102623 IsBsmClose Dist 100217014111125lt
AdvDist 1024200201024 253 X 100 7 10
1312017 102650 IsBsmClose Dist 540919707235241lt
AdvDist 887399925984 221 X 54 0 10
1172017 111504 IsBsmClose Dist 100564061581794lt
AdvDist 1169999927712 291 X 101 10 10
1172017 112437 IsBsmClose Dist 992912014791515lt
AdvDist 10386002088 258 X 99 10 10
1172017 112837 IsBsmClose Dist 106684353810469lt
AdvDist 1076400078336 261 X 107 10 10
US Department of Transportation Office of the Assistant Secretary for Research and Technology
Intelligent Transportation Systems Joint Program Office
Task 8 D2X Hub Proof-of-Concept Test Evaluation Report ndash Final | A-2
APPENDIX A Comprehensive Data Analysis Tables
Date Time Vehicle Range and Advisory
Distance wrt Speed Speed In
Range Out of Range Distance
RSU Log PSM
Message RateSec
VEA Log PSM
Message Rate
1172017 113148 IsBsmClose Dist 1124753473133lt AdvDist
1186199986752 268 X 112 10 10
1172017 113332 IsBsmClose Dist 106022149777593lt
AdvDist 1126799904384 260 X 106 10 10
1172017 113336 IsBsmClose Dist 59429630331283lt
AdvDist 1196999892 298 X 59 10 10
1172017 113357 IsBsmClose Dist 657937887214709lt
AdvDist 1193400191808 297 X 66 10 10
1172017 113627 IsBsmClose Dist 965542357439439lt
AdvDist 1080000180864 260 X 97 10 10
1172017 113629 IsBsmClose Dist 821301583410616lt
AdvDist 1074600027072 270 X 82 10 10
1172017 113803 IsBsmClose Dist 994884887192582lt
AdvDist 104580001152 251 X 99 10 10
1172017 113811 IsBsmClose Dist 16809952777894lt
AdvDist 106200007056 257 X 17 10 10
1172017 114114 IsBsmClose Dist 948985801452811lt
AdvDist 986399929152 245 X 95 10 10
1172017 114133 IsBsmClose Dist 141255704529106lt
AdvDist 963000067392 242 X 14 10 10
1172017 114136 IsBsmClose Dist 377627357471613lt
AdvDist 977400075168 243 X 38 10 10
US Department of Transportation Office of the Assistant Secretary for Research and Technology
Intelligent Transportation Systems Joint Program Office
Task 8 D2X Hub Proof-of-Concept Test Evaluation Report ndash Final | A-3
APPENDIX A Comprehensive Data Analysis Tables
Date Time Vehicle Range and Advisory
Distance wrt Speed Speed In
Range Out of Range Distance
RSU Log PSM
Message RateSec
VEA Log PSM
Message Rate
1172017 114403 IsBsmClose Dist 114490146784404lt
AdvDist 1225799907552 266 X 114 10 10
1172017 114415 IsBsmClose Dist 280463490772458lt
AdvDist 71100013248 161 X 28 10 10
1172017 114735 IsBsmClose Dist 102043927314914lt
AdvDist 1040399857728 259 X 102 10 10
1172017 114755 IsBsmClose Dist 185020887331204lt
AdvDist 112499985312 275 X 19 10 10
1192017 35605 IsBsmClose Dist 107928079653642lt
AdvDist 1107000145152 272 X 108 9 9
1192017 35630 IsBsmClose Dist 99759104887202lt
AdvDist 1184399935488 294 X 100 10 10
1192017 35837 IsBsmClose Dist 110291146846666lt
AdvDist 115020016848 286 X 110 10 10
1192017 40057 IsBsmClose Dist 998997459961241lt
AdvDist 1260000076896 313 X 100 10 10
1192017 40300 IsBsmClose Dist 100209094247195lt
AdvDist 106919987328 260 X 100 10 10
1192017 40410 IsBsmClose Dist 100723184500334lt
AdvDist 1097999888832 273 X 101 6 10
1192017 41103 IsBsmClose Dist 977354295877856lt
AdvDist 1008000141984 251 X 98 10 10
US Department of Transportation Office of the Assistant Secretary for Research and Technology
Intelligent Transportation Systems Joint Program Office
Task 8 D2X Hub Proof-of-Concept Test Evaluation Report ndash Final | A-4
APPENDIX A Comprehensive Data Analysis Tables
Date Time Vehicle Range and Advisory
Distance wrt Speed Speed In
Range Out of Range Distance
RSU Log PSM
Message RateSec
VEA Log PSM
Message Rate
1192017 41311 IsBsmClose Dist 10190842581135lt
AdvDist 1040399857728 259 X 102 10 10
1192017 41423 IsBsmClose Dist 995536361906761lt
AdvDist 1009799790912 251 X 100 10 10
1192017 41534 IsBsmClose Dist 10075608603652lt
AdvDist 106919987328 264 X 101 10 10
US Department of Transportation Office of the Assistant Secretary for Research and Technology
Intelligent Transportation Systems Joint Program Office
Task 8 D2X Hub Proof-of-Concept Test Evaluation Report ndash Final | A-5
APPENDIX A Comprehensive Data Analysis Tables
Table A-2 Complete Data Analysis ndash Hypothesis 2
US Department of Transportation Office of the Assistant Secretary for Research and Technology
Intelligent Transportation Systems Joint Program Office
Task 8 D2X Hub Proof-of-Concept Test Evaluation Report ndash Final | A-6
Date Test
Number PSMs Generated by
Trav X and Trav Y Transition to In Group Trav Y PSM Ceased Only Trav X PSM
Received
1312017 TFHRC 1 111116 111240 Check 111305
1312017 TFHRC 2 Grouping Failed Grouping Failed Grouping Failed Grouping Failed
1312017 TFHRC 3 112346 112448 Check 112508
1312017 TFHRC 4 114208 114301 Check 114345
1312017 TFHRC 5 114609 114658 Check 114721
1312017 TFHRC 6 115222 115313 Check 115342
1182017 ATP 1 104400 104527 Check 104601
1182017 ATP 2 105356 105455 Check 105546
1182017 ATP 3 110059 110150 Check 110322
1182017 ATP 4 111222 111310 Check 111329
1182017 ATP 5 111515 111616 Check 111630
1182017 ATP 6 111823 111906 Check 111917
1182017 ATP 7 112116 112157 Check 112209
1182017 ATP 8 112814 112855 Check 112917
1182017 ATP 9 113142 113230 Check 113248
1182017 ATP 10 113501 113545 Check 113608
1192017 ATP 11 44728 44842 Check 45007
1192017 ATP 12 Radio Failure Test Terminated Radio Failure Test Terminated Radio Failure Test Terminated Radio Failure Test Terminated
1192017 ATP 13 45548 45637 Check 45728
1192017 ATP 14 45946 50047 Check 50107
1192017 ATP 15 50353 50444 Check 50513
1192017 ATP 16 50730 50823 Check 50839
APPENDIX A Comprehensive Data Analysis Tables
Table A-3 Complete Data Analysis ndash Hypothesis 3
US Department of Transportation Office of the Assistant Secretary for Research and Technology
Intelligent Transportation Systems Joint Program Office
Task 8 D2X Hub Proof-of-Concept Test Evaluation Report ndash Final | A-7
Date Description
MDEA not in Vehicle
MDEA Transmits
PSMs Time of MDEA
Mode Transition
MDEA Ceases Transmitting
PSMs
1312017 TFHRC 1 Check Check 0443101852 Check
1312017 TFHRC 2 Check Check 0445243056 Check
1312017 TFHRC 3 Check Check 0447569444 Check
1312017 TFHRC 4 Check Check 0448888889 Check
1312017 TFHRC 5 Check Check 045005787 Check
1312017 TFHRC 6 Check Check 0451666667 Check
1172017 ATP 1 Check Check 0501898148 Check
1172017 ATP 2 Check Check 0504201389 Check
1172017 ATP 3 Check Check 0506215278 Check
1172017 ATP 4 Check Check 0507858796 Check
1172017 ATP 5 Check Check 0508981481 Check
1172017 ATP 6 Check Check 0510219907 Check
1172017 ATP 7 Check Check 0511736111 Check
1172017 ATP 8 Check Check 05128125 Check
1172017 ATP 9 Check Check 0513831019 Check
1172017 ATP 10 Check Check 0514884259 Check
1172017 ATP 11 Check Check 0185590278 Check
1172017 ATP 12 Check Check 0187210648 Check
1172017 ATP 13 Check Check 0188425926 Check
1172017 ATP 14 Check Check 0190289352 Check
1172017 ATP 15 Check Check 0191863426 Check
APPENDIX A Comprehensive Data Analysis Tables
Table A-4 Complete Data Analysis ndash Hypothesis 5 (VEA)
Test Number
Type of Message
True Distance (m)
Speed (MPH)
Expected Distance (m)
Difference (m)
TFHRC1
Advisory 7584 2471 9942 2358
Alert 5545 2523 5780 235
Warning 4874 2498 4910 036
TFHRC2
Advisory 8552 2595 10441 1889
Alert 5167 2461 5588 421
Warning 4515 2433 4751 236
TFHRC3
Advisory 7876 2381 9580 1704
Alert 5827 2590 5989 162
Warning 5124 2624 5222 098
TFHRC4
Advisory 7529 2818 11338 3809
Alert 6047 2744 6482 435
Warning 5323 2714 5450 127
TFHRC5
Advisory 9292 2404 9672 380
Alert 5350 2423 5472 122
Warning 4081 2352 4556 475
ATP1
Advisory 000 000
Alert 000 000
Warning 000 000
ATP2
Advisory 5787 1644 6614 827
Alert 3074 1640 3289 215
Warning 2627 1640 2947 320
ATP3
Advisory 4204 1685 6779 2575
Alert 3300 1672 3370 070
Warning 2854 1658 2985 131
ATP4
Advisory 4296 1753 7053 2757
Alert 3346 1791 3679 333
Warning 2871 1755 3194 323
ATP5
Advisory 000 000
Alert 000 000
Warning 1069 1706 3088 2019
ATP6
Advisory 3632 1640 6598 2966
Alert 000 000
Warning 2770 1594 2850 080
US Department of Transportation Office of the Assistant Secretary for Research and Technology
Intelligent Transportation Systems Joint Program Office
Task 8 D2X Hub Proof-of-Concept Test Evaluation Report ndash Final | A-8
APPENDIX A Comprehensive Data Analysis Tables
Test Number
Type of Message
True Distance (m)
Speed (MPH)
Expected Distance (m)
Difference (m)
ATP7
Advisory 000 000
Alert 000 000
Warning 1919 1887 3483 1564
ATP8
Advisory 4492 1741 7005 2513
Alert 3113 1687 3409 296
Warning 2661 1680 3032 371
ATP9
Advisory 4694 1628 6550 1856
Alert 2991 1570 3113 122
Warning 2572 1549 2756 184
ATP10
Advisory 000 000
Alert 000 000
Warning 650 2505 4927 4277
ATP11
Advisory 000 000
Alert 000 000
Warning 1914 2398 4666 2752
ATP12
Advisory 000 000
Alert 000 000
Warning 460 2293 4415 3955
ATP13
Advisory 000 000
Alert 000 000
Warning 2732 2535 5001 2269
ATP14
Advisory 000 000
Alert 000 000
Warning 2358 2361 4577 2219
ATP15
Advisory 000 000
Alert 000 000
Warning 1107 2459 4814 3707
ATP16
Advisory 5668 1982 7974 2306
Alert 000 000
Warning 1502 1906 3525 2023
ATP17
Advisory 000 000
Alert 000 000
Warning 3183 2420 4720 1537
US Department of Transportation Office of the Assistant Secretary for Research and Technology
Intelligent Transportation Systems Joint Program Office
Task 8 D2X Hub Proof-of-Concept Test Evaluation Report ndash Final | A-9
Table A-5 Complete Data Analysis ndash Hypothesis 6 (MDEA)
Test Number
Type of Message
True Distance (m)
Speed (MPH)
Expected Distance (m)
Difference (m)
TFHRC1
Advisory 8756 2290 9213 457
Alert 5320 2509 5736 416
Warning 4651 2487 4883 232
TFHRC2
Advisory 9928 2514 10115 187
Alert 5276 2447 5546 270
Warning 4624 2415 4707 084
TFHRC3
Advisory 8952 2304 9270 318
Alert 5595 2603 6030 436
Warning 4890 2617 5205 315
TFHRC4
Advisory 9752 2514 10115 363
Alert 6290 2769 6564 274
Warning 4844 2693 5396 552
TFHRC5
Advisory 9613 2406 9680 067
Alert 5242 2420 5463 221
Warning 4080 2357 4568 488
ATP1
Advisory 5938 2183 8783 2845
Alert 4314 2120 4580 266
Warning 3644 2111 3989 345
ATP2
Advisory 6452 1641 6602 150
Alert 3296 1691 3419 123
Warning 2600 1601 2865 265
ATP3
Advisory 6212 1628 6550 338
Alert 3200 1655 3327 127
Warning 2707 1641 2949 242
ATP4
Advisory 6420 1646 6622 202
Alert 3300 1780 3650 350
Warning 2878 1704 3084 206
ATP5
Advisory 6673 1677 6747 074
Alert 3400 1847 3828 428
Warning 2972 1807 3307 335
ATP6
Advisory 6100 1628 6550 450
Alert 3100 1637 3281 181
Warning 2500 1597 2857 357
APPENDIX A Comprehensive Data Analysis Tables
US Department of Transportation Office of the Assistant Secretary for Research and Technology
Intelligent Transportation Systems Joint Program Office
Task 8 D2X Hub Proof-of-Concept Test Evaluation Report ndash Final | A-10
APPENDIX A Comprehensive Data Analysis Tables
Test Number
Type of Message
True Distance (m)
Speed (MPH)
Expected Distance (m)
Difference (m)
ATP7
Advisory 7500 1972 7934 434
Alert 3882 1914 4008 126
Warning 3400 1946 3614 214
ATP8
Advisory 6659 1744 7017 358
Alert 3263 1682 3396 133
Warning 2900 1682 3037 137
ATP9
Advisory 6605 1659 6675 070
Alert 2900 1556 3078 178
Warning 2365 1561 2781 416
ATP10
Advisory 9214 2491 10022 808
Alert 5859 2688 6301 442
Warning 5200 2644 5273 073
ATP11
Advisory 8485 2487 10006 1521
Alert 5376 2487 5668 292
Warning 4716 2483 4873 157
ATP12
Advisory 9001 2433 9789 788
Alert 5395 2420 5463 068
Warning 4103 2330 4503 400
ATP13
Advisory 8615 2559 10296 1681
Alert 000 000 000 000
Warning 4930 2581 5115 185
ATP14
Advisory 6119 2491 10022 3903
Alert 5500 2491 5681 181
Warning 3800 2402 4676 876
ATP15
Advisory 7546 2603 10473 2927
Alert 6000 2661 6215 215
Warning 3100 2603 5170 2070
ATP16
Advisory 7931 2089 8405 474
Alert 3995 1950 4106 111
Warning 3500 1923 3563 063
ATP17
Advisory 8243 2049 8244 001
Alert 5260 2465 5601 341
Warning 4718 2438 4763 045
US Department of Transportation Office of the Assistant Secretary for Research and Technology
Intelligent Transportation Systems Joint Program Office
Task 8 D2X Hub Proof-of-Concept Test Evaluation Report ndash Final | A-11
Table A-6 Complete Data Analysis ndash Hypothesis 7
Date Test
Number
User State Change Is
Safe Icon False
Properly Processed
User State Change Is
Safe Icon True
Properly Processed
1312017 TFHRC 1 111438 X 111504 X
1312017 TFHRC 3 112533 X 112619 X
1312017 TFHRC 4 114400 X 114438 X
1312017 TFHRC 5 114801 X 114829 X
1312017 TFHRC 6 115408 X 115444 X
1182017 ATP 1 105056 X 105116 X
1182017 ATP 2 105622 X 105656 X
1182017 ATP 3 110348 X 110436 X
1182017 ATP 4 111355 X 111417 X
1182017 ATP 5 111655 X 111717 X
1182017 ATP 6 111947 X 112007 X
1182017 ATP 7 112235 X 112305 X
1182017 ATP 8 112937 X 113013 X
1182017 ATP 9 113313 X 113353 X
1182017 ATP 10 113636 X 113708 X
1192017 ATP 11 45035 X 45057 X
1192017 ATP 13 45806 X 45828 X
1192017 ATP 14 50144 X 50202 X
1192017 ATP 15 50542 X 50600 X
1192017 ATP 16 50903 X 50929 X
APPENDIX A Comprehensive Data Analysis Tables
US Department of Transportation Office of the Assistant Secretary for Research and Technology
Intelligent Transportation Systems Joint Program Office
Task 8 D2X Hub Proof-of-Concept Test Evaluation Report ndash Final | A-12
APPENDIX A Comprehensive Data Analysis Tables
Table A-7 Complete Data Analysis ndash Hy pothesis 8 amp 9
US Department of Transportation Office of the Assistant Secretary for Research and Technology
Intelligent Transportation Systems Joint Program Office
Task 8 D2X Hub Proof-of-Concept Test Evaluation Report ndash Final | A-13
Test Number
Analyze the percentage of PMM messages properly processed by
in-vehicle devices Analyze the percentage of PMM-RSP messages
properly processed by mobile devices
Analyze the percentage of PMM-Cancel messages
properly processed by in-vehicle devices
MDEA Log ndash PMM Send
occurrence
MDEA Log ndash
PMM contents
VEA Log ndash PMM
Receive occurrence
VEA Log ndash Driver
acceptance
VEA Log ndash PMM-RSP
Send occurrence
MDEA Log ndash PMM-RSP
Receive occurrence
MDEA Log ndash Coordination
Status
MDEA Log ndash PMM-
Cancel Sent Occurrence
VEA Log ndash PMM-
Cancel Received
Occurrence
TFHRC 1 Check All Present Check Check Check Check Check Check Check
TFHRC 2 Check All Present Check Check Check Check Check Check Check
TFHRC 3 Check All Present Check Check Check Check Check Check Check
TFHRC 4 Check All Present Check Check Check Check Check Check Check
TFHRC 5 Check All Present Check Check Check Check Check Check Check
ATP 1 Check All Present Check Check Check Check Check Check Check
ATP 2 Check All Present Check Check Check Check Check Check Check
ATP 3 Check All Present Check Check Check Check Check Check Check
ATP 4 Check All Present Check Check Check Check Check Check Check
ATP 5 Check All Present Check Check Check Check Check Check Check
ATP 6 Check All Present Check Check Check Check Check Check Check
ATP 7 Check All Present Check Check Check Check Check Check Check
ATP 8 Check All Present Check Check Check Check Check Check Check
ATP 9 Check All Present Check Check Check Check Check Check Check
ATP 10 Check All Present Check Check Check Check Check Check Check
APPENDIX A Comprehensive Data Analysis Tables
Test Number
Analyze the percentage of PMM messages properly processed by
in-vehicle devices Analyze the percentage of PMM-RSP messages
properly processed by mobile devices
Analyze the percentage of PMM-Cancel messages
properly processed by in-vehicle devices
MDEA Log ndash PMM Send occurrence
MDEA Log ndash PMM
contents
VEA Log ndash PMM
Receive occurrence
VEA Log ndash Driver
acceptance
VEA Log ndash PMM-RSP
Send occurrence
MDEA Log ndash PMM-RSP
Receive occurrence
MDEA Log ndash Coordination
Status
MDEA Log ndash PMM-
Cancel Sent Occurrence
VEA Log ndash PMM-
Cancel Received
Occurrence
ATP 11 Check All Present Check Check Check Check Check Check Check
ATP 12 Check All Present Check Check Check Check Check Check Check
ATP 13 Check All Present Check Check Check Check Check Check Check
ATP 14 Check All Present Check Check Check Check Check Check Check
ATP 15 Check All Present Check Check Check Check Check Check Check
ATP 16 Check All Present Check Check Check Check Check Check Check
ATP 17 Check All Present Check Check Check Check Check Check Check
US Department of Transportation Office of the Assistant Secretary for Research and Technology
Intelligent Transportation Systems Joint Program Office
Task 8 D2X Hub Proof-of-Concept Test Evaluation Report ndash Final | A-14
Table A-8 Complete Data Analysis ndash Hy pothesis 10
Date Test Number
Analyze the Success Rate of Receiving a PMM-Arrive Message
VEA Log ndash PMM-ARRIVE Send Occurrence MDEA Log ndash PMM-ARRIVE Receive Occurrence
1312017 TFHRC 1 Fail Fail
1312017 TFHRC 2 Check Check
1312017 TFHRC 3 Check Check
1312017 TFHRC 4 Check Check
1312017 TFHRC 5 Check Check
1312017 TFHRC 6 Check Check
1312017 TFHRC 7 Check Check
1182017 ATP 1 Not Available Check
1182017 ATP 2 Not Available Check
1182017 ATP 3 Not Available Check
1182017 ATP 4 Not Available Check
1182017 ATP 5 Not Available Check
1182017 ATP 6 Not Available Check
1182017 ATP 7 Not Available Check
1182017 ATP 8 Not Available Check
1182017 ATP 9 Not Available Check
1182017 ATP 10 Not Available Check
1202017 ATP 11 Check Check
1202017 ATP 12 Check Check
1202017 ATP 13 Check Check
1202017 ATP 14 Check Check
1202017 ATP 15 Check Check
APPENDIX A Comprehensive Data Analysis Tables
US Department of Transportation Office of the Assistant Secretary for Research and Technology
Intelligent Transportation Systems Joint Program Office
Task 8 D2X Hub Proof-of-Concept Test Evaluation Report ndash Final | A-15
APPENDIX A Comprehensive Data Analysis Tables
Table A-9 Complete Data Analysis ndash Hypothesis 13 (Part A)
US Department of Transportation Office of the Assistant Secretary for Research and Technology
Intelligent Transportation Systems Joint Program Office
Task 8 D2X Hub Proof-of-Concept Test Evaluation Report ndash Final | A-16
Test Number
Coordination Request Sent
by Y
Coordination Request
Received by X
Request Confirmed
by X Confirmation Received by Y
Coordination Request Sent
by Z
Coordination Request
Received by X
Request Confirmed
by X Confirmation Received by Z
Coordination Heart Beat
Transmitted by Y amp Z
Heart Beat Response received
by X
Ride Arrived
Messages
TFHRC 1
Fail Traveler Y could not join the ad-hoc travel group
TFHRC 2
Check check check check 41047 check check check check check 41303
TFHRC 3
Check Check Check Check Check Check Check Check Check Check Check
TFHRC 4
Fail Traveler Y could not join the ad-hoc travel group
TFHRC 5
Check Check Check Check Check Check Check Check Check Check Check
TFHRC 6
Check Check Check Check Check Check Check Check Check Check Check
TFHRC 7
Check Check Check Check Check Check Check Check Check Check Check
TFHRC 8
Check Check Check Check Check Check Check Check Check Check Check
TFHRC 9
Check Check Check Check Check Check Check Check Check Check Check
TFHRC 10
Check Check Check Check Check Check Check Check Check Check Check
ATP 1 Check Check Check Check Check Check Check Check Check Check Check
ATP 2 Check Check Check Check Check Check Check Check Check Check Check
Test Number
Coordination Request Sent
by Y
Coordination Request
Received by X
Request Confirmed
by X Confirmation Received by Y
Coordination Request Sent
by Z
Coordination Request
Received by X
Request Confirmed
by X Confirmation Received by Z
Coordination Heart Beat
Transmitted by Y amp Z
Heart Beat Response received
by X
Ride Arrived
Messages
ATP 3 Check Check Check Check Check Check Check Check Check Check Check
ATP 4 Check Check Check Check Check Check Check Check Check Check Check
ATP 5 Check Check Check Check Check Check Check Check Check Check Check
ATP 6 Check Check Check Check Check Check Check Check Check Check Check
ATP 7 Check Check Check Check Check Check Check Check Check Check No ride
arrives received
ATP 8 Check Check Check Check Check Check Check Check Check Check Check
ATP 9 Check Check Check Check Check Check Check Check Check Check No ride
arrives received
ATP 10 Check Check Check Check Check Check Check Check Check Check Check
ATP 11 Check Check Check Check Check Check Check Check Check Check Check
ATP 12 Check Check Check Check Check Check Check Check Check Check No ride
arrives received
ATP 13 Check Check Check Check Check Check Check Check Check Check Check
ATP 14 Check Check Check Check Check Check Check Check Check Check Check
ATP 15 Check Check Check Check Check Check Check Check Check Check Check
APPENDIX A Comprehensive Data Analysis Tables
US Department of Transportation Office of the Assistant Secretary for Research and Technology
Intelligent Transportation Systems Joint Program Office
Task 8 D2X Hub Proof-of-Concept Test Evaluation Report ndash Final | A-17
APPENDIX A Comprehensive Data Analysis Tables
Table A-10 Complete Data Analysis ndash Hypothesis 13 (Part B)
US Department of Transportation Office of the Assistant Secretary for Research and Technology
Intelligent Transportation Systems Joint Program Office
Task 8 D2X Hub Proof-of-Concept Test Evaluation Report ndash Final | A-18
Test Number Coordination Cancel by
Walking Away Coordination Cancel by
Manual Request Disband Group after
Entering into Vehicle
TFHRC 1 Check This step not tested on this day
TFHRC 2 Check This step not tested on this day
TFHRC 3 Check This step not tested on this day
TFHRC 4 Check This step not tested on this day
TFHRC 5 Check This step not tested on this day
TFHRC 6 This step not tested on this day Check Check
TFHRC 7 This step not tested on this day Check Check
TFHRC 8 This step not tested on this day Check Check
TFHRC 9 This step not tested on this day Check Check
TFHRC 10 This step not tested on this day Check Check
ATP 1 Check Check Check
ATP 2 Check Check Check
ATP 3 Check Check Check
ATP 4 Check Check Check
ATP 5 Check Check Check
ATP 6 Check Check Check
ATP 7 Check Check Check
ATP 8 Check Check Check
ATP 9 Check Check Check
APPENDIX A Comprehensive Data Analysis Tables
Test Number Coordination Cancel by
Walking Away Coordination Cancel by
Manual Request Disband Group after Entering into Vehicle
ATP 10 Check Check Check
ATP 11 Fail Could not cancel by distance Check Check
ATP 12 Check Check Check
ATP 13 Fail Could not cancel by distance Check Check
ATP 14 Check Check Check
ATP 15 Check Check Check
US Department of Transportation Office of the Assistant Secretary for Research and Technology
Intelligent Transportation Systems Joint Program Office
Task 8 D2X Hub Proof-of-Concept Test Evaluation Report ndash Final | A-19
APPENDIX A Comprehensive Data Analysis Tables
APPENDIX B Acronyms and Abbreviations
ATG Ad-Hoc Travel Group
ATP Acceptance Test Plan
BSM Basic Safety Message
CCP Common Computing Platform
CV Connected Vehicle
DSRC Dedicated Short Range Communications
EPS Experimental Prototype System
FHWA Federal Highway Administration
FR Functional Requirement
ITS Intelligent Transportation Systems
LDV Light-Duty Vehicle
MAP Map Data
MDEA Mobile Device Experimental Application
MGL Message Logging
OBU On-board Unit
PMM Personal Mobility Message
PMM-ARRIVE Personal Mobility Message Arrival Message
PMM-CANCEL Personal Mobility Message Cancel Message
PMM-RSP Personal Mobility Message Response Message
PR Performance Requirement
PSM Personal Safety Message
REA Roadside Experimental Application
RSU Roadside Unit
SFY Safety
SIR System Interface Requirement
SMP SPaT and MAP
SPaT Signal Phasing and Timing
SyRS System Requirements Specifications
TFHRC Turner-Fairbank Highway Research Center
US DOT US Department of Transportation
US Department of Transportation Office of the Assistant Secretary for Research and Technology
Intelligent Transportation Systems Joint Program Office
Task 8 D2X Hub Proof-of-Concept Test Evaluation Report ndash Final |B-1
VEA Vehicle Experimental Application
Wi-Fi Wireless Fidelity
APPENDIX B Acronyms and Abbreviations
US Department of Transportation Office of the Assistant Secretary for Research and Technology
Intelligent Transportation Systems Joint Program Office
Task 8 D2X Hub Proof-of-Concept Test Evaluation Report ndash Final | B-2
APPENDIX C Terms and Definitions
Basic Safety Message (BSM)
Connected vehicle message type which contains vehicle safety-related information that is broadcast to surrounding vehicles
Bluetooth Short range wireless technology used to exchange data between enabled devices
Cellular Uses short-range radio stations to cover areas of communication
Connected Vehicle A vehicle that can communicate with other vehicles and infrastructure via communication media such as DSRC Wi-Fi cellular or Bluetooth
Coordinated Messages are coordinated when two or more mobile devices have establish a travel group based on the same origin destination and
time and function as a single cohesive senderrecipient
CV Inspector An application that verifies if the Mobile Device is broadcasting messages to Connected Vehicles
Destination The end point of a travelerrsquos trip
DSRC Dedicated Short-Range Communications a low-latency high-reliability two-way communications tool used for sending transportation safety
messages
Light-Duty Vehicle Of or relating to vehicles that way less than 4000 lbs
Message Type Type of personal safety or personal mobility message that is transmitted based on the technology used and level of coordination available
Personal Mobility Message (PMM)
Similar to PDM message intended for the exchange of mobility messages between individual travelers and vehiclesinfrastructure via
mobile device
Personal Safety Message (PSM)
Similar to BSM message intended to transmit low-latency urgent safety messages between individual travelers and vehiclesinfrastructure via
mobile device
Test Case A set of conditions or variables that a Tester can determine if system meets requirements
Transit Vehicle Large vehicles mainly used for public transportation as well as support services
Transmitting The state in which a traveler has opted in and is sendingreceiving messages via mobile device
Uncoordinated Messages are uncoordinated when travel groups are not established (see coordinated definition)
Wi-Fi Local area wireless technology that allows enabled devices to connect to the Internet
APPENDIX A Comprehensive Data Analysis Tables
US Department of Transportation Office of the Assistant Secretary for Research and Technology
Intelligent Transportation Systems Joint Program Office
Task 8 D2X Hub Proof-of-Concept Test Evaluation Report ndash Final |C-1
ITS Joint Program Office-HOIT 1200 New Jersey Avenue SE
Washington DC 20590
Toll-Free ldquoHelp Linerdquo 866-367-7487 wwwitsdotgov
FHWA-JPO-18-263
- Structure Bookmarks
-
- Sharing Data between Mobile Devices Connected Vehicles and Infrastructure Task 8 D2X Hub Proof-of-Concept Test Evaluation Report wwwitsdotgovindexhtm Final Report mdash October 25 2017 FHWA-JPO-18-623
- Revision History
- Table of Contents
- Chapter 1 Scope
- Chapter 2 Referenced Documents
- Chapter 3 Test Conduct
- Chapter 4 Experimental Analysis Results Summary
- Chapter 5 Experimental Analysis
- Chapter 6 Lessons Learned and Recommendations
- APPENDIX A Comprehensive Data Analysis Tables
- APPENDIX B Acronyms and Abbreviations
- APPENDIX C Terms and Definitions
-

US Department of Transportation Office of the Assistant Secretary for Research and Technology
Intelligent Transportation Systems Joint Program Office
Task 8 D2X Hub Proof-of-Concept Test Evaluation Report ndash Final | 9
Chapter 5 Experimental Analysis
Hypothesis 1 The MDEA only broadcasts PSMs when in the range of a vehicle broadcasting a BSM
Data logs verified MDEA Log ndash BSM received and PSM send occurrences
Analysis
Determination of vehicle range from mobile device based on vehicle speed Analysis of PSMs sent with respect to vehicle range (In range and out of range scenarios)
Observations In all the test cases PSMs were broadcasted by MDEA when the vehicle was in its range with respect to vehicle speed (ldquofast enough close enoughrdquo)
Table 5-1 Hypothesis 1 Analysis Data Sample
Vehicle Range and Advisory Speed In Out of Distance Date Time Distance wrt Speed (mph) Range Range (m)
13117 101316 IsBsmClose Dist 975500061708885lt
AdvDist 1024200201024 255 X 98
13117 101332 IsBsmClose Dist 570797651794001lt
AdvDist 666000057888 173 X 57
13117 101340 IsBsmClose Dist 57448436831453lt
AdvDist 601199821728 149 X 57
13117 101529 IsBsmClose Dist 975729907380225lt
AdvDist 102240014976 254 X 98
For the complete analysis please refer to Table A-1 in Appendix A
ݐݑݍܧ ݎ ݑ ݐ dݒݏݕݎ ݐݏ ݓݎݐ ݏ
ௗ௩௦௬= lowastݒ9
Where
is the advisory display distance (meters) ௗ௩௦௬ ݒ is the velocity of the vehicle (meters per second)
Results There were no outliers (False Negatives) in the dat a analyzed Hence Hypothesis 1 is satisfied at a 100 level of confidence
Chapter 5 Experimental Analysis
Hypothesis 2 The overall MDEA DSRC message broadcast rate is lower during travel group coordination
Data logs verified MDEA Log ndash Coordination Status PSM send occurrences before and after coordination
Analysis
Determination of coordination status Analysis of PSMs sent while not part of the travel group and while part of the travel group
(Travel group leader) Analysis of PSMs sent while not part of the travel group and while part of the travel group
(Travel group Member)
Observations Out of 64 log checks performed 56 true positives were observed Two tests had a grouping failure due to Wi-Fi Direct issues
Table 5-2 Hypothesis 2 Analysis Data Sample
Date 13117 13117 13117 13117 13117
Description Test Number TFHRC 1 TFHRC 3 TFHRC 4 TFHRC 5 TFHRC 6
PSMs Generated by Traveler X and Traveler Y 111116 112346 114208 114609 115222
Transition to In Group 111240 112448 114301 114658 115313
Traveler Y PSM ceased Check Check Check Check Check
only Traveler X PSM received 111305 112508 114345 114721 115342
For the complete analysis please refer to Table A-2 in Appendix A
Results There were 8 False Negatives in the data analyzed Hence Hypothesis 2 is satisfied at 875 level of confidence
US Department of Transportation Office of the Assistant Secretary for Research and Technology
Intelligent Transportation Systems Joint Program Office
Task 8 D2X Hub Proof-of-Concept Test Evaluation Report ndash Final | 10
Chapter 5 Experimental Analysis
Hypothesis 3 MDEA Log ndash Travel Mode Status PSM send occurrences
Data logs verified MDEA Log ndash BSM received and PSM send occurrences
Analysis
Determination of mobile device travel mode status Analysis of PSMs sent before and after transition of travel mode (on-foot and In-vehicle)
Observations All the test logs indicate that the PSMs were ceased after the MDEA transitioned its travel mode to In-vehicle
Table 5-3 Hypothesis 3 Analysis Data Sample
Description Test Number
TFHRC 1 TFHRC 2 TFHRC 3 TFHRC 4 TFHRC 5 TFHRC 6
MDEA not in vehicle Check Check Check Check Check Check
MDEA Transmits PSMs
Check Check Check Check Check Check
Time of MDEA Mode Transition
103804 104109 104430 104624 104805 105024
MDEA Ceases Transmitting PSMs
Check Check Check Check Check Check
For the complete analysis please refer to Table A-3 in Appendix A
Results There were no outliers (False Negatives) in the data analyzed Hence Hypothesis 3 is satisfied at a 100 level of confidence
US Department of Transportation Office of the Assistant Secretary for Research and Technology
Intelligent Transportation Systems Joint Program Office
Task 8 D2X Hub Proof-of-Concept Test Evaluation Report ndash Final | 11
US Department of Transportation Office of the Assistant Secretary for Research and Technology
Intelligent Transportation Systems Joint Program Office
Task 8 D2X Hub Proof-of-Concept Test Evaluation Report ndash Final | 12
Chapter 5 Experimental Analysis
Hypothesis 4 The Mobile Device can broadcast a PSM a radius of 250 meters 10 Hz under clear unobstructed conditions regardless of where the mobile device is located on the pedestrianrsquos person or clothing
Data logs verified VEA Log ndash PSM receive occurrences at a d istance of 10 m 50 m 100 m
Analysis
The rate at which PSMs were received by the RSU had been assessed The mobile device was placed in multiple locations on the pedestrian including in-hand in-pocket and in a backpack
Observations Due to DSRC limitations in the CCPs tests could not be performed beyond 100 m range Considering the RSU logging issues VEA Logs were used to analyze PSM broadcasting capacity of MDEA All the tests logged PSMs at a ra te o f 10sec Therefore 150 200 250 300 m radius could no t be a nalyzed Only three (10 50 and 100m) out of seven (10 50 100 150 200 250 and 300 m) cases were tested which resulted in a 43 Level of Confidence
Table 5-4 Hypothesis 4 Analysis Data Sample
Date Time
Vehicle Range and Advisory Distance wrt Speed
Speed (mph)
In Range
Out of Range
True Distance (m)
VEA Log PSM Message Rate
13117 101316 IsBsmClose Dist 975500061708885lt AdvDist 1024200201024
255 98 10
13117 101332 IsBsmClose Dist 570797651794001lt AdvDist 666000057888
173 57 10
13117 101340 IsBsmClose Dist 57448436831453lt AdvDist 601199821728
149 57 10
13117 101529 IsBsmClose Dist 975729907380225lt AdvDist 102240014976
254 98 10
13117 101538 IsBsmClose Dist 399317028326919lt AdvDist 102240014976
250 4 10
For the complete analysis please refer to Table A-1 in Appendix A
Results Due to the DSRC limitations the radius was limited to 100 m Hence Hypothesis 4 is satisfied at a 43 level of confidence
Chapter 5 Experimental Analysis
Hypothesis 5 Vehicles OBUs can capture and process Mobile Device PSMs and issue warnings at sufficient distance for drivers to avoid imminent pedestrian collision
Data logs verified VEA Log ndash PSM Location GPS Location Advisory Display Alert Display and Warning Display
Analysis
Assessing the distance at which an Advisory Alert and Warning were issued based on the speed of the vehicle (in the VEA Log)
Observations a Considering TFHRC tests the average difference in distance for VEA Logging of Advisories
Alerts and Warnings were on average 2028 m 275 m and 194 m respectively b The higher difference in advisory was due to the delay in the time between VEA deciding to
send PSM and Arada sending a PSM c Latency of less than a second was observed between PSM received and the message
display time on MDEA and VEA Logs
sݐݑݍܧ ݎ ݑݐ dݒݏwarningandalertݕݎ ݐݏ ݓݎݐ ݏ
ௗ௩௦௬= lowastݒ9
lowast ሻ05ݒ 25ሾሺൌ 11 lowast ቊ ௧ଶݒ
ሿ 2ሺ34ሻ
ቋ
Where
lowast ሻ05ݒ 25ሾሺൌ 11 lowast ቊ ௪
is the advisory display distance (meters) ௗ௩௦௬
is the alert display distance (meters) ௧
is the warning display distance (meters) ௐ
ଶݒሿ 2ሺ56ሻ
ቋ
ݒ is the velocity of the vehicle (meters per second)
TF 71 Run 2 - VEA
Source Battelle Google Maps February 2017
Figure 5-1 Advisory Alert and Warning Distances with Respect to VEA
US Department of Transportation Office of the Assistant Secretary for Research and Technology
Intelligent Transportation Systems Joint Program Office
Task 8 D2X Hub Proof-of-Concept Test Evaluation Report ndash Final | 13
Chapter 5 Experimental Analysis
Table 5-5 Hypothesis 5 Analysis Data Sample
TFHRC1 TFHRC2 TFHRC3
Advisory Alert Warning Advisory Alert Warning Advisory Alert Warning
True Distance (m) 7584 5545 4874 8552 5167 4515 7876 5827 5124
Speed (MPH) 2471 2523 2498 2595 2461 2433 2381 2590 2624
Expected Distance (m)
9942 5780 4910 10441 5588 4751 9580 5989 5222
Difference (m) 2358 235 036 1889 421 236 1704 162 098
For the complete analysis please refer to Table A-4 in Appendix A
Table 5-6 Total and Average Differences between Actual and Calculated Advisories Alerts and Warnings (VEA)
TFHRC Advisory Alert Warning
Total Difference (m) 10139 1376 971
Average Difference (m) 2028 275 194
Results There were no outliers (False Negatives) in the data analyzed Hence Hypothesis 5 is satisfied at a 100 level of confidence
US Department of Transportation Office of the Assistant Secretary for Research and Technology
Intelligent Transportation Systems Joint Program Office
Task 8 D2X Hub Proof-of-Concept Test Evaluation Report ndash Final | 14
Hypothesis 6 Mobile Devices can capture and process Vehicle BSMs and issue warnings in time for pedestrians to avoid imminent vehicle collision
Data logs verified MDEA Log ndash BSM Location GPS Location Advisory Display Alert Display and Warning Display
Analysis
Assessing the distance at which an Advisory Alert and Warning were issued based on the speed of the vehicle (in the BSM received by the mobile device)
Observations a Considering the TFHRC results the average difference in distance for MDEA logging of
Advisories Alerts and Warnings were on average 278 m 323 m and 334 m respectively b Latency of less than a second was observed on MDEA and VEA Logs
sݐݑݍܧ ݎ ݑݐ dݒݏwarningandalertݕݎ ݐݏ ݓݎݐ ݏ
ௗ௩௦௬= lowastݒ9
lowast ሻ05ݒ 25ሾሺൌ 11 lowast ቊ ௧ଶݒ
ሿ 2ሺ34ሻ
ቋ
ଶݒሿ 2ሺ56ሻ
ቋ
Where
lowast ሻ05ݒ 25ሾሺൌ 11 lowast ቊ ௪
is the advisory display distance (meters) ௗ௩௦௬
is the alert display distance (meters) ௧
is the warning display distance (meters) ௐ
ݒ is the velocity of the vehicle (meters per second)
Chapter 5 Experimental Analysis
TF 71 Run 2 - MDEA
US Department of Transportation Office of the Assistant Secretary for Research and Technology
Intelligent Transportation Systems Joint Program Office
Task 8 D2X Hub Proof-of-Concept Test Evaluation Report ndash Final | 15
Source Battelle Google Maps February 2017
Figure 5-2 Advisory Alert and Warning Distances with Respect to MDEA
Chapter 5 Experimental Analysis
Table 5-7 Hypothesis 6 Analysis Data Sample
TFHRC1 TFHRC2 TFHRC3
Advisory Alert Warning Advisory Alert Warning Advisory Alert Warning
True Distance (m) 8756 5320 4651 9928 5276 4624 8952 5595 4890
Speed (mph) 2290 2509 2487 2514 2447 2415 2304 2603 2617
Expected distance (m) 9213 5736 4883 10115 5546 4707 9270 6030 5205
Difference (m) 458 416 232 187 270 084 318 436 315
For the complete analysis please refer to Table A-5 in Appendix A
Table 5-8 Total and Average Differences between Actual and Calculated Advisories Alerts and Warnings (MDEA)
TFHRC Advisory Alert Warning
Total Difference (m) 1392 1617 1671
Average Difference (m) 278 323 334
Results There were no false alarms detected at neither of the TFHRCATP tests performed Hence Hypothesis 6 is satisfied at a 100 level of confidence
Issues Identified GPS Inaccuracy ndash Cross Track Distance Issue
The accuracy of GPS as per the US government claims is +- 4 m This error in GPS accuracy was balanced by increasing the cluster radius to 7 m for all the tests at TFHRC This modification in cluster radius increased the efficiency of pedestrian detection by closing out the difference in Cross Track Distancersquo
There were no false alarms detected at neither of the TFHRCATP tests performed
US Department of Transportation Office of the Assistant Secretary for Research and Technology
Intelligent Transportation Systems Joint Program Office
Task 8 D2X Hub Proof-of-Concept Test Evaluation Report ndash Final | 16
Chapter 5 Experimental Analysis
Source Battelle Google Maps February 2017
Figure 5-3 Cross Track Distance between Pedestrian and Vehicle Path
US Department of Transportation Office of the Assistant Secretary for Research and Technology
Intelligent Transportation Systems Joint Program Office
Task 8 D2X Hub Proof-of-Concept Test Evaluation Report ndash Final | 17
Chapter 5 Experimental Analysis
Hypothesis 7 MDEA Log ndash GPS Location SafeUnsafe Zone Status and MAP Message Contents
Data logs verified MDEA Log ndash GPS Location SafeUnsafe Zone Status and MAP Message Contents
Analysis
Analyzed the percentage of properly classified safeunsafe zone detections The device was placed in the roadway ndash mobile device location was properly classified if it positions itself in an unsafe zone
Observations User State Change from Safe to Unsafe (when placed 20 m in the roadway) and Unsafe to Safe (when placed 50 m from the roadway) were captured accurate and timely
Table 5-9 Hypothesis 7 Analysis Data Sample
TFHRC 1 TFHRC 2 TFHRC 3 TFHRC 4 TFHRC 5
User State Change Is Safe Icon False (2 m in the roadway)
111438 112533 114400 114801 115408
Properly Processed
User State Change Is Safe Icon True (5 m from the roadway)
111504 112619 114438 114829 115444
Properly Processed
For the complete analysis please refer to Table A-6 in Appendix A
US Department of Transportation Office of the Assistant Secretary for Research and Technology
Intelligent Transportation Systems Joint Program Office
Task 8 D2X Hub Proof-of-Concept Test Evaluation Report ndash Final | 18
Chapter 5 Experimental Analysis
Source Battelle Google Maps February 2017
Figure 5-4 Safe and Unsafe Zones at TFHRC Test Site
Results There were no outliers (False Negatives) in the data analyzed Hence Hypothesis 7 is satisfied at a 100 level of confidence
US Department of Transportation Office of the Assistant Secretary for Research and Technology
Intelligent Transportation Systems Joint Program Office
Task 8 D2X Hub Proof-of-Concept Test Evaluation Report ndash Final | 19
Chapter 5 Experimental Analysis
Hypothesis 8 amp 9 The VEA can coordinate taxi travel requests from an MDEA
Data logs verified MDEA Log ndash PMM Send Occurrence PMM contents PMM-RSP Receive Occurrence Coordination Status and PMM-Cancel Sent Occurrence
Analysis
Analyzed the percentage of PMM and PMM ndash Cancel messages properly processed by in-vehicle devices
Analyzed the percentage of PMM-RSP messages properly processed by mobile devices This analysis was performed for PMM Messages communicated through both DSRC and
Cellular
Observations 16 out of 204 checks had a failure during tests performed under ATP
Table 5-10 Hypothesis 8 amp 9 Analysis Data Sample
TFHRC 1 TFHRC 2 TFHRC 3 TFHRC 4 TFHRC 5
Analyze the percentage of PMM messages properly processed by in-vehicle devices
MDEA Log ndash PMM Send occurrence
Check Check Check Check Check
MDEA Log ndash PMM contents
All Present All Present All Present All Present All Present
Experimental Log ndash Information entered into
Mobile Device by Traveler
VEA Log ndash PMM Receive occurrence
Check Check Check Check Check
Analyze the percentage of PMM-RSP messages properly processed by mobile devices
Experimental Log ndash Driver Acceptance
VEA Log ndash Driver acceptance
Check Check Check Check Check
VEA Log ndash PMM-RSP Send occurrence
Check Check Check Check Check
MDEA Log ndash PMM-RSP Receive occurrence
Check Check Check Check Check
MDEA Log ndash Coordination Status
Check Check Check Check Check
Experimental Log ndash Coordination Success
Display
US Department of Transportation Office of the Assistant Secretary for Research and Technology
Intelligent Transportation Systems Joint Program Office
Task 8 D2X Hub Proof-of-Concept Test Evaluation Report ndash Final | 20
Chapter 5 Experimental Analysis
TFHRC 1 TFHRC 2 TFHRC 3 TFHRC 4 TFHRC 5
Analyze the percentage of PMM-Cancel messages properly processed by in-vehicle devices
MDEA Log ndash PMM-Cancel Sent Occurrence
Check Check Check Check Check
VEA Log ndash PMM-Cancel Received
Occurrence Check Check Check Check Check
For the complete analysis please refer to Table A-7 in Appendix A
Results Considering the tests performed at TFHRC Hypothesis 8 is satisfied at a 100 level of confidence However ATP tests satisfied the hypothesis at a confidence level of 9215
Issues Identified
Some issues observed for cloud communication during ATP testing at Columbus OH
Delay in Cloud PMM-cancel for VEA ndash 8 instances Adding a trip twice ndash 5 instances Some PMMs not being cancelled ndash 3 instances
All these issues were addressed prior to TFHRC tests
TFHRC tests did not have any of the above issues
US Department of Transportation Office of the Assistant Secretary for Research and Technology
Intelligent Transportation Systems Joint Program Office
Task 8 D2X Hub Proof-of-Concept Test Evaluation Report ndash Final | 21
Chapter 5 Experimental Analysis
Hypothesis 10 The traveler can receive arrival updates from a taxi or transit vehicle
Data logs verified VEA Log ndash PMM-ARRIVE Send Occurrence
MDEA Log ndash PMM-ARRIVE receive occurrence
Analysis
Analyzed the success rate of receiving a PMM-Arrive message via DSRC
Observations One test case at TFHRC failed due to equipment failure (CCP lost its location) All other tests satisfied the hypothesis
Table 5-11 Hypothesis 10 Analysis Data Sample
TFHRC 1
TFHRC 2
TFHRC 3
TFHRC 4
TFHRC 5
TFHRC 6
TFHRC 7
DSRC (Taxi)
Analyze the success rate of receiving a PMM-Arrive message
VEA Log ndash PMM-ARRIVE
Send occurrence
Fail Check Check Check Check Check Check
MDEA Log ndash PMM-ARRIVE
Receive occurrence
Fail Check Check Check Check Check Check
For the complete analysis please refer to Table A-8 in Appendix A
Results Considering the tests at TFHRC the hypothesis is satisfied at a confidence level of 8571 12 out of 14 tests were successful
US Department of Transportation Office of the Assistant Secretary for Research and Technology
Intelligent Transportation Systems Joint Program Office
Task 8 D2X Hub Proof-of-Concept Test Evaluation Report ndash Final | 22
Chapter 5 Experimental Analysis
Hypothesis 11 amp 12 The MDEA can detect when a traveler transitions from a pedestrian to a light duty vehicle or from a light duty vehicle to a pedestrian
Data logs verified MDEA Log ndash Travel Mode Status Change Experimental Log ndash Mode Transition Detection Log
Analysis 1 Assessed the change in ldquoTravel Mode Statusrdquo after the pedestrian enters the vehicle
(The threshold value for Travel Mode Status Change is 10 secs) 2 Assessed the false positive rate of transition detection
Observations Accelerometer tests on average took 75 secs and 44 secs to detect in-vehicle and on-foot respectively However Bluetooth beacon tests on a verage took 17 secs and 1 1 secs to detect in-vehicle and on-foot respectively This quantifies the unreliable nature of Bluetooth Beacons as used in this system
Table 5-12 Hypothesis 11 amp 12 Analysis Data Sample
Mode Detection Method On-foot to In-Vehicle Transition time (Sec)
In-Vehicle to On-foot Transition Time (Sec)
Accelerometer 75 44
Bluetooth Beacon 17 11
Results Hypothesis is proved as 100 confident during the accelerometer tests However none of the tests with Bluetooth Beacon satisfied the hypothesis (all false negatives)
US Department of Transportation Office of the Assistant Secretary for Research and Technology
Intelligent Transportation Systems Joint Program Office
Task 8 D2X Hub Proof-of-Concept Test Evaluation Report ndash Final | 23
Chapter 5 Experimental Analysis
Hypothesis 13 The MDEA can coordinate maintain and cancel travel with another MDEA via Wi-Fi Direct
Data logs verified MDEA (1) Log ndash Coordination Request Received Occurrence Coordination Request Contents Coordination Acceptance Sent Occurrence Coordination Acceptance Notification Coordination Heartbeat Received Occurrence Coordination Cancel Response Sent occurrence and Coordination Disband Sent occurrence
MDEA (2) Log ndash Coordination Request Sent Occurrence Coordination Confirmation received Occurrence Coordination Heartbeat Response Sent Occurrence Coordination Acceptance received Occurrence
Analysis 1 Determined the percentage of Coordination Request Acceptance Heartbeat Cancel and
Disband messages properly processed by mobile devices 2 Assessed the message contents for consistency
Observations This test is performed in a highly-controlled environment This means selection of specific devices and designating them with specific roles This approach was chosen due to poor Wi-Fi direct performance with our system that would have otherwise hindered the ability to conduct the testing and collect the necessary data
US Department of Transportation Office of the Assistant Secretary for Research and Technology
Intelligent Transportation Systems Joint Program Office
Task 8 D2X Hub Proof-of-Concept Test Evaluation Report ndash Final | 24
Chapter 5 Experimental Analysis
Table 5-13 Hypothesis 13 Analysis Data Sample
13117 2117
TFHRC 1
TFHRC 2
TFHRC 3
TFHRC 4
TFHRC 5
TFHRC 6
TFHRC 7
TFHRC 8
TFHRC 9
TFHRC 10
Coordination Request Sent by
Y
Fai
l T
rave
ler
Y c
ould
no
t joi
n th
e ad
-hoc
trav
el g
roup
40951 Check
F
ail
Tra
vele
r Y
cou
ld
not j
oin
the
ad-h
oc tr
avel
gro
up
Check Check Check Check Check Check
Coordination Request Received
by X check Check Check Check Check Check Check Check
Request Confirmed by X
check Check Check Check Check Check Check Check
Confirmation Received by Y
Coordination Request Sent by
Z
check Check Check Check Check Check Check Check
41047 Check Check Check Check Check Check Check
Coordination Request Received
by X check Check Check Check Check Check Check Check
Request Confirmed by X
check Check Check Check Check Check Check Check
Confirmation Received by Z
Coordination Heart Beat
Transmitted by Y amp Z
check Check Check Check Check Check Check Check
check Check Check Check Check Check Check Check
Heart Beat Response
received by X
Ride Arrived Messages
check Check Check Check Check Check Check Check
41303 Check Check Check Check Check Check Check
Coordination Cancel by walking
away Check Check Check Check Check This step not tested on this day
Coordination Cancel by Manual
request This step not tested on this day
Check Check Check Check Check
Disband Group after entering into
vehicle Check Check Check Check Check
For the complete analysis please refer to Table A-9 and Table A-10 in Appendix A
Results There were 30 outliers out of 198 checks (False Negatives) in the data analyzed Hence Hypothesis 13 is satisfied at an 8484 level of confidence
US Department of Transportation Office of the Assistant Secretary for Research and Technology
Intelligent Transportation Systems Joint Program Office
Task 8 D2X Hub Proof-of-Concept Test Evaluation Report ndash Final | 25
US Department of Transportation Office of the Assistant Secretary for Research and Technology
Intelligent Transportation Systems Joint Program Office
Task 8 D2X Hub Proof-of-Concept Test Evaluation Report ndash Final | 26
Chapter 5 Experimental Analysis
Hypothesis 14 The RSU can broadcast a SPaT and MAP message via DSRC that can be received by mobile devices
Data logs verified MDEA Log ndash BSM received and PSM send occurrences
Analysis 1 Determined the percentage of SPaT messages received by mobile devices when within
100 meters of RSE Assessed message contents for consistency 2 Determined the percentage of MAP messages received by mobile devices when within
100 meters of RSE Assessed message contents for consistency
Observations Considering test 5444 all the SPa T messages were transmitted and received at a rate of 1sec Similarly all the MAP messages were transmitted and received at a rate better than 5sec
Table 5-14 Hypothesis 14 Analysis Data Sample
ID Date Message
5 13117 163842 Dsrc Rx Spat id19
6 13117 163842 Dsrc Rx Map id18
9 13117 163843 Dsrc Rx Spat id19
10 13117 163843 Dsrc Rx Bsm Lat389546323 Long -771488295 Head 2713375 Sp 0
12 13117 163843 Dsrc Rx Bsm Lat389546138 Long -771483988 Head 2559125 Sp 0
13 13117 163844 Dsrc Rx Spat id19
14 13117 163844 Dsrc Rx Bsm Lat389546323 Long -771488297 Head 2713375 Sp 0
16 13117 163844 Dsrc Rx Bsm Lat389546138 Long -771483987 Head 2559125 Sp 0
17 13117 163844 Dsrc Rx Map id18
18 13117 163844 Dsrc Rx Bsm Lat389546322 Long -7714883 Head 2713375 Sp 0
20 13117 163845 Dsrc Rx Bsm Lat389546137 Long -771483987 Head 2559125 Sp 0
21 13117 163845 Dsrc Rx Bsm Lat389546322 Long -771488302 Head 2713375 Sp 0
22 13117 163845 Dsrc Rx Spat id19
23 13117 163845 Dsrc Rx Bsm Lat389546137 Long -771483987 Head 2559125 Sp 0
25 13117 163845 Dsrc Rx Bsm Lat38954632 Long -771488302 Head 2713375 Sp 0
26 13117 163846 Dsrc Rx Bsm Lat389546135 Long -771483987 Head 2559125 Sp 0
27 13117 163846 Dsrc Rx Spat id19
29 13117 163846 Dsrc Rx Bsm Lat389546318 Long -771488303 Head 2713375 Sp 0
31 13117 163846 Dsrc Rx Map id18
Results There were no outliers (False Negatives) in the data analyzed Hence Hypothesis 14 is satisfied at a 100 level of confidence
Chapter 5 Experimental Analysis
Hypothesis 15 The RSU can store all messages received via DSRC
Data logs verified MDEA Log ndash All Occurrences of messages sent via DSRC and Message Contents RSU Log ndash Message Received Occurrence and Message Contents
Analysis 1 Assessed the percentage of messages received from mobile devices within 100 meters of
RSE Assess message contents to make sure they are consistent
Observations a Considering the message logs from test cases 5411 5444 5471 there were instances
where PSMs were logged at a rate of less than 10sec Also there were test cases that had no reception of PSMs This clearly indicates the reception issues with RSU CCP unit One prime focus for the Large-Scale Field Test is to improve the reliability of the hardware associated with RSU
b The message contents in all the DSRC messages were consistent throughout the test logs
Table 5-15 Hypothesis 15 Analysis Data Sample
Date Time
Vehicle Range and Advisory Distance wrt
Speed Speed (mph)
In Range
Out of Range
Distance (m)
RSU Log PSM
Message RateSec
13117 101316 IsBsmClose Dist
975500061708885lt AdvDist 1024200201024
255 98 8
13117 101332 IsBsmClose Dist
570797651794001lt AdvDist 666000057888
173 57 6
13117 101340 IsBsmClose Dist
57448436831453lt AdvDist 601199821728
149 57 1
13117 101529 IsBsmClose Dist
975729907380225lt AdvDist 102240014976
254 98 0
13117 101538 IsBsmClose Dist
399317028326919lt AdvDist 102240014976
250 4 1
For the complete analysis please refer to Table A-1 in Appendix A
US Department of Transportation Office of the Assistant Secretary for Research and Technology
Intelligent Transportation Systems Joint Program Office
Task 8 D2X Hub Proof-of-Concept Test Evaluation Report ndash Final | 27
Chapter 5 Experimental Analysis
Table 5-16 Data Usage Statistics
17-Jan 18-Jan 19-Jan 20-Jan 31-Jan 1-Feb Average Maximum
Total Usage (MB) 3805 626 714 2713 4873 1355 984 2713
TMX core usage (MB) 271 450 468 1991 345 90 705 1991
of TMX usage 71 72 66 73 71 66 71 73
Results The hypothesis statement of RSU being able to store all messages received via DSRC is not satisfied at 100 level of confidence due to hardware issues
US Department of Transportation Office of the Assistant Secretary for Research and Technology
Intelligent Transportation Systems Joint Program Office
Task 8 D2X Hub Proof-of-Concept Test Evaluation Report ndash Final | 28
Chapter 6 Lessons Learned and Recommendations
Lessons Learned
The Lessons Learned from the Proof-of-Concept testing are summarized as follows
The ability to reliably generate transmit and receive messages between mobile devices and connected vehicles was demonstrated
The messages to incorporate mobile devices into the C V environment functioned as designed and provided the necessary data for the prototype mobility and safety applications
The prototype safety and mobility software applications functioned well (as designed)
Limitations of technology and hardware issues caused the majority of performance shortfalls
Mixed results were achieved for the various communication methods tested
a Cellular functioned well with our system
b Wi-Fi Direct connectivity was unreliable with our system
c DSRC hardware problems caused communication problems with our system
GPS accuracy limitations were observed as expected
Wi-Fi Direct Connectivity
The connection process was prone to failure at multiple points with no indication to the application why connection failed
TFHRC success rate was achieved by selecting specific devices that worked best for specific roles otherwise a failure rate gt50 would have been expected based on earlier testing
Canvasing of developer community found similar observations no solutions for our system
Wi-Fi Direct connection process requires authorization from the user of the target device in a real world environment such a request would most likely be denied if noticed at all
US Department of Transportation Office of the Assistant Secretary for Research and Technology
Intelligent Transportation Systems Joint Program Office
Task 8 D2X Hub Proof-of-Concept Test Evaluation Report ndash Final | 29
Chapter 6 Lessons Learned and Recommendations
DSRC Hardware
Common Computer Platform (CCP) Pre-production engineering units were used which were determined to have an impedance mismatch between the DSRC chip and RF connector that caused reduction of signal strength
Arada LocoMate ME There were occasional Bluetooth connection failures to mobile devices as well as occasional DSRC transmissionreception failures Longer term it is assumed that DSRC radios will be integrated into smartphones thus obviating the current issues
Recommendations
Based on outcomes of Proof-of-Concept Testing the following prototype system design changes are recommended to be implemented prior to the larger-scale prototype field test
Add Cellular-based communication for Travel Group coordination between mobile devices
New and improved CCP units will be used for the larger-scale field test
For in-vehicle detection use Accelerometer method as the most reliable option
US Department of Transportation Office of the Assistant Secretary for Research and Technology
Intelligent Transportation Systems Joint Program Office
Task 8 D2X Hub Proof-of-Concept Test Evaluation Report ndash Final | 30
APPENDIX A Comprehensive Data Analysis Tables
Note For all the analysis results depicted below the term ldquocheckrdquo refers to the ldquosuccessrdquo of desired action
Table A-1 Complete Data Analysis ndash Hypothesis 1 4 amp 15
Date Time Vehicle Range and Advisory
Distance wrt Speed Speed In
Range Out of
Range Distance
RSU Log PSM
Message RateSec
VEA Log PSM
Message Rate
1312017 101316 IsBsmClose Dist 975500061708885lt
AdvDist 1024200201024 255 X 98 8 10
1312017 101332 IsBsmClose Dist 570797651794001lt
AdvDist 666000057888 173 X 57 6 10
1312017 101340 IsBsmClose Dist 57448436831453lt
AdvDist 601199821728 149 X 57 1 10
1312017 101529 IsBsmClose Dist 975729907380225lt
AdvDist 102240014976 254 X 98 0 10
1312017 101538 IsBsmClose Dist 399317028326919lt
AdvDist 102240014976 250 X 4 1 10
1312017 101553 IsBsmClose Dist 600719107941917lt
AdvDist 70199987616 174 X 60 0 10
1312017 102029 IsBsmClose Dist 944643508928866lt
AdvDist 1008000141984 251 X 95 0 9
1312017 102048 IsBsmClose Dist 592561932680623lt
AdvDist 628200188352 156 X 59 0 9
US Department of Transportation Office of the Assistant Secretary for Research and Technology
Intelligent Transportation Systems Joint Program Office
Task 8 D2X Hub Proof-of-Concept Test Evaluation Report ndash Final | A-1
APPENDIX A Comprehensive Data Analysis Tables
Date Time Vehicle Range and Advisory
Distance wrt Speed Speed In
Range Out of Range Distance
RSU Log PSM
Message RateSec
VEA Log PSM
Message Rate
1312017 102054 IsBsmClose Dist 616348297460404lt
AdvDist 644399845056 160 X 62 3 11
1312017 102105 IsBsmClose Dist 871180496389495lt
AdvDist 1092600137376 247 X 87 4 9
1312017 102206 IsBsmClose Dist 977301610734722lt
AdvDist 1130400006912 295 X 98 0 10
1312017 102228 IsBsmClose Dist 577576034007057lt
AdvDist 60659997552 151 X 58 2 10
1312017 102332 IsBsmClose Dist 101193300977461lt
AdvDist 10386002088 258 X 101 10 10
1312017 102356 IsBsmClose Dist 595641466972855lt
AdvDist 660599904096 164 X 60 6 10
1312017 102623 IsBsmClose Dist 100217014111125lt
AdvDist 1024200201024 253 X 100 7 10
1312017 102650 IsBsmClose Dist 540919707235241lt
AdvDist 887399925984 221 X 54 0 10
1172017 111504 IsBsmClose Dist 100564061581794lt
AdvDist 1169999927712 291 X 101 10 10
1172017 112437 IsBsmClose Dist 992912014791515lt
AdvDist 10386002088 258 X 99 10 10
1172017 112837 IsBsmClose Dist 106684353810469lt
AdvDist 1076400078336 261 X 107 10 10
US Department of Transportation Office of the Assistant Secretary for Research and Technology
Intelligent Transportation Systems Joint Program Office
Task 8 D2X Hub Proof-of-Concept Test Evaluation Report ndash Final | A-2
APPENDIX A Comprehensive Data Analysis Tables
Date Time Vehicle Range and Advisory
Distance wrt Speed Speed In
Range Out of Range Distance
RSU Log PSM
Message RateSec
VEA Log PSM
Message Rate
1172017 113148 IsBsmClose Dist 1124753473133lt AdvDist
1186199986752 268 X 112 10 10
1172017 113332 IsBsmClose Dist 106022149777593lt
AdvDist 1126799904384 260 X 106 10 10
1172017 113336 IsBsmClose Dist 59429630331283lt
AdvDist 1196999892 298 X 59 10 10
1172017 113357 IsBsmClose Dist 657937887214709lt
AdvDist 1193400191808 297 X 66 10 10
1172017 113627 IsBsmClose Dist 965542357439439lt
AdvDist 1080000180864 260 X 97 10 10
1172017 113629 IsBsmClose Dist 821301583410616lt
AdvDist 1074600027072 270 X 82 10 10
1172017 113803 IsBsmClose Dist 994884887192582lt
AdvDist 104580001152 251 X 99 10 10
1172017 113811 IsBsmClose Dist 16809952777894lt
AdvDist 106200007056 257 X 17 10 10
1172017 114114 IsBsmClose Dist 948985801452811lt
AdvDist 986399929152 245 X 95 10 10
1172017 114133 IsBsmClose Dist 141255704529106lt
AdvDist 963000067392 242 X 14 10 10
1172017 114136 IsBsmClose Dist 377627357471613lt
AdvDist 977400075168 243 X 38 10 10
US Department of Transportation Office of the Assistant Secretary for Research and Technology
Intelligent Transportation Systems Joint Program Office
Task 8 D2X Hub Proof-of-Concept Test Evaluation Report ndash Final | A-3
APPENDIX A Comprehensive Data Analysis Tables
Date Time Vehicle Range and Advisory
Distance wrt Speed Speed In
Range Out of Range Distance
RSU Log PSM
Message RateSec
VEA Log PSM
Message Rate
1172017 114403 IsBsmClose Dist 114490146784404lt
AdvDist 1225799907552 266 X 114 10 10
1172017 114415 IsBsmClose Dist 280463490772458lt
AdvDist 71100013248 161 X 28 10 10
1172017 114735 IsBsmClose Dist 102043927314914lt
AdvDist 1040399857728 259 X 102 10 10
1172017 114755 IsBsmClose Dist 185020887331204lt
AdvDist 112499985312 275 X 19 10 10
1192017 35605 IsBsmClose Dist 107928079653642lt
AdvDist 1107000145152 272 X 108 9 9
1192017 35630 IsBsmClose Dist 99759104887202lt
AdvDist 1184399935488 294 X 100 10 10
1192017 35837 IsBsmClose Dist 110291146846666lt
AdvDist 115020016848 286 X 110 10 10
1192017 40057 IsBsmClose Dist 998997459961241lt
AdvDist 1260000076896 313 X 100 10 10
1192017 40300 IsBsmClose Dist 100209094247195lt
AdvDist 106919987328 260 X 100 10 10
1192017 40410 IsBsmClose Dist 100723184500334lt
AdvDist 1097999888832 273 X 101 6 10
1192017 41103 IsBsmClose Dist 977354295877856lt
AdvDist 1008000141984 251 X 98 10 10
US Department of Transportation Office of the Assistant Secretary for Research and Technology
Intelligent Transportation Systems Joint Program Office
Task 8 D2X Hub Proof-of-Concept Test Evaluation Report ndash Final | A-4
APPENDIX A Comprehensive Data Analysis Tables
Date Time Vehicle Range and Advisory
Distance wrt Speed Speed In
Range Out of Range Distance
RSU Log PSM
Message RateSec
VEA Log PSM
Message Rate
1192017 41311 IsBsmClose Dist 10190842581135lt
AdvDist 1040399857728 259 X 102 10 10
1192017 41423 IsBsmClose Dist 995536361906761lt
AdvDist 1009799790912 251 X 100 10 10
1192017 41534 IsBsmClose Dist 10075608603652lt
AdvDist 106919987328 264 X 101 10 10
US Department of Transportation Office of the Assistant Secretary for Research and Technology
Intelligent Transportation Systems Joint Program Office
Task 8 D2X Hub Proof-of-Concept Test Evaluation Report ndash Final | A-5
APPENDIX A Comprehensive Data Analysis Tables
Table A-2 Complete Data Analysis ndash Hypothesis 2
US Department of Transportation Office of the Assistant Secretary for Research and Technology
Intelligent Transportation Systems Joint Program Office
Task 8 D2X Hub Proof-of-Concept Test Evaluation Report ndash Final | A-6
Date Test
Number PSMs Generated by
Trav X and Trav Y Transition to In Group Trav Y PSM Ceased Only Trav X PSM
Received
1312017 TFHRC 1 111116 111240 Check 111305
1312017 TFHRC 2 Grouping Failed Grouping Failed Grouping Failed Grouping Failed
1312017 TFHRC 3 112346 112448 Check 112508
1312017 TFHRC 4 114208 114301 Check 114345
1312017 TFHRC 5 114609 114658 Check 114721
1312017 TFHRC 6 115222 115313 Check 115342
1182017 ATP 1 104400 104527 Check 104601
1182017 ATP 2 105356 105455 Check 105546
1182017 ATP 3 110059 110150 Check 110322
1182017 ATP 4 111222 111310 Check 111329
1182017 ATP 5 111515 111616 Check 111630
1182017 ATP 6 111823 111906 Check 111917
1182017 ATP 7 112116 112157 Check 112209
1182017 ATP 8 112814 112855 Check 112917
1182017 ATP 9 113142 113230 Check 113248
1182017 ATP 10 113501 113545 Check 113608
1192017 ATP 11 44728 44842 Check 45007
1192017 ATP 12 Radio Failure Test Terminated Radio Failure Test Terminated Radio Failure Test Terminated Radio Failure Test Terminated
1192017 ATP 13 45548 45637 Check 45728
1192017 ATP 14 45946 50047 Check 50107
1192017 ATP 15 50353 50444 Check 50513
1192017 ATP 16 50730 50823 Check 50839
APPENDIX A Comprehensive Data Analysis Tables
Table A-3 Complete Data Analysis ndash Hypothesis 3
US Department of Transportation Office of the Assistant Secretary for Research and Technology
Intelligent Transportation Systems Joint Program Office
Task 8 D2X Hub Proof-of-Concept Test Evaluation Report ndash Final | A-7
Date Description
MDEA not in Vehicle
MDEA Transmits
PSMs Time of MDEA
Mode Transition
MDEA Ceases Transmitting
PSMs
1312017 TFHRC 1 Check Check 0443101852 Check
1312017 TFHRC 2 Check Check 0445243056 Check
1312017 TFHRC 3 Check Check 0447569444 Check
1312017 TFHRC 4 Check Check 0448888889 Check
1312017 TFHRC 5 Check Check 045005787 Check
1312017 TFHRC 6 Check Check 0451666667 Check
1172017 ATP 1 Check Check 0501898148 Check
1172017 ATP 2 Check Check 0504201389 Check
1172017 ATP 3 Check Check 0506215278 Check
1172017 ATP 4 Check Check 0507858796 Check
1172017 ATP 5 Check Check 0508981481 Check
1172017 ATP 6 Check Check 0510219907 Check
1172017 ATP 7 Check Check 0511736111 Check
1172017 ATP 8 Check Check 05128125 Check
1172017 ATP 9 Check Check 0513831019 Check
1172017 ATP 10 Check Check 0514884259 Check
1172017 ATP 11 Check Check 0185590278 Check
1172017 ATP 12 Check Check 0187210648 Check
1172017 ATP 13 Check Check 0188425926 Check
1172017 ATP 14 Check Check 0190289352 Check
1172017 ATP 15 Check Check 0191863426 Check
APPENDIX A Comprehensive Data Analysis Tables
Table A-4 Complete Data Analysis ndash Hypothesis 5 (VEA)
Test Number
Type of Message
True Distance (m)
Speed (MPH)
Expected Distance (m)
Difference (m)
TFHRC1
Advisory 7584 2471 9942 2358
Alert 5545 2523 5780 235
Warning 4874 2498 4910 036
TFHRC2
Advisory 8552 2595 10441 1889
Alert 5167 2461 5588 421
Warning 4515 2433 4751 236
TFHRC3
Advisory 7876 2381 9580 1704
Alert 5827 2590 5989 162
Warning 5124 2624 5222 098
TFHRC4
Advisory 7529 2818 11338 3809
Alert 6047 2744 6482 435
Warning 5323 2714 5450 127
TFHRC5
Advisory 9292 2404 9672 380
Alert 5350 2423 5472 122
Warning 4081 2352 4556 475
ATP1
Advisory 000 000
Alert 000 000
Warning 000 000
ATP2
Advisory 5787 1644 6614 827
Alert 3074 1640 3289 215
Warning 2627 1640 2947 320
ATP3
Advisory 4204 1685 6779 2575
Alert 3300 1672 3370 070
Warning 2854 1658 2985 131
ATP4
Advisory 4296 1753 7053 2757
Alert 3346 1791 3679 333
Warning 2871 1755 3194 323
ATP5
Advisory 000 000
Alert 000 000
Warning 1069 1706 3088 2019
ATP6
Advisory 3632 1640 6598 2966
Alert 000 000
Warning 2770 1594 2850 080
US Department of Transportation Office of the Assistant Secretary for Research and Technology
Intelligent Transportation Systems Joint Program Office
Task 8 D2X Hub Proof-of-Concept Test Evaluation Report ndash Final | A-8
APPENDIX A Comprehensive Data Analysis Tables
Test Number
Type of Message
True Distance (m)
Speed (MPH)
Expected Distance (m)
Difference (m)
ATP7
Advisory 000 000
Alert 000 000
Warning 1919 1887 3483 1564
ATP8
Advisory 4492 1741 7005 2513
Alert 3113 1687 3409 296
Warning 2661 1680 3032 371
ATP9
Advisory 4694 1628 6550 1856
Alert 2991 1570 3113 122
Warning 2572 1549 2756 184
ATP10
Advisory 000 000
Alert 000 000
Warning 650 2505 4927 4277
ATP11
Advisory 000 000
Alert 000 000
Warning 1914 2398 4666 2752
ATP12
Advisory 000 000
Alert 000 000
Warning 460 2293 4415 3955
ATP13
Advisory 000 000
Alert 000 000
Warning 2732 2535 5001 2269
ATP14
Advisory 000 000
Alert 000 000
Warning 2358 2361 4577 2219
ATP15
Advisory 000 000
Alert 000 000
Warning 1107 2459 4814 3707
ATP16
Advisory 5668 1982 7974 2306
Alert 000 000
Warning 1502 1906 3525 2023
ATP17
Advisory 000 000
Alert 000 000
Warning 3183 2420 4720 1537
US Department of Transportation Office of the Assistant Secretary for Research and Technology
Intelligent Transportation Systems Joint Program Office
Task 8 D2X Hub Proof-of-Concept Test Evaluation Report ndash Final | A-9
Table A-5 Complete Data Analysis ndash Hypothesis 6 (MDEA)
Test Number
Type of Message
True Distance (m)
Speed (MPH)
Expected Distance (m)
Difference (m)
TFHRC1
Advisory 8756 2290 9213 457
Alert 5320 2509 5736 416
Warning 4651 2487 4883 232
TFHRC2
Advisory 9928 2514 10115 187
Alert 5276 2447 5546 270
Warning 4624 2415 4707 084
TFHRC3
Advisory 8952 2304 9270 318
Alert 5595 2603 6030 436
Warning 4890 2617 5205 315
TFHRC4
Advisory 9752 2514 10115 363
Alert 6290 2769 6564 274
Warning 4844 2693 5396 552
TFHRC5
Advisory 9613 2406 9680 067
Alert 5242 2420 5463 221
Warning 4080 2357 4568 488
ATP1
Advisory 5938 2183 8783 2845
Alert 4314 2120 4580 266
Warning 3644 2111 3989 345
ATP2
Advisory 6452 1641 6602 150
Alert 3296 1691 3419 123
Warning 2600 1601 2865 265
ATP3
Advisory 6212 1628 6550 338
Alert 3200 1655 3327 127
Warning 2707 1641 2949 242
ATP4
Advisory 6420 1646 6622 202
Alert 3300 1780 3650 350
Warning 2878 1704 3084 206
ATP5
Advisory 6673 1677 6747 074
Alert 3400 1847 3828 428
Warning 2972 1807 3307 335
ATP6
Advisory 6100 1628 6550 450
Alert 3100 1637 3281 181
Warning 2500 1597 2857 357
APPENDIX A Comprehensive Data Analysis Tables
US Department of Transportation Office of the Assistant Secretary for Research and Technology
Intelligent Transportation Systems Joint Program Office
Task 8 D2X Hub Proof-of-Concept Test Evaluation Report ndash Final | A-10
APPENDIX A Comprehensive Data Analysis Tables
Test Number
Type of Message
True Distance (m)
Speed (MPH)
Expected Distance (m)
Difference (m)
ATP7
Advisory 7500 1972 7934 434
Alert 3882 1914 4008 126
Warning 3400 1946 3614 214
ATP8
Advisory 6659 1744 7017 358
Alert 3263 1682 3396 133
Warning 2900 1682 3037 137
ATP9
Advisory 6605 1659 6675 070
Alert 2900 1556 3078 178
Warning 2365 1561 2781 416
ATP10
Advisory 9214 2491 10022 808
Alert 5859 2688 6301 442
Warning 5200 2644 5273 073
ATP11
Advisory 8485 2487 10006 1521
Alert 5376 2487 5668 292
Warning 4716 2483 4873 157
ATP12
Advisory 9001 2433 9789 788
Alert 5395 2420 5463 068
Warning 4103 2330 4503 400
ATP13
Advisory 8615 2559 10296 1681
Alert 000 000 000 000
Warning 4930 2581 5115 185
ATP14
Advisory 6119 2491 10022 3903
Alert 5500 2491 5681 181
Warning 3800 2402 4676 876
ATP15
Advisory 7546 2603 10473 2927
Alert 6000 2661 6215 215
Warning 3100 2603 5170 2070
ATP16
Advisory 7931 2089 8405 474
Alert 3995 1950 4106 111
Warning 3500 1923 3563 063
ATP17
Advisory 8243 2049 8244 001
Alert 5260 2465 5601 341
Warning 4718 2438 4763 045
US Department of Transportation Office of the Assistant Secretary for Research and Technology
Intelligent Transportation Systems Joint Program Office
Task 8 D2X Hub Proof-of-Concept Test Evaluation Report ndash Final | A-11
Table A-6 Complete Data Analysis ndash Hypothesis 7
Date Test
Number
User State Change Is
Safe Icon False
Properly Processed
User State Change Is
Safe Icon True
Properly Processed
1312017 TFHRC 1 111438 X 111504 X
1312017 TFHRC 3 112533 X 112619 X
1312017 TFHRC 4 114400 X 114438 X
1312017 TFHRC 5 114801 X 114829 X
1312017 TFHRC 6 115408 X 115444 X
1182017 ATP 1 105056 X 105116 X
1182017 ATP 2 105622 X 105656 X
1182017 ATP 3 110348 X 110436 X
1182017 ATP 4 111355 X 111417 X
1182017 ATP 5 111655 X 111717 X
1182017 ATP 6 111947 X 112007 X
1182017 ATP 7 112235 X 112305 X
1182017 ATP 8 112937 X 113013 X
1182017 ATP 9 113313 X 113353 X
1182017 ATP 10 113636 X 113708 X
1192017 ATP 11 45035 X 45057 X
1192017 ATP 13 45806 X 45828 X
1192017 ATP 14 50144 X 50202 X
1192017 ATP 15 50542 X 50600 X
1192017 ATP 16 50903 X 50929 X
APPENDIX A Comprehensive Data Analysis Tables
US Department of Transportation Office of the Assistant Secretary for Research and Technology
Intelligent Transportation Systems Joint Program Office
Task 8 D2X Hub Proof-of-Concept Test Evaluation Report ndash Final | A-12
APPENDIX A Comprehensive Data Analysis Tables
Table A-7 Complete Data Analysis ndash Hy pothesis 8 amp 9
US Department of Transportation Office of the Assistant Secretary for Research and Technology
Intelligent Transportation Systems Joint Program Office
Task 8 D2X Hub Proof-of-Concept Test Evaluation Report ndash Final | A-13
Test Number
Analyze the percentage of PMM messages properly processed by
in-vehicle devices Analyze the percentage of PMM-RSP messages
properly processed by mobile devices
Analyze the percentage of PMM-Cancel messages
properly processed by in-vehicle devices
MDEA Log ndash PMM Send
occurrence
MDEA Log ndash
PMM contents
VEA Log ndash PMM
Receive occurrence
VEA Log ndash Driver
acceptance
VEA Log ndash PMM-RSP
Send occurrence
MDEA Log ndash PMM-RSP
Receive occurrence
MDEA Log ndash Coordination
Status
MDEA Log ndash PMM-
Cancel Sent Occurrence
VEA Log ndash PMM-
Cancel Received
Occurrence
TFHRC 1 Check All Present Check Check Check Check Check Check Check
TFHRC 2 Check All Present Check Check Check Check Check Check Check
TFHRC 3 Check All Present Check Check Check Check Check Check Check
TFHRC 4 Check All Present Check Check Check Check Check Check Check
TFHRC 5 Check All Present Check Check Check Check Check Check Check
ATP 1 Check All Present Check Check Check Check Check Check Check
ATP 2 Check All Present Check Check Check Check Check Check Check
ATP 3 Check All Present Check Check Check Check Check Check Check
ATP 4 Check All Present Check Check Check Check Check Check Check
ATP 5 Check All Present Check Check Check Check Check Check Check
ATP 6 Check All Present Check Check Check Check Check Check Check
ATP 7 Check All Present Check Check Check Check Check Check Check
ATP 8 Check All Present Check Check Check Check Check Check Check
ATP 9 Check All Present Check Check Check Check Check Check Check
ATP 10 Check All Present Check Check Check Check Check Check Check
APPENDIX A Comprehensive Data Analysis Tables
Test Number
Analyze the percentage of PMM messages properly processed by
in-vehicle devices Analyze the percentage of PMM-RSP messages
properly processed by mobile devices
Analyze the percentage of PMM-Cancel messages
properly processed by in-vehicle devices
MDEA Log ndash PMM Send occurrence
MDEA Log ndash PMM
contents
VEA Log ndash PMM
Receive occurrence
VEA Log ndash Driver
acceptance
VEA Log ndash PMM-RSP
Send occurrence
MDEA Log ndash PMM-RSP
Receive occurrence
MDEA Log ndash Coordination
Status
MDEA Log ndash PMM-
Cancel Sent Occurrence
VEA Log ndash PMM-
Cancel Received
Occurrence
ATP 11 Check All Present Check Check Check Check Check Check Check
ATP 12 Check All Present Check Check Check Check Check Check Check
ATP 13 Check All Present Check Check Check Check Check Check Check
ATP 14 Check All Present Check Check Check Check Check Check Check
ATP 15 Check All Present Check Check Check Check Check Check Check
ATP 16 Check All Present Check Check Check Check Check Check Check
ATP 17 Check All Present Check Check Check Check Check Check Check
US Department of Transportation Office of the Assistant Secretary for Research and Technology
Intelligent Transportation Systems Joint Program Office
Task 8 D2X Hub Proof-of-Concept Test Evaluation Report ndash Final | A-14
Table A-8 Complete Data Analysis ndash Hy pothesis 10
Date Test Number
Analyze the Success Rate of Receiving a PMM-Arrive Message
VEA Log ndash PMM-ARRIVE Send Occurrence MDEA Log ndash PMM-ARRIVE Receive Occurrence
1312017 TFHRC 1 Fail Fail
1312017 TFHRC 2 Check Check
1312017 TFHRC 3 Check Check
1312017 TFHRC 4 Check Check
1312017 TFHRC 5 Check Check
1312017 TFHRC 6 Check Check
1312017 TFHRC 7 Check Check
1182017 ATP 1 Not Available Check
1182017 ATP 2 Not Available Check
1182017 ATP 3 Not Available Check
1182017 ATP 4 Not Available Check
1182017 ATP 5 Not Available Check
1182017 ATP 6 Not Available Check
1182017 ATP 7 Not Available Check
1182017 ATP 8 Not Available Check
1182017 ATP 9 Not Available Check
1182017 ATP 10 Not Available Check
1202017 ATP 11 Check Check
1202017 ATP 12 Check Check
1202017 ATP 13 Check Check
1202017 ATP 14 Check Check
1202017 ATP 15 Check Check
APPENDIX A Comprehensive Data Analysis Tables
US Department of Transportation Office of the Assistant Secretary for Research and Technology
Intelligent Transportation Systems Joint Program Office
Task 8 D2X Hub Proof-of-Concept Test Evaluation Report ndash Final | A-15
APPENDIX A Comprehensive Data Analysis Tables
Table A-9 Complete Data Analysis ndash Hypothesis 13 (Part A)
US Department of Transportation Office of the Assistant Secretary for Research and Technology
Intelligent Transportation Systems Joint Program Office
Task 8 D2X Hub Proof-of-Concept Test Evaluation Report ndash Final | A-16
Test Number
Coordination Request Sent
by Y
Coordination Request
Received by X
Request Confirmed
by X Confirmation Received by Y
Coordination Request Sent
by Z
Coordination Request
Received by X
Request Confirmed
by X Confirmation Received by Z
Coordination Heart Beat
Transmitted by Y amp Z
Heart Beat Response received
by X
Ride Arrived
Messages
TFHRC 1
Fail Traveler Y could not join the ad-hoc travel group
TFHRC 2
Check check check check 41047 check check check check check 41303
TFHRC 3
Check Check Check Check Check Check Check Check Check Check Check
TFHRC 4
Fail Traveler Y could not join the ad-hoc travel group
TFHRC 5
Check Check Check Check Check Check Check Check Check Check Check
TFHRC 6
Check Check Check Check Check Check Check Check Check Check Check
TFHRC 7
Check Check Check Check Check Check Check Check Check Check Check
TFHRC 8
Check Check Check Check Check Check Check Check Check Check Check
TFHRC 9
Check Check Check Check Check Check Check Check Check Check Check
TFHRC 10
Check Check Check Check Check Check Check Check Check Check Check
ATP 1 Check Check Check Check Check Check Check Check Check Check Check
ATP 2 Check Check Check Check Check Check Check Check Check Check Check
Test Number
Coordination Request Sent
by Y
Coordination Request
Received by X
Request Confirmed
by X Confirmation Received by Y
Coordination Request Sent
by Z
Coordination Request
Received by X
Request Confirmed
by X Confirmation Received by Z
Coordination Heart Beat
Transmitted by Y amp Z
Heart Beat Response received
by X
Ride Arrived
Messages
ATP 3 Check Check Check Check Check Check Check Check Check Check Check
ATP 4 Check Check Check Check Check Check Check Check Check Check Check
ATP 5 Check Check Check Check Check Check Check Check Check Check Check
ATP 6 Check Check Check Check Check Check Check Check Check Check Check
ATP 7 Check Check Check Check Check Check Check Check Check Check No ride
arrives received
ATP 8 Check Check Check Check Check Check Check Check Check Check Check
ATP 9 Check Check Check Check Check Check Check Check Check Check No ride
arrives received
ATP 10 Check Check Check Check Check Check Check Check Check Check Check
ATP 11 Check Check Check Check Check Check Check Check Check Check Check
ATP 12 Check Check Check Check Check Check Check Check Check Check No ride
arrives received
ATP 13 Check Check Check Check Check Check Check Check Check Check Check
ATP 14 Check Check Check Check Check Check Check Check Check Check Check
ATP 15 Check Check Check Check Check Check Check Check Check Check Check
APPENDIX A Comprehensive Data Analysis Tables
US Department of Transportation Office of the Assistant Secretary for Research and Technology
Intelligent Transportation Systems Joint Program Office
Task 8 D2X Hub Proof-of-Concept Test Evaluation Report ndash Final | A-17
APPENDIX A Comprehensive Data Analysis Tables
Table A-10 Complete Data Analysis ndash Hypothesis 13 (Part B)
US Department of Transportation Office of the Assistant Secretary for Research and Technology
Intelligent Transportation Systems Joint Program Office
Task 8 D2X Hub Proof-of-Concept Test Evaluation Report ndash Final | A-18
Test Number Coordination Cancel by
Walking Away Coordination Cancel by
Manual Request Disband Group after
Entering into Vehicle
TFHRC 1 Check This step not tested on this day
TFHRC 2 Check This step not tested on this day
TFHRC 3 Check This step not tested on this day
TFHRC 4 Check This step not tested on this day
TFHRC 5 Check This step not tested on this day
TFHRC 6 This step not tested on this day Check Check
TFHRC 7 This step not tested on this day Check Check
TFHRC 8 This step not tested on this day Check Check
TFHRC 9 This step not tested on this day Check Check
TFHRC 10 This step not tested on this day Check Check
ATP 1 Check Check Check
ATP 2 Check Check Check
ATP 3 Check Check Check
ATP 4 Check Check Check
ATP 5 Check Check Check
ATP 6 Check Check Check
ATP 7 Check Check Check
ATP 8 Check Check Check
ATP 9 Check Check Check
APPENDIX A Comprehensive Data Analysis Tables
Test Number Coordination Cancel by
Walking Away Coordination Cancel by
Manual Request Disband Group after Entering into Vehicle
ATP 10 Check Check Check
ATP 11 Fail Could not cancel by distance Check Check
ATP 12 Check Check Check
ATP 13 Fail Could not cancel by distance Check Check
ATP 14 Check Check Check
ATP 15 Check Check Check
US Department of Transportation Office of the Assistant Secretary for Research and Technology
Intelligent Transportation Systems Joint Program Office
Task 8 D2X Hub Proof-of-Concept Test Evaluation Report ndash Final | A-19
APPENDIX A Comprehensive Data Analysis Tables
APPENDIX B Acronyms and Abbreviations
ATG Ad-Hoc Travel Group
ATP Acceptance Test Plan
BSM Basic Safety Message
CCP Common Computing Platform
CV Connected Vehicle
DSRC Dedicated Short Range Communications
EPS Experimental Prototype System
FHWA Federal Highway Administration
FR Functional Requirement
ITS Intelligent Transportation Systems
LDV Light-Duty Vehicle
MAP Map Data
MDEA Mobile Device Experimental Application
MGL Message Logging
OBU On-board Unit
PMM Personal Mobility Message
PMM-ARRIVE Personal Mobility Message Arrival Message
PMM-CANCEL Personal Mobility Message Cancel Message
PMM-RSP Personal Mobility Message Response Message
PR Performance Requirement
PSM Personal Safety Message
REA Roadside Experimental Application
RSU Roadside Unit
SFY Safety
SIR System Interface Requirement
SMP SPaT and MAP
SPaT Signal Phasing and Timing
SyRS System Requirements Specifications
TFHRC Turner-Fairbank Highway Research Center
US DOT US Department of Transportation
US Department of Transportation Office of the Assistant Secretary for Research and Technology
Intelligent Transportation Systems Joint Program Office
Task 8 D2X Hub Proof-of-Concept Test Evaluation Report ndash Final |B-1
VEA Vehicle Experimental Application
Wi-Fi Wireless Fidelity
APPENDIX B Acronyms and Abbreviations
US Department of Transportation Office of the Assistant Secretary for Research and Technology
Intelligent Transportation Systems Joint Program Office
Task 8 D2X Hub Proof-of-Concept Test Evaluation Report ndash Final | B-2
APPENDIX C Terms and Definitions
Basic Safety Message (BSM)
Connected vehicle message type which contains vehicle safety-related information that is broadcast to surrounding vehicles
Bluetooth Short range wireless technology used to exchange data between enabled devices
Cellular Uses short-range radio stations to cover areas of communication
Connected Vehicle A vehicle that can communicate with other vehicles and infrastructure via communication media such as DSRC Wi-Fi cellular or Bluetooth
Coordinated Messages are coordinated when two or more mobile devices have establish a travel group based on the same origin destination and
time and function as a single cohesive senderrecipient
CV Inspector An application that verifies if the Mobile Device is broadcasting messages to Connected Vehicles
Destination The end point of a travelerrsquos trip
DSRC Dedicated Short-Range Communications a low-latency high-reliability two-way communications tool used for sending transportation safety
messages
Light-Duty Vehicle Of or relating to vehicles that way less than 4000 lbs
Message Type Type of personal safety or personal mobility message that is transmitted based on the technology used and level of coordination available
Personal Mobility Message (PMM)
Similar to PDM message intended for the exchange of mobility messages between individual travelers and vehiclesinfrastructure via
mobile device
Personal Safety Message (PSM)
Similar to BSM message intended to transmit low-latency urgent safety messages between individual travelers and vehiclesinfrastructure via
mobile device
Test Case A set of conditions or variables that a Tester can determine if system meets requirements
Transit Vehicle Large vehicles mainly used for public transportation as well as support services
Transmitting The state in which a traveler has opted in and is sendingreceiving messages via mobile device
Uncoordinated Messages are uncoordinated when travel groups are not established (see coordinated definition)
Wi-Fi Local area wireless technology that allows enabled devices to connect to the Internet
APPENDIX A Comprehensive Data Analysis Tables
US Department of Transportation Office of the Assistant Secretary for Research and Technology
Intelligent Transportation Systems Joint Program Office
Task 8 D2X Hub Proof-of-Concept Test Evaluation Report ndash Final |C-1
ITS Joint Program Office-HOIT 1200 New Jersey Avenue SE
Washington DC 20590
Toll-Free ldquoHelp Linerdquo 866-367-7487 wwwitsdotgov
FHWA-JPO-18-263
- Structure Bookmarks
-
- Sharing Data between Mobile Devices Connected Vehicles and Infrastructure Task 8 D2X Hub Proof-of-Concept Test Evaluation Report wwwitsdotgovindexhtm Final Report mdash October 25 2017 FHWA-JPO-18-623
- Revision History
- Table of Contents
- Chapter 1 Scope
- Chapter 2 Referenced Documents
- Chapter 3 Test Conduct
- Chapter 4 Experimental Analysis Results Summary
- Chapter 5 Experimental Analysis
- Chapter 6 Lessons Learned and Recommendations
- APPENDIX A Comprehensive Data Analysis Tables
- APPENDIX B Acronyms and Abbreviations
- APPENDIX C Terms and Definitions
-

Chapter 5 Experimental Analysis
Hypothesis 3 MDEA Log ndash Travel Mode Status PSM send occurrences
Data logs verified MDEA Log ndash BSM received and PSM send occurrences
Analysis
Determination of mobile device travel mode status Analysis of PSMs sent before and after transition of travel mode (on-foot and In-vehicle)
Observations All the test logs indicate that the PSMs were ceased after the MDEA transitioned its travel mode to In-vehicle
Table 5-3 Hypothesis 3 Analysis Data Sample
Description Test Number
TFHRC 1 TFHRC 2 TFHRC 3 TFHRC 4 TFHRC 5 TFHRC 6
MDEA not in vehicle Check Check Check Check Check Check
MDEA Transmits PSMs
Check Check Check Check Check Check
Time of MDEA Mode Transition
103804 104109 104430 104624 104805 105024
MDEA Ceases Transmitting PSMs
Check Check Check Check Check Check
For the complete analysis please refer to Table A-3 in Appendix A
Results There were no outliers (False Negatives) in the data analyzed Hence Hypothesis 3 is satisfied at a 100 level of confidence
US Department of Transportation Office of the Assistant Secretary for Research and Technology
Intelligent Transportation Systems Joint Program Office
Task 8 D2X Hub Proof-of-Concept Test Evaluation Report ndash Final | 11
US Department of Transportation Office of the Assistant Secretary for Research and Technology
Intelligent Transportation Systems Joint Program Office
Task 8 D2X Hub Proof-of-Concept Test Evaluation Report ndash Final | 12
Chapter 5 Experimental Analysis
Hypothesis 4 The Mobile Device can broadcast a PSM a radius of 250 meters 10 Hz under clear unobstructed conditions regardless of where the mobile device is located on the pedestrianrsquos person or clothing
Data logs verified VEA Log ndash PSM receive occurrences at a d istance of 10 m 50 m 100 m
Analysis
The rate at which PSMs were received by the RSU had been assessed The mobile device was placed in multiple locations on the pedestrian including in-hand in-pocket and in a backpack
Observations Due to DSRC limitations in the CCPs tests could not be performed beyond 100 m range Considering the RSU logging issues VEA Logs were used to analyze PSM broadcasting capacity of MDEA All the tests logged PSMs at a ra te o f 10sec Therefore 150 200 250 300 m radius could no t be a nalyzed Only three (10 50 and 100m) out of seven (10 50 100 150 200 250 and 300 m) cases were tested which resulted in a 43 Level of Confidence
Table 5-4 Hypothesis 4 Analysis Data Sample
Date Time
Vehicle Range and Advisory Distance wrt Speed
Speed (mph)
In Range
Out of Range
True Distance (m)
VEA Log PSM Message Rate
13117 101316 IsBsmClose Dist 975500061708885lt AdvDist 1024200201024
255 98 10
13117 101332 IsBsmClose Dist 570797651794001lt AdvDist 666000057888
173 57 10
13117 101340 IsBsmClose Dist 57448436831453lt AdvDist 601199821728
149 57 10
13117 101529 IsBsmClose Dist 975729907380225lt AdvDist 102240014976
254 98 10
13117 101538 IsBsmClose Dist 399317028326919lt AdvDist 102240014976
250 4 10
For the complete analysis please refer to Table A-1 in Appendix A
Results Due to the DSRC limitations the radius was limited to 100 m Hence Hypothesis 4 is satisfied at a 43 level of confidence
Chapter 5 Experimental Analysis
Hypothesis 5 Vehicles OBUs can capture and process Mobile Device PSMs and issue warnings at sufficient distance for drivers to avoid imminent pedestrian collision
Data logs verified VEA Log ndash PSM Location GPS Location Advisory Display Alert Display and Warning Display
Analysis
Assessing the distance at which an Advisory Alert and Warning were issued based on the speed of the vehicle (in the VEA Log)
Observations a Considering TFHRC tests the average difference in distance for VEA Logging of Advisories
Alerts and Warnings were on average 2028 m 275 m and 194 m respectively b The higher difference in advisory was due to the delay in the time between VEA deciding to
send PSM and Arada sending a PSM c Latency of less than a second was observed between PSM received and the message
display time on MDEA and VEA Logs
sݐݑݍܧ ݎ ݑݐ dݒݏwarningandalertݕݎ ݐݏ ݓݎݐ ݏ
ௗ௩௦௬= lowastݒ9
lowast ሻ05ݒ 25ሾሺൌ 11 lowast ቊ ௧ଶݒ
ሿ 2ሺ34ሻ
ቋ
Where
lowast ሻ05ݒ 25ሾሺൌ 11 lowast ቊ ௪
is the advisory display distance (meters) ௗ௩௦௬
is the alert display distance (meters) ௧
is the warning display distance (meters) ௐ
ଶݒሿ 2ሺ56ሻ
ቋ
ݒ is the velocity of the vehicle (meters per second)
TF 71 Run 2 - VEA
Source Battelle Google Maps February 2017
Figure 5-1 Advisory Alert and Warning Distances with Respect to VEA
US Department of Transportation Office of the Assistant Secretary for Research and Technology
Intelligent Transportation Systems Joint Program Office
Task 8 D2X Hub Proof-of-Concept Test Evaluation Report ndash Final | 13
Chapter 5 Experimental Analysis
Table 5-5 Hypothesis 5 Analysis Data Sample
TFHRC1 TFHRC2 TFHRC3
Advisory Alert Warning Advisory Alert Warning Advisory Alert Warning
True Distance (m) 7584 5545 4874 8552 5167 4515 7876 5827 5124
Speed (MPH) 2471 2523 2498 2595 2461 2433 2381 2590 2624
Expected Distance (m)
9942 5780 4910 10441 5588 4751 9580 5989 5222
Difference (m) 2358 235 036 1889 421 236 1704 162 098
For the complete analysis please refer to Table A-4 in Appendix A
Table 5-6 Total and Average Differences between Actual and Calculated Advisories Alerts and Warnings (VEA)
TFHRC Advisory Alert Warning
Total Difference (m) 10139 1376 971
Average Difference (m) 2028 275 194
Results There were no outliers (False Negatives) in the data analyzed Hence Hypothesis 5 is satisfied at a 100 level of confidence
US Department of Transportation Office of the Assistant Secretary for Research and Technology
Intelligent Transportation Systems Joint Program Office
Task 8 D2X Hub Proof-of-Concept Test Evaluation Report ndash Final | 14
Hypothesis 6 Mobile Devices can capture and process Vehicle BSMs and issue warnings in time for pedestrians to avoid imminent vehicle collision
Data logs verified MDEA Log ndash BSM Location GPS Location Advisory Display Alert Display and Warning Display
Analysis
Assessing the distance at which an Advisory Alert and Warning were issued based on the speed of the vehicle (in the BSM received by the mobile device)
Observations a Considering the TFHRC results the average difference in distance for MDEA logging of
Advisories Alerts and Warnings were on average 278 m 323 m and 334 m respectively b Latency of less than a second was observed on MDEA and VEA Logs
sݐݑݍܧ ݎ ݑݐ dݒݏwarningandalertݕݎ ݐݏ ݓݎݐ ݏ
ௗ௩௦௬= lowastݒ9
lowast ሻ05ݒ 25ሾሺൌ 11 lowast ቊ ௧ଶݒ
ሿ 2ሺ34ሻ
ቋ
ଶݒሿ 2ሺ56ሻ
ቋ
Where
lowast ሻ05ݒ 25ሾሺൌ 11 lowast ቊ ௪
is the advisory display distance (meters) ௗ௩௦௬
is the alert display distance (meters) ௧
is the warning display distance (meters) ௐ
ݒ is the velocity of the vehicle (meters per second)
Chapter 5 Experimental Analysis
TF 71 Run 2 - MDEA
US Department of Transportation Office of the Assistant Secretary for Research and Technology
Intelligent Transportation Systems Joint Program Office
Task 8 D2X Hub Proof-of-Concept Test Evaluation Report ndash Final | 15
Source Battelle Google Maps February 2017
Figure 5-2 Advisory Alert and Warning Distances with Respect to MDEA
Chapter 5 Experimental Analysis
Table 5-7 Hypothesis 6 Analysis Data Sample
TFHRC1 TFHRC2 TFHRC3
Advisory Alert Warning Advisory Alert Warning Advisory Alert Warning
True Distance (m) 8756 5320 4651 9928 5276 4624 8952 5595 4890
Speed (mph) 2290 2509 2487 2514 2447 2415 2304 2603 2617
Expected distance (m) 9213 5736 4883 10115 5546 4707 9270 6030 5205
Difference (m) 458 416 232 187 270 084 318 436 315
For the complete analysis please refer to Table A-5 in Appendix A
Table 5-8 Total and Average Differences between Actual and Calculated Advisories Alerts and Warnings (MDEA)
TFHRC Advisory Alert Warning
Total Difference (m) 1392 1617 1671
Average Difference (m) 278 323 334
Results There were no false alarms detected at neither of the TFHRCATP tests performed Hence Hypothesis 6 is satisfied at a 100 level of confidence
Issues Identified GPS Inaccuracy ndash Cross Track Distance Issue
The accuracy of GPS as per the US government claims is +- 4 m This error in GPS accuracy was balanced by increasing the cluster radius to 7 m for all the tests at TFHRC This modification in cluster radius increased the efficiency of pedestrian detection by closing out the difference in Cross Track Distancersquo
There were no false alarms detected at neither of the TFHRCATP tests performed
US Department of Transportation Office of the Assistant Secretary for Research and Technology
Intelligent Transportation Systems Joint Program Office
Task 8 D2X Hub Proof-of-Concept Test Evaluation Report ndash Final | 16
Chapter 5 Experimental Analysis
Source Battelle Google Maps February 2017
Figure 5-3 Cross Track Distance between Pedestrian and Vehicle Path
US Department of Transportation Office of the Assistant Secretary for Research and Technology
Intelligent Transportation Systems Joint Program Office
Task 8 D2X Hub Proof-of-Concept Test Evaluation Report ndash Final | 17
Chapter 5 Experimental Analysis
Hypothesis 7 MDEA Log ndash GPS Location SafeUnsafe Zone Status and MAP Message Contents
Data logs verified MDEA Log ndash GPS Location SafeUnsafe Zone Status and MAP Message Contents
Analysis
Analyzed the percentage of properly classified safeunsafe zone detections The device was placed in the roadway ndash mobile device location was properly classified if it positions itself in an unsafe zone
Observations User State Change from Safe to Unsafe (when placed 20 m in the roadway) and Unsafe to Safe (when placed 50 m from the roadway) were captured accurate and timely
Table 5-9 Hypothesis 7 Analysis Data Sample
TFHRC 1 TFHRC 2 TFHRC 3 TFHRC 4 TFHRC 5
User State Change Is Safe Icon False (2 m in the roadway)
111438 112533 114400 114801 115408
Properly Processed
User State Change Is Safe Icon True (5 m from the roadway)
111504 112619 114438 114829 115444
Properly Processed
For the complete analysis please refer to Table A-6 in Appendix A
US Department of Transportation Office of the Assistant Secretary for Research and Technology
Intelligent Transportation Systems Joint Program Office
Task 8 D2X Hub Proof-of-Concept Test Evaluation Report ndash Final | 18
Chapter 5 Experimental Analysis
Source Battelle Google Maps February 2017
Figure 5-4 Safe and Unsafe Zones at TFHRC Test Site
Results There were no outliers (False Negatives) in the data analyzed Hence Hypothesis 7 is satisfied at a 100 level of confidence
US Department of Transportation Office of the Assistant Secretary for Research and Technology
Intelligent Transportation Systems Joint Program Office
Task 8 D2X Hub Proof-of-Concept Test Evaluation Report ndash Final | 19
Chapter 5 Experimental Analysis
Hypothesis 8 amp 9 The VEA can coordinate taxi travel requests from an MDEA
Data logs verified MDEA Log ndash PMM Send Occurrence PMM contents PMM-RSP Receive Occurrence Coordination Status and PMM-Cancel Sent Occurrence
Analysis
Analyzed the percentage of PMM and PMM ndash Cancel messages properly processed by in-vehicle devices
Analyzed the percentage of PMM-RSP messages properly processed by mobile devices This analysis was performed for PMM Messages communicated through both DSRC and
Cellular
Observations 16 out of 204 checks had a failure during tests performed under ATP
Table 5-10 Hypothesis 8 amp 9 Analysis Data Sample
TFHRC 1 TFHRC 2 TFHRC 3 TFHRC 4 TFHRC 5
Analyze the percentage of PMM messages properly processed by in-vehicle devices
MDEA Log ndash PMM Send occurrence
Check Check Check Check Check
MDEA Log ndash PMM contents
All Present All Present All Present All Present All Present
Experimental Log ndash Information entered into
Mobile Device by Traveler
VEA Log ndash PMM Receive occurrence
Check Check Check Check Check
Analyze the percentage of PMM-RSP messages properly processed by mobile devices
Experimental Log ndash Driver Acceptance
VEA Log ndash Driver acceptance
Check Check Check Check Check
VEA Log ndash PMM-RSP Send occurrence
Check Check Check Check Check
MDEA Log ndash PMM-RSP Receive occurrence
Check Check Check Check Check
MDEA Log ndash Coordination Status
Check Check Check Check Check
Experimental Log ndash Coordination Success
Display
US Department of Transportation Office of the Assistant Secretary for Research and Technology
Intelligent Transportation Systems Joint Program Office
Task 8 D2X Hub Proof-of-Concept Test Evaluation Report ndash Final | 20
Chapter 5 Experimental Analysis
TFHRC 1 TFHRC 2 TFHRC 3 TFHRC 4 TFHRC 5
Analyze the percentage of PMM-Cancel messages properly processed by in-vehicle devices
MDEA Log ndash PMM-Cancel Sent Occurrence
Check Check Check Check Check
VEA Log ndash PMM-Cancel Received
Occurrence Check Check Check Check Check
For the complete analysis please refer to Table A-7 in Appendix A
Results Considering the tests performed at TFHRC Hypothesis 8 is satisfied at a 100 level of confidence However ATP tests satisfied the hypothesis at a confidence level of 9215
Issues Identified
Some issues observed for cloud communication during ATP testing at Columbus OH
Delay in Cloud PMM-cancel for VEA ndash 8 instances Adding a trip twice ndash 5 instances Some PMMs not being cancelled ndash 3 instances
All these issues were addressed prior to TFHRC tests
TFHRC tests did not have any of the above issues
US Department of Transportation Office of the Assistant Secretary for Research and Technology
Intelligent Transportation Systems Joint Program Office
Task 8 D2X Hub Proof-of-Concept Test Evaluation Report ndash Final | 21
Chapter 5 Experimental Analysis
Hypothesis 10 The traveler can receive arrival updates from a taxi or transit vehicle
Data logs verified VEA Log ndash PMM-ARRIVE Send Occurrence
MDEA Log ndash PMM-ARRIVE receive occurrence
Analysis
Analyzed the success rate of receiving a PMM-Arrive message via DSRC
Observations One test case at TFHRC failed due to equipment failure (CCP lost its location) All other tests satisfied the hypothesis
Table 5-11 Hypothesis 10 Analysis Data Sample
TFHRC 1
TFHRC 2
TFHRC 3
TFHRC 4
TFHRC 5
TFHRC 6
TFHRC 7
DSRC (Taxi)
Analyze the success rate of receiving a PMM-Arrive message
VEA Log ndash PMM-ARRIVE
Send occurrence
Fail Check Check Check Check Check Check
MDEA Log ndash PMM-ARRIVE
Receive occurrence
Fail Check Check Check Check Check Check
For the complete analysis please refer to Table A-8 in Appendix A
Results Considering the tests at TFHRC the hypothesis is satisfied at a confidence level of 8571 12 out of 14 tests were successful
US Department of Transportation Office of the Assistant Secretary for Research and Technology
Intelligent Transportation Systems Joint Program Office
Task 8 D2X Hub Proof-of-Concept Test Evaluation Report ndash Final | 22
Chapter 5 Experimental Analysis
Hypothesis 11 amp 12 The MDEA can detect when a traveler transitions from a pedestrian to a light duty vehicle or from a light duty vehicle to a pedestrian
Data logs verified MDEA Log ndash Travel Mode Status Change Experimental Log ndash Mode Transition Detection Log
Analysis 1 Assessed the change in ldquoTravel Mode Statusrdquo after the pedestrian enters the vehicle
(The threshold value for Travel Mode Status Change is 10 secs) 2 Assessed the false positive rate of transition detection
Observations Accelerometer tests on average took 75 secs and 44 secs to detect in-vehicle and on-foot respectively However Bluetooth beacon tests on a verage took 17 secs and 1 1 secs to detect in-vehicle and on-foot respectively This quantifies the unreliable nature of Bluetooth Beacons as used in this system
Table 5-12 Hypothesis 11 amp 12 Analysis Data Sample
Mode Detection Method On-foot to In-Vehicle Transition time (Sec)
In-Vehicle to On-foot Transition Time (Sec)
Accelerometer 75 44
Bluetooth Beacon 17 11
Results Hypothesis is proved as 100 confident during the accelerometer tests However none of the tests with Bluetooth Beacon satisfied the hypothesis (all false negatives)
US Department of Transportation Office of the Assistant Secretary for Research and Technology
Intelligent Transportation Systems Joint Program Office
Task 8 D2X Hub Proof-of-Concept Test Evaluation Report ndash Final | 23
Chapter 5 Experimental Analysis
Hypothesis 13 The MDEA can coordinate maintain and cancel travel with another MDEA via Wi-Fi Direct
Data logs verified MDEA (1) Log ndash Coordination Request Received Occurrence Coordination Request Contents Coordination Acceptance Sent Occurrence Coordination Acceptance Notification Coordination Heartbeat Received Occurrence Coordination Cancel Response Sent occurrence and Coordination Disband Sent occurrence
MDEA (2) Log ndash Coordination Request Sent Occurrence Coordination Confirmation received Occurrence Coordination Heartbeat Response Sent Occurrence Coordination Acceptance received Occurrence
Analysis 1 Determined the percentage of Coordination Request Acceptance Heartbeat Cancel and
Disband messages properly processed by mobile devices 2 Assessed the message contents for consistency
Observations This test is performed in a highly-controlled environment This means selection of specific devices and designating them with specific roles This approach was chosen due to poor Wi-Fi direct performance with our system that would have otherwise hindered the ability to conduct the testing and collect the necessary data
US Department of Transportation Office of the Assistant Secretary for Research and Technology
Intelligent Transportation Systems Joint Program Office
Task 8 D2X Hub Proof-of-Concept Test Evaluation Report ndash Final | 24
Chapter 5 Experimental Analysis
Table 5-13 Hypothesis 13 Analysis Data Sample
13117 2117
TFHRC 1
TFHRC 2
TFHRC 3
TFHRC 4
TFHRC 5
TFHRC 6
TFHRC 7
TFHRC 8
TFHRC 9
TFHRC 10
Coordination Request Sent by
Y
Fai
l T
rave
ler
Y c
ould
no
t joi
n th
e ad
-hoc
trav
el g
roup
40951 Check
F
ail
Tra
vele
r Y
cou
ld
not j
oin
the
ad-h
oc tr
avel
gro
up
Check Check Check Check Check Check
Coordination Request Received
by X check Check Check Check Check Check Check Check
Request Confirmed by X
check Check Check Check Check Check Check Check
Confirmation Received by Y
Coordination Request Sent by
Z
check Check Check Check Check Check Check Check
41047 Check Check Check Check Check Check Check
Coordination Request Received
by X check Check Check Check Check Check Check Check
Request Confirmed by X
check Check Check Check Check Check Check Check
Confirmation Received by Z
Coordination Heart Beat
Transmitted by Y amp Z
check Check Check Check Check Check Check Check
check Check Check Check Check Check Check Check
Heart Beat Response
received by X
Ride Arrived Messages
check Check Check Check Check Check Check Check
41303 Check Check Check Check Check Check Check
Coordination Cancel by walking
away Check Check Check Check Check This step not tested on this day
Coordination Cancel by Manual
request This step not tested on this day
Check Check Check Check Check
Disband Group after entering into
vehicle Check Check Check Check Check
For the complete analysis please refer to Table A-9 and Table A-10 in Appendix A
Results There were 30 outliers out of 198 checks (False Negatives) in the data analyzed Hence Hypothesis 13 is satisfied at an 8484 level of confidence
US Department of Transportation Office of the Assistant Secretary for Research and Technology
Intelligent Transportation Systems Joint Program Office
Task 8 D2X Hub Proof-of-Concept Test Evaluation Report ndash Final | 25
US Department of Transportation Office of the Assistant Secretary for Research and Technology
Intelligent Transportation Systems Joint Program Office
Task 8 D2X Hub Proof-of-Concept Test Evaluation Report ndash Final | 26
Chapter 5 Experimental Analysis
Hypothesis 14 The RSU can broadcast a SPaT and MAP message via DSRC that can be received by mobile devices
Data logs verified MDEA Log ndash BSM received and PSM send occurrences
Analysis 1 Determined the percentage of SPaT messages received by mobile devices when within
100 meters of RSE Assessed message contents for consistency 2 Determined the percentage of MAP messages received by mobile devices when within
100 meters of RSE Assessed message contents for consistency
Observations Considering test 5444 all the SPa T messages were transmitted and received at a rate of 1sec Similarly all the MAP messages were transmitted and received at a rate better than 5sec
Table 5-14 Hypothesis 14 Analysis Data Sample
ID Date Message
5 13117 163842 Dsrc Rx Spat id19
6 13117 163842 Dsrc Rx Map id18
9 13117 163843 Dsrc Rx Spat id19
10 13117 163843 Dsrc Rx Bsm Lat389546323 Long -771488295 Head 2713375 Sp 0
12 13117 163843 Dsrc Rx Bsm Lat389546138 Long -771483988 Head 2559125 Sp 0
13 13117 163844 Dsrc Rx Spat id19
14 13117 163844 Dsrc Rx Bsm Lat389546323 Long -771488297 Head 2713375 Sp 0
16 13117 163844 Dsrc Rx Bsm Lat389546138 Long -771483987 Head 2559125 Sp 0
17 13117 163844 Dsrc Rx Map id18
18 13117 163844 Dsrc Rx Bsm Lat389546322 Long -7714883 Head 2713375 Sp 0
20 13117 163845 Dsrc Rx Bsm Lat389546137 Long -771483987 Head 2559125 Sp 0
21 13117 163845 Dsrc Rx Bsm Lat389546322 Long -771488302 Head 2713375 Sp 0
22 13117 163845 Dsrc Rx Spat id19
23 13117 163845 Dsrc Rx Bsm Lat389546137 Long -771483987 Head 2559125 Sp 0
25 13117 163845 Dsrc Rx Bsm Lat38954632 Long -771488302 Head 2713375 Sp 0
26 13117 163846 Dsrc Rx Bsm Lat389546135 Long -771483987 Head 2559125 Sp 0
27 13117 163846 Dsrc Rx Spat id19
29 13117 163846 Dsrc Rx Bsm Lat389546318 Long -771488303 Head 2713375 Sp 0
31 13117 163846 Dsrc Rx Map id18
Results There were no outliers (False Negatives) in the data analyzed Hence Hypothesis 14 is satisfied at a 100 level of confidence
Chapter 5 Experimental Analysis
Hypothesis 15 The RSU can store all messages received via DSRC
Data logs verified MDEA Log ndash All Occurrences of messages sent via DSRC and Message Contents RSU Log ndash Message Received Occurrence and Message Contents
Analysis 1 Assessed the percentage of messages received from mobile devices within 100 meters of
RSE Assess message contents to make sure they are consistent
Observations a Considering the message logs from test cases 5411 5444 5471 there were instances
where PSMs were logged at a rate of less than 10sec Also there were test cases that had no reception of PSMs This clearly indicates the reception issues with RSU CCP unit One prime focus for the Large-Scale Field Test is to improve the reliability of the hardware associated with RSU
b The message contents in all the DSRC messages were consistent throughout the test logs
Table 5-15 Hypothesis 15 Analysis Data Sample
Date Time
Vehicle Range and Advisory Distance wrt
Speed Speed (mph)
In Range
Out of Range
Distance (m)
RSU Log PSM
Message RateSec
13117 101316 IsBsmClose Dist
975500061708885lt AdvDist 1024200201024
255 98 8
13117 101332 IsBsmClose Dist
570797651794001lt AdvDist 666000057888
173 57 6
13117 101340 IsBsmClose Dist
57448436831453lt AdvDist 601199821728
149 57 1
13117 101529 IsBsmClose Dist
975729907380225lt AdvDist 102240014976
254 98 0
13117 101538 IsBsmClose Dist
399317028326919lt AdvDist 102240014976
250 4 1
For the complete analysis please refer to Table A-1 in Appendix A
US Department of Transportation Office of the Assistant Secretary for Research and Technology
Intelligent Transportation Systems Joint Program Office
Task 8 D2X Hub Proof-of-Concept Test Evaluation Report ndash Final | 27
Chapter 5 Experimental Analysis
Table 5-16 Data Usage Statistics
17-Jan 18-Jan 19-Jan 20-Jan 31-Jan 1-Feb Average Maximum
Total Usage (MB) 3805 626 714 2713 4873 1355 984 2713
TMX core usage (MB) 271 450 468 1991 345 90 705 1991
of TMX usage 71 72 66 73 71 66 71 73
Results The hypothesis statement of RSU being able to store all messages received via DSRC is not satisfied at 100 level of confidence due to hardware issues
US Department of Transportation Office of the Assistant Secretary for Research and Technology
Intelligent Transportation Systems Joint Program Office
Task 8 D2X Hub Proof-of-Concept Test Evaluation Report ndash Final | 28
Chapter 6 Lessons Learned and Recommendations
Lessons Learned
The Lessons Learned from the Proof-of-Concept testing are summarized as follows
The ability to reliably generate transmit and receive messages between mobile devices and connected vehicles was demonstrated
The messages to incorporate mobile devices into the C V environment functioned as designed and provided the necessary data for the prototype mobility and safety applications
The prototype safety and mobility software applications functioned well (as designed)
Limitations of technology and hardware issues caused the majority of performance shortfalls
Mixed results were achieved for the various communication methods tested
a Cellular functioned well with our system
b Wi-Fi Direct connectivity was unreliable with our system
c DSRC hardware problems caused communication problems with our system
GPS accuracy limitations were observed as expected
Wi-Fi Direct Connectivity
The connection process was prone to failure at multiple points with no indication to the application why connection failed
TFHRC success rate was achieved by selecting specific devices that worked best for specific roles otherwise a failure rate gt50 would have been expected based on earlier testing
Canvasing of developer community found similar observations no solutions for our system
Wi-Fi Direct connection process requires authorization from the user of the target device in a real world environment such a request would most likely be denied if noticed at all
US Department of Transportation Office of the Assistant Secretary for Research and Technology
Intelligent Transportation Systems Joint Program Office
Task 8 D2X Hub Proof-of-Concept Test Evaluation Report ndash Final | 29
Chapter 6 Lessons Learned and Recommendations
DSRC Hardware
Common Computer Platform (CCP) Pre-production engineering units were used which were determined to have an impedance mismatch between the DSRC chip and RF connector that caused reduction of signal strength
Arada LocoMate ME There were occasional Bluetooth connection failures to mobile devices as well as occasional DSRC transmissionreception failures Longer term it is assumed that DSRC radios will be integrated into smartphones thus obviating the current issues
Recommendations
Based on outcomes of Proof-of-Concept Testing the following prototype system design changes are recommended to be implemented prior to the larger-scale prototype field test
Add Cellular-based communication for Travel Group coordination between mobile devices
New and improved CCP units will be used for the larger-scale field test
For in-vehicle detection use Accelerometer method as the most reliable option
US Department of Transportation Office of the Assistant Secretary for Research and Technology
Intelligent Transportation Systems Joint Program Office
Task 8 D2X Hub Proof-of-Concept Test Evaluation Report ndash Final | 30
APPENDIX A Comprehensive Data Analysis Tables
Note For all the analysis results depicted below the term ldquocheckrdquo refers to the ldquosuccessrdquo of desired action
Table A-1 Complete Data Analysis ndash Hypothesis 1 4 amp 15
Date Time Vehicle Range and Advisory
Distance wrt Speed Speed In
Range Out of
Range Distance
RSU Log PSM
Message RateSec
VEA Log PSM
Message Rate
1312017 101316 IsBsmClose Dist 975500061708885lt
AdvDist 1024200201024 255 X 98 8 10
1312017 101332 IsBsmClose Dist 570797651794001lt
AdvDist 666000057888 173 X 57 6 10
1312017 101340 IsBsmClose Dist 57448436831453lt
AdvDist 601199821728 149 X 57 1 10
1312017 101529 IsBsmClose Dist 975729907380225lt
AdvDist 102240014976 254 X 98 0 10
1312017 101538 IsBsmClose Dist 399317028326919lt
AdvDist 102240014976 250 X 4 1 10
1312017 101553 IsBsmClose Dist 600719107941917lt
AdvDist 70199987616 174 X 60 0 10
1312017 102029 IsBsmClose Dist 944643508928866lt
AdvDist 1008000141984 251 X 95 0 9
1312017 102048 IsBsmClose Dist 592561932680623lt
AdvDist 628200188352 156 X 59 0 9
US Department of Transportation Office of the Assistant Secretary for Research and Technology
Intelligent Transportation Systems Joint Program Office
Task 8 D2X Hub Proof-of-Concept Test Evaluation Report ndash Final | A-1
APPENDIX A Comprehensive Data Analysis Tables
Date Time Vehicle Range and Advisory
Distance wrt Speed Speed In
Range Out of Range Distance
RSU Log PSM
Message RateSec
VEA Log PSM
Message Rate
1312017 102054 IsBsmClose Dist 616348297460404lt
AdvDist 644399845056 160 X 62 3 11
1312017 102105 IsBsmClose Dist 871180496389495lt
AdvDist 1092600137376 247 X 87 4 9
1312017 102206 IsBsmClose Dist 977301610734722lt
AdvDist 1130400006912 295 X 98 0 10
1312017 102228 IsBsmClose Dist 577576034007057lt
AdvDist 60659997552 151 X 58 2 10
1312017 102332 IsBsmClose Dist 101193300977461lt
AdvDist 10386002088 258 X 101 10 10
1312017 102356 IsBsmClose Dist 595641466972855lt
AdvDist 660599904096 164 X 60 6 10
1312017 102623 IsBsmClose Dist 100217014111125lt
AdvDist 1024200201024 253 X 100 7 10
1312017 102650 IsBsmClose Dist 540919707235241lt
AdvDist 887399925984 221 X 54 0 10
1172017 111504 IsBsmClose Dist 100564061581794lt
AdvDist 1169999927712 291 X 101 10 10
1172017 112437 IsBsmClose Dist 992912014791515lt
AdvDist 10386002088 258 X 99 10 10
1172017 112837 IsBsmClose Dist 106684353810469lt
AdvDist 1076400078336 261 X 107 10 10
US Department of Transportation Office of the Assistant Secretary for Research and Technology
Intelligent Transportation Systems Joint Program Office
Task 8 D2X Hub Proof-of-Concept Test Evaluation Report ndash Final | A-2
APPENDIX A Comprehensive Data Analysis Tables
Date Time Vehicle Range and Advisory
Distance wrt Speed Speed In
Range Out of Range Distance
RSU Log PSM
Message RateSec
VEA Log PSM
Message Rate
1172017 113148 IsBsmClose Dist 1124753473133lt AdvDist
1186199986752 268 X 112 10 10
1172017 113332 IsBsmClose Dist 106022149777593lt
AdvDist 1126799904384 260 X 106 10 10
1172017 113336 IsBsmClose Dist 59429630331283lt
AdvDist 1196999892 298 X 59 10 10
1172017 113357 IsBsmClose Dist 657937887214709lt
AdvDist 1193400191808 297 X 66 10 10
1172017 113627 IsBsmClose Dist 965542357439439lt
AdvDist 1080000180864 260 X 97 10 10
1172017 113629 IsBsmClose Dist 821301583410616lt
AdvDist 1074600027072 270 X 82 10 10
1172017 113803 IsBsmClose Dist 994884887192582lt
AdvDist 104580001152 251 X 99 10 10
1172017 113811 IsBsmClose Dist 16809952777894lt
AdvDist 106200007056 257 X 17 10 10
1172017 114114 IsBsmClose Dist 948985801452811lt
AdvDist 986399929152 245 X 95 10 10
1172017 114133 IsBsmClose Dist 141255704529106lt
AdvDist 963000067392 242 X 14 10 10
1172017 114136 IsBsmClose Dist 377627357471613lt
AdvDist 977400075168 243 X 38 10 10
US Department of Transportation Office of the Assistant Secretary for Research and Technology
Intelligent Transportation Systems Joint Program Office
Task 8 D2X Hub Proof-of-Concept Test Evaluation Report ndash Final | A-3
APPENDIX A Comprehensive Data Analysis Tables
Date Time Vehicle Range and Advisory
Distance wrt Speed Speed In
Range Out of Range Distance
RSU Log PSM
Message RateSec
VEA Log PSM
Message Rate
1172017 114403 IsBsmClose Dist 114490146784404lt
AdvDist 1225799907552 266 X 114 10 10
1172017 114415 IsBsmClose Dist 280463490772458lt
AdvDist 71100013248 161 X 28 10 10
1172017 114735 IsBsmClose Dist 102043927314914lt
AdvDist 1040399857728 259 X 102 10 10
1172017 114755 IsBsmClose Dist 185020887331204lt
AdvDist 112499985312 275 X 19 10 10
1192017 35605 IsBsmClose Dist 107928079653642lt
AdvDist 1107000145152 272 X 108 9 9
1192017 35630 IsBsmClose Dist 99759104887202lt
AdvDist 1184399935488 294 X 100 10 10
1192017 35837 IsBsmClose Dist 110291146846666lt
AdvDist 115020016848 286 X 110 10 10
1192017 40057 IsBsmClose Dist 998997459961241lt
AdvDist 1260000076896 313 X 100 10 10
1192017 40300 IsBsmClose Dist 100209094247195lt
AdvDist 106919987328 260 X 100 10 10
1192017 40410 IsBsmClose Dist 100723184500334lt
AdvDist 1097999888832 273 X 101 6 10
1192017 41103 IsBsmClose Dist 977354295877856lt
AdvDist 1008000141984 251 X 98 10 10
US Department of Transportation Office of the Assistant Secretary for Research and Technology
Intelligent Transportation Systems Joint Program Office
Task 8 D2X Hub Proof-of-Concept Test Evaluation Report ndash Final | A-4
APPENDIX A Comprehensive Data Analysis Tables
Date Time Vehicle Range and Advisory
Distance wrt Speed Speed In
Range Out of Range Distance
RSU Log PSM
Message RateSec
VEA Log PSM
Message Rate
1192017 41311 IsBsmClose Dist 10190842581135lt
AdvDist 1040399857728 259 X 102 10 10
1192017 41423 IsBsmClose Dist 995536361906761lt
AdvDist 1009799790912 251 X 100 10 10
1192017 41534 IsBsmClose Dist 10075608603652lt
AdvDist 106919987328 264 X 101 10 10
US Department of Transportation Office of the Assistant Secretary for Research and Technology
Intelligent Transportation Systems Joint Program Office
Task 8 D2X Hub Proof-of-Concept Test Evaluation Report ndash Final | A-5
APPENDIX A Comprehensive Data Analysis Tables
Table A-2 Complete Data Analysis ndash Hypothesis 2
US Department of Transportation Office of the Assistant Secretary for Research and Technology
Intelligent Transportation Systems Joint Program Office
Task 8 D2X Hub Proof-of-Concept Test Evaluation Report ndash Final | A-6
Date Test
Number PSMs Generated by
Trav X and Trav Y Transition to In Group Trav Y PSM Ceased Only Trav X PSM
Received
1312017 TFHRC 1 111116 111240 Check 111305
1312017 TFHRC 2 Grouping Failed Grouping Failed Grouping Failed Grouping Failed
1312017 TFHRC 3 112346 112448 Check 112508
1312017 TFHRC 4 114208 114301 Check 114345
1312017 TFHRC 5 114609 114658 Check 114721
1312017 TFHRC 6 115222 115313 Check 115342
1182017 ATP 1 104400 104527 Check 104601
1182017 ATP 2 105356 105455 Check 105546
1182017 ATP 3 110059 110150 Check 110322
1182017 ATP 4 111222 111310 Check 111329
1182017 ATP 5 111515 111616 Check 111630
1182017 ATP 6 111823 111906 Check 111917
1182017 ATP 7 112116 112157 Check 112209
1182017 ATP 8 112814 112855 Check 112917
1182017 ATP 9 113142 113230 Check 113248
1182017 ATP 10 113501 113545 Check 113608
1192017 ATP 11 44728 44842 Check 45007
1192017 ATP 12 Radio Failure Test Terminated Radio Failure Test Terminated Radio Failure Test Terminated Radio Failure Test Terminated
1192017 ATP 13 45548 45637 Check 45728
1192017 ATP 14 45946 50047 Check 50107
1192017 ATP 15 50353 50444 Check 50513
1192017 ATP 16 50730 50823 Check 50839
APPENDIX A Comprehensive Data Analysis Tables
Table A-3 Complete Data Analysis ndash Hypothesis 3
US Department of Transportation Office of the Assistant Secretary for Research and Technology
Intelligent Transportation Systems Joint Program Office
Task 8 D2X Hub Proof-of-Concept Test Evaluation Report ndash Final | A-7
Date Description
MDEA not in Vehicle
MDEA Transmits
PSMs Time of MDEA
Mode Transition
MDEA Ceases Transmitting
PSMs
1312017 TFHRC 1 Check Check 0443101852 Check
1312017 TFHRC 2 Check Check 0445243056 Check
1312017 TFHRC 3 Check Check 0447569444 Check
1312017 TFHRC 4 Check Check 0448888889 Check
1312017 TFHRC 5 Check Check 045005787 Check
1312017 TFHRC 6 Check Check 0451666667 Check
1172017 ATP 1 Check Check 0501898148 Check
1172017 ATP 2 Check Check 0504201389 Check
1172017 ATP 3 Check Check 0506215278 Check
1172017 ATP 4 Check Check 0507858796 Check
1172017 ATP 5 Check Check 0508981481 Check
1172017 ATP 6 Check Check 0510219907 Check
1172017 ATP 7 Check Check 0511736111 Check
1172017 ATP 8 Check Check 05128125 Check
1172017 ATP 9 Check Check 0513831019 Check
1172017 ATP 10 Check Check 0514884259 Check
1172017 ATP 11 Check Check 0185590278 Check
1172017 ATP 12 Check Check 0187210648 Check
1172017 ATP 13 Check Check 0188425926 Check
1172017 ATP 14 Check Check 0190289352 Check
1172017 ATP 15 Check Check 0191863426 Check
APPENDIX A Comprehensive Data Analysis Tables
Table A-4 Complete Data Analysis ndash Hypothesis 5 (VEA)
Test Number
Type of Message
True Distance (m)
Speed (MPH)
Expected Distance (m)
Difference (m)
TFHRC1
Advisory 7584 2471 9942 2358
Alert 5545 2523 5780 235
Warning 4874 2498 4910 036
TFHRC2
Advisory 8552 2595 10441 1889
Alert 5167 2461 5588 421
Warning 4515 2433 4751 236
TFHRC3
Advisory 7876 2381 9580 1704
Alert 5827 2590 5989 162
Warning 5124 2624 5222 098
TFHRC4
Advisory 7529 2818 11338 3809
Alert 6047 2744 6482 435
Warning 5323 2714 5450 127
TFHRC5
Advisory 9292 2404 9672 380
Alert 5350 2423 5472 122
Warning 4081 2352 4556 475
ATP1
Advisory 000 000
Alert 000 000
Warning 000 000
ATP2
Advisory 5787 1644 6614 827
Alert 3074 1640 3289 215
Warning 2627 1640 2947 320
ATP3
Advisory 4204 1685 6779 2575
Alert 3300 1672 3370 070
Warning 2854 1658 2985 131
ATP4
Advisory 4296 1753 7053 2757
Alert 3346 1791 3679 333
Warning 2871 1755 3194 323
ATP5
Advisory 000 000
Alert 000 000
Warning 1069 1706 3088 2019
ATP6
Advisory 3632 1640 6598 2966
Alert 000 000
Warning 2770 1594 2850 080
US Department of Transportation Office of the Assistant Secretary for Research and Technology
Intelligent Transportation Systems Joint Program Office
Task 8 D2X Hub Proof-of-Concept Test Evaluation Report ndash Final | A-8
APPENDIX A Comprehensive Data Analysis Tables
Test Number
Type of Message
True Distance (m)
Speed (MPH)
Expected Distance (m)
Difference (m)
ATP7
Advisory 000 000
Alert 000 000
Warning 1919 1887 3483 1564
ATP8
Advisory 4492 1741 7005 2513
Alert 3113 1687 3409 296
Warning 2661 1680 3032 371
ATP9
Advisory 4694 1628 6550 1856
Alert 2991 1570 3113 122
Warning 2572 1549 2756 184
ATP10
Advisory 000 000
Alert 000 000
Warning 650 2505 4927 4277
ATP11
Advisory 000 000
Alert 000 000
Warning 1914 2398 4666 2752
ATP12
Advisory 000 000
Alert 000 000
Warning 460 2293 4415 3955
ATP13
Advisory 000 000
Alert 000 000
Warning 2732 2535 5001 2269
ATP14
Advisory 000 000
Alert 000 000
Warning 2358 2361 4577 2219
ATP15
Advisory 000 000
Alert 000 000
Warning 1107 2459 4814 3707
ATP16
Advisory 5668 1982 7974 2306
Alert 000 000
Warning 1502 1906 3525 2023
ATP17
Advisory 000 000
Alert 000 000
Warning 3183 2420 4720 1537
US Department of Transportation Office of the Assistant Secretary for Research and Technology
Intelligent Transportation Systems Joint Program Office
Task 8 D2X Hub Proof-of-Concept Test Evaluation Report ndash Final | A-9
Table A-5 Complete Data Analysis ndash Hypothesis 6 (MDEA)
Test Number
Type of Message
True Distance (m)
Speed (MPH)
Expected Distance (m)
Difference (m)
TFHRC1
Advisory 8756 2290 9213 457
Alert 5320 2509 5736 416
Warning 4651 2487 4883 232
TFHRC2
Advisory 9928 2514 10115 187
Alert 5276 2447 5546 270
Warning 4624 2415 4707 084
TFHRC3
Advisory 8952 2304 9270 318
Alert 5595 2603 6030 436
Warning 4890 2617 5205 315
TFHRC4
Advisory 9752 2514 10115 363
Alert 6290 2769 6564 274
Warning 4844 2693 5396 552
TFHRC5
Advisory 9613 2406 9680 067
Alert 5242 2420 5463 221
Warning 4080 2357 4568 488
ATP1
Advisory 5938 2183 8783 2845
Alert 4314 2120 4580 266
Warning 3644 2111 3989 345
ATP2
Advisory 6452 1641 6602 150
Alert 3296 1691 3419 123
Warning 2600 1601 2865 265
ATP3
Advisory 6212 1628 6550 338
Alert 3200 1655 3327 127
Warning 2707 1641 2949 242
ATP4
Advisory 6420 1646 6622 202
Alert 3300 1780 3650 350
Warning 2878 1704 3084 206
ATP5
Advisory 6673 1677 6747 074
Alert 3400 1847 3828 428
Warning 2972 1807 3307 335
ATP6
Advisory 6100 1628 6550 450
Alert 3100 1637 3281 181
Warning 2500 1597 2857 357
APPENDIX A Comprehensive Data Analysis Tables
US Department of Transportation Office of the Assistant Secretary for Research and Technology
Intelligent Transportation Systems Joint Program Office
Task 8 D2X Hub Proof-of-Concept Test Evaluation Report ndash Final | A-10
APPENDIX A Comprehensive Data Analysis Tables
Test Number
Type of Message
True Distance (m)
Speed (MPH)
Expected Distance (m)
Difference (m)
ATP7
Advisory 7500 1972 7934 434
Alert 3882 1914 4008 126
Warning 3400 1946 3614 214
ATP8
Advisory 6659 1744 7017 358
Alert 3263 1682 3396 133
Warning 2900 1682 3037 137
ATP9
Advisory 6605 1659 6675 070
Alert 2900 1556 3078 178
Warning 2365 1561 2781 416
ATP10
Advisory 9214 2491 10022 808
Alert 5859 2688 6301 442
Warning 5200 2644 5273 073
ATP11
Advisory 8485 2487 10006 1521
Alert 5376 2487 5668 292
Warning 4716 2483 4873 157
ATP12
Advisory 9001 2433 9789 788
Alert 5395 2420 5463 068
Warning 4103 2330 4503 400
ATP13
Advisory 8615 2559 10296 1681
Alert 000 000 000 000
Warning 4930 2581 5115 185
ATP14
Advisory 6119 2491 10022 3903
Alert 5500 2491 5681 181
Warning 3800 2402 4676 876
ATP15
Advisory 7546 2603 10473 2927
Alert 6000 2661 6215 215
Warning 3100 2603 5170 2070
ATP16
Advisory 7931 2089 8405 474
Alert 3995 1950 4106 111
Warning 3500 1923 3563 063
ATP17
Advisory 8243 2049 8244 001
Alert 5260 2465 5601 341
Warning 4718 2438 4763 045
US Department of Transportation Office of the Assistant Secretary for Research and Technology
Intelligent Transportation Systems Joint Program Office
Task 8 D2X Hub Proof-of-Concept Test Evaluation Report ndash Final | A-11
Table A-6 Complete Data Analysis ndash Hypothesis 7
Date Test
Number
User State Change Is
Safe Icon False
Properly Processed
User State Change Is
Safe Icon True
Properly Processed
1312017 TFHRC 1 111438 X 111504 X
1312017 TFHRC 3 112533 X 112619 X
1312017 TFHRC 4 114400 X 114438 X
1312017 TFHRC 5 114801 X 114829 X
1312017 TFHRC 6 115408 X 115444 X
1182017 ATP 1 105056 X 105116 X
1182017 ATP 2 105622 X 105656 X
1182017 ATP 3 110348 X 110436 X
1182017 ATP 4 111355 X 111417 X
1182017 ATP 5 111655 X 111717 X
1182017 ATP 6 111947 X 112007 X
1182017 ATP 7 112235 X 112305 X
1182017 ATP 8 112937 X 113013 X
1182017 ATP 9 113313 X 113353 X
1182017 ATP 10 113636 X 113708 X
1192017 ATP 11 45035 X 45057 X
1192017 ATP 13 45806 X 45828 X
1192017 ATP 14 50144 X 50202 X
1192017 ATP 15 50542 X 50600 X
1192017 ATP 16 50903 X 50929 X
APPENDIX A Comprehensive Data Analysis Tables
US Department of Transportation Office of the Assistant Secretary for Research and Technology
Intelligent Transportation Systems Joint Program Office
Task 8 D2X Hub Proof-of-Concept Test Evaluation Report ndash Final | A-12
APPENDIX A Comprehensive Data Analysis Tables
Table A-7 Complete Data Analysis ndash Hy pothesis 8 amp 9
US Department of Transportation Office of the Assistant Secretary for Research and Technology
Intelligent Transportation Systems Joint Program Office
Task 8 D2X Hub Proof-of-Concept Test Evaluation Report ndash Final | A-13
Test Number
Analyze the percentage of PMM messages properly processed by
in-vehicle devices Analyze the percentage of PMM-RSP messages
properly processed by mobile devices
Analyze the percentage of PMM-Cancel messages
properly processed by in-vehicle devices
MDEA Log ndash PMM Send
occurrence
MDEA Log ndash
PMM contents
VEA Log ndash PMM
Receive occurrence
VEA Log ndash Driver
acceptance
VEA Log ndash PMM-RSP
Send occurrence
MDEA Log ndash PMM-RSP
Receive occurrence
MDEA Log ndash Coordination
Status
MDEA Log ndash PMM-
Cancel Sent Occurrence
VEA Log ndash PMM-
Cancel Received
Occurrence
TFHRC 1 Check All Present Check Check Check Check Check Check Check
TFHRC 2 Check All Present Check Check Check Check Check Check Check
TFHRC 3 Check All Present Check Check Check Check Check Check Check
TFHRC 4 Check All Present Check Check Check Check Check Check Check
TFHRC 5 Check All Present Check Check Check Check Check Check Check
ATP 1 Check All Present Check Check Check Check Check Check Check
ATP 2 Check All Present Check Check Check Check Check Check Check
ATP 3 Check All Present Check Check Check Check Check Check Check
ATP 4 Check All Present Check Check Check Check Check Check Check
ATP 5 Check All Present Check Check Check Check Check Check Check
ATP 6 Check All Present Check Check Check Check Check Check Check
ATP 7 Check All Present Check Check Check Check Check Check Check
ATP 8 Check All Present Check Check Check Check Check Check Check
ATP 9 Check All Present Check Check Check Check Check Check Check
ATP 10 Check All Present Check Check Check Check Check Check Check
APPENDIX A Comprehensive Data Analysis Tables
Test Number
Analyze the percentage of PMM messages properly processed by
in-vehicle devices Analyze the percentage of PMM-RSP messages
properly processed by mobile devices
Analyze the percentage of PMM-Cancel messages
properly processed by in-vehicle devices
MDEA Log ndash PMM Send occurrence
MDEA Log ndash PMM
contents
VEA Log ndash PMM
Receive occurrence
VEA Log ndash Driver
acceptance
VEA Log ndash PMM-RSP
Send occurrence
MDEA Log ndash PMM-RSP
Receive occurrence
MDEA Log ndash Coordination
Status
MDEA Log ndash PMM-
Cancel Sent Occurrence
VEA Log ndash PMM-
Cancel Received
Occurrence
ATP 11 Check All Present Check Check Check Check Check Check Check
ATP 12 Check All Present Check Check Check Check Check Check Check
ATP 13 Check All Present Check Check Check Check Check Check Check
ATP 14 Check All Present Check Check Check Check Check Check Check
ATP 15 Check All Present Check Check Check Check Check Check Check
ATP 16 Check All Present Check Check Check Check Check Check Check
ATP 17 Check All Present Check Check Check Check Check Check Check
US Department of Transportation Office of the Assistant Secretary for Research and Technology
Intelligent Transportation Systems Joint Program Office
Task 8 D2X Hub Proof-of-Concept Test Evaluation Report ndash Final | A-14
Table A-8 Complete Data Analysis ndash Hy pothesis 10
Date Test Number
Analyze the Success Rate of Receiving a PMM-Arrive Message
VEA Log ndash PMM-ARRIVE Send Occurrence MDEA Log ndash PMM-ARRIVE Receive Occurrence
1312017 TFHRC 1 Fail Fail
1312017 TFHRC 2 Check Check
1312017 TFHRC 3 Check Check
1312017 TFHRC 4 Check Check
1312017 TFHRC 5 Check Check
1312017 TFHRC 6 Check Check
1312017 TFHRC 7 Check Check
1182017 ATP 1 Not Available Check
1182017 ATP 2 Not Available Check
1182017 ATP 3 Not Available Check
1182017 ATP 4 Not Available Check
1182017 ATP 5 Not Available Check
1182017 ATP 6 Not Available Check
1182017 ATP 7 Not Available Check
1182017 ATP 8 Not Available Check
1182017 ATP 9 Not Available Check
1182017 ATP 10 Not Available Check
1202017 ATP 11 Check Check
1202017 ATP 12 Check Check
1202017 ATP 13 Check Check
1202017 ATP 14 Check Check
1202017 ATP 15 Check Check
APPENDIX A Comprehensive Data Analysis Tables
US Department of Transportation Office of the Assistant Secretary for Research and Technology
Intelligent Transportation Systems Joint Program Office
Task 8 D2X Hub Proof-of-Concept Test Evaluation Report ndash Final | A-15
APPENDIX A Comprehensive Data Analysis Tables
Table A-9 Complete Data Analysis ndash Hypothesis 13 (Part A)
US Department of Transportation Office of the Assistant Secretary for Research and Technology
Intelligent Transportation Systems Joint Program Office
Task 8 D2X Hub Proof-of-Concept Test Evaluation Report ndash Final | A-16
Test Number
Coordination Request Sent
by Y
Coordination Request
Received by X
Request Confirmed
by X Confirmation Received by Y
Coordination Request Sent
by Z
Coordination Request
Received by X
Request Confirmed
by X Confirmation Received by Z
Coordination Heart Beat
Transmitted by Y amp Z
Heart Beat Response received
by X
Ride Arrived
Messages
TFHRC 1
Fail Traveler Y could not join the ad-hoc travel group
TFHRC 2
Check check check check 41047 check check check check check 41303
TFHRC 3
Check Check Check Check Check Check Check Check Check Check Check
TFHRC 4
Fail Traveler Y could not join the ad-hoc travel group
TFHRC 5
Check Check Check Check Check Check Check Check Check Check Check
TFHRC 6
Check Check Check Check Check Check Check Check Check Check Check
TFHRC 7
Check Check Check Check Check Check Check Check Check Check Check
TFHRC 8
Check Check Check Check Check Check Check Check Check Check Check
TFHRC 9
Check Check Check Check Check Check Check Check Check Check Check
TFHRC 10
Check Check Check Check Check Check Check Check Check Check Check
ATP 1 Check Check Check Check Check Check Check Check Check Check Check
ATP 2 Check Check Check Check Check Check Check Check Check Check Check
Test Number
Coordination Request Sent
by Y
Coordination Request
Received by X
Request Confirmed
by X Confirmation Received by Y
Coordination Request Sent
by Z
Coordination Request
Received by X
Request Confirmed
by X Confirmation Received by Z
Coordination Heart Beat
Transmitted by Y amp Z
Heart Beat Response received
by X
Ride Arrived
Messages
ATP 3 Check Check Check Check Check Check Check Check Check Check Check
ATP 4 Check Check Check Check Check Check Check Check Check Check Check
ATP 5 Check Check Check Check Check Check Check Check Check Check Check
ATP 6 Check Check Check Check Check Check Check Check Check Check Check
ATP 7 Check Check Check Check Check Check Check Check Check Check No ride
arrives received
ATP 8 Check Check Check Check Check Check Check Check Check Check Check
ATP 9 Check Check Check Check Check Check Check Check Check Check No ride
arrives received
ATP 10 Check Check Check Check Check Check Check Check Check Check Check
ATP 11 Check Check Check Check Check Check Check Check Check Check Check
ATP 12 Check Check Check Check Check Check Check Check Check Check No ride
arrives received
ATP 13 Check Check Check Check Check Check Check Check Check Check Check
ATP 14 Check Check Check Check Check Check Check Check Check Check Check
ATP 15 Check Check Check Check Check Check Check Check Check Check Check
APPENDIX A Comprehensive Data Analysis Tables
US Department of Transportation Office of the Assistant Secretary for Research and Technology
Intelligent Transportation Systems Joint Program Office
Task 8 D2X Hub Proof-of-Concept Test Evaluation Report ndash Final | A-17
APPENDIX A Comprehensive Data Analysis Tables
Table A-10 Complete Data Analysis ndash Hypothesis 13 (Part B)
US Department of Transportation Office of the Assistant Secretary for Research and Technology
Intelligent Transportation Systems Joint Program Office
Task 8 D2X Hub Proof-of-Concept Test Evaluation Report ndash Final | A-18
Test Number Coordination Cancel by
Walking Away Coordination Cancel by
Manual Request Disband Group after
Entering into Vehicle
TFHRC 1 Check This step not tested on this day
TFHRC 2 Check This step not tested on this day
TFHRC 3 Check This step not tested on this day
TFHRC 4 Check This step not tested on this day
TFHRC 5 Check This step not tested on this day
TFHRC 6 This step not tested on this day Check Check
TFHRC 7 This step not tested on this day Check Check
TFHRC 8 This step not tested on this day Check Check
TFHRC 9 This step not tested on this day Check Check
TFHRC 10 This step not tested on this day Check Check
ATP 1 Check Check Check
ATP 2 Check Check Check
ATP 3 Check Check Check
ATP 4 Check Check Check
ATP 5 Check Check Check
ATP 6 Check Check Check
ATP 7 Check Check Check
ATP 8 Check Check Check
ATP 9 Check Check Check
APPENDIX A Comprehensive Data Analysis Tables
Test Number Coordination Cancel by
Walking Away Coordination Cancel by
Manual Request Disband Group after Entering into Vehicle
ATP 10 Check Check Check
ATP 11 Fail Could not cancel by distance Check Check
ATP 12 Check Check Check
ATP 13 Fail Could not cancel by distance Check Check
ATP 14 Check Check Check
ATP 15 Check Check Check
US Department of Transportation Office of the Assistant Secretary for Research and Technology
Intelligent Transportation Systems Joint Program Office
Task 8 D2X Hub Proof-of-Concept Test Evaluation Report ndash Final | A-19
APPENDIX A Comprehensive Data Analysis Tables
APPENDIX B Acronyms and Abbreviations
ATG Ad-Hoc Travel Group
ATP Acceptance Test Plan
BSM Basic Safety Message
CCP Common Computing Platform
CV Connected Vehicle
DSRC Dedicated Short Range Communications
EPS Experimental Prototype System
FHWA Federal Highway Administration
FR Functional Requirement
ITS Intelligent Transportation Systems
LDV Light-Duty Vehicle
MAP Map Data
MDEA Mobile Device Experimental Application
MGL Message Logging
OBU On-board Unit
PMM Personal Mobility Message
PMM-ARRIVE Personal Mobility Message Arrival Message
PMM-CANCEL Personal Mobility Message Cancel Message
PMM-RSP Personal Mobility Message Response Message
PR Performance Requirement
PSM Personal Safety Message
REA Roadside Experimental Application
RSU Roadside Unit
SFY Safety
SIR System Interface Requirement
SMP SPaT and MAP
SPaT Signal Phasing and Timing
SyRS System Requirements Specifications
TFHRC Turner-Fairbank Highway Research Center
US DOT US Department of Transportation
US Department of Transportation Office of the Assistant Secretary for Research and Technology
Intelligent Transportation Systems Joint Program Office
Task 8 D2X Hub Proof-of-Concept Test Evaluation Report ndash Final |B-1
VEA Vehicle Experimental Application
Wi-Fi Wireless Fidelity
APPENDIX B Acronyms and Abbreviations
US Department of Transportation Office of the Assistant Secretary for Research and Technology
Intelligent Transportation Systems Joint Program Office
Task 8 D2X Hub Proof-of-Concept Test Evaluation Report ndash Final | B-2
APPENDIX C Terms and Definitions
Basic Safety Message (BSM)
Connected vehicle message type which contains vehicle safety-related information that is broadcast to surrounding vehicles
Bluetooth Short range wireless technology used to exchange data between enabled devices
Cellular Uses short-range radio stations to cover areas of communication
Connected Vehicle A vehicle that can communicate with other vehicles and infrastructure via communication media such as DSRC Wi-Fi cellular or Bluetooth
Coordinated Messages are coordinated when two or more mobile devices have establish a travel group based on the same origin destination and
time and function as a single cohesive senderrecipient
CV Inspector An application that verifies if the Mobile Device is broadcasting messages to Connected Vehicles
Destination The end point of a travelerrsquos trip
DSRC Dedicated Short-Range Communications a low-latency high-reliability two-way communications tool used for sending transportation safety
messages
Light-Duty Vehicle Of or relating to vehicles that way less than 4000 lbs
Message Type Type of personal safety or personal mobility message that is transmitted based on the technology used and level of coordination available
Personal Mobility Message (PMM)
Similar to PDM message intended for the exchange of mobility messages between individual travelers and vehiclesinfrastructure via
mobile device
Personal Safety Message (PSM)
Similar to BSM message intended to transmit low-latency urgent safety messages between individual travelers and vehiclesinfrastructure via
mobile device
Test Case A set of conditions or variables that a Tester can determine if system meets requirements
Transit Vehicle Large vehicles mainly used for public transportation as well as support services
Transmitting The state in which a traveler has opted in and is sendingreceiving messages via mobile device
Uncoordinated Messages are uncoordinated when travel groups are not established (see coordinated definition)
Wi-Fi Local area wireless technology that allows enabled devices to connect to the Internet
APPENDIX A Comprehensive Data Analysis Tables
US Department of Transportation Office of the Assistant Secretary for Research and Technology
Intelligent Transportation Systems Joint Program Office
Task 8 D2X Hub Proof-of-Concept Test Evaluation Report ndash Final |C-1
ITS Joint Program Office-HOIT 1200 New Jersey Avenue SE
Washington DC 20590
Toll-Free ldquoHelp Linerdquo 866-367-7487 wwwitsdotgov
FHWA-JPO-18-263
- Structure Bookmarks
-
- Sharing Data between Mobile Devices Connected Vehicles and Infrastructure Task 8 D2X Hub Proof-of-Concept Test Evaluation Report wwwitsdotgovindexhtm Final Report mdash October 25 2017 FHWA-JPO-18-623
- Revision History
- Table of Contents
- Chapter 1 Scope
- Chapter 2 Referenced Documents
- Chapter 3 Test Conduct
- Chapter 4 Experimental Analysis Results Summary
- Chapter 5 Experimental Analysis
- Chapter 6 Lessons Learned and Recommendations
- APPENDIX A Comprehensive Data Analysis Tables
- APPENDIX B Acronyms and Abbreviations
- APPENDIX C Terms and Definitions
-

US Department of Transportation Office of the Assistant Secretary for Research and Technology
Intelligent Transportation Systems Joint Program Office
Task 8 D2X Hub Proof-of-Concept Test Evaluation Report ndash Final | 12
Chapter 5 Experimental Analysis
Hypothesis 4 The Mobile Device can broadcast a PSM a radius of 250 meters 10 Hz under clear unobstructed conditions regardless of where the mobile device is located on the pedestrianrsquos person or clothing
Data logs verified VEA Log ndash PSM receive occurrences at a d istance of 10 m 50 m 100 m
Analysis
The rate at which PSMs were received by the RSU had been assessed The mobile device was placed in multiple locations on the pedestrian including in-hand in-pocket and in a backpack
Observations Due to DSRC limitations in the CCPs tests could not be performed beyond 100 m range Considering the RSU logging issues VEA Logs were used to analyze PSM broadcasting capacity of MDEA All the tests logged PSMs at a ra te o f 10sec Therefore 150 200 250 300 m radius could no t be a nalyzed Only three (10 50 and 100m) out of seven (10 50 100 150 200 250 and 300 m) cases were tested which resulted in a 43 Level of Confidence
Table 5-4 Hypothesis 4 Analysis Data Sample
Date Time
Vehicle Range and Advisory Distance wrt Speed
Speed (mph)
In Range
Out of Range
True Distance (m)
VEA Log PSM Message Rate
13117 101316 IsBsmClose Dist 975500061708885lt AdvDist 1024200201024
255 98 10
13117 101332 IsBsmClose Dist 570797651794001lt AdvDist 666000057888
173 57 10
13117 101340 IsBsmClose Dist 57448436831453lt AdvDist 601199821728
149 57 10
13117 101529 IsBsmClose Dist 975729907380225lt AdvDist 102240014976
254 98 10
13117 101538 IsBsmClose Dist 399317028326919lt AdvDist 102240014976
250 4 10
For the complete analysis please refer to Table A-1 in Appendix A
Results Due to the DSRC limitations the radius was limited to 100 m Hence Hypothesis 4 is satisfied at a 43 level of confidence
Chapter 5 Experimental Analysis
Hypothesis 5 Vehicles OBUs can capture and process Mobile Device PSMs and issue warnings at sufficient distance for drivers to avoid imminent pedestrian collision
Data logs verified VEA Log ndash PSM Location GPS Location Advisory Display Alert Display and Warning Display
Analysis
Assessing the distance at which an Advisory Alert and Warning were issued based on the speed of the vehicle (in the VEA Log)
Observations a Considering TFHRC tests the average difference in distance for VEA Logging of Advisories
Alerts and Warnings were on average 2028 m 275 m and 194 m respectively b The higher difference in advisory was due to the delay in the time between VEA deciding to
send PSM and Arada sending a PSM c Latency of less than a second was observed between PSM received and the message
display time on MDEA and VEA Logs
sݐݑݍܧ ݎ ݑݐ dݒݏwarningandalertݕݎ ݐݏ ݓݎݐ ݏ
ௗ௩௦௬= lowastݒ9
lowast ሻ05ݒ 25ሾሺൌ 11 lowast ቊ ௧ଶݒ
ሿ 2ሺ34ሻ
ቋ
Where
lowast ሻ05ݒ 25ሾሺൌ 11 lowast ቊ ௪
is the advisory display distance (meters) ௗ௩௦௬
is the alert display distance (meters) ௧
is the warning display distance (meters) ௐ
ଶݒሿ 2ሺ56ሻ
ቋ
ݒ is the velocity of the vehicle (meters per second)
TF 71 Run 2 - VEA
Source Battelle Google Maps February 2017
Figure 5-1 Advisory Alert and Warning Distances with Respect to VEA
US Department of Transportation Office of the Assistant Secretary for Research and Technology
Intelligent Transportation Systems Joint Program Office
Task 8 D2X Hub Proof-of-Concept Test Evaluation Report ndash Final | 13
Chapter 5 Experimental Analysis
Table 5-5 Hypothesis 5 Analysis Data Sample
TFHRC1 TFHRC2 TFHRC3
Advisory Alert Warning Advisory Alert Warning Advisory Alert Warning
True Distance (m) 7584 5545 4874 8552 5167 4515 7876 5827 5124
Speed (MPH) 2471 2523 2498 2595 2461 2433 2381 2590 2624
Expected Distance (m)
9942 5780 4910 10441 5588 4751 9580 5989 5222
Difference (m) 2358 235 036 1889 421 236 1704 162 098
For the complete analysis please refer to Table A-4 in Appendix A
Table 5-6 Total and Average Differences between Actual and Calculated Advisories Alerts and Warnings (VEA)
TFHRC Advisory Alert Warning
Total Difference (m) 10139 1376 971
Average Difference (m) 2028 275 194
Results There were no outliers (False Negatives) in the data analyzed Hence Hypothesis 5 is satisfied at a 100 level of confidence
US Department of Transportation Office of the Assistant Secretary for Research and Technology
Intelligent Transportation Systems Joint Program Office
Task 8 D2X Hub Proof-of-Concept Test Evaluation Report ndash Final | 14
Hypothesis 6 Mobile Devices can capture and process Vehicle BSMs and issue warnings in time for pedestrians to avoid imminent vehicle collision
Data logs verified MDEA Log ndash BSM Location GPS Location Advisory Display Alert Display and Warning Display
Analysis
Assessing the distance at which an Advisory Alert and Warning were issued based on the speed of the vehicle (in the BSM received by the mobile device)
Observations a Considering the TFHRC results the average difference in distance for MDEA logging of
Advisories Alerts and Warnings were on average 278 m 323 m and 334 m respectively b Latency of less than a second was observed on MDEA and VEA Logs
sݐݑݍܧ ݎ ݑݐ dݒݏwarningandalertݕݎ ݐݏ ݓݎݐ ݏ
ௗ௩௦௬= lowastݒ9
lowast ሻ05ݒ 25ሾሺൌ 11 lowast ቊ ௧ଶݒ
ሿ 2ሺ34ሻ
ቋ
ଶݒሿ 2ሺ56ሻ
ቋ
Where
lowast ሻ05ݒ 25ሾሺൌ 11 lowast ቊ ௪
is the advisory display distance (meters) ௗ௩௦௬
is the alert display distance (meters) ௧
is the warning display distance (meters) ௐ
ݒ is the velocity of the vehicle (meters per second)
Chapter 5 Experimental Analysis
TF 71 Run 2 - MDEA
US Department of Transportation Office of the Assistant Secretary for Research and Technology
Intelligent Transportation Systems Joint Program Office
Task 8 D2X Hub Proof-of-Concept Test Evaluation Report ndash Final | 15
Source Battelle Google Maps February 2017
Figure 5-2 Advisory Alert and Warning Distances with Respect to MDEA
Chapter 5 Experimental Analysis
Table 5-7 Hypothesis 6 Analysis Data Sample
TFHRC1 TFHRC2 TFHRC3
Advisory Alert Warning Advisory Alert Warning Advisory Alert Warning
True Distance (m) 8756 5320 4651 9928 5276 4624 8952 5595 4890
Speed (mph) 2290 2509 2487 2514 2447 2415 2304 2603 2617
Expected distance (m) 9213 5736 4883 10115 5546 4707 9270 6030 5205
Difference (m) 458 416 232 187 270 084 318 436 315
For the complete analysis please refer to Table A-5 in Appendix A
Table 5-8 Total and Average Differences between Actual and Calculated Advisories Alerts and Warnings (MDEA)
TFHRC Advisory Alert Warning
Total Difference (m) 1392 1617 1671
Average Difference (m) 278 323 334
Results There were no false alarms detected at neither of the TFHRCATP tests performed Hence Hypothesis 6 is satisfied at a 100 level of confidence
Issues Identified GPS Inaccuracy ndash Cross Track Distance Issue
The accuracy of GPS as per the US government claims is +- 4 m This error in GPS accuracy was balanced by increasing the cluster radius to 7 m for all the tests at TFHRC This modification in cluster radius increased the efficiency of pedestrian detection by closing out the difference in Cross Track Distancersquo
There were no false alarms detected at neither of the TFHRCATP tests performed
US Department of Transportation Office of the Assistant Secretary for Research and Technology
Intelligent Transportation Systems Joint Program Office
Task 8 D2X Hub Proof-of-Concept Test Evaluation Report ndash Final | 16
Chapter 5 Experimental Analysis
Source Battelle Google Maps February 2017
Figure 5-3 Cross Track Distance between Pedestrian and Vehicle Path
US Department of Transportation Office of the Assistant Secretary for Research and Technology
Intelligent Transportation Systems Joint Program Office
Task 8 D2X Hub Proof-of-Concept Test Evaluation Report ndash Final | 17
Chapter 5 Experimental Analysis
Hypothesis 7 MDEA Log ndash GPS Location SafeUnsafe Zone Status and MAP Message Contents
Data logs verified MDEA Log ndash GPS Location SafeUnsafe Zone Status and MAP Message Contents
Analysis
Analyzed the percentage of properly classified safeunsafe zone detections The device was placed in the roadway ndash mobile device location was properly classified if it positions itself in an unsafe zone
Observations User State Change from Safe to Unsafe (when placed 20 m in the roadway) and Unsafe to Safe (when placed 50 m from the roadway) were captured accurate and timely
Table 5-9 Hypothesis 7 Analysis Data Sample
TFHRC 1 TFHRC 2 TFHRC 3 TFHRC 4 TFHRC 5
User State Change Is Safe Icon False (2 m in the roadway)
111438 112533 114400 114801 115408
Properly Processed
User State Change Is Safe Icon True (5 m from the roadway)
111504 112619 114438 114829 115444
Properly Processed
For the complete analysis please refer to Table A-6 in Appendix A
US Department of Transportation Office of the Assistant Secretary for Research and Technology
Intelligent Transportation Systems Joint Program Office
Task 8 D2X Hub Proof-of-Concept Test Evaluation Report ndash Final | 18
Chapter 5 Experimental Analysis
Source Battelle Google Maps February 2017
Figure 5-4 Safe and Unsafe Zones at TFHRC Test Site
Results There were no outliers (False Negatives) in the data analyzed Hence Hypothesis 7 is satisfied at a 100 level of confidence
US Department of Transportation Office of the Assistant Secretary for Research and Technology
Intelligent Transportation Systems Joint Program Office
Task 8 D2X Hub Proof-of-Concept Test Evaluation Report ndash Final | 19
Chapter 5 Experimental Analysis
Hypothesis 8 amp 9 The VEA can coordinate taxi travel requests from an MDEA
Data logs verified MDEA Log ndash PMM Send Occurrence PMM contents PMM-RSP Receive Occurrence Coordination Status and PMM-Cancel Sent Occurrence
Analysis
Analyzed the percentage of PMM and PMM ndash Cancel messages properly processed by in-vehicle devices
Analyzed the percentage of PMM-RSP messages properly processed by mobile devices This analysis was performed for PMM Messages communicated through both DSRC and
Cellular
Observations 16 out of 204 checks had a failure during tests performed under ATP
Table 5-10 Hypothesis 8 amp 9 Analysis Data Sample
TFHRC 1 TFHRC 2 TFHRC 3 TFHRC 4 TFHRC 5
Analyze the percentage of PMM messages properly processed by in-vehicle devices
MDEA Log ndash PMM Send occurrence
Check Check Check Check Check
MDEA Log ndash PMM contents
All Present All Present All Present All Present All Present
Experimental Log ndash Information entered into
Mobile Device by Traveler
VEA Log ndash PMM Receive occurrence
Check Check Check Check Check
Analyze the percentage of PMM-RSP messages properly processed by mobile devices
Experimental Log ndash Driver Acceptance
VEA Log ndash Driver acceptance
Check Check Check Check Check
VEA Log ndash PMM-RSP Send occurrence
Check Check Check Check Check
MDEA Log ndash PMM-RSP Receive occurrence
Check Check Check Check Check
MDEA Log ndash Coordination Status
Check Check Check Check Check
Experimental Log ndash Coordination Success
Display
US Department of Transportation Office of the Assistant Secretary for Research and Technology
Intelligent Transportation Systems Joint Program Office
Task 8 D2X Hub Proof-of-Concept Test Evaluation Report ndash Final | 20
Chapter 5 Experimental Analysis
TFHRC 1 TFHRC 2 TFHRC 3 TFHRC 4 TFHRC 5
Analyze the percentage of PMM-Cancel messages properly processed by in-vehicle devices
MDEA Log ndash PMM-Cancel Sent Occurrence
Check Check Check Check Check
VEA Log ndash PMM-Cancel Received
Occurrence Check Check Check Check Check
For the complete analysis please refer to Table A-7 in Appendix A
Results Considering the tests performed at TFHRC Hypothesis 8 is satisfied at a 100 level of confidence However ATP tests satisfied the hypothesis at a confidence level of 9215
Issues Identified
Some issues observed for cloud communication during ATP testing at Columbus OH
Delay in Cloud PMM-cancel for VEA ndash 8 instances Adding a trip twice ndash 5 instances Some PMMs not being cancelled ndash 3 instances
All these issues were addressed prior to TFHRC tests
TFHRC tests did not have any of the above issues
US Department of Transportation Office of the Assistant Secretary for Research and Technology
Intelligent Transportation Systems Joint Program Office
Task 8 D2X Hub Proof-of-Concept Test Evaluation Report ndash Final | 21
Chapter 5 Experimental Analysis
Hypothesis 10 The traveler can receive arrival updates from a taxi or transit vehicle
Data logs verified VEA Log ndash PMM-ARRIVE Send Occurrence
MDEA Log ndash PMM-ARRIVE receive occurrence
Analysis
Analyzed the success rate of receiving a PMM-Arrive message via DSRC
Observations One test case at TFHRC failed due to equipment failure (CCP lost its location) All other tests satisfied the hypothesis
Table 5-11 Hypothesis 10 Analysis Data Sample
TFHRC 1
TFHRC 2
TFHRC 3
TFHRC 4
TFHRC 5
TFHRC 6
TFHRC 7
DSRC (Taxi)
Analyze the success rate of receiving a PMM-Arrive message
VEA Log ndash PMM-ARRIVE
Send occurrence
Fail Check Check Check Check Check Check
MDEA Log ndash PMM-ARRIVE
Receive occurrence
Fail Check Check Check Check Check Check
For the complete analysis please refer to Table A-8 in Appendix A
Results Considering the tests at TFHRC the hypothesis is satisfied at a confidence level of 8571 12 out of 14 tests were successful
US Department of Transportation Office of the Assistant Secretary for Research and Technology
Intelligent Transportation Systems Joint Program Office
Task 8 D2X Hub Proof-of-Concept Test Evaluation Report ndash Final | 22
Chapter 5 Experimental Analysis
Hypothesis 11 amp 12 The MDEA can detect when a traveler transitions from a pedestrian to a light duty vehicle or from a light duty vehicle to a pedestrian
Data logs verified MDEA Log ndash Travel Mode Status Change Experimental Log ndash Mode Transition Detection Log
Analysis 1 Assessed the change in ldquoTravel Mode Statusrdquo after the pedestrian enters the vehicle
(The threshold value for Travel Mode Status Change is 10 secs) 2 Assessed the false positive rate of transition detection
Observations Accelerometer tests on average took 75 secs and 44 secs to detect in-vehicle and on-foot respectively However Bluetooth beacon tests on a verage took 17 secs and 1 1 secs to detect in-vehicle and on-foot respectively This quantifies the unreliable nature of Bluetooth Beacons as used in this system
Table 5-12 Hypothesis 11 amp 12 Analysis Data Sample
Mode Detection Method On-foot to In-Vehicle Transition time (Sec)
In-Vehicle to On-foot Transition Time (Sec)
Accelerometer 75 44
Bluetooth Beacon 17 11
Results Hypothesis is proved as 100 confident during the accelerometer tests However none of the tests with Bluetooth Beacon satisfied the hypothesis (all false negatives)
US Department of Transportation Office of the Assistant Secretary for Research and Technology
Intelligent Transportation Systems Joint Program Office
Task 8 D2X Hub Proof-of-Concept Test Evaluation Report ndash Final | 23
Chapter 5 Experimental Analysis
Hypothesis 13 The MDEA can coordinate maintain and cancel travel with another MDEA via Wi-Fi Direct
Data logs verified MDEA (1) Log ndash Coordination Request Received Occurrence Coordination Request Contents Coordination Acceptance Sent Occurrence Coordination Acceptance Notification Coordination Heartbeat Received Occurrence Coordination Cancel Response Sent occurrence and Coordination Disband Sent occurrence
MDEA (2) Log ndash Coordination Request Sent Occurrence Coordination Confirmation received Occurrence Coordination Heartbeat Response Sent Occurrence Coordination Acceptance received Occurrence
Analysis 1 Determined the percentage of Coordination Request Acceptance Heartbeat Cancel and
Disband messages properly processed by mobile devices 2 Assessed the message contents for consistency
Observations This test is performed in a highly-controlled environment This means selection of specific devices and designating them with specific roles This approach was chosen due to poor Wi-Fi direct performance with our system that would have otherwise hindered the ability to conduct the testing and collect the necessary data
US Department of Transportation Office of the Assistant Secretary for Research and Technology
Intelligent Transportation Systems Joint Program Office
Task 8 D2X Hub Proof-of-Concept Test Evaluation Report ndash Final | 24
Chapter 5 Experimental Analysis
Table 5-13 Hypothesis 13 Analysis Data Sample
13117 2117
TFHRC 1
TFHRC 2
TFHRC 3
TFHRC 4
TFHRC 5
TFHRC 6
TFHRC 7
TFHRC 8
TFHRC 9
TFHRC 10
Coordination Request Sent by
Y
Fai
l T
rave
ler
Y c
ould
no
t joi
n th
e ad
-hoc
trav
el g
roup
40951 Check
F
ail
Tra
vele
r Y
cou
ld
not j
oin
the
ad-h
oc tr
avel
gro
up
Check Check Check Check Check Check
Coordination Request Received
by X check Check Check Check Check Check Check Check
Request Confirmed by X
check Check Check Check Check Check Check Check
Confirmation Received by Y
Coordination Request Sent by
Z
check Check Check Check Check Check Check Check
41047 Check Check Check Check Check Check Check
Coordination Request Received
by X check Check Check Check Check Check Check Check
Request Confirmed by X
check Check Check Check Check Check Check Check
Confirmation Received by Z
Coordination Heart Beat
Transmitted by Y amp Z
check Check Check Check Check Check Check Check
check Check Check Check Check Check Check Check
Heart Beat Response
received by X
Ride Arrived Messages
check Check Check Check Check Check Check Check
41303 Check Check Check Check Check Check Check
Coordination Cancel by walking
away Check Check Check Check Check This step not tested on this day
Coordination Cancel by Manual
request This step not tested on this day
Check Check Check Check Check
Disband Group after entering into
vehicle Check Check Check Check Check
For the complete analysis please refer to Table A-9 and Table A-10 in Appendix A
Results There were 30 outliers out of 198 checks (False Negatives) in the data analyzed Hence Hypothesis 13 is satisfied at an 8484 level of confidence
US Department of Transportation Office of the Assistant Secretary for Research and Technology
Intelligent Transportation Systems Joint Program Office
Task 8 D2X Hub Proof-of-Concept Test Evaluation Report ndash Final | 25
US Department of Transportation Office of the Assistant Secretary for Research and Technology
Intelligent Transportation Systems Joint Program Office
Task 8 D2X Hub Proof-of-Concept Test Evaluation Report ndash Final | 26
Chapter 5 Experimental Analysis
Hypothesis 14 The RSU can broadcast a SPaT and MAP message via DSRC that can be received by mobile devices
Data logs verified MDEA Log ndash BSM received and PSM send occurrences
Analysis 1 Determined the percentage of SPaT messages received by mobile devices when within
100 meters of RSE Assessed message contents for consistency 2 Determined the percentage of MAP messages received by mobile devices when within
100 meters of RSE Assessed message contents for consistency
Observations Considering test 5444 all the SPa T messages were transmitted and received at a rate of 1sec Similarly all the MAP messages were transmitted and received at a rate better than 5sec
Table 5-14 Hypothesis 14 Analysis Data Sample
ID Date Message
5 13117 163842 Dsrc Rx Spat id19
6 13117 163842 Dsrc Rx Map id18
9 13117 163843 Dsrc Rx Spat id19
10 13117 163843 Dsrc Rx Bsm Lat389546323 Long -771488295 Head 2713375 Sp 0
12 13117 163843 Dsrc Rx Bsm Lat389546138 Long -771483988 Head 2559125 Sp 0
13 13117 163844 Dsrc Rx Spat id19
14 13117 163844 Dsrc Rx Bsm Lat389546323 Long -771488297 Head 2713375 Sp 0
16 13117 163844 Dsrc Rx Bsm Lat389546138 Long -771483987 Head 2559125 Sp 0
17 13117 163844 Dsrc Rx Map id18
18 13117 163844 Dsrc Rx Bsm Lat389546322 Long -7714883 Head 2713375 Sp 0
20 13117 163845 Dsrc Rx Bsm Lat389546137 Long -771483987 Head 2559125 Sp 0
21 13117 163845 Dsrc Rx Bsm Lat389546322 Long -771488302 Head 2713375 Sp 0
22 13117 163845 Dsrc Rx Spat id19
23 13117 163845 Dsrc Rx Bsm Lat389546137 Long -771483987 Head 2559125 Sp 0
25 13117 163845 Dsrc Rx Bsm Lat38954632 Long -771488302 Head 2713375 Sp 0
26 13117 163846 Dsrc Rx Bsm Lat389546135 Long -771483987 Head 2559125 Sp 0
27 13117 163846 Dsrc Rx Spat id19
29 13117 163846 Dsrc Rx Bsm Lat389546318 Long -771488303 Head 2713375 Sp 0
31 13117 163846 Dsrc Rx Map id18
Results There were no outliers (False Negatives) in the data analyzed Hence Hypothesis 14 is satisfied at a 100 level of confidence
Chapter 5 Experimental Analysis
Hypothesis 15 The RSU can store all messages received via DSRC
Data logs verified MDEA Log ndash All Occurrences of messages sent via DSRC and Message Contents RSU Log ndash Message Received Occurrence and Message Contents
Analysis 1 Assessed the percentage of messages received from mobile devices within 100 meters of
RSE Assess message contents to make sure they are consistent
Observations a Considering the message logs from test cases 5411 5444 5471 there were instances
where PSMs were logged at a rate of less than 10sec Also there were test cases that had no reception of PSMs This clearly indicates the reception issues with RSU CCP unit One prime focus for the Large-Scale Field Test is to improve the reliability of the hardware associated with RSU
b The message contents in all the DSRC messages were consistent throughout the test logs
Table 5-15 Hypothesis 15 Analysis Data Sample
Date Time
Vehicle Range and Advisory Distance wrt
Speed Speed (mph)
In Range
Out of Range
Distance (m)
RSU Log PSM
Message RateSec
13117 101316 IsBsmClose Dist
975500061708885lt AdvDist 1024200201024
255 98 8
13117 101332 IsBsmClose Dist
570797651794001lt AdvDist 666000057888
173 57 6
13117 101340 IsBsmClose Dist
57448436831453lt AdvDist 601199821728
149 57 1
13117 101529 IsBsmClose Dist
975729907380225lt AdvDist 102240014976
254 98 0
13117 101538 IsBsmClose Dist
399317028326919lt AdvDist 102240014976
250 4 1
For the complete analysis please refer to Table A-1 in Appendix A
US Department of Transportation Office of the Assistant Secretary for Research and Technology
Intelligent Transportation Systems Joint Program Office
Task 8 D2X Hub Proof-of-Concept Test Evaluation Report ndash Final | 27
Chapter 5 Experimental Analysis
Table 5-16 Data Usage Statistics
17-Jan 18-Jan 19-Jan 20-Jan 31-Jan 1-Feb Average Maximum
Total Usage (MB) 3805 626 714 2713 4873 1355 984 2713
TMX core usage (MB) 271 450 468 1991 345 90 705 1991
of TMX usage 71 72 66 73 71 66 71 73
Results The hypothesis statement of RSU being able to store all messages received via DSRC is not satisfied at 100 level of confidence due to hardware issues
US Department of Transportation Office of the Assistant Secretary for Research and Technology
Intelligent Transportation Systems Joint Program Office
Task 8 D2X Hub Proof-of-Concept Test Evaluation Report ndash Final | 28
Chapter 6 Lessons Learned and Recommendations
Lessons Learned
The Lessons Learned from the Proof-of-Concept testing are summarized as follows
The ability to reliably generate transmit and receive messages between mobile devices and connected vehicles was demonstrated
The messages to incorporate mobile devices into the C V environment functioned as designed and provided the necessary data for the prototype mobility and safety applications
The prototype safety and mobility software applications functioned well (as designed)
Limitations of technology and hardware issues caused the majority of performance shortfalls
Mixed results were achieved for the various communication methods tested
a Cellular functioned well with our system
b Wi-Fi Direct connectivity was unreliable with our system
c DSRC hardware problems caused communication problems with our system
GPS accuracy limitations were observed as expected
Wi-Fi Direct Connectivity
The connection process was prone to failure at multiple points with no indication to the application why connection failed
TFHRC success rate was achieved by selecting specific devices that worked best for specific roles otherwise a failure rate gt50 would have been expected based on earlier testing
Canvasing of developer community found similar observations no solutions for our system
Wi-Fi Direct connection process requires authorization from the user of the target device in a real world environment such a request would most likely be denied if noticed at all
US Department of Transportation Office of the Assistant Secretary for Research and Technology
Intelligent Transportation Systems Joint Program Office
Task 8 D2X Hub Proof-of-Concept Test Evaluation Report ndash Final | 29
Chapter 6 Lessons Learned and Recommendations
DSRC Hardware
Common Computer Platform (CCP) Pre-production engineering units were used which were determined to have an impedance mismatch between the DSRC chip and RF connector that caused reduction of signal strength
Arada LocoMate ME There were occasional Bluetooth connection failures to mobile devices as well as occasional DSRC transmissionreception failures Longer term it is assumed that DSRC radios will be integrated into smartphones thus obviating the current issues
Recommendations
Based on outcomes of Proof-of-Concept Testing the following prototype system design changes are recommended to be implemented prior to the larger-scale prototype field test
Add Cellular-based communication for Travel Group coordination between mobile devices
New and improved CCP units will be used for the larger-scale field test
For in-vehicle detection use Accelerometer method as the most reliable option
US Department of Transportation Office of the Assistant Secretary for Research and Technology
Intelligent Transportation Systems Joint Program Office
Task 8 D2X Hub Proof-of-Concept Test Evaluation Report ndash Final | 30
APPENDIX A Comprehensive Data Analysis Tables
Note For all the analysis results depicted below the term ldquocheckrdquo refers to the ldquosuccessrdquo of desired action
Table A-1 Complete Data Analysis ndash Hypothesis 1 4 amp 15
Date Time Vehicle Range and Advisory
Distance wrt Speed Speed In
Range Out of
Range Distance
RSU Log PSM
Message RateSec
VEA Log PSM
Message Rate
1312017 101316 IsBsmClose Dist 975500061708885lt
AdvDist 1024200201024 255 X 98 8 10
1312017 101332 IsBsmClose Dist 570797651794001lt
AdvDist 666000057888 173 X 57 6 10
1312017 101340 IsBsmClose Dist 57448436831453lt
AdvDist 601199821728 149 X 57 1 10
1312017 101529 IsBsmClose Dist 975729907380225lt
AdvDist 102240014976 254 X 98 0 10
1312017 101538 IsBsmClose Dist 399317028326919lt
AdvDist 102240014976 250 X 4 1 10
1312017 101553 IsBsmClose Dist 600719107941917lt
AdvDist 70199987616 174 X 60 0 10
1312017 102029 IsBsmClose Dist 944643508928866lt
AdvDist 1008000141984 251 X 95 0 9
1312017 102048 IsBsmClose Dist 592561932680623lt
AdvDist 628200188352 156 X 59 0 9
US Department of Transportation Office of the Assistant Secretary for Research and Technology
Intelligent Transportation Systems Joint Program Office
Task 8 D2X Hub Proof-of-Concept Test Evaluation Report ndash Final | A-1
APPENDIX A Comprehensive Data Analysis Tables
Date Time Vehicle Range and Advisory
Distance wrt Speed Speed In
Range Out of Range Distance
RSU Log PSM
Message RateSec
VEA Log PSM
Message Rate
1312017 102054 IsBsmClose Dist 616348297460404lt
AdvDist 644399845056 160 X 62 3 11
1312017 102105 IsBsmClose Dist 871180496389495lt
AdvDist 1092600137376 247 X 87 4 9
1312017 102206 IsBsmClose Dist 977301610734722lt
AdvDist 1130400006912 295 X 98 0 10
1312017 102228 IsBsmClose Dist 577576034007057lt
AdvDist 60659997552 151 X 58 2 10
1312017 102332 IsBsmClose Dist 101193300977461lt
AdvDist 10386002088 258 X 101 10 10
1312017 102356 IsBsmClose Dist 595641466972855lt
AdvDist 660599904096 164 X 60 6 10
1312017 102623 IsBsmClose Dist 100217014111125lt
AdvDist 1024200201024 253 X 100 7 10
1312017 102650 IsBsmClose Dist 540919707235241lt
AdvDist 887399925984 221 X 54 0 10
1172017 111504 IsBsmClose Dist 100564061581794lt
AdvDist 1169999927712 291 X 101 10 10
1172017 112437 IsBsmClose Dist 992912014791515lt
AdvDist 10386002088 258 X 99 10 10
1172017 112837 IsBsmClose Dist 106684353810469lt
AdvDist 1076400078336 261 X 107 10 10
US Department of Transportation Office of the Assistant Secretary for Research and Technology
Intelligent Transportation Systems Joint Program Office
Task 8 D2X Hub Proof-of-Concept Test Evaluation Report ndash Final | A-2
APPENDIX A Comprehensive Data Analysis Tables
Date Time Vehicle Range and Advisory
Distance wrt Speed Speed In
Range Out of Range Distance
RSU Log PSM
Message RateSec
VEA Log PSM
Message Rate
1172017 113148 IsBsmClose Dist 1124753473133lt AdvDist
1186199986752 268 X 112 10 10
1172017 113332 IsBsmClose Dist 106022149777593lt
AdvDist 1126799904384 260 X 106 10 10
1172017 113336 IsBsmClose Dist 59429630331283lt
AdvDist 1196999892 298 X 59 10 10
1172017 113357 IsBsmClose Dist 657937887214709lt
AdvDist 1193400191808 297 X 66 10 10
1172017 113627 IsBsmClose Dist 965542357439439lt
AdvDist 1080000180864 260 X 97 10 10
1172017 113629 IsBsmClose Dist 821301583410616lt
AdvDist 1074600027072 270 X 82 10 10
1172017 113803 IsBsmClose Dist 994884887192582lt
AdvDist 104580001152 251 X 99 10 10
1172017 113811 IsBsmClose Dist 16809952777894lt
AdvDist 106200007056 257 X 17 10 10
1172017 114114 IsBsmClose Dist 948985801452811lt
AdvDist 986399929152 245 X 95 10 10
1172017 114133 IsBsmClose Dist 141255704529106lt
AdvDist 963000067392 242 X 14 10 10
1172017 114136 IsBsmClose Dist 377627357471613lt
AdvDist 977400075168 243 X 38 10 10
US Department of Transportation Office of the Assistant Secretary for Research and Technology
Intelligent Transportation Systems Joint Program Office
Task 8 D2X Hub Proof-of-Concept Test Evaluation Report ndash Final | A-3
APPENDIX A Comprehensive Data Analysis Tables
Date Time Vehicle Range and Advisory
Distance wrt Speed Speed In
Range Out of Range Distance
RSU Log PSM
Message RateSec
VEA Log PSM
Message Rate
1172017 114403 IsBsmClose Dist 114490146784404lt
AdvDist 1225799907552 266 X 114 10 10
1172017 114415 IsBsmClose Dist 280463490772458lt
AdvDist 71100013248 161 X 28 10 10
1172017 114735 IsBsmClose Dist 102043927314914lt
AdvDist 1040399857728 259 X 102 10 10
1172017 114755 IsBsmClose Dist 185020887331204lt
AdvDist 112499985312 275 X 19 10 10
1192017 35605 IsBsmClose Dist 107928079653642lt
AdvDist 1107000145152 272 X 108 9 9
1192017 35630 IsBsmClose Dist 99759104887202lt
AdvDist 1184399935488 294 X 100 10 10
1192017 35837 IsBsmClose Dist 110291146846666lt
AdvDist 115020016848 286 X 110 10 10
1192017 40057 IsBsmClose Dist 998997459961241lt
AdvDist 1260000076896 313 X 100 10 10
1192017 40300 IsBsmClose Dist 100209094247195lt
AdvDist 106919987328 260 X 100 10 10
1192017 40410 IsBsmClose Dist 100723184500334lt
AdvDist 1097999888832 273 X 101 6 10
1192017 41103 IsBsmClose Dist 977354295877856lt
AdvDist 1008000141984 251 X 98 10 10
US Department of Transportation Office of the Assistant Secretary for Research and Technology
Intelligent Transportation Systems Joint Program Office
Task 8 D2X Hub Proof-of-Concept Test Evaluation Report ndash Final | A-4
APPENDIX A Comprehensive Data Analysis Tables
Date Time Vehicle Range and Advisory
Distance wrt Speed Speed In
Range Out of Range Distance
RSU Log PSM
Message RateSec
VEA Log PSM
Message Rate
1192017 41311 IsBsmClose Dist 10190842581135lt
AdvDist 1040399857728 259 X 102 10 10
1192017 41423 IsBsmClose Dist 995536361906761lt
AdvDist 1009799790912 251 X 100 10 10
1192017 41534 IsBsmClose Dist 10075608603652lt
AdvDist 106919987328 264 X 101 10 10
US Department of Transportation Office of the Assistant Secretary for Research and Technology
Intelligent Transportation Systems Joint Program Office
Task 8 D2X Hub Proof-of-Concept Test Evaluation Report ndash Final | A-5
APPENDIX A Comprehensive Data Analysis Tables
Table A-2 Complete Data Analysis ndash Hypothesis 2
US Department of Transportation Office of the Assistant Secretary for Research and Technology
Intelligent Transportation Systems Joint Program Office
Task 8 D2X Hub Proof-of-Concept Test Evaluation Report ndash Final | A-6
Date Test
Number PSMs Generated by
Trav X and Trav Y Transition to In Group Trav Y PSM Ceased Only Trav X PSM
Received
1312017 TFHRC 1 111116 111240 Check 111305
1312017 TFHRC 2 Grouping Failed Grouping Failed Grouping Failed Grouping Failed
1312017 TFHRC 3 112346 112448 Check 112508
1312017 TFHRC 4 114208 114301 Check 114345
1312017 TFHRC 5 114609 114658 Check 114721
1312017 TFHRC 6 115222 115313 Check 115342
1182017 ATP 1 104400 104527 Check 104601
1182017 ATP 2 105356 105455 Check 105546
1182017 ATP 3 110059 110150 Check 110322
1182017 ATP 4 111222 111310 Check 111329
1182017 ATP 5 111515 111616 Check 111630
1182017 ATP 6 111823 111906 Check 111917
1182017 ATP 7 112116 112157 Check 112209
1182017 ATP 8 112814 112855 Check 112917
1182017 ATP 9 113142 113230 Check 113248
1182017 ATP 10 113501 113545 Check 113608
1192017 ATP 11 44728 44842 Check 45007
1192017 ATP 12 Radio Failure Test Terminated Radio Failure Test Terminated Radio Failure Test Terminated Radio Failure Test Terminated
1192017 ATP 13 45548 45637 Check 45728
1192017 ATP 14 45946 50047 Check 50107
1192017 ATP 15 50353 50444 Check 50513
1192017 ATP 16 50730 50823 Check 50839
APPENDIX A Comprehensive Data Analysis Tables
Table A-3 Complete Data Analysis ndash Hypothesis 3
US Department of Transportation Office of the Assistant Secretary for Research and Technology
Intelligent Transportation Systems Joint Program Office
Task 8 D2X Hub Proof-of-Concept Test Evaluation Report ndash Final | A-7
Date Description
MDEA not in Vehicle
MDEA Transmits
PSMs Time of MDEA
Mode Transition
MDEA Ceases Transmitting
PSMs
1312017 TFHRC 1 Check Check 0443101852 Check
1312017 TFHRC 2 Check Check 0445243056 Check
1312017 TFHRC 3 Check Check 0447569444 Check
1312017 TFHRC 4 Check Check 0448888889 Check
1312017 TFHRC 5 Check Check 045005787 Check
1312017 TFHRC 6 Check Check 0451666667 Check
1172017 ATP 1 Check Check 0501898148 Check
1172017 ATP 2 Check Check 0504201389 Check
1172017 ATP 3 Check Check 0506215278 Check
1172017 ATP 4 Check Check 0507858796 Check
1172017 ATP 5 Check Check 0508981481 Check
1172017 ATP 6 Check Check 0510219907 Check
1172017 ATP 7 Check Check 0511736111 Check
1172017 ATP 8 Check Check 05128125 Check
1172017 ATP 9 Check Check 0513831019 Check
1172017 ATP 10 Check Check 0514884259 Check
1172017 ATP 11 Check Check 0185590278 Check
1172017 ATP 12 Check Check 0187210648 Check
1172017 ATP 13 Check Check 0188425926 Check
1172017 ATP 14 Check Check 0190289352 Check
1172017 ATP 15 Check Check 0191863426 Check
APPENDIX A Comprehensive Data Analysis Tables
Table A-4 Complete Data Analysis ndash Hypothesis 5 (VEA)
Test Number
Type of Message
True Distance (m)
Speed (MPH)
Expected Distance (m)
Difference (m)
TFHRC1
Advisory 7584 2471 9942 2358
Alert 5545 2523 5780 235
Warning 4874 2498 4910 036
TFHRC2
Advisory 8552 2595 10441 1889
Alert 5167 2461 5588 421
Warning 4515 2433 4751 236
TFHRC3
Advisory 7876 2381 9580 1704
Alert 5827 2590 5989 162
Warning 5124 2624 5222 098
TFHRC4
Advisory 7529 2818 11338 3809
Alert 6047 2744 6482 435
Warning 5323 2714 5450 127
TFHRC5
Advisory 9292 2404 9672 380
Alert 5350 2423 5472 122
Warning 4081 2352 4556 475
ATP1
Advisory 000 000
Alert 000 000
Warning 000 000
ATP2
Advisory 5787 1644 6614 827
Alert 3074 1640 3289 215
Warning 2627 1640 2947 320
ATP3
Advisory 4204 1685 6779 2575
Alert 3300 1672 3370 070
Warning 2854 1658 2985 131
ATP4
Advisory 4296 1753 7053 2757
Alert 3346 1791 3679 333
Warning 2871 1755 3194 323
ATP5
Advisory 000 000
Alert 000 000
Warning 1069 1706 3088 2019
ATP6
Advisory 3632 1640 6598 2966
Alert 000 000
Warning 2770 1594 2850 080
US Department of Transportation Office of the Assistant Secretary for Research and Technology
Intelligent Transportation Systems Joint Program Office
Task 8 D2X Hub Proof-of-Concept Test Evaluation Report ndash Final | A-8
APPENDIX A Comprehensive Data Analysis Tables
Test Number
Type of Message
True Distance (m)
Speed (MPH)
Expected Distance (m)
Difference (m)
ATP7
Advisory 000 000
Alert 000 000
Warning 1919 1887 3483 1564
ATP8
Advisory 4492 1741 7005 2513
Alert 3113 1687 3409 296
Warning 2661 1680 3032 371
ATP9
Advisory 4694 1628 6550 1856
Alert 2991 1570 3113 122
Warning 2572 1549 2756 184
ATP10
Advisory 000 000
Alert 000 000
Warning 650 2505 4927 4277
ATP11
Advisory 000 000
Alert 000 000
Warning 1914 2398 4666 2752
ATP12
Advisory 000 000
Alert 000 000
Warning 460 2293 4415 3955
ATP13
Advisory 000 000
Alert 000 000
Warning 2732 2535 5001 2269
ATP14
Advisory 000 000
Alert 000 000
Warning 2358 2361 4577 2219
ATP15
Advisory 000 000
Alert 000 000
Warning 1107 2459 4814 3707
ATP16
Advisory 5668 1982 7974 2306
Alert 000 000
Warning 1502 1906 3525 2023
ATP17
Advisory 000 000
Alert 000 000
Warning 3183 2420 4720 1537
US Department of Transportation Office of the Assistant Secretary for Research and Technology
Intelligent Transportation Systems Joint Program Office
Task 8 D2X Hub Proof-of-Concept Test Evaluation Report ndash Final | A-9
Table A-5 Complete Data Analysis ndash Hypothesis 6 (MDEA)
Test Number
Type of Message
True Distance (m)
Speed (MPH)
Expected Distance (m)
Difference (m)
TFHRC1
Advisory 8756 2290 9213 457
Alert 5320 2509 5736 416
Warning 4651 2487 4883 232
TFHRC2
Advisory 9928 2514 10115 187
Alert 5276 2447 5546 270
Warning 4624 2415 4707 084
TFHRC3
Advisory 8952 2304 9270 318
Alert 5595 2603 6030 436
Warning 4890 2617 5205 315
TFHRC4
Advisory 9752 2514 10115 363
Alert 6290 2769 6564 274
Warning 4844 2693 5396 552
TFHRC5
Advisory 9613 2406 9680 067
Alert 5242 2420 5463 221
Warning 4080 2357 4568 488
ATP1
Advisory 5938 2183 8783 2845
Alert 4314 2120 4580 266
Warning 3644 2111 3989 345
ATP2
Advisory 6452 1641 6602 150
Alert 3296 1691 3419 123
Warning 2600 1601 2865 265
ATP3
Advisory 6212 1628 6550 338
Alert 3200 1655 3327 127
Warning 2707 1641 2949 242
ATP4
Advisory 6420 1646 6622 202
Alert 3300 1780 3650 350
Warning 2878 1704 3084 206
ATP5
Advisory 6673 1677 6747 074
Alert 3400 1847 3828 428
Warning 2972 1807 3307 335
ATP6
Advisory 6100 1628 6550 450
Alert 3100 1637 3281 181
Warning 2500 1597 2857 357
APPENDIX A Comprehensive Data Analysis Tables
US Department of Transportation Office of the Assistant Secretary for Research and Technology
Intelligent Transportation Systems Joint Program Office
Task 8 D2X Hub Proof-of-Concept Test Evaluation Report ndash Final | A-10
APPENDIX A Comprehensive Data Analysis Tables
Test Number
Type of Message
True Distance (m)
Speed (MPH)
Expected Distance (m)
Difference (m)
ATP7
Advisory 7500 1972 7934 434
Alert 3882 1914 4008 126
Warning 3400 1946 3614 214
ATP8
Advisory 6659 1744 7017 358
Alert 3263 1682 3396 133
Warning 2900 1682 3037 137
ATP9
Advisory 6605 1659 6675 070
Alert 2900 1556 3078 178
Warning 2365 1561 2781 416
ATP10
Advisory 9214 2491 10022 808
Alert 5859 2688 6301 442
Warning 5200 2644 5273 073
ATP11
Advisory 8485 2487 10006 1521
Alert 5376 2487 5668 292
Warning 4716 2483 4873 157
ATP12
Advisory 9001 2433 9789 788
Alert 5395 2420 5463 068
Warning 4103 2330 4503 400
ATP13
Advisory 8615 2559 10296 1681
Alert 000 000 000 000
Warning 4930 2581 5115 185
ATP14
Advisory 6119 2491 10022 3903
Alert 5500 2491 5681 181
Warning 3800 2402 4676 876
ATP15
Advisory 7546 2603 10473 2927
Alert 6000 2661 6215 215
Warning 3100 2603 5170 2070
ATP16
Advisory 7931 2089 8405 474
Alert 3995 1950 4106 111
Warning 3500 1923 3563 063
ATP17
Advisory 8243 2049 8244 001
Alert 5260 2465 5601 341
Warning 4718 2438 4763 045
US Department of Transportation Office of the Assistant Secretary for Research and Technology
Intelligent Transportation Systems Joint Program Office
Task 8 D2X Hub Proof-of-Concept Test Evaluation Report ndash Final | A-11
Table A-6 Complete Data Analysis ndash Hypothesis 7
Date Test
Number
User State Change Is
Safe Icon False
Properly Processed
User State Change Is
Safe Icon True
Properly Processed
1312017 TFHRC 1 111438 X 111504 X
1312017 TFHRC 3 112533 X 112619 X
1312017 TFHRC 4 114400 X 114438 X
1312017 TFHRC 5 114801 X 114829 X
1312017 TFHRC 6 115408 X 115444 X
1182017 ATP 1 105056 X 105116 X
1182017 ATP 2 105622 X 105656 X
1182017 ATP 3 110348 X 110436 X
1182017 ATP 4 111355 X 111417 X
1182017 ATP 5 111655 X 111717 X
1182017 ATP 6 111947 X 112007 X
1182017 ATP 7 112235 X 112305 X
1182017 ATP 8 112937 X 113013 X
1182017 ATP 9 113313 X 113353 X
1182017 ATP 10 113636 X 113708 X
1192017 ATP 11 45035 X 45057 X
1192017 ATP 13 45806 X 45828 X
1192017 ATP 14 50144 X 50202 X
1192017 ATP 15 50542 X 50600 X
1192017 ATP 16 50903 X 50929 X
APPENDIX A Comprehensive Data Analysis Tables
US Department of Transportation Office of the Assistant Secretary for Research and Technology
Intelligent Transportation Systems Joint Program Office
Task 8 D2X Hub Proof-of-Concept Test Evaluation Report ndash Final | A-12
APPENDIX A Comprehensive Data Analysis Tables
Table A-7 Complete Data Analysis ndash Hy pothesis 8 amp 9
US Department of Transportation Office of the Assistant Secretary for Research and Technology
Intelligent Transportation Systems Joint Program Office
Task 8 D2X Hub Proof-of-Concept Test Evaluation Report ndash Final | A-13
Test Number
Analyze the percentage of PMM messages properly processed by
in-vehicle devices Analyze the percentage of PMM-RSP messages
properly processed by mobile devices
Analyze the percentage of PMM-Cancel messages
properly processed by in-vehicle devices
MDEA Log ndash PMM Send
occurrence
MDEA Log ndash
PMM contents
VEA Log ndash PMM
Receive occurrence
VEA Log ndash Driver
acceptance
VEA Log ndash PMM-RSP
Send occurrence
MDEA Log ndash PMM-RSP
Receive occurrence
MDEA Log ndash Coordination
Status
MDEA Log ndash PMM-
Cancel Sent Occurrence
VEA Log ndash PMM-
Cancel Received
Occurrence
TFHRC 1 Check All Present Check Check Check Check Check Check Check
TFHRC 2 Check All Present Check Check Check Check Check Check Check
TFHRC 3 Check All Present Check Check Check Check Check Check Check
TFHRC 4 Check All Present Check Check Check Check Check Check Check
TFHRC 5 Check All Present Check Check Check Check Check Check Check
ATP 1 Check All Present Check Check Check Check Check Check Check
ATP 2 Check All Present Check Check Check Check Check Check Check
ATP 3 Check All Present Check Check Check Check Check Check Check
ATP 4 Check All Present Check Check Check Check Check Check Check
ATP 5 Check All Present Check Check Check Check Check Check Check
ATP 6 Check All Present Check Check Check Check Check Check Check
ATP 7 Check All Present Check Check Check Check Check Check Check
ATP 8 Check All Present Check Check Check Check Check Check Check
ATP 9 Check All Present Check Check Check Check Check Check Check
ATP 10 Check All Present Check Check Check Check Check Check Check
APPENDIX A Comprehensive Data Analysis Tables
Test Number
Analyze the percentage of PMM messages properly processed by
in-vehicle devices Analyze the percentage of PMM-RSP messages
properly processed by mobile devices
Analyze the percentage of PMM-Cancel messages
properly processed by in-vehicle devices
MDEA Log ndash PMM Send occurrence
MDEA Log ndash PMM
contents
VEA Log ndash PMM
Receive occurrence
VEA Log ndash Driver
acceptance
VEA Log ndash PMM-RSP
Send occurrence
MDEA Log ndash PMM-RSP
Receive occurrence
MDEA Log ndash Coordination
Status
MDEA Log ndash PMM-
Cancel Sent Occurrence
VEA Log ndash PMM-
Cancel Received
Occurrence
ATP 11 Check All Present Check Check Check Check Check Check Check
ATP 12 Check All Present Check Check Check Check Check Check Check
ATP 13 Check All Present Check Check Check Check Check Check Check
ATP 14 Check All Present Check Check Check Check Check Check Check
ATP 15 Check All Present Check Check Check Check Check Check Check
ATP 16 Check All Present Check Check Check Check Check Check Check
ATP 17 Check All Present Check Check Check Check Check Check Check
US Department of Transportation Office of the Assistant Secretary for Research and Technology
Intelligent Transportation Systems Joint Program Office
Task 8 D2X Hub Proof-of-Concept Test Evaluation Report ndash Final | A-14
Table A-8 Complete Data Analysis ndash Hy pothesis 10
Date Test Number
Analyze the Success Rate of Receiving a PMM-Arrive Message
VEA Log ndash PMM-ARRIVE Send Occurrence MDEA Log ndash PMM-ARRIVE Receive Occurrence
1312017 TFHRC 1 Fail Fail
1312017 TFHRC 2 Check Check
1312017 TFHRC 3 Check Check
1312017 TFHRC 4 Check Check
1312017 TFHRC 5 Check Check
1312017 TFHRC 6 Check Check
1312017 TFHRC 7 Check Check
1182017 ATP 1 Not Available Check
1182017 ATP 2 Not Available Check
1182017 ATP 3 Not Available Check
1182017 ATP 4 Not Available Check
1182017 ATP 5 Not Available Check
1182017 ATP 6 Not Available Check
1182017 ATP 7 Not Available Check
1182017 ATP 8 Not Available Check
1182017 ATP 9 Not Available Check
1182017 ATP 10 Not Available Check
1202017 ATP 11 Check Check
1202017 ATP 12 Check Check
1202017 ATP 13 Check Check
1202017 ATP 14 Check Check
1202017 ATP 15 Check Check
APPENDIX A Comprehensive Data Analysis Tables
US Department of Transportation Office of the Assistant Secretary for Research and Technology
Intelligent Transportation Systems Joint Program Office
Task 8 D2X Hub Proof-of-Concept Test Evaluation Report ndash Final | A-15
APPENDIX A Comprehensive Data Analysis Tables
Table A-9 Complete Data Analysis ndash Hypothesis 13 (Part A)
US Department of Transportation Office of the Assistant Secretary for Research and Technology
Intelligent Transportation Systems Joint Program Office
Task 8 D2X Hub Proof-of-Concept Test Evaluation Report ndash Final | A-16
Test Number
Coordination Request Sent
by Y
Coordination Request
Received by X
Request Confirmed
by X Confirmation Received by Y
Coordination Request Sent
by Z
Coordination Request
Received by X
Request Confirmed
by X Confirmation Received by Z
Coordination Heart Beat
Transmitted by Y amp Z
Heart Beat Response received
by X
Ride Arrived
Messages
TFHRC 1
Fail Traveler Y could not join the ad-hoc travel group
TFHRC 2
Check check check check 41047 check check check check check 41303
TFHRC 3
Check Check Check Check Check Check Check Check Check Check Check
TFHRC 4
Fail Traveler Y could not join the ad-hoc travel group
TFHRC 5
Check Check Check Check Check Check Check Check Check Check Check
TFHRC 6
Check Check Check Check Check Check Check Check Check Check Check
TFHRC 7
Check Check Check Check Check Check Check Check Check Check Check
TFHRC 8
Check Check Check Check Check Check Check Check Check Check Check
TFHRC 9
Check Check Check Check Check Check Check Check Check Check Check
TFHRC 10
Check Check Check Check Check Check Check Check Check Check Check
ATP 1 Check Check Check Check Check Check Check Check Check Check Check
ATP 2 Check Check Check Check Check Check Check Check Check Check Check
Test Number
Coordination Request Sent
by Y
Coordination Request
Received by X
Request Confirmed
by X Confirmation Received by Y
Coordination Request Sent
by Z
Coordination Request
Received by X
Request Confirmed
by X Confirmation Received by Z
Coordination Heart Beat
Transmitted by Y amp Z
Heart Beat Response received
by X
Ride Arrived
Messages
ATP 3 Check Check Check Check Check Check Check Check Check Check Check
ATP 4 Check Check Check Check Check Check Check Check Check Check Check
ATP 5 Check Check Check Check Check Check Check Check Check Check Check
ATP 6 Check Check Check Check Check Check Check Check Check Check Check
ATP 7 Check Check Check Check Check Check Check Check Check Check No ride
arrives received
ATP 8 Check Check Check Check Check Check Check Check Check Check Check
ATP 9 Check Check Check Check Check Check Check Check Check Check No ride
arrives received
ATP 10 Check Check Check Check Check Check Check Check Check Check Check
ATP 11 Check Check Check Check Check Check Check Check Check Check Check
ATP 12 Check Check Check Check Check Check Check Check Check Check No ride
arrives received
ATP 13 Check Check Check Check Check Check Check Check Check Check Check
ATP 14 Check Check Check Check Check Check Check Check Check Check Check
ATP 15 Check Check Check Check Check Check Check Check Check Check Check
APPENDIX A Comprehensive Data Analysis Tables
US Department of Transportation Office of the Assistant Secretary for Research and Technology
Intelligent Transportation Systems Joint Program Office
Task 8 D2X Hub Proof-of-Concept Test Evaluation Report ndash Final | A-17
APPENDIX A Comprehensive Data Analysis Tables
Table A-10 Complete Data Analysis ndash Hypothesis 13 (Part B)
US Department of Transportation Office of the Assistant Secretary for Research and Technology
Intelligent Transportation Systems Joint Program Office
Task 8 D2X Hub Proof-of-Concept Test Evaluation Report ndash Final | A-18
Test Number Coordination Cancel by
Walking Away Coordination Cancel by
Manual Request Disband Group after
Entering into Vehicle
TFHRC 1 Check This step not tested on this day
TFHRC 2 Check This step not tested on this day
TFHRC 3 Check This step not tested on this day
TFHRC 4 Check This step not tested on this day
TFHRC 5 Check This step not tested on this day
TFHRC 6 This step not tested on this day Check Check
TFHRC 7 This step not tested on this day Check Check
TFHRC 8 This step not tested on this day Check Check
TFHRC 9 This step not tested on this day Check Check
TFHRC 10 This step not tested on this day Check Check
ATP 1 Check Check Check
ATP 2 Check Check Check
ATP 3 Check Check Check
ATP 4 Check Check Check
ATP 5 Check Check Check
ATP 6 Check Check Check
ATP 7 Check Check Check
ATP 8 Check Check Check
ATP 9 Check Check Check
APPENDIX A Comprehensive Data Analysis Tables
Test Number Coordination Cancel by
Walking Away Coordination Cancel by
Manual Request Disband Group after Entering into Vehicle
ATP 10 Check Check Check
ATP 11 Fail Could not cancel by distance Check Check
ATP 12 Check Check Check
ATP 13 Fail Could not cancel by distance Check Check
ATP 14 Check Check Check
ATP 15 Check Check Check
US Department of Transportation Office of the Assistant Secretary for Research and Technology
Intelligent Transportation Systems Joint Program Office
Task 8 D2X Hub Proof-of-Concept Test Evaluation Report ndash Final | A-19
APPENDIX A Comprehensive Data Analysis Tables
APPENDIX B Acronyms and Abbreviations
ATG Ad-Hoc Travel Group
ATP Acceptance Test Plan
BSM Basic Safety Message
CCP Common Computing Platform
CV Connected Vehicle
DSRC Dedicated Short Range Communications
EPS Experimental Prototype System
FHWA Federal Highway Administration
FR Functional Requirement
ITS Intelligent Transportation Systems
LDV Light-Duty Vehicle
MAP Map Data
MDEA Mobile Device Experimental Application
MGL Message Logging
OBU On-board Unit
PMM Personal Mobility Message
PMM-ARRIVE Personal Mobility Message Arrival Message
PMM-CANCEL Personal Mobility Message Cancel Message
PMM-RSP Personal Mobility Message Response Message
PR Performance Requirement
PSM Personal Safety Message
REA Roadside Experimental Application
RSU Roadside Unit
SFY Safety
SIR System Interface Requirement
SMP SPaT and MAP
SPaT Signal Phasing and Timing
SyRS System Requirements Specifications
TFHRC Turner-Fairbank Highway Research Center
US DOT US Department of Transportation
US Department of Transportation Office of the Assistant Secretary for Research and Technology
Intelligent Transportation Systems Joint Program Office
Task 8 D2X Hub Proof-of-Concept Test Evaluation Report ndash Final |B-1
VEA Vehicle Experimental Application
Wi-Fi Wireless Fidelity
APPENDIX B Acronyms and Abbreviations
US Department of Transportation Office of the Assistant Secretary for Research and Technology
Intelligent Transportation Systems Joint Program Office
Task 8 D2X Hub Proof-of-Concept Test Evaluation Report ndash Final | B-2
APPENDIX C Terms and Definitions
Basic Safety Message (BSM)
Connected vehicle message type which contains vehicle safety-related information that is broadcast to surrounding vehicles
Bluetooth Short range wireless technology used to exchange data between enabled devices
Cellular Uses short-range radio stations to cover areas of communication
Connected Vehicle A vehicle that can communicate with other vehicles and infrastructure via communication media such as DSRC Wi-Fi cellular or Bluetooth
Coordinated Messages are coordinated when two or more mobile devices have establish a travel group based on the same origin destination and
time and function as a single cohesive senderrecipient
CV Inspector An application that verifies if the Mobile Device is broadcasting messages to Connected Vehicles
Destination The end point of a travelerrsquos trip
DSRC Dedicated Short-Range Communications a low-latency high-reliability two-way communications tool used for sending transportation safety
messages
Light-Duty Vehicle Of or relating to vehicles that way less than 4000 lbs
Message Type Type of personal safety or personal mobility message that is transmitted based on the technology used and level of coordination available
Personal Mobility Message (PMM)
Similar to PDM message intended for the exchange of mobility messages between individual travelers and vehiclesinfrastructure via
mobile device
Personal Safety Message (PSM)
Similar to BSM message intended to transmit low-latency urgent safety messages between individual travelers and vehiclesinfrastructure via
mobile device
Test Case A set of conditions or variables that a Tester can determine if system meets requirements
Transit Vehicle Large vehicles mainly used for public transportation as well as support services
Transmitting The state in which a traveler has opted in and is sendingreceiving messages via mobile device
Uncoordinated Messages are uncoordinated when travel groups are not established (see coordinated definition)
Wi-Fi Local area wireless technology that allows enabled devices to connect to the Internet
APPENDIX A Comprehensive Data Analysis Tables
US Department of Transportation Office of the Assistant Secretary for Research and Technology
Intelligent Transportation Systems Joint Program Office
Task 8 D2X Hub Proof-of-Concept Test Evaluation Report ndash Final |C-1
ITS Joint Program Office-HOIT 1200 New Jersey Avenue SE
Washington DC 20590
Toll-Free ldquoHelp Linerdquo 866-367-7487 wwwitsdotgov
FHWA-JPO-18-263
- Structure Bookmarks
-
- Sharing Data between Mobile Devices Connected Vehicles and Infrastructure Task 8 D2X Hub Proof-of-Concept Test Evaluation Report wwwitsdotgovindexhtm Final Report mdash October 25 2017 FHWA-JPO-18-623
- Revision History
- Table of Contents
- Chapter 1 Scope
- Chapter 2 Referenced Documents
- Chapter 3 Test Conduct
- Chapter 4 Experimental Analysis Results Summary
- Chapter 5 Experimental Analysis
- Chapter 6 Lessons Learned and Recommendations
- APPENDIX A Comprehensive Data Analysis Tables
- APPENDIX B Acronyms and Abbreviations
- APPENDIX C Terms and Definitions
-

Chapter 5 Experimental Analysis
Table 5-5 Hypothesis 5 Analysis Data Sample
TFHRC1 TFHRC2 TFHRC3
Advisory Alert Warning Advisory Alert Warning Advisory Alert Warning
True Distance (m) 7584 5545 4874 8552 5167 4515 7876 5827 5124
Speed (MPH) 2471 2523 2498 2595 2461 2433 2381 2590 2624
Expected Distance (m)
9942 5780 4910 10441 5588 4751 9580 5989 5222
Difference (m) 2358 235 036 1889 421 236 1704 162 098
For the complete analysis please refer to Table A-4 in Appendix A
Table 5-6 Total and Average Differences between Actual and Calculated Advisories Alerts and Warnings (VEA)
TFHRC Advisory Alert Warning
Total Difference (m) 10139 1376 971
Average Difference (m) 2028 275 194
Results There were no outliers (False Negatives) in the data analyzed Hence Hypothesis 5 is satisfied at a 100 level of confidence
US Department of Transportation Office of the Assistant Secretary for Research and Technology
Intelligent Transportation Systems Joint Program Office
Task 8 D2X Hub Proof-of-Concept Test Evaluation Report ndash Final | 14
Hypothesis 6 Mobile Devices can capture and process Vehicle BSMs and issue warnings in time for pedestrians to avoid imminent vehicle collision
Data logs verified MDEA Log ndash BSM Location GPS Location Advisory Display Alert Display and Warning Display
Analysis
Assessing the distance at which an Advisory Alert and Warning were issued based on the speed of the vehicle (in the BSM received by the mobile device)
Observations a Considering the TFHRC results the average difference in distance for MDEA logging of
Advisories Alerts and Warnings were on average 278 m 323 m and 334 m respectively b Latency of less than a second was observed on MDEA and VEA Logs
sݐݑݍܧ ݎ ݑݐ dݒݏwarningandalertݕݎ ݐݏ ݓݎݐ ݏ
ௗ௩௦௬= lowastݒ9
lowast ሻ05ݒ 25ሾሺൌ 11 lowast ቊ ௧ଶݒ
ሿ 2ሺ34ሻ
ቋ
ଶݒሿ 2ሺ56ሻ
ቋ
Where
lowast ሻ05ݒ 25ሾሺൌ 11 lowast ቊ ௪
is the advisory display distance (meters) ௗ௩௦௬
is the alert display distance (meters) ௧
is the warning display distance (meters) ௐ
ݒ is the velocity of the vehicle (meters per second)
Chapter 5 Experimental Analysis
TF 71 Run 2 - MDEA
US Department of Transportation Office of the Assistant Secretary for Research and Technology
Intelligent Transportation Systems Joint Program Office
Task 8 D2X Hub Proof-of-Concept Test Evaluation Report ndash Final | 15
Source Battelle Google Maps February 2017
Figure 5-2 Advisory Alert and Warning Distances with Respect to MDEA
Chapter 5 Experimental Analysis
Table 5-7 Hypothesis 6 Analysis Data Sample
TFHRC1 TFHRC2 TFHRC3
Advisory Alert Warning Advisory Alert Warning Advisory Alert Warning
True Distance (m) 8756 5320 4651 9928 5276 4624 8952 5595 4890
Speed (mph) 2290 2509 2487 2514 2447 2415 2304 2603 2617
Expected distance (m) 9213 5736 4883 10115 5546 4707 9270 6030 5205
Difference (m) 458 416 232 187 270 084 318 436 315
For the complete analysis please refer to Table A-5 in Appendix A
Table 5-8 Total and Average Differences between Actual and Calculated Advisories Alerts and Warnings (MDEA)
TFHRC Advisory Alert Warning
Total Difference (m) 1392 1617 1671
Average Difference (m) 278 323 334
Results There were no false alarms detected at neither of the TFHRCATP tests performed Hence Hypothesis 6 is satisfied at a 100 level of confidence
Issues Identified GPS Inaccuracy ndash Cross Track Distance Issue
The accuracy of GPS as per the US government claims is +- 4 m This error in GPS accuracy was balanced by increasing the cluster radius to 7 m for all the tests at TFHRC This modification in cluster radius increased the efficiency of pedestrian detection by closing out the difference in Cross Track Distancersquo
There were no false alarms detected at neither of the TFHRCATP tests performed
US Department of Transportation Office of the Assistant Secretary for Research and Technology
Intelligent Transportation Systems Joint Program Office
Task 8 D2X Hub Proof-of-Concept Test Evaluation Report ndash Final | 16
Chapter 5 Experimental Analysis
Source Battelle Google Maps February 2017
Figure 5-3 Cross Track Distance between Pedestrian and Vehicle Path
US Department of Transportation Office of the Assistant Secretary for Research and Technology
Intelligent Transportation Systems Joint Program Office
Task 8 D2X Hub Proof-of-Concept Test Evaluation Report ndash Final | 17
Chapter 5 Experimental Analysis
Hypothesis 7 MDEA Log ndash GPS Location SafeUnsafe Zone Status and MAP Message Contents
Data logs verified MDEA Log ndash GPS Location SafeUnsafe Zone Status and MAP Message Contents
Analysis
Analyzed the percentage of properly classified safeunsafe zone detections The device was placed in the roadway ndash mobile device location was properly classified if it positions itself in an unsafe zone
Observations User State Change from Safe to Unsafe (when placed 20 m in the roadway) and Unsafe to Safe (when placed 50 m from the roadway) were captured accurate and timely
Table 5-9 Hypothesis 7 Analysis Data Sample
TFHRC 1 TFHRC 2 TFHRC 3 TFHRC 4 TFHRC 5
User State Change Is Safe Icon False (2 m in the roadway)
111438 112533 114400 114801 115408
Properly Processed
User State Change Is Safe Icon True (5 m from the roadway)
111504 112619 114438 114829 115444
Properly Processed
For the complete analysis please refer to Table A-6 in Appendix A
US Department of Transportation Office of the Assistant Secretary for Research and Technology
Intelligent Transportation Systems Joint Program Office
Task 8 D2X Hub Proof-of-Concept Test Evaluation Report ndash Final | 18
Chapter 5 Experimental Analysis
Source Battelle Google Maps February 2017
Figure 5-4 Safe and Unsafe Zones at TFHRC Test Site
Results There were no outliers (False Negatives) in the data analyzed Hence Hypothesis 7 is satisfied at a 100 level of confidence
US Department of Transportation Office of the Assistant Secretary for Research and Technology
Intelligent Transportation Systems Joint Program Office
Task 8 D2X Hub Proof-of-Concept Test Evaluation Report ndash Final | 19
Chapter 5 Experimental Analysis
Hypothesis 8 amp 9 The VEA can coordinate taxi travel requests from an MDEA
Data logs verified MDEA Log ndash PMM Send Occurrence PMM contents PMM-RSP Receive Occurrence Coordination Status and PMM-Cancel Sent Occurrence
Analysis
Analyzed the percentage of PMM and PMM ndash Cancel messages properly processed by in-vehicle devices
Analyzed the percentage of PMM-RSP messages properly processed by mobile devices This analysis was performed for PMM Messages communicated through both DSRC and
Cellular
Observations 16 out of 204 checks had a failure during tests performed under ATP
Table 5-10 Hypothesis 8 amp 9 Analysis Data Sample
TFHRC 1 TFHRC 2 TFHRC 3 TFHRC 4 TFHRC 5
Analyze the percentage of PMM messages properly processed by in-vehicle devices
MDEA Log ndash PMM Send occurrence
Check Check Check Check Check
MDEA Log ndash PMM contents
All Present All Present All Present All Present All Present
Experimental Log ndash Information entered into
Mobile Device by Traveler
VEA Log ndash PMM Receive occurrence
Check Check Check Check Check
Analyze the percentage of PMM-RSP messages properly processed by mobile devices
Experimental Log ndash Driver Acceptance
VEA Log ndash Driver acceptance
Check Check Check Check Check
VEA Log ndash PMM-RSP Send occurrence
Check Check Check Check Check
MDEA Log ndash PMM-RSP Receive occurrence
Check Check Check Check Check
MDEA Log ndash Coordination Status
Check Check Check Check Check
Experimental Log ndash Coordination Success
Display
US Department of Transportation Office of the Assistant Secretary for Research and Technology
Intelligent Transportation Systems Joint Program Office
Task 8 D2X Hub Proof-of-Concept Test Evaluation Report ndash Final | 20
Chapter 5 Experimental Analysis
TFHRC 1 TFHRC 2 TFHRC 3 TFHRC 4 TFHRC 5
Analyze the percentage of PMM-Cancel messages properly processed by in-vehicle devices
MDEA Log ndash PMM-Cancel Sent Occurrence
Check Check Check Check Check
VEA Log ndash PMM-Cancel Received
Occurrence Check Check Check Check Check
For the complete analysis please refer to Table A-7 in Appendix A
Results Considering the tests performed at TFHRC Hypothesis 8 is satisfied at a 100 level of confidence However ATP tests satisfied the hypothesis at a confidence level of 9215
Issues Identified
Some issues observed for cloud communication during ATP testing at Columbus OH
Delay in Cloud PMM-cancel for VEA ndash 8 instances Adding a trip twice ndash 5 instances Some PMMs not being cancelled ndash 3 instances
All these issues were addressed prior to TFHRC tests
TFHRC tests did not have any of the above issues
US Department of Transportation Office of the Assistant Secretary for Research and Technology
Intelligent Transportation Systems Joint Program Office
Task 8 D2X Hub Proof-of-Concept Test Evaluation Report ndash Final | 21
Chapter 5 Experimental Analysis
Hypothesis 10 The traveler can receive arrival updates from a taxi or transit vehicle
Data logs verified VEA Log ndash PMM-ARRIVE Send Occurrence
MDEA Log ndash PMM-ARRIVE receive occurrence
Analysis
Analyzed the success rate of receiving a PMM-Arrive message via DSRC
Observations One test case at TFHRC failed due to equipment failure (CCP lost its location) All other tests satisfied the hypothesis
Table 5-11 Hypothesis 10 Analysis Data Sample
TFHRC 1
TFHRC 2
TFHRC 3
TFHRC 4
TFHRC 5
TFHRC 6
TFHRC 7
DSRC (Taxi)
Analyze the success rate of receiving a PMM-Arrive message
VEA Log ndash PMM-ARRIVE
Send occurrence
Fail Check Check Check Check Check Check
MDEA Log ndash PMM-ARRIVE
Receive occurrence
Fail Check Check Check Check Check Check
For the complete analysis please refer to Table A-8 in Appendix A
Results Considering the tests at TFHRC the hypothesis is satisfied at a confidence level of 8571 12 out of 14 tests were successful
US Department of Transportation Office of the Assistant Secretary for Research and Technology
Intelligent Transportation Systems Joint Program Office
Task 8 D2X Hub Proof-of-Concept Test Evaluation Report ndash Final | 22
Chapter 5 Experimental Analysis
Hypothesis 11 amp 12 The MDEA can detect when a traveler transitions from a pedestrian to a light duty vehicle or from a light duty vehicle to a pedestrian
Data logs verified MDEA Log ndash Travel Mode Status Change Experimental Log ndash Mode Transition Detection Log
Analysis 1 Assessed the change in ldquoTravel Mode Statusrdquo after the pedestrian enters the vehicle
(The threshold value for Travel Mode Status Change is 10 secs) 2 Assessed the false positive rate of transition detection
Observations Accelerometer tests on average took 75 secs and 44 secs to detect in-vehicle and on-foot respectively However Bluetooth beacon tests on a verage took 17 secs and 1 1 secs to detect in-vehicle and on-foot respectively This quantifies the unreliable nature of Bluetooth Beacons as used in this system
Table 5-12 Hypothesis 11 amp 12 Analysis Data Sample
Mode Detection Method On-foot to In-Vehicle Transition time (Sec)
In-Vehicle to On-foot Transition Time (Sec)
Accelerometer 75 44
Bluetooth Beacon 17 11
Results Hypothesis is proved as 100 confident during the accelerometer tests However none of the tests with Bluetooth Beacon satisfied the hypothesis (all false negatives)
US Department of Transportation Office of the Assistant Secretary for Research and Technology
Intelligent Transportation Systems Joint Program Office
Task 8 D2X Hub Proof-of-Concept Test Evaluation Report ndash Final | 23
Chapter 5 Experimental Analysis
Hypothesis 13 The MDEA can coordinate maintain and cancel travel with another MDEA via Wi-Fi Direct
Data logs verified MDEA (1) Log ndash Coordination Request Received Occurrence Coordination Request Contents Coordination Acceptance Sent Occurrence Coordination Acceptance Notification Coordination Heartbeat Received Occurrence Coordination Cancel Response Sent occurrence and Coordination Disband Sent occurrence
MDEA (2) Log ndash Coordination Request Sent Occurrence Coordination Confirmation received Occurrence Coordination Heartbeat Response Sent Occurrence Coordination Acceptance received Occurrence
Analysis 1 Determined the percentage of Coordination Request Acceptance Heartbeat Cancel and
Disband messages properly processed by mobile devices 2 Assessed the message contents for consistency
Observations This test is performed in a highly-controlled environment This means selection of specific devices and designating them with specific roles This approach was chosen due to poor Wi-Fi direct performance with our system that would have otherwise hindered the ability to conduct the testing and collect the necessary data
US Department of Transportation Office of the Assistant Secretary for Research and Technology
Intelligent Transportation Systems Joint Program Office
Task 8 D2X Hub Proof-of-Concept Test Evaluation Report ndash Final | 24
Chapter 5 Experimental Analysis
Table 5-13 Hypothesis 13 Analysis Data Sample
13117 2117
TFHRC 1
TFHRC 2
TFHRC 3
TFHRC 4
TFHRC 5
TFHRC 6
TFHRC 7
TFHRC 8
TFHRC 9
TFHRC 10
Coordination Request Sent by
Y
Fai
l T
rave
ler
Y c
ould
no
t joi
n th
e ad
-hoc
trav
el g
roup
40951 Check
F
ail
Tra
vele
r Y
cou
ld
not j
oin
the
ad-h
oc tr
avel
gro
up
Check Check Check Check Check Check
Coordination Request Received
by X check Check Check Check Check Check Check Check
Request Confirmed by X
check Check Check Check Check Check Check Check
Confirmation Received by Y
Coordination Request Sent by
Z
check Check Check Check Check Check Check Check
41047 Check Check Check Check Check Check Check
Coordination Request Received
by X check Check Check Check Check Check Check Check
Request Confirmed by X
check Check Check Check Check Check Check Check
Confirmation Received by Z
Coordination Heart Beat
Transmitted by Y amp Z
check Check Check Check Check Check Check Check
check Check Check Check Check Check Check Check
Heart Beat Response
received by X
Ride Arrived Messages
check Check Check Check Check Check Check Check
41303 Check Check Check Check Check Check Check
Coordination Cancel by walking
away Check Check Check Check Check This step not tested on this day
Coordination Cancel by Manual
request This step not tested on this day
Check Check Check Check Check
Disband Group after entering into
vehicle Check Check Check Check Check
For the complete analysis please refer to Table A-9 and Table A-10 in Appendix A
Results There were 30 outliers out of 198 checks (False Negatives) in the data analyzed Hence Hypothesis 13 is satisfied at an 8484 level of confidence
US Department of Transportation Office of the Assistant Secretary for Research and Technology
Intelligent Transportation Systems Joint Program Office
Task 8 D2X Hub Proof-of-Concept Test Evaluation Report ndash Final | 25
US Department of Transportation Office of the Assistant Secretary for Research and Technology
Intelligent Transportation Systems Joint Program Office
Task 8 D2X Hub Proof-of-Concept Test Evaluation Report ndash Final | 26
Chapter 5 Experimental Analysis
Hypothesis 14 The RSU can broadcast a SPaT and MAP message via DSRC that can be received by mobile devices
Data logs verified MDEA Log ndash BSM received and PSM send occurrences
Analysis 1 Determined the percentage of SPaT messages received by mobile devices when within
100 meters of RSE Assessed message contents for consistency 2 Determined the percentage of MAP messages received by mobile devices when within
100 meters of RSE Assessed message contents for consistency
Observations Considering test 5444 all the SPa T messages were transmitted and received at a rate of 1sec Similarly all the MAP messages were transmitted and received at a rate better than 5sec
Table 5-14 Hypothesis 14 Analysis Data Sample
ID Date Message
5 13117 163842 Dsrc Rx Spat id19
6 13117 163842 Dsrc Rx Map id18
9 13117 163843 Dsrc Rx Spat id19
10 13117 163843 Dsrc Rx Bsm Lat389546323 Long -771488295 Head 2713375 Sp 0
12 13117 163843 Dsrc Rx Bsm Lat389546138 Long -771483988 Head 2559125 Sp 0
13 13117 163844 Dsrc Rx Spat id19
14 13117 163844 Dsrc Rx Bsm Lat389546323 Long -771488297 Head 2713375 Sp 0
16 13117 163844 Dsrc Rx Bsm Lat389546138 Long -771483987 Head 2559125 Sp 0
17 13117 163844 Dsrc Rx Map id18
18 13117 163844 Dsrc Rx Bsm Lat389546322 Long -7714883 Head 2713375 Sp 0
20 13117 163845 Dsrc Rx Bsm Lat389546137 Long -771483987 Head 2559125 Sp 0
21 13117 163845 Dsrc Rx Bsm Lat389546322 Long -771488302 Head 2713375 Sp 0
22 13117 163845 Dsrc Rx Spat id19
23 13117 163845 Dsrc Rx Bsm Lat389546137 Long -771483987 Head 2559125 Sp 0
25 13117 163845 Dsrc Rx Bsm Lat38954632 Long -771488302 Head 2713375 Sp 0
26 13117 163846 Dsrc Rx Bsm Lat389546135 Long -771483987 Head 2559125 Sp 0
27 13117 163846 Dsrc Rx Spat id19
29 13117 163846 Dsrc Rx Bsm Lat389546318 Long -771488303 Head 2713375 Sp 0
31 13117 163846 Dsrc Rx Map id18
Results There were no outliers (False Negatives) in the data analyzed Hence Hypothesis 14 is satisfied at a 100 level of confidence
Chapter 5 Experimental Analysis
Hypothesis 15 The RSU can store all messages received via DSRC
Data logs verified MDEA Log ndash All Occurrences of messages sent via DSRC and Message Contents RSU Log ndash Message Received Occurrence and Message Contents
Analysis 1 Assessed the percentage of messages received from mobile devices within 100 meters of
RSE Assess message contents to make sure they are consistent
Observations a Considering the message logs from test cases 5411 5444 5471 there were instances
where PSMs were logged at a rate of less than 10sec Also there were test cases that had no reception of PSMs This clearly indicates the reception issues with RSU CCP unit One prime focus for the Large-Scale Field Test is to improve the reliability of the hardware associated with RSU
b The message contents in all the DSRC messages were consistent throughout the test logs
Table 5-15 Hypothesis 15 Analysis Data Sample
Date Time
Vehicle Range and Advisory Distance wrt
Speed Speed (mph)
In Range
Out of Range
Distance (m)
RSU Log PSM
Message RateSec
13117 101316 IsBsmClose Dist
975500061708885lt AdvDist 1024200201024
255 98 8
13117 101332 IsBsmClose Dist
570797651794001lt AdvDist 666000057888
173 57 6
13117 101340 IsBsmClose Dist
57448436831453lt AdvDist 601199821728
149 57 1
13117 101529 IsBsmClose Dist
975729907380225lt AdvDist 102240014976
254 98 0
13117 101538 IsBsmClose Dist
399317028326919lt AdvDist 102240014976
250 4 1
For the complete analysis please refer to Table A-1 in Appendix A
US Department of Transportation Office of the Assistant Secretary for Research and Technology
Intelligent Transportation Systems Joint Program Office
Task 8 D2X Hub Proof-of-Concept Test Evaluation Report ndash Final | 27
Chapter 5 Experimental Analysis
Table 5-16 Data Usage Statistics
17-Jan 18-Jan 19-Jan 20-Jan 31-Jan 1-Feb Average Maximum
Total Usage (MB) 3805 626 714 2713 4873 1355 984 2713
TMX core usage (MB) 271 450 468 1991 345 90 705 1991
of TMX usage 71 72 66 73 71 66 71 73
Results The hypothesis statement of RSU being able to store all messages received via DSRC is not satisfied at 100 level of confidence due to hardware issues
US Department of Transportation Office of the Assistant Secretary for Research and Technology
Intelligent Transportation Systems Joint Program Office
Task 8 D2X Hub Proof-of-Concept Test Evaluation Report ndash Final | 28
Chapter 6 Lessons Learned and Recommendations
Lessons Learned
The Lessons Learned from the Proof-of-Concept testing are summarized as follows
The ability to reliably generate transmit and receive messages between mobile devices and connected vehicles was demonstrated
The messages to incorporate mobile devices into the C V environment functioned as designed and provided the necessary data for the prototype mobility and safety applications
The prototype safety and mobility software applications functioned well (as designed)
Limitations of technology and hardware issues caused the majority of performance shortfalls
Mixed results were achieved for the various communication methods tested
a Cellular functioned well with our system
b Wi-Fi Direct connectivity was unreliable with our system
c DSRC hardware problems caused communication problems with our system
GPS accuracy limitations were observed as expected
Wi-Fi Direct Connectivity
The connection process was prone to failure at multiple points with no indication to the application why connection failed
TFHRC success rate was achieved by selecting specific devices that worked best for specific roles otherwise a failure rate gt50 would have been expected based on earlier testing
Canvasing of developer community found similar observations no solutions for our system
Wi-Fi Direct connection process requires authorization from the user of the target device in a real world environment such a request would most likely be denied if noticed at all
US Department of Transportation Office of the Assistant Secretary for Research and Technology
Intelligent Transportation Systems Joint Program Office
Task 8 D2X Hub Proof-of-Concept Test Evaluation Report ndash Final | 29
Chapter 6 Lessons Learned and Recommendations
DSRC Hardware
Common Computer Platform (CCP) Pre-production engineering units were used which were determined to have an impedance mismatch between the DSRC chip and RF connector that caused reduction of signal strength
Arada LocoMate ME There were occasional Bluetooth connection failures to mobile devices as well as occasional DSRC transmissionreception failures Longer term it is assumed that DSRC radios will be integrated into smartphones thus obviating the current issues
Recommendations
Based on outcomes of Proof-of-Concept Testing the following prototype system design changes are recommended to be implemented prior to the larger-scale prototype field test
Add Cellular-based communication for Travel Group coordination between mobile devices
New and improved CCP units will be used for the larger-scale field test
For in-vehicle detection use Accelerometer method as the most reliable option
US Department of Transportation Office of the Assistant Secretary for Research and Technology
Intelligent Transportation Systems Joint Program Office
Task 8 D2X Hub Proof-of-Concept Test Evaluation Report ndash Final | 30
APPENDIX A Comprehensive Data Analysis Tables
Note For all the analysis results depicted below the term ldquocheckrdquo refers to the ldquosuccessrdquo of desired action
Table A-1 Complete Data Analysis ndash Hypothesis 1 4 amp 15
Date Time Vehicle Range and Advisory
Distance wrt Speed Speed In
Range Out of
Range Distance
RSU Log PSM
Message RateSec
VEA Log PSM
Message Rate
1312017 101316 IsBsmClose Dist 975500061708885lt
AdvDist 1024200201024 255 X 98 8 10
1312017 101332 IsBsmClose Dist 570797651794001lt
AdvDist 666000057888 173 X 57 6 10
1312017 101340 IsBsmClose Dist 57448436831453lt
AdvDist 601199821728 149 X 57 1 10
1312017 101529 IsBsmClose Dist 975729907380225lt
AdvDist 102240014976 254 X 98 0 10
1312017 101538 IsBsmClose Dist 399317028326919lt
AdvDist 102240014976 250 X 4 1 10
1312017 101553 IsBsmClose Dist 600719107941917lt
AdvDist 70199987616 174 X 60 0 10
1312017 102029 IsBsmClose Dist 944643508928866lt
AdvDist 1008000141984 251 X 95 0 9
1312017 102048 IsBsmClose Dist 592561932680623lt
AdvDist 628200188352 156 X 59 0 9
US Department of Transportation Office of the Assistant Secretary for Research and Technology
Intelligent Transportation Systems Joint Program Office
Task 8 D2X Hub Proof-of-Concept Test Evaluation Report ndash Final | A-1
APPENDIX A Comprehensive Data Analysis Tables
Date Time Vehicle Range and Advisory
Distance wrt Speed Speed In
Range Out of Range Distance
RSU Log PSM
Message RateSec
VEA Log PSM
Message Rate
1312017 102054 IsBsmClose Dist 616348297460404lt
AdvDist 644399845056 160 X 62 3 11
1312017 102105 IsBsmClose Dist 871180496389495lt
AdvDist 1092600137376 247 X 87 4 9
1312017 102206 IsBsmClose Dist 977301610734722lt
AdvDist 1130400006912 295 X 98 0 10
1312017 102228 IsBsmClose Dist 577576034007057lt
AdvDist 60659997552 151 X 58 2 10
1312017 102332 IsBsmClose Dist 101193300977461lt
AdvDist 10386002088 258 X 101 10 10
1312017 102356 IsBsmClose Dist 595641466972855lt
AdvDist 660599904096 164 X 60 6 10
1312017 102623 IsBsmClose Dist 100217014111125lt
AdvDist 1024200201024 253 X 100 7 10
1312017 102650 IsBsmClose Dist 540919707235241lt
AdvDist 887399925984 221 X 54 0 10
1172017 111504 IsBsmClose Dist 100564061581794lt
AdvDist 1169999927712 291 X 101 10 10
1172017 112437 IsBsmClose Dist 992912014791515lt
AdvDist 10386002088 258 X 99 10 10
1172017 112837 IsBsmClose Dist 106684353810469lt
AdvDist 1076400078336 261 X 107 10 10
US Department of Transportation Office of the Assistant Secretary for Research and Technology
Intelligent Transportation Systems Joint Program Office
Task 8 D2X Hub Proof-of-Concept Test Evaluation Report ndash Final | A-2
APPENDIX A Comprehensive Data Analysis Tables
Date Time Vehicle Range and Advisory
Distance wrt Speed Speed In
Range Out of Range Distance
RSU Log PSM
Message RateSec
VEA Log PSM
Message Rate
1172017 113148 IsBsmClose Dist 1124753473133lt AdvDist
1186199986752 268 X 112 10 10
1172017 113332 IsBsmClose Dist 106022149777593lt
AdvDist 1126799904384 260 X 106 10 10
1172017 113336 IsBsmClose Dist 59429630331283lt
AdvDist 1196999892 298 X 59 10 10
1172017 113357 IsBsmClose Dist 657937887214709lt
AdvDist 1193400191808 297 X 66 10 10
1172017 113627 IsBsmClose Dist 965542357439439lt
AdvDist 1080000180864 260 X 97 10 10
1172017 113629 IsBsmClose Dist 821301583410616lt
AdvDist 1074600027072 270 X 82 10 10
1172017 113803 IsBsmClose Dist 994884887192582lt
AdvDist 104580001152 251 X 99 10 10
1172017 113811 IsBsmClose Dist 16809952777894lt
AdvDist 106200007056 257 X 17 10 10
1172017 114114 IsBsmClose Dist 948985801452811lt
AdvDist 986399929152 245 X 95 10 10
1172017 114133 IsBsmClose Dist 141255704529106lt
AdvDist 963000067392 242 X 14 10 10
1172017 114136 IsBsmClose Dist 377627357471613lt
AdvDist 977400075168 243 X 38 10 10
US Department of Transportation Office of the Assistant Secretary for Research and Technology
Intelligent Transportation Systems Joint Program Office
Task 8 D2X Hub Proof-of-Concept Test Evaluation Report ndash Final | A-3
APPENDIX A Comprehensive Data Analysis Tables
Date Time Vehicle Range and Advisory
Distance wrt Speed Speed In
Range Out of Range Distance
RSU Log PSM
Message RateSec
VEA Log PSM
Message Rate
1172017 114403 IsBsmClose Dist 114490146784404lt
AdvDist 1225799907552 266 X 114 10 10
1172017 114415 IsBsmClose Dist 280463490772458lt
AdvDist 71100013248 161 X 28 10 10
1172017 114735 IsBsmClose Dist 102043927314914lt
AdvDist 1040399857728 259 X 102 10 10
1172017 114755 IsBsmClose Dist 185020887331204lt
AdvDist 112499985312 275 X 19 10 10
1192017 35605 IsBsmClose Dist 107928079653642lt
AdvDist 1107000145152 272 X 108 9 9
1192017 35630 IsBsmClose Dist 99759104887202lt
AdvDist 1184399935488 294 X 100 10 10
1192017 35837 IsBsmClose Dist 110291146846666lt
AdvDist 115020016848 286 X 110 10 10
1192017 40057 IsBsmClose Dist 998997459961241lt
AdvDist 1260000076896 313 X 100 10 10
1192017 40300 IsBsmClose Dist 100209094247195lt
AdvDist 106919987328 260 X 100 10 10
1192017 40410 IsBsmClose Dist 100723184500334lt
AdvDist 1097999888832 273 X 101 6 10
1192017 41103 IsBsmClose Dist 977354295877856lt
AdvDist 1008000141984 251 X 98 10 10
US Department of Transportation Office of the Assistant Secretary for Research and Technology
Intelligent Transportation Systems Joint Program Office
Task 8 D2X Hub Proof-of-Concept Test Evaluation Report ndash Final | A-4
APPENDIX A Comprehensive Data Analysis Tables
Date Time Vehicle Range and Advisory
Distance wrt Speed Speed In
Range Out of Range Distance
RSU Log PSM
Message RateSec
VEA Log PSM
Message Rate
1192017 41311 IsBsmClose Dist 10190842581135lt
AdvDist 1040399857728 259 X 102 10 10
1192017 41423 IsBsmClose Dist 995536361906761lt
AdvDist 1009799790912 251 X 100 10 10
1192017 41534 IsBsmClose Dist 10075608603652lt
AdvDist 106919987328 264 X 101 10 10
US Department of Transportation Office of the Assistant Secretary for Research and Technology
Intelligent Transportation Systems Joint Program Office
Task 8 D2X Hub Proof-of-Concept Test Evaluation Report ndash Final | A-5
APPENDIX A Comprehensive Data Analysis Tables
Table A-2 Complete Data Analysis ndash Hypothesis 2
US Department of Transportation Office of the Assistant Secretary for Research and Technology
Intelligent Transportation Systems Joint Program Office
Task 8 D2X Hub Proof-of-Concept Test Evaluation Report ndash Final | A-6
Date Test
Number PSMs Generated by
Trav X and Trav Y Transition to In Group Trav Y PSM Ceased Only Trav X PSM
Received
1312017 TFHRC 1 111116 111240 Check 111305
1312017 TFHRC 2 Grouping Failed Grouping Failed Grouping Failed Grouping Failed
1312017 TFHRC 3 112346 112448 Check 112508
1312017 TFHRC 4 114208 114301 Check 114345
1312017 TFHRC 5 114609 114658 Check 114721
1312017 TFHRC 6 115222 115313 Check 115342
1182017 ATP 1 104400 104527 Check 104601
1182017 ATP 2 105356 105455 Check 105546
1182017 ATP 3 110059 110150 Check 110322
1182017 ATP 4 111222 111310 Check 111329
1182017 ATP 5 111515 111616 Check 111630
1182017 ATP 6 111823 111906 Check 111917
1182017 ATP 7 112116 112157 Check 112209
1182017 ATP 8 112814 112855 Check 112917
1182017 ATP 9 113142 113230 Check 113248
1182017 ATP 10 113501 113545 Check 113608
1192017 ATP 11 44728 44842 Check 45007
1192017 ATP 12 Radio Failure Test Terminated Radio Failure Test Terminated Radio Failure Test Terminated Radio Failure Test Terminated
1192017 ATP 13 45548 45637 Check 45728
1192017 ATP 14 45946 50047 Check 50107
1192017 ATP 15 50353 50444 Check 50513
1192017 ATP 16 50730 50823 Check 50839
APPENDIX A Comprehensive Data Analysis Tables
Table A-3 Complete Data Analysis ndash Hypothesis 3
US Department of Transportation Office of the Assistant Secretary for Research and Technology
Intelligent Transportation Systems Joint Program Office
Task 8 D2X Hub Proof-of-Concept Test Evaluation Report ndash Final | A-7
Date Description
MDEA not in Vehicle
MDEA Transmits
PSMs Time of MDEA
Mode Transition
MDEA Ceases Transmitting
PSMs
1312017 TFHRC 1 Check Check 0443101852 Check
1312017 TFHRC 2 Check Check 0445243056 Check
1312017 TFHRC 3 Check Check 0447569444 Check
1312017 TFHRC 4 Check Check 0448888889 Check
1312017 TFHRC 5 Check Check 045005787 Check
1312017 TFHRC 6 Check Check 0451666667 Check
1172017 ATP 1 Check Check 0501898148 Check
1172017 ATP 2 Check Check 0504201389 Check
1172017 ATP 3 Check Check 0506215278 Check
1172017 ATP 4 Check Check 0507858796 Check
1172017 ATP 5 Check Check 0508981481 Check
1172017 ATP 6 Check Check 0510219907 Check
1172017 ATP 7 Check Check 0511736111 Check
1172017 ATP 8 Check Check 05128125 Check
1172017 ATP 9 Check Check 0513831019 Check
1172017 ATP 10 Check Check 0514884259 Check
1172017 ATP 11 Check Check 0185590278 Check
1172017 ATP 12 Check Check 0187210648 Check
1172017 ATP 13 Check Check 0188425926 Check
1172017 ATP 14 Check Check 0190289352 Check
1172017 ATP 15 Check Check 0191863426 Check
APPENDIX A Comprehensive Data Analysis Tables
Table A-4 Complete Data Analysis ndash Hypothesis 5 (VEA)
Test Number
Type of Message
True Distance (m)
Speed (MPH)
Expected Distance (m)
Difference (m)
TFHRC1
Advisory 7584 2471 9942 2358
Alert 5545 2523 5780 235
Warning 4874 2498 4910 036
TFHRC2
Advisory 8552 2595 10441 1889
Alert 5167 2461 5588 421
Warning 4515 2433 4751 236
TFHRC3
Advisory 7876 2381 9580 1704
Alert 5827 2590 5989 162
Warning 5124 2624 5222 098
TFHRC4
Advisory 7529 2818 11338 3809
Alert 6047 2744 6482 435
Warning 5323 2714 5450 127
TFHRC5
Advisory 9292 2404 9672 380
Alert 5350 2423 5472 122
Warning 4081 2352 4556 475
ATP1
Advisory 000 000
Alert 000 000
Warning 000 000
ATP2
Advisory 5787 1644 6614 827
Alert 3074 1640 3289 215
Warning 2627 1640 2947 320
ATP3
Advisory 4204 1685 6779 2575
Alert 3300 1672 3370 070
Warning 2854 1658 2985 131
ATP4
Advisory 4296 1753 7053 2757
Alert 3346 1791 3679 333
Warning 2871 1755 3194 323
ATP5
Advisory 000 000
Alert 000 000
Warning 1069 1706 3088 2019
ATP6
Advisory 3632 1640 6598 2966
Alert 000 000
Warning 2770 1594 2850 080
US Department of Transportation Office of the Assistant Secretary for Research and Technology
Intelligent Transportation Systems Joint Program Office
Task 8 D2X Hub Proof-of-Concept Test Evaluation Report ndash Final | A-8
APPENDIX A Comprehensive Data Analysis Tables
Test Number
Type of Message
True Distance (m)
Speed (MPH)
Expected Distance (m)
Difference (m)
ATP7
Advisory 000 000
Alert 000 000
Warning 1919 1887 3483 1564
ATP8
Advisory 4492 1741 7005 2513
Alert 3113 1687 3409 296
Warning 2661 1680 3032 371
ATP9
Advisory 4694 1628 6550 1856
Alert 2991 1570 3113 122
Warning 2572 1549 2756 184
ATP10
Advisory 000 000
Alert 000 000
Warning 650 2505 4927 4277
ATP11
Advisory 000 000
Alert 000 000
Warning 1914 2398 4666 2752
ATP12
Advisory 000 000
Alert 000 000
Warning 460 2293 4415 3955
ATP13
Advisory 000 000
Alert 000 000
Warning 2732 2535 5001 2269
ATP14
Advisory 000 000
Alert 000 000
Warning 2358 2361 4577 2219
ATP15
Advisory 000 000
Alert 000 000
Warning 1107 2459 4814 3707
ATP16
Advisory 5668 1982 7974 2306
Alert 000 000
Warning 1502 1906 3525 2023
ATP17
Advisory 000 000
Alert 000 000
Warning 3183 2420 4720 1537
US Department of Transportation Office of the Assistant Secretary for Research and Technology
Intelligent Transportation Systems Joint Program Office
Task 8 D2X Hub Proof-of-Concept Test Evaluation Report ndash Final | A-9
Table A-5 Complete Data Analysis ndash Hypothesis 6 (MDEA)
Test Number
Type of Message
True Distance (m)
Speed (MPH)
Expected Distance (m)
Difference (m)
TFHRC1
Advisory 8756 2290 9213 457
Alert 5320 2509 5736 416
Warning 4651 2487 4883 232
TFHRC2
Advisory 9928 2514 10115 187
Alert 5276 2447 5546 270
Warning 4624 2415 4707 084
TFHRC3
Advisory 8952 2304 9270 318
Alert 5595 2603 6030 436
Warning 4890 2617 5205 315
TFHRC4
Advisory 9752 2514 10115 363
Alert 6290 2769 6564 274
Warning 4844 2693 5396 552
TFHRC5
Advisory 9613 2406 9680 067
Alert 5242 2420 5463 221
Warning 4080 2357 4568 488
ATP1
Advisory 5938 2183 8783 2845
Alert 4314 2120 4580 266
Warning 3644 2111 3989 345
ATP2
Advisory 6452 1641 6602 150
Alert 3296 1691 3419 123
Warning 2600 1601 2865 265
ATP3
Advisory 6212 1628 6550 338
Alert 3200 1655 3327 127
Warning 2707 1641 2949 242
ATP4
Advisory 6420 1646 6622 202
Alert 3300 1780 3650 350
Warning 2878 1704 3084 206
ATP5
Advisory 6673 1677 6747 074
Alert 3400 1847 3828 428
Warning 2972 1807 3307 335
ATP6
Advisory 6100 1628 6550 450
Alert 3100 1637 3281 181
Warning 2500 1597 2857 357
APPENDIX A Comprehensive Data Analysis Tables
US Department of Transportation Office of the Assistant Secretary for Research and Technology
Intelligent Transportation Systems Joint Program Office
Task 8 D2X Hub Proof-of-Concept Test Evaluation Report ndash Final | A-10
APPENDIX A Comprehensive Data Analysis Tables
Test Number
Type of Message
True Distance (m)
Speed (MPH)
Expected Distance (m)
Difference (m)
ATP7
Advisory 7500 1972 7934 434
Alert 3882 1914 4008 126
Warning 3400 1946 3614 214
ATP8
Advisory 6659 1744 7017 358
Alert 3263 1682 3396 133
Warning 2900 1682 3037 137
ATP9
Advisory 6605 1659 6675 070
Alert 2900 1556 3078 178
Warning 2365 1561 2781 416
ATP10
Advisory 9214 2491 10022 808
Alert 5859 2688 6301 442
Warning 5200 2644 5273 073
ATP11
Advisory 8485 2487 10006 1521
Alert 5376 2487 5668 292
Warning 4716 2483 4873 157
ATP12
Advisory 9001 2433 9789 788
Alert 5395 2420 5463 068
Warning 4103 2330 4503 400
ATP13
Advisory 8615 2559 10296 1681
Alert 000 000 000 000
Warning 4930 2581 5115 185
ATP14
Advisory 6119 2491 10022 3903
Alert 5500 2491 5681 181
Warning 3800 2402 4676 876
ATP15
Advisory 7546 2603 10473 2927
Alert 6000 2661 6215 215
Warning 3100 2603 5170 2070
ATP16
Advisory 7931 2089 8405 474
Alert 3995 1950 4106 111
Warning 3500 1923 3563 063
ATP17
Advisory 8243 2049 8244 001
Alert 5260 2465 5601 341
Warning 4718 2438 4763 045
US Department of Transportation Office of the Assistant Secretary for Research and Technology
Intelligent Transportation Systems Joint Program Office
Task 8 D2X Hub Proof-of-Concept Test Evaluation Report ndash Final | A-11
Table A-6 Complete Data Analysis ndash Hypothesis 7
Date Test
Number
User State Change Is
Safe Icon False
Properly Processed
User State Change Is
Safe Icon True
Properly Processed
1312017 TFHRC 1 111438 X 111504 X
1312017 TFHRC 3 112533 X 112619 X
1312017 TFHRC 4 114400 X 114438 X
1312017 TFHRC 5 114801 X 114829 X
1312017 TFHRC 6 115408 X 115444 X
1182017 ATP 1 105056 X 105116 X
1182017 ATP 2 105622 X 105656 X
1182017 ATP 3 110348 X 110436 X
1182017 ATP 4 111355 X 111417 X
1182017 ATP 5 111655 X 111717 X
1182017 ATP 6 111947 X 112007 X
1182017 ATP 7 112235 X 112305 X
1182017 ATP 8 112937 X 113013 X
1182017 ATP 9 113313 X 113353 X
1182017 ATP 10 113636 X 113708 X
1192017 ATP 11 45035 X 45057 X
1192017 ATP 13 45806 X 45828 X
1192017 ATP 14 50144 X 50202 X
1192017 ATP 15 50542 X 50600 X
1192017 ATP 16 50903 X 50929 X
APPENDIX A Comprehensive Data Analysis Tables
US Department of Transportation Office of the Assistant Secretary for Research and Technology
Intelligent Transportation Systems Joint Program Office
Task 8 D2X Hub Proof-of-Concept Test Evaluation Report ndash Final | A-12
APPENDIX A Comprehensive Data Analysis Tables
Table A-7 Complete Data Analysis ndash Hy pothesis 8 amp 9
US Department of Transportation Office of the Assistant Secretary for Research and Technology
Intelligent Transportation Systems Joint Program Office
Task 8 D2X Hub Proof-of-Concept Test Evaluation Report ndash Final | A-13
Test Number
Analyze the percentage of PMM messages properly processed by
in-vehicle devices Analyze the percentage of PMM-RSP messages
properly processed by mobile devices
Analyze the percentage of PMM-Cancel messages
properly processed by in-vehicle devices
MDEA Log ndash PMM Send
occurrence
MDEA Log ndash
PMM contents
VEA Log ndash PMM
Receive occurrence
VEA Log ndash Driver
acceptance
VEA Log ndash PMM-RSP
Send occurrence
MDEA Log ndash PMM-RSP
Receive occurrence
MDEA Log ndash Coordination
Status
MDEA Log ndash PMM-
Cancel Sent Occurrence
VEA Log ndash PMM-
Cancel Received
Occurrence
TFHRC 1 Check All Present Check Check Check Check Check Check Check
TFHRC 2 Check All Present Check Check Check Check Check Check Check
TFHRC 3 Check All Present Check Check Check Check Check Check Check
TFHRC 4 Check All Present Check Check Check Check Check Check Check
TFHRC 5 Check All Present Check Check Check Check Check Check Check
ATP 1 Check All Present Check Check Check Check Check Check Check
ATP 2 Check All Present Check Check Check Check Check Check Check
ATP 3 Check All Present Check Check Check Check Check Check Check
ATP 4 Check All Present Check Check Check Check Check Check Check
ATP 5 Check All Present Check Check Check Check Check Check Check
ATP 6 Check All Present Check Check Check Check Check Check Check
ATP 7 Check All Present Check Check Check Check Check Check Check
ATP 8 Check All Present Check Check Check Check Check Check Check
ATP 9 Check All Present Check Check Check Check Check Check Check
ATP 10 Check All Present Check Check Check Check Check Check Check
APPENDIX A Comprehensive Data Analysis Tables
Test Number
Analyze the percentage of PMM messages properly processed by
in-vehicle devices Analyze the percentage of PMM-RSP messages
properly processed by mobile devices
Analyze the percentage of PMM-Cancel messages
properly processed by in-vehicle devices
MDEA Log ndash PMM Send occurrence
MDEA Log ndash PMM
contents
VEA Log ndash PMM
Receive occurrence
VEA Log ndash Driver
acceptance
VEA Log ndash PMM-RSP
Send occurrence
MDEA Log ndash PMM-RSP
Receive occurrence
MDEA Log ndash Coordination
Status
MDEA Log ndash PMM-
Cancel Sent Occurrence
VEA Log ndash PMM-
Cancel Received
Occurrence
ATP 11 Check All Present Check Check Check Check Check Check Check
ATP 12 Check All Present Check Check Check Check Check Check Check
ATP 13 Check All Present Check Check Check Check Check Check Check
ATP 14 Check All Present Check Check Check Check Check Check Check
ATP 15 Check All Present Check Check Check Check Check Check Check
ATP 16 Check All Present Check Check Check Check Check Check Check
ATP 17 Check All Present Check Check Check Check Check Check Check
US Department of Transportation Office of the Assistant Secretary for Research and Technology
Intelligent Transportation Systems Joint Program Office
Task 8 D2X Hub Proof-of-Concept Test Evaluation Report ndash Final | A-14
Table A-8 Complete Data Analysis ndash Hy pothesis 10
Date Test Number
Analyze the Success Rate of Receiving a PMM-Arrive Message
VEA Log ndash PMM-ARRIVE Send Occurrence MDEA Log ndash PMM-ARRIVE Receive Occurrence
1312017 TFHRC 1 Fail Fail
1312017 TFHRC 2 Check Check
1312017 TFHRC 3 Check Check
1312017 TFHRC 4 Check Check
1312017 TFHRC 5 Check Check
1312017 TFHRC 6 Check Check
1312017 TFHRC 7 Check Check
1182017 ATP 1 Not Available Check
1182017 ATP 2 Not Available Check
1182017 ATP 3 Not Available Check
1182017 ATP 4 Not Available Check
1182017 ATP 5 Not Available Check
1182017 ATP 6 Not Available Check
1182017 ATP 7 Not Available Check
1182017 ATP 8 Not Available Check
1182017 ATP 9 Not Available Check
1182017 ATP 10 Not Available Check
1202017 ATP 11 Check Check
1202017 ATP 12 Check Check
1202017 ATP 13 Check Check
1202017 ATP 14 Check Check
1202017 ATP 15 Check Check
APPENDIX A Comprehensive Data Analysis Tables
US Department of Transportation Office of the Assistant Secretary for Research and Technology
Intelligent Transportation Systems Joint Program Office
Task 8 D2X Hub Proof-of-Concept Test Evaluation Report ndash Final | A-15
APPENDIX A Comprehensive Data Analysis Tables
Table A-9 Complete Data Analysis ndash Hypothesis 13 (Part A)
US Department of Transportation Office of the Assistant Secretary for Research and Technology
Intelligent Transportation Systems Joint Program Office
Task 8 D2X Hub Proof-of-Concept Test Evaluation Report ndash Final | A-16
Test Number
Coordination Request Sent
by Y
Coordination Request
Received by X
Request Confirmed
by X Confirmation Received by Y
Coordination Request Sent
by Z
Coordination Request
Received by X
Request Confirmed
by X Confirmation Received by Z
Coordination Heart Beat
Transmitted by Y amp Z
Heart Beat Response received
by X
Ride Arrived
Messages
TFHRC 1
Fail Traveler Y could not join the ad-hoc travel group
TFHRC 2
Check check check check 41047 check check check check check 41303
TFHRC 3
Check Check Check Check Check Check Check Check Check Check Check
TFHRC 4
Fail Traveler Y could not join the ad-hoc travel group
TFHRC 5
Check Check Check Check Check Check Check Check Check Check Check
TFHRC 6
Check Check Check Check Check Check Check Check Check Check Check
TFHRC 7
Check Check Check Check Check Check Check Check Check Check Check
TFHRC 8
Check Check Check Check Check Check Check Check Check Check Check
TFHRC 9
Check Check Check Check Check Check Check Check Check Check Check
TFHRC 10
Check Check Check Check Check Check Check Check Check Check Check
ATP 1 Check Check Check Check Check Check Check Check Check Check Check
ATP 2 Check Check Check Check Check Check Check Check Check Check Check
Test Number
Coordination Request Sent
by Y
Coordination Request
Received by X
Request Confirmed
by X Confirmation Received by Y
Coordination Request Sent
by Z
Coordination Request
Received by X
Request Confirmed
by X Confirmation Received by Z
Coordination Heart Beat
Transmitted by Y amp Z
Heart Beat Response received
by X
Ride Arrived
Messages
ATP 3 Check Check Check Check Check Check Check Check Check Check Check
ATP 4 Check Check Check Check Check Check Check Check Check Check Check
ATP 5 Check Check Check Check Check Check Check Check Check Check Check
ATP 6 Check Check Check Check Check Check Check Check Check Check Check
ATP 7 Check Check Check Check Check Check Check Check Check Check No ride
arrives received
ATP 8 Check Check Check Check Check Check Check Check Check Check Check
ATP 9 Check Check Check Check Check Check Check Check Check Check No ride
arrives received
ATP 10 Check Check Check Check Check Check Check Check Check Check Check
ATP 11 Check Check Check Check Check Check Check Check Check Check Check
ATP 12 Check Check Check Check Check Check Check Check Check Check No ride
arrives received
ATP 13 Check Check Check Check Check Check Check Check Check Check Check
ATP 14 Check Check Check Check Check Check Check Check Check Check Check
ATP 15 Check Check Check Check Check Check Check Check Check Check Check
APPENDIX A Comprehensive Data Analysis Tables
US Department of Transportation Office of the Assistant Secretary for Research and Technology
Intelligent Transportation Systems Joint Program Office
Task 8 D2X Hub Proof-of-Concept Test Evaluation Report ndash Final | A-17
APPENDIX A Comprehensive Data Analysis Tables
Table A-10 Complete Data Analysis ndash Hypothesis 13 (Part B)
US Department of Transportation Office of the Assistant Secretary for Research and Technology
Intelligent Transportation Systems Joint Program Office
Task 8 D2X Hub Proof-of-Concept Test Evaluation Report ndash Final | A-18
Test Number Coordination Cancel by
Walking Away Coordination Cancel by
Manual Request Disband Group after
Entering into Vehicle
TFHRC 1 Check This step not tested on this day
TFHRC 2 Check This step not tested on this day
TFHRC 3 Check This step not tested on this day
TFHRC 4 Check This step not tested on this day
TFHRC 5 Check This step not tested on this day
TFHRC 6 This step not tested on this day Check Check
TFHRC 7 This step not tested on this day Check Check
TFHRC 8 This step not tested on this day Check Check
TFHRC 9 This step not tested on this day Check Check
TFHRC 10 This step not tested on this day Check Check
ATP 1 Check Check Check
ATP 2 Check Check Check
ATP 3 Check Check Check
ATP 4 Check Check Check
ATP 5 Check Check Check
ATP 6 Check Check Check
ATP 7 Check Check Check
ATP 8 Check Check Check
ATP 9 Check Check Check
APPENDIX A Comprehensive Data Analysis Tables
Test Number Coordination Cancel by
Walking Away Coordination Cancel by
Manual Request Disband Group after Entering into Vehicle
ATP 10 Check Check Check
ATP 11 Fail Could not cancel by distance Check Check
ATP 12 Check Check Check
ATP 13 Fail Could not cancel by distance Check Check
ATP 14 Check Check Check
ATP 15 Check Check Check
US Department of Transportation Office of the Assistant Secretary for Research and Technology
Intelligent Transportation Systems Joint Program Office
Task 8 D2X Hub Proof-of-Concept Test Evaluation Report ndash Final | A-19
APPENDIX A Comprehensive Data Analysis Tables
APPENDIX B Acronyms and Abbreviations
ATG Ad-Hoc Travel Group
ATP Acceptance Test Plan
BSM Basic Safety Message
CCP Common Computing Platform
CV Connected Vehicle
DSRC Dedicated Short Range Communications
EPS Experimental Prototype System
FHWA Federal Highway Administration
FR Functional Requirement
ITS Intelligent Transportation Systems
LDV Light-Duty Vehicle
MAP Map Data
MDEA Mobile Device Experimental Application
MGL Message Logging
OBU On-board Unit
PMM Personal Mobility Message
PMM-ARRIVE Personal Mobility Message Arrival Message
PMM-CANCEL Personal Mobility Message Cancel Message
PMM-RSP Personal Mobility Message Response Message
PR Performance Requirement
PSM Personal Safety Message
REA Roadside Experimental Application
RSU Roadside Unit
SFY Safety
SIR System Interface Requirement
SMP SPaT and MAP
SPaT Signal Phasing and Timing
SyRS System Requirements Specifications
TFHRC Turner-Fairbank Highway Research Center
US DOT US Department of Transportation
US Department of Transportation Office of the Assistant Secretary for Research and Technology
Intelligent Transportation Systems Joint Program Office
Task 8 D2X Hub Proof-of-Concept Test Evaluation Report ndash Final |B-1
VEA Vehicle Experimental Application
Wi-Fi Wireless Fidelity
APPENDIX B Acronyms and Abbreviations
US Department of Transportation Office of the Assistant Secretary for Research and Technology
Intelligent Transportation Systems Joint Program Office
Task 8 D2X Hub Proof-of-Concept Test Evaluation Report ndash Final | B-2
APPENDIX C Terms and Definitions
Basic Safety Message (BSM)
Connected vehicle message type which contains vehicle safety-related information that is broadcast to surrounding vehicles
Bluetooth Short range wireless technology used to exchange data between enabled devices
Cellular Uses short-range radio stations to cover areas of communication
Connected Vehicle A vehicle that can communicate with other vehicles and infrastructure via communication media such as DSRC Wi-Fi cellular or Bluetooth
Coordinated Messages are coordinated when two or more mobile devices have establish a travel group based on the same origin destination and
time and function as a single cohesive senderrecipient
CV Inspector An application that verifies if the Mobile Device is broadcasting messages to Connected Vehicles
Destination The end point of a travelerrsquos trip
DSRC Dedicated Short-Range Communications a low-latency high-reliability two-way communications tool used for sending transportation safety
messages
Light-Duty Vehicle Of or relating to vehicles that way less than 4000 lbs
Message Type Type of personal safety or personal mobility message that is transmitted based on the technology used and level of coordination available
Personal Mobility Message (PMM)
Similar to PDM message intended for the exchange of mobility messages between individual travelers and vehiclesinfrastructure via
mobile device
Personal Safety Message (PSM)
Similar to BSM message intended to transmit low-latency urgent safety messages between individual travelers and vehiclesinfrastructure via
mobile device
Test Case A set of conditions or variables that a Tester can determine if system meets requirements
Transit Vehicle Large vehicles mainly used for public transportation as well as support services
Transmitting The state in which a traveler has opted in and is sendingreceiving messages via mobile device
Uncoordinated Messages are uncoordinated when travel groups are not established (see coordinated definition)
Wi-Fi Local area wireless technology that allows enabled devices to connect to the Internet
APPENDIX A Comprehensive Data Analysis Tables
US Department of Transportation Office of the Assistant Secretary for Research and Technology
Intelligent Transportation Systems Joint Program Office
Task 8 D2X Hub Proof-of-Concept Test Evaluation Report ndash Final |C-1
ITS Joint Program Office-HOIT 1200 New Jersey Avenue SE
Washington DC 20590
Toll-Free ldquoHelp Linerdquo 866-367-7487 wwwitsdotgov
FHWA-JPO-18-263
- Structure Bookmarks
-
- Sharing Data between Mobile Devices Connected Vehicles and Infrastructure Task 8 D2X Hub Proof-of-Concept Test Evaluation Report wwwitsdotgovindexhtm Final Report mdash October 25 2017 FHWA-JPO-18-623
- Revision History
- Table of Contents
- Chapter 1 Scope
- Chapter 2 Referenced Documents
- Chapter 3 Test Conduct
- Chapter 4 Experimental Analysis Results Summary
- Chapter 5 Experimental Analysis
- Chapter 6 Lessons Learned and Recommendations
- APPENDIX A Comprehensive Data Analysis Tables
- APPENDIX B Acronyms and Abbreviations
- APPENDIX C Terms and Definitions
-

Chapter 5 Experimental Analysis
Source Battelle Google Maps February 2017
Figure 5-3 Cross Track Distance between Pedestrian and Vehicle Path
US Department of Transportation Office of the Assistant Secretary for Research and Technology
Intelligent Transportation Systems Joint Program Office
Task 8 D2X Hub Proof-of-Concept Test Evaluation Report ndash Final | 17
Chapter 5 Experimental Analysis
Hypothesis 7 MDEA Log ndash GPS Location SafeUnsafe Zone Status and MAP Message Contents
Data logs verified MDEA Log ndash GPS Location SafeUnsafe Zone Status and MAP Message Contents
Analysis
Analyzed the percentage of properly classified safeunsafe zone detections The device was placed in the roadway ndash mobile device location was properly classified if it positions itself in an unsafe zone
Observations User State Change from Safe to Unsafe (when placed 20 m in the roadway) and Unsafe to Safe (when placed 50 m from the roadway) were captured accurate and timely
Table 5-9 Hypothesis 7 Analysis Data Sample
TFHRC 1 TFHRC 2 TFHRC 3 TFHRC 4 TFHRC 5
User State Change Is Safe Icon False (2 m in the roadway)
111438 112533 114400 114801 115408
Properly Processed
User State Change Is Safe Icon True (5 m from the roadway)
111504 112619 114438 114829 115444
Properly Processed
For the complete analysis please refer to Table A-6 in Appendix A
US Department of Transportation Office of the Assistant Secretary for Research and Technology
Intelligent Transportation Systems Joint Program Office
Task 8 D2X Hub Proof-of-Concept Test Evaluation Report ndash Final | 18
Chapter 5 Experimental Analysis
Source Battelle Google Maps February 2017
Figure 5-4 Safe and Unsafe Zones at TFHRC Test Site
Results There were no outliers (False Negatives) in the data analyzed Hence Hypothesis 7 is satisfied at a 100 level of confidence
US Department of Transportation Office of the Assistant Secretary for Research and Technology
Intelligent Transportation Systems Joint Program Office
Task 8 D2X Hub Proof-of-Concept Test Evaluation Report ndash Final | 19
Chapter 5 Experimental Analysis
Hypothesis 8 amp 9 The VEA can coordinate taxi travel requests from an MDEA
Data logs verified MDEA Log ndash PMM Send Occurrence PMM contents PMM-RSP Receive Occurrence Coordination Status and PMM-Cancel Sent Occurrence
Analysis
Analyzed the percentage of PMM and PMM ndash Cancel messages properly processed by in-vehicle devices
Analyzed the percentage of PMM-RSP messages properly processed by mobile devices This analysis was performed for PMM Messages communicated through both DSRC and
Cellular
Observations 16 out of 204 checks had a failure during tests performed under ATP
Table 5-10 Hypothesis 8 amp 9 Analysis Data Sample
TFHRC 1 TFHRC 2 TFHRC 3 TFHRC 4 TFHRC 5
Analyze the percentage of PMM messages properly processed by in-vehicle devices
MDEA Log ndash PMM Send occurrence
Check Check Check Check Check
MDEA Log ndash PMM contents
All Present All Present All Present All Present All Present
Experimental Log ndash Information entered into
Mobile Device by Traveler
VEA Log ndash PMM Receive occurrence
Check Check Check Check Check
Analyze the percentage of PMM-RSP messages properly processed by mobile devices
Experimental Log ndash Driver Acceptance
VEA Log ndash Driver acceptance
Check Check Check Check Check
VEA Log ndash PMM-RSP Send occurrence
Check Check Check Check Check
MDEA Log ndash PMM-RSP Receive occurrence
Check Check Check Check Check
MDEA Log ndash Coordination Status
Check Check Check Check Check
Experimental Log ndash Coordination Success
Display
US Department of Transportation Office of the Assistant Secretary for Research and Technology
Intelligent Transportation Systems Joint Program Office
Task 8 D2X Hub Proof-of-Concept Test Evaluation Report ndash Final | 20
Chapter 5 Experimental Analysis
TFHRC 1 TFHRC 2 TFHRC 3 TFHRC 4 TFHRC 5
Analyze the percentage of PMM-Cancel messages properly processed by in-vehicle devices
MDEA Log ndash PMM-Cancel Sent Occurrence
Check Check Check Check Check
VEA Log ndash PMM-Cancel Received
Occurrence Check Check Check Check Check
For the complete analysis please refer to Table A-7 in Appendix A
Results Considering the tests performed at TFHRC Hypothesis 8 is satisfied at a 100 level of confidence However ATP tests satisfied the hypothesis at a confidence level of 9215
Issues Identified
Some issues observed for cloud communication during ATP testing at Columbus OH
Delay in Cloud PMM-cancel for VEA ndash 8 instances Adding a trip twice ndash 5 instances Some PMMs not being cancelled ndash 3 instances
All these issues were addressed prior to TFHRC tests
TFHRC tests did not have any of the above issues
US Department of Transportation Office of the Assistant Secretary for Research and Technology
Intelligent Transportation Systems Joint Program Office
Task 8 D2X Hub Proof-of-Concept Test Evaluation Report ndash Final | 21
Chapter 5 Experimental Analysis
Hypothesis 10 The traveler can receive arrival updates from a taxi or transit vehicle
Data logs verified VEA Log ndash PMM-ARRIVE Send Occurrence
MDEA Log ndash PMM-ARRIVE receive occurrence
Analysis
Analyzed the success rate of receiving a PMM-Arrive message via DSRC
Observations One test case at TFHRC failed due to equipment failure (CCP lost its location) All other tests satisfied the hypothesis
Table 5-11 Hypothesis 10 Analysis Data Sample
TFHRC 1
TFHRC 2
TFHRC 3
TFHRC 4
TFHRC 5
TFHRC 6
TFHRC 7
DSRC (Taxi)
Analyze the success rate of receiving a PMM-Arrive message
VEA Log ndash PMM-ARRIVE
Send occurrence
Fail Check Check Check Check Check Check
MDEA Log ndash PMM-ARRIVE
Receive occurrence
Fail Check Check Check Check Check Check
For the complete analysis please refer to Table A-8 in Appendix A
Results Considering the tests at TFHRC the hypothesis is satisfied at a confidence level of 8571 12 out of 14 tests were successful
US Department of Transportation Office of the Assistant Secretary for Research and Technology
Intelligent Transportation Systems Joint Program Office
Task 8 D2X Hub Proof-of-Concept Test Evaluation Report ndash Final | 22
Chapter 5 Experimental Analysis
Hypothesis 11 amp 12 The MDEA can detect when a traveler transitions from a pedestrian to a light duty vehicle or from a light duty vehicle to a pedestrian
Data logs verified MDEA Log ndash Travel Mode Status Change Experimental Log ndash Mode Transition Detection Log
Analysis 1 Assessed the change in ldquoTravel Mode Statusrdquo after the pedestrian enters the vehicle
(The threshold value for Travel Mode Status Change is 10 secs) 2 Assessed the false positive rate of transition detection
Observations Accelerometer tests on average took 75 secs and 44 secs to detect in-vehicle and on-foot respectively However Bluetooth beacon tests on a verage took 17 secs and 1 1 secs to detect in-vehicle and on-foot respectively This quantifies the unreliable nature of Bluetooth Beacons as used in this system
Table 5-12 Hypothesis 11 amp 12 Analysis Data Sample
Mode Detection Method On-foot to In-Vehicle Transition time (Sec)
In-Vehicle to On-foot Transition Time (Sec)
Accelerometer 75 44
Bluetooth Beacon 17 11
Results Hypothesis is proved as 100 confident during the accelerometer tests However none of the tests with Bluetooth Beacon satisfied the hypothesis (all false negatives)
US Department of Transportation Office of the Assistant Secretary for Research and Technology
Intelligent Transportation Systems Joint Program Office
Task 8 D2X Hub Proof-of-Concept Test Evaluation Report ndash Final | 23
Chapter 5 Experimental Analysis
Hypothesis 13 The MDEA can coordinate maintain and cancel travel with another MDEA via Wi-Fi Direct
Data logs verified MDEA (1) Log ndash Coordination Request Received Occurrence Coordination Request Contents Coordination Acceptance Sent Occurrence Coordination Acceptance Notification Coordination Heartbeat Received Occurrence Coordination Cancel Response Sent occurrence and Coordination Disband Sent occurrence
MDEA (2) Log ndash Coordination Request Sent Occurrence Coordination Confirmation received Occurrence Coordination Heartbeat Response Sent Occurrence Coordination Acceptance received Occurrence
Analysis 1 Determined the percentage of Coordination Request Acceptance Heartbeat Cancel and
Disband messages properly processed by mobile devices 2 Assessed the message contents for consistency
Observations This test is performed in a highly-controlled environment This means selection of specific devices and designating them with specific roles This approach was chosen due to poor Wi-Fi direct performance with our system that would have otherwise hindered the ability to conduct the testing and collect the necessary data
US Department of Transportation Office of the Assistant Secretary for Research and Technology
Intelligent Transportation Systems Joint Program Office
Task 8 D2X Hub Proof-of-Concept Test Evaluation Report ndash Final | 24
Chapter 5 Experimental Analysis
Table 5-13 Hypothesis 13 Analysis Data Sample
13117 2117
TFHRC 1
TFHRC 2
TFHRC 3
TFHRC 4
TFHRC 5
TFHRC 6
TFHRC 7
TFHRC 8
TFHRC 9
TFHRC 10
Coordination Request Sent by
Y
Fai
l T
rave
ler
Y c
ould
no
t joi
n th
e ad
-hoc
trav
el g
roup
40951 Check
F
ail
Tra
vele
r Y
cou
ld
not j
oin
the
ad-h
oc tr
avel
gro
up
Check Check Check Check Check Check
Coordination Request Received
by X check Check Check Check Check Check Check Check
Request Confirmed by X
check Check Check Check Check Check Check Check
Confirmation Received by Y
Coordination Request Sent by
Z
check Check Check Check Check Check Check Check
41047 Check Check Check Check Check Check Check
Coordination Request Received
by X check Check Check Check Check Check Check Check
Request Confirmed by X
check Check Check Check Check Check Check Check
Confirmation Received by Z
Coordination Heart Beat
Transmitted by Y amp Z
check Check Check Check Check Check Check Check
check Check Check Check Check Check Check Check
Heart Beat Response
received by X
Ride Arrived Messages
check Check Check Check Check Check Check Check
41303 Check Check Check Check Check Check Check
Coordination Cancel by walking
away Check Check Check Check Check This step not tested on this day
Coordination Cancel by Manual
request This step not tested on this day
Check Check Check Check Check
Disband Group after entering into
vehicle Check Check Check Check Check
For the complete analysis please refer to Table A-9 and Table A-10 in Appendix A
Results There were 30 outliers out of 198 checks (False Negatives) in the data analyzed Hence Hypothesis 13 is satisfied at an 8484 level of confidence
US Department of Transportation Office of the Assistant Secretary for Research and Technology
Intelligent Transportation Systems Joint Program Office
Task 8 D2X Hub Proof-of-Concept Test Evaluation Report ndash Final | 25
US Department of Transportation Office of the Assistant Secretary for Research and Technology
Intelligent Transportation Systems Joint Program Office
Task 8 D2X Hub Proof-of-Concept Test Evaluation Report ndash Final | 26
Chapter 5 Experimental Analysis
Hypothesis 14 The RSU can broadcast a SPaT and MAP message via DSRC that can be received by mobile devices
Data logs verified MDEA Log ndash BSM received and PSM send occurrences
Analysis 1 Determined the percentage of SPaT messages received by mobile devices when within
100 meters of RSE Assessed message contents for consistency 2 Determined the percentage of MAP messages received by mobile devices when within
100 meters of RSE Assessed message contents for consistency
Observations Considering test 5444 all the SPa T messages were transmitted and received at a rate of 1sec Similarly all the MAP messages were transmitted and received at a rate better than 5sec
Table 5-14 Hypothesis 14 Analysis Data Sample
ID Date Message
5 13117 163842 Dsrc Rx Spat id19
6 13117 163842 Dsrc Rx Map id18
9 13117 163843 Dsrc Rx Spat id19
10 13117 163843 Dsrc Rx Bsm Lat389546323 Long -771488295 Head 2713375 Sp 0
12 13117 163843 Dsrc Rx Bsm Lat389546138 Long -771483988 Head 2559125 Sp 0
13 13117 163844 Dsrc Rx Spat id19
14 13117 163844 Dsrc Rx Bsm Lat389546323 Long -771488297 Head 2713375 Sp 0
16 13117 163844 Dsrc Rx Bsm Lat389546138 Long -771483987 Head 2559125 Sp 0
17 13117 163844 Dsrc Rx Map id18
18 13117 163844 Dsrc Rx Bsm Lat389546322 Long -7714883 Head 2713375 Sp 0
20 13117 163845 Dsrc Rx Bsm Lat389546137 Long -771483987 Head 2559125 Sp 0
21 13117 163845 Dsrc Rx Bsm Lat389546322 Long -771488302 Head 2713375 Sp 0
22 13117 163845 Dsrc Rx Spat id19
23 13117 163845 Dsrc Rx Bsm Lat389546137 Long -771483987 Head 2559125 Sp 0
25 13117 163845 Dsrc Rx Bsm Lat38954632 Long -771488302 Head 2713375 Sp 0
26 13117 163846 Dsrc Rx Bsm Lat389546135 Long -771483987 Head 2559125 Sp 0
27 13117 163846 Dsrc Rx Spat id19
29 13117 163846 Dsrc Rx Bsm Lat389546318 Long -771488303 Head 2713375 Sp 0
31 13117 163846 Dsrc Rx Map id18
Results There were no outliers (False Negatives) in the data analyzed Hence Hypothesis 14 is satisfied at a 100 level of confidence
Chapter 5 Experimental Analysis
Hypothesis 15 The RSU can store all messages received via DSRC
Data logs verified MDEA Log ndash All Occurrences of messages sent via DSRC and Message Contents RSU Log ndash Message Received Occurrence and Message Contents
Analysis 1 Assessed the percentage of messages received from mobile devices within 100 meters of
RSE Assess message contents to make sure they are consistent
Observations a Considering the message logs from test cases 5411 5444 5471 there were instances
where PSMs were logged at a rate of less than 10sec Also there were test cases that had no reception of PSMs This clearly indicates the reception issues with RSU CCP unit One prime focus for the Large-Scale Field Test is to improve the reliability of the hardware associated with RSU
b The message contents in all the DSRC messages were consistent throughout the test logs
Table 5-15 Hypothesis 15 Analysis Data Sample
Date Time
Vehicle Range and Advisory Distance wrt
Speed Speed (mph)
In Range
Out of Range
Distance (m)
RSU Log PSM
Message RateSec
13117 101316 IsBsmClose Dist
975500061708885lt AdvDist 1024200201024
255 98 8
13117 101332 IsBsmClose Dist
570797651794001lt AdvDist 666000057888
173 57 6
13117 101340 IsBsmClose Dist
57448436831453lt AdvDist 601199821728
149 57 1
13117 101529 IsBsmClose Dist
975729907380225lt AdvDist 102240014976
254 98 0
13117 101538 IsBsmClose Dist
399317028326919lt AdvDist 102240014976
250 4 1
For the complete analysis please refer to Table A-1 in Appendix A
US Department of Transportation Office of the Assistant Secretary for Research and Technology
Intelligent Transportation Systems Joint Program Office
Task 8 D2X Hub Proof-of-Concept Test Evaluation Report ndash Final | 27
Chapter 5 Experimental Analysis
Table 5-16 Data Usage Statistics
17-Jan 18-Jan 19-Jan 20-Jan 31-Jan 1-Feb Average Maximum
Total Usage (MB) 3805 626 714 2713 4873 1355 984 2713
TMX core usage (MB) 271 450 468 1991 345 90 705 1991
of TMX usage 71 72 66 73 71 66 71 73
Results The hypothesis statement of RSU being able to store all messages received via DSRC is not satisfied at 100 level of confidence due to hardware issues
US Department of Transportation Office of the Assistant Secretary for Research and Technology
Intelligent Transportation Systems Joint Program Office
Task 8 D2X Hub Proof-of-Concept Test Evaluation Report ndash Final | 28
Chapter 6 Lessons Learned and Recommendations
Lessons Learned
The Lessons Learned from the Proof-of-Concept testing are summarized as follows
The ability to reliably generate transmit and receive messages between mobile devices and connected vehicles was demonstrated
The messages to incorporate mobile devices into the C V environment functioned as designed and provided the necessary data for the prototype mobility and safety applications
The prototype safety and mobility software applications functioned well (as designed)
Limitations of technology and hardware issues caused the majority of performance shortfalls
Mixed results were achieved for the various communication methods tested
a Cellular functioned well with our system
b Wi-Fi Direct connectivity was unreliable with our system
c DSRC hardware problems caused communication problems with our system
GPS accuracy limitations were observed as expected
Wi-Fi Direct Connectivity
The connection process was prone to failure at multiple points with no indication to the application why connection failed
TFHRC success rate was achieved by selecting specific devices that worked best for specific roles otherwise a failure rate gt50 would have been expected based on earlier testing
Canvasing of developer community found similar observations no solutions for our system
Wi-Fi Direct connection process requires authorization from the user of the target device in a real world environment such a request would most likely be denied if noticed at all
US Department of Transportation Office of the Assistant Secretary for Research and Technology
Intelligent Transportation Systems Joint Program Office
Task 8 D2X Hub Proof-of-Concept Test Evaluation Report ndash Final | 29
Chapter 6 Lessons Learned and Recommendations
DSRC Hardware
Common Computer Platform (CCP) Pre-production engineering units were used which were determined to have an impedance mismatch between the DSRC chip and RF connector that caused reduction of signal strength
Arada LocoMate ME There were occasional Bluetooth connection failures to mobile devices as well as occasional DSRC transmissionreception failures Longer term it is assumed that DSRC radios will be integrated into smartphones thus obviating the current issues
Recommendations
Based on outcomes of Proof-of-Concept Testing the following prototype system design changes are recommended to be implemented prior to the larger-scale prototype field test
Add Cellular-based communication for Travel Group coordination between mobile devices
New and improved CCP units will be used for the larger-scale field test
For in-vehicle detection use Accelerometer method as the most reliable option
US Department of Transportation Office of the Assistant Secretary for Research and Technology
Intelligent Transportation Systems Joint Program Office
Task 8 D2X Hub Proof-of-Concept Test Evaluation Report ndash Final | 30
APPENDIX A Comprehensive Data Analysis Tables
Note For all the analysis results depicted below the term ldquocheckrdquo refers to the ldquosuccessrdquo of desired action
Table A-1 Complete Data Analysis ndash Hypothesis 1 4 amp 15
Date Time Vehicle Range and Advisory
Distance wrt Speed Speed In
Range Out of
Range Distance
RSU Log PSM
Message RateSec
VEA Log PSM
Message Rate
1312017 101316 IsBsmClose Dist 975500061708885lt
AdvDist 1024200201024 255 X 98 8 10
1312017 101332 IsBsmClose Dist 570797651794001lt
AdvDist 666000057888 173 X 57 6 10
1312017 101340 IsBsmClose Dist 57448436831453lt
AdvDist 601199821728 149 X 57 1 10
1312017 101529 IsBsmClose Dist 975729907380225lt
AdvDist 102240014976 254 X 98 0 10
1312017 101538 IsBsmClose Dist 399317028326919lt
AdvDist 102240014976 250 X 4 1 10
1312017 101553 IsBsmClose Dist 600719107941917lt
AdvDist 70199987616 174 X 60 0 10
1312017 102029 IsBsmClose Dist 944643508928866lt
AdvDist 1008000141984 251 X 95 0 9
1312017 102048 IsBsmClose Dist 592561932680623lt
AdvDist 628200188352 156 X 59 0 9
US Department of Transportation Office of the Assistant Secretary for Research and Technology
Intelligent Transportation Systems Joint Program Office
Task 8 D2X Hub Proof-of-Concept Test Evaluation Report ndash Final | A-1
APPENDIX A Comprehensive Data Analysis Tables
Date Time Vehicle Range and Advisory
Distance wrt Speed Speed In
Range Out of Range Distance
RSU Log PSM
Message RateSec
VEA Log PSM
Message Rate
1312017 102054 IsBsmClose Dist 616348297460404lt
AdvDist 644399845056 160 X 62 3 11
1312017 102105 IsBsmClose Dist 871180496389495lt
AdvDist 1092600137376 247 X 87 4 9
1312017 102206 IsBsmClose Dist 977301610734722lt
AdvDist 1130400006912 295 X 98 0 10
1312017 102228 IsBsmClose Dist 577576034007057lt
AdvDist 60659997552 151 X 58 2 10
1312017 102332 IsBsmClose Dist 101193300977461lt
AdvDist 10386002088 258 X 101 10 10
1312017 102356 IsBsmClose Dist 595641466972855lt
AdvDist 660599904096 164 X 60 6 10
1312017 102623 IsBsmClose Dist 100217014111125lt
AdvDist 1024200201024 253 X 100 7 10
1312017 102650 IsBsmClose Dist 540919707235241lt
AdvDist 887399925984 221 X 54 0 10
1172017 111504 IsBsmClose Dist 100564061581794lt
AdvDist 1169999927712 291 X 101 10 10
1172017 112437 IsBsmClose Dist 992912014791515lt
AdvDist 10386002088 258 X 99 10 10
1172017 112837 IsBsmClose Dist 106684353810469lt
AdvDist 1076400078336 261 X 107 10 10
US Department of Transportation Office of the Assistant Secretary for Research and Technology
Intelligent Transportation Systems Joint Program Office
Task 8 D2X Hub Proof-of-Concept Test Evaluation Report ndash Final | A-2
APPENDIX A Comprehensive Data Analysis Tables
Date Time Vehicle Range and Advisory
Distance wrt Speed Speed In
Range Out of Range Distance
RSU Log PSM
Message RateSec
VEA Log PSM
Message Rate
1172017 113148 IsBsmClose Dist 1124753473133lt AdvDist
1186199986752 268 X 112 10 10
1172017 113332 IsBsmClose Dist 106022149777593lt
AdvDist 1126799904384 260 X 106 10 10
1172017 113336 IsBsmClose Dist 59429630331283lt
AdvDist 1196999892 298 X 59 10 10
1172017 113357 IsBsmClose Dist 657937887214709lt
AdvDist 1193400191808 297 X 66 10 10
1172017 113627 IsBsmClose Dist 965542357439439lt
AdvDist 1080000180864 260 X 97 10 10
1172017 113629 IsBsmClose Dist 821301583410616lt
AdvDist 1074600027072 270 X 82 10 10
1172017 113803 IsBsmClose Dist 994884887192582lt
AdvDist 104580001152 251 X 99 10 10
1172017 113811 IsBsmClose Dist 16809952777894lt
AdvDist 106200007056 257 X 17 10 10
1172017 114114 IsBsmClose Dist 948985801452811lt
AdvDist 986399929152 245 X 95 10 10
1172017 114133 IsBsmClose Dist 141255704529106lt
AdvDist 963000067392 242 X 14 10 10
1172017 114136 IsBsmClose Dist 377627357471613lt
AdvDist 977400075168 243 X 38 10 10
US Department of Transportation Office of the Assistant Secretary for Research and Technology
Intelligent Transportation Systems Joint Program Office
Task 8 D2X Hub Proof-of-Concept Test Evaluation Report ndash Final | A-3
APPENDIX A Comprehensive Data Analysis Tables
Date Time Vehicle Range and Advisory
Distance wrt Speed Speed In
Range Out of Range Distance
RSU Log PSM
Message RateSec
VEA Log PSM
Message Rate
1172017 114403 IsBsmClose Dist 114490146784404lt
AdvDist 1225799907552 266 X 114 10 10
1172017 114415 IsBsmClose Dist 280463490772458lt
AdvDist 71100013248 161 X 28 10 10
1172017 114735 IsBsmClose Dist 102043927314914lt
AdvDist 1040399857728 259 X 102 10 10
1172017 114755 IsBsmClose Dist 185020887331204lt
AdvDist 112499985312 275 X 19 10 10
1192017 35605 IsBsmClose Dist 107928079653642lt
AdvDist 1107000145152 272 X 108 9 9
1192017 35630 IsBsmClose Dist 99759104887202lt
AdvDist 1184399935488 294 X 100 10 10
1192017 35837 IsBsmClose Dist 110291146846666lt
AdvDist 115020016848 286 X 110 10 10
1192017 40057 IsBsmClose Dist 998997459961241lt
AdvDist 1260000076896 313 X 100 10 10
1192017 40300 IsBsmClose Dist 100209094247195lt
AdvDist 106919987328 260 X 100 10 10
1192017 40410 IsBsmClose Dist 100723184500334lt
AdvDist 1097999888832 273 X 101 6 10
1192017 41103 IsBsmClose Dist 977354295877856lt
AdvDist 1008000141984 251 X 98 10 10
US Department of Transportation Office of the Assistant Secretary for Research and Technology
Intelligent Transportation Systems Joint Program Office
Task 8 D2X Hub Proof-of-Concept Test Evaluation Report ndash Final | A-4
APPENDIX A Comprehensive Data Analysis Tables
Date Time Vehicle Range and Advisory
Distance wrt Speed Speed In
Range Out of Range Distance
RSU Log PSM
Message RateSec
VEA Log PSM
Message Rate
1192017 41311 IsBsmClose Dist 10190842581135lt
AdvDist 1040399857728 259 X 102 10 10
1192017 41423 IsBsmClose Dist 995536361906761lt
AdvDist 1009799790912 251 X 100 10 10
1192017 41534 IsBsmClose Dist 10075608603652lt
AdvDist 106919987328 264 X 101 10 10
US Department of Transportation Office of the Assistant Secretary for Research and Technology
Intelligent Transportation Systems Joint Program Office
Task 8 D2X Hub Proof-of-Concept Test Evaluation Report ndash Final | A-5
APPENDIX A Comprehensive Data Analysis Tables
Table A-2 Complete Data Analysis ndash Hypothesis 2
US Department of Transportation Office of the Assistant Secretary for Research and Technology
Intelligent Transportation Systems Joint Program Office
Task 8 D2X Hub Proof-of-Concept Test Evaluation Report ndash Final | A-6
Date Test
Number PSMs Generated by
Trav X and Trav Y Transition to In Group Trav Y PSM Ceased Only Trav X PSM
Received
1312017 TFHRC 1 111116 111240 Check 111305
1312017 TFHRC 2 Grouping Failed Grouping Failed Grouping Failed Grouping Failed
1312017 TFHRC 3 112346 112448 Check 112508
1312017 TFHRC 4 114208 114301 Check 114345
1312017 TFHRC 5 114609 114658 Check 114721
1312017 TFHRC 6 115222 115313 Check 115342
1182017 ATP 1 104400 104527 Check 104601
1182017 ATP 2 105356 105455 Check 105546
1182017 ATP 3 110059 110150 Check 110322
1182017 ATP 4 111222 111310 Check 111329
1182017 ATP 5 111515 111616 Check 111630
1182017 ATP 6 111823 111906 Check 111917
1182017 ATP 7 112116 112157 Check 112209
1182017 ATP 8 112814 112855 Check 112917
1182017 ATP 9 113142 113230 Check 113248
1182017 ATP 10 113501 113545 Check 113608
1192017 ATP 11 44728 44842 Check 45007
1192017 ATP 12 Radio Failure Test Terminated Radio Failure Test Terminated Radio Failure Test Terminated Radio Failure Test Terminated
1192017 ATP 13 45548 45637 Check 45728
1192017 ATP 14 45946 50047 Check 50107
1192017 ATP 15 50353 50444 Check 50513
1192017 ATP 16 50730 50823 Check 50839
APPENDIX A Comprehensive Data Analysis Tables
Table A-3 Complete Data Analysis ndash Hypothesis 3
US Department of Transportation Office of the Assistant Secretary for Research and Technology
Intelligent Transportation Systems Joint Program Office
Task 8 D2X Hub Proof-of-Concept Test Evaluation Report ndash Final | A-7
Date Description
MDEA not in Vehicle
MDEA Transmits
PSMs Time of MDEA
Mode Transition
MDEA Ceases Transmitting
PSMs
1312017 TFHRC 1 Check Check 0443101852 Check
1312017 TFHRC 2 Check Check 0445243056 Check
1312017 TFHRC 3 Check Check 0447569444 Check
1312017 TFHRC 4 Check Check 0448888889 Check
1312017 TFHRC 5 Check Check 045005787 Check
1312017 TFHRC 6 Check Check 0451666667 Check
1172017 ATP 1 Check Check 0501898148 Check
1172017 ATP 2 Check Check 0504201389 Check
1172017 ATP 3 Check Check 0506215278 Check
1172017 ATP 4 Check Check 0507858796 Check
1172017 ATP 5 Check Check 0508981481 Check
1172017 ATP 6 Check Check 0510219907 Check
1172017 ATP 7 Check Check 0511736111 Check
1172017 ATP 8 Check Check 05128125 Check
1172017 ATP 9 Check Check 0513831019 Check
1172017 ATP 10 Check Check 0514884259 Check
1172017 ATP 11 Check Check 0185590278 Check
1172017 ATP 12 Check Check 0187210648 Check
1172017 ATP 13 Check Check 0188425926 Check
1172017 ATP 14 Check Check 0190289352 Check
1172017 ATP 15 Check Check 0191863426 Check
APPENDIX A Comprehensive Data Analysis Tables
Table A-4 Complete Data Analysis ndash Hypothesis 5 (VEA)
Test Number
Type of Message
True Distance (m)
Speed (MPH)
Expected Distance (m)
Difference (m)
TFHRC1
Advisory 7584 2471 9942 2358
Alert 5545 2523 5780 235
Warning 4874 2498 4910 036
TFHRC2
Advisory 8552 2595 10441 1889
Alert 5167 2461 5588 421
Warning 4515 2433 4751 236
TFHRC3
Advisory 7876 2381 9580 1704
Alert 5827 2590 5989 162
Warning 5124 2624 5222 098
TFHRC4
Advisory 7529 2818 11338 3809
Alert 6047 2744 6482 435
Warning 5323 2714 5450 127
TFHRC5
Advisory 9292 2404 9672 380
Alert 5350 2423 5472 122
Warning 4081 2352 4556 475
ATP1
Advisory 000 000
Alert 000 000
Warning 000 000
ATP2
Advisory 5787 1644 6614 827
Alert 3074 1640 3289 215
Warning 2627 1640 2947 320
ATP3
Advisory 4204 1685 6779 2575
Alert 3300 1672 3370 070
Warning 2854 1658 2985 131
ATP4
Advisory 4296 1753 7053 2757
Alert 3346 1791 3679 333
Warning 2871 1755 3194 323
ATP5
Advisory 000 000
Alert 000 000
Warning 1069 1706 3088 2019
ATP6
Advisory 3632 1640 6598 2966
Alert 000 000
Warning 2770 1594 2850 080
US Department of Transportation Office of the Assistant Secretary for Research and Technology
Intelligent Transportation Systems Joint Program Office
Task 8 D2X Hub Proof-of-Concept Test Evaluation Report ndash Final | A-8
APPENDIX A Comprehensive Data Analysis Tables
Test Number
Type of Message
True Distance (m)
Speed (MPH)
Expected Distance (m)
Difference (m)
ATP7
Advisory 000 000
Alert 000 000
Warning 1919 1887 3483 1564
ATP8
Advisory 4492 1741 7005 2513
Alert 3113 1687 3409 296
Warning 2661 1680 3032 371
ATP9
Advisory 4694 1628 6550 1856
Alert 2991 1570 3113 122
Warning 2572 1549 2756 184
ATP10
Advisory 000 000
Alert 000 000
Warning 650 2505 4927 4277
ATP11
Advisory 000 000
Alert 000 000
Warning 1914 2398 4666 2752
ATP12
Advisory 000 000
Alert 000 000
Warning 460 2293 4415 3955
ATP13
Advisory 000 000
Alert 000 000
Warning 2732 2535 5001 2269
ATP14
Advisory 000 000
Alert 000 000
Warning 2358 2361 4577 2219
ATP15
Advisory 000 000
Alert 000 000
Warning 1107 2459 4814 3707
ATP16
Advisory 5668 1982 7974 2306
Alert 000 000
Warning 1502 1906 3525 2023
ATP17
Advisory 000 000
Alert 000 000
Warning 3183 2420 4720 1537
US Department of Transportation Office of the Assistant Secretary for Research and Technology
Intelligent Transportation Systems Joint Program Office
Task 8 D2X Hub Proof-of-Concept Test Evaluation Report ndash Final | A-9
Table A-5 Complete Data Analysis ndash Hypothesis 6 (MDEA)
Test Number
Type of Message
True Distance (m)
Speed (MPH)
Expected Distance (m)
Difference (m)
TFHRC1
Advisory 8756 2290 9213 457
Alert 5320 2509 5736 416
Warning 4651 2487 4883 232
TFHRC2
Advisory 9928 2514 10115 187
Alert 5276 2447 5546 270
Warning 4624 2415 4707 084
TFHRC3
Advisory 8952 2304 9270 318
Alert 5595 2603 6030 436
Warning 4890 2617 5205 315
TFHRC4
Advisory 9752 2514 10115 363
Alert 6290 2769 6564 274
Warning 4844 2693 5396 552
TFHRC5
Advisory 9613 2406 9680 067
Alert 5242 2420 5463 221
Warning 4080 2357 4568 488
ATP1
Advisory 5938 2183 8783 2845
Alert 4314 2120 4580 266
Warning 3644 2111 3989 345
ATP2
Advisory 6452 1641 6602 150
Alert 3296 1691 3419 123
Warning 2600 1601 2865 265
ATP3
Advisory 6212 1628 6550 338
Alert 3200 1655 3327 127
Warning 2707 1641 2949 242
ATP4
Advisory 6420 1646 6622 202
Alert 3300 1780 3650 350
Warning 2878 1704 3084 206
ATP5
Advisory 6673 1677 6747 074
Alert 3400 1847 3828 428
Warning 2972 1807 3307 335
ATP6
Advisory 6100 1628 6550 450
Alert 3100 1637 3281 181
Warning 2500 1597 2857 357
APPENDIX A Comprehensive Data Analysis Tables
US Department of Transportation Office of the Assistant Secretary for Research and Technology
Intelligent Transportation Systems Joint Program Office
Task 8 D2X Hub Proof-of-Concept Test Evaluation Report ndash Final | A-10
APPENDIX A Comprehensive Data Analysis Tables
Test Number
Type of Message
True Distance (m)
Speed (MPH)
Expected Distance (m)
Difference (m)
ATP7
Advisory 7500 1972 7934 434
Alert 3882 1914 4008 126
Warning 3400 1946 3614 214
ATP8
Advisory 6659 1744 7017 358
Alert 3263 1682 3396 133
Warning 2900 1682 3037 137
ATP9
Advisory 6605 1659 6675 070
Alert 2900 1556 3078 178
Warning 2365 1561 2781 416
ATP10
Advisory 9214 2491 10022 808
Alert 5859 2688 6301 442
Warning 5200 2644 5273 073
ATP11
Advisory 8485 2487 10006 1521
Alert 5376 2487 5668 292
Warning 4716 2483 4873 157
ATP12
Advisory 9001 2433 9789 788
Alert 5395 2420 5463 068
Warning 4103 2330 4503 400
ATP13
Advisory 8615 2559 10296 1681
Alert 000 000 000 000
Warning 4930 2581 5115 185
ATP14
Advisory 6119 2491 10022 3903
Alert 5500 2491 5681 181
Warning 3800 2402 4676 876
ATP15
Advisory 7546 2603 10473 2927
Alert 6000 2661 6215 215
Warning 3100 2603 5170 2070
ATP16
Advisory 7931 2089 8405 474
Alert 3995 1950 4106 111
Warning 3500 1923 3563 063
ATP17
Advisory 8243 2049 8244 001
Alert 5260 2465 5601 341
Warning 4718 2438 4763 045
US Department of Transportation Office of the Assistant Secretary for Research and Technology
Intelligent Transportation Systems Joint Program Office
Task 8 D2X Hub Proof-of-Concept Test Evaluation Report ndash Final | A-11
Table A-6 Complete Data Analysis ndash Hypothesis 7
Date Test
Number
User State Change Is
Safe Icon False
Properly Processed
User State Change Is
Safe Icon True
Properly Processed
1312017 TFHRC 1 111438 X 111504 X
1312017 TFHRC 3 112533 X 112619 X
1312017 TFHRC 4 114400 X 114438 X
1312017 TFHRC 5 114801 X 114829 X
1312017 TFHRC 6 115408 X 115444 X
1182017 ATP 1 105056 X 105116 X
1182017 ATP 2 105622 X 105656 X
1182017 ATP 3 110348 X 110436 X
1182017 ATP 4 111355 X 111417 X
1182017 ATP 5 111655 X 111717 X
1182017 ATP 6 111947 X 112007 X
1182017 ATP 7 112235 X 112305 X
1182017 ATP 8 112937 X 113013 X
1182017 ATP 9 113313 X 113353 X
1182017 ATP 10 113636 X 113708 X
1192017 ATP 11 45035 X 45057 X
1192017 ATP 13 45806 X 45828 X
1192017 ATP 14 50144 X 50202 X
1192017 ATP 15 50542 X 50600 X
1192017 ATP 16 50903 X 50929 X
APPENDIX A Comprehensive Data Analysis Tables
US Department of Transportation Office of the Assistant Secretary for Research and Technology
Intelligent Transportation Systems Joint Program Office
Task 8 D2X Hub Proof-of-Concept Test Evaluation Report ndash Final | A-12
APPENDIX A Comprehensive Data Analysis Tables
Table A-7 Complete Data Analysis ndash Hy pothesis 8 amp 9
US Department of Transportation Office of the Assistant Secretary for Research and Technology
Intelligent Transportation Systems Joint Program Office
Task 8 D2X Hub Proof-of-Concept Test Evaluation Report ndash Final | A-13
Test Number
Analyze the percentage of PMM messages properly processed by
in-vehicle devices Analyze the percentage of PMM-RSP messages
properly processed by mobile devices
Analyze the percentage of PMM-Cancel messages
properly processed by in-vehicle devices
MDEA Log ndash PMM Send
occurrence
MDEA Log ndash
PMM contents
VEA Log ndash PMM
Receive occurrence
VEA Log ndash Driver
acceptance
VEA Log ndash PMM-RSP
Send occurrence
MDEA Log ndash PMM-RSP
Receive occurrence
MDEA Log ndash Coordination
Status
MDEA Log ndash PMM-
Cancel Sent Occurrence
VEA Log ndash PMM-
Cancel Received
Occurrence
TFHRC 1 Check All Present Check Check Check Check Check Check Check
TFHRC 2 Check All Present Check Check Check Check Check Check Check
TFHRC 3 Check All Present Check Check Check Check Check Check Check
TFHRC 4 Check All Present Check Check Check Check Check Check Check
TFHRC 5 Check All Present Check Check Check Check Check Check Check
ATP 1 Check All Present Check Check Check Check Check Check Check
ATP 2 Check All Present Check Check Check Check Check Check Check
ATP 3 Check All Present Check Check Check Check Check Check Check
ATP 4 Check All Present Check Check Check Check Check Check Check
ATP 5 Check All Present Check Check Check Check Check Check Check
ATP 6 Check All Present Check Check Check Check Check Check Check
ATP 7 Check All Present Check Check Check Check Check Check Check
ATP 8 Check All Present Check Check Check Check Check Check Check
ATP 9 Check All Present Check Check Check Check Check Check Check
ATP 10 Check All Present Check Check Check Check Check Check Check
APPENDIX A Comprehensive Data Analysis Tables
Test Number
Analyze the percentage of PMM messages properly processed by
in-vehicle devices Analyze the percentage of PMM-RSP messages
properly processed by mobile devices
Analyze the percentage of PMM-Cancel messages
properly processed by in-vehicle devices
MDEA Log ndash PMM Send occurrence
MDEA Log ndash PMM
contents
VEA Log ndash PMM
Receive occurrence
VEA Log ndash Driver
acceptance
VEA Log ndash PMM-RSP
Send occurrence
MDEA Log ndash PMM-RSP
Receive occurrence
MDEA Log ndash Coordination
Status
MDEA Log ndash PMM-
Cancel Sent Occurrence
VEA Log ndash PMM-
Cancel Received
Occurrence
ATP 11 Check All Present Check Check Check Check Check Check Check
ATP 12 Check All Present Check Check Check Check Check Check Check
ATP 13 Check All Present Check Check Check Check Check Check Check
ATP 14 Check All Present Check Check Check Check Check Check Check
ATP 15 Check All Present Check Check Check Check Check Check Check
ATP 16 Check All Present Check Check Check Check Check Check Check
ATP 17 Check All Present Check Check Check Check Check Check Check
US Department of Transportation Office of the Assistant Secretary for Research and Technology
Intelligent Transportation Systems Joint Program Office
Task 8 D2X Hub Proof-of-Concept Test Evaluation Report ndash Final | A-14
Table A-8 Complete Data Analysis ndash Hy pothesis 10
Date Test Number
Analyze the Success Rate of Receiving a PMM-Arrive Message
VEA Log ndash PMM-ARRIVE Send Occurrence MDEA Log ndash PMM-ARRIVE Receive Occurrence
1312017 TFHRC 1 Fail Fail
1312017 TFHRC 2 Check Check
1312017 TFHRC 3 Check Check
1312017 TFHRC 4 Check Check
1312017 TFHRC 5 Check Check
1312017 TFHRC 6 Check Check
1312017 TFHRC 7 Check Check
1182017 ATP 1 Not Available Check
1182017 ATP 2 Not Available Check
1182017 ATP 3 Not Available Check
1182017 ATP 4 Not Available Check
1182017 ATP 5 Not Available Check
1182017 ATP 6 Not Available Check
1182017 ATP 7 Not Available Check
1182017 ATP 8 Not Available Check
1182017 ATP 9 Not Available Check
1182017 ATP 10 Not Available Check
1202017 ATP 11 Check Check
1202017 ATP 12 Check Check
1202017 ATP 13 Check Check
1202017 ATP 14 Check Check
1202017 ATP 15 Check Check
APPENDIX A Comprehensive Data Analysis Tables
US Department of Transportation Office of the Assistant Secretary for Research and Technology
Intelligent Transportation Systems Joint Program Office
Task 8 D2X Hub Proof-of-Concept Test Evaluation Report ndash Final | A-15
APPENDIX A Comprehensive Data Analysis Tables
Table A-9 Complete Data Analysis ndash Hypothesis 13 (Part A)
US Department of Transportation Office of the Assistant Secretary for Research and Technology
Intelligent Transportation Systems Joint Program Office
Task 8 D2X Hub Proof-of-Concept Test Evaluation Report ndash Final | A-16
Test Number
Coordination Request Sent
by Y
Coordination Request
Received by X
Request Confirmed
by X Confirmation Received by Y
Coordination Request Sent
by Z
Coordination Request
Received by X
Request Confirmed
by X Confirmation Received by Z
Coordination Heart Beat
Transmitted by Y amp Z
Heart Beat Response received
by X
Ride Arrived
Messages
TFHRC 1
Fail Traveler Y could not join the ad-hoc travel group
TFHRC 2
Check check check check 41047 check check check check check 41303
TFHRC 3
Check Check Check Check Check Check Check Check Check Check Check
TFHRC 4
Fail Traveler Y could not join the ad-hoc travel group
TFHRC 5
Check Check Check Check Check Check Check Check Check Check Check
TFHRC 6
Check Check Check Check Check Check Check Check Check Check Check
TFHRC 7
Check Check Check Check Check Check Check Check Check Check Check
TFHRC 8
Check Check Check Check Check Check Check Check Check Check Check
TFHRC 9
Check Check Check Check Check Check Check Check Check Check Check
TFHRC 10
Check Check Check Check Check Check Check Check Check Check Check
ATP 1 Check Check Check Check Check Check Check Check Check Check Check
ATP 2 Check Check Check Check Check Check Check Check Check Check Check
Test Number
Coordination Request Sent
by Y
Coordination Request
Received by X
Request Confirmed
by X Confirmation Received by Y
Coordination Request Sent
by Z
Coordination Request
Received by X
Request Confirmed
by X Confirmation Received by Z
Coordination Heart Beat
Transmitted by Y amp Z
Heart Beat Response received
by X
Ride Arrived
Messages
ATP 3 Check Check Check Check Check Check Check Check Check Check Check
ATP 4 Check Check Check Check Check Check Check Check Check Check Check
ATP 5 Check Check Check Check Check Check Check Check Check Check Check
ATP 6 Check Check Check Check Check Check Check Check Check Check Check
ATP 7 Check Check Check Check Check Check Check Check Check Check No ride
arrives received
ATP 8 Check Check Check Check Check Check Check Check Check Check Check
ATP 9 Check Check Check Check Check Check Check Check Check Check No ride
arrives received
ATP 10 Check Check Check Check Check Check Check Check Check Check Check
ATP 11 Check Check Check Check Check Check Check Check Check Check Check
ATP 12 Check Check Check Check Check Check Check Check Check Check No ride
arrives received
ATP 13 Check Check Check Check Check Check Check Check Check Check Check
ATP 14 Check Check Check Check Check Check Check Check Check Check Check
ATP 15 Check Check Check Check Check Check Check Check Check Check Check
APPENDIX A Comprehensive Data Analysis Tables
US Department of Transportation Office of the Assistant Secretary for Research and Technology
Intelligent Transportation Systems Joint Program Office
Task 8 D2X Hub Proof-of-Concept Test Evaluation Report ndash Final | A-17
APPENDIX A Comprehensive Data Analysis Tables
Table A-10 Complete Data Analysis ndash Hypothesis 13 (Part B)
US Department of Transportation Office of the Assistant Secretary for Research and Technology
Intelligent Transportation Systems Joint Program Office
Task 8 D2X Hub Proof-of-Concept Test Evaluation Report ndash Final | A-18
Test Number Coordination Cancel by
Walking Away Coordination Cancel by
Manual Request Disband Group after
Entering into Vehicle
TFHRC 1 Check This step not tested on this day
TFHRC 2 Check This step not tested on this day
TFHRC 3 Check This step not tested on this day
TFHRC 4 Check This step not tested on this day
TFHRC 5 Check This step not tested on this day
TFHRC 6 This step not tested on this day Check Check
TFHRC 7 This step not tested on this day Check Check
TFHRC 8 This step not tested on this day Check Check
TFHRC 9 This step not tested on this day Check Check
TFHRC 10 This step not tested on this day Check Check
ATP 1 Check Check Check
ATP 2 Check Check Check
ATP 3 Check Check Check
ATP 4 Check Check Check
ATP 5 Check Check Check
ATP 6 Check Check Check
ATP 7 Check Check Check
ATP 8 Check Check Check
ATP 9 Check Check Check
APPENDIX A Comprehensive Data Analysis Tables
Test Number Coordination Cancel by
Walking Away Coordination Cancel by
Manual Request Disband Group after Entering into Vehicle
ATP 10 Check Check Check
ATP 11 Fail Could not cancel by distance Check Check
ATP 12 Check Check Check
ATP 13 Fail Could not cancel by distance Check Check
ATP 14 Check Check Check
ATP 15 Check Check Check
US Department of Transportation Office of the Assistant Secretary for Research and Technology
Intelligent Transportation Systems Joint Program Office
Task 8 D2X Hub Proof-of-Concept Test Evaluation Report ndash Final | A-19
APPENDIX A Comprehensive Data Analysis Tables
APPENDIX B Acronyms and Abbreviations
ATG Ad-Hoc Travel Group
ATP Acceptance Test Plan
BSM Basic Safety Message
CCP Common Computing Platform
CV Connected Vehicle
DSRC Dedicated Short Range Communications
EPS Experimental Prototype System
FHWA Federal Highway Administration
FR Functional Requirement
ITS Intelligent Transportation Systems
LDV Light-Duty Vehicle
MAP Map Data
MDEA Mobile Device Experimental Application
MGL Message Logging
OBU On-board Unit
PMM Personal Mobility Message
PMM-ARRIVE Personal Mobility Message Arrival Message
PMM-CANCEL Personal Mobility Message Cancel Message
PMM-RSP Personal Mobility Message Response Message
PR Performance Requirement
PSM Personal Safety Message
REA Roadside Experimental Application
RSU Roadside Unit
SFY Safety
SIR System Interface Requirement
SMP SPaT and MAP
SPaT Signal Phasing and Timing
SyRS System Requirements Specifications
TFHRC Turner-Fairbank Highway Research Center
US DOT US Department of Transportation
US Department of Transportation Office of the Assistant Secretary for Research and Technology
Intelligent Transportation Systems Joint Program Office
Task 8 D2X Hub Proof-of-Concept Test Evaluation Report ndash Final |B-1
VEA Vehicle Experimental Application
Wi-Fi Wireless Fidelity
APPENDIX B Acronyms and Abbreviations
US Department of Transportation Office of the Assistant Secretary for Research and Technology
Intelligent Transportation Systems Joint Program Office
Task 8 D2X Hub Proof-of-Concept Test Evaluation Report ndash Final | B-2
APPENDIX C Terms and Definitions
Basic Safety Message (BSM)
Connected vehicle message type which contains vehicle safety-related information that is broadcast to surrounding vehicles
Bluetooth Short range wireless technology used to exchange data between enabled devices
Cellular Uses short-range radio stations to cover areas of communication
Connected Vehicle A vehicle that can communicate with other vehicles and infrastructure via communication media such as DSRC Wi-Fi cellular or Bluetooth
Coordinated Messages are coordinated when two or more mobile devices have establish a travel group based on the same origin destination and
time and function as a single cohesive senderrecipient
CV Inspector An application that verifies if the Mobile Device is broadcasting messages to Connected Vehicles
Destination The end point of a travelerrsquos trip
DSRC Dedicated Short-Range Communications a low-latency high-reliability two-way communications tool used for sending transportation safety
messages
Light-Duty Vehicle Of or relating to vehicles that way less than 4000 lbs
Message Type Type of personal safety or personal mobility message that is transmitted based on the technology used and level of coordination available
Personal Mobility Message (PMM)
Similar to PDM message intended for the exchange of mobility messages between individual travelers and vehiclesinfrastructure via
mobile device
Personal Safety Message (PSM)
Similar to BSM message intended to transmit low-latency urgent safety messages between individual travelers and vehiclesinfrastructure via
mobile device
Test Case A set of conditions or variables that a Tester can determine if system meets requirements
Transit Vehicle Large vehicles mainly used for public transportation as well as support services
Transmitting The state in which a traveler has opted in and is sendingreceiving messages via mobile device
Uncoordinated Messages are uncoordinated when travel groups are not established (see coordinated definition)
Wi-Fi Local area wireless technology that allows enabled devices to connect to the Internet
APPENDIX A Comprehensive Data Analysis Tables
US Department of Transportation Office of the Assistant Secretary for Research and Technology
Intelligent Transportation Systems Joint Program Office
Task 8 D2X Hub Proof-of-Concept Test Evaluation Report ndash Final |C-1
ITS Joint Program Office-HOIT 1200 New Jersey Avenue SE
Washington DC 20590
Toll-Free ldquoHelp Linerdquo 866-367-7487 wwwitsdotgov
FHWA-JPO-18-263
- Structure Bookmarks
-
- Sharing Data between Mobile Devices Connected Vehicles and Infrastructure Task 8 D2X Hub Proof-of-Concept Test Evaluation Report wwwitsdotgovindexhtm Final Report mdash October 25 2017 FHWA-JPO-18-623
- Revision History
- Table of Contents
- Chapter 1 Scope
- Chapter 2 Referenced Documents
- Chapter 3 Test Conduct
- Chapter 4 Experimental Analysis Results Summary
- Chapter 5 Experimental Analysis
- Chapter 6 Lessons Learned and Recommendations
- APPENDIX A Comprehensive Data Analysis Tables
- APPENDIX B Acronyms and Abbreviations
- APPENDIX C Terms and Definitions
-

Chapter 5 Experimental Analysis
Table 5-13 Hypothesis 13 Analysis Data Sample
13117 2117
TFHRC 1
TFHRC 2
TFHRC 3
TFHRC 4
TFHRC 5
TFHRC 6
TFHRC 7
TFHRC 8
TFHRC 9
TFHRC 10
Coordination Request Sent by
Y
Fai
l T
rave
ler
Y c
ould
no
t joi
n th
e ad
-hoc
trav
el g
roup
40951 Check
F
ail
Tra
vele
r Y
cou
ld
not j
oin
the
ad-h
oc tr
avel
gro
up
Check Check Check Check Check Check
Coordination Request Received
by X check Check Check Check Check Check Check Check
Request Confirmed by X
check Check Check Check Check Check Check Check
Confirmation Received by Y
Coordination Request Sent by
Z
check Check Check Check Check Check Check Check
41047 Check Check Check Check Check Check Check
Coordination Request Received
by X check Check Check Check Check Check Check Check
Request Confirmed by X
check Check Check Check Check Check Check Check
Confirmation Received by Z
Coordination Heart Beat
Transmitted by Y amp Z
check Check Check Check Check Check Check Check
check Check Check Check Check Check Check Check
Heart Beat Response
received by X
Ride Arrived Messages
check Check Check Check Check Check Check Check
41303 Check Check Check Check Check Check Check
Coordination Cancel by walking
away Check Check Check Check Check This step not tested on this day
Coordination Cancel by Manual
request This step not tested on this day
Check Check Check Check Check
Disband Group after entering into
vehicle Check Check Check Check Check
For the complete analysis please refer to Table A-9 and Table A-10 in Appendix A
Results There were 30 outliers out of 198 checks (False Negatives) in the data analyzed Hence Hypothesis 13 is satisfied at an 8484 level of confidence
US Department of Transportation Office of the Assistant Secretary for Research and Technology
Intelligent Transportation Systems Joint Program Office
Task 8 D2X Hub Proof-of-Concept Test Evaluation Report ndash Final | 25
US Department of Transportation Office of the Assistant Secretary for Research and Technology
Intelligent Transportation Systems Joint Program Office
Task 8 D2X Hub Proof-of-Concept Test Evaluation Report ndash Final | 26
Chapter 5 Experimental Analysis
Hypothesis 14 The RSU can broadcast a SPaT and MAP message via DSRC that can be received by mobile devices
Data logs verified MDEA Log ndash BSM received and PSM send occurrences
Analysis 1 Determined the percentage of SPaT messages received by mobile devices when within
100 meters of RSE Assessed message contents for consistency 2 Determined the percentage of MAP messages received by mobile devices when within
100 meters of RSE Assessed message contents for consistency
Observations Considering test 5444 all the SPa T messages were transmitted and received at a rate of 1sec Similarly all the MAP messages were transmitted and received at a rate better than 5sec
Table 5-14 Hypothesis 14 Analysis Data Sample
ID Date Message
5 13117 163842 Dsrc Rx Spat id19
6 13117 163842 Dsrc Rx Map id18
9 13117 163843 Dsrc Rx Spat id19
10 13117 163843 Dsrc Rx Bsm Lat389546323 Long -771488295 Head 2713375 Sp 0
12 13117 163843 Dsrc Rx Bsm Lat389546138 Long -771483988 Head 2559125 Sp 0
13 13117 163844 Dsrc Rx Spat id19
14 13117 163844 Dsrc Rx Bsm Lat389546323 Long -771488297 Head 2713375 Sp 0
16 13117 163844 Dsrc Rx Bsm Lat389546138 Long -771483987 Head 2559125 Sp 0
17 13117 163844 Dsrc Rx Map id18
18 13117 163844 Dsrc Rx Bsm Lat389546322 Long -7714883 Head 2713375 Sp 0
20 13117 163845 Dsrc Rx Bsm Lat389546137 Long -771483987 Head 2559125 Sp 0
21 13117 163845 Dsrc Rx Bsm Lat389546322 Long -771488302 Head 2713375 Sp 0
22 13117 163845 Dsrc Rx Spat id19
23 13117 163845 Dsrc Rx Bsm Lat389546137 Long -771483987 Head 2559125 Sp 0
25 13117 163845 Dsrc Rx Bsm Lat38954632 Long -771488302 Head 2713375 Sp 0
26 13117 163846 Dsrc Rx Bsm Lat389546135 Long -771483987 Head 2559125 Sp 0
27 13117 163846 Dsrc Rx Spat id19
29 13117 163846 Dsrc Rx Bsm Lat389546318 Long -771488303 Head 2713375 Sp 0
31 13117 163846 Dsrc Rx Map id18
Results There were no outliers (False Negatives) in the data analyzed Hence Hypothesis 14 is satisfied at a 100 level of confidence
Chapter 5 Experimental Analysis
Hypothesis 15 The RSU can store all messages received via DSRC
Data logs verified MDEA Log ndash All Occurrences of messages sent via DSRC and Message Contents RSU Log ndash Message Received Occurrence and Message Contents
Analysis 1 Assessed the percentage of messages received from mobile devices within 100 meters of
RSE Assess message contents to make sure they are consistent
Observations a Considering the message logs from test cases 5411 5444 5471 there were instances
where PSMs were logged at a rate of less than 10sec Also there were test cases that had no reception of PSMs This clearly indicates the reception issues with RSU CCP unit One prime focus for the Large-Scale Field Test is to improve the reliability of the hardware associated with RSU
b The message contents in all the DSRC messages were consistent throughout the test logs
Table 5-15 Hypothesis 15 Analysis Data Sample
Date Time
Vehicle Range and Advisory Distance wrt
Speed Speed (mph)
In Range
Out of Range
Distance (m)
RSU Log PSM
Message RateSec
13117 101316 IsBsmClose Dist
975500061708885lt AdvDist 1024200201024
255 98 8
13117 101332 IsBsmClose Dist
570797651794001lt AdvDist 666000057888
173 57 6
13117 101340 IsBsmClose Dist
57448436831453lt AdvDist 601199821728
149 57 1
13117 101529 IsBsmClose Dist
975729907380225lt AdvDist 102240014976
254 98 0
13117 101538 IsBsmClose Dist
399317028326919lt AdvDist 102240014976
250 4 1
For the complete analysis please refer to Table A-1 in Appendix A
US Department of Transportation Office of the Assistant Secretary for Research and Technology
Intelligent Transportation Systems Joint Program Office
Task 8 D2X Hub Proof-of-Concept Test Evaluation Report ndash Final | 27
Chapter 5 Experimental Analysis
Table 5-16 Data Usage Statistics
17-Jan 18-Jan 19-Jan 20-Jan 31-Jan 1-Feb Average Maximum
Total Usage (MB) 3805 626 714 2713 4873 1355 984 2713
TMX core usage (MB) 271 450 468 1991 345 90 705 1991
of TMX usage 71 72 66 73 71 66 71 73
Results The hypothesis statement of RSU being able to store all messages received via DSRC is not satisfied at 100 level of confidence due to hardware issues
US Department of Transportation Office of the Assistant Secretary for Research and Technology
Intelligent Transportation Systems Joint Program Office
Task 8 D2X Hub Proof-of-Concept Test Evaluation Report ndash Final | 28
Chapter 6 Lessons Learned and Recommendations
Lessons Learned
The Lessons Learned from the Proof-of-Concept testing are summarized as follows
The ability to reliably generate transmit and receive messages between mobile devices and connected vehicles was demonstrated
The messages to incorporate mobile devices into the C V environment functioned as designed and provided the necessary data for the prototype mobility and safety applications
The prototype safety and mobility software applications functioned well (as designed)
Limitations of technology and hardware issues caused the majority of performance shortfalls
Mixed results were achieved for the various communication methods tested
a Cellular functioned well with our system
b Wi-Fi Direct connectivity was unreliable with our system
c DSRC hardware problems caused communication problems with our system
GPS accuracy limitations were observed as expected
Wi-Fi Direct Connectivity
The connection process was prone to failure at multiple points with no indication to the application why connection failed
TFHRC success rate was achieved by selecting specific devices that worked best for specific roles otherwise a failure rate gt50 would have been expected based on earlier testing
Canvasing of developer community found similar observations no solutions for our system
Wi-Fi Direct connection process requires authorization from the user of the target device in a real world environment such a request would most likely be denied if noticed at all
US Department of Transportation Office of the Assistant Secretary for Research and Technology
Intelligent Transportation Systems Joint Program Office
Task 8 D2X Hub Proof-of-Concept Test Evaluation Report ndash Final | 29
Chapter 6 Lessons Learned and Recommendations
DSRC Hardware
Common Computer Platform (CCP) Pre-production engineering units were used which were determined to have an impedance mismatch between the DSRC chip and RF connector that caused reduction of signal strength
Arada LocoMate ME There were occasional Bluetooth connection failures to mobile devices as well as occasional DSRC transmissionreception failures Longer term it is assumed that DSRC radios will be integrated into smartphones thus obviating the current issues
Recommendations
Based on outcomes of Proof-of-Concept Testing the following prototype system design changes are recommended to be implemented prior to the larger-scale prototype field test
Add Cellular-based communication for Travel Group coordination between mobile devices
New and improved CCP units will be used for the larger-scale field test
For in-vehicle detection use Accelerometer method as the most reliable option
US Department of Transportation Office of the Assistant Secretary for Research and Technology
Intelligent Transportation Systems Joint Program Office
Task 8 D2X Hub Proof-of-Concept Test Evaluation Report ndash Final | 30
APPENDIX A Comprehensive Data Analysis Tables
Note For all the analysis results depicted below the term ldquocheckrdquo refers to the ldquosuccessrdquo of desired action
Table A-1 Complete Data Analysis ndash Hypothesis 1 4 amp 15
Date Time Vehicle Range and Advisory
Distance wrt Speed Speed In
Range Out of
Range Distance
RSU Log PSM
Message RateSec
VEA Log PSM
Message Rate
1312017 101316 IsBsmClose Dist 975500061708885lt
AdvDist 1024200201024 255 X 98 8 10
1312017 101332 IsBsmClose Dist 570797651794001lt
AdvDist 666000057888 173 X 57 6 10
1312017 101340 IsBsmClose Dist 57448436831453lt
AdvDist 601199821728 149 X 57 1 10
1312017 101529 IsBsmClose Dist 975729907380225lt
AdvDist 102240014976 254 X 98 0 10
1312017 101538 IsBsmClose Dist 399317028326919lt
AdvDist 102240014976 250 X 4 1 10
1312017 101553 IsBsmClose Dist 600719107941917lt
AdvDist 70199987616 174 X 60 0 10
1312017 102029 IsBsmClose Dist 944643508928866lt
AdvDist 1008000141984 251 X 95 0 9
1312017 102048 IsBsmClose Dist 592561932680623lt
AdvDist 628200188352 156 X 59 0 9
US Department of Transportation Office of the Assistant Secretary for Research and Technology
Intelligent Transportation Systems Joint Program Office
Task 8 D2X Hub Proof-of-Concept Test Evaluation Report ndash Final | A-1
APPENDIX A Comprehensive Data Analysis Tables
Date Time Vehicle Range and Advisory
Distance wrt Speed Speed In
Range Out of Range Distance
RSU Log PSM
Message RateSec
VEA Log PSM
Message Rate
1312017 102054 IsBsmClose Dist 616348297460404lt
AdvDist 644399845056 160 X 62 3 11
1312017 102105 IsBsmClose Dist 871180496389495lt
AdvDist 1092600137376 247 X 87 4 9
1312017 102206 IsBsmClose Dist 977301610734722lt
AdvDist 1130400006912 295 X 98 0 10
1312017 102228 IsBsmClose Dist 577576034007057lt
AdvDist 60659997552 151 X 58 2 10
1312017 102332 IsBsmClose Dist 101193300977461lt
AdvDist 10386002088 258 X 101 10 10
1312017 102356 IsBsmClose Dist 595641466972855lt
AdvDist 660599904096 164 X 60 6 10
1312017 102623 IsBsmClose Dist 100217014111125lt
AdvDist 1024200201024 253 X 100 7 10
1312017 102650 IsBsmClose Dist 540919707235241lt
AdvDist 887399925984 221 X 54 0 10
1172017 111504 IsBsmClose Dist 100564061581794lt
AdvDist 1169999927712 291 X 101 10 10
1172017 112437 IsBsmClose Dist 992912014791515lt
AdvDist 10386002088 258 X 99 10 10
1172017 112837 IsBsmClose Dist 106684353810469lt
AdvDist 1076400078336 261 X 107 10 10
US Department of Transportation Office of the Assistant Secretary for Research and Technology
Intelligent Transportation Systems Joint Program Office
Task 8 D2X Hub Proof-of-Concept Test Evaluation Report ndash Final | A-2
APPENDIX A Comprehensive Data Analysis Tables
Date Time Vehicle Range and Advisory
Distance wrt Speed Speed In
Range Out of Range Distance
RSU Log PSM
Message RateSec
VEA Log PSM
Message Rate
1172017 113148 IsBsmClose Dist 1124753473133lt AdvDist
1186199986752 268 X 112 10 10
1172017 113332 IsBsmClose Dist 106022149777593lt
AdvDist 1126799904384 260 X 106 10 10
1172017 113336 IsBsmClose Dist 59429630331283lt
AdvDist 1196999892 298 X 59 10 10
1172017 113357 IsBsmClose Dist 657937887214709lt
AdvDist 1193400191808 297 X 66 10 10
1172017 113627 IsBsmClose Dist 965542357439439lt
AdvDist 1080000180864 260 X 97 10 10
1172017 113629 IsBsmClose Dist 821301583410616lt
AdvDist 1074600027072 270 X 82 10 10
1172017 113803 IsBsmClose Dist 994884887192582lt
AdvDist 104580001152 251 X 99 10 10
1172017 113811 IsBsmClose Dist 16809952777894lt
AdvDist 106200007056 257 X 17 10 10
1172017 114114 IsBsmClose Dist 948985801452811lt
AdvDist 986399929152 245 X 95 10 10
1172017 114133 IsBsmClose Dist 141255704529106lt
AdvDist 963000067392 242 X 14 10 10
1172017 114136 IsBsmClose Dist 377627357471613lt
AdvDist 977400075168 243 X 38 10 10
US Department of Transportation Office of the Assistant Secretary for Research and Technology
Intelligent Transportation Systems Joint Program Office
Task 8 D2X Hub Proof-of-Concept Test Evaluation Report ndash Final | A-3
APPENDIX A Comprehensive Data Analysis Tables
Date Time Vehicle Range and Advisory
Distance wrt Speed Speed In
Range Out of Range Distance
RSU Log PSM
Message RateSec
VEA Log PSM
Message Rate
1172017 114403 IsBsmClose Dist 114490146784404lt
AdvDist 1225799907552 266 X 114 10 10
1172017 114415 IsBsmClose Dist 280463490772458lt
AdvDist 71100013248 161 X 28 10 10
1172017 114735 IsBsmClose Dist 102043927314914lt
AdvDist 1040399857728 259 X 102 10 10
1172017 114755 IsBsmClose Dist 185020887331204lt
AdvDist 112499985312 275 X 19 10 10
1192017 35605 IsBsmClose Dist 107928079653642lt
AdvDist 1107000145152 272 X 108 9 9
1192017 35630 IsBsmClose Dist 99759104887202lt
AdvDist 1184399935488 294 X 100 10 10
1192017 35837 IsBsmClose Dist 110291146846666lt
AdvDist 115020016848 286 X 110 10 10
1192017 40057 IsBsmClose Dist 998997459961241lt
AdvDist 1260000076896 313 X 100 10 10
1192017 40300 IsBsmClose Dist 100209094247195lt
AdvDist 106919987328 260 X 100 10 10
1192017 40410 IsBsmClose Dist 100723184500334lt
AdvDist 1097999888832 273 X 101 6 10
1192017 41103 IsBsmClose Dist 977354295877856lt
AdvDist 1008000141984 251 X 98 10 10
US Department of Transportation Office of the Assistant Secretary for Research and Technology
Intelligent Transportation Systems Joint Program Office
Task 8 D2X Hub Proof-of-Concept Test Evaluation Report ndash Final | A-4
APPENDIX A Comprehensive Data Analysis Tables
Date Time Vehicle Range and Advisory
Distance wrt Speed Speed In
Range Out of Range Distance
RSU Log PSM
Message RateSec
VEA Log PSM
Message Rate
1192017 41311 IsBsmClose Dist 10190842581135lt
AdvDist 1040399857728 259 X 102 10 10
1192017 41423 IsBsmClose Dist 995536361906761lt
AdvDist 1009799790912 251 X 100 10 10
1192017 41534 IsBsmClose Dist 10075608603652lt
AdvDist 106919987328 264 X 101 10 10
US Department of Transportation Office of the Assistant Secretary for Research and Technology
Intelligent Transportation Systems Joint Program Office
Task 8 D2X Hub Proof-of-Concept Test Evaluation Report ndash Final | A-5
APPENDIX A Comprehensive Data Analysis Tables
Table A-2 Complete Data Analysis ndash Hypothesis 2
US Department of Transportation Office of the Assistant Secretary for Research and Technology
Intelligent Transportation Systems Joint Program Office
Task 8 D2X Hub Proof-of-Concept Test Evaluation Report ndash Final | A-6
Date Test
Number PSMs Generated by
Trav X and Trav Y Transition to In Group Trav Y PSM Ceased Only Trav X PSM
Received
1312017 TFHRC 1 111116 111240 Check 111305
1312017 TFHRC 2 Grouping Failed Grouping Failed Grouping Failed Grouping Failed
1312017 TFHRC 3 112346 112448 Check 112508
1312017 TFHRC 4 114208 114301 Check 114345
1312017 TFHRC 5 114609 114658 Check 114721
1312017 TFHRC 6 115222 115313 Check 115342
1182017 ATP 1 104400 104527 Check 104601
1182017 ATP 2 105356 105455 Check 105546
1182017 ATP 3 110059 110150 Check 110322
1182017 ATP 4 111222 111310 Check 111329
1182017 ATP 5 111515 111616 Check 111630
1182017 ATP 6 111823 111906 Check 111917
1182017 ATP 7 112116 112157 Check 112209
1182017 ATP 8 112814 112855 Check 112917
1182017 ATP 9 113142 113230 Check 113248
1182017 ATP 10 113501 113545 Check 113608
1192017 ATP 11 44728 44842 Check 45007
1192017 ATP 12 Radio Failure Test Terminated Radio Failure Test Terminated Radio Failure Test Terminated Radio Failure Test Terminated
1192017 ATP 13 45548 45637 Check 45728
1192017 ATP 14 45946 50047 Check 50107
1192017 ATP 15 50353 50444 Check 50513
1192017 ATP 16 50730 50823 Check 50839
APPENDIX A Comprehensive Data Analysis Tables
Table A-3 Complete Data Analysis ndash Hypothesis 3
US Department of Transportation Office of the Assistant Secretary for Research and Technology
Intelligent Transportation Systems Joint Program Office
Task 8 D2X Hub Proof-of-Concept Test Evaluation Report ndash Final | A-7
Date Description
MDEA not in Vehicle
MDEA Transmits
PSMs Time of MDEA
Mode Transition
MDEA Ceases Transmitting
PSMs
1312017 TFHRC 1 Check Check 0443101852 Check
1312017 TFHRC 2 Check Check 0445243056 Check
1312017 TFHRC 3 Check Check 0447569444 Check
1312017 TFHRC 4 Check Check 0448888889 Check
1312017 TFHRC 5 Check Check 045005787 Check
1312017 TFHRC 6 Check Check 0451666667 Check
1172017 ATP 1 Check Check 0501898148 Check
1172017 ATP 2 Check Check 0504201389 Check
1172017 ATP 3 Check Check 0506215278 Check
1172017 ATP 4 Check Check 0507858796 Check
1172017 ATP 5 Check Check 0508981481 Check
1172017 ATP 6 Check Check 0510219907 Check
1172017 ATP 7 Check Check 0511736111 Check
1172017 ATP 8 Check Check 05128125 Check
1172017 ATP 9 Check Check 0513831019 Check
1172017 ATP 10 Check Check 0514884259 Check
1172017 ATP 11 Check Check 0185590278 Check
1172017 ATP 12 Check Check 0187210648 Check
1172017 ATP 13 Check Check 0188425926 Check
1172017 ATP 14 Check Check 0190289352 Check
1172017 ATP 15 Check Check 0191863426 Check
APPENDIX A Comprehensive Data Analysis Tables
Table A-4 Complete Data Analysis ndash Hypothesis 5 (VEA)
Test Number
Type of Message
True Distance (m)
Speed (MPH)
Expected Distance (m)
Difference (m)
TFHRC1
Advisory 7584 2471 9942 2358
Alert 5545 2523 5780 235
Warning 4874 2498 4910 036
TFHRC2
Advisory 8552 2595 10441 1889
Alert 5167 2461 5588 421
Warning 4515 2433 4751 236
TFHRC3
Advisory 7876 2381 9580 1704
Alert 5827 2590 5989 162
Warning 5124 2624 5222 098
TFHRC4
Advisory 7529 2818 11338 3809
Alert 6047 2744 6482 435
Warning 5323 2714 5450 127
TFHRC5
Advisory 9292 2404 9672 380
Alert 5350 2423 5472 122
Warning 4081 2352 4556 475
ATP1
Advisory 000 000
Alert 000 000
Warning 000 000
ATP2
Advisory 5787 1644 6614 827
Alert 3074 1640 3289 215
Warning 2627 1640 2947 320
ATP3
Advisory 4204 1685 6779 2575
Alert 3300 1672 3370 070
Warning 2854 1658 2985 131
ATP4
Advisory 4296 1753 7053 2757
Alert 3346 1791 3679 333
Warning 2871 1755 3194 323
ATP5
Advisory 000 000
Alert 000 000
Warning 1069 1706 3088 2019
ATP6
Advisory 3632 1640 6598 2966
Alert 000 000
Warning 2770 1594 2850 080
US Department of Transportation Office of the Assistant Secretary for Research and Technology
Intelligent Transportation Systems Joint Program Office
Task 8 D2X Hub Proof-of-Concept Test Evaluation Report ndash Final | A-8
APPENDIX A Comprehensive Data Analysis Tables
Test Number
Type of Message
True Distance (m)
Speed (MPH)
Expected Distance (m)
Difference (m)
ATP7
Advisory 000 000
Alert 000 000
Warning 1919 1887 3483 1564
ATP8
Advisory 4492 1741 7005 2513
Alert 3113 1687 3409 296
Warning 2661 1680 3032 371
ATP9
Advisory 4694 1628 6550 1856
Alert 2991 1570 3113 122
Warning 2572 1549 2756 184
ATP10
Advisory 000 000
Alert 000 000
Warning 650 2505 4927 4277
ATP11
Advisory 000 000
Alert 000 000
Warning 1914 2398 4666 2752
ATP12
Advisory 000 000
Alert 000 000
Warning 460 2293 4415 3955
ATP13
Advisory 000 000
Alert 000 000
Warning 2732 2535 5001 2269
ATP14
Advisory 000 000
Alert 000 000
Warning 2358 2361 4577 2219
ATP15
Advisory 000 000
Alert 000 000
Warning 1107 2459 4814 3707
ATP16
Advisory 5668 1982 7974 2306
Alert 000 000
Warning 1502 1906 3525 2023
ATP17
Advisory 000 000
Alert 000 000
Warning 3183 2420 4720 1537
US Department of Transportation Office of the Assistant Secretary for Research and Technology
Intelligent Transportation Systems Joint Program Office
Task 8 D2X Hub Proof-of-Concept Test Evaluation Report ndash Final | A-9
Table A-5 Complete Data Analysis ndash Hypothesis 6 (MDEA)
Test Number
Type of Message
True Distance (m)
Speed (MPH)
Expected Distance (m)
Difference (m)
TFHRC1
Advisory 8756 2290 9213 457
Alert 5320 2509 5736 416
Warning 4651 2487 4883 232
TFHRC2
Advisory 9928 2514 10115 187
Alert 5276 2447 5546 270
Warning 4624 2415 4707 084
TFHRC3
Advisory 8952 2304 9270 318
Alert 5595 2603 6030 436
Warning 4890 2617 5205 315
TFHRC4
Advisory 9752 2514 10115 363
Alert 6290 2769 6564 274
Warning 4844 2693 5396 552
TFHRC5
Advisory 9613 2406 9680 067
Alert 5242 2420 5463 221
Warning 4080 2357 4568 488
ATP1
Advisory 5938 2183 8783 2845
Alert 4314 2120 4580 266
Warning 3644 2111 3989 345
ATP2
Advisory 6452 1641 6602 150
Alert 3296 1691 3419 123
Warning 2600 1601 2865 265
ATP3
Advisory 6212 1628 6550 338
Alert 3200 1655 3327 127
Warning 2707 1641 2949 242
ATP4
Advisory 6420 1646 6622 202
Alert 3300 1780 3650 350
Warning 2878 1704 3084 206
ATP5
Advisory 6673 1677 6747 074
Alert 3400 1847 3828 428
Warning 2972 1807 3307 335
ATP6
Advisory 6100 1628 6550 450
Alert 3100 1637 3281 181
Warning 2500 1597 2857 357
APPENDIX A Comprehensive Data Analysis Tables
US Department of Transportation Office of the Assistant Secretary for Research and Technology
Intelligent Transportation Systems Joint Program Office
Task 8 D2X Hub Proof-of-Concept Test Evaluation Report ndash Final | A-10
APPENDIX A Comprehensive Data Analysis Tables
Test Number
Type of Message
True Distance (m)
Speed (MPH)
Expected Distance (m)
Difference (m)
ATP7
Advisory 7500 1972 7934 434
Alert 3882 1914 4008 126
Warning 3400 1946 3614 214
ATP8
Advisory 6659 1744 7017 358
Alert 3263 1682 3396 133
Warning 2900 1682 3037 137
ATP9
Advisory 6605 1659 6675 070
Alert 2900 1556 3078 178
Warning 2365 1561 2781 416
ATP10
Advisory 9214 2491 10022 808
Alert 5859 2688 6301 442
Warning 5200 2644 5273 073
ATP11
Advisory 8485 2487 10006 1521
Alert 5376 2487 5668 292
Warning 4716 2483 4873 157
ATP12
Advisory 9001 2433 9789 788
Alert 5395 2420 5463 068
Warning 4103 2330 4503 400
ATP13
Advisory 8615 2559 10296 1681
Alert 000 000 000 000
Warning 4930 2581 5115 185
ATP14
Advisory 6119 2491 10022 3903
Alert 5500 2491 5681 181
Warning 3800 2402 4676 876
ATP15
Advisory 7546 2603 10473 2927
Alert 6000 2661 6215 215
Warning 3100 2603 5170 2070
ATP16
Advisory 7931 2089 8405 474
Alert 3995 1950 4106 111
Warning 3500 1923 3563 063
ATP17
Advisory 8243 2049 8244 001
Alert 5260 2465 5601 341
Warning 4718 2438 4763 045
US Department of Transportation Office of the Assistant Secretary for Research and Technology
Intelligent Transportation Systems Joint Program Office
Task 8 D2X Hub Proof-of-Concept Test Evaluation Report ndash Final | A-11
Table A-6 Complete Data Analysis ndash Hypothesis 7
Date Test
Number
User State Change Is
Safe Icon False
Properly Processed
User State Change Is
Safe Icon True
Properly Processed
1312017 TFHRC 1 111438 X 111504 X
1312017 TFHRC 3 112533 X 112619 X
1312017 TFHRC 4 114400 X 114438 X
1312017 TFHRC 5 114801 X 114829 X
1312017 TFHRC 6 115408 X 115444 X
1182017 ATP 1 105056 X 105116 X
1182017 ATP 2 105622 X 105656 X
1182017 ATP 3 110348 X 110436 X
1182017 ATP 4 111355 X 111417 X
1182017 ATP 5 111655 X 111717 X
1182017 ATP 6 111947 X 112007 X
1182017 ATP 7 112235 X 112305 X
1182017 ATP 8 112937 X 113013 X
1182017 ATP 9 113313 X 113353 X
1182017 ATP 10 113636 X 113708 X
1192017 ATP 11 45035 X 45057 X
1192017 ATP 13 45806 X 45828 X
1192017 ATP 14 50144 X 50202 X
1192017 ATP 15 50542 X 50600 X
1192017 ATP 16 50903 X 50929 X
APPENDIX A Comprehensive Data Analysis Tables
US Department of Transportation Office of the Assistant Secretary for Research and Technology
Intelligent Transportation Systems Joint Program Office
Task 8 D2X Hub Proof-of-Concept Test Evaluation Report ndash Final | A-12
APPENDIX A Comprehensive Data Analysis Tables
Table A-7 Complete Data Analysis ndash Hy pothesis 8 amp 9
US Department of Transportation Office of the Assistant Secretary for Research and Technology
Intelligent Transportation Systems Joint Program Office
Task 8 D2X Hub Proof-of-Concept Test Evaluation Report ndash Final | A-13
Test Number
Analyze the percentage of PMM messages properly processed by
in-vehicle devices Analyze the percentage of PMM-RSP messages
properly processed by mobile devices
Analyze the percentage of PMM-Cancel messages
properly processed by in-vehicle devices
MDEA Log ndash PMM Send
occurrence
MDEA Log ndash
PMM contents
VEA Log ndash PMM
Receive occurrence
VEA Log ndash Driver
acceptance
VEA Log ndash PMM-RSP
Send occurrence
MDEA Log ndash PMM-RSP
Receive occurrence
MDEA Log ndash Coordination
Status
MDEA Log ndash PMM-
Cancel Sent Occurrence
VEA Log ndash PMM-
Cancel Received
Occurrence
TFHRC 1 Check All Present Check Check Check Check Check Check Check
TFHRC 2 Check All Present Check Check Check Check Check Check Check
TFHRC 3 Check All Present Check Check Check Check Check Check Check
TFHRC 4 Check All Present Check Check Check Check Check Check Check
TFHRC 5 Check All Present Check Check Check Check Check Check Check
ATP 1 Check All Present Check Check Check Check Check Check Check
ATP 2 Check All Present Check Check Check Check Check Check Check
ATP 3 Check All Present Check Check Check Check Check Check Check
ATP 4 Check All Present Check Check Check Check Check Check Check
ATP 5 Check All Present Check Check Check Check Check Check Check
ATP 6 Check All Present Check Check Check Check Check Check Check
ATP 7 Check All Present Check Check Check Check Check Check Check
ATP 8 Check All Present Check Check Check Check Check Check Check
ATP 9 Check All Present Check Check Check Check Check Check Check
ATP 10 Check All Present Check Check Check Check Check Check Check
APPENDIX A Comprehensive Data Analysis Tables
Test Number
Analyze the percentage of PMM messages properly processed by
in-vehicle devices Analyze the percentage of PMM-RSP messages
properly processed by mobile devices
Analyze the percentage of PMM-Cancel messages
properly processed by in-vehicle devices
MDEA Log ndash PMM Send occurrence
MDEA Log ndash PMM
contents
VEA Log ndash PMM
Receive occurrence
VEA Log ndash Driver
acceptance
VEA Log ndash PMM-RSP
Send occurrence
MDEA Log ndash PMM-RSP
Receive occurrence
MDEA Log ndash Coordination
Status
MDEA Log ndash PMM-
Cancel Sent Occurrence
VEA Log ndash PMM-
Cancel Received
Occurrence
ATP 11 Check All Present Check Check Check Check Check Check Check
ATP 12 Check All Present Check Check Check Check Check Check Check
ATP 13 Check All Present Check Check Check Check Check Check Check
ATP 14 Check All Present Check Check Check Check Check Check Check
ATP 15 Check All Present Check Check Check Check Check Check Check
ATP 16 Check All Present Check Check Check Check Check Check Check
ATP 17 Check All Present Check Check Check Check Check Check Check
US Department of Transportation Office of the Assistant Secretary for Research and Technology
Intelligent Transportation Systems Joint Program Office
Task 8 D2X Hub Proof-of-Concept Test Evaluation Report ndash Final | A-14
Table A-8 Complete Data Analysis ndash Hy pothesis 10
Date Test Number
Analyze the Success Rate of Receiving a PMM-Arrive Message
VEA Log ndash PMM-ARRIVE Send Occurrence MDEA Log ndash PMM-ARRIVE Receive Occurrence
1312017 TFHRC 1 Fail Fail
1312017 TFHRC 2 Check Check
1312017 TFHRC 3 Check Check
1312017 TFHRC 4 Check Check
1312017 TFHRC 5 Check Check
1312017 TFHRC 6 Check Check
1312017 TFHRC 7 Check Check
1182017 ATP 1 Not Available Check
1182017 ATP 2 Not Available Check
1182017 ATP 3 Not Available Check
1182017 ATP 4 Not Available Check
1182017 ATP 5 Not Available Check
1182017 ATP 6 Not Available Check
1182017 ATP 7 Not Available Check
1182017 ATP 8 Not Available Check
1182017 ATP 9 Not Available Check
1182017 ATP 10 Not Available Check
1202017 ATP 11 Check Check
1202017 ATP 12 Check Check
1202017 ATP 13 Check Check
1202017 ATP 14 Check Check
1202017 ATP 15 Check Check
APPENDIX A Comprehensive Data Analysis Tables
US Department of Transportation Office of the Assistant Secretary for Research and Technology
Intelligent Transportation Systems Joint Program Office
Task 8 D2X Hub Proof-of-Concept Test Evaluation Report ndash Final | A-15
APPENDIX A Comprehensive Data Analysis Tables
Table A-9 Complete Data Analysis ndash Hypothesis 13 (Part A)
US Department of Transportation Office of the Assistant Secretary for Research and Technology
Intelligent Transportation Systems Joint Program Office
Task 8 D2X Hub Proof-of-Concept Test Evaluation Report ndash Final | A-16
Test Number
Coordination Request Sent
by Y
Coordination Request
Received by X
Request Confirmed
by X Confirmation Received by Y
Coordination Request Sent
by Z
Coordination Request
Received by X
Request Confirmed
by X Confirmation Received by Z
Coordination Heart Beat
Transmitted by Y amp Z
Heart Beat Response received
by X
Ride Arrived
Messages
TFHRC 1
Fail Traveler Y could not join the ad-hoc travel group
TFHRC 2
Check check check check 41047 check check check check check 41303
TFHRC 3
Check Check Check Check Check Check Check Check Check Check Check
TFHRC 4
Fail Traveler Y could not join the ad-hoc travel group
TFHRC 5
Check Check Check Check Check Check Check Check Check Check Check
TFHRC 6
Check Check Check Check Check Check Check Check Check Check Check
TFHRC 7
Check Check Check Check Check Check Check Check Check Check Check
TFHRC 8
Check Check Check Check Check Check Check Check Check Check Check
TFHRC 9
Check Check Check Check Check Check Check Check Check Check Check
TFHRC 10
Check Check Check Check Check Check Check Check Check Check Check
ATP 1 Check Check Check Check Check Check Check Check Check Check Check
ATP 2 Check Check Check Check Check Check Check Check Check Check Check
Test Number
Coordination Request Sent
by Y
Coordination Request
Received by X
Request Confirmed
by X Confirmation Received by Y
Coordination Request Sent
by Z
Coordination Request
Received by X
Request Confirmed
by X Confirmation Received by Z
Coordination Heart Beat
Transmitted by Y amp Z
Heart Beat Response received
by X
Ride Arrived
Messages
ATP 3 Check Check Check Check Check Check Check Check Check Check Check
ATP 4 Check Check Check Check Check Check Check Check Check Check Check
ATP 5 Check Check Check Check Check Check Check Check Check Check Check
ATP 6 Check Check Check Check Check Check Check Check Check Check Check
ATP 7 Check Check Check Check Check Check Check Check Check Check No ride
arrives received
ATP 8 Check Check Check Check Check Check Check Check Check Check Check
ATP 9 Check Check Check Check Check Check Check Check Check Check No ride
arrives received
ATP 10 Check Check Check Check Check Check Check Check Check Check Check
ATP 11 Check Check Check Check Check Check Check Check Check Check Check
ATP 12 Check Check Check Check Check Check Check Check Check Check No ride
arrives received
ATP 13 Check Check Check Check Check Check Check Check Check Check Check
ATP 14 Check Check Check Check Check Check Check Check Check Check Check
ATP 15 Check Check Check Check Check Check Check Check Check Check Check
APPENDIX A Comprehensive Data Analysis Tables
US Department of Transportation Office of the Assistant Secretary for Research and Technology
Intelligent Transportation Systems Joint Program Office
Task 8 D2X Hub Proof-of-Concept Test Evaluation Report ndash Final | A-17
APPENDIX A Comprehensive Data Analysis Tables
Table A-10 Complete Data Analysis ndash Hypothesis 13 (Part B)
US Department of Transportation Office of the Assistant Secretary for Research and Technology
Intelligent Transportation Systems Joint Program Office
Task 8 D2X Hub Proof-of-Concept Test Evaluation Report ndash Final | A-18
Test Number Coordination Cancel by
Walking Away Coordination Cancel by
Manual Request Disband Group after
Entering into Vehicle
TFHRC 1 Check This step not tested on this day
TFHRC 2 Check This step not tested on this day
TFHRC 3 Check This step not tested on this day
TFHRC 4 Check This step not tested on this day
TFHRC 5 Check This step not tested on this day
TFHRC 6 This step not tested on this day Check Check
TFHRC 7 This step not tested on this day Check Check
TFHRC 8 This step not tested on this day Check Check
TFHRC 9 This step not tested on this day Check Check
TFHRC 10 This step not tested on this day Check Check
ATP 1 Check Check Check
ATP 2 Check Check Check
ATP 3 Check Check Check
ATP 4 Check Check Check
ATP 5 Check Check Check
ATP 6 Check Check Check
ATP 7 Check Check Check
ATP 8 Check Check Check
ATP 9 Check Check Check
APPENDIX A Comprehensive Data Analysis Tables
Test Number Coordination Cancel by
Walking Away Coordination Cancel by
Manual Request Disband Group after Entering into Vehicle
ATP 10 Check Check Check
ATP 11 Fail Could not cancel by distance Check Check
ATP 12 Check Check Check
ATP 13 Fail Could not cancel by distance Check Check
ATP 14 Check Check Check
ATP 15 Check Check Check
US Department of Transportation Office of the Assistant Secretary for Research and Technology
Intelligent Transportation Systems Joint Program Office
Task 8 D2X Hub Proof-of-Concept Test Evaluation Report ndash Final | A-19
APPENDIX A Comprehensive Data Analysis Tables
APPENDIX B Acronyms and Abbreviations
ATG Ad-Hoc Travel Group
ATP Acceptance Test Plan
BSM Basic Safety Message
CCP Common Computing Platform
CV Connected Vehicle
DSRC Dedicated Short Range Communications
EPS Experimental Prototype System
FHWA Federal Highway Administration
FR Functional Requirement
ITS Intelligent Transportation Systems
LDV Light-Duty Vehicle
MAP Map Data
MDEA Mobile Device Experimental Application
MGL Message Logging
OBU On-board Unit
PMM Personal Mobility Message
PMM-ARRIVE Personal Mobility Message Arrival Message
PMM-CANCEL Personal Mobility Message Cancel Message
PMM-RSP Personal Mobility Message Response Message
PR Performance Requirement
PSM Personal Safety Message
REA Roadside Experimental Application
RSU Roadside Unit
SFY Safety
SIR System Interface Requirement
SMP SPaT and MAP
SPaT Signal Phasing and Timing
SyRS System Requirements Specifications
TFHRC Turner-Fairbank Highway Research Center
US DOT US Department of Transportation
US Department of Transportation Office of the Assistant Secretary for Research and Technology
Intelligent Transportation Systems Joint Program Office
Task 8 D2X Hub Proof-of-Concept Test Evaluation Report ndash Final |B-1
VEA Vehicle Experimental Application
Wi-Fi Wireless Fidelity
APPENDIX B Acronyms and Abbreviations
US Department of Transportation Office of the Assistant Secretary for Research and Technology
Intelligent Transportation Systems Joint Program Office
Task 8 D2X Hub Proof-of-Concept Test Evaluation Report ndash Final | B-2
APPENDIX C Terms and Definitions
Basic Safety Message (BSM)
Connected vehicle message type which contains vehicle safety-related information that is broadcast to surrounding vehicles
Bluetooth Short range wireless technology used to exchange data between enabled devices
Cellular Uses short-range radio stations to cover areas of communication
Connected Vehicle A vehicle that can communicate with other vehicles and infrastructure via communication media such as DSRC Wi-Fi cellular or Bluetooth
Coordinated Messages are coordinated when two or more mobile devices have establish a travel group based on the same origin destination and
time and function as a single cohesive senderrecipient
CV Inspector An application that verifies if the Mobile Device is broadcasting messages to Connected Vehicles
Destination The end point of a travelerrsquos trip
DSRC Dedicated Short-Range Communications a low-latency high-reliability two-way communications tool used for sending transportation safety
messages
Light-Duty Vehicle Of or relating to vehicles that way less than 4000 lbs
Message Type Type of personal safety or personal mobility message that is transmitted based on the technology used and level of coordination available
Personal Mobility Message (PMM)
Similar to PDM message intended for the exchange of mobility messages between individual travelers and vehiclesinfrastructure via
mobile device
Personal Safety Message (PSM)
Similar to BSM message intended to transmit low-latency urgent safety messages between individual travelers and vehiclesinfrastructure via
mobile device
Test Case A set of conditions or variables that a Tester can determine if system meets requirements
Transit Vehicle Large vehicles mainly used for public transportation as well as support services
Transmitting The state in which a traveler has opted in and is sendingreceiving messages via mobile device
Uncoordinated Messages are uncoordinated when travel groups are not established (see coordinated definition)
Wi-Fi Local area wireless technology that allows enabled devices to connect to the Internet
APPENDIX A Comprehensive Data Analysis Tables
US Department of Transportation Office of the Assistant Secretary for Research and Technology
Intelligent Transportation Systems Joint Program Office
Task 8 D2X Hub Proof-of-Concept Test Evaluation Report ndash Final |C-1
ITS Joint Program Office-HOIT 1200 New Jersey Avenue SE
Washington DC 20590
Toll-Free ldquoHelp Linerdquo 866-367-7487 wwwitsdotgov
FHWA-JPO-18-263
- Structure Bookmarks
-
- Sharing Data between Mobile Devices Connected Vehicles and Infrastructure Task 8 D2X Hub Proof-of-Concept Test Evaluation Report wwwitsdotgovindexhtm Final Report mdash October 25 2017 FHWA-JPO-18-623
- Revision History
- Table of Contents
- Chapter 1 Scope
- Chapter 2 Referenced Documents
- Chapter 3 Test Conduct
- Chapter 4 Experimental Analysis Results Summary
- Chapter 5 Experimental Analysis
- Chapter 6 Lessons Learned and Recommendations
- APPENDIX A Comprehensive Data Analysis Tables
- APPENDIX B Acronyms and Abbreviations
- APPENDIX C Terms and Definitions
-

US Department of Transportation Office of the Assistant Secretary for Research and Technology
Intelligent Transportation Systems Joint Program Office
Task 8 D2X Hub Proof-of-Concept Test Evaluation Report ndash Final | 26
Chapter 5 Experimental Analysis
Hypothesis 14 The RSU can broadcast a SPaT and MAP message via DSRC that can be received by mobile devices
Data logs verified MDEA Log ndash BSM received and PSM send occurrences
Analysis 1 Determined the percentage of SPaT messages received by mobile devices when within
100 meters of RSE Assessed message contents for consistency 2 Determined the percentage of MAP messages received by mobile devices when within
100 meters of RSE Assessed message contents for consistency
Observations Considering test 5444 all the SPa T messages were transmitted and received at a rate of 1sec Similarly all the MAP messages were transmitted and received at a rate better than 5sec
Table 5-14 Hypothesis 14 Analysis Data Sample
ID Date Message
5 13117 163842 Dsrc Rx Spat id19
6 13117 163842 Dsrc Rx Map id18
9 13117 163843 Dsrc Rx Spat id19
10 13117 163843 Dsrc Rx Bsm Lat389546323 Long -771488295 Head 2713375 Sp 0
12 13117 163843 Dsrc Rx Bsm Lat389546138 Long -771483988 Head 2559125 Sp 0
13 13117 163844 Dsrc Rx Spat id19
14 13117 163844 Dsrc Rx Bsm Lat389546323 Long -771488297 Head 2713375 Sp 0
16 13117 163844 Dsrc Rx Bsm Lat389546138 Long -771483987 Head 2559125 Sp 0
17 13117 163844 Dsrc Rx Map id18
18 13117 163844 Dsrc Rx Bsm Lat389546322 Long -7714883 Head 2713375 Sp 0
20 13117 163845 Dsrc Rx Bsm Lat389546137 Long -771483987 Head 2559125 Sp 0
21 13117 163845 Dsrc Rx Bsm Lat389546322 Long -771488302 Head 2713375 Sp 0
22 13117 163845 Dsrc Rx Spat id19
23 13117 163845 Dsrc Rx Bsm Lat389546137 Long -771483987 Head 2559125 Sp 0
25 13117 163845 Dsrc Rx Bsm Lat38954632 Long -771488302 Head 2713375 Sp 0
26 13117 163846 Dsrc Rx Bsm Lat389546135 Long -771483987 Head 2559125 Sp 0
27 13117 163846 Dsrc Rx Spat id19
29 13117 163846 Dsrc Rx Bsm Lat389546318 Long -771488303 Head 2713375 Sp 0
31 13117 163846 Dsrc Rx Map id18
Results There were no outliers (False Negatives) in the data analyzed Hence Hypothesis 14 is satisfied at a 100 level of confidence
Chapter 5 Experimental Analysis
Hypothesis 15 The RSU can store all messages received via DSRC
Data logs verified MDEA Log ndash All Occurrences of messages sent via DSRC and Message Contents RSU Log ndash Message Received Occurrence and Message Contents
Analysis 1 Assessed the percentage of messages received from mobile devices within 100 meters of
RSE Assess message contents to make sure they are consistent
Observations a Considering the message logs from test cases 5411 5444 5471 there were instances
where PSMs were logged at a rate of less than 10sec Also there were test cases that had no reception of PSMs This clearly indicates the reception issues with RSU CCP unit One prime focus for the Large-Scale Field Test is to improve the reliability of the hardware associated with RSU
b The message contents in all the DSRC messages were consistent throughout the test logs
Table 5-15 Hypothesis 15 Analysis Data Sample
Date Time
Vehicle Range and Advisory Distance wrt
Speed Speed (mph)
In Range
Out of Range
Distance (m)
RSU Log PSM
Message RateSec
13117 101316 IsBsmClose Dist
975500061708885lt AdvDist 1024200201024
255 98 8
13117 101332 IsBsmClose Dist
570797651794001lt AdvDist 666000057888
173 57 6
13117 101340 IsBsmClose Dist
57448436831453lt AdvDist 601199821728
149 57 1
13117 101529 IsBsmClose Dist
975729907380225lt AdvDist 102240014976
254 98 0
13117 101538 IsBsmClose Dist
399317028326919lt AdvDist 102240014976
250 4 1
For the complete analysis please refer to Table A-1 in Appendix A
US Department of Transportation Office of the Assistant Secretary for Research and Technology
Intelligent Transportation Systems Joint Program Office
Task 8 D2X Hub Proof-of-Concept Test Evaluation Report ndash Final | 27
Chapter 5 Experimental Analysis
Table 5-16 Data Usage Statistics
17-Jan 18-Jan 19-Jan 20-Jan 31-Jan 1-Feb Average Maximum
Total Usage (MB) 3805 626 714 2713 4873 1355 984 2713
TMX core usage (MB) 271 450 468 1991 345 90 705 1991
of TMX usage 71 72 66 73 71 66 71 73
Results The hypothesis statement of RSU being able to store all messages received via DSRC is not satisfied at 100 level of confidence due to hardware issues
US Department of Transportation Office of the Assistant Secretary for Research and Technology
Intelligent Transportation Systems Joint Program Office
Task 8 D2X Hub Proof-of-Concept Test Evaluation Report ndash Final | 28
Chapter 6 Lessons Learned and Recommendations
Lessons Learned
The Lessons Learned from the Proof-of-Concept testing are summarized as follows
The ability to reliably generate transmit and receive messages between mobile devices and connected vehicles was demonstrated
The messages to incorporate mobile devices into the C V environment functioned as designed and provided the necessary data for the prototype mobility and safety applications
The prototype safety and mobility software applications functioned well (as designed)
Limitations of technology and hardware issues caused the majority of performance shortfalls
Mixed results were achieved for the various communication methods tested
a Cellular functioned well with our system
b Wi-Fi Direct connectivity was unreliable with our system
c DSRC hardware problems caused communication problems with our system
GPS accuracy limitations were observed as expected
Wi-Fi Direct Connectivity
The connection process was prone to failure at multiple points with no indication to the application why connection failed
TFHRC success rate was achieved by selecting specific devices that worked best for specific roles otherwise a failure rate gt50 would have been expected based on earlier testing
Canvasing of developer community found similar observations no solutions for our system
Wi-Fi Direct connection process requires authorization from the user of the target device in a real world environment such a request would most likely be denied if noticed at all
US Department of Transportation Office of the Assistant Secretary for Research and Technology
Intelligent Transportation Systems Joint Program Office
Task 8 D2X Hub Proof-of-Concept Test Evaluation Report ndash Final | 29
Chapter 6 Lessons Learned and Recommendations
DSRC Hardware
Common Computer Platform (CCP) Pre-production engineering units were used which were determined to have an impedance mismatch between the DSRC chip and RF connector that caused reduction of signal strength
Arada LocoMate ME There were occasional Bluetooth connection failures to mobile devices as well as occasional DSRC transmissionreception failures Longer term it is assumed that DSRC radios will be integrated into smartphones thus obviating the current issues
Recommendations
Based on outcomes of Proof-of-Concept Testing the following prototype system design changes are recommended to be implemented prior to the larger-scale prototype field test
Add Cellular-based communication for Travel Group coordination between mobile devices
New and improved CCP units will be used for the larger-scale field test
For in-vehicle detection use Accelerometer method as the most reliable option
US Department of Transportation Office of the Assistant Secretary for Research and Technology
Intelligent Transportation Systems Joint Program Office
Task 8 D2X Hub Proof-of-Concept Test Evaluation Report ndash Final | 30
APPENDIX A Comprehensive Data Analysis Tables
Note For all the analysis results depicted below the term ldquocheckrdquo refers to the ldquosuccessrdquo of desired action
Table A-1 Complete Data Analysis ndash Hypothesis 1 4 amp 15
Date Time Vehicle Range and Advisory
Distance wrt Speed Speed In
Range Out of
Range Distance
RSU Log PSM
Message RateSec
VEA Log PSM
Message Rate
1312017 101316 IsBsmClose Dist 975500061708885lt
AdvDist 1024200201024 255 X 98 8 10
1312017 101332 IsBsmClose Dist 570797651794001lt
AdvDist 666000057888 173 X 57 6 10
1312017 101340 IsBsmClose Dist 57448436831453lt
AdvDist 601199821728 149 X 57 1 10
1312017 101529 IsBsmClose Dist 975729907380225lt
AdvDist 102240014976 254 X 98 0 10
1312017 101538 IsBsmClose Dist 399317028326919lt
AdvDist 102240014976 250 X 4 1 10
1312017 101553 IsBsmClose Dist 600719107941917lt
AdvDist 70199987616 174 X 60 0 10
1312017 102029 IsBsmClose Dist 944643508928866lt
AdvDist 1008000141984 251 X 95 0 9
1312017 102048 IsBsmClose Dist 592561932680623lt
AdvDist 628200188352 156 X 59 0 9
US Department of Transportation Office of the Assistant Secretary for Research and Technology
Intelligent Transportation Systems Joint Program Office
Task 8 D2X Hub Proof-of-Concept Test Evaluation Report ndash Final | A-1
APPENDIX A Comprehensive Data Analysis Tables
Date Time Vehicle Range and Advisory
Distance wrt Speed Speed In
Range Out of Range Distance
RSU Log PSM
Message RateSec
VEA Log PSM
Message Rate
1312017 102054 IsBsmClose Dist 616348297460404lt
AdvDist 644399845056 160 X 62 3 11
1312017 102105 IsBsmClose Dist 871180496389495lt
AdvDist 1092600137376 247 X 87 4 9
1312017 102206 IsBsmClose Dist 977301610734722lt
AdvDist 1130400006912 295 X 98 0 10
1312017 102228 IsBsmClose Dist 577576034007057lt
AdvDist 60659997552 151 X 58 2 10
1312017 102332 IsBsmClose Dist 101193300977461lt
AdvDist 10386002088 258 X 101 10 10
1312017 102356 IsBsmClose Dist 595641466972855lt
AdvDist 660599904096 164 X 60 6 10
1312017 102623 IsBsmClose Dist 100217014111125lt
AdvDist 1024200201024 253 X 100 7 10
1312017 102650 IsBsmClose Dist 540919707235241lt
AdvDist 887399925984 221 X 54 0 10
1172017 111504 IsBsmClose Dist 100564061581794lt
AdvDist 1169999927712 291 X 101 10 10
1172017 112437 IsBsmClose Dist 992912014791515lt
AdvDist 10386002088 258 X 99 10 10
1172017 112837 IsBsmClose Dist 106684353810469lt
AdvDist 1076400078336 261 X 107 10 10
US Department of Transportation Office of the Assistant Secretary for Research and Technology
Intelligent Transportation Systems Joint Program Office
Task 8 D2X Hub Proof-of-Concept Test Evaluation Report ndash Final | A-2
APPENDIX A Comprehensive Data Analysis Tables
Date Time Vehicle Range and Advisory
Distance wrt Speed Speed In
Range Out of Range Distance
RSU Log PSM
Message RateSec
VEA Log PSM
Message Rate
1172017 113148 IsBsmClose Dist 1124753473133lt AdvDist
1186199986752 268 X 112 10 10
1172017 113332 IsBsmClose Dist 106022149777593lt
AdvDist 1126799904384 260 X 106 10 10
1172017 113336 IsBsmClose Dist 59429630331283lt
AdvDist 1196999892 298 X 59 10 10
1172017 113357 IsBsmClose Dist 657937887214709lt
AdvDist 1193400191808 297 X 66 10 10
1172017 113627 IsBsmClose Dist 965542357439439lt
AdvDist 1080000180864 260 X 97 10 10
1172017 113629 IsBsmClose Dist 821301583410616lt
AdvDist 1074600027072 270 X 82 10 10
1172017 113803 IsBsmClose Dist 994884887192582lt
AdvDist 104580001152 251 X 99 10 10
1172017 113811 IsBsmClose Dist 16809952777894lt
AdvDist 106200007056 257 X 17 10 10
1172017 114114 IsBsmClose Dist 948985801452811lt
AdvDist 986399929152 245 X 95 10 10
1172017 114133 IsBsmClose Dist 141255704529106lt
AdvDist 963000067392 242 X 14 10 10
1172017 114136 IsBsmClose Dist 377627357471613lt
AdvDist 977400075168 243 X 38 10 10
US Department of Transportation Office of the Assistant Secretary for Research and Technology
Intelligent Transportation Systems Joint Program Office
Task 8 D2X Hub Proof-of-Concept Test Evaluation Report ndash Final | A-3
APPENDIX A Comprehensive Data Analysis Tables
Date Time Vehicle Range and Advisory
Distance wrt Speed Speed In
Range Out of Range Distance
RSU Log PSM
Message RateSec
VEA Log PSM
Message Rate
1172017 114403 IsBsmClose Dist 114490146784404lt
AdvDist 1225799907552 266 X 114 10 10
1172017 114415 IsBsmClose Dist 280463490772458lt
AdvDist 71100013248 161 X 28 10 10
1172017 114735 IsBsmClose Dist 102043927314914lt
AdvDist 1040399857728 259 X 102 10 10
1172017 114755 IsBsmClose Dist 185020887331204lt
AdvDist 112499985312 275 X 19 10 10
1192017 35605 IsBsmClose Dist 107928079653642lt
AdvDist 1107000145152 272 X 108 9 9
1192017 35630 IsBsmClose Dist 99759104887202lt
AdvDist 1184399935488 294 X 100 10 10
1192017 35837 IsBsmClose Dist 110291146846666lt
AdvDist 115020016848 286 X 110 10 10
1192017 40057 IsBsmClose Dist 998997459961241lt
AdvDist 1260000076896 313 X 100 10 10
1192017 40300 IsBsmClose Dist 100209094247195lt
AdvDist 106919987328 260 X 100 10 10
1192017 40410 IsBsmClose Dist 100723184500334lt
AdvDist 1097999888832 273 X 101 6 10
1192017 41103 IsBsmClose Dist 977354295877856lt
AdvDist 1008000141984 251 X 98 10 10
US Department of Transportation Office of the Assistant Secretary for Research and Technology
Intelligent Transportation Systems Joint Program Office
Task 8 D2X Hub Proof-of-Concept Test Evaluation Report ndash Final | A-4
APPENDIX A Comprehensive Data Analysis Tables
Date Time Vehicle Range and Advisory
Distance wrt Speed Speed In
Range Out of Range Distance
RSU Log PSM
Message RateSec
VEA Log PSM
Message Rate
1192017 41311 IsBsmClose Dist 10190842581135lt
AdvDist 1040399857728 259 X 102 10 10
1192017 41423 IsBsmClose Dist 995536361906761lt
AdvDist 1009799790912 251 X 100 10 10
1192017 41534 IsBsmClose Dist 10075608603652lt
AdvDist 106919987328 264 X 101 10 10
US Department of Transportation Office of the Assistant Secretary for Research and Technology
Intelligent Transportation Systems Joint Program Office
Task 8 D2X Hub Proof-of-Concept Test Evaluation Report ndash Final | A-5
APPENDIX A Comprehensive Data Analysis Tables
Table A-2 Complete Data Analysis ndash Hypothesis 2
US Department of Transportation Office of the Assistant Secretary for Research and Technology
Intelligent Transportation Systems Joint Program Office
Task 8 D2X Hub Proof-of-Concept Test Evaluation Report ndash Final | A-6
Date Test
Number PSMs Generated by
Trav X and Trav Y Transition to In Group Trav Y PSM Ceased Only Trav X PSM
Received
1312017 TFHRC 1 111116 111240 Check 111305
1312017 TFHRC 2 Grouping Failed Grouping Failed Grouping Failed Grouping Failed
1312017 TFHRC 3 112346 112448 Check 112508
1312017 TFHRC 4 114208 114301 Check 114345
1312017 TFHRC 5 114609 114658 Check 114721
1312017 TFHRC 6 115222 115313 Check 115342
1182017 ATP 1 104400 104527 Check 104601
1182017 ATP 2 105356 105455 Check 105546
1182017 ATP 3 110059 110150 Check 110322
1182017 ATP 4 111222 111310 Check 111329
1182017 ATP 5 111515 111616 Check 111630
1182017 ATP 6 111823 111906 Check 111917
1182017 ATP 7 112116 112157 Check 112209
1182017 ATP 8 112814 112855 Check 112917
1182017 ATP 9 113142 113230 Check 113248
1182017 ATP 10 113501 113545 Check 113608
1192017 ATP 11 44728 44842 Check 45007
1192017 ATP 12 Radio Failure Test Terminated Radio Failure Test Terminated Radio Failure Test Terminated Radio Failure Test Terminated
1192017 ATP 13 45548 45637 Check 45728
1192017 ATP 14 45946 50047 Check 50107
1192017 ATP 15 50353 50444 Check 50513
1192017 ATP 16 50730 50823 Check 50839
APPENDIX A Comprehensive Data Analysis Tables
Table A-3 Complete Data Analysis ndash Hypothesis 3
US Department of Transportation Office of the Assistant Secretary for Research and Technology
Intelligent Transportation Systems Joint Program Office
Task 8 D2X Hub Proof-of-Concept Test Evaluation Report ndash Final | A-7
Date Description
MDEA not in Vehicle
MDEA Transmits
PSMs Time of MDEA
Mode Transition
MDEA Ceases Transmitting
PSMs
1312017 TFHRC 1 Check Check 0443101852 Check
1312017 TFHRC 2 Check Check 0445243056 Check
1312017 TFHRC 3 Check Check 0447569444 Check
1312017 TFHRC 4 Check Check 0448888889 Check
1312017 TFHRC 5 Check Check 045005787 Check
1312017 TFHRC 6 Check Check 0451666667 Check
1172017 ATP 1 Check Check 0501898148 Check
1172017 ATP 2 Check Check 0504201389 Check
1172017 ATP 3 Check Check 0506215278 Check
1172017 ATP 4 Check Check 0507858796 Check
1172017 ATP 5 Check Check 0508981481 Check
1172017 ATP 6 Check Check 0510219907 Check
1172017 ATP 7 Check Check 0511736111 Check
1172017 ATP 8 Check Check 05128125 Check
1172017 ATP 9 Check Check 0513831019 Check
1172017 ATP 10 Check Check 0514884259 Check
1172017 ATP 11 Check Check 0185590278 Check
1172017 ATP 12 Check Check 0187210648 Check
1172017 ATP 13 Check Check 0188425926 Check
1172017 ATP 14 Check Check 0190289352 Check
1172017 ATP 15 Check Check 0191863426 Check
APPENDIX A Comprehensive Data Analysis Tables
Table A-4 Complete Data Analysis ndash Hypothesis 5 (VEA)
Test Number
Type of Message
True Distance (m)
Speed (MPH)
Expected Distance (m)
Difference (m)
TFHRC1
Advisory 7584 2471 9942 2358
Alert 5545 2523 5780 235
Warning 4874 2498 4910 036
TFHRC2
Advisory 8552 2595 10441 1889
Alert 5167 2461 5588 421
Warning 4515 2433 4751 236
TFHRC3
Advisory 7876 2381 9580 1704
Alert 5827 2590 5989 162
Warning 5124 2624 5222 098
TFHRC4
Advisory 7529 2818 11338 3809
Alert 6047 2744 6482 435
Warning 5323 2714 5450 127
TFHRC5
Advisory 9292 2404 9672 380
Alert 5350 2423 5472 122
Warning 4081 2352 4556 475
ATP1
Advisory 000 000
Alert 000 000
Warning 000 000
ATP2
Advisory 5787 1644 6614 827
Alert 3074 1640 3289 215
Warning 2627 1640 2947 320
ATP3
Advisory 4204 1685 6779 2575
Alert 3300 1672 3370 070
Warning 2854 1658 2985 131
ATP4
Advisory 4296 1753 7053 2757
Alert 3346 1791 3679 333
Warning 2871 1755 3194 323
ATP5
Advisory 000 000
Alert 000 000
Warning 1069 1706 3088 2019
ATP6
Advisory 3632 1640 6598 2966
Alert 000 000
Warning 2770 1594 2850 080
US Department of Transportation Office of the Assistant Secretary for Research and Technology
Intelligent Transportation Systems Joint Program Office
Task 8 D2X Hub Proof-of-Concept Test Evaluation Report ndash Final | A-8
APPENDIX A Comprehensive Data Analysis Tables
Test Number
Type of Message
True Distance (m)
Speed (MPH)
Expected Distance (m)
Difference (m)
ATP7
Advisory 000 000
Alert 000 000
Warning 1919 1887 3483 1564
ATP8
Advisory 4492 1741 7005 2513
Alert 3113 1687 3409 296
Warning 2661 1680 3032 371
ATP9
Advisory 4694 1628 6550 1856
Alert 2991 1570 3113 122
Warning 2572 1549 2756 184
ATP10
Advisory 000 000
Alert 000 000
Warning 650 2505 4927 4277
ATP11
Advisory 000 000
Alert 000 000
Warning 1914 2398 4666 2752
ATP12
Advisory 000 000
Alert 000 000
Warning 460 2293 4415 3955
ATP13
Advisory 000 000
Alert 000 000
Warning 2732 2535 5001 2269
ATP14
Advisory 000 000
Alert 000 000
Warning 2358 2361 4577 2219
ATP15
Advisory 000 000
Alert 000 000
Warning 1107 2459 4814 3707
ATP16
Advisory 5668 1982 7974 2306
Alert 000 000
Warning 1502 1906 3525 2023
ATP17
Advisory 000 000
Alert 000 000
Warning 3183 2420 4720 1537
US Department of Transportation Office of the Assistant Secretary for Research and Technology
Intelligent Transportation Systems Joint Program Office
Task 8 D2X Hub Proof-of-Concept Test Evaluation Report ndash Final | A-9
Table A-5 Complete Data Analysis ndash Hypothesis 6 (MDEA)
Test Number
Type of Message
True Distance (m)
Speed (MPH)
Expected Distance (m)
Difference (m)
TFHRC1
Advisory 8756 2290 9213 457
Alert 5320 2509 5736 416
Warning 4651 2487 4883 232
TFHRC2
Advisory 9928 2514 10115 187
Alert 5276 2447 5546 270
Warning 4624 2415 4707 084
TFHRC3
Advisory 8952 2304 9270 318
Alert 5595 2603 6030 436
Warning 4890 2617 5205 315
TFHRC4
Advisory 9752 2514 10115 363
Alert 6290 2769 6564 274
Warning 4844 2693 5396 552
TFHRC5
Advisory 9613 2406 9680 067
Alert 5242 2420 5463 221
Warning 4080 2357 4568 488
ATP1
Advisory 5938 2183 8783 2845
Alert 4314 2120 4580 266
Warning 3644 2111 3989 345
ATP2
Advisory 6452 1641 6602 150
Alert 3296 1691 3419 123
Warning 2600 1601 2865 265
ATP3
Advisory 6212 1628 6550 338
Alert 3200 1655 3327 127
Warning 2707 1641 2949 242
ATP4
Advisory 6420 1646 6622 202
Alert 3300 1780 3650 350
Warning 2878 1704 3084 206
ATP5
Advisory 6673 1677 6747 074
Alert 3400 1847 3828 428
Warning 2972 1807 3307 335
ATP6
Advisory 6100 1628 6550 450
Alert 3100 1637 3281 181
Warning 2500 1597 2857 357
APPENDIX A Comprehensive Data Analysis Tables
US Department of Transportation Office of the Assistant Secretary for Research and Technology
Intelligent Transportation Systems Joint Program Office
Task 8 D2X Hub Proof-of-Concept Test Evaluation Report ndash Final | A-10
APPENDIX A Comprehensive Data Analysis Tables
Test Number
Type of Message
True Distance (m)
Speed (MPH)
Expected Distance (m)
Difference (m)
ATP7
Advisory 7500 1972 7934 434
Alert 3882 1914 4008 126
Warning 3400 1946 3614 214
ATP8
Advisory 6659 1744 7017 358
Alert 3263 1682 3396 133
Warning 2900 1682 3037 137
ATP9
Advisory 6605 1659 6675 070
Alert 2900 1556 3078 178
Warning 2365 1561 2781 416
ATP10
Advisory 9214 2491 10022 808
Alert 5859 2688 6301 442
Warning 5200 2644 5273 073
ATP11
Advisory 8485 2487 10006 1521
Alert 5376 2487 5668 292
Warning 4716 2483 4873 157
ATP12
Advisory 9001 2433 9789 788
Alert 5395 2420 5463 068
Warning 4103 2330 4503 400
ATP13
Advisory 8615 2559 10296 1681
Alert 000 000 000 000
Warning 4930 2581 5115 185
ATP14
Advisory 6119 2491 10022 3903
Alert 5500 2491 5681 181
Warning 3800 2402 4676 876
ATP15
Advisory 7546 2603 10473 2927
Alert 6000 2661 6215 215
Warning 3100 2603 5170 2070
ATP16
Advisory 7931 2089 8405 474
Alert 3995 1950 4106 111
Warning 3500 1923 3563 063
ATP17
Advisory 8243 2049 8244 001
Alert 5260 2465 5601 341
Warning 4718 2438 4763 045
US Department of Transportation Office of the Assistant Secretary for Research and Technology
Intelligent Transportation Systems Joint Program Office
Task 8 D2X Hub Proof-of-Concept Test Evaluation Report ndash Final | A-11
Table A-6 Complete Data Analysis ndash Hypothesis 7
Date Test
Number
User State Change Is
Safe Icon False
Properly Processed
User State Change Is
Safe Icon True
Properly Processed
1312017 TFHRC 1 111438 X 111504 X
1312017 TFHRC 3 112533 X 112619 X
1312017 TFHRC 4 114400 X 114438 X
1312017 TFHRC 5 114801 X 114829 X
1312017 TFHRC 6 115408 X 115444 X
1182017 ATP 1 105056 X 105116 X
1182017 ATP 2 105622 X 105656 X
1182017 ATP 3 110348 X 110436 X
1182017 ATP 4 111355 X 111417 X
1182017 ATP 5 111655 X 111717 X
1182017 ATP 6 111947 X 112007 X
1182017 ATP 7 112235 X 112305 X
1182017 ATP 8 112937 X 113013 X
1182017 ATP 9 113313 X 113353 X
1182017 ATP 10 113636 X 113708 X
1192017 ATP 11 45035 X 45057 X
1192017 ATP 13 45806 X 45828 X
1192017 ATP 14 50144 X 50202 X
1192017 ATP 15 50542 X 50600 X
1192017 ATP 16 50903 X 50929 X
APPENDIX A Comprehensive Data Analysis Tables
US Department of Transportation Office of the Assistant Secretary for Research and Technology
Intelligent Transportation Systems Joint Program Office
Task 8 D2X Hub Proof-of-Concept Test Evaluation Report ndash Final | A-12
APPENDIX A Comprehensive Data Analysis Tables
Table A-7 Complete Data Analysis ndash Hy pothesis 8 amp 9
US Department of Transportation Office of the Assistant Secretary for Research and Technology
Intelligent Transportation Systems Joint Program Office
Task 8 D2X Hub Proof-of-Concept Test Evaluation Report ndash Final | A-13
Test Number
Analyze the percentage of PMM messages properly processed by
in-vehicle devices Analyze the percentage of PMM-RSP messages
properly processed by mobile devices
Analyze the percentage of PMM-Cancel messages
properly processed by in-vehicle devices
MDEA Log ndash PMM Send
occurrence
MDEA Log ndash
PMM contents
VEA Log ndash PMM
Receive occurrence
VEA Log ndash Driver
acceptance
VEA Log ndash PMM-RSP
Send occurrence
MDEA Log ndash PMM-RSP
Receive occurrence
MDEA Log ndash Coordination
Status
MDEA Log ndash PMM-
Cancel Sent Occurrence
VEA Log ndash PMM-
Cancel Received
Occurrence
TFHRC 1 Check All Present Check Check Check Check Check Check Check
TFHRC 2 Check All Present Check Check Check Check Check Check Check
TFHRC 3 Check All Present Check Check Check Check Check Check Check
TFHRC 4 Check All Present Check Check Check Check Check Check Check
TFHRC 5 Check All Present Check Check Check Check Check Check Check
ATP 1 Check All Present Check Check Check Check Check Check Check
ATP 2 Check All Present Check Check Check Check Check Check Check
ATP 3 Check All Present Check Check Check Check Check Check Check
ATP 4 Check All Present Check Check Check Check Check Check Check
ATP 5 Check All Present Check Check Check Check Check Check Check
ATP 6 Check All Present Check Check Check Check Check Check Check
ATP 7 Check All Present Check Check Check Check Check Check Check
ATP 8 Check All Present Check Check Check Check Check Check Check
ATP 9 Check All Present Check Check Check Check Check Check Check
ATP 10 Check All Present Check Check Check Check Check Check Check
APPENDIX A Comprehensive Data Analysis Tables
Test Number
Analyze the percentage of PMM messages properly processed by
in-vehicle devices Analyze the percentage of PMM-RSP messages
properly processed by mobile devices
Analyze the percentage of PMM-Cancel messages
properly processed by in-vehicle devices
MDEA Log ndash PMM Send occurrence
MDEA Log ndash PMM
contents
VEA Log ndash PMM
Receive occurrence
VEA Log ndash Driver
acceptance
VEA Log ndash PMM-RSP
Send occurrence
MDEA Log ndash PMM-RSP
Receive occurrence
MDEA Log ndash Coordination
Status
MDEA Log ndash PMM-
Cancel Sent Occurrence
VEA Log ndash PMM-
Cancel Received
Occurrence
ATP 11 Check All Present Check Check Check Check Check Check Check
ATP 12 Check All Present Check Check Check Check Check Check Check
ATP 13 Check All Present Check Check Check Check Check Check Check
ATP 14 Check All Present Check Check Check Check Check Check Check
ATP 15 Check All Present Check Check Check Check Check Check Check
ATP 16 Check All Present Check Check Check Check Check Check Check
ATP 17 Check All Present Check Check Check Check Check Check Check
US Department of Transportation Office of the Assistant Secretary for Research and Technology
Intelligent Transportation Systems Joint Program Office
Task 8 D2X Hub Proof-of-Concept Test Evaluation Report ndash Final | A-14
Table A-8 Complete Data Analysis ndash Hy pothesis 10
Date Test Number
Analyze the Success Rate of Receiving a PMM-Arrive Message
VEA Log ndash PMM-ARRIVE Send Occurrence MDEA Log ndash PMM-ARRIVE Receive Occurrence
1312017 TFHRC 1 Fail Fail
1312017 TFHRC 2 Check Check
1312017 TFHRC 3 Check Check
1312017 TFHRC 4 Check Check
1312017 TFHRC 5 Check Check
1312017 TFHRC 6 Check Check
1312017 TFHRC 7 Check Check
1182017 ATP 1 Not Available Check
1182017 ATP 2 Not Available Check
1182017 ATP 3 Not Available Check
1182017 ATP 4 Not Available Check
1182017 ATP 5 Not Available Check
1182017 ATP 6 Not Available Check
1182017 ATP 7 Not Available Check
1182017 ATP 8 Not Available Check
1182017 ATP 9 Not Available Check
1182017 ATP 10 Not Available Check
1202017 ATP 11 Check Check
1202017 ATP 12 Check Check
1202017 ATP 13 Check Check
1202017 ATP 14 Check Check
1202017 ATP 15 Check Check
APPENDIX A Comprehensive Data Analysis Tables
US Department of Transportation Office of the Assistant Secretary for Research and Technology
Intelligent Transportation Systems Joint Program Office
Task 8 D2X Hub Proof-of-Concept Test Evaluation Report ndash Final | A-15
APPENDIX A Comprehensive Data Analysis Tables
Table A-9 Complete Data Analysis ndash Hypothesis 13 (Part A)
US Department of Transportation Office of the Assistant Secretary for Research and Technology
Intelligent Transportation Systems Joint Program Office
Task 8 D2X Hub Proof-of-Concept Test Evaluation Report ndash Final | A-16
Test Number
Coordination Request Sent
by Y
Coordination Request
Received by X
Request Confirmed
by X Confirmation Received by Y
Coordination Request Sent
by Z
Coordination Request
Received by X
Request Confirmed
by X Confirmation Received by Z
Coordination Heart Beat
Transmitted by Y amp Z
Heart Beat Response received
by X
Ride Arrived
Messages
TFHRC 1
Fail Traveler Y could not join the ad-hoc travel group
TFHRC 2
Check check check check 41047 check check check check check 41303
TFHRC 3
Check Check Check Check Check Check Check Check Check Check Check
TFHRC 4
Fail Traveler Y could not join the ad-hoc travel group
TFHRC 5
Check Check Check Check Check Check Check Check Check Check Check
TFHRC 6
Check Check Check Check Check Check Check Check Check Check Check
TFHRC 7
Check Check Check Check Check Check Check Check Check Check Check
TFHRC 8
Check Check Check Check Check Check Check Check Check Check Check
TFHRC 9
Check Check Check Check Check Check Check Check Check Check Check
TFHRC 10
Check Check Check Check Check Check Check Check Check Check Check
ATP 1 Check Check Check Check Check Check Check Check Check Check Check
ATP 2 Check Check Check Check Check Check Check Check Check Check Check
Test Number
Coordination Request Sent
by Y
Coordination Request
Received by X
Request Confirmed
by X Confirmation Received by Y
Coordination Request Sent
by Z
Coordination Request
Received by X
Request Confirmed
by X Confirmation Received by Z
Coordination Heart Beat
Transmitted by Y amp Z
Heart Beat Response received
by X
Ride Arrived
Messages
ATP 3 Check Check Check Check Check Check Check Check Check Check Check
ATP 4 Check Check Check Check Check Check Check Check Check Check Check
ATP 5 Check Check Check Check Check Check Check Check Check Check Check
ATP 6 Check Check Check Check Check Check Check Check Check Check Check
ATP 7 Check Check Check Check Check Check Check Check Check Check No ride
arrives received
ATP 8 Check Check Check Check Check Check Check Check Check Check Check
ATP 9 Check Check Check Check Check Check Check Check Check Check No ride
arrives received
ATP 10 Check Check Check Check Check Check Check Check Check Check Check
ATP 11 Check Check Check Check Check Check Check Check Check Check Check
ATP 12 Check Check Check Check Check Check Check Check Check Check No ride
arrives received
ATP 13 Check Check Check Check Check Check Check Check Check Check Check
ATP 14 Check Check Check Check Check Check Check Check Check Check Check
ATP 15 Check Check Check Check Check Check Check Check Check Check Check
APPENDIX A Comprehensive Data Analysis Tables
US Department of Transportation Office of the Assistant Secretary for Research and Technology
Intelligent Transportation Systems Joint Program Office
Task 8 D2X Hub Proof-of-Concept Test Evaluation Report ndash Final | A-17
APPENDIX A Comprehensive Data Analysis Tables
Table A-10 Complete Data Analysis ndash Hypothesis 13 (Part B)
US Department of Transportation Office of the Assistant Secretary for Research and Technology
Intelligent Transportation Systems Joint Program Office
Task 8 D2X Hub Proof-of-Concept Test Evaluation Report ndash Final | A-18
Test Number Coordination Cancel by
Walking Away Coordination Cancel by
Manual Request Disband Group after
Entering into Vehicle
TFHRC 1 Check This step not tested on this day
TFHRC 2 Check This step not tested on this day
TFHRC 3 Check This step not tested on this day
TFHRC 4 Check This step not tested on this day
TFHRC 5 Check This step not tested on this day
TFHRC 6 This step not tested on this day Check Check
TFHRC 7 This step not tested on this day Check Check
TFHRC 8 This step not tested on this day Check Check
TFHRC 9 This step not tested on this day Check Check
TFHRC 10 This step not tested on this day Check Check
ATP 1 Check Check Check
ATP 2 Check Check Check
ATP 3 Check Check Check
ATP 4 Check Check Check
ATP 5 Check Check Check
ATP 6 Check Check Check
ATP 7 Check Check Check
ATP 8 Check Check Check
ATP 9 Check Check Check
APPENDIX A Comprehensive Data Analysis Tables
Test Number Coordination Cancel by
Walking Away Coordination Cancel by
Manual Request Disband Group after Entering into Vehicle
ATP 10 Check Check Check
ATP 11 Fail Could not cancel by distance Check Check
ATP 12 Check Check Check
ATP 13 Fail Could not cancel by distance Check Check
ATP 14 Check Check Check
ATP 15 Check Check Check
US Department of Transportation Office of the Assistant Secretary for Research and Technology
Intelligent Transportation Systems Joint Program Office
Task 8 D2X Hub Proof-of-Concept Test Evaluation Report ndash Final | A-19
APPENDIX A Comprehensive Data Analysis Tables
APPENDIX B Acronyms and Abbreviations
ATG Ad-Hoc Travel Group
ATP Acceptance Test Plan
BSM Basic Safety Message
CCP Common Computing Platform
CV Connected Vehicle
DSRC Dedicated Short Range Communications
EPS Experimental Prototype System
FHWA Federal Highway Administration
FR Functional Requirement
ITS Intelligent Transportation Systems
LDV Light-Duty Vehicle
MAP Map Data
MDEA Mobile Device Experimental Application
MGL Message Logging
OBU On-board Unit
PMM Personal Mobility Message
PMM-ARRIVE Personal Mobility Message Arrival Message
PMM-CANCEL Personal Mobility Message Cancel Message
PMM-RSP Personal Mobility Message Response Message
PR Performance Requirement
PSM Personal Safety Message
REA Roadside Experimental Application
RSU Roadside Unit
SFY Safety
SIR System Interface Requirement
SMP SPaT and MAP
SPaT Signal Phasing and Timing
SyRS System Requirements Specifications
TFHRC Turner-Fairbank Highway Research Center
US DOT US Department of Transportation
US Department of Transportation Office of the Assistant Secretary for Research and Technology
Intelligent Transportation Systems Joint Program Office
Task 8 D2X Hub Proof-of-Concept Test Evaluation Report ndash Final |B-1
VEA Vehicle Experimental Application
Wi-Fi Wireless Fidelity
APPENDIX B Acronyms and Abbreviations
US Department of Transportation Office of the Assistant Secretary for Research and Technology
Intelligent Transportation Systems Joint Program Office
Task 8 D2X Hub Proof-of-Concept Test Evaluation Report ndash Final | B-2
APPENDIX C Terms and Definitions
Basic Safety Message (BSM)
Connected vehicle message type which contains vehicle safety-related information that is broadcast to surrounding vehicles
Bluetooth Short range wireless technology used to exchange data between enabled devices
Cellular Uses short-range radio stations to cover areas of communication
Connected Vehicle A vehicle that can communicate with other vehicles and infrastructure via communication media such as DSRC Wi-Fi cellular or Bluetooth
Coordinated Messages are coordinated when two or more mobile devices have establish a travel group based on the same origin destination and
time and function as a single cohesive senderrecipient
CV Inspector An application that verifies if the Mobile Device is broadcasting messages to Connected Vehicles
Destination The end point of a travelerrsquos trip
DSRC Dedicated Short-Range Communications a low-latency high-reliability two-way communications tool used for sending transportation safety
messages
Light-Duty Vehicle Of or relating to vehicles that way less than 4000 lbs
Message Type Type of personal safety or personal mobility message that is transmitted based on the technology used and level of coordination available
Personal Mobility Message (PMM)
Similar to PDM message intended for the exchange of mobility messages between individual travelers and vehiclesinfrastructure via
mobile device
Personal Safety Message (PSM)
Similar to BSM message intended to transmit low-latency urgent safety messages between individual travelers and vehiclesinfrastructure via
mobile device
Test Case A set of conditions or variables that a Tester can determine if system meets requirements
Transit Vehicle Large vehicles mainly used for public transportation as well as support services
Transmitting The state in which a traveler has opted in and is sendingreceiving messages via mobile device
Uncoordinated Messages are uncoordinated when travel groups are not established (see coordinated definition)
Wi-Fi Local area wireless technology that allows enabled devices to connect to the Internet
APPENDIX A Comprehensive Data Analysis Tables
US Department of Transportation Office of the Assistant Secretary for Research and Technology
Intelligent Transportation Systems Joint Program Office
Task 8 D2X Hub Proof-of-Concept Test Evaluation Report ndash Final |C-1
ITS Joint Program Office-HOIT 1200 New Jersey Avenue SE
Washington DC 20590
Toll-Free ldquoHelp Linerdquo 866-367-7487 wwwitsdotgov
FHWA-JPO-18-263
- Structure Bookmarks
-
- Sharing Data between Mobile Devices Connected Vehicles and Infrastructure Task 8 D2X Hub Proof-of-Concept Test Evaluation Report wwwitsdotgovindexhtm Final Report mdash October 25 2017 FHWA-JPO-18-623
- Revision History
- Table of Contents
- Chapter 1 Scope
- Chapter 2 Referenced Documents
- Chapter 3 Test Conduct
- Chapter 4 Experimental Analysis Results Summary
- Chapter 5 Experimental Analysis
- Chapter 6 Lessons Learned and Recommendations
- APPENDIX A Comprehensive Data Analysis Tables
- APPENDIX B Acronyms and Abbreviations
- APPENDIX C Terms and Definitions
-

Chapter 5 Experimental Analysis
Table 5-16 Data Usage Statistics
17-Jan 18-Jan 19-Jan 20-Jan 31-Jan 1-Feb Average Maximum
Total Usage (MB) 3805 626 714 2713 4873 1355 984 2713
TMX core usage (MB) 271 450 468 1991 345 90 705 1991
of TMX usage 71 72 66 73 71 66 71 73
Results The hypothesis statement of RSU being able to store all messages received via DSRC is not satisfied at 100 level of confidence due to hardware issues
US Department of Transportation Office of the Assistant Secretary for Research and Technology
Intelligent Transportation Systems Joint Program Office
Task 8 D2X Hub Proof-of-Concept Test Evaluation Report ndash Final | 28
Chapter 6 Lessons Learned and Recommendations
Lessons Learned
The Lessons Learned from the Proof-of-Concept testing are summarized as follows
The ability to reliably generate transmit and receive messages between mobile devices and connected vehicles was demonstrated
The messages to incorporate mobile devices into the C V environment functioned as designed and provided the necessary data for the prototype mobility and safety applications
The prototype safety and mobility software applications functioned well (as designed)
Limitations of technology and hardware issues caused the majority of performance shortfalls
Mixed results were achieved for the various communication methods tested
a Cellular functioned well with our system
b Wi-Fi Direct connectivity was unreliable with our system
c DSRC hardware problems caused communication problems with our system
GPS accuracy limitations were observed as expected
Wi-Fi Direct Connectivity
The connection process was prone to failure at multiple points with no indication to the application why connection failed
TFHRC success rate was achieved by selecting specific devices that worked best for specific roles otherwise a failure rate gt50 would have been expected based on earlier testing
Canvasing of developer community found similar observations no solutions for our system
Wi-Fi Direct connection process requires authorization from the user of the target device in a real world environment such a request would most likely be denied if noticed at all
US Department of Transportation Office of the Assistant Secretary for Research and Technology
Intelligent Transportation Systems Joint Program Office
Task 8 D2X Hub Proof-of-Concept Test Evaluation Report ndash Final | 29
Chapter 6 Lessons Learned and Recommendations
DSRC Hardware
Common Computer Platform (CCP) Pre-production engineering units were used which were determined to have an impedance mismatch between the DSRC chip and RF connector that caused reduction of signal strength
Arada LocoMate ME There were occasional Bluetooth connection failures to mobile devices as well as occasional DSRC transmissionreception failures Longer term it is assumed that DSRC radios will be integrated into smartphones thus obviating the current issues
Recommendations
Based on outcomes of Proof-of-Concept Testing the following prototype system design changes are recommended to be implemented prior to the larger-scale prototype field test
Add Cellular-based communication for Travel Group coordination between mobile devices
New and improved CCP units will be used for the larger-scale field test
For in-vehicle detection use Accelerometer method as the most reliable option
US Department of Transportation Office of the Assistant Secretary for Research and Technology
Intelligent Transportation Systems Joint Program Office
Task 8 D2X Hub Proof-of-Concept Test Evaluation Report ndash Final | 30
APPENDIX A Comprehensive Data Analysis Tables
Note For all the analysis results depicted below the term ldquocheckrdquo refers to the ldquosuccessrdquo of desired action
Table A-1 Complete Data Analysis ndash Hypothesis 1 4 amp 15
Date Time Vehicle Range and Advisory
Distance wrt Speed Speed In
Range Out of
Range Distance
RSU Log PSM
Message RateSec
VEA Log PSM
Message Rate
1312017 101316 IsBsmClose Dist 975500061708885lt
AdvDist 1024200201024 255 X 98 8 10
1312017 101332 IsBsmClose Dist 570797651794001lt
AdvDist 666000057888 173 X 57 6 10
1312017 101340 IsBsmClose Dist 57448436831453lt
AdvDist 601199821728 149 X 57 1 10
1312017 101529 IsBsmClose Dist 975729907380225lt
AdvDist 102240014976 254 X 98 0 10
1312017 101538 IsBsmClose Dist 399317028326919lt
AdvDist 102240014976 250 X 4 1 10
1312017 101553 IsBsmClose Dist 600719107941917lt
AdvDist 70199987616 174 X 60 0 10
1312017 102029 IsBsmClose Dist 944643508928866lt
AdvDist 1008000141984 251 X 95 0 9
1312017 102048 IsBsmClose Dist 592561932680623lt
AdvDist 628200188352 156 X 59 0 9
US Department of Transportation Office of the Assistant Secretary for Research and Technology
Intelligent Transportation Systems Joint Program Office
Task 8 D2X Hub Proof-of-Concept Test Evaluation Report ndash Final | A-1
APPENDIX A Comprehensive Data Analysis Tables
Date Time Vehicle Range and Advisory
Distance wrt Speed Speed In
Range Out of Range Distance
RSU Log PSM
Message RateSec
VEA Log PSM
Message Rate
1312017 102054 IsBsmClose Dist 616348297460404lt
AdvDist 644399845056 160 X 62 3 11
1312017 102105 IsBsmClose Dist 871180496389495lt
AdvDist 1092600137376 247 X 87 4 9
1312017 102206 IsBsmClose Dist 977301610734722lt
AdvDist 1130400006912 295 X 98 0 10
1312017 102228 IsBsmClose Dist 577576034007057lt
AdvDist 60659997552 151 X 58 2 10
1312017 102332 IsBsmClose Dist 101193300977461lt
AdvDist 10386002088 258 X 101 10 10
1312017 102356 IsBsmClose Dist 595641466972855lt
AdvDist 660599904096 164 X 60 6 10
1312017 102623 IsBsmClose Dist 100217014111125lt
AdvDist 1024200201024 253 X 100 7 10
1312017 102650 IsBsmClose Dist 540919707235241lt
AdvDist 887399925984 221 X 54 0 10
1172017 111504 IsBsmClose Dist 100564061581794lt
AdvDist 1169999927712 291 X 101 10 10
1172017 112437 IsBsmClose Dist 992912014791515lt
AdvDist 10386002088 258 X 99 10 10
1172017 112837 IsBsmClose Dist 106684353810469lt
AdvDist 1076400078336 261 X 107 10 10
US Department of Transportation Office of the Assistant Secretary for Research and Technology
Intelligent Transportation Systems Joint Program Office
Task 8 D2X Hub Proof-of-Concept Test Evaluation Report ndash Final | A-2
APPENDIX A Comprehensive Data Analysis Tables
Date Time Vehicle Range and Advisory
Distance wrt Speed Speed In
Range Out of Range Distance
RSU Log PSM
Message RateSec
VEA Log PSM
Message Rate
1172017 113148 IsBsmClose Dist 1124753473133lt AdvDist
1186199986752 268 X 112 10 10
1172017 113332 IsBsmClose Dist 106022149777593lt
AdvDist 1126799904384 260 X 106 10 10
1172017 113336 IsBsmClose Dist 59429630331283lt
AdvDist 1196999892 298 X 59 10 10
1172017 113357 IsBsmClose Dist 657937887214709lt
AdvDist 1193400191808 297 X 66 10 10
1172017 113627 IsBsmClose Dist 965542357439439lt
AdvDist 1080000180864 260 X 97 10 10
1172017 113629 IsBsmClose Dist 821301583410616lt
AdvDist 1074600027072 270 X 82 10 10
1172017 113803 IsBsmClose Dist 994884887192582lt
AdvDist 104580001152 251 X 99 10 10
1172017 113811 IsBsmClose Dist 16809952777894lt
AdvDist 106200007056 257 X 17 10 10
1172017 114114 IsBsmClose Dist 948985801452811lt
AdvDist 986399929152 245 X 95 10 10
1172017 114133 IsBsmClose Dist 141255704529106lt
AdvDist 963000067392 242 X 14 10 10
1172017 114136 IsBsmClose Dist 377627357471613lt
AdvDist 977400075168 243 X 38 10 10
US Department of Transportation Office of the Assistant Secretary for Research and Technology
Intelligent Transportation Systems Joint Program Office
Task 8 D2X Hub Proof-of-Concept Test Evaluation Report ndash Final | A-3
APPENDIX A Comprehensive Data Analysis Tables
Date Time Vehicle Range and Advisory
Distance wrt Speed Speed In
Range Out of Range Distance
RSU Log PSM
Message RateSec
VEA Log PSM
Message Rate
1172017 114403 IsBsmClose Dist 114490146784404lt
AdvDist 1225799907552 266 X 114 10 10
1172017 114415 IsBsmClose Dist 280463490772458lt
AdvDist 71100013248 161 X 28 10 10
1172017 114735 IsBsmClose Dist 102043927314914lt
AdvDist 1040399857728 259 X 102 10 10
1172017 114755 IsBsmClose Dist 185020887331204lt
AdvDist 112499985312 275 X 19 10 10
1192017 35605 IsBsmClose Dist 107928079653642lt
AdvDist 1107000145152 272 X 108 9 9
1192017 35630 IsBsmClose Dist 99759104887202lt
AdvDist 1184399935488 294 X 100 10 10
1192017 35837 IsBsmClose Dist 110291146846666lt
AdvDist 115020016848 286 X 110 10 10
1192017 40057 IsBsmClose Dist 998997459961241lt
AdvDist 1260000076896 313 X 100 10 10
1192017 40300 IsBsmClose Dist 100209094247195lt
AdvDist 106919987328 260 X 100 10 10
1192017 40410 IsBsmClose Dist 100723184500334lt
AdvDist 1097999888832 273 X 101 6 10
1192017 41103 IsBsmClose Dist 977354295877856lt
AdvDist 1008000141984 251 X 98 10 10
US Department of Transportation Office of the Assistant Secretary for Research and Technology
Intelligent Transportation Systems Joint Program Office
Task 8 D2X Hub Proof-of-Concept Test Evaluation Report ndash Final | A-4
APPENDIX A Comprehensive Data Analysis Tables
Date Time Vehicle Range and Advisory
Distance wrt Speed Speed In
Range Out of Range Distance
RSU Log PSM
Message RateSec
VEA Log PSM
Message Rate
1192017 41311 IsBsmClose Dist 10190842581135lt
AdvDist 1040399857728 259 X 102 10 10
1192017 41423 IsBsmClose Dist 995536361906761lt
AdvDist 1009799790912 251 X 100 10 10
1192017 41534 IsBsmClose Dist 10075608603652lt
AdvDist 106919987328 264 X 101 10 10
US Department of Transportation Office of the Assistant Secretary for Research and Technology
Intelligent Transportation Systems Joint Program Office
Task 8 D2X Hub Proof-of-Concept Test Evaluation Report ndash Final | A-5
APPENDIX A Comprehensive Data Analysis Tables
Table A-2 Complete Data Analysis ndash Hypothesis 2
US Department of Transportation Office of the Assistant Secretary for Research and Technology
Intelligent Transportation Systems Joint Program Office
Task 8 D2X Hub Proof-of-Concept Test Evaluation Report ndash Final | A-6
Date Test
Number PSMs Generated by
Trav X and Trav Y Transition to In Group Trav Y PSM Ceased Only Trav X PSM
Received
1312017 TFHRC 1 111116 111240 Check 111305
1312017 TFHRC 2 Grouping Failed Grouping Failed Grouping Failed Grouping Failed
1312017 TFHRC 3 112346 112448 Check 112508
1312017 TFHRC 4 114208 114301 Check 114345
1312017 TFHRC 5 114609 114658 Check 114721
1312017 TFHRC 6 115222 115313 Check 115342
1182017 ATP 1 104400 104527 Check 104601
1182017 ATP 2 105356 105455 Check 105546
1182017 ATP 3 110059 110150 Check 110322
1182017 ATP 4 111222 111310 Check 111329
1182017 ATP 5 111515 111616 Check 111630
1182017 ATP 6 111823 111906 Check 111917
1182017 ATP 7 112116 112157 Check 112209
1182017 ATP 8 112814 112855 Check 112917
1182017 ATP 9 113142 113230 Check 113248
1182017 ATP 10 113501 113545 Check 113608
1192017 ATP 11 44728 44842 Check 45007
1192017 ATP 12 Radio Failure Test Terminated Radio Failure Test Terminated Radio Failure Test Terminated Radio Failure Test Terminated
1192017 ATP 13 45548 45637 Check 45728
1192017 ATP 14 45946 50047 Check 50107
1192017 ATP 15 50353 50444 Check 50513
1192017 ATP 16 50730 50823 Check 50839
APPENDIX A Comprehensive Data Analysis Tables
Table A-3 Complete Data Analysis ndash Hypothesis 3
US Department of Transportation Office of the Assistant Secretary for Research and Technology
Intelligent Transportation Systems Joint Program Office
Task 8 D2X Hub Proof-of-Concept Test Evaluation Report ndash Final | A-7
Date Description
MDEA not in Vehicle
MDEA Transmits
PSMs Time of MDEA
Mode Transition
MDEA Ceases Transmitting
PSMs
1312017 TFHRC 1 Check Check 0443101852 Check
1312017 TFHRC 2 Check Check 0445243056 Check
1312017 TFHRC 3 Check Check 0447569444 Check
1312017 TFHRC 4 Check Check 0448888889 Check
1312017 TFHRC 5 Check Check 045005787 Check
1312017 TFHRC 6 Check Check 0451666667 Check
1172017 ATP 1 Check Check 0501898148 Check
1172017 ATP 2 Check Check 0504201389 Check
1172017 ATP 3 Check Check 0506215278 Check
1172017 ATP 4 Check Check 0507858796 Check
1172017 ATP 5 Check Check 0508981481 Check
1172017 ATP 6 Check Check 0510219907 Check
1172017 ATP 7 Check Check 0511736111 Check
1172017 ATP 8 Check Check 05128125 Check
1172017 ATP 9 Check Check 0513831019 Check
1172017 ATP 10 Check Check 0514884259 Check
1172017 ATP 11 Check Check 0185590278 Check
1172017 ATP 12 Check Check 0187210648 Check
1172017 ATP 13 Check Check 0188425926 Check
1172017 ATP 14 Check Check 0190289352 Check
1172017 ATP 15 Check Check 0191863426 Check
APPENDIX A Comprehensive Data Analysis Tables
Table A-4 Complete Data Analysis ndash Hypothesis 5 (VEA)
Test Number
Type of Message
True Distance (m)
Speed (MPH)
Expected Distance (m)
Difference (m)
TFHRC1
Advisory 7584 2471 9942 2358
Alert 5545 2523 5780 235
Warning 4874 2498 4910 036
TFHRC2
Advisory 8552 2595 10441 1889
Alert 5167 2461 5588 421
Warning 4515 2433 4751 236
TFHRC3
Advisory 7876 2381 9580 1704
Alert 5827 2590 5989 162
Warning 5124 2624 5222 098
TFHRC4
Advisory 7529 2818 11338 3809
Alert 6047 2744 6482 435
Warning 5323 2714 5450 127
TFHRC5
Advisory 9292 2404 9672 380
Alert 5350 2423 5472 122
Warning 4081 2352 4556 475
ATP1
Advisory 000 000
Alert 000 000
Warning 000 000
ATP2
Advisory 5787 1644 6614 827
Alert 3074 1640 3289 215
Warning 2627 1640 2947 320
ATP3
Advisory 4204 1685 6779 2575
Alert 3300 1672 3370 070
Warning 2854 1658 2985 131
ATP4
Advisory 4296 1753 7053 2757
Alert 3346 1791 3679 333
Warning 2871 1755 3194 323
ATP5
Advisory 000 000
Alert 000 000
Warning 1069 1706 3088 2019
ATP6
Advisory 3632 1640 6598 2966
Alert 000 000
Warning 2770 1594 2850 080
US Department of Transportation Office of the Assistant Secretary for Research and Technology
Intelligent Transportation Systems Joint Program Office
Task 8 D2X Hub Proof-of-Concept Test Evaluation Report ndash Final | A-8
APPENDIX A Comprehensive Data Analysis Tables
Test Number
Type of Message
True Distance (m)
Speed (MPH)
Expected Distance (m)
Difference (m)
ATP7
Advisory 000 000
Alert 000 000
Warning 1919 1887 3483 1564
ATP8
Advisory 4492 1741 7005 2513
Alert 3113 1687 3409 296
Warning 2661 1680 3032 371
ATP9
Advisory 4694 1628 6550 1856
Alert 2991 1570 3113 122
Warning 2572 1549 2756 184
ATP10
Advisory 000 000
Alert 000 000
Warning 650 2505 4927 4277
ATP11
Advisory 000 000
Alert 000 000
Warning 1914 2398 4666 2752
ATP12
Advisory 000 000
Alert 000 000
Warning 460 2293 4415 3955
ATP13
Advisory 000 000
Alert 000 000
Warning 2732 2535 5001 2269
ATP14
Advisory 000 000
Alert 000 000
Warning 2358 2361 4577 2219
ATP15
Advisory 000 000
Alert 000 000
Warning 1107 2459 4814 3707
ATP16
Advisory 5668 1982 7974 2306
Alert 000 000
Warning 1502 1906 3525 2023
ATP17
Advisory 000 000
Alert 000 000
Warning 3183 2420 4720 1537
US Department of Transportation Office of the Assistant Secretary for Research and Technology
Intelligent Transportation Systems Joint Program Office
Task 8 D2X Hub Proof-of-Concept Test Evaluation Report ndash Final | A-9
Table A-5 Complete Data Analysis ndash Hypothesis 6 (MDEA)
Test Number
Type of Message
True Distance (m)
Speed (MPH)
Expected Distance (m)
Difference (m)
TFHRC1
Advisory 8756 2290 9213 457
Alert 5320 2509 5736 416
Warning 4651 2487 4883 232
TFHRC2
Advisory 9928 2514 10115 187
Alert 5276 2447 5546 270
Warning 4624 2415 4707 084
TFHRC3
Advisory 8952 2304 9270 318
Alert 5595 2603 6030 436
Warning 4890 2617 5205 315
TFHRC4
Advisory 9752 2514 10115 363
Alert 6290 2769 6564 274
Warning 4844 2693 5396 552
TFHRC5
Advisory 9613 2406 9680 067
Alert 5242 2420 5463 221
Warning 4080 2357 4568 488
ATP1
Advisory 5938 2183 8783 2845
Alert 4314 2120 4580 266
Warning 3644 2111 3989 345
ATP2
Advisory 6452 1641 6602 150
Alert 3296 1691 3419 123
Warning 2600 1601 2865 265
ATP3
Advisory 6212 1628 6550 338
Alert 3200 1655 3327 127
Warning 2707 1641 2949 242
ATP4
Advisory 6420 1646 6622 202
Alert 3300 1780 3650 350
Warning 2878 1704 3084 206
ATP5
Advisory 6673 1677 6747 074
Alert 3400 1847 3828 428
Warning 2972 1807 3307 335
ATP6
Advisory 6100 1628 6550 450
Alert 3100 1637 3281 181
Warning 2500 1597 2857 357
APPENDIX A Comprehensive Data Analysis Tables
US Department of Transportation Office of the Assistant Secretary for Research and Technology
Intelligent Transportation Systems Joint Program Office
Task 8 D2X Hub Proof-of-Concept Test Evaluation Report ndash Final | A-10
APPENDIX A Comprehensive Data Analysis Tables
Test Number
Type of Message
True Distance (m)
Speed (MPH)
Expected Distance (m)
Difference (m)
ATP7
Advisory 7500 1972 7934 434
Alert 3882 1914 4008 126
Warning 3400 1946 3614 214
ATP8
Advisory 6659 1744 7017 358
Alert 3263 1682 3396 133
Warning 2900 1682 3037 137
ATP9
Advisory 6605 1659 6675 070
Alert 2900 1556 3078 178
Warning 2365 1561 2781 416
ATP10
Advisory 9214 2491 10022 808
Alert 5859 2688 6301 442
Warning 5200 2644 5273 073
ATP11
Advisory 8485 2487 10006 1521
Alert 5376 2487 5668 292
Warning 4716 2483 4873 157
ATP12
Advisory 9001 2433 9789 788
Alert 5395 2420 5463 068
Warning 4103 2330 4503 400
ATP13
Advisory 8615 2559 10296 1681
Alert 000 000 000 000
Warning 4930 2581 5115 185
ATP14
Advisory 6119 2491 10022 3903
Alert 5500 2491 5681 181
Warning 3800 2402 4676 876
ATP15
Advisory 7546 2603 10473 2927
Alert 6000 2661 6215 215
Warning 3100 2603 5170 2070
ATP16
Advisory 7931 2089 8405 474
Alert 3995 1950 4106 111
Warning 3500 1923 3563 063
ATP17
Advisory 8243 2049 8244 001
Alert 5260 2465 5601 341
Warning 4718 2438 4763 045
US Department of Transportation Office of the Assistant Secretary for Research and Technology
Intelligent Transportation Systems Joint Program Office
Task 8 D2X Hub Proof-of-Concept Test Evaluation Report ndash Final | A-11
Table A-6 Complete Data Analysis ndash Hypothesis 7
Date Test
Number
User State Change Is
Safe Icon False
Properly Processed
User State Change Is
Safe Icon True
Properly Processed
1312017 TFHRC 1 111438 X 111504 X
1312017 TFHRC 3 112533 X 112619 X
1312017 TFHRC 4 114400 X 114438 X
1312017 TFHRC 5 114801 X 114829 X
1312017 TFHRC 6 115408 X 115444 X
1182017 ATP 1 105056 X 105116 X
1182017 ATP 2 105622 X 105656 X
1182017 ATP 3 110348 X 110436 X
1182017 ATP 4 111355 X 111417 X
1182017 ATP 5 111655 X 111717 X
1182017 ATP 6 111947 X 112007 X
1182017 ATP 7 112235 X 112305 X
1182017 ATP 8 112937 X 113013 X
1182017 ATP 9 113313 X 113353 X
1182017 ATP 10 113636 X 113708 X
1192017 ATP 11 45035 X 45057 X
1192017 ATP 13 45806 X 45828 X
1192017 ATP 14 50144 X 50202 X
1192017 ATP 15 50542 X 50600 X
1192017 ATP 16 50903 X 50929 X
APPENDIX A Comprehensive Data Analysis Tables
US Department of Transportation Office of the Assistant Secretary for Research and Technology
Intelligent Transportation Systems Joint Program Office
Task 8 D2X Hub Proof-of-Concept Test Evaluation Report ndash Final | A-12
APPENDIX A Comprehensive Data Analysis Tables
Table A-7 Complete Data Analysis ndash Hy pothesis 8 amp 9
US Department of Transportation Office of the Assistant Secretary for Research and Technology
Intelligent Transportation Systems Joint Program Office
Task 8 D2X Hub Proof-of-Concept Test Evaluation Report ndash Final | A-13
Test Number
Analyze the percentage of PMM messages properly processed by
in-vehicle devices Analyze the percentage of PMM-RSP messages
properly processed by mobile devices
Analyze the percentage of PMM-Cancel messages
properly processed by in-vehicle devices
MDEA Log ndash PMM Send
occurrence
MDEA Log ndash
PMM contents
VEA Log ndash PMM
Receive occurrence
VEA Log ndash Driver
acceptance
VEA Log ndash PMM-RSP
Send occurrence
MDEA Log ndash PMM-RSP
Receive occurrence
MDEA Log ndash Coordination
Status
MDEA Log ndash PMM-
Cancel Sent Occurrence
VEA Log ndash PMM-
Cancel Received
Occurrence
TFHRC 1 Check All Present Check Check Check Check Check Check Check
TFHRC 2 Check All Present Check Check Check Check Check Check Check
TFHRC 3 Check All Present Check Check Check Check Check Check Check
TFHRC 4 Check All Present Check Check Check Check Check Check Check
TFHRC 5 Check All Present Check Check Check Check Check Check Check
ATP 1 Check All Present Check Check Check Check Check Check Check
ATP 2 Check All Present Check Check Check Check Check Check Check
ATP 3 Check All Present Check Check Check Check Check Check Check
ATP 4 Check All Present Check Check Check Check Check Check Check
ATP 5 Check All Present Check Check Check Check Check Check Check
ATP 6 Check All Present Check Check Check Check Check Check Check
ATP 7 Check All Present Check Check Check Check Check Check Check
ATP 8 Check All Present Check Check Check Check Check Check Check
ATP 9 Check All Present Check Check Check Check Check Check Check
ATP 10 Check All Present Check Check Check Check Check Check Check
APPENDIX A Comprehensive Data Analysis Tables
Test Number
Analyze the percentage of PMM messages properly processed by
in-vehicle devices Analyze the percentage of PMM-RSP messages
properly processed by mobile devices
Analyze the percentage of PMM-Cancel messages
properly processed by in-vehicle devices
MDEA Log ndash PMM Send occurrence
MDEA Log ndash PMM
contents
VEA Log ndash PMM
Receive occurrence
VEA Log ndash Driver
acceptance
VEA Log ndash PMM-RSP
Send occurrence
MDEA Log ndash PMM-RSP
Receive occurrence
MDEA Log ndash Coordination
Status
MDEA Log ndash PMM-
Cancel Sent Occurrence
VEA Log ndash PMM-
Cancel Received
Occurrence
ATP 11 Check All Present Check Check Check Check Check Check Check
ATP 12 Check All Present Check Check Check Check Check Check Check
ATP 13 Check All Present Check Check Check Check Check Check Check
ATP 14 Check All Present Check Check Check Check Check Check Check
ATP 15 Check All Present Check Check Check Check Check Check Check
ATP 16 Check All Present Check Check Check Check Check Check Check
ATP 17 Check All Present Check Check Check Check Check Check Check
US Department of Transportation Office of the Assistant Secretary for Research and Technology
Intelligent Transportation Systems Joint Program Office
Task 8 D2X Hub Proof-of-Concept Test Evaluation Report ndash Final | A-14
Table A-8 Complete Data Analysis ndash Hy pothesis 10
Date Test Number
Analyze the Success Rate of Receiving a PMM-Arrive Message
VEA Log ndash PMM-ARRIVE Send Occurrence MDEA Log ndash PMM-ARRIVE Receive Occurrence
1312017 TFHRC 1 Fail Fail
1312017 TFHRC 2 Check Check
1312017 TFHRC 3 Check Check
1312017 TFHRC 4 Check Check
1312017 TFHRC 5 Check Check
1312017 TFHRC 6 Check Check
1312017 TFHRC 7 Check Check
1182017 ATP 1 Not Available Check
1182017 ATP 2 Not Available Check
1182017 ATP 3 Not Available Check
1182017 ATP 4 Not Available Check
1182017 ATP 5 Not Available Check
1182017 ATP 6 Not Available Check
1182017 ATP 7 Not Available Check
1182017 ATP 8 Not Available Check
1182017 ATP 9 Not Available Check
1182017 ATP 10 Not Available Check
1202017 ATP 11 Check Check
1202017 ATP 12 Check Check
1202017 ATP 13 Check Check
1202017 ATP 14 Check Check
1202017 ATP 15 Check Check
APPENDIX A Comprehensive Data Analysis Tables
US Department of Transportation Office of the Assistant Secretary for Research and Technology
Intelligent Transportation Systems Joint Program Office
Task 8 D2X Hub Proof-of-Concept Test Evaluation Report ndash Final | A-15
APPENDIX A Comprehensive Data Analysis Tables
Table A-9 Complete Data Analysis ndash Hypothesis 13 (Part A)
US Department of Transportation Office of the Assistant Secretary for Research and Technology
Intelligent Transportation Systems Joint Program Office
Task 8 D2X Hub Proof-of-Concept Test Evaluation Report ndash Final | A-16
Test Number
Coordination Request Sent
by Y
Coordination Request
Received by X
Request Confirmed
by X Confirmation Received by Y
Coordination Request Sent
by Z
Coordination Request
Received by X
Request Confirmed
by X Confirmation Received by Z
Coordination Heart Beat
Transmitted by Y amp Z
Heart Beat Response received
by X
Ride Arrived
Messages
TFHRC 1
Fail Traveler Y could not join the ad-hoc travel group
TFHRC 2
Check check check check 41047 check check check check check 41303
TFHRC 3
Check Check Check Check Check Check Check Check Check Check Check
TFHRC 4
Fail Traveler Y could not join the ad-hoc travel group
TFHRC 5
Check Check Check Check Check Check Check Check Check Check Check
TFHRC 6
Check Check Check Check Check Check Check Check Check Check Check
TFHRC 7
Check Check Check Check Check Check Check Check Check Check Check
TFHRC 8
Check Check Check Check Check Check Check Check Check Check Check
TFHRC 9
Check Check Check Check Check Check Check Check Check Check Check
TFHRC 10
Check Check Check Check Check Check Check Check Check Check Check
ATP 1 Check Check Check Check Check Check Check Check Check Check Check
ATP 2 Check Check Check Check Check Check Check Check Check Check Check
Test Number
Coordination Request Sent
by Y
Coordination Request
Received by X
Request Confirmed
by X Confirmation Received by Y
Coordination Request Sent
by Z
Coordination Request
Received by X
Request Confirmed
by X Confirmation Received by Z
Coordination Heart Beat
Transmitted by Y amp Z
Heart Beat Response received
by X
Ride Arrived
Messages
ATP 3 Check Check Check Check Check Check Check Check Check Check Check
ATP 4 Check Check Check Check Check Check Check Check Check Check Check
ATP 5 Check Check Check Check Check Check Check Check Check Check Check
ATP 6 Check Check Check Check Check Check Check Check Check Check Check
ATP 7 Check Check Check Check Check Check Check Check Check Check No ride
arrives received
ATP 8 Check Check Check Check Check Check Check Check Check Check Check
ATP 9 Check Check Check Check Check Check Check Check Check Check No ride
arrives received
ATP 10 Check Check Check Check Check Check Check Check Check Check Check
ATP 11 Check Check Check Check Check Check Check Check Check Check Check
ATP 12 Check Check Check Check Check Check Check Check Check Check No ride
arrives received
ATP 13 Check Check Check Check Check Check Check Check Check Check Check
ATP 14 Check Check Check Check Check Check Check Check Check Check Check
ATP 15 Check Check Check Check Check Check Check Check Check Check Check
APPENDIX A Comprehensive Data Analysis Tables
US Department of Transportation Office of the Assistant Secretary for Research and Technology
Intelligent Transportation Systems Joint Program Office
Task 8 D2X Hub Proof-of-Concept Test Evaluation Report ndash Final | A-17
APPENDIX A Comprehensive Data Analysis Tables
Table A-10 Complete Data Analysis ndash Hypothesis 13 (Part B)
US Department of Transportation Office of the Assistant Secretary for Research and Technology
Intelligent Transportation Systems Joint Program Office
Task 8 D2X Hub Proof-of-Concept Test Evaluation Report ndash Final | A-18
Test Number Coordination Cancel by
Walking Away Coordination Cancel by
Manual Request Disband Group after
Entering into Vehicle
TFHRC 1 Check This step not tested on this day
TFHRC 2 Check This step not tested on this day
TFHRC 3 Check This step not tested on this day
TFHRC 4 Check This step not tested on this day
TFHRC 5 Check This step not tested on this day
TFHRC 6 This step not tested on this day Check Check
TFHRC 7 This step not tested on this day Check Check
TFHRC 8 This step not tested on this day Check Check
TFHRC 9 This step not tested on this day Check Check
TFHRC 10 This step not tested on this day Check Check
ATP 1 Check Check Check
ATP 2 Check Check Check
ATP 3 Check Check Check
ATP 4 Check Check Check
ATP 5 Check Check Check
ATP 6 Check Check Check
ATP 7 Check Check Check
ATP 8 Check Check Check
ATP 9 Check Check Check
APPENDIX A Comprehensive Data Analysis Tables
Test Number Coordination Cancel by
Walking Away Coordination Cancel by
Manual Request Disband Group after Entering into Vehicle
ATP 10 Check Check Check
ATP 11 Fail Could not cancel by distance Check Check
ATP 12 Check Check Check
ATP 13 Fail Could not cancel by distance Check Check
ATP 14 Check Check Check
ATP 15 Check Check Check
US Department of Transportation Office of the Assistant Secretary for Research and Technology
Intelligent Transportation Systems Joint Program Office
Task 8 D2X Hub Proof-of-Concept Test Evaluation Report ndash Final | A-19
APPENDIX A Comprehensive Data Analysis Tables
APPENDIX B Acronyms and Abbreviations
ATG Ad-Hoc Travel Group
ATP Acceptance Test Plan
BSM Basic Safety Message
CCP Common Computing Platform
CV Connected Vehicle
DSRC Dedicated Short Range Communications
EPS Experimental Prototype System
FHWA Federal Highway Administration
FR Functional Requirement
ITS Intelligent Transportation Systems
LDV Light-Duty Vehicle
MAP Map Data
MDEA Mobile Device Experimental Application
MGL Message Logging
OBU On-board Unit
PMM Personal Mobility Message
PMM-ARRIVE Personal Mobility Message Arrival Message
PMM-CANCEL Personal Mobility Message Cancel Message
PMM-RSP Personal Mobility Message Response Message
PR Performance Requirement
PSM Personal Safety Message
REA Roadside Experimental Application
RSU Roadside Unit
SFY Safety
SIR System Interface Requirement
SMP SPaT and MAP
SPaT Signal Phasing and Timing
SyRS System Requirements Specifications
TFHRC Turner-Fairbank Highway Research Center
US DOT US Department of Transportation
US Department of Transportation Office of the Assistant Secretary for Research and Technology
Intelligent Transportation Systems Joint Program Office
Task 8 D2X Hub Proof-of-Concept Test Evaluation Report ndash Final |B-1
VEA Vehicle Experimental Application
Wi-Fi Wireless Fidelity
APPENDIX B Acronyms and Abbreviations
US Department of Transportation Office of the Assistant Secretary for Research and Technology
Intelligent Transportation Systems Joint Program Office
Task 8 D2X Hub Proof-of-Concept Test Evaluation Report ndash Final | B-2
APPENDIX C Terms and Definitions
Basic Safety Message (BSM)
Connected vehicle message type which contains vehicle safety-related information that is broadcast to surrounding vehicles
Bluetooth Short range wireless technology used to exchange data between enabled devices
Cellular Uses short-range radio stations to cover areas of communication
Connected Vehicle A vehicle that can communicate with other vehicles and infrastructure via communication media such as DSRC Wi-Fi cellular or Bluetooth
Coordinated Messages are coordinated when two or more mobile devices have establish a travel group based on the same origin destination and
time and function as a single cohesive senderrecipient
CV Inspector An application that verifies if the Mobile Device is broadcasting messages to Connected Vehicles
Destination The end point of a travelerrsquos trip
DSRC Dedicated Short-Range Communications a low-latency high-reliability two-way communications tool used for sending transportation safety
messages
Light-Duty Vehicle Of or relating to vehicles that way less than 4000 lbs
Message Type Type of personal safety or personal mobility message that is transmitted based on the technology used and level of coordination available
Personal Mobility Message (PMM)
Similar to PDM message intended for the exchange of mobility messages between individual travelers and vehiclesinfrastructure via
mobile device
Personal Safety Message (PSM)
Similar to BSM message intended to transmit low-latency urgent safety messages between individual travelers and vehiclesinfrastructure via
mobile device
Test Case A set of conditions or variables that a Tester can determine if system meets requirements
Transit Vehicle Large vehicles mainly used for public transportation as well as support services
Transmitting The state in which a traveler has opted in and is sendingreceiving messages via mobile device
Uncoordinated Messages are uncoordinated when travel groups are not established (see coordinated definition)
Wi-Fi Local area wireless technology that allows enabled devices to connect to the Internet
APPENDIX A Comprehensive Data Analysis Tables
US Department of Transportation Office of the Assistant Secretary for Research and Technology
Intelligent Transportation Systems Joint Program Office
Task 8 D2X Hub Proof-of-Concept Test Evaluation Report ndash Final |C-1
ITS Joint Program Office-HOIT 1200 New Jersey Avenue SE
Washington DC 20590
Toll-Free ldquoHelp Linerdquo 866-367-7487 wwwitsdotgov
FHWA-JPO-18-263
- Structure Bookmarks
-
- Sharing Data between Mobile Devices Connected Vehicles and Infrastructure Task 8 D2X Hub Proof-of-Concept Test Evaluation Report wwwitsdotgovindexhtm Final Report mdash October 25 2017 FHWA-JPO-18-623
- Revision History
- Table of Contents
- Chapter 1 Scope
- Chapter 2 Referenced Documents
- Chapter 3 Test Conduct
- Chapter 4 Experimental Analysis Results Summary
- Chapter 5 Experimental Analysis
- Chapter 6 Lessons Learned and Recommendations
- APPENDIX A Comprehensive Data Analysis Tables
- APPENDIX B Acronyms and Abbreviations
- APPENDIX C Terms and Definitions
-

Chapter 6 Lessons Learned and Recommendations
DSRC Hardware
Common Computer Platform (CCP) Pre-production engineering units were used which were determined to have an impedance mismatch between the DSRC chip and RF connector that caused reduction of signal strength
Arada LocoMate ME There were occasional Bluetooth connection failures to mobile devices as well as occasional DSRC transmissionreception failures Longer term it is assumed that DSRC radios will be integrated into smartphones thus obviating the current issues
Recommendations
Based on outcomes of Proof-of-Concept Testing the following prototype system design changes are recommended to be implemented prior to the larger-scale prototype field test
Add Cellular-based communication for Travel Group coordination between mobile devices
New and improved CCP units will be used for the larger-scale field test
For in-vehicle detection use Accelerometer method as the most reliable option
US Department of Transportation Office of the Assistant Secretary for Research and Technology
Intelligent Transportation Systems Joint Program Office
Task 8 D2X Hub Proof-of-Concept Test Evaluation Report ndash Final | 30
APPENDIX A Comprehensive Data Analysis Tables
Note For all the analysis results depicted below the term ldquocheckrdquo refers to the ldquosuccessrdquo of desired action
Table A-1 Complete Data Analysis ndash Hypothesis 1 4 amp 15
Date Time Vehicle Range and Advisory
Distance wrt Speed Speed In
Range Out of
Range Distance
RSU Log PSM
Message RateSec
VEA Log PSM
Message Rate
1312017 101316 IsBsmClose Dist 975500061708885lt
AdvDist 1024200201024 255 X 98 8 10
1312017 101332 IsBsmClose Dist 570797651794001lt
AdvDist 666000057888 173 X 57 6 10
1312017 101340 IsBsmClose Dist 57448436831453lt
AdvDist 601199821728 149 X 57 1 10
1312017 101529 IsBsmClose Dist 975729907380225lt
AdvDist 102240014976 254 X 98 0 10
1312017 101538 IsBsmClose Dist 399317028326919lt
AdvDist 102240014976 250 X 4 1 10
1312017 101553 IsBsmClose Dist 600719107941917lt
AdvDist 70199987616 174 X 60 0 10
1312017 102029 IsBsmClose Dist 944643508928866lt
AdvDist 1008000141984 251 X 95 0 9
1312017 102048 IsBsmClose Dist 592561932680623lt
AdvDist 628200188352 156 X 59 0 9
US Department of Transportation Office of the Assistant Secretary for Research and Technology
Intelligent Transportation Systems Joint Program Office
Task 8 D2X Hub Proof-of-Concept Test Evaluation Report ndash Final | A-1
APPENDIX A Comprehensive Data Analysis Tables
Date Time Vehicle Range and Advisory
Distance wrt Speed Speed In
Range Out of Range Distance
RSU Log PSM
Message RateSec
VEA Log PSM
Message Rate
1312017 102054 IsBsmClose Dist 616348297460404lt
AdvDist 644399845056 160 X 62 3 11
1312017 102105 IsBsmClose Dist 871180496389495lt
AdvDist 1092600137376 247 X 87 4 9
1312017 102206 IsBsmClose Dist 977301610734722lt
AdvDist 1130400006912 295 X 98 0 10
1312017 102228 IsBsmClose Dist 577576034007057lt
AdvDist 60659997552 151 X 58 2 10
1312017 102332 IsBsmClose Dist 101193300977461lt
AdvDist 10386002088 258 X 101 10 10
1312017 102356 IsBsmClose Dist 595641466972855lt
AdvDist 660599904096 164 X 60 6 10
1312017 102623 IsBsmClose Dist 100217014111125lt
AdvDist 1024200201024 253 X 100 7 10
1312017 102650 IsBsmClose Dist 540919707235241lt
AdvDist 887399925984 221 X 54 0 10
1172017 111504 IsBsmClose Dist 100564061581794lt
AdvDist 1169999927712 291 X 101 10 10
1172017 112437 IsBsmClose Dist 992912014791515lt
AdvDist 10386002088 258 X 99 10 10
1172017 112837 IsBsmClose Dist 106684353810469lt
AdvDist 1076400078336 261 X 107 10 10
US Department of Transportation Office of the Assistant Secretary for Research and Technology
Intelligent Transportation Systems Joint Program Office
Task 8 D2X Hub Proof-of-Concept Test Evaluation Report ndash Final | A-2
APPENDIX A Comprehensive Data Analysis Tables
Date Time Vehicle Range and Advisory
Distance wrt Speed Speed In
Range Out of Range Distance
RSU Log PSM
Message RateSec
VEA Log PSM
Message Rate
1172017 113148 IsBsmClose Dist 1124753473133lt AdvDist
1186199986752 268 X 112 10 10
1172017 113332 IsBsmClose Dist 106022149777593lt
AdvDist 1126799904384 260 X 106 10 10
1172017 113336 IsBsmClose Dist 59429630331283lt
AdvDist 1196999892 298 X 59 10 10
1172017 113357 IsBsmClose Dist 657937887214709lt
AdvDist 1193400191808 297 X 66 10 10
1172017 113627 IsBsmClose Dist 965542357439439lt
AdvDist 1080000180864 260 X 97 10 10
1172017 113629 IsBsmClose Dist 821301583410616lt
AdvDist 1074600027072 270 X 82 10 10
1172017 113803 IsBsmClose Dist 994884887192582lt
AdvDist 104580001152 251 X 99 10 10
1172017 113811 IsBsmClose Dist 16809952777894lt
AdvDist 106200007056 257 X 17 10 10
1172017 114114 IsBsmClose Dist 948985801452811lt
AdvDist 986399929152 245 X 95 10 10
1172017 114133 IsBsmClose Dist 141255704529106lt
AdvDist 963000067392 242 X 14 10 10
1172017 114136 IsBsmClose Dist 377627357471613lt
AdvDist 977400075168 243 X 38 10 10
US Department of Transportation Office of the Assistant Secretary for Research and Technology
Intelligent Transportation Systems Joint Program Office
Task 8 D2X Hub Proof-of-Concept Test Evaluation Report ndash Final | A-3
APPENDIX A Comprehensive Data Analysis Tables
Date Time Vehicle Range and Advisory
Distance wrt Speed Speed In
Range Out of Range Distance
RSU Log PSM
Message RateSec
VEA Log PSM
Message Rate
1172017 114403 IsBsmClose Dist 114490146784404lt
AdvDist 1225799907552 266 X 114 10 10
1172017 114415 IsBsmClose Dist 280463490772458lt
AdvDist 71100013248 161 X 28 10 10
1172017 114735 IsBsmClose Dist 102043927314914lt
AdvDist 1040399857728 259 X 102 10 10
1172017 114755 IsBsmClose Dist 185020887331204lt
AdvDist 112499985312 275 X 19 10 10
1192017 35605 IsBsmClose Dist 107928079653642lt
AdvDist 1107000145152 272 X 108 9 9
1192017 35630 IsBsmClose Dist 99759104887202lt
AdvDist 1184399935488 294 X 100 10 10
1192017 35837 IsBsmClose Dist 110291146846666lt
AdvDist 115020016848 286 X 110 10 10
1192017 40057 IsBsmClose Dist 998997459961241lt
AdvDist 1260000076896 313 X 100 10 10
1192017 40300 IsBsmClose Dist 100209094247195lt
AdvDist 106919987328 260 X 100 10 10
1192017 40410 IsBsmClose Dist 100723184500334lt
AdvDist 1097999888832 273 X 101 6 10
1192017 41103 IsBsmClose Dist 977354295877856lt
AdvDist 1008000141984 251 X 98 10 10
US Department of Transportation Office of the Assistant Secretary for Research and Technology
Intelligent Transportation Systems Joint Program Office
Task 8 D2X Hub Proof-of-Concept Test Evaluation Report ndash Final | A-4
APPENDIX A Comprehensive Data Analysis Tables
Date Time Vehicle Range and Advisory
Distance wrt Speed Speed In
Range Out of Range Distance
RSU Log PSM
Message RateSec
VEA Log PSM
Message Rate
1192017 41311 IsBsmClose Dist 10190842581135lt
AdvDist 1040399857728 259 X 102 10 10
1192017 41423 IsBsmClose Dist 995536361906761lt
AdvDist 1009799790912 251 X 100 10 10
1192017 41534 IsBsmClose Dist 10075608603652lt
AdvDist 106919987328 264 X 101 10 10
US Department of Transportation Office of the Assistant Secretary for Research and Technology
Intelligent Transportation Systems Joint Program Office
Task 8 D2X Hub Proof-of-Concept Test Evaluation Report ndash Final | A-5
APPENDIX A Comprehensive Data Analysis Tables
Table A-2 Complete Data Analysis ndash Hypothesis 2
US Department of Transportation Office of the Assistant Secretary for Research and Technology
Intelligent Transportation Systems Joint Program Office
Task 8 D2X Hub Proof-of-Concept Test Evaluation Report ndash Final | A-6
Date Test
Number PSMs Generated by
Trav X and Trav Y Transition to In Group Trav Y PSM Ceased Only Trav X PSM
Received
1312017 TFHRC 1 111116 111240 Check 111305
1312017 TFHRC 2 Grouping Failed Grouping Failed Grouping Failed Grouping Failed
1312017 TFHRC 3 112346 112448 Check 112508
1312017 TFHRC 4 114208 114301 Check 114345
1312017 TFHRC 5 114609 114658 Check 114721
1312017 TFHRC 6 115222 115313 Check 115342
1182017 ATP 1 104400 104527 Check 104601
1182017 ATP 2 105356 105455 Check 105546
1182017 ATP 3 110059 110150 Check 110322
1182017 ATP 4 111222 111310 Check 111329
1182017 ATP 5 111515 111616 Check 111630
1182017 ATP 6 111823 111906 Check 111917
1182017 ATP 7 112116 112157 Check 112209
1182017 ATP 8 112814 112855 Check 112917
1182017 ATP 9 113142 113230 Check 113248
1182017 ATP 10 113501 113545 Check 113608
1192017 ATP 11 44728 44842 Check 45007
1192017 ATP 12 Radio Failure Test Terminated Radio Failure Test Terminated Radio Failure Test Terminated Radio Failure Test Terminated
1192017 ATP 13 45548 45637 Check 45728
1192017 ATP 14 45946 50047 Check 50107
1192017 ATP 15 50353 50444 Check 50513
1192017 ATP 16 50730 50823 Check 50839
APPENDIX A Comprehensive Data Analysis Tables
Table A-3 Complete Data Analysis ndash Hypothesis 3
US Department of Transportation Office of the Assistant Secretary for Research and Technology
Intelligent Transportation Systems Joint Program Office
Task 8 D2X Hub Proof-of-Concept Test Evaluation Report ndash Final | A-7
Date Description
MDEA not in Vehicle
MDEA Transmits
PSMs Time of MDEA
Mode Transition
MDEA Ceases Transmitting
PSMs
1312017 TFHRC 1 Check Check 0443101852 Check
1312017 TFHRC 2 Check Check 0445243056 Check
1312017 TFHRC 3 Check Check 0447569444 Check
1312017 TFHRC 4 Check Check 0448888889 Check
1312017 TFHRC 5 Check Check 045005787 Check
1312017 TFHRC 6 Check Check 0451666667 Check
1172017 ATP 1 Check Check 0501898148 Check
1172017 ATP 2 Check Check 0504201389 Check
1172017 ATP 3 Check Check 0506215278 Check
1172017 ATP 4 Check Check 0507858796 Check
1172017 ATP 5 Check Check 0508981481 Check
1172017 ATP 6 Check Check 0510219907 Check
1172017 ATP 7 Check Check 0511736111 Check
1172017 ATP 8 Check Check 05128125 Check
1172017 ATP 9 Check Check 0513831019 Check
1172017 ATP 10 Check Check 0514884259 Check
1172017 ATP 11 Check Check 0185590278 Check
1172017 ATP 12 Check Check 0187210648 Check
1172017 ATP 13 Check Check 0188425926 Check
1172017 ATP 14 Check Check 0190289352 Check
1172017 ATP 15 Check Check 0191863426 Check
APPENDIX A Comprehensive Data Analysis Tables
Table A-4 Complete Data Analysis ndash Hypothesis 5 (VEA)
Test Number
Type of Message
True Distance (m)
Speed (MPH)
Expected Distance (m)
Difference (m)
TFHRC1
Advisory 7584 2471 9942 2358
Alert 5545 2523 5780 235
Warning 4874 2498 4910 036
TFHRC2
Advisory 8552 2595 10441 1889
Alert 5167 2461 5588 421
Warning 4515 2433 4751 236
TFHRC3
Advisory 7876 2381 9580 1704
Alert 5827 2590 5989 162
Warning 5124 2624 5222 098
TFHRC4
Advisory 7529 2818 11338 3809
Alert 6047 2744 6482 435
Warning 5323 2714 5450 127
TFHRC5
Advisory 9292 2404 9672 380
Alert 5350 2423 5472 122
Warning 4081 2352 4556 475
ATP1
Advisory 000 000
Alert 000 000
Warning 000 000
ATP2
Advisory 5787 1644 6614 827
Alert 3074 1640 3289 215
Warning 2627 1640 2947 320
ATP3
Advisory 4204 1685 6779 2575
Alert 3300 1672 3370 070
Warning 2854 1658 2985 131
ATP4
Advisory 4296 1753 7053 2757
Alert 3346 1791 3679 333
Warning 2871 1755 3194 323
ATP5
Advisory 000 000
Alert 000 000
Warning 1069 1706 3088 2019
ATP6
Advisory 3632 1640 6598 2966
Alert 000 000
Warning 2770 1594 2850 080
US Department of Transportation Office of the Assistant Secretary for Research and Technology
Intelligent Transportation Systems Joint Program Office
Task 8 D2X Hub Proof-of-Concept Test Evaluation Report ndash Final | A-8
APPENDIX A Comprehensive Data Analysis Tables
Test Number
Type of Message
True Distance (m)
Speed (MPH)
Expected Distance (m)
Difference (m)
ATP7
Advisory 000 000
Alert 000 000
Warning 1919 1887 3483 1564
ATP8
Advisory 4492 1741 7005 2513
Alert 3113 1687 3409 296
Warning 2661 1680 3032 371
ATP9
Advisory 4694 1628 6550 1856
Alert 2991 1570 3113 122
Warning 2572 1549 2756 184
ATP10
Advisory 000 000
Alert 000 000
Warning 650 2505 4927 4277
ATP11
Advisory 000 000
Alert 000 000
Warning 1914 2398 4666 2752
ATP12
Advisory 000 000
Alert 000 000
Warning 460 2293 4415 3955
ATP13
Advisory 000 000
Alert 000 000
Warning 2732 2535 5001 2269
ATP14
Advisory 000 000
Alert 000 000
Warning 2358 2361 4577 2219
ATP15
Advisory 000 000
Alert 000 000
Warning 1107 2459 4814 3707
ATP16
Advisory 5668 1982 7974 2306
Alert 000 000
Warning 1502 1906 3525 2023
ATP17
Advisory 000 000
Alert 000 000
Warning 3183 2420 4720 1537
US Department of Transportation Office of the Assistant Secretary for Research and Technology
Intelligent Transportation Systems Joint Program Office
Task 8 D2X Hub Proof-of-Concept Test Evaluation Report ndash Final | A-9
Table A-5 Complete Data Analysis ndash Hypothesis 6 (MDEA)
Test Number
Type of Message
True Distance (m)
Speed (MPH)
Expected Distance (m)
Difference (m)
TFHRC1
Advisory 8756 2290 9213 457
Alert 5320 2509 5736 416
Warning 4651 2487 4883 232
TFHRC2
Advisory 9928 2514 10115 187
Alert 5276 2447 5546 270
Warning 4624 2415 4707 084
TFHRC3
Advisory 8952 2304 9270 318
Alert 5595 2603 6030 436
Warning 4890 2617 5205 315
TFHRC4
Advisory 9752 2514 10115 363
Alert 6290 2769 6564 274
Warning 4844 2693 5396 552
TFHRC5
Advisory 9613 2406 9680 067
Alert 5242 2420 5463 221
Warning 4080 2357 4568 488
ATP1
Advisory 5938 2183 8783 2845
Alert 4314 2120 4580 266
Warning 3644 2111 3989 345
ATP2
Advisory 6452 1641 6602 150
Alert 3296 1691 3419 123
Warning 2600 1601 2865 265
ATP3
Advisory 6212 1628 6550 338
Alert 3200 1655 3327 127
Warning 2707 1641 2949 242
ATP4
Advisory 6420 1646 6622 202
Alert 3300 1780 3650 350
Warning 2878 1704 3084 206
ATP5
Advisory 6673 1677 6747 074
Alert 3400 1847 3828 428
Warning 2972 1807 3307 335
ATP6
Advisory 6100 1628 6550 450
Alert 3100 1637 3281 181
Warning 2500 1597 2857 357
APPENDIX A Comprehensive Data Analysis Tables
US Department of Transportation Office of the Assistant Secretary for Research and Technology
Intelligent Transportation Systems Joint Program Office
Task 8 D2X Hub Proof-of-Concept Test Evaluation Report ndash Final | A-10
APPENDIX A Comprehensive Data Analysis Tables
Test Number
Type of Message
True Distance (m)
Speed (MPH)
Expected Distance (m)
Difference (m)
ATP7
Advisory 7500 1972 7934 434
Alert 3882 1914 4008 126
Warning 3400 1946 3614 214
ATP8
Advisory 6659 1744 7017 358
Alert 3263 1682 3396 133
Warning 2900 1682 3037 137
ATP9
Advisory 6605 1659 6675 070
Alert 2900 1556 3078 178
Warning 2365 1561 2781 416
ATP10
Advisory 9214 2491 10022 808
Alert 5859 2688 6301 442
Warning 5200 2644 5273 073
ATP11
Advisory 8485 2487 10006 1521
Alert 5376 2487 5668 292
Warning 4716 2483 4873 157
ATP12
Advisory 9001 2433 9789 788
Alert 5395 2420 5463 068
Warning 4103 2330 4503 400
ATP13
Advisory 8615 2559 10296 1681
Alert 000 000 000 000
Warning 4930 2581 5115 185
ATP14
Advisory 6119 2491 10022 3903
Alert 5500 2491 5681 181
Warning 3800 2402 4676 876
ATP15
Advisory 7546 2603 10473 2927
Alert 6000 2661 6215 215
Warning 3100 2603 5170 2070
ATP16
Advisory 7931 2089 8405 474
Alert 3995 1950 4106 111
Warning 3500 1923 3563 063
ATP17
Advisory 8243 2049 8244 001
Alert 5260 2465 5601 341
Warning 4718 2438 4763 045
US Department of Transportation Office of the Assistant Secretary for Research and Technology
Intelligent Transportation Systems Joint Program Office
Task 8 D2X Hub Proof-of-Concept Test Evaluation Report ndash Final | A-11
Table A-6 Complete Data Analysis ndash Hypothesis 7
Date Test
Number
User State Change Is
Safe Icon False
Properly Processed
User State Change Is
Safe Icon True
Properly Processed
1312017 TFHRC 1 111438 X 111504 X
1312017 TFHRC 3 112533 X 112619 X
1312017 TFHRC 4 114400 X 114438 X
1312017 TFHRC 5 114801 X 114829 X
1312017 TFHRC 6 115408 X 115444 X
1182017 ATP 1 105056 X 105116 X
1182017 ATP 2 105622 X 105656 X
1182017 ATP 3 110348 X 110436 X
1182017 ATP 4 111355 X 111417 X
1182017 ATP 5 111655 X 111717 X
1182017 ATP 6 111947 X 112007 X
1182017 ATP 7 112235 X 112305 X
1182017 ATP 8 112937 X 113013 X
1182017 ATP 9 113313 X 113353 X
1182017 ATP 10 113636 X 113708 X
1192017 ATP 11 45035 X 45057 X
1192017 ATP 13 45806 X 45828 X
1192017 ATP 14 50144 X 50202 X
1192017 ATP 15 50542 X 50600 X
1192017 ATP 16 50903 X 50929 X
APPENDIX A Comprehensive Data Analysis Tables
US Department of Transportation Office of the Assistant Secretary for Research and Technology
Intelligent Transportation Systems Joint Program Office
Task 8 D2X Hub Proof-of-Concept Test Evaluation Report ndash Final | A-12
APPENDIX A Comprehensive Data Analysis Tables
Table A-7 Complete Data Analysis ndash Hy pothesis 8 amp 9
US Department of Transportation Office of the Assistant Secretary for Research and Technology
Intelligent Transportation Systems Joint Program Office
Task 8 D2X Hub Proof-of-Concept Test Evaluation Report ndash Final | A-13
Test Number
Analyze the percentage of PMM messages properly processed by
in-vehicle devices Analyze the percentage of PMM-RSP messages
properly processed by mobile devices
Analyze the percentage of PMM-Cancel messages
properly processed by in-vehicle devices
MDEA Log ndash PMM Send
occurrence
MDEA Log ndash
PMM contents
VEA Log ndash PMM
Receive occurrence
VEA Log ndash Driver
acceptance
VEA Log ndash PMM-RSP
Send occurrence
MDEA Log ndash PMM-RSP
Receive occurrence
MDEA Log ndash Coordination
Status
MDEA Log ndash PMM-
Cancel Sent Occurrence
VEA Log ndash PMM-
Cancel Received
Occurrence
TFHRC 1 Check All Present Check Check Check Check Check Check Check
TFHRC 2 Check All Present Check Check Check Check Check Check Check
TFHRC 3 Check All Present Check Check Check Check Check Check Check
TFHRC 4 Check All Present Check Check Check Check Check Check Check
TFHRC 5 Check All Present Check Check Check Check Check Check Check
ATP 1 Check All Present Check Check Check Check Check Check Check
ATP 2 Check All Present Check Check Check Check Check Check Check
ATP 3 Check All Present Check Check Check Check Check Check Check
ATP 4 Check All Present Check Check Check Check Check Check Check
ATP 5 Check All Present Check Check Check Check Check Check Check
ATP 6 Check All Present Check Check Check Check Check Check Check
ATP 7 Check All Present Check Check Check Check Check Check Check
ATP 8 Check All Present Check Check Check Check Check Check Check
ATP 9 Check All Present Check Check Check Check Check Check Check
ATP 10 Check All Present Check Check Check Check Check Check Check
APPENDIX A Comprehensive Data Analysis Tables
Test Number
Analyze the percentage of PMM messages properly processed by
in-vehicle devices Analyze the percentage of PMM-RSP messages
properly processed by mobile devices
Analyze the percentage of PMM-Cancel messages
properly processed by in-vehicle devices
MDEA Log ndash PMM Send occurrence
MDEA Log ndash PMM
contents
VEA Log ndash PMM
Receive occurrence
VEA Log ndash Driver
acceptance
VEA Log ndash PMM-RSP
Send occurrence
MDEA Log ndash PMM-RSP
Receive occurrence
MDEA Log ndash Coordination
Status
MDEA Log ndash PMM-
Cancel Sent Occurrence
VEA Log ndash PMM-
Cancel Received
Occurrence
ATP 11 Check All Present Check Check Check Check Check Check Check
ATP 12 Check All Present Check Check Check Check Check Check Check
ATP 13 Check All Present Check Check Check Check Check Check Check
ATP 14 Check All Present Check Check Check Check Check Check Check
ATP 15 Check All Present Check Check Check Check Check Check Check
ATP 16 Check All Present Check Check Check Check Check Check Check
ATP 17 Check All Present Check Check Check Check Check Check Check
US Department of Transportation Office of the Assistant Secretary for Research and Technology
Intelligent Transportation Systems Joint Program Office
Task 8 D2X Hub Proof-of-Concept Test Evaluation Report ndash Final | A-14
Table A-8 Complete Data Analysis ndash Hy pothesis 10
Date Test Number
Analyze the Success Rate of Receiving a PMM-Arrive Message
VEA Log ndash PMM-ARRIVE Send Occurrence MDEA Log ndash PMM-ARRIVE Receive Occurrence
1312017 TFHRC 1 Fail Fail
1312017 TFHRC 2 Check Check
1312017 TFHRC 3 Check Check
1312017 TFHRC 4 Check Check
1312017 TFHRC 5 Check Check
1312017 TFHRC 6 Check Check
1312017 TFHRC 7 Check Check
1182017 ATP 1 Not Available Check
1182017 ATP 2 Not Available Check
1182017 ATP 3 Not Available Check
1182017 ATP 4 Not Available Check
1182017 ATP 5 Not Available Check
1182017 ATP 6 Not Available Check
1182017 ATP 7 Not Available Check
1182017 ATP 8 Not Available Check
1182017 ATP 9 Not Available Check
1182017 ATP 10 Not Available Check
1202017 ATP 11 Check Check
1202017 ATP 12 Check Check
1202017 ATP 13 Check Check
1202017 ATP 14 Check Check
1202017 ATP 15 Check Check
APPENDIX A Comprehensive Data Analysis Tables
US Department of Transportation Office of the Assistant Secretary for Research and Technology
Intelligent Transportation Systems Joint Program Office
Task 8 D2X Hub Proof-of-Concept Test Evaluation Report ndash Final | A-15
APPENDIX A Comprehensive Data Analysis Tables
Table A-9 Complete Data Analysis ndash Hypothesis 13 (Part A)
US Department of Transportation Office of the Assistant Secretary for Research and Technology
Intelligent Transportation Systems Joint Program Office
Task 8 D2X Hub Proof-of-Concept Test Evaluation Report ndash Final | A-16
Test Number
Coordination Request Sent
by Y
Coordination Request
Received by X
Request Confirmed
by X Confirmation Received by Y
Coordination Request Sent
by Z
Coordination Request
Received by X
Request Confirmed
by X Confirmation Received by Z
Coordination Heart Beat
Transmitted by Y amp Z
Heart Beat Response received
by X
Ride Arrived
Messages
TFHRC 1
Fail Traveler Y could not join the ad-hoc travel group
TFHRC 2
Check check check check 41047 check check check check check 41303
TFHRC 3
Check Check Check Check Check Check Check Check Check Check Check
TFHRC 4
Fail Traveler Y could not join the ad-hoc travel group
TFHRC 5
Check Check Check Check Check Check Check Check Check Check Check
TFHRC 6
Check Check Check Check Check Check Check Check Check Check Check
TFHRC 7
Check Check Check Check Check Check Check Check Check Check Check
TFHRC 8
Check Check Check Check Check Check Check Check Check Check Check
TFHRC 9
Check Check Check Check Check Check Check Check Check Check Check
TFHRC 10
Check Check Check Check Check Check Check Check Check Check Check
ATP 1 Check Check Check Check Check Check Check Check Check Check Check
ATP 2 Check Check Check Check Check Check Check Check Check Check Check
Test Number
Coordination Request Sent
by Y
Coordination Request
Received by X
Request Confirmed
by X Confirmation Received by Y
Coordination Request Sent
by Z
Coordination Request
Received by X
Request Confirmed
by X Confirmation Received by Z
Coordination Heart Beat
Transmitted by Y amp Z
Heart Beat Response received
by X
Ride Arrived
Messages
ATP 3 Check Check Check Check Check Check Check Check Check Check Check
ATP 4 Check Check Check Check Check Check Check Check Check Check Check
ATP 5 Check Check Check Check Check Check Check Check Check Check Check
ATP 6 Check Check Check Check Check Check Check Check Check Check Check
ATP 7 Check Check Check Check Check Check Check Check Check Check No ride
arrives received
ATP 8 Check Check Check Check Check Check Check Check Check Check Check
ATP 9 Check Check Check Check Check Check Check Check Check Check No ride
arrives received
ATP 10 Check Check Check Check Check Check Check Check Check Check Check
ATP 11 Check Check Check Check Check Check Check Check Check Check Check
ATP 12 Check Check Check Check Check Check Check Check Check Check No ride
arrives received
ATP 13 Check Check Check Check Check Check Check Check Check Check Check
ATP 14 Check Check Check Check Check Check Check Check Check Check Check
ATP 15 Check Check Check Check Check Check Check Check Check Check Check
APPENDIX A Comprehensive Data Analysis Tables
US Department of Transportation Office of the Assistant Secretary for Research and Technology
Intelligent Transportation Systems Joint Program Office
Task 8 D2X Hub Proof-of-Concept Test Evaluation Report ndash Final | A-17
APPENDIX A Comprehensive Data Analysis Tables
Table A-10 Complete Data Analysis ndash Hypothesis 13 (Part B)
US Department of Transportation Office of the Assistant Secretary for Research and Technology
Intelligent Transportation Systems Joint Program Office
Task 8 D2X Hub Proof-of-Concept Test Evaluation Report ndash Final | A-18
Test Number Coordination Cancel by
Walking Away Coordination Cancel by
Manual Request Disband Group after
Entering into Vehicle
TFHRC 1 Check This step not tested on this day
TFHRC 2 Check This step not tested on this day
TFHRC 3 Check This step not tested on this day
TFHRC 4 Check This step not tested on this day
TFHRC 5 Check This step not tested on this day
TFHRC 6 This step not tested on this day Check Check
TFHRC 7 This step not tested on this day Check Check
TFHRC 8 This step not tested on this day Check Check
TFHRC 9 This step not tested on this day Check Check
TFHRC 10 This step not tested on this day Check Check
ATP 1 Check Check Check
ATP 2 Check Check Check
ATP 3 Check Check Check
ATP 4 Check Check Check
ATP 5 Check Check Check
ATP 6 Check Check Check
ATP 7 Check Check Check
ATP 8 Check Check Check
ATP 9 Check Check Check
APPENDIX A Comprehensive Data Analysis Tables
Test Number Coordination Cancel by
Walking Away Coordination Cancel by
Manual Request Disband Group after Entering into Vehicle
ATP 10 Check Check Check
ATP 11 Fail Could not cancel by distance Check Check
ATP 12 Check Check Check
ATP 13 Fail Could not cancel by distance Check Check
ATP 14 Check Check Check
ATP 15 Check Check Check
US Department of Transportation Office of the Assistant Secretary for Research and Technology
Intelligent Transportation Systems Joint Program Office
Task 8 D2X Hub Proof-of-Concept Test Evaluation Report ndash Final | A-19
APPENDIX A Comprehensive Data Analysis Tables
APPENDIX B Acronyms and Abbreviations
ATG Ad-Hoc Travel Group
ATP Acceptance Test Plan
BSM Basic Safety Message
CCP Common Computing Platform
CV Connected Vehicle
DSRC Dedicated Short Range Communications
EPS Experimental Prototype System
FHWA Federal Highway Administration
FR Functional Requirement
ITS Intelligent Transportation Systems
LDV Light-Duty Vehicle
MAP Map Data
MDEA Mobile Device Experimental Application
MGL Message Logging
OBU On-board Unit
PMM Personal Mobility Message
PMM-ARRIVE Personal Mobility Message Arrival Message
PMM-CANCEL Personal Mobility Message Cancel Message
PMM-RSP Personal Mobility Message Response Message
PR Performance Requirement
PSM Personal Safety Message
REA Roadside Experimental Application
RSU Roadside Unit
SFY Safety
SIR System Interface Requirement
SMP SPaT and MAP
SPaT Signal Phasing and Timing
SyRS System Requirements Specifications
TFHRC Turner-Fairbank Highway Research Center
US DOT US Department of Transportation
US Department of Transportation Office of the Assistant Secretary for Research and Technology
Intelligent Transportation Systems Joint Program Office
Task 8 D2X Hub Proof-of-Concept Test Evaluation Report ndash Final |B-1
VEA Vehicle Experimental Application
Wi-Fi Wireless Fidelity
APPENDIX B Acronyms and Abbreviations
US Department of Transportation Office of the Assistant Secretary for Research and Technology
Intelligent Transportation Systems Joint Program Office
Task 8 D2X Hub Proof-of-Concept Test Evaluation Report ndash Final | B-2
APPENDIX C Terms and Definitions
Basic Safety Message (BSM)
Connected vehicle message type which contains vehicle safety-related information that is broadcast to surrounding vehicles
Bluetooth Short range wireless technology used to exchange data between enabled devices
Cellular Uses short-range radio stations to cover areas of communication
Connected Vehicle A vehicle that can communicate with other vehicles and infrastructure via communication media such as DSRC Wi-Fi cellular or Bluetooth
Coordinated Messages are coordinated when two or more mobile devices have establish a travel group based on the same origin destination and
time and function as a single cohesive senderrecipient
CV Inspector An application that verifies if the Mobile Device is broadcasting messages to Connected Vehicles
Destination The end point of a travelerrsquos trip
DSRC Dedicated Short-Range Communications a low-latency high-reliability two-way communications tool used for sending transportation safety
messages
Light-Duty Vehicle Of or relating to vehicles that way less than 4000 lbs
Message Type Type of personal safety or personal mobility message that is transmitted based on the technology used and level of coordination available
Personal Mobility Message (PMM)
Similar to PDM message intended for the exchange of mobility messages between individual travelers and vehiclesinfrastructure via
mobile device
Personal Safety Message (PSM)
Similar to BSM message intended to transmit low-latency urgent safety messages between individual travelers and vehiclesinfrastructure via
mobile device
Test Case A set of conditions or variables that a Tester can determine if system meets requirements
Transit Vehicle Large vehicles mainly used for public transportation as well as support services
Transmitting The state in which a traveler has opted in and is sendingreceiving messages via mobile device
Uncoordinated Messages are uncoordinated when travel groups are not established (see coordinated definition)
Wi-Fi Local area wireless technology that allows enabled devices to connect to the Internet
APPENDIX A Comprehensive Data Analysis Tables
US Department of Transportation Office of the Assistant Secretary for Research and Technology
Intelligent Transportation Systems Joint Program Office
Task 8 D2X Hub Proof-of-Concept Test Evaluation Report ndash Final |C-1
ITS Joint Program Office-HOIT 1200 New Jersey Avenue SE
Washington DC 20590
Toll-Free ldquoHelp Linerdquo 866-367-7487 wwwitsdotgov
FHWA-JPO-18-263
- Structure Bookmarks
-
- Sharing Data between Mobile Devices Connected Vehicles and Infrastructure Task 8 D2X Hub Proof-of-Concept Test Evaluation Report wwwitsdotgovindexhtm Final Report mdash October 25 2017 FHWA-JPO-18-623
- Revision History
- Table of Contents
- Chapter 1 Scope
- Chapter 2 Referenced Documents
- Chapter 3 Test Conduct
- Chapter 4 Experimental Analysis Results Summary
- Chapter 5 Experimental Analysis
- Chapter 6 Lessons Learned and Recommendations
- APPENDIX A Comprehensive Data Analysis Tables
- APPENDIX B Acronyms and Abbreviations
- APPENDIX C Terms and Definitions
-

APPENDIX A Comprehensive Data Analysis Tables
Date Time Vehicle Range and Advisory
Distance wrt Speed Speed In
Range Out of Range Distance
RSU Log PSM
Message RateSec
VEA Log PSM
Message Rate
1192017 41311 IsBsmClose Dist 10190842581135lt
AdvDist 1040399857728 259 X 102 10 10
1192017 41423 IsBsmClose Dist 995536361906761lt
AdvDist 1009799790912 251 X 100 10 10
1192017 41534 IsBsmClose Dist 10075608603652lt
AdvDist 106919987328 264 X 101 10 10
US Department of Transportation Office of the Assistant Secretary for Research and Technology
Intelligent Transportation Systems Joint Program Office
Task 8 D2X Hub Proof-of-Concept Test Evaluation Report ndash Final | A-5
APPENDIX A Comprehensive Data Analysis Tables
Table A-2 Complete Data Analysis ndash Hypothesis 2
US Department of Transportation Office of the Assistant Secretary for Research and Technology
Intelligent Transportation Systems Joint Program Office
Task 8 D2X Hub Proof-of-Concept Test Evaluation Report ndash Final | A-6
Date Test
Number PSMs Generated by
Trav X and Trav Y Transition to In Group Trav Y PSM Ceased Only Trav X PSM
Received
1312017 TFHRC 1 111116 111240 Check 111305
1312017 TFHRC 2 Grouping Failed Grouping Failed Grouping Failed Grouping Failed
1312017 TFHRC 3 112346 112448 Check 112508
1312017 TFHRC 4 114208 114301 Check 114345
1312017 TFHRC 5 114609 114658 Check 114721
1312017 TFHRC 6 115222 115313 Check 115342
1182017 ATP 1 104400 104527 Check 104601
1182017 ATP 2 105356 105455 Check 105546
1182017 ATP 3 110059 110150 Check 110322
1182017 ATP 4 111222 111310 Check 111329
1182017 ATP 5 111515 111616 Check 111630
1182017 ATP 6 111823 111906 Check 111917
1182017 ATP 7 112116 112157 Check 112209
1182017 ATP 8 112814 112855 Check 112917
1182017 ATP 9 113142 113230 Check 113248
1182017 ATP 10 113501 113545 Check 113608
1192017 ATP 11 44728 44842 Check 45007
1192017 ATP 12 Radio Failure Test Terminated Radio Failure Test Terminated Radio Failure Test Terminated Radio Failure Test Terminated
1192017 ATP 13 45548 45637 Check 45728
1192017 ATP 14 45946 50047 Check 50107
1192017 ATP 15 50353 50444 Check 50513
1192017 ATP 16 50730 50823 Check 50839
APPENDIX A Comprehensive Data Analysis Tables
Table A-3 Complete Data Analysis ndash Hypothesis 3
US Department of Transportation Office of the Assistant Secretary for Research and Technology
Intelligent Transportation Systems Joint Program Office
Task 8 D2X Hub Proof-of-Concept Test Evaluation Report ndash Final | A-7
Date Description
MDEA not in Vehicle
MDEA Transmits
PSMs Time of MDEA
Mode Transition
MDEA Ceases Transmitting
PSMs
1312017 TFHRC 1 Check Check 0443101852 Check
1312017 TFHRC 2 Check Check 0445243056 Check
1312017 TFHRC 3 Check Check 0447569444 Check
1312017 TFHRC 4 Check Check 0448888889 Check
1312017 TFHRC 5 Check Check 045005787 Check
1312017 TFHRC 6 Check Check 0451666667 Check
1172017 ATP 1 Check Check 0501898148 Check
1172017 ATP 2 Check Check 0504201389 Check
1172017 ATP 3 Check Check 0506215278 Check
1172017 ATP 4 Check Check 0507858796 Check
1172017 ATP 5 Check Check 0508981481 Check
1172017 ATP 6 Check Check 0510219907 Check
1172017 ATP 7 Check Check 0511736111 Check
1172017 ATP 8 Check Check 05128125 Check
1172017 ATP 9 Check Check 0513831019 Check
1172017 ATP 10 Check Check 0514884259 Check
1172017 ATP 11 Check Check 0185590278 Check
1172017 ATP 12 Check Check 0187210648 Check
1172017 ATP 13 Check Check 0188425926 Check
1172017 ATP 14 Check Check 0190289352 Check
1172017 ATP 15 Check Check 0191863426 Check
APPENDIX A Comprehensive Data Analysis Tables
Table A-4 Complete Data Analysis ndash Hypothesis 5 (VEA)
Test Number
Type of Message
True Distance (m)
Speed (MPH)
Expected Distance (m)
Difference (m)
TFHRC1
Advisory 7584 2471 9942 2358
Alert 5545 2523 5780 235
Warning 4874 2498 4910 036
TFHRC2
Advisory 8552 2595 10441 1889
Alert 5167 2461 5588 421
Warning 4515 2433 4751 236
TFHRC3
Advisory 7876 2381 9580 1704
Alert 5827 2590 5989 162
Warning 5124 2624 5222 098
TFHRC4
Advisory 7529 2818 11338 3809
Alert 6047 2744 6482 435
Warning 5323 2714 5450 127
TFHRC5
Advisory 9292 2404 9672 380
Alert 5350 2423 5472 122
Warning 4081 2352 4556 475
ATP1
Advisory 000 000
Alert 000 000
Warning 000 000
ATP2
Advisory 5787 1644 6614 827
Alert 3074 1640 3289 215
Warning 2627 1640 2947 320
ATP3
Advisory 4204 1685 6779 2575
Alert 3300 1672 3370 070
Warning 2854 1658 2985 131
ATP4
Advisory 4296 1753 7053 2757
Alert 3346 1791 3679 333
Warning 2871 1755 3194 323
ATP5
Advisory 000 000
Alert 000 000
Warning 1069 1706 3088 2019
ATP6
Advisory 3632 1640 6598 2966
Alert 000 000
Warning 2770 1594 2850 080
US Department of Transportation Office of the Assistant Secretary for Research and Technology
Intelligent Transportation Systems Joint Program Office
Task 8 D2X Hub Proof-of-Concept Test Evaluation Report ndash Final | A-8
APPENDIX A Comprehensive Data Analysis Tables
Test Number
Type of Message
True Distance (m)
Speed (MPH)
Expected Distance (m)
Difference (m)
ATP7
Advisory 000 000
Alert 000 000
Warning 1919 1887 3483 1564
ATP8
Advisory 4492 1741 7005 2513
Alert 3113 1687 3409 296
Warning 2661 1680 3032 371
ATP9
Advisory 4694 1628 6550 1856
Alert 2991 1570 3113 122
Warning 2572 1549 2756 184
ATP10
Advisory 000 000
Alert 000 000
Warning 650 2505 4927 4277
ATP11
Advisory 000 000
Alert 000 000
Warning 1914 2398 4666 2752
ATP12
Advisory 000 000
Alert 000 000
Warning 460 2293 4415 3955
ATP13
Advisory 000 000
Alert 000 000
Warning 2732 2535 5001 2269
ATP14
Advisory 000 000
Alert 000 000
Warning 2358 2361 4577 2219
ATP15
Advisory 000 000
Alert 000 000
Warning 1107 2459 4814 3707
ATP16
Advisory 5668 1982 7974 2306
Alert 000 000
Warning 1502 1906 3525 2023
ATP17
Advisory 000 000
Alert 000 000
Warning 3183 2420 4720 1537
US Department of Transportation Office of the Assistant Secretary for Research and Technology
Intelligent Transportation Systems Joint Program Office
Task 8 D2X Hub Proof-of-Concept Test Evaluation Report ndash Final | A-9
Table A-5 Complete Data Analysis ndash Hypothesis 6 (MDEA)
Test Number
Type of Message
True Distance (m)
Speed (MPH)
Expected Distance (m)
Difference (m)
TFHRC1
Advisory 8756 2290 9213 457
Alert 5320 2509 5736 416
Warning 4651 2487 4883 232
TFHRC2
Advisory 9928 2514 10115 187
Alert 5276 2447 5546 270
Warning 4624 2415 4707 084
TFHRC3
Advisory 8952 2304 9270 318
Alert 5595 2603 6030 436
Warning 4890 2617 5205 315
TFHRC4
Advisory 9752 2514 10115 363
Alert 6290 2769 6564 274
Warning 4844 2693 5396 552
TFHRC5
Advisory 9613 2406 9680 067
Alert 5242 2420 5463 221
Warning 4080 2357 4568 488
ATP1
Advisory 5938 2183 8783 2845
Alert 4314 2120 4580 266
Warning 3644 2111 3989 345
ATP2
Advisory 6452 1641 6602 150
Alert 3296 1691 3419 123
Warning 2600 1601 2865 265
ATP3
Advisory 6212 1628 6550 338
Alert 3200 1655 3327 127
Warning 2707 1641 2949 242
ATP4
Advisory 6420 1646 6622 202
Alert 3300 1780 3650 350
Warning 2878 1704 3084 206
ATP5
Advisory 6673 1677 6747 074
Alert 3400 1847 3828 428
Warning 2972 1807 3307 335
ATP6
Advisory 6100 1628 6550 450
Alert 3100 1637 3281 181
Warning 2500 1597 2857 357
APPENDIX A Comprehensive Data Analysis Tables
US Department of Transportation Office of the Assistant Secretary for Research and Technology
Intelligent Transportation Systems Joint Program Office
Task 8 D2X Hub Proof-of-Concept Test Evaluation Report ndash Final | A-10
APPENDIX A Comprehensive Data Analysis Tables
Test Number
Type of Message
True Distance (m)
Speed (MPH)
Expected Distance (m)
Difference (m)
ATP7
Advisory 7500 1972 7934 434
Alert 3882 1914 4008 126
Warning 3400 1946 3614 214
ATP8
Advisory 6659 1744 7017 358
Alert 3263 1682 3396 133
Warning 2900 1682 3037 137
ATP9
Advisory 6605 1659 6675 070
Alert 2900 1556 3078 178
Warning 2365 1561 2781 416
ATP10
Advisory 9214 2491 10022 808
Alert 5859 2688 6301 442
Warning 5200 2644 5273 073
ATP11
Advisory 8485 2487 10006 1521
Alert 5376 2487 5668 292
Warning 4716 2483 4873 157
ATP12
Advisory 9001 2433 9789 788
Alert 5395 2420 5463 068
Warning 4103 2330 4503 400
ATP13
Advisory 8615 2559 10296 1681
Alert 000 000 000 000
Warning 4930 2581 5115 185
ATP14
Advisory 6119 2491 10022 3903
Alert 5500 2491 5681 181
Warning 3800 2402 4676 876
ATP15
Advisory 7546 2603 10473 2927
Alert 6000 2661 6215 215
Warning 3100 2603 5170 2070
ATP16
Advisory 7931 2089 8405 474
Alert 3995 1950 4106 111
Warning 3500 1923 3563 063
ATP17
Advisory 8243 2049 8244 001
Alert 5260 2465 5601 341
Warning 4718 2438 4763 045
US Department of Transportation Office of the Assistant Secretary for Research and Technology
Intelligent Transportation Systems Joint Program Office
Task 8 D2X Hub Proof-of-Concept Test Evaluation Report ndash Final | A-11
Table A-6 Complete Data Analysis ndash Hypothesis 7
Date Test
Number
User State Change Is
Safe Icon False
Properly Processed
User State Change Is
Safe Icon True
Properly Processed
1312017 TFHRC 1 111438 X 111504 X
1312017 TFHRC 3 112533 X 112619 X
1312017 TFHRC 4 114400 X 114438 X
1312017 TFHRC 5 114801 X 114829 X
1312017 TFHRC 6 115408 X 115444 X
1182017 ATP 1 105056 X 105116 X
1182017 ATP 2 105622 X 105656 X
1182017 ATP 3 110348 X 110436 X
1182017 ATP 4 111355 X 111417 X
1182017 ATP 5 111655 X 111717 X
1182017 ATP 6 111947 X 112007 X
1182017 ATP 7 112235 X 112305 X
1182017 ATP 8 112937 X 113013 X
1182017 ATP 9 113313 X 113353 X
1182017 ATP 10 113636 X 113708 X
1192017 ATP 11 45035 X 45057 X
1192017 ATP 13 45806 X 45828 X
1192017 ATP 14 50144 X 50202 X
1192017 ATP 15 50542 X 50600 X
1192017 ATP 16 50903 X 50929 X
APPENDIX A Comprehensive Data Analysis Tables
US Department of Transportation Office of the Assistant Secretary for Research and Technology
Intelligent Transportation Systems Joint Program Office
Task 8 D2X Hub Proof-of-Concept Test Evaluation Report ndash Final | A-12
APPENDIX A Comprehensive Data Analysis Tables
Table A-7 Complete Data Analysis ndash Hy pothesis 8 amp 9
US Department of Transportation Office of the Assistant Secretary for Research and Technology
Intelligent Transportation Systems Joint Program Office
Task 8 D2X Hub Proof-of-Concept Test Evaluation Report ndash Final | A-13
Test Number
Analyze the percentage of PMM messages properly processed by
in-vehicle devices Analyze the percentage of PMM-RSP messages
properly processed by mobile devices
Analyze the percentage of PMM-Cancel messages
properly processed by in-vehicle devices
MDEA Log ndash PMM Send
occurrence
MDEA Log ndash
PMM contents
VEA Log ndash PMM
Receive occurrence
VEA Log ndash Driver
acceptance
VEA Log ndash PMM-RSP
Send occurrence
MDEA Log ndash PMM-RSP
Receive occurrence
MDEA Log ndash Coordination
Status
MDEA Log ndash PMM-
Cancel Sent Occurrence
VEA Log ndash PMM-
Cancel Received
Occurrence
TFHRC 1 Check All Present Check Check Check Check Check Check Check
TFHRC 2 Check All Present Check Check Check Check Check Check Check
TFHRC 3 Check All Present Check Check Check Check Check Check Check
TFHRC 4 Check All Present Check Check Check Check Check Check Check
TFHRC 5 Check All Present Check Check Check Check Check Check Check
ATP 1 Check All Present Check Check Check Check Check Check Check
ATP 2 Check All Present Check Check Check Check Check Check Check
ATP 3 Check All Present Check Check Check Check Check Check Check
ATP 4 Check All Present Check Check Check Check Check Check Check
ATP 5 Check All Present Check Check Check Check Check Check Check
ATP 6 Check All Present Check Check Check Check Check Check Check
ATP 7 Check All Present Check Check Check Check Check Check Check
ATP 8 Check All Present Check Check Check Check Check Check Check
ATP 9 Check All Present Check Check Check Check Check Check Check
ATP 10 Check All Present Check Check Check Check Check Check Check
APPENDIX A Comprehensive Data Analysis Tables
Test Number
Analyze the percentage of PMM messages properly processed by
in-vehicle devices Analyze the percentage of PMM-RSP messages
properly processed by mobile devices
Analyze the percentage of PMM-Cancel messages
properly processed by in-vehicle devices
MDEA Log ndash PMM Send occurrence
MDEA Log ndash PMM
contents
VEA Log ndash PMM
Receive occurrence
VEA Log ndash Driver
acceptance
VEA Log ndash PMM-RSP
Send occurrence
MDEA Log ndash PMM-RSP
Receive occurrence
MDEA Log ndash Coordination
Status
MDEA Log ndash PMM-
Cancel Sent Occurrence
VEA Log ndash PMM-
Cancel Received
Occurrence
ATP 11 Check All Present Check Check Check Check Check Check Check
ATP 12 Check All Present Check Check Check Check Check Check Check
ATP 13 Check All Present Check Check Check Check Check Check Check
ATP 14 Check All Present Check Check Check Check Check Check Check
ATP 15 Check All Present Check Check Check Check Check Check Check
ATP 16 Check All Present Check Check Check Check Check Check Check
ATP 17 Check All Present Check Check Check Check Check Check Check
US Department of Transportation Office of the Assistant Secretary for Research and Technology
Intelligent Transportation Systems Joint Program Office
Task 8 D2X Hub Proof-of-Concept Test Evaluation Report ndash Final | A-14
Table A-8 Complete Data Analysis ndash Hy pothesis 10
Date Test Number
Analyze the Success Rate of Receiving a PMM-Arrive Message
VEA Log ndash PMM-ARRIVE Send Occurrence MDEA Log ndash PMM-ARRIVE Receive Occurrence
1312017 TFHRC 1 Fail Fail
1312017 TFHRC 2 Check Check
1312017 TFHRC 3 Check Check
1312017 TFHRC 4 Check Check
1312017 TFHRC 5 Check Check
1312017 TFHRC 6 Check Check
1312017 TFHRC 7 Check Check
1182017 ATP 1 Not Available Check
1182017 ATP 2 Not Available Check
1182017 ATP 3 Not Available Check
1182017 ATP 4 Not Available Check
1182017 ATP 5 Not Available Check
1182017 ATP 6 Not Available Check
1182017 ATP 7 Not Available Check
1182017 ATP 8 Not Available Check
1182017 ATP 9 Not Available Check
1182017 ATP 10 Not Available Check
1202017 ATP 11 Check Check
1202017 ATP 12 Check Check
1202017 ATP 13 Check Check
1202017 ATP 14 Check Check
1202017 ATP 15 Check Check
APPENDIX A Comprehensive Data Analysis Tables
US Department of Transportation Office of the Assistant Secretary for Research and Technology
Intelligent Transportation Systems Joint Program Office
Task 8 D2X Hub Proof-of-Concept Test Evaluation Report ndash Final | A-15
APPENDIX A Comprehensive Data Analysis Tables
Table A-9 Complete Data Analysis ndash Hypothesis 13 (Part A)
US Department of Transportation Office of the Assistant Secretary for Research and Technology
Intelligent Transportation Systems Joint Program Office
Task 8 D2X Hub Proof-of-Concept Test Evaluation Report ndash Final | A-16
Test Number
Coordination Request Sent
by Y
Coordination Request
Received by X
Request Confirmed
by X Confirmation Received by Y
Coordination Request Sent
by Z
Coordination Request
Received by X
Request Confirmed
by X Confirmation Received by Z
Coordination Heart Beat
Transmitted by Y amp Z
Heart Beat Response received
by X
Ride Arrived
Messages
TFHRC 1
Fail Traveler Y could not join the ad-hoc travel group
TFHRC 2
Check check check check 41047 check check check check check 41303
TFHRC 3
Check Check Check Check Check Check Check Check Check Check Check
TFHRC 4
Fail Traveler Y could not join the ad-hoc travel group
TFHRC 5
Check Check Check Check Check Check Check Check Check Check Check
TFHRC 6
Check Check Check Check Check Check Check Check Check Check Check
TFHRC 7
Check Check Check Check Check Check Check Check Check Check Check
TFHRC 8
Check Check Check Check Check Check Check Check Check Check Check
TFHRC 9
Check Check Check Check Check Check Check Check Check Check Check
TFHRC 10
Check Check Check Check Check Check Check Check Check Check Check
ATP 1 Check Check Check Check Check Check Check Check Check Check Check
ATP 2 Check Check Check Check Check Check Check Check Check Check Check
Test Number
Coordination Request Sent
by Y
Coordination Request
Received by X
Request Confirmed
by X Confirmation Received by Y
Coordination Request Sent
by Z
Coordination Request
Received by X
Request Confirmed
by X Confirmation Received by Z
Coordination Heart Beat
Transmitted by Y amp Z
Heart Beat Response received
by X
Ride Arrived
Messages
ATP 3 Check Check Check Check Check Check Check Check Check Check Check
ATP 4 Check Check Check Check Check Check Check Check Check Check Check
ATP 5 Check Check Check Check Check Check Check Check Check Check Check
ATP 6 Check Check Check Check Check Check Check Check Check Check Check
ATP 7 Check Check Check Check Check Check Check Check Check Check No ride
arrives received
ATP 8 Check Check Check Check Check Check Check Check Check Check Check
ATP 9 Check Check Check Check Check Check Check Check Check Check No ride
arrives received
ATP 10 Check Check Check Check Check Check Check Check Check Check Check
ATP 11 Check Check Check Check Check Check Check Check Check Check Check
ATP 12 Check Check Check Check Check Check Check Check Check Check No ride
arrives received
ATP 13 Check Check Check Check Check Check Check Check Check Check Check
ATP 14 Check Check Check Check Check Check Check Check Check Check Check
ATP 15 Check Check Check Check Check Check Check Check Check Check Check
APPENDIX A Comprehensive Data Analysis Tables
US Department of Transportation Office of the Assistant Secretary for Research and Technology
Intelligent Transportation Systems Joint Program Office
Task 8 D2X Hub Proof-of-Concept Test Evaluation Report ndash Final | A-17
APPENDIX A Comprehensive Data Analysis Tables
Table A-10 Complete Data Analysis ndash Hypothesis 13 (Part B)
US Department of Transportation Office of the Assistant Secretary for Research and Technology
Intelligent Transportation Systems Joint Program Office
Task 8 D2X Hub Proof-of-Concept Test Evaluation Report ndash Final | A-18
Test Number Coordination Cancel by
Walking Away Coordination Cancel by
Manual Request Disband Group after
Entering into Vehicle
TFHRC 1 Check This step not tested on this day
TFHRC 2 Check This step not tested on this day
TFHRC 3 Check This step not tested on this day
TFHRC 4 Check This step not tested on this day
TFHRC 5 Check This step not tested on this day
TFHRC 6 This step not tested on this day Check Check
TFHRC 7 This step not tested on this day Check Check
TFHRC 8 This step not tested on this day Check Check
TFHRC 9 This step not tested on this day Check Check
TFHRC 10 This step not tested on this day Check Check
ATP 1 Check Check Check
ATP 2 Check Check Check
ATP 3 Check Check Check
ATP 4 Check Check Check
ATP 5 Check Check Check
ATP 6 Check Check Check
ATP 7 Check Check Check
ATP 8 Check Check Check
ATP 9 Check Check Check
APPENDIX A Comprehensive Data Analysis Tables
Test Number Coordination Cancel by
Walking Away Coordination Cancel by
Manual Request Disband Group after Entering into Vehicle
ATP 10 Check Check Check
ATP 11 Fail Could not cancel by distance Check Check
ATP 12 Check Check Check
ATP 13 Fail Could not cancel by distance Check Check
ATP 14 Check Check Check
ATP 15 Check Check Check
US Department of Transportation Office of the Assistant Secretary for Research and Technology
Intelligent Transportation Systems Joint Program Office
Task 8 D2X Hub Proof-of-Concept Test Evaluation Report ndash Final | A-19
APPENDIX A Comprehensive Data Analysis Tables
APPENDIX B Acronyms and Abbreviations
ATG Ad-Hoc Travel Group
ATP Acceptance Test Plan
BSM Basic Safety Message
CCP Common Computing Platform
CV Connected Vehicle
DSRC Dedicated Short Range Communications
EPS Experimental Prototype System
FHWA Federal Highway Administration
FR Functional Requirement
ITS Intelligent Transportation Systems
LDV Light-Duty Vehicle
MAP Map Data
MDEA Mobile Device Experimental Application
MGL Message Logging
OBU On-board Unit
PMM Personal Mobility Message
PMM-ARRIVE Personal Mobility Message Arrival Message
PMM-CANCEL Personal Mobility Message Cancel Message
PMM-RSP Personal Mobility Message Response Message
PR Performance Requirement
PSM Personal Safety Message
REA Roadside Experimental Application
RSU Roadside Unit
SFY Safety
SIR System Interface Requirement
SMP SPaT and MAP
SPaT Signal Phasing and Timing
SyRS System Requirements Specifications
TFHRC Turner-Fairbank Highway Research Center
US DOT US Department of Transportation
US Department of Transportation Office of the Assistant Secretary for Research and Technology
Intelligent Transportation Systems Joint Program Office
Task 8 D2X Hub Proof-of-Concept Test Evaluation Report ndash Final |B-1
VEA Vehicle Experimental Application
Wi-Fi Wireless Fidelity
APPENDIX B Acronyms and Abbreviations
US Department of Transportation Office of the Assistant Secretary for Research and Technology
Intelligent Transportation Systems Joint Program Office
Task 8 D2X Hub Proof-of-Concept Test Evaluation Report ndash Final | B-2
APPENDIX C Terms and Definitions
Basic Safety Message (BSM)
Connected vehicle message type which contains vehicle safety-related information that is broadcast to surrounding vehicles
Bluetooth Short range wireless technology used to exchange data between enabled devices
Cellular Uses short-range radio stations to cover areas of communication
Connected Vehicle A vehicle that can communicate with other vehicles and infrastructure via communication media such as DSRC Wi-Fi cellular or Bluetooth
Coordinated Messages are coordinated when two or more mobile devices have establish a travel group based on the same origin destination and
time and function as a single cohesive senderrecipient
CV Inspector An application that verifies if the Mobile Device is broadcasting messages to Connected Vehicles
Destination The end point of a travelerrsquos trip
DSRC Dedicated Short-Range Communications a low-latency high-reliability two-way communications tool used for sending transportation safety
messages
Light-Duty Vehicle Of or relating to vehicles that way less than 4000 lbs
Message Type Type of personal safety or personal mobility message that is transmitted based on the technology used and level of coordination available
Personal Mobility Message (PMM)
Similar to PDM message intended for the exchange of mobility messages between individual travelers and vehiclesinfrastructure via
mobile device
Personal Safety Message (PSM)
Similar to BSM message intended to transmit low-latency urgent safety messages between individual travelers and vehiclesinfrastructure via
mobile device
Test Case A set of conditions or variables that a Tester can determine if system meets requirements
Transit Vehicle Large vehicles mainly used for public transportation as well as support services
Transmitting The state in which a traveler has opted in and is sendingreceiving messages via mobile device
Uncoordinated Messages are uncoordinated when travel groups are not established (see coordinated definition)
Wi-Fi Local area wireless technology that allows enabled devices to connect to the Internet
APPENDIX A Comprehensive Data Analysis Tables
US Department of Transportation Office of the Assistant Secretary for Research and Technology
Intelligent Transportation Systems Joint Program Office
Task 8 D2X Hub Proof-of-Concept Test Evaluation Report ndash Final |C-1
ITS Joint Program Office-HOIT 1200 New Jersey Avenue SE
Washington DC 20590
Toll-Free ldquoHelp Linerdquo 866-367-7487 wwwitsdotgov
FHWA-JPO-18-263
- Structure Bookmarks
-
- Sharing Data between Mobile Devices Connected Vehicles and Infrastructure Task 8 D2X Hub Proof-of-Concept Test Evaluation Report wwwitsdotgovindexhtm Final Report mdash October 25 2017 FHWA-JPO-18-623
- Revision History
- Table of Contents
- Chapter 1 Scope
- Chapter 2 Referenced Documents
- Chapter 3 Test Conduct
- Chapter 4 Experimental Analysis Results Summary
- Chapter 5 Experimental Analysis
- Chapter 6 Lessons Learned and Recommendations
- APPENDIX A Comprehensive Data Analysis Tables
- APPENDIX B Acronyms and Abbreviations
- APPENDIX C Terms and Definitions
-

APPENDIX A Comprehensive Data Analysis Tables
Test Number
Type of Message
True Distance (m)
Speed (MPH)
Expected Distance (m)
Difference (m)
ATP7
Advisory 000 000
Alert 000 000
Warning 1919 1887 3483 1564
ATP8
Advisory 4492 1741 7005 2513
Alert 3113 1687 3409 296
Warning 2661 1680 3032 371
ATP9
Advisory 4694 1628 6550 1856
Alert 2991 1570 3113 122
Warning 2572 1549 2756 184
ATP10
Advisory 000 000
Alert 000 000
Warning 650 2505 4927 4277
ATP11
Advisory 000 000
Alert 000 000
Warning 1914 2398 4666 2752
ATP12
Advisory 000 000
Alert 000 000
Warning 460 2293 4415 3955
ATP13
Advisory 000 000
Alert 000 000
Warning 2732 2535 5001 2269
ATP14
Advisory 000 000
Alert 000 000
Warning 2358 2361 4577 2219
ATP15
Advisory 000 000
Alert 000 000
Warning 1107 2459 4814 3707
ATP16
Advisory 5668 1982 7974 2306
Alert 000 000
Warning 1502 1906 3525 2023
ATP17
Advisory 000 000
Alert 000 000
Warning 3183 2420 4720 1537
US Department of Transportation Office of the Assistant Secretary for Research and Technology
Intelligent Transportation Systems Joint Program Office
Task 8 D2X Hub Proof-of-Concept Test Evaluation Report ndash Final | A-9
Table A-5 Complete Data Analysis ndash Hypothesis 6 (MDEA)
Test Number
Type of Message
True Distance (m)
Speed (MPH)
Expected Distance (m)
Difference (m)
TFHRC1
Advisory 8756 2290 9213 457
Alert 5320 2509 5736 416
Warning 4651 2487 4883 232
TFHRC2
Advisory 9928 2514 10115 187
Alert 5276 2447 5546 270
Warning 4624 2415 4707 084
TFHRC3
Advisory 8952 2304 9270 318
Alert 5595 2603 6030 436
Warning 4890 2617 5205 315
TFHRC4
Advisory 9752 2514 10115 363
Alert 6290 2769 6564 274
Warning 4844 2693 5396 552
TFHRC5
Advisory 9613 2406 9680 067
Alert 5242 2420 5463 221
Warning 4080 2357 4568 488
ATP1
Advisory 5938 2183 8783 2845
Alert 4314 2120 4580 266
Warning 3644 2111 3989 345
ATP2
Advisory 6452 1641 6602 150
Alert 3296 1691 3419 123
Warning 2600 1601 2865 265
ATP3
Advisory 6212 1628 6550 338
Alert 3200 1655 3327 127
Warning 2707 1641 2949 242
ATP4
Advisory 6420 1646 6622 202
Alert 3300 1780 3650 350
Warning 2878 1704 3084 206
ATP5
Advisory 6673 1677 6747 074
Alert 3400 1847 3828 428
Warning 2972 1807 3307 335
ATP6
Advisory 6100 1628 6550 450
Alert 3100 1637 3281 181
Warning 2500 1597 2857 357
APPENDIX A Comprehensive Data Analysis Tables
US Department of Transportation Office of the Assistant Secretary for Research and Technology
Intelligent Transportation Systems Joint Program Office
Task 8 D2X Hub Proof-of-Concept Test Evaluation Report ndash Final | A-10
APPENDIX A Comprehensive Data Analysis Tables
Test Number
Type of Message
True Distance (m)
Speed (MPH)
Expected Distance (m)
Difference (m)
ATP7
Advisory 7500 1972 7934 434
Alert 3882 1914 4008 126
Warning 3400 1946 3614 214
ATP8
Advisory 6659 1744 7017 358
Alert 3263 1682 3396 133
Warning 2900 1682 3037 137
ATP9
Advisory 6605 1659 6675 070
Alert 2900 1556 3078 178
Warning 2365 1561 2781 416
ATP10
Advisory 9214 2491 10022 808
Alert 5859 2688 6301 442
Warning 5200 2644 5273 073
ATP11
Advisory 8485 2487 10006 1521
Alert 5376 2487 5668 292
Warning 4716 2483 4873 157
ATP12
Advisory 9001 2433 9789 788
Alert 5395 2420 5463 068
Warning 4103 2330 4503 400
ATP13
Advisory 8615 2559 10296 1681
Alert 000 000 000 000
Warning 4930 2581 5115 185
ATP14
Advisory 6119 2491 10022 3903
Alert 5500 2491 5681 181
Warning 3800 2402 4676 876
ATP15
Advisory 7546 2603 10473 2927
Alert 6000 2661 6215 215
Warning 3100 2603 5170 2070
ATP16
Advisory 7931 2089 8405 474
Alert 3995 1950 4106 111
Warning 3500 1923 3563 063
ATP17
Advisory 8243 2049 8244 001
Alert 5260 2465 5601 341
Warning 4718 2438 4763 045
US Department of Transportation Office of the Assistant Secretary for Research and Technology
Intelligent Transportation Systems Joint Program Office
Task 8 D2X Hub Proof-of-Concept Test Evaluation Report ndash Final | A-11
Table A-6 Complete Data Analysis ndash Hypothesis 7
Date Test
Number
User State Change Is
Safe Icon False
Properly Processed
User State Change Is
Safe Icon True
Properly Processed
1312017 TFHRC 1 111438 X 111504 X
1312017 TFHRC 3 112533 X 112619 X
1312017 TFHRC 4 114400 X 114438 X
1312017 TFHRC 5 114801 X 114829 X
1312017 TFHRC 6 115408 X 115444 X
1182017 ATP 1 105056 X 105116 X
1182017 ATP 2 105622 X 105656 X
1182017 ATP 3 110348 X 110436 X
1182017 ATP 4 111355 X 111417 X
1182017 ATP 5 111655 X 111717 X
1182017 ATP 6 111947 X 112007 X
1182017 ATP 7 112235 X 112305 X
1182017 ATP 8 112937 X 113013 X
1182017 ATP 9 113313 X 113353 X
1182017 ATP 10 113636 X 113708 X
1192017 ATP 11 45035 X 45057 X
1192017 ATP 13 45806 X 45828 X
1192017 ATP 14 50144 X 50202 X
1192017 ATP 15 50542 X 50600 X
1192017 ATP 16 50903 X 50929 X
APPENDIX A Comprehensive Data Analysis Tables
US Department of Transportation Office of the Assistant Secretary for Research and Technology
Intelligent Transportation Systems Joint Program Office
Task 8 D2X Hub Proof-of-Concept Test Evaluation Report ndash Final | A-12
APPENDIX A Comprehensive Data Analysis Tables
Table A-7 Complete Data Analysis ndash Hy pothesis 8 amp 9
US Department of Transportation Office of the Assistant Secretary for Research and Technology
Intelligent Transportation Systems Joint Program Office
Task 8 D2X Hub Proof-of-Concept Test Evaluation Report ndash Final | A-13
Test Number
Analyze the percentage of PMM messages properly processed by
in-vehicle devices Analyze the percentage of PMM-RSP messages
properly processed by mobile devices
Analyze the percentage of PMM-Cancel messages
properly processed by in-vehicle devices
MDEA Log ndash PMM Send
occurrence
MDEA Log ndash
PMM contents
VEA Log ndash PMM
Receive occurrence
VEA Log ndash Driver
acceptance
VEA Log ndash PMM-RSP
Send occurrence
MDEA Log ndash PMM-RSP
Receive occurrence
MDEA Log ndash Coordination
Status
MDEA Log ndash PMM-
Cancel Sent Occurrence
VEA Log ndash PMM-
Cancel Received
Occurrence
TFHRC 1 Check All Present Check Check Check Check Check Check Check
TFHRC 2 Check All Present Check Check Check Check Check Check Check
TFHRC 3 Check All Present Check Check Check Check Check Check Check
TFHRC 4 Check All Present Check Check Check Check Check Check Check
TFHRC 5 Check All Present Check Check Check Check Check Check Check
ATP 1 Check All Present Check Check Check Check Check Check Check
ATP 2 Check All Present Check Check Check Check Check Check Check
ATP 3 Check All Present Check Check Check Check Check Check Check
ATP 4 Check All Present Check Check Check Check Check Check Check
ATP 5 Check All Present Check Check Check Check Check Check Check
ATP 6 Check All Present Check Check Check Check Check Check Check
ATP 7 Check All Present Check Check Check Check Check Check Check
ATP 8 Check All Present Check Check Check Check Check Check Check
ATP 9 Check All Present Check Check Check Check Check Check Check
ATP 10 Check All Present Check Check Check Check Check Check Check
APPENDIX A Comprehensive Data Analysis Tables
Test Number
Analyze the percentage of PMM messages properly processed by
in-vehicle devices Analyze the percentage of PMM-RSP messages
properly processed by mobile devices
Analyze the percentage of PMM-Cancel messages
properly processed by in-vehicle devices
MDEA Log ndash PMM Send occurrence
MDEA Log ndash PMM
contents
VEA Log ndash PMM
Receive occurrence
VEA Log ndash Driver
acceptance
VEA Log ndash PMM-RSP
Send occurrence
MDEA Log ndash PMM-RSP
Receive occurrence
MDEA Log ndash Coordination
Status
MDEA Log ndash PMM-
Cancel Sent Occurrence
VEA Log ndash PMM-
Cancel Received
Occurrence
ATP 11 Check All Present Check Check Check Check Check Check Check
ATP 12 Check All Present Check Check Check Check Check Check Check
ATP 13 Check All Present Check Check Check Check Check Check Check
ATP 14 Check All Present Check Check Check Check Check Check Check
ATP 15 Check All Present Check Check Check Check Check Check Check
ATP 16 Check All Present Check Check Check Check Check Check Check
ATP 17 Check All Present Check Check Check Check Check Check Check
US Department of Transportation Office of the Assistant Secretary for Research and Technology
Intelligent Transportation Systems Joint Program Office
Task 8 D2X Hub Proof-of-Concept Test Evaluation Report ndash Final | A-14
Table A-8 Complete Data Analysis ndash Hy pothesis 10
Date Test Number
Analyze the Success Rate of Receiving a PMM-Arrive Message
VEA Log ndash PMM-ARRIVE Send Occurrence MDEA Log ndash PMM-ARRIVE Receive Occurrence
1312017 TFHRC 1 Fail Fail
1312017 TFHRC 2 Check Check
1312017 TFHRC 3 Check Check
1312017 TFHRC 4 Check Check
1312017 TFHRC 5 Check Check
1312017 TFHRC 6 Check Check
1312017 TFHRC 7 Check Check
1182017 ATP 1 Not Available Check
1182017 ATP 2 Not Available Check
1182017 ATP 3 Not Available Check
1182017 ATP 4 Not Available Check
1182017 ATP 5 Not Available Check
1182017 ATP 6 Not Available Check
1182017 ATP 7 Not Available Check
1182017 ATP 8 Not Available Check
1182017 ATP 9 Not Available Check
1182017 ATP 10 Not Available Check
1202017 ATP 11 Check Check
1202017 ATP 12 Check Check
1202017 ATP 13 Check Check
1202017 ATP 14 Check Check
1202017 ATP 15 Check Check
APPENDIX A Comprehensive Data Analysis Tables
US Department of Transportation Office of the Assistant Secretary for Research and Technology
Intelligent Transportation Systems Joint Program Office
Task 8 D2X Hub Proof-of-Concept Test Evaluation Report ndash Final | A-15
APPENDIX A Comprehensive Data Analysis Tables
Table A-9 Complete Data Analysis ndash Hypothesis 13 (Part A)
US Department of Transportation Office of the Assistant Secretary for Research and Technology
Intelligent Transportation Systems Joint Program Office
Task 8 D2X Hub Proof-of-Concept Test Evaluation Report ndash Final | A-16
Test Number
Coordination Request Sent
by Y
Coordination Request
Received by X
Request Confirmed
by X Confirmation Received by Y
Coordination Request Sent
by Z
Coordination Request
Received by X
Request Confirmed
by X Confirmation Received by Z
Coordination Heart Beat
Transmitted by Y amp Z
Heart Beat Response received
by X
Ride Arrived
Messages
TFHRC 1
Fail Traveler Y could not join the ad-hoc travel group
TFHRC 2
Check check check check 41047 check check check check check 41303
TFHRC 3
Check Check Check Check Check Check Check Check Check Check Check
TFHRC 4
Fail Traveler Y could not join the ad-hoc travel group
TFHRC 5
Check Check Check Check Check Check Check Check Check Check Check
TFHRC 6
Check Check Check Check Check Check Check Check Check Check Check
TFHRC 7
Check Check Check Check Check Check Check Check Check Check Check
TFHRC 8
Check Check Check Check Check Check Check Check Check Check Check
TFHRC 9
Check Check Check Check Check Check Check Check Check Check Check
TFHRC 10
Check Check Check Check Check Check Check Check Check Check Check
ATP 1 Check Check Check Check Check Check Check Check Check Check Check
ATP 2 Check Check Check Check Check Check Check Check Check Check Check
Test Number
Coordination Request Sent
by Y
Coordination Request
Received by X
Request Confirmed
by X Confirmation Received by Y
Coordination Request Sent
by Z
Coordination Request
Received by X
Request Confirmed
by X Confirmation Received by Z
Coordination Heart Beat
Transmitted by Y amp Z
Heart Beat Response received
by X
Ride Arrived
Messages
ATP 3 Check Check Check Check Check Check Check Check Check Check Check
ATP 4 Check Check Check Check Check Check Check Check Check Check Check
ATP 5 Check Check Check Check Check Check Check Check Check Check Check
ATP 6 Check Check Check Check Check Check Check Check Check Check Check
ATP 7 Check Check Check Check Check Check Check Check Check Check No ride
arrives received
ATP 8 Check Check Check Check Check Check Check Check Check Check Check
ATP 9 Check Check Check Check Check Check Check Check Check Check No ride
arrives received
ATP 10 Check Check Check Check Check Check Check Check Check Check Check
ATP 11 Check Check Check Check Check Check Check Check Check Check Check
ATP 12 Check Check Check Check Check Check Check Check Check Check No ride
arrives received
ATP 13 Check Check Check Check Check Check Check Check Check Check Check
ATP 14 Check Check Check Check Check Check Check Check Check Check Check
ATP 15 Check Check Check Check Check Check Check Check Check Check Check
APPENDIX A Comprehensive Data Analysis Tables
US Department of Transportation Office of the Assistant Secretary for Research and Technology
Intelligent Transportation Systems Joint Program Office
Task 8 D2X Hub Proof-of-Concept Test Evaluation Report ndash Final | A-17
APPENDIX A Comprehensive Data Analysis Tables
Table A-10 Complete Data Analysis ndash Hypothesis 13 (Part B)
US Department of Transportation Office of the Assistant Secretary for Research and Technology
Intelligent Transportation Systems Joint Program Office
Task 8 D2X Hub Proof-of-Concept Test Evaluation Report ndash Final | A-18
Test Number Coordination Cancel by
Walking Away Coordination Cancel by
Manual Request Disband Group after
Entering into Vehicle
TFHRC 1 Check This step not tested on this day
TFHRC 2 Check This step not tested on this day
TFHRC 3 Check This step not tested on this day
TFHRC 4 Check This step not tested on this day
TFHRC 5 Check This step not tested on this day
TFHRC 6 This step not tested on this day Check Check
TFHRC 7 This step not tested on this day Check Check
TFHRC 8 This step not tested on this day Check Check
TFHRC 9 This step not tested on this day Check Check
TFHRC 10 This step not tested on this day Check Check
ATP 1 Check Check Check
ATP 2 Check Check Check
ATP 3 Check Check Check
ATP 4 Check Check Check
ATP 5 Check Check Check
ATP 6 Check Check Check
ATP 7 Check Check Check
ATP 8 Check Check Check
ATP 9 Check Check Check
APPENDIX A Comprehensive Data Analysis Tables
Test Number Coordination Cancel by
Walking Away Coordination Cancel by
Manual Request Disband Group after Entering into Vehicle
ATP 10 Check Check Check
ATP 11 Fail Could not cancel by distance Check Check
ATP 12 Check Check Check
ATP 13 Fail Could not cancel by distance Check Check
ATP 14 Check Check Check
ATP 15 Check Check Check
US Department of Transportation Office of the Assistant Secretary for Research and Technology
Intelligent Transportation Systems Joint Program Office
Task 8 D2X Hub Proof-of-Concept Test Evaluation Report ndash Final | A-19
APPENDIX A Comprehensive Data Analysis Tables
APPENDIX B Acronyms and Abbreviations
ATG Ad-Hoc Travel Group
ATP Acceptance Test Plan
BSM Basic Safety Message
CCP Common Computing Platform
CV Connected Vehicle
DSRC Dedicated Short Range Communications
EPS Experimental Prototype System
FHWA Federal Highway Administration
FR Functional Requirement
ITS Intelligent Transportation Systems
LDV Light-Duty Vehicle
MAP Map Data
MDEA Mobile Device Experimental Application
MGL Message Logging
OBU On-board Unit
PMM Personal Mobility Message
PMM-ARRIVE Personal Mobility Message Arrival Message
PMM-CANCEL Personal Mobility Message Cancel Message
PMM-RSP Personal Mobility Message Response Message
PR Performance Requirement
PSM Personal Safety Message
REA Roadside Experimental Application
RSU Roadside Unit
SFY Safety
SIR System Interface Requirement
SMP SPaT and MAP
SPaT Signal Phasing and Timing
SyRS System Requirements Specifications
TFHRC Turner-Fairbank Highway Research Center
US DOT US Department of Transportation
US Department of Transportation Office of the Assistant Secretary for Research and Technology
Intelligent Transportation Systems Joint Program Office
Task 8 D2X Hub Proof-of-Concept Test Evaluation Report ndash Final |B-1
VEA Vehicle Experimental Application
Wi-Fi Wireless Fidelity
APPENDIX B Acronyms and Abbreviations
US Department of Transportation Office of the Assistant Secretary for Research and Technology
Intelligent Transportation Systems Joint Program Office
Task 8 D2X Hub Proof-of-Concept Test Evaluation Report ndash Final | B-2
APPENDIX C Terms and Definitions
Basic Safety Message (BSM)
Connected vehicle message type which contains vehicle safety-related information that is broadcast to surrounding vehicles
Bluetooth Short range wireless technology used to exchange data between enabled devices
Cellular Uses short-range radio stations to cover areas of communication
Connected Vehicle A vehicle that can communicate with other vehicles and infrastructure via communication media such as DSRC Wi-Fi cellular or Bluetooth
Coordinated Messages are coordinated when two or more mobile devices have establish a travel group based on the same origin destination and
time and function as a single cohesive senderrecipient
CV Inspector An application that verifies if the Mobile Device is broadcasting messages to Connected Vehicles
Destination The end point of a travelerrsquos trip
DSRC Dedicated Short-Range Communications a low-latency high-reliability two-way communications tool used for sending transportation safety
messages
Light-Duty Vehicle Of or relating to vehicles that way less than 4000 lbs
Message Type Type of personal safety or personal mobility message that is transmitted based on the technology used and level of coordination available
Personal Mobility Message (PMM)
Similar to PDM message intended for the exchange of mobility messages between individual travelers and vehiclesinfrastructure via
mobile device
Personal Safety Message (PSM)
Similar to BSM message intended to transmit low-latency urgent safety messages between individual travelers and vehiclesinfrastructure via
mobile device
Test Case A set of conditions or variables that a Tester can determine if system meets requirements
Transit Vehicle Large vehicles mainly used for public transportation as well as support services
Transmitting The state in which a traveler has opted in and is sendingreceiving messages via mobile device
Uncoordinated Messages are uncoordinated when travel groups are not established (see coordinated definition)
Wi-Fi Local area wireless technology that allows enabled devices to connect to the Internet
APPENDIX A Comprehensive Data Analysis Tables
US Department of Transportation Office of the Assistant Secretary for Research and Technology
Intelligent Transportation Systems Joint Program Office
Task 8 D2X Hub Proof-of-Concept Test Evaluation Report ndash Final |C-1
ITS Joint Program Office-HOIT 1200 New Jersey Avenue SE
Washington DC 20590
Toll-Free ldquoHelp Linerdquo 866-367-7487 wwwitsdotgov
FHWA-JPO-18-263
- Structure Bookmarks
-
- Sharing Data between Mobile Devices Connected Vehicles and Infrastructure Task 8 D2X Hub Proof-of-Concept Test Evaluation Report wwwitsdotgovindexhtm Final Report mdash October 25 2017 FHWA-JPO-18-623
- Revision History
- Table of Contents
- Chapter 1 Scope
- Chapter 2 Referenced Documents
- Chapter 3 Test Conduct
- Chapter 4 Experimental Analysis Results Summary
- Chapter 5 Experimental Analysis
- Chapter 6 Lessons Learned and Recommendations
- APPENDIX A Comprehensive Data Analysis Tables
- APPENDIX B Acronyms and Abbreviations
- APPENDIX C Terms and Definitions
-

APPENDIX A Comprehensive Data Analysis Tables
Test Number
Type of Message
True Distance (m)
Speed (MPH)
Expected Distance (m)
Difference (m)
ATP7
Advisory 7500 1972 7934 434
Alert 3882 1914 4008 126
Warning 3400 1946 3614 214
ATP8
Advisory 6659 1744 7017 358
Alert 3263 1682 3396 133
Warning 2900 1682 3037 137
ATP9
Advisory 6605 1659 6675 070
Alert 2900 1556 3078 178
Warning 2365 1561 2781 416
ATP10
Advisory 9214 2491 10022 808
Alert 5859 2688 6301 442
Warning 5200 2644 5273 073
ATP11
Advisory 8485 2487 10006 1521
Alert 5376 2487 5668 292
Warning 4716 2483 4873 157
ATP12
Advisory 9001 2433 9789 788
Alert 5395 2420 5463 068
Warning 4103 2330 4503 400
ATP13
Advisory 8615 2559 10296 1681
Alert 000 000 000 000
Warning 4930 2581 5115 185
ATP14
Advisory 6119 2491 10022 3903
Alert 5500 2491 5681 181
Warning 3800 2402 4676 876
ATP15
Advisory 7546 2603 10473 2927
Alert 6000 2661 6215 215
Warning 3100 2603 5170 2070
ATP16
Advisory 7931 2089 8405 474
Alert 3995 1950 4106 111
Warning 3500 1923 3563 063
ATP17
Advisory 8243 2049 8244 001
Alert 5260 2465 5601 341
Warning 4718 2438 4763 045
US Department of Transportation Office of the Assistant Secretary for Research and Technology
Intelligent Transportation Systems Joint Program Office
Task 8 D2X Hub Proof-of-Concept Test Evaluation Report ndash Final | A-11
Table A-6 Complete Data Analysis ndash Hypothesis 7
Date Test
Number
User State Change Is
Safe Icon False
Properly Processed
User State Change Is
Safe Icon True
Properly Processed
1312017 TFHRC 1 111438 X 111504 X
1312017 TFHRC 3 112533 X 112619 X
1312017 TFHRC 4 114400 X 114438 X
1312017 TFHRC 5 114801 X 114829 X
1312017 TFHRC 6 115408 X 115444 X
1182017 ATP 1 105056 X 105116 X
1182017 ATP 2 105622 X 105656 X
1182017 ATP 3 110348 X 110436 X
1182017 ATP 4 111355 X 111417 X
1182017 ATP 5 111655 X 111717 X
1182017 ATP 6 111947 X 112007 X
1182017 ATP 7 112235 X 112305 X
1182017 ATP 8 112937 X 113013 X
1182017 ATP 9 113313 X 113353 X
1182017 ATP 10 113636 X 113708 X
1192017 ATP 11 45035 X 45057 X
1192017 ATP 13 45806 X 45828 X
1192017 ATP 14 50144 X 50202 X
1192017 ATP 15 50542 X 50600 X
1192017 ATP 16 50903 X 50929 X
APPENDIX A Comprehensive Data Analysis Tables
US Department of Transportation Office of the Assistant Secretary for Research and Technology
Intelligent Transportation Systems Joint Program Office
Task 8 D2X Hub Proof-of-Concept Test Evaluation Report ndash Final | A-12
APPENDIX A Comprehensive Data Analysis Tables
Table A-7 Complete Data Analysis ndash Hy pothesis 8 amp 9
US Department of Transportation Office of the Assistant Secretary for Research and Technology
Intelligent Transportation Systems Joint Program Office
Task 8 D2X Hub Proof-of-Concept Test Evaluation Report ndash Final | A-13
Test Number
Analyze the percentage of PMM messages properly processed by
in-vehicle devices Analyze the percentage of PMM-RSP messages
properly processed by mobile devices
Analyze the percentage of PMM-Cancel messages
properly processed by in-vehicle devices
MDEA Log ndash PMM Send
occurrence
MDEA Log ndash
PMM contents
VEA Log ndash PMM
Receive occurrence
VEA Log ndash Driver
acceptance
VEA Log ndash PMM-RSP
Send occurrence
MDEA Log ndash PMM-RSP
Receive occurrence
MDEA Log ndash Coordination
Status
MDEA Log ndash PMM-
Cancel Sent Occurrence
VEA Log ndash PMM-
Cancel Received
Occurrence
TFHRC 1 Check All Present Check Check Check Check Check Check Check
TFHRC 2 Check All Present Check Check Check Check Check Check Check
TFHRC 3 Check All Present Check Check Check Check Check Check Check
TFHRC 4 Check All Present Check Check Check Check Check Check Check
TFHRC 5 Check All Present Check Check Check Check Check Check Check
ATP 1 Check All Present Check Check Check Check Check Check Check
ATP 2 Check All Present Check Check Check Check Check Check Check
ATP 3 Check All Present Check Check Check Check Check Check Check
ATP 4 Check All Present Check Check Check Check Check Check Check
ATP 5 Check All Present Check Check Check Check Check Check Check
ATP 6 Check All Present Check Check Check Check Check Check Check
ATP 7 Check All Present Check Check Check Check Check Check Check
ATP 8 Check All Present Check Check Check Check Check Check Check
ATP 9 Check All Present Check Check Check Check Check Check Check
ATP 10 Check All Present Check Check Check Check Check Check Check
APPENDIX A Comprehensive Data Analysis Tables
Test Number
Analyze the percentage of PMM messages properly processed by
in-vehicle devices Analyze the percentage of PMM-RSP messages
properly processed by mobile devices
Analyze the percentage of PMM-Cancel messages
properly processed by in-vehicle devices
MDEA Log ndash PMM Send occurrence
MDEA Log ndash PMM
contents
VEA Log ndash PMM
Receive occurrence
VEA Log ndash Driver
acceptance
VEA Log ndash PMM-RSP
Send occurrence
MDEA Log ndash PMM-RSP
Receive occurrence
MDEA Log ndash Coordination
Status
MDEA Log ndash PMM-
Cancel Sent Occurrence
VEA Log ndash PMM-
Cancel Received
Occurrence
ATP 11 Check All Present Check Check Check Check Check Check Check
ATP 12 Check All Present Check Check Check Check Check Check Check
ATP 13 Check All Present Check Check Check Check Check Check Check
ATP 14 Check All Present Check Check Check Check Check Check Check
ATP 15 Check All Present Check Check Check Check Check Check Check
ATP 16 Check All Present Check Check Check Check Check Check Check
ATP 17 Check All Present Check Check Check Check Check Check Check
US Department of Transportation Office of the Assistant Secretary for Research and Technology
Intelligent Transportation Systems Joint Program Office
Task 8 D2X Hub Proof-of-Concept Test Evaluation Report ndash Final | A-14
Table A-8 Complete Data Analysis ndash Hy pothesis 10
Date Test Number
Analyze the Success Rate of Receiving a PMM-Arrive Message
VEA Log ndash PMM-ARRIVE Send Occurrence MDEA Log ndash PMM-ARRIVE Receive Occurrence
1312017 TFHRC 1 Fail Fail
1312017 TFHRC 2 Check Check
1312017 TFHRC 3 Check Check
1312017 TFHRC 4 Check Check
1312017 TFHRC 5 Check Check
1312017 TFHRC 6 Check Check
1312017 TFHRC 7 Check Check
1182017 ATP 1 Not Available Check
1182017 ATP 2 Not Available Check
1182017 ATP 3 Not Available Check
1182017 ATP 4 Not Available Check
1182017 ATP 5 Not Available Check
1182017 ATP 6 Not Available Check
1182017 ATP 7 Not Available Check
1182017 ATP 8 Not Available Check
1182017 ATP 9 Not Available Check
1182017 ATP 10 Not Available Check
1202017 ATP 11 Check Check
1202017 ATP 12 Check Check
1202017 ATP 13 Check Check
1202017 ATP 14 Check Check
1202017 ATP 15 Check Check
APPENDIX A Comprehensive Data Analysis Tables
US Department of Transportation Office of the Assistant Secretary for Research and Technology
Intelligent Transportation Systems Joint Program Office
Task 8 D2X Hub Proof-of-Concept Test Evaluation Report ndash Final | A-15
APPENDIX A Comprehensive Data Analysis Tables
Table A-9 Complete Data Analysis ndash Hypothesis 13 (Part A)
US Department of Transportation Office of the Assistant Secretary for Research and Technology
Intelligent Transportation Systems Joint Program Office
Task 8 D2X Hub Proof-of-Concept Test Evaluation Report ndash Final | A-16
Test Number
Coordination Request Sent
by Y
Coordination Request
Received by X
Request Confirmed
by X Confirmation Received by Y
Coordination Request Sent
by Z
Coordination Request
Received by X
Request Confirmed
by X Confirmation Received by Z
Coordination Heart Beat
Transmitted by Y amp Z
Heart Beat Response received
by X
Ride Arrived
Messages
TFHRC 1
Fail Traveler Y could not join the ad-hoc travel group
TFHRC 2
Check check check check 41047 check check check check check 41303
TFHRC 3
Check Check Check Check Check Check Check Check Check Check Check
TFHRC 4
Fail Traveler Y could not join the ad-hoc travel group
TFHRC 5
Check Check Check Check Check Check Check Check Check Check Check
TFHRC 6
Check Check Check Check Check Check Check Check Check Check Check
TFHRC 7
Check Check Check Check Check Check Check Check Check Check Check
TFHRC 8
Check Check Check Check Check Check Check Check Check Check Check
TFHRC 9
Check Check Check Check Check Check Check Check Check Check Check
TFHRC 10
Check Check Check Check Check Check Check Check Check Check Check
ATP 1 Check Check Check Check Check Check Check Check Check Check Check
ATP 2 Check Check Check Check Check Check Check Check Check Check Check
Test Number
Coordination Request Sent
by Y
Coordination Request
Received by X
Request Confirmed
by X Confirmation Received by Y
Coordination Request Sent
by Z
Coordination Request
Received by X
Request Confirmed
by X Confirmation Received by Z
Coordination Heart Beat
Transmitted by Y amp Z
Heart Beat Response received
by X
Ride Arrived
Messages
ATP 3 Check Check Check Check Check Check Check Check Check Check Check
ATP 4 Check Check Check Check Check Check Check Check Check Check Check
ATP 5 Check Check Check Check Check Check Check Check Check Check Check
ATP 6 Check Check Check Check Check Check Check Check Check Check Check
ATP 7 Check Check Check Check Check Check Check Check Check Check No ride
arrives received
ATP 8 Check Check Check Check Check Check Check Check Check Check Check
ATP 9 Check Check Check Check Check Check Check Check Check Check No ride
arrives received
ATP 10 Check Check Check Check Check Check Check Check Check Check Check
ATP 11 Check Check Check Check Check Check Check Check Check Check Check
ATP 12 Check Check Check Check Check Check Check Check Check Check No ride
arrives received
ATP 13 Check Check Check Check Check Check Check Check Check Check Check
ATP 14 Check Check Check Check Check Check Check Check Check Check Check
ATP 15 Check Check Check Check Check Check Check Check Check Check Check
APPENDIX A Comprehensive Data Analysis Tables
US Department of Transportation Office of the Assistant Secretary for Research and Technology
Intelligent Transportation Systems Joint Program Office
Task 8 D2X Hub Proof-of-Concept Test Evaluation Report ndash Final | A-17
APPENDIX A Comprehensive Data Analysis Tables
Table A-10 Complete Data Analysis ndash Hypothesis 13 (Part B)
US Department of Transportation Office of the Assistant Secretary for Research and Technology
Intelligent Transportation Systems Joint Program Office
Task 8 D2X Hub Proof-of-Concept Test Evaluation Report ndash Final | A-18
Test Number Coordination Cancel by
Walking Away Coordination Cancel by
Manual Request Disband Group after
Entering into Vehicle
TFHRC 1 Check This step not tested on this day
TFHRC 2 Check This step not tested on this day
TFHRC 3 Check This step not tested on this day
TFHRC 4 Check This step not tested on this day
TFHRC 5 Check This step not tested on this day
TFHRC 6 This step not tested on this day Check Check
TFHRC 7 This step not tested on this day Check Check
TFHRC 8 This step not tested on this day Check Check
TFHRC 9 This step not tested on this day Check Check
TFHRC 10 This step not tested on this day Check Check
ATP 1 Check Check Check
ATP 2 Check Check Check
ATP 3 Check Check Check
ATP 4 Check Check Check
ATP 5 Check Check Check
ATP 6 Check Check Check
ATP 7 Check Check Check
ATP 8 Check Check Check
ATP 9 Check Check Check
APPENDIX A Comprehensive Data Analysis Tables
Test Number Coordination Cancel by
Walking Away Coordination Cancel by
Manual Request Disband Group after Entering into Vehicle
ATP 10 Check Check Check
ATP 11 Fail Could not cancel by distance Check Check
ATP 12 Check Check Check
ATP 13 Fail Could not cancel by distance Check Check
ATP 14 Check Check Check
ATP 15 Check Check Check
US Department of Transportation Office of the Assistant Secretary for Research and Technology
Intelligent Transportation Systems Joint Program Office
Task 8 D2X Hub Proof-of-Concept Test Evaluation Report ndash Final | A-19
APPENDIX A Comprehensive Data Analysis Tables
APPENDIX B Acronyms and Abbreviations
ATG Ad-Hoc Travel Group
ATP Acceptance Test Plan
BSM Basic Safety Message
CCP Common Computing Platform
CV Connected Vehicle
DSRC Dedicated Short Range Communications
EPS Experimental Prototype System
FHWA Federal Highway Administration
FR Functional Requirement
ITS Intelligent Transportation Systems
LDV Light-Duty Vehicle
MAP Map Data
MDEA Mobile Device Experimental Application
MGL Message Logging
OBU On-board Unit
PMM Personal Mobility Message
PMM-ARRIVE Personal Mobility Message Arrival Message
PMM-CANCEL Personal Mobility Message Cancel Message
PMM-RSP Personal Mobility Message Response Message
PR Performance Requirement
PSM Personal Safety Message
REA Roadside Experimental Application
RSU Roadside Unit
SFY Safety
SIR System Interface Requirement
SMP SPaT and MAP
SPaT Signal Phasing and Timing
SyRS System Requirements Specifications
TFHRC Turner-Fairbank Highway Research Center
US DOT US Department of Transportation
US Department of Transportation Office of the Assistant Secretary for Research and Technology
Intelligent Transportation Systems Joint Program Office
Task 8 D2X Hub Proof-of-Concept Test Evaluation Report ndash Final |B-1
VEA Vehicle Experimental Application
Wi-Fi Wireless Fidelity
APPENDIX B Acronyms and Abbreviations
US Department of Transportation Office of the Assistant Secretary for Research and Technology
Intelligent Transportation Systems Joint Program Office
Task 8 D2X Hub Proof-of-Concept Test Evaluation Report ndash Final | B-2
APPENDIX C Terms and Definitions
Basic Safety Message (BSM)
Connected vehicle message type which contains vehicle safety-related information that is broadcast to surrounding vehicles
Bluetooth Short range wireless technology used to exchange data between enabled devices
Cellular Uses short-range radio stations to cover areas of communication
Connected Vehicle A vehicle that can communicate with other vehicles and infrastructure via communication media such as DSRC Wi-Fi cellular or Bluetooth
Coordinated Messages are coordinated when two or more mobile devices have establish a travel group based on the same origin destination and
time and function as a single cohesive senderrecipient
CV Inspector An application that verifies if the Mobile Device is broadcasting messages to Connected Vehicles
Destination The end point of a travelerrsquos trip
DSRC Dedicated Short-Range Communications a low-latency high-reliability two-way communications tool used for sending transportation safety
messages
Light-Duty Vehicle Of or relating to vehicles that way less than 4000 lbs
Message Type Type of personal safety or personal mobility message that is transmitted based on the technology used and level of coordination available
Personal Mobility Message (PMM)
Similar to PDM message intended for the exchange of mobility messages between individual travelers and vehiclesinfrastructure via
mobile device
Personal Safety Message (PSM)
Similar to BSM message intended to transmit low-latency urgent safety messages between individual travelers and vehiclesinfrastructure via
mobile device
Test Case A set of conditions or variables that a Tester can determine if system meets requirements
Transit Vehicle Large vehicles mainly used for public transportation as well as support services
Transmitting The state in which a traveler has opted in and is sendingreceiving messages via mobile device
Uncoordinated Messages are uncoordinated when travel groups are not established (see coordinated definition)
Wi-Fi Local area wireless technology that allows enabled devices to connect to the Internet
APPENDIX A Comprehensive Data Analysis Tables
US Department of Transportation Office of the Assistant Secretary for Research and Technology
Intelligent Transportation Systems Joint Program Office
Task 8 D2X Hub Proof-of-Concept Test Evaluation Report ndash Final |C-1
ITS Joint Program Office-HOIT 1200 New Jersey Avenue SE
Washington DC 20590
Toll-Free ldquoHelp Linerdquo 866-367-7487 wwwitsdotgov
FHWA-JPO-18-263
- Structure Bookmarks
-
- Sharing Data between Mobile Devices Connected Vehicles and Infrastructure Task 8 D2X Hub Proof-of-Concept Test Evaluation Report wwwitsdotgovindexhtm Final Report mdash October 25 2017 FHWA-JPO-18-623
- Revision History
- Table of Contents
- Chapter 1 Scope
- Chapter 2 Referenced Documents
- Chapter 3 Test Conduct
- Chapter 4 Experimental Analysis Results Summary
- Chapter 5 Experimental Analysis
- Chapter 6 Lessons Learned and Recommendations
- APPENDIX A Comprehensive Data Analysis Tables
- APPENDIX B Acronyms and Abbreviations
- APPENDIX C Terms and Definitions
-

APPENDIX A Comprehensive Data Analysis Tables
Table A-7 Complete Data Analysis ndash Hy pothesis 8 amp 9
US Department of Transportation Office of the Assistant Secretary for Research and Technology
Intelligent Transportation Systems Joint Program Office
Task 8 D2X Hub Proof-of-Concept Test Evaluation Report ndash Final | A-13
Test Number
Analyze the percentage of PMM messages properly processed by
in-vehicle devices Analyze the percentage of PMM-RSP messages
properly processed by mobile devices
Analyze the percentage of PMM-Cancel messages
properly processed by in-vehicle devices
MDEA Log ndash PMM Send
occurrence
MDEA Log ndash
PMM contents
VEA Log ndash PMM
Receive occurrence
VEA Log ndash Driver
acceptance
VEA Log ndash PMM-RSP
Send occurrence
MDEA Log ndash PMM-RSP
Receive occurrence
MDEA Log ndash Coordination
Status
MDEA Log ndash PMM-
Cancel Sent Occurrence
VEA Log ndash PMM-
Cancel Received
Occurrence
TFHRC 1 Check All Present Check Check Check Check Check Check Check
TFHRC 2 Check All Present Check Check Check Check Check Check Check
TFHRC 3 Check All Present Check Check Check Check Check Check Check
TFHRC 4 Check All Present Check Check Check Check Check Check Check
TFHRC 5 Check All Present Check Check Check Check Check Check Check
ATP 1 Check All Present Check Check Check Check Check Check Check
ATP 2 Check All Present Check Check Check Check Check Check Check
ATP 3 Check All Present Check Check Check Check Check Check Check
ATP 4 Check All Present Check Check Check Check Check Check Check
ATP 5 Check All Present Check Check Check Check Check Check Check
ATP 6 Check All Present Check Check Check Check Check Check Check
ATP 7 Check All Present Check Check Check Check Check Check Check
ATP 8 Check All Present Check Check Check Check Check Check Check
ATP 9 Check All Present Check Check Check Check Check Check Check
ATP 10 Check All Present Check Check Check Check Check Check Check
APPENDIX A Comprehensive Data Analysis Tables
Test Number
Analyze the percentage of PMM messages properly processed by
in-vehicle devices Analyze the percentage of PMM-RSP messages
properly processed by mobile devices
Analyze the percentage of PMM-Cancel messages
properly processed by in-vehicle devices
MDEA Log ndash PMM Send occurrence
MDEA Log ndash PMM
contents
VEA Log ndash PMM
Receive occurrence
VEA Log ndash Driver
acceptance
VEA Log ndash PMM-RSP
Send occurrence
MDEA Log ndash PMM-RSP
Receive occurrence
MDEA Log ndash Coordination
Status
MDEA Log ndash PMM-
Cancel Sent Occurrence
VEA Log ndash PMM-
Cancel Received
Occurrence
ATP 11 Check All Present Check Check Check Check Check Check Check
ATP 12 Check All Present Check Check Check Check Check Check Check
ATP 13 Check All Present Check Check Check Check Check Check Check
ATP 14 Check All Present Check Check Check Check Check Check Check
ATP 15 Check All Present Check Check Check Check Check Check Check
ATP 16 Check All Present Check Check Check Check Check Check Check
ATP 17 Check All Present Check Check Check Check Check Check Check
US Department of Transportation Office of the Assistant Secretary for Research and Technology
Intelligent Transportation Systems Joint Program Office
Task 8 D2X Hub Proof-of-Concept Test Evaluation Report ndash Final | A-14
Table A-8 Complete Data Analysis ndash Hy pothesis 10
Date Test Number
Analyze the Success Rate of Receiving a PMM-Arrive Message
VEA Log ndash PMM-ARRIVE Send Occurrence MDEA Log ndash PMM-ARRIVE Receive Occurrence
1312017 TFHRC 1 Fail Fail
1312017 TFHRC 2 Check Check
1312017 TFHRC 3 Check Check
1312017 TFHRC 4 Check Check
1312017 TFHRC 5 Check Check
1312017 TFHRC 6 Check Check
1312017 TFHRC 7 Check Check
1182017 ATP 1 Not Available Check
1182017 ATP 2 Not Available Check
1182017 ATP 3 Not Available Check
1182017 ATP 4 Not Available Check
1182017 ATP 5 Not Available Check
1182017 ATP 6 Not Available Check
1182017 ATP 7 Not Available Check
1182017 ATP 8 Not Available Check
1182017 ATP 9 Not Available Check
1182017 ATP 10 Not Available Check
1202017 ATP 11 Check Check
1202017 ATP 12 Check Check
1202017 ATP 13 Check Check
1202017 ATP 14 Check Check
1202017 ATP 15 Check Check
APPENDIX A Comprehensive Data Analysis Tables
US Department of Transportation Office of the Assistant Secretary for Research and Technology
Intelligent Transportation Systems Joint Program Office
Task 8 D2X Hub Proof-of-Concept Test Evaluation Report ndash Final | A-15
APPENDIX A Comprehensive Data Analysis Tables
Table A-9 Complete Data Analysis ndash Hypothesis 13 (Part A)
US Department of Transportation Office of the Assistant Secretary for Research and Technology
Intelligent Transportation Systems Joint Program Office
Task 8 D2X Hub Proof-of-Concept Test Evaluation Report ndash Final | A-16
Test Number
Coordination Request Sent
by Y
Coordination Request
Received by X
Request Confirmed
by X Confirmation Received by Y
Coordination Request Sent
by Z
Coordination Request
Received by X
Request Confirmed
by X Confirmation Received by Z
Coordination Heart Beat
Transmitted by Y amp Z
Heart Beat Response received
by X
Ride Arrived
Messages
TFHRC 1
Fail Traveler Y could not join the ad-hoc travel group
TFHRC 2
Check check check check 41047 check check check check check 41303
TFHRC 3
Check Check Check Check Check Check Check Check Check Check Check
TFHRC 4
Fail Traveler Y could not join the ad-hoc travel group
TFHRC 5
Check Check Check Check Check Check Check Check Check Check Check
TFHRC 6
Check Check Check Check Check Check Check Check Check Check Check
TFHRC 7
Check Check Check Check Check Check Check Check Check Check Check
TFHRC 8
Check Check Check Check Check Check Check Check Check Check Check
TFHRC 9
Check Check Check Check Check Check Check Check Check Check Check
TFHRC 10
Check Check Check Check Check Check Check Check Check Check Check
ATP 1 Check Check Check Check Check Check Check Check Check Check Check
ATP 2 Check Check Check Check Check Check Check Check Check Check Check
Test Number
Coordination Request Sent
by Y
Coordination Request
Received by X
Request Confirmed
by X Confirmation Received by Y
Coordination Request Sent
by Z
Coordination Request
Received by X
Request Confirmed
by X Confirmation Received by Z
Coordination Heart Beat
Transmitted by Y amp Z
Heart Beat Response received
by X
Ride Arrived
Messages
ATP 3 Check Check Check Check Check Check Check Check Check Check Check
ATP 4 Check Check Check Check Check Check Check Check Check Check Check
ATP 5 Check Check Check Check Check Check Check Check Check Check Check
ATP 6 Check Check Check Check Check Check Check Check Check Check Check
ATP 7 Check Check Check Check Check Check Check Check Check Check No ride
arrives received
ATP 8 Check Check Check Check Check Check Check Check Check Check Check
ATP 9 Check Check Check Check Check Check Check Check Check Check No ride
arrives received
ATP 10 Check Check Check Check Check Check Check Check Check Check Check
ATP 11 Check Check Check Check Check Check Check Check Check Check Check
ATP 12 Check Check Check Check Check Check Check Check Check Check No ride
arrives received
ATP 13 Check Check Check Check Check Check Check Check Check Check Check
ATP 14 Check Check Check Check Check Check Check Check Check Check Check
ATP 15 Check Check Check Check Check Check Check Check Check Check Check
APPENDIX A Comprehensive Data Analysis Tables
US Department of Transportation Office of the Assistant Secretary for Research and Technology
Intelligent Transportation Systems Joint Program Office
Task 8 D2X Hub Proof-of-Concept Test Evaluation Report ndash Final | A-17
APPENDIX A Comprehensive Data Analysis Tables
Table A-10 Complete Data Analysis ndash Hypothesis 13 (Part B)
US Department of Transportation Office of the Assistant Secretary for Research and Technology
Intelligent Transportation Systems Joint Program Office
Task 8 D2X Hub Proof-of-Concept Test Evaluation Report ndash Final | A-18
Test Number Coordination Cancel by
Walking Away Coordination Cancel by
Manual Request Disband Group after
Entering into Vehicle
TFHRC 1 Check This step not tested on this day
TFHRC 2 Check This step not tested on this day
TFHRC 3 Check This step not tested on this day
TFHRC 4 Check This step not tested on this day
TFHRC 5 Check This step not tested on this day
TFHRC 6 This step not tested on this day Check Check
TFHRC 7 This step not tested on this day Check Check
TFHRC 8 This step not tested on this day Check Check
TFHRC 9 This step not tested on this day Check Check
TFHRC 10 This step not tested on this day Check Check
ATP 1 Check Check Check
ATP 2 Check Check Check
ATP 3 Check Check Check
ATP 4 Check Check Check
ATP 5 Check Check Check
ATP 6 Check Check Check
ATP 7 Check Check Check
ATP 8 Check Check Check
ATP 9 Check Check Check
APPENDIX A Comprehensive Data Analysis Tables
Test Number Coordination Cancel by
Walking Away Coordination Cancel by
Manual Request Disband Group after Entering into Vehicle
ATP 10 Check Check Check
ATP 11 Fail Could not cancel by distance Check Check
ATP 12 Check Check Check
ATP 13 Fail Could not cancel by distance Check Check
ATP 14 Check Check Check
ATP 15 Check Check Check
US Department of Transportation Office of the Assistant Secretary for Research and Technology
Intelligent Transportation Systems Joint Program Office
Task 8 D2X Hub Proof-of-Concept Test Evaluation Report ndash Final | A-19
APPENDIX A Comprehensive Data Analysis Tables
APPENDIX B Acronyms and Abbreviations
ATG Ad-Hoc Travel Group
ATP Acceptance Test Plan
BSM Basic Safety Message
CCP Common Computing Platform
CV Connected Vehicle
DSRC Dedicated Short Range Communications
EPS Experimental Prototype System
FHWA Federal Highway Administration
FR Functional Requirement
ITS Intelligent Transportation Systems
LDV Light-Duty Vehicle
MAP Map Data
MDEA Mobile Device Experimental Application
MGL Message Logging
OBU On-board Unit
PMM Personal Mobility Message
PMM-ARRIVE Personal Mobility Message Arrival Message
PMM-CANCEL Personal Mobility Message Cancel Message
PMM-RSP Personal Mobility Message Response Message
PR Performance Requirement
PSM Personal Safety Message
REA Roadside Experimental Application
RSU Roadside Unit
SFY Safety
SIR System Interface Requirement
SMP SPaT and MAP
SPaT Signal Phasing and Timing
SyRS System Requirements Specifications
TFHRC Turner-Fairbank Highway Research Center
US DOT US Department of Transportation
US Department of Transportation Office of the Assistant Secretary for Research and Technology
Intelligent Transportation Systems Joint Program Office
Task 8 D2X Hub Proof-of-Concept Test Evaluation Report ndash Final |B-1
VEA Vehicle Experimental Application
Wi-Fi Wireless Fidelity
APPENDIX B Acronyms and Abbreviations
US Department of Transportation Office of the Assistant Secretary for Research and Technology
Intelligent Transportation Systems Joint Program Office
Task 8 D2X Hub Proof-of-Concept Test Evaluation Report ndash Final | B-2
APPENDIX C Terms and Definitions
Basic Safety Message (BSM)
Connected vehicle message type which contains vehicle safety-related information that is broadcast to surrounding vehicles
Bluetooth Short range wireless technology used to exchange data between enabled devices
Cellular Uses short-range radio stations to cover areas of communication
Connected Vehicle A vehicle that can communicate with other vehicles and infrastructure via communication media such as DSRC Wi-Fi cellular or Bluetooth
Coordinated Messages are coordinated when two or more mobile devices have establish a travel group based on the same origin destination and
time and function as a single cohesive senderrecipient
CV Inspector An application that verifies if the Mobile Device is broadcasting messages to Connected Vehicles
Destination The end point of a travelerrsquos trip
DSRC Dedicated Short-Range Communications a low-latency high-reliability two-way communications tool used for sending transportation safety
messages
Light-Duty Vehicle Of or relating to vehicles that way less than 4000 lbs
Message Type Type of personal safety or personal mobility message that is transmitted based on the technology used and level of coordination available
Personal Mobility Message (PMM)
Similar to PDM message intended for the exchange of mobility messages between individual travelers and vehiclesinfrastructure via
mobile device
Personal Safety Message (PSM)
Similar to BSM message intended to transmit low-latency urgent safety messages between individual travelers and vehiclesinfrastructure via
mobile device
Test Case A set of conditions or variables that a Tester can determine if system meets requirements
Transit Vehicle Large vehicles mainly used for public transportation as well as support services
Transmitting The state in which a traveler has opted in and is sendingreceiving messages via mobile device
Uncoordinated Messages are uncoordinated when travel groups are not established (see coordinated definition)
Wi-Fi Local area wireless technology that allows enabled devices to connect to the Internet
APPENDIX A Comprehensive Data Analysis Tables
US Department of Transportation Office of the Assistant Secretary for Research and Technology
Intelligent Transportation Systems Joint Program Office
Task 8 D2X Hub Proof-of-Concept Test Evaluation Report ndash Final |C-1
ITS Joint Program Office-HOIT 1200 New Jersey Avenue SE
Washington DC 20590
Toll-Free ldquoHelp Linerdquo 866-367-7487 wwwitsdotgov
FHWA-JPO-18-263
- Structure Bookmarks
-
- Sharing Data between Mobile Devices Connected Vehicles and Infrastructure Task 8 D2X Hub Proof-of-Concept Test Evaluation Report wwwitsdotgovindexhtm Final Report mdash October 25 2017 FHWA-JPO-18-623
- Revision History
- Table of Contents
- Chapter 1 Scope
- Chapter 2 Referenced Documents
- Chapter 3 Test Conduct
- Chapter 4 Experimental Analysis Results Summary
- Chapter 5 Experimental Analysis
- Chapter 6 Lessons Learned and Recommendations
- APPENDIX A Comprehensive Data Analysis Tables
- APPENDIX B Acronyms and Abbreviations
- APPENDIX C Terms and Definitions
-
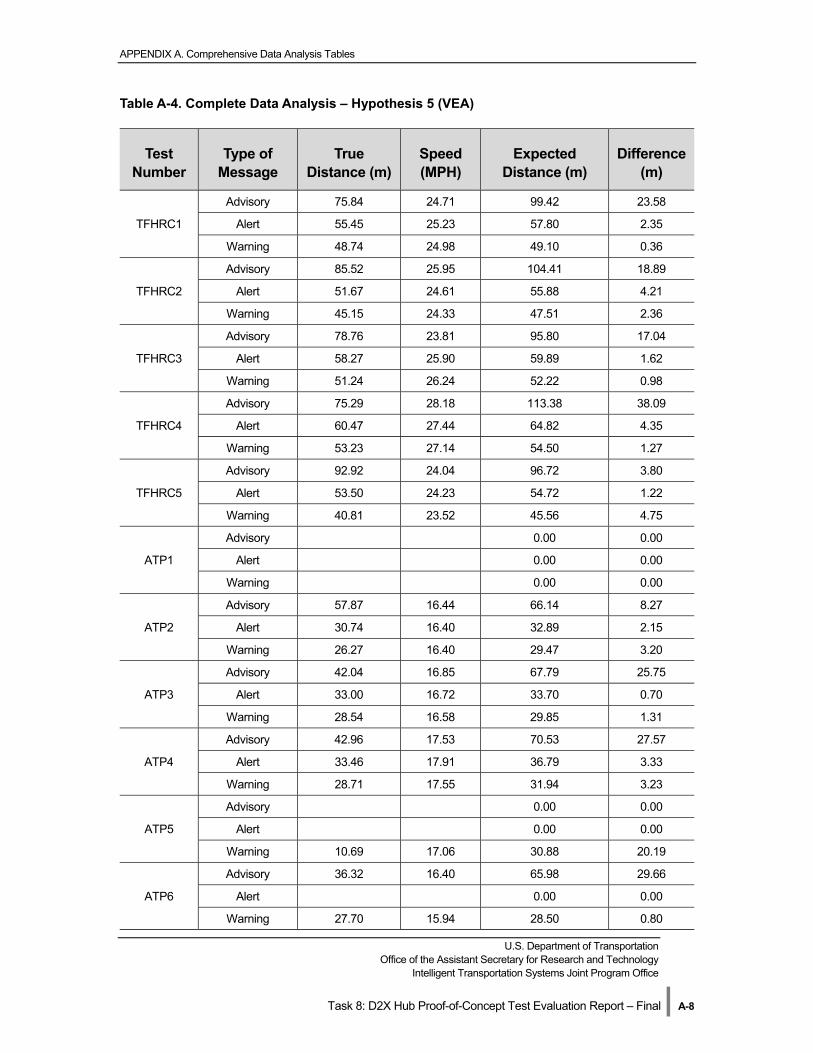
APPENDIX A Comprehensive Data Analysis Tables
Test Number
Analyze the percentage of PMM messages properly processed by
in-vehicle devices Analyze the percentage of PMM-RSP messages
properly processed by mobile devices
Analyze the percentage of PMM-Cancel messages
properly processed by in-vehicle devices
MDEA Log ndash PMM Send occurrence
MDEA Log ndash PMM
contents
VEA Log ndash PMM
Receive occurrence
VEA Log ndash Driver
acceptance
VEA Log ndash PMM-RSP
Send occurrence
MDEA Log ndash PMM-RSP
Receive occurrence
MDEA Log ndash Coordination
Status
MDEA Log ndash PMM-
Cancel Sent Occurrence
VEA Log ndash PMM-
Cancel Received
Occurrence
ATP 11 Check All Present Check Check Check Check Check Check Check
ATP 12 Check All Present Check Check Check Check Check Check Check
ATP 13 Check All Present Check Check Check Check Check Check Check
ATP 14 Check All Present Check Check Check Check Check Check Check
ATP 15 Check All Present Check Check Check Check Check Check Check
ATP 16 Check All Present Check Check Check Check Check Check Check
ATP 17 Check All Present Check Check Check Check Check Check Check
US Department of Transportation Office of the Assistant Secretary for Research and Technology
Intelligent Transportation Systems Joint Program Office
Task 8 D2X Hub Proof-of-Concept Test Evaluation Report ndash Final | A-14
Table A-8 Complete Data Analysis ndash Hy pothesis 10
Date Test Number
Analyze the Success Rate of Receiving a PMM-Arrive Message
VEA Log ndash PMM-ARRIVE Send Occurrence MDEA Log ndash PMM-ARRIVE Receive Occurrence
1312017 TFHRC 1 Fail Fail
1312017 TFHRC 2 Check Check
1312017 TFHRC 3 Check Check
1312017 TFHRC 4 Check Check
1312017 TFHRC 5 Check Check
1312017 TFHRC 6 Check Check
1312017 TFHRC 7 Check Check
1182017 ATP 1 Not Available Check
1182017 ATP 2 Not Available Check
1182017 ATP 3 Not Available Check
1182017 ATP 4 Not Available Check
1182017 ATP 5 Not Available Check
1182017 ATP 6 Not Available Check
1182017 ATP 7 Not Available Check
1182017 ATP 8 Not Available Check
1182017 ATP 9 Not Available Check
1182017 ATP 10 Not Available Check
1202017 ATP 11 Check Check
1202017 ATP 12 Check Check
1202017 ATP 13 Check Check
1202017 ATP 14 Check Check
1202017 ATP 15 Check Check
APPENDIX A Comprehensive Data Analysis Tables
US Department of Transportation Office of the Assistant Secretary for Research and Technology
Intelligent Transportation Systems Joint Program Office
Task 8 D2X Hub Proof-of-Concept Test Evaluation Report ndash Final | A-15
APPENDIX A Comprehensive Data Analysis Tables
Table A-9 Complete Data Analysis ndash Hypothesis 13 (Part A)
US Department of Transportation Office of the Assistant Secretary for Research and Technology
Intelligent Transportation Systems Joint Program Office
Task 8 D2X Hub Proof-of-Concept Test Evaluation Report ndash Final | A-16
Test Number
Coordination Request Sent
by Y
Coordination Request
Received by X
Request Confirmed
by X Confirmation Received by Y
Coordination Request Sent
by Z
Coordination Request
Received by X
Request Confirmed
by X Confirmation Received by Z
Coordination Heart Beat
Transmitted by Y amp Z
Heart Beat Response received
by X
Ride Arrived
Messages
TFHRC 1
Fail Traveler Y could not join the ad-hoc travel group
TFHRC 2
Check check check check 41047 check check check check check 41303
TFHRC 3
Check Check Check Check Check Check Check Check Check Check Check
TFHRC 4
Fail Traveler Y could not join the ad-hoc travel group
TFHRC 5
Check Check Check Check Check Check Check Check Check Check Check
TFHRC 6
Check Check Check Check Check Check Check Check Check Check Check
TFHRC 7
Check Check Check Check Check Check Check Check Check Check Check
TFHRC 8
Check Check Check Check Check Check Check Check Check Check Check
TFHRC 9
Check Check Check Check Check Check Check Check Check Check Check
TFHRC 10
Check Check Check Check Check Check Check Check Check Check Check
ATP 1 Check Check Check Check Check Check Check Check Check Check Check
ATP 2 Check Check Check Check Check Check Check Check Check Check Check
Test Number
Coordination Request Sent
by Y
Coordination Request
Received by X
Request Confirmed
by X Confirmation Received by Y
Coordination Request Sent
by Z
Coordination Request
Received by X
Request Confirmed
by X Confirmation Received by Z
Coordination Heart Beat
Transmitted by Y amp Z
Heart Beat Response received
by X
Ride Arrived
Messages
ATP 3 Check Check Check Check Check Check Check Check Check Check Check
ATP 4 Check Check Check Check Check Check Check Check Check Check Check
ATP 5 Check Check Check Check Check Check Check Check Check Check Check
ATP 6 Check Check Check Check Check Check Check Check Check Check Check
ATP 7 Check Check Check Check Check Check Check Check Check Check No ride
arrives received
ATP 8 Check Check Check Check Check Check Check Check Check Check Check
ATP 9 Check Check Check Check Check Check Check Check Check Check No ride
arrives received
ATP 10 Check Check Check Check Check Check Check Check Check Check Check
ATP 11 Check Check Check Check Check Check Check Check Check Check Check
ATP 12 Check Check Check Check Check Check Check Check Check Check No ride
arrives received
ATP 13 Check Check Check Check Check Check Check Check Check Check Check
ATP 14 Check Check Check Check Check Check Check Check Check Check Check
ATP 15 Check Check Check Check Check Check Check Check Check Check Check
APPENDIX A Comprehensive Data Analysis Tables
US Department of Transportation Office of the Assistant Secretary for Research and Technology
Intelligent Transportation Systems Joint Program Office
Task 8 D2X Hub Proof-of-Concept Test Evaluation Report ndash Final | A-17
APPENDIX A Comprehensive Data Analysis Tables
Table A-10 Complete Data Analysis ndash Hypothesis 13 (Part B)
US Department of Transportation Office of the Assistant Secretary for Research and Technology
Intelligent Transportation Systems Joint Program Office
Task 8 D2X Hub Proof-of-Concept Test Evaluation Report ndash Final | A-18
Test Number Coordination Cancel by
Walking Away Coordination Cancel by
Manual Request Disband Group after
Entering into Vehicle
TFHRC 1 Check This step not tested on this day
TFHRC 2 Check This step not tested on this day
TFHRC 3 Check This step not tested on this day
TFHRC 4 Check This step not tested on this day
TFHRC 5 Check This step not tested on this day
TFHRC 6 This step not tested on this day Check Check
TFHRC 7 This step not tested on this day Check Check
TFHRC 8 This step not tested on this day Check Check
TFHRC 9 This step not tested on this day Check Check
TFHRC 10 This step not tested on this day Check Check
ATP 1 Check Check Check
ATP 2 Check Check Check
ATP 3 Check Check Check
ATP 4 Check Check Check
ATP 5 Check Check Check
ATP 6 Check Check Check
ATP 7 Check Check Check
ATP 8 Check Check Check
ATP 9 Check Check Check
APPENDIX A Comprehensive Data Analysis Tables
Test Number Coordination Cancel by
Walking Away Coordination Cancel by
Manual Request Disband Group after Entering into Vehicle
ATP 10 Check Check Check
ATP 11 Fail Could not cancel by distance Check Check
ATP 12 Check Check Check
ATP 13 Fail Could not cancel by distance Check Check
ATP 14 Check Check Check
ATP 15 Check Check Check
US Department of Transportation Office of the Assistant Secretary for Research and Technology
Intelligent Transportation Systems Joint Program Office
Task 8 D2X Hub Proof-of-Concept Test Evaluation Report ndash Final | A-19
APPENDIX A Comprehensive Data Analysis Tables
APPENDIX B Acronyms and Abbreviations
ATG Ad-Hoc Travel Group
ATP Acceptance Test Plan
BSM Basic Safety Message
CCP Common Computing Platform
CV Connected Vehicle
DSRC Dedicated Short Range Communications
EPS Experimental Prototype System
FHWA Federal Highway Administration
FR Functional Requirement
ITS Intelligent Transportation Systems
LDV Light-Duty Vehicle
MAP Map Data
MDEA Mobile Device Experimental Application
MGL Message Logging
OBU On-board Unit
PMM Personal Mobility Message
PMM-ARRIVE Personal Mobility Message Arrival Message
PMM-CANCEL Personal Mobility Message Cancel Message
PMM-RSP Personal Mobility Message Response Message
PR Performance Requirement
PSM Personal Safety Message
REA Roadside Experimental Application
RSU Roadside Unit
SFY Safety
SIR System Interface Requirement
SMP SPaT and MAP
SPaT Signal Phasing and Timing
SyRS System Requirements Specifications
TFHRC Turner-Fairbank Highway Research Center
US DOT US Department of Transportation
US Department of Transportation Office of the Assistant Secretary for Research and Technology
Intelligent Transportation Systems Joint Program Office
Task 8 D2X Hub Proof-of-Concept Test Evaluation Report ndash Final |B-1
VEA Vehicle Experimental Application
Wi-Fi Wireless Fidelity
APPENDIX B Acronyms and Abbreviations
US Department of Transportation Office of the Assistant Secretary for Research and Technology
Intelligent Transportation Systems Joint Program Office
Task 8 D2X Hub Proof-of-Concept Test Evaluation Report ndash Final | B-2
APPENDIX C Terms and Definitions
Basic Safety Message (BSM)
Connected vehicle message type which contains vehicle safety-related information that is broadcast to surrounding vehicles
Bluetooth Short range wireless technology used to exchange data between enabled devices
Cellular Uses short-range radio stations to cover areas of communication
Connected Vehicle A vehicle that can communicate with other vehicles and infrastructure via communication media such as DSRC Wi-Fi cellular or Bluetooth
Coordinated Messages are coordinated when two or more mobile devices have establish a travel group based on the same origin destination and
time and function as a single cohesive senderrecipient
CV Inspector An application that verifies if the Mobile Device is broadcasting messages to Connected Vehicles
Destination The end point of a travelerrsquos trip
DSRC Dedicated Short-Range Communications a low-latency high-reliability two-way communications tool used for sending transportation safety
messages
Light-Duty Vehicle Of or relating to vehicles that way less than 4000 lbs
Message Type Type of personal safety or personal mobility message that is transmitted based on the technology used and level of coordination available
Personal Mobility Message (PMM)
Similar to PDM message intended for the exchange of mobility messages between individual travelers and vehiclesinfrastructure via
mobile device
Personal Safety Message (PSM)
Similar to BSM message intended to transmit low-latency urgent safety messages between individual travelers and vehiclesinfrastructure via
mobile device
Test Case A set of conditions or variables that a Tester can determine if system meets requirements
Transit Vehicle Large vehicles mainly used for public transportation as well as support services
Transmitting The state in which a traveler has opted in and is sendingreceiving messages via mobile device
Uncoordinated Messages are uncoordinated when travel groups are not established (see coordinated definition)
Wi-Fi Local area wireless technology that allows enabled devices to connect to the Internet
APPENDIX A Comprehensive Data Analysis Tables
US Department of Transportation Office of the Assistant Secretary for Research and Technology
Intelligent Transportation Systems Joint Program Office
Task 8 D2X Hub Proof-of-Concept Test Evaluation Report ndash Final |C-1
ITS Joint Program Office-HOIT 1200 New Jersey Avenue SE
Washington DC 20590
Toll-Free ldquoHelp Linerdquo 866-367-7487 wwwitsdotgov
FHWA-JPO-18-263
- Structure Bookmarks
-
- Sharing Data between Mobile Devices Connected Vehicles and Infrastructure Task 8 D2X Hub Proof-of-Concept Test Evaluation Report wwwitsdotgovindexhtm Final Report mdash October 25 2017 FHWA-JPO-18-623
- Revision History
- Table of Contents
- Chapter 1 Scope
- Chapter 2 Referenced Documents
- Chapter 3 Test Conduct
- Chapter 4 Experimental Analysis Results Summary
- Chapter 5 Experimental Analysis
- Chapter 6 Lessons Learned and Recommendations
- APPENDIX A Comprehensive Data Analysis Tables
- APPENDIX B Acronyms and Abbreviations
- APPENDIX C Terms and Definitions
-

APPENDIX A Comprehensive Data Analysis Tables
Table A-9 Complete Data Analysis ndash Hypothesis 13 (Part A)
US Department of Transportation Office of the Assistant Secretary for Research and Technology
Intelligent Transportation Systems Joint Program Office
Task 8 D2X Hub Proof-of-Concept Test Evaluation Report ndash Final | A-16
Test Number
Coordination Request Sent
by Y
Coordination Request
Received by X
Request Confirmed
by X Confirmation Received by Y
Coordination Request Sent
by Z
Coordination Request
Received by X
Request Confirmed
by X Confirmation Received by Z
Coordination Heart Beat
Transmitted by Y amp Z
Heart Beat Response received
by X
Ride Arrived
Messages
TFHRC 1
Fail Traveler Y could not join the ad-hoc travel group
TFHRC 2
Check check check check 41047 check check check check check 41303
TFHRC 3
Check Check Check Check Check Check Check Check Check Check Check
TFHRC 4
Fail Traveler Y could not join the ad-hoc travel group
TFHRC 5
Check Check Check Check Check Check Check Check Check Check Check
TFHRC 6
Check Check Check Check Check Check Check Check Check Check Check
TFHRC 7
Check Check Check Check Check Check Check Check Check Check Check
TFHRC 8
Check Check Check Check Check Check Check Check Check Check Check
TFHRC 9
Check Check Check Check Check Check Check Check Check Check Check
TFHRC 10
Check Check Check Check Check Check Check Check Check Check Check
ATP 1 Check Check Check Check Check Check Check Check Check Check Check
ATP 2 Check Check Check Check Check Check Check Check Check Check Check
Test Number
Coordination Request Sent
by Y
Coordination Request
Received by X
Request Confirmed
by X Confirmation Received by Y
Coordination Request Sent
by Z
Coordination Request
Received by X
Request Confirmed
by X Confirmation Received by Z
Coordination Heart Beat
Transmitted by Y amp Z
Heart Beat Response received
by X
Ride Arrived
Messages
ATP 3 Check Check Check Check Check Check Check Check Check Check Check
ATP 4 Check Check Check Check Check Check Check Check Check Check Check
ATP 5 Check Check Check Check Check Check Check Check Check Check Check
ATP 6 Check Check Check Check Check Check Check Check Check Check Check
ATP 7 Check Check Check Check Check Check Check Check Check Check No ride
arrives received
ATP 8 Check Check Check Check Check Check Check Check Check Check Check
ATP 9 Check Check Check Check Check Check Check Check Check Check No ride
arrives received
ATP 10 Check Check Check Check Check Check Check Check Check Check Check
ATP 11 Check Check Check Check Check Check Check Check Check Check Check
ATP 12 Check Check Check Check Check Check Check Check Check Check No ride
arrives received
ATP 13 Check Check Check Check Check Check Check Check Check Check Check
ATP 14 Check Check Check Check Check Check Check Check Check Check Check
ATP 15 Check Check Check Check Check Check Check Check Check Check Check
APPENDIX A Comprehensive Data Analysis Tables
US Department of Transportation Office of the Assistant Secretary for Research and Technology
Intelligent Transportation Systems Joint Program Office
Task 8 D2X Hub Proof-of-Concept Test Evaluation Report ndash Final | A-17
APPENDIX A Comprehensive Data Analysis Tables
Table A-10 Complete Data Analysis ndash Hypothesis 13 (Part B)
US Department of Transportation Office of the Assistant Secretary for Research and Technology
Intelligent Transportation Systems Joint Program Office
Task 8 D2X Hub Proof-of-Concept Test Evaluation Report ndash Final | A-18
Test Number Coordination Cancel by
Walking Away Coordination Cancel by
Manual Request Disband Group after
Entering into Vehicle
TFHRC 1 Check This step not tested on this day
TFHRC 2 Check This step not tested on this day
TFHRC 3 Check This step not tested on this day
TFHRC 4 Check This step not tested on this day
TFHRC 5 Check This step not tested on this day
TFHRC 6 This step not tested on this day Check Check
TFHRC 7 This step not tested on this day Check Check
TFHRC 8 This step not tested on this day Check Check
TFHRC 9 This step not tested on this day Check Check
TFHRC 10 This step not tested on this day Check Check
ATP 1 Check Check Check
ATP 2 Check Check Check
ATP 3 Check Check Check
ATP 4 Check Check Check
ATP 5 Check Check Check
ATP 6 Check Check Check
ATP 7 Check Check Check
ATP 8 Check Check Check
ATP 9 Check Check Check
APPENDIX A Comprehensive Data Analysis Tables
Test Number Coordination Cancel by
Walking Away Coordination Cancel by
Manual Request Disband Group after Entering into Vehicle
ATP 10 Check Check Check
ATP 11 Fail Could not cancel by distance Check Check
ATP 12 Check Check Check
ATP 13 Fail Could not cancel by distance Check Check
ATP 14 Check Check Check
ATP 15 Check Check Check
US Department of Transportation Office of the Assistant Secretary for Research and Technology
Intelligent Transportation Systems Joint Program Office
Task 8 D2X Hub Proof-of-Concept Test Evaluation Report ndash Final | A-19
APPENDIX A Comprehensive Data Analysis Tables
APPENDIX B Acronyms and Abbreviations
ATG Ad-Hoc Travel Group
ATP Acceptance Test Plan
BSM Basic Safety Message
CCP Common Computing Platform
CV Connected Vehicle
DSRC Dedicated Short Range Communications
EPS Experimental Prototype System
FHWA Federal Highway Administration
FR Functional Requirement
ITS Intelligent Transportation Systems
LDV Light-Duty Vehicle
MAP Map Data
MDEA Mobile Device Experimental Application
MGL Message Logging
OBU On-board Unit
PMM Personal Mobility Message
PMM-ARRIVE Personal Mobility Message Arrival Message
PMM-CANCEL Personal Mobility Message Cancel Message
PMM-RSP Personal Mobility Message Response Message
PR Performance Requirement
PSM Personal Safety Message
REA Roadside Experimental Application
RSU Roadside Unit
SFY Safety
SIR System Interface Requirement
SMP SPaT and MAP
SPaT Signal Phasing and Timing
SyRS System Requirements Specifications
TFHRC Turner-Fairbank Highway Research Center
US DOT US Department of Transportation
US Department of Transportation Office of the Assistant Secretary for Research and Technology
Intelligent Transportation Systems Joint Program Office
Task 8 D2X Hub Proof-of-Concept Test Evaluation Report ndash Final |B-1
VEA Vehicle Experimental Application
Wi-Fi Wireless Fidelity
APPENDIX B Acronyms and Abbreviations
US Department of Transportation Office of the Assistant Secretary for Research and Technology
Intelligent Transportation Systems Joint Program Office
Task 8 D2X Hub Proof-of-Concept Test Evaluation Report ndash Final | B-2
APPENDIX C Terms and Definitions
Basic Safety Message (BSM)
Connected vehicle message type which contains vehicle safety-related information that is broadcast to surrounding vehicles
Bluetooth Short range wireless technology used to exchange data between enabled devices
Cellular Uses short-range radio stations to cover areas of communication
Connected Vehicle A vehicle that can communicate with other vehicles and infrastructure via communication media such as DSRC Wi-Fi cellular or Bluetooth
Coordinated Messages are coordinated when two or more mobile devices have establish a travel group based on the same origin destination and
time and function as a single cohesive senderrecipient
CV Inspector An application that verifies if the Mobile Device is broadcasting messages to Connected Vehicles
Destination The end point of a travelerrsquos trip
DSRC Dedicated Short-Range Communications a low-latency high-reliability two-way communications tool used for sending transportation safety
messages
Light-Duty Vehicle Of or relating to vehicles that way less than 4000 lbs
Message Type Type of personal safety or personal mobility message that is transmitted based on the technology used and level of coordination available
Personal Mobility Message (PMM)
Similar to PDM message intended for the exchange of mobility messages between individual travelers and vehiclesinfrastructure via
mobile device
Personal Safety Message (PSM)
Similar to BSM message intended to transmit low-latency urgent safety messages between individual travelers and vehiclesinfrastructure via
mobile device
Test Case A set of conditions or variables that a Tester can determine if system meets requirements
Transit Vehicle Large vehicles mainly used for public transportation as well as support services
Transmitting The state in which a traveler has opted in and is sendingreceiving messages via mobile device
Uncoordinated Messages are uncoordinated when travel groups are not established (see coordinated definition)
Wi-Fi Local area wireless technology that allows enabled devices to connect to the Internet
APPENDIX A Comprehensive Data Analysis Tables
US Department of Transportation Office of the Assistant Secretary for Research and Technology
Intelligent Transportation Systems Joint Program Office
Task 8 D2X Hub Proof-of-Concept Test Evaluation Report ndash Final |C-1
ITS Joint Program Office-HOIT 1200 New Jersey Avenue SE
Washington DC 20590
Toll-Free ldquoHelp Linerdquo 866-367-7487 wwwitsdotgov
FHWA-JPO-18-263
- Structure Bookmarks
-
- Sharing Data between Mobile Devices Connected Vehicles and Infrastructure Task 8 D2X Hub Proof-of-Concept Test Evaluation Report wwwitsdotgovindexhtm Final Report mdash October 25 2017 FHWA-JPO-18-623
- Revision History
- Table of Contents
- Chapter 1 Scope
- Chapter 2 Referenced Documents
- Chapter 3 Test Conduct
- Chapter 4 Experimental Analysis Results Summary
- Chapter 5 Experimental Analysis
- Chapter 6 Lessons Learned and Recommendations
- APPENDIX A Comprehensive Data Analysis Tables
- APPENDIX B Acronyms and Abbreviations
- APPENDIX C Terms and Definitions
-

APPENDIX A Comprehensive Data Analysis Tables
APPENDIX B Acronyms and Abbreviations
ATG Ad-Hoc Travel Group
ATP Acceptance Test Plan
BSM Basic Safety Message
CCP Common Computing Platform
CV Connected Vehicle
DSRC Dedicated Short Range Communications
EPS Experimental Prototype System
FHWA Federal Highway Administration
FR Functional Requirement
ITS Intelligent Transportation Systems
LDV Light-Duty Vehicle
MAP Map Data
MDEA Mobile Device Experimental Application
MGL Message Logging
OBU On-board Unit
PMM Personal Mobility Message
PMM-ARRIVE Personal Mobility Message Arrival Message
PMM-CANCEL Personal Mobility Message Cancel Message
PMM-RSP Personal Mobility Message Response Message
PR Performance Requirement
PSM Personal Safety Message
REA Roadside Experimental Application
RSU Roadside Unit
SFY Safety
SIR System Interface Requirement
SMP SPaT and MAP
SPaT Signal Phasing and Timing
SyRS System Requirements Specifications
TFHRC Turner-Fairbank Highway Research Center
US DOT US Department of Transportation
US Department of Transportation Office of the Assistant Secretary for Research and Technology
Intelligent Transportation Systems Joint Program Office
Task 8 D2X Hub Proof-of-Concept Test Evaluation Report ndash Final |B-1
VEA Vehicle Experimental Application
Wi-Fi Wireless Fidelity
APPENDIX B Acronyms and Abbreviations
US Department of Transportation Office of the Assistant Secretary for Research and Technology
Intelligent Transportation Systems Joint Program Office
Task 8 D2X Hub Proof-of-Concept Test Evaluation Report ndash Final | B-2
APPENDIX C Terms and Definitions
Basic Safety Message (BSM)
Connected vehicle message type which contains vehicle safety-related information that is broadcast to surrounding vehicles
Bluetooth Short range wireless technology used to exchange data between enabled devices
Cellular Uses short-range radio stations to cover areas of communication
Connected Vehicle A vehicle that can communicate with other vehicles and infrastructure via communication media such as DSRC Wi-Fi cellular or Bluetooth
Coordinated Messages are coordinated when two or more mobile devices have establish a travel group based on the same origin destination and
time and function as a single cohesive senderrecipient
CV Inspector An application that verifies if the Mobile Device is broadcasting messages to Connected Vehicles
Destination The end point of a travelerrsquos trip
DSRC Dedicated Short-Range Communications a low-latency high-reliability two-way communications tool used for sending transportation safety
messages
Light-Duty Vehicle Of or relating to vehicles that way less than 4000 lbs
Message Type Type of personal safety or personal mobility message that is transmitted based on the technology used and level of coordination available
Personal Mobility Message (PMM)
Similar to PDM message intended for the exchange of mobility messages between individual travelers and vehiclesinfrastructure via
mobile device
Personal Safety Message (PSM)
Similar to BSM message intended to transmit low-latency urgent safety messages between individual travelers and vehiclesinfrastructure via
mobile device
Test Case A set of conditions or variables that a Tester can determine if system meets requirements
Transit Vehicle Large vehicles mainly used for public transportation as well as support services
Transmitting The state in which a traveler has opted in and is sendingreceiving messages via mobile device
Uncoordinated Messages are uncoordinated when travel groups are not established (see coordinated definition)
Wi-Fi Local area wireless technology that allows enabled devices to connect to the Internet
APPENDIX A Comprehensive Data Analysis Tables
US Department of Transportation Office of the Assistant Secretary for Research and Technology
Intelligent Transportation Systems Joint Program Office
Task 8 D2X Hub Proof-of-Concept Test Evaluation Report ndash Final |C-1
ITS Joint Program Office-HOIT 1200 New Jersey Avenue SE
Washington DC 20590
Toll-Free ldquoHelp Linerdquo 866-367-7487 wwwitsdotgov
FHWA-JPO-18-263
- Structure Bookmarks
-
- Sharing Data between Mobile Devices Connected Vehicles and Infrastructure Task 8 D2X Hub Proof-of-Concept Test Evaluation Report wwwitsdotgovindexhtm Final Report mdash October 25 2017 FHWA-JPO-18-623
- Revision History
- Table of Contents
- Chapter 1 Scope
- Chapter 2 Referenced Documents
- Chapter 3 Test Conduct
- Chapter 4 Experimental Analysis Results Summary
- Chapter 5 Experimental Analysis
- Chapter 6 Lessons Learned and Recommendations
- APPENDIX A Comprehensive Data Analysis Tables
- APPENDIX B Acronyms and Abbreviations
- APPENDIX C Terms and Definitions
-