shaping the future - annualreports.com
TRANSCRIPT

SHAPINGTHE FUTURE...
Annual Report and Accounts 2007

...THROUGH PASSION AND
INSIGHTTNS is a global market information
and insight group.
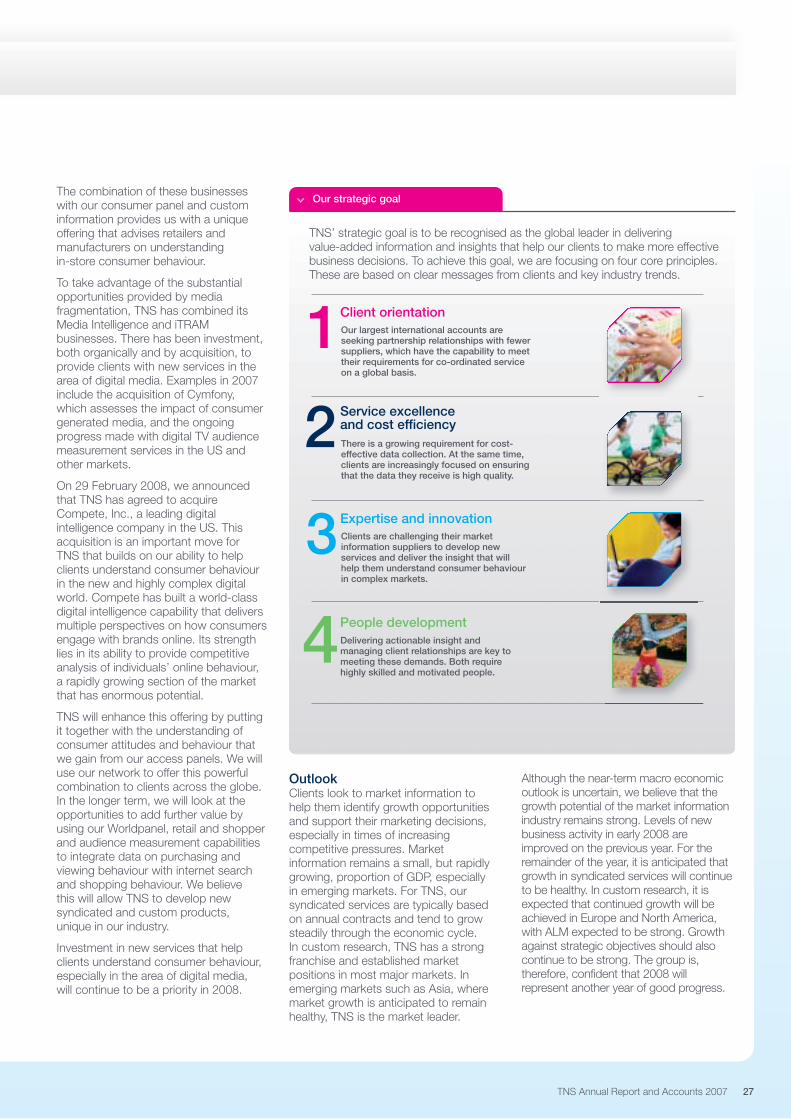
Our strategic goal is to be recognised as the global leader in delivering value-added
information and insights that help our clients to make more effective business decisions.
TNS is the sixth sense of businessTM.
TNS Annual Report and Accounts 2007 1
Understanding the Big Issues
2 The big issues
Directors’ Report – Business Review
18 Performance highlights
19 Chairman’s statement
20 TNS at a glance
24 Chief Executive’s strategic review
30 Delivering responsibly
34 Finance Director’s report on performance
39 Risk
Directors’ Report – Governance
40 Board of directors
42 Senior management team
44 Corporate governance report
48 Other statutory information
50 Directors’ remuneration report
55 Independent auditors’ report
56 Consolidated income statement
57 Balance sheets
58 Cash flow statements
59 Statements of recognised incomeand expense
60 Notes to the financial statements
95 Five year summary
96 Shareholder information
Our strategic goal is supportedby four core principles, whichaddress the big issues facedby our clients.
2Client orientation
6Service excellenceand cost efficiency
10Expertise and innovation
14People development
Meeting the challenge of globalisation
Use of technology in operations
Impact of media fragmentation
Delivering actionable insight
�
Further information
Information and video online
Shareholder Information
Financial Statements

Global future nowLarge, international companies continue to see new opportunities outside theirtraditional markets: in Asia Pacific, Latin America, the Middle East and Africa,as well as in Eastern Europe. As these economies grow, the major multinationalsare expanding their existing brands and launching new products based on rapidlyincreasing consumer demand.
The potential for further expansion of demand in the emerging markets is shown below. Market information spend still represents a relatively small proportion of GDP,when compared with more mature economies.
Preferred suppliersThe ability to expand into new regions successfully requires information about thosemarkets. Major multinational companies are looking for support from suppliers whohave the presence and the capability to provide them with this knowledge. As thisdemand for insight and analysis becomes more global, clients increasingly look todevelop partnerships with a smaller number of suppliers, who have global capabilities.
Brave new worldA broader geographic shift of power is also taking place, from the US and WesternEurope to countries such as China and India. Companies based in the emergingmarkets are fast becoming global powerhouses. At the same time, traditional concepts of geographic base are becoming outdated as companies look to source the best services regardless of geographic boundaries.
Meeting the challenge of globalisation
2 www.tnsglobal.com
www.tnsglobal.com/smallworld�
Market research spend as % of GDP2006
0.11
J
0.09
I
0.08
H
0.07
G
0.06
F
0.05
E
0.04
D
0.03
C
0.02
B
0.01
A
Source: Esomar Global Market Research Report 2007
Net growth above 10%
A India
B China, Russia
C Malaysia, Peru, Ukraine
D Lithuania, Venezuela, Argentina
E Brazil, Hong Kong, Bulgaria
Net growth 0-2%
I Sweden
J France, UK
Net growth 2-5%
F US
G Australia
H Germany
Fast growing markets Mature markets

TNS Annual Report and Accounts 2007 3
SMALL WORLD?�

4 www.tnsglobal.com
Dedicated frameworkTNS Global Clients and Sectors focuses on three areas: the organisation of dedicatedglobal sector teams; driving revenue from our Global Account Programme; and havingeffective protocols to support large and multi-country projects. Each area is supportedby dedicated resources, with the objective of being the industry leader.
Sector focus and Global Partnership AccountsA key differentiator is that TNS’ Global Sectors act as revenue drivers, responsible fordeveloping new products and services. Sector heads are actively involved in majoraccount relationships. Account teams are co-ordinated by the sectors, to cut acrossgeographies and be tailored to client needs.
In 2007, TNS extended its Global Account Programme to include 50 clients. 13 of thesehave been nominated Global Partnership Accounts. They are clients that have indicateda desire to partner with their supplier and invest their own resources in globalrelationships. They have the potential to spend at a higher rate and consolidate morebusiness with TNS. Each has a dedicated Global Account Director, who provides asingle point of contact, builds the relationship and ensures the successful delivery ofprojects. Four regional hubs manage multi-country projects, so that account teamscan price and pitch for business most effectively.
Client orientation
TNS has a strategy and operational structure in place that capitaliseson one of the most extensive international networks in the marketinformation industry.
Matthew Froggatt MD, Global Technology SectorShari Morwood EVP Technology, Media andTelecom Sector, North AmericaJames Fergusson Strategic Head Sectors, ALM
Technology – a global growth sectorTNS’ Global Technology Sector is managed bya cross-regional steering committee of seniormanagers. They develop and implement asector strategy based on four big trends –consumerisation, innovation, mobility andconvergence. The committee is responsiblefor devising new revenue streams andco-ordinating sector activity for 700 client-facing people across the world.
The sector has an integrated approach to communication and knowledge sharing,working as a community to develop best-practice pitch protocols for large pieces of international business, case studies and account planning.
TNS has identified Technology as a key growthsector. Its success is an important factor indelivery against the Global Clients and Sectorstrategy. There are 11 global accounts in theTechnology sector, representing around 40% of total sector revenues. In 2007, theseaccounts grew by almost 10%, validating thesector strategy and the investment that hasbeen made in building those relationships.
Arjen Kuijten Regional Director, TNS EuropeTrevor Richards Regional Managing Director, UK and Ireland
Developing more effective client relationships‘Move!’ is a programme of organisationalchange in TNS’ European custom business,which frees up more time for employees inaccount facing roles to focus on building more effective client relationships.
It is about streamlining and automatingprocedural and project management functions.This is complemented by a more formalisedpitch process for high-value projects.
The programme emphasises developmentof client service teams, with skills andmanagement training. This is supported byincreased focus on marketing TNS’ uniquepositioning: the combination of sector andresearch expertise to provide added-value.
Move! is based on successful changeprogrammes already applied in France and theNetherlands. It is driven by TNS Europe’s seniormanagement team and being implemented bycountry managing directors.

TNS Annual Report and Accounts 2007 5
...BIG OPPORTUNITIES!
6 www.tnsglobal.com
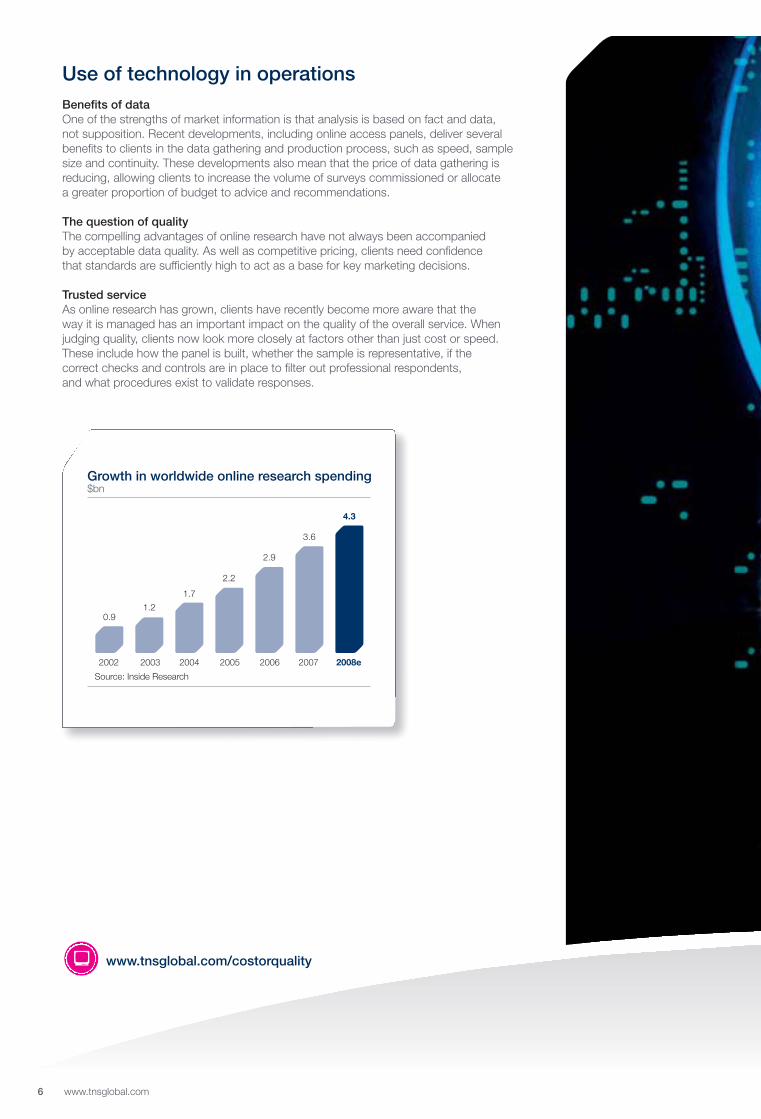
Benefits of dataOne of the strengths of market information is that analysis is based on fact and data,not supposition. Recent developments, including online access panels, deliver severalbenefits to clients in the data gathering and production process, such as speed, samplesize and continuity. These developments also mean that the price of data gathering isreducing, allowing clients to increase the volume of surveys commissioned or allocate a greater proportion of budget to advice and recommendations.
The question of qualityThe compelling advantages of online research have not always been accompanied by acceptable data quality. As well as competitive pricing, clients need confidence that standards are sufficiently high to act as a base for key marketing decisions.
Trusted serviceAs online research has grown, clients have recently become more aware that theway it is managed has an important impact on the quality of the overall service. Whenjudging quality, clients now look more closely at factors other than just cost or speed.These include how the panel is built, whether the sample is representative, if thecorrect checks and controls are in place to filter out professional respondents,and what procedures exist to validate responses.
Use of technology in operations
www.tnsglobal.com/costorquality�
Growth in worldwide online research spending$bn
2008e20072006200520042003
0.91.2
1.7
2.2
2.9
3.6
4.3
2002
Source: Inside Research

TNS Annual Report and Accounts 2007 7
COST OR QUALITY?�

8 www.tnsglobal.com
Not just the internetAlthough it has seen significant growth, the internet remains just one methodology fordata collection. As well as expanding 6th dimension™ access panel coverage in Europe,Asia and Latin America and rapidly transitioning surveys online, TNS is actively involvedin reducing overall data collection costs. This includes the use of smart software tooptimise call centre utilisation.
Looking across all operationsAt the same time as reducing costs of data collection, whatever the methodology,TNS is active in looking across its global operational structure to provide clients witha more efficient service. Key initiatives include standardising systems, automationof the production process, off-shoring and the rationalisation of delivery systems.
Maintaining quality standardsAs well as improving operational effectiveness, TNS remains committed to maintainingstandards of quality that clients can trust. The integrity of data is especially importantin online research and TNS has continued to take a leadership role in the industry,based on its heritage, expertise and 6th dimension access panels.
Service excellence and cost efficiency
TNS believes that competitive pricing and high-quality service arecomplementary, not conflicting objectives. We use technology andeconomies of scale across all operations, coupled with driving upstandards in online research, to provide greater benefits for clients.
Stephen Jenke Regional Director, ALMDayalan P Senior Vice President, ORSCJenny Abraham Global Off-shoring Director
A model of operational efficiency in AsiaTNS’ International Research Centre (IRC) inHong Kong was established in 2004, as part of a strategy to capture more of the growingnumber of pan-regional and internationalopportunities in Asia Pacific. It advises on themost effective way to design, plan and manageprojects across Asia Pacific and co-ordinatesdelivery. It acts as an operational hub for theregion, including a sophisticated multi-lingualcall centre and is the home of the region’s6th dimension online access panels.
In Hyderabad, TNS operates its own off-shoringcentre, where more than 600 full-time employeesprovide analysis, data processing, softwaredevelopment, questionnaire scripting, chartingand online coding services to the group.
TNS has extended these models to createoperational centres in Belgium, North Americaand Argentina, as well as new locations foroff-shoring in Tunisia and Bratislava. Thesecentres are resourced with the people,systems and tools to ensure consistencyacross the globe.
Mark Walton Regional Director, 6th dimension™Interactive Research, ALMRobert Tomei Global Head, Access Panels
Leading the campaign on data qualityTNS is the world’s leading provider of onlineresearch – one of our industry’s fastest-growingareas. It is not simply a means of cost-effectivedata gathering but also has advantages thatstimulate client demand, such as increasedrates of co-operation, continuous tracking and more accurate completion of surveys.
We think such benefits can only be achieved if panels are well managed. Quality has alwaysbeen a key differentiator for TNS; we believewe have the highest quality standards andresponse rates in the industry. We also havethe most extensive panellist profiles, so wecan sample against complex criteria.
In 2008, TNS is at the forefront of industryinitiatives to improve quality in online research,communicating our ‘6 degrees of online quality’to clients and chairing the Online ResearchQuality Council for the US AdvertisingResearch Foundation.

TNS Annual Report and Accounts 2007 9
...BOTH!
10 www.tnsglobal.com10 www.tnsglobal.com
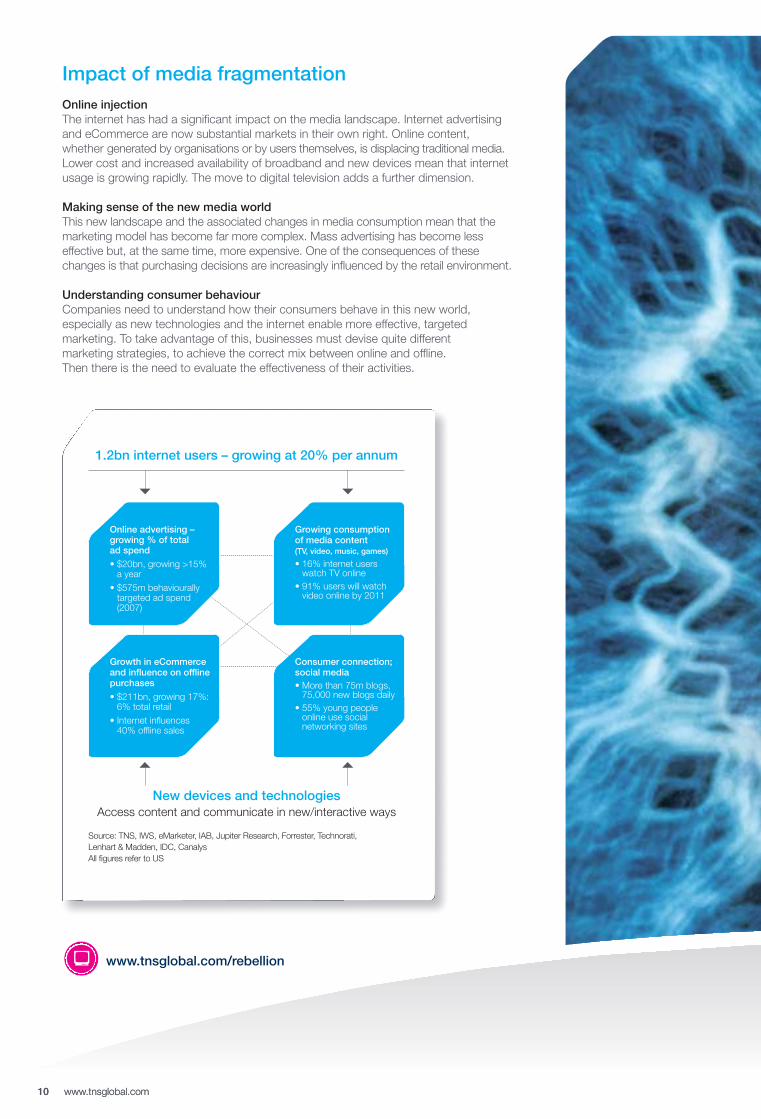
Online injectionThe internet has had a significant impact on the media landscape. Internet advertisingand eCommerce are now substantial markets in their own right. Online content,whether generated by organisations or by users themselves, is displacing traditional media.Lower cost and increased availability of broadband and new devices mean that internetusage is growing rapidly. The move to digital television adds a further dimension.
Making sense of the new media worldThis new landscape and the associated changes in media consumption mean that themarketing model has become far more complex. Mass advertising has become lesseffective but, at the same time, more expensive. One of the consequences of thesechanges is that purchasing decisions are increasingly influenced by the retail environment.
Understanding consumer behaviourCompanies need to understand how their consumers behave in this new world,especially as new technologies and the internet enable more effective, targetedmarketing. To take advantage of this, businesses must devise quite different marketing strategies, to achieve the correct mix between online and offline. Then there is the need to evaluate the effectiveness of their activities.
Impact of media fragmentation
www.tnsglobal.com/rebellion�
1.2bn internet users – growing at 20% per annum
Online advertising – growing % of total ad spend
• $20bn, growing >15%a year
• $575m behaviourallytargeted ad spend (2007)
Growth in eCommerceand influence on offlinepurchases
• $211bn, growing 17%:6% total retail
• Internet influences40% offline sales
Growing consumption of media content (TV, video, music, games)
• 16% internet userswatch TV online
• 91% users will watchvideo online by 2011
Consumer connection;social media• More than 75m blogs,
75,000 new blogs daily• 55% young people
online use social networking sites
New devices and technologiesAccess content and communicate in new/interactive ways
Source: TNS, IWS, eMarketer, IAB, Jupiter Research, Forrester, Technorati, Lenhart & Madden, IDC, CanalysAll figures refer to US
TNS Annual Report and Accounts 2007 11TNS Annual Report and Accounts 2007 11
CONSUMER REBELLION?�

12 www.tnsglobal.com12 www.tnsglobal.com
InsightMany market information companies claim they want to provide clients with insight. But what does this mean? For TNS, ‘insight’ means providing clients with a viewthat will have a practical impact on their business. It means making recommendationswith a new or different perspective. It means being industry thought leaders.
This is achieved through a strategic focus on Expertise and Innovation – by having thebest products and services in the industry, by continually seeking to improve them andby developing new services that give clients a better understanding of their consumers.
Capitalising on the revolutionTNS is combining its expertise to provide clients with services that answer tomorrow’smarketing issues. In Media, our advertising intelligence and audience measurementbusinesses have been integrated. Each was already a leader in its field; together theyprovide a powerful platform in the digital age.
In Consumer, we have pulled together the knowledge we hold across the group toprovide clients with new insights into the area of shopper behaviour. These changesmake TNS a leading provider of understanding into consumer behaviour, whetherthat is in-store, on TV or online.
Expertise and innovation
More information and analysis is needed to understand the impact ofthe digital revolution. TNS is investing in capabilities to provide clientswith insight into changing consumer behaviour in this new world.
Barry Lemmon Global Head, Retail & Shopper InsightsPat McCann European Head, Retail & Shopper Insights
Retail & ShopperUp to 70% of purchasing decisions are nowmade in-store. Through the combination of our market-leading consumer panels, heritagein consumer custom research and newly-acquired specialist retail and shopperconsultancies, TNS provides clients with vital insight into that ‘moment of truth’.
This combination of expertise gives TNS aunique position in the industry. We help clientswith their key retail issues, including effectivestore design, optimal category placement,impact of merchandising, alignment of in-storecommunication with brand equity, and brandcommunication with in-store delivery.
In 2007, Retail & Shopper became an‘Area of Expertise’ within the TNS portfolio.
TNS is experiencing strong demand for theseservices from retailers and manufacturersacross the world.
Developments in TNS MediaIn 2007, TNS continued to build on the strengthof its digital media offering, both organically andthrough acquisition, with services in two areasthat are undergoing major transformation.These services are being extended to clientsacross the TNS network.
A structural shift is taking place in measurementof television audiences, due to the emergenceof digital broadcasting. Using digital informationfrom the set-top boxes of huge householdsamples, TNS provides clients with granular, in-depth understanding of their audiences’ viewingbehaviour. This assists with media negotiationsand promotion planning, as well as realising thepotential of addressable advertising.
Online, there has been a surge in social networksand user-generated content; there are now over70 million blogs. Recently acquired Cymfonyallows clients to understand and act on whatbloggers, consumers and journalists are saying about brands across all media.
Richard Marks Global Sector Head, TNS Media ResearchAndrew Bernstein President, TNS Media Intelligence Cymfony

TNS Annual Report and Accounts 2007 13TNS Annual Report and Accounts 2007 13
...VIVA LA REVOLUCIÓN!

Delivering actionable insight
14 www.tnsglobal.com
www.tnsglobal.com/originality�
Making a differenceMarket information companies have too often engaged in validating what clients alreadyknow, or what they think they know. Now, clients are looking for companies with thecapability to advise them, to respond proactively to their marketing issues, to predicthow their markets will develop and uncover that nugget of information that leads to a change in marketing strategy.
A new model for client relationshipsClients are increasingly seeking to develop a new type of relationship with their suppliers.They are looking for dedicated resources and longer-term partnerships. They want largersuppliers to draw on the depth of sector and research experience to provide new learnings.They are allocating budget to more advisory and consultative services that will impacttheir bottom line.
The requirement for talentIn today’s market, therefore, delivering actionable insight and managing clientrelationships are key. But they are not easily achieved. Both require highly-skilled people to make them truly effective. They need people who go beyond the traditionalnotion of an account director. People who can make recommendations, build commercialrelationships and lead accounts. This requires the recruitment of the best people fromwithin and outside of the market information industry, as well as the development ofexisting talent.
‘We are looking for someone on theaccount with a good brain…whocan drive in on the issues wherewe need it and who has thepresence and credibility to berolled out in front of the MD.’Recent quote from Insight Director at a majorinternational consumer goods company

TNS Annual Report and Accounts 2007 15
SEEKING ORIGINALITY?�

16 www.tnsglobal.com16 www.tnsglobal.com
Recruiting and retaining the bestTNS is responding to this demand by ensuring that we have people with the rightcapabilities in the right roles to provide value-added insight to clients. This is theessence of the TNS sixth sense of business. It begins with recruiting the very best.The best industry expertise; the best research expertise.
Once at TNS, we foster imagination, innovation and creative problem solving through tailored internal learning and development programmes, effective internalcommunication and collaboration, together with strong performance management.
A passion for what we doTNS people are knowledgeable and committed – they have a passion for developinglasting partnerships with their clients and making a real difference to their businesses.
Looking insideWe listen to what our people tell us and continually look for ways to enhance theemployee experience, so that we can foster that passion and retain the brightest talent to serve our clients.
People development
At the core of everything we do is a profound commitment tounderstanding and servicing our clients. They are looking for our people to be able to provide information and advice that give them the competitive edge in a challenging market.
Yannick Carriou Managing Director, TNS SofresTim Kidd Managing Director, Europanel
Employee engagement in EuropeTNS conducts an annual employeecommitment study, as part of its ongoingemployee engagement programme. We use ourproprietary business solution, TRI*M™ – the world’sleading product for stakeholder management. Theresponses in Europe have provided an excellentfoundation from which to reinforce our strengthsand rectify our weaknesses.
Getting the most from the insights relies on three things: ensuring the basics are done right;engaging the whole team, in innovative ways, to create a detailed plan on the factors mostimportant to them; and taking the right actions to achieve the plan. Many of these actionsinvolve common themes in employee motivation: increased clarity on career paths; better communications; improving the working environment.
Perhaps more surprising is the energy andpassion shown by the teams, once theyrealised that they were at the heart of a process that the business takes so seriously.
Recruitment and retention in ALMWhether you are in New Zealand or New Delhi, attracting and retaining talent is critical to success in the emerging markets. To addressthis challenge, 2007 saw the development of aspecial ‘Toolkit’, including the materials: ‘Whywork for TNS’, ‘Shaping a High PerformanceCulture’ and a ‘TNS Passport’, providing a self-directed learning pathway for new starters. Theseequipped managers with the necessary tools toengage and drive performance discussions.
There was also specific focus on heightening theinvestment in our business-critical client facingpeople, who can deliver increased revenue in theadvisory and specialist areas. Diagnostic Consultingwas launched, introducing a common frameworkto establish, retain and grow client relationships.This programme has now been successfullyrolled out across all 33 countries within ALM,covering 500 client-facing employees.
Michelle Griffin Regional Director, People & Culture, ALM Manny Inocencio Managing Director, TNS Taiwan

TNS Annual Report and Accounts 2007 17TNS Annual Report and Accounts 2007 17
...IMAGINATIVE APPROACH!
18 www.tnsglobal.com
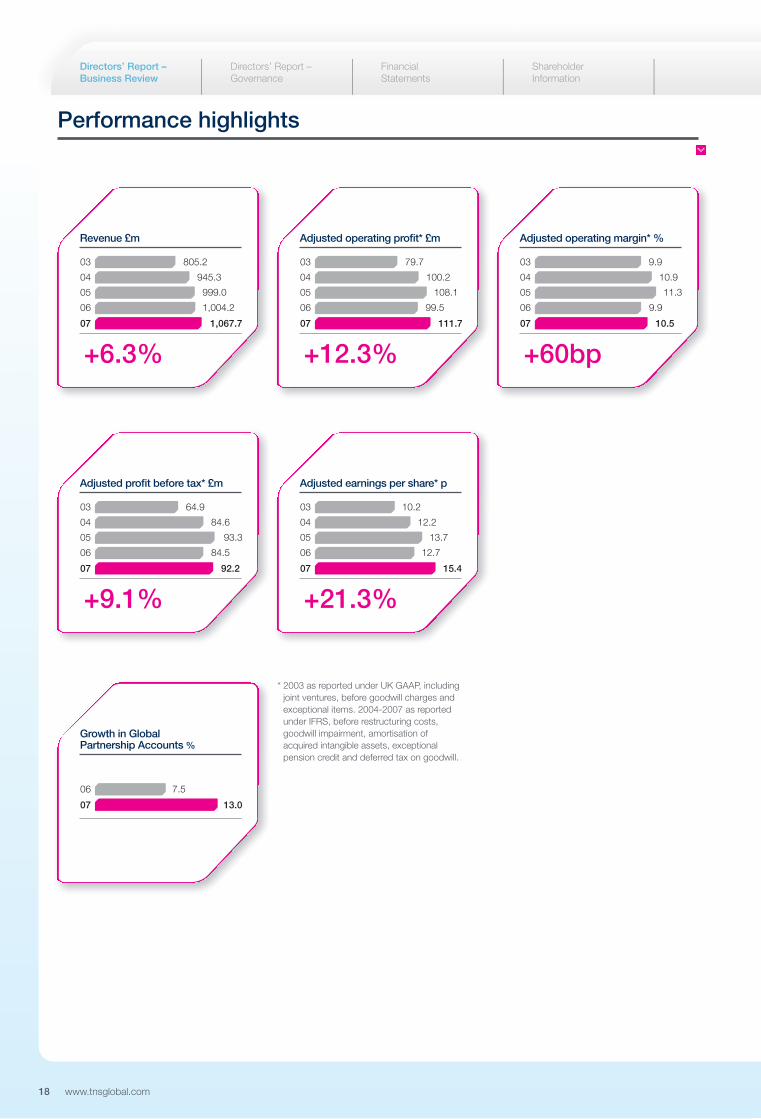
Performance highlights
Directors’ Report – Business Review
Directors’ Report –Governance
Financial Statements
Shareholder Information
+6.3%
Revenue £m
07
06 1,004.2
05
04
03
1,067.7
999.0
945.3
805.2
+12.3%
Adjusted operating profit* £m
07
06 99.5
05
04
03
111.7
108.1
100.2
79.7
+21.3%
Adjusted earnings per share* p
07
06 12.7
05
04
03
15.4
13.7
12.2
10.2
+9.1%
Adjusted profit before tax* £m
07
06 84.5
05
04
03
92.2
93.3
84.6
64.9
+60bp
Adjusted operating margin* %
07
06 9.9
05
04
03
10.5
11.3
10.9
9.9
07
06 7.5
13.0
Growth in Global Partnership Accounts %
* 2003 as reported under UK GAAP, includingjoint ventures, before goodwill charges andexceptional items. 2004-2007 as reportedunder IFRS, before restructuring costs,goodwill impairment, amortisation ofacquired intangible assets, exceptionalpension credit and deferred tax on goodwill.

TNS Annual Report and Accounts 2007 19
Chairman’s statement
2007 was a year of positiveachievement for TNS, both interms of financial performanceand progress against ourstrategic objectives.
In 2007, the group grew underlyingrevenue in all its regions and sectors,while at the same time achievingoperating margin improvement. This goodoperational performance has contributedtowards earnings per share growth ofover 20 per cent and has been achievedin response to the challenging goals setby the Chief Executive, David Lowden.
At the same time, the group has fullyrecognised the demands of a changingmarketplace. In particular, it hasreinforced its response to clients’ needto understand the impact on consumerbehaviour of an increasingly digital world.It has prioritised investment into servicesto meet these demands, whilst achievingefficiencies in its existing processes.
This progress is attributable to the talent,passion and sheer hard work of ourpeople. I thank them for all their effort and success.
Over the past 12 months, I have againvisited many parts of the group andmet with many of its senior executives.I sense a growing excitement around theorganisation about the progress that hasbeen made to date but, especially, aboutthe future. There is tangible belief in ourability to lead industry thinking and deliveroutstanding service to our clients, bothglobal and local. There is also a strongcommitment to continuous improvementin all areas and to effective managementof change.
In the turbulent economic times throughwhich we are passing, it is particularly
important to have a clear strategyand management focused on effectiveexecution. The need for first-classmarket information combining data withjudgement – insight – is particularlyimportant during such periods and thegroup’s strategy is shaped to deliver this.
During 2007, the group completed itsshare buy back programme, throughwhich it has returned £100 million toshareholders. The board reviews thegroup’s use of cash on an ongoing basis,so that we can continue to take fulladvantage of opportunities by investingin our strategic initiatives, while alsoensuring an efficient capital structure.
Despite the current macro-economicuncertainty, the outlook for the marketinformation industry remains positive.Market growth continues to be driven bythe trends of globalisation, technologicalchange and demand for insight. Whilstmindful of the need to plan carefully,David Lowden has again set ambitiousgoals and I look forward to 2008 beinganother year of progress for TNS.
Confidence in this future performance isreflected in the board’s recommendationof a total dividend of 5.5p per share for2007, an increase of almost 20 per centover the previous year.
Donald BrydonChairman
+19.6%
Total dividend per share p
07
06 4.6
05
04
03
5.5
4.0
3.5
3.0
20 www.tnsglobal.com
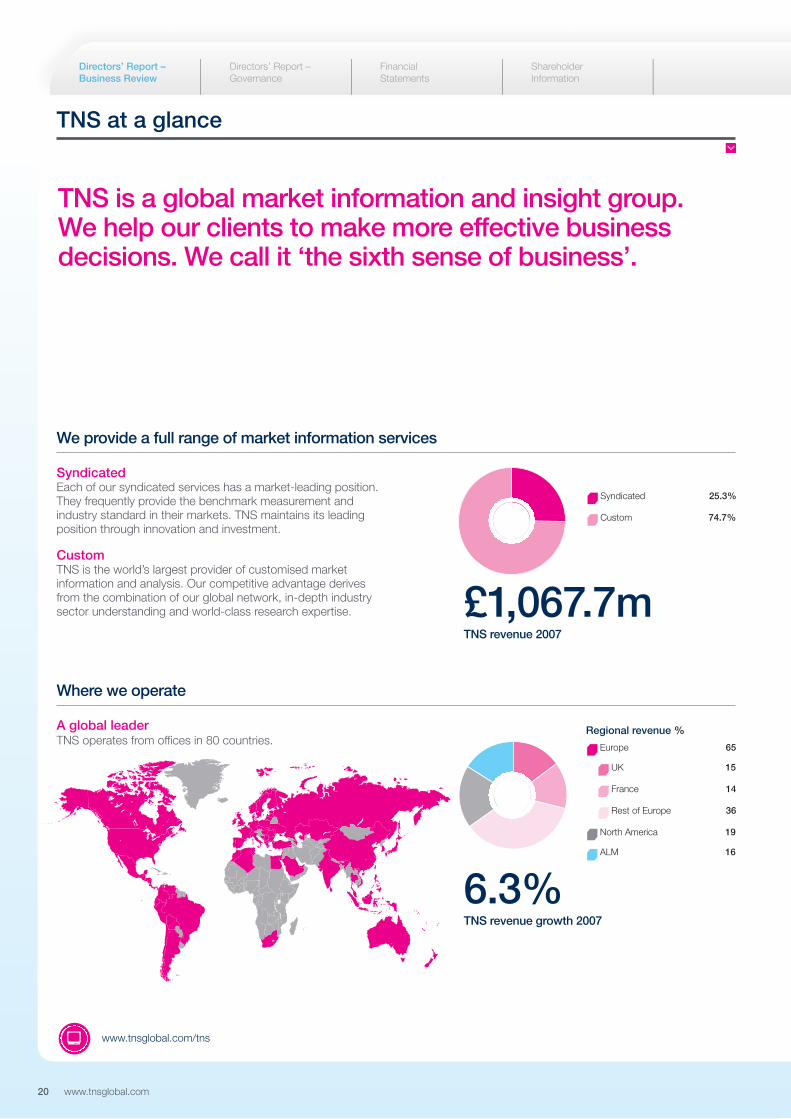
TNS at a glance
Where we operate
We provide a full range of market information services
SyndicatedEach of our syndicated services has a market-leading position. They frequently provide the benchmark measurement andindustry standard in their markets. TNS maintains its leadingposition through innovation and investment.
CustomTNS is the world’s largest provider of customised marketinformation and analysis. Our competitive advantage derivesfrom the combination of our global network, in-depth industrysector understanding and world-class research expertise.
6.3%TNS revenue growth 2007
Regional revenue %
UK 15
France 14
Rest of Europe 36
North America 19
ALM 16
Europe 65
Syndicated 25.3%
Custom 74.7%
£1,067.7mTNS revenue 2007
TNS is a global market information and insight group. We help our clients to make more effective businessdecisions. We call it ‘the sixth sense of business’.
A global leaderTNS operates from offices in 80 countries.
Directors’ Report – Business Review
Directors’ Report –Governance
Financial Statements
Shareholder Information
www.tnsglobal.com/tns �

TNS Annual Report and Accounts 2007 21
TNS Worldpanel™
Josep Montserrat
ServicesTNS Worldpanel operates continuous consumer panels that measureand track household and individual purchasing and consumptionbehaviour. When linked with customised insights from TNS Consumerand our retail and shopper expertise, they provide an unparalleledunderstanding of the consumer and the consumer packagedgoods marketplace.
Through its own panels in 30 countries and strategic alliancescovering a further 25, TNS Worldpanel is the world’s largestprovider of consumer purchasing information.
Client overviewOver 500 clients around the world base business decisions on TNS Worldpanel information. They include global and local consumerbrand companies, retailers, private label manufacturers, fresh foodsuppliers, advertising and media agencies and market analysts.
Information collectionData is collected on a regular cycle using technology matched tothe development of each market, including bar code and till receiptscanners, internet, SMS text messaging and diary.
TNS insightConsumer panel specialists interpret the data to provide clientswith essential insights into consumer and shopper behaviour.We help clients understand how people shop and how to attractcustomers to their products. Based on these findings, we adviseon the opportunities and implications for marketing strategies,promotion and branding.
Syndicated
TNS Media™
Jean-Michel Portier
ServicesTNS Media is a leading provider of strategic media intelligenceand audience measurement.
We track 96 per cent of advertising expenditure worldwide, supplyingthe industry standard for competitive advertising information. Wemonitor over three million brands across all media – print, TV, radio,internet, social, cinema and outdoors. Our analysis of social mediais based on tracking 70 million blogs, message boards and socialnetworks. We provide monitoring and public relations evaluationservices. TNS is the market leader in 24 countries, where we offerinstant access, web-based services.
TNS Media operates audience measurement services in 34 countriesincluding Russia, Spain and the US. In China, we operate the world’slargest continuous TV audience measurement panel. TNS has set thestandard in electronic measurement of media audience behaviour,using fixed and portable metering technology and return path datafrom set top boxes.
Client overviewTNS Media has over 16,000 clients – advertising agencies,broadcasters and platform operators, on and off-line advertisers,new media, PR and media planning agencies, publishers, governmentdepartments and NGOs, as well as international and local companies.
Information collectionPatented systems capture commercials, monitor websites andtrack visual and verbal brand appearances on broadcast andcable programming. High-capacity digital scanners harvestelectronic images from publications.
In audience measurement, at-home viewing is measured byTNS PeopleMeters. We have pioneered the use of the ArbitronPersonal People Meter™ for mobile measurement of TV and radioaudiences. Through our expertise in return path data analysis,TNS has developed the capability of processing data, overnight,from more than one million households in a single market.
TNS insightTNS Media offers a full range of insights and analysis into the changingmedia landscape, including advertising expenditure and creationmonitoring, news monitoring and sports sponsorship evaluation.
TNS audience measurement and analysis is used to negotiate pricesfor commercial airtime, evaluate the success of programmes, planadvertising campaigns and devise future programming schedules.Through return path data services, we provide a total picture of theconsumer’s viewing experience in the digital environment. Analysisis delivered via TNS proprietary software, Infosys™, with 6,000 usersin 18 countries.

22 www.tnsglobal.com
Custom
Global Clients and Sectors – setting the strategy
TNS Global Clients and Sectors operatesacross the custom business, with teamsof sector specialists, to meet the needs ofour clients – locally, regionally and globally.
A structure is in place to ensure that wemeet clients’ demands for greater insights,deeper relationships, innovation and globalcapabilities. It is used to co-ordinatethinking and develop industry sector-driven strategies for implementationacross the regions.
Global AccountsOur Global Account Programme covers50 of TNS’ top clients.
We develop strong partnerships withthese clients, providing them withdedicated account teams who co-ordinatea global service, tailored to individual clientneeds. This is based on a solidunderstanding of their businessrequirements, combined with TNS’innovative research services.
Pedro Ros
Areas of Expertise – world-leading solutions
In a world where our clients are seekingmore insight and analysis, specialistresearch knowledge is key. Throughour Areas of Expertise, TNS is building on its world-leading range of productsand services to provide clients withinnovative solutions to the challengesthey face in fast-changing markets.
Regional teams can access this expertise,to deliver actionable insight to clientsaround the world.
Brand & Communications services help clients build their brands throughevery stage of the brand experience, fromdevelopment to implementation of strategy.TNS also tracks the success of brands andcommunications in the marketplace, with aview to optimising brand performance andmaximising future potential.
Retail & Shopper provides insight about in-store and shopperbehaviour for manufacturers and retailers.These insights can be used to improve equity,sales and profitability of a brand or categorythrough merchandising, store layout, pricing andpromotions, as well as in-store communications.
John Abraham
Regions – flawless implementation
TNS has the industry’s most extensivecustom research network and ranks no.1 or no.2 in most major markets.
Our custom operations are divided intothree geographic regions. These formthe base from which we serve ourclients and implement consistent
strategies for each of our Global Sectors.The regions use their local knowledge andaccess to TNS’ global network to provideclients with information and insight on acountry, regional or global basis.
Our regional teams are focused onensuring that clients receive the best
possible service from TNS, whatevertheir size and requirements. To achievethis, each country office can call on thegroup’s leading industry sector andresearch experts. They have access toa highly efficient operational infrastructureand can use the most effective methodsof data collection, analysis and delivery.
Directors’ Report – Business Review
Directors’ Report –Governance
Financial Statements
Shareholder Information
TNS at a glance

TNS Annual Report and Accounts 2007 23
AutomotiveRémy Pothet
ConsumerStephen Factor
FinanceSam Thayer
HealthcareElaine Riddell
Political & SocialLeendert de Voogd
TechnologyMatthew Froggatt
Global SectorsOur aim is to be recognised as the global leaderin each of our six sectors. We believe that TNS’sector-based approach is unique within ourindustry. In each sector, world-leading industryexperts work together to meet client demandfor market information with actionable businessinsights. They achieve this by combining theirknowledge of the issues that drive theirclients’ businesses with TNS’ extensiveresearch expertise.
Global Sector Heads use their understandingand experience of these issues to developsector strategies and innovative new services.
Product Development & Innovation enables clients to identify new opportunities,evaluate whether an idea justifies investment,discover how to make a concept moreappealing, optimise the product mix andforecast potential sales volumes. It coversthe product development process from ideageneration, early stage screening, conceptand product optimisation through to volumetricforecasting and post-launch evaluation.
Stakeholder Management helps clients measure and monitor theirperformance and relationships withvarious stakeholder groups. It providesunderstanding of factors affecting levelsof satisfaction, retention and motivationamong customers and employees. TRI*M,the main TNS solution in this area, offersactionable recommendations to boardsand senior management teams.
Customer Intelligence provides insight based on analysis ofmultiple data sets, combining behaviouralinformation at an individual or householdlevel. This delivers insight about our clients’customers in areas such as customerprofitability, defection risk and propensityto buy. Fusing this with TNS informationsuch as usage and attitudes can then beused to drive more tailored marketing.
Europe
Judith Passingham
Asia, Latin America, Middle East & Africa
James Hall
North America
Pedro Ros

24 www.tnsglobal.com
TNS’ strategic goal, supported by its four core principles, is based on researchinto what clients now expect from theirmarket information and insight providers.It is designed to enable TNS to benefitfrom the changes happening in themarket information industry, as outlinedbelow. Progress against the strategy ismeasured by our non-financial KPIs.These are shown on page 28, alongwith the group’s targets in those areas.
Market overview
Market size and segmentationIn 2006, the global market informationindustry was valued by Esomar at $24.6billion. It comprises two main categories.
Syndicated servicesInformation is collected on a regularbasis, mostly from continuous panels. It is owned by the research provider and sold to multiple clients. Keyattributes are:• ‘must-have’ data that provides
a measure of the market• steady growth rates through
the economic cycle
In 2007, we continued to makeexcellent progress against keystrategic objectives. By the endof the year, TNS was a strongerbusiness, with the right structurein place to deliver our strategic goal.
Directors’ Report – Business Review
Directors’ Report –Governance
Financial Statements
Shareholder Information
David LowdenChief Executive
Chief Executive’s strategic review
• lower margins than syndicatedservices; should benefit from costefficiencies in operations and provisionof more value-added services.
Market growthMarket information is a growth industry,currently estimated to be growing byaround 4-5 per cent per annum. Its long-term growth potential is estimatedto be greater than the wider advertisingand marketing services industry. Growthrates vary by region. Currently growth isstrongest in the regions of Asia Pacific,Latin America, Eastern Europe and theMiddle East and Africa, where marketinformation represents a relatively smallproportion of GDP compared with moremature markets.
Growth driversGlobalisation and growth of emerging marketsAs major multi-nationals look for growthin developing markets and take a moreglobal view of their marketing, theyrequire high-quality multi-countryinformation, collected and analysedusing consistent methodology.
Demand for insight and analysis One of the strongest growth drivers in the industry is the continued client demand for insights, analysis and actionable recommendations.
Sector specialisationThe demand for more consumer-relatedresearch services from organisations inthe technology, financial services, mediaand healthcare sectors.
Market changeChanges in clients’ markets are occurringat an ever faster pace. Clients needincreasing levels of information andinterpretation that help predict theimplications of these market changes for their businesses.
Technology and media fragmentationChanging patterns of media consumptionpresent significant challenges toadvertisers. This is fuelling increaseddemand for services in traditional areasof advertising and brand effectiveness. It is also creating demand for new servicesto understand consumer behaviour inan increasingly digitised world.
• investment in technology andnew services drives growth
• higher margins thancustomised research
• longer-term contracts, typicallybetween one and five years
• high barriers to entry • mainly consumer and media but
increasingly used in other sectors.
Custom researchBased on ad hoc or continuouscontracts that are tailored to the needs of individual clients, who own theinformation. Key attributes are:• more discretionary than syndicated,
with potential for stronger growth ingood economic environment
• traditionally local and fragmentedbut rapidly globalising
• basic data collection becomingmore standardised; growing focuson quality
• increased client demand forinsights and recommendations
• current market trends provideopportunities for larger suppliers to raise barriers to entry
TNS Annual Report and Accounts 2007 25
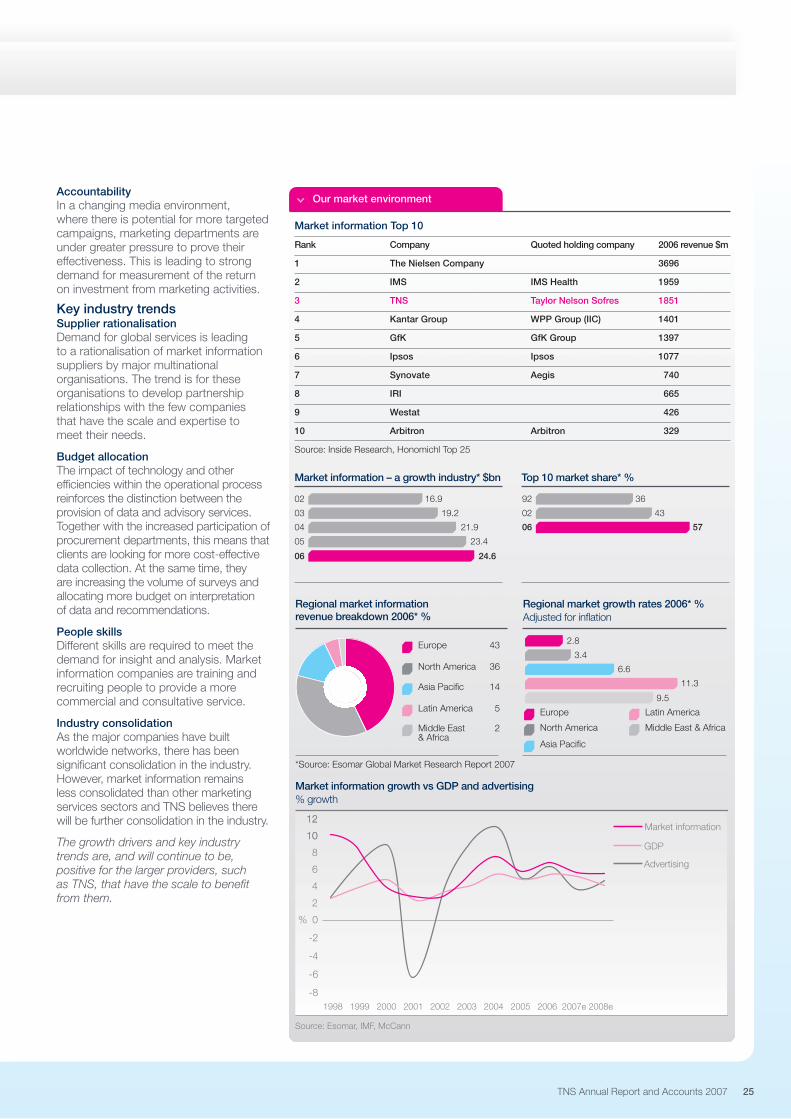
AccountabilityIn a changing media environment, where there is potential for more targetedcampaigns, marketing departments are under greater pressure to prove theireffectiveness. This is leading to strongdemand for measurement of the return on investment from marketing activities.
Key industry trendsSupplier rationalisationDemand for global services is leadingto a rationalisation of market informationsuppliers by major multinationalorganisations. The trend is for theseorganisations to develop partnershiprelationships with the few companies that have the scale and expertise to meet their needs.
Budget allocationThe impact of technology and otherefficiencies within the operational processreinforces the distinction between theprovision of data and advisory services.Together with the increased participation ofprocurement departments, this means thatclients are looking for more cost-effectivedata collection. At the same time, theyare increasing the volume of surveys andallocating more budget on interpretationof data and recommendations.
People skillsDifferent skills are required to meet thedemand for insight and analysis. Marketinformation companies are training andrecruiting people to provide a morecommercial and consultative service.
Industry consolidation As the major companies have builtworldwide networks, there has beensignificant consolidation in the industry.However, market information remains less consolidated than other marketingservices sectors and TNS believes therewill be further consolidation in the industry.
The growth drivers and key industrytrends are, and will continue to be,positive for the larger providers, such as TNS, that have the scale to benefitfrom them.
Market information Top 10
Rank Company Quoted holding company 2006 revenue $m
1 The Nielsen Company 3696
2 IMS IMS Health 1959
3 TNS Taylor Nelson Sofres 1851
4 Kantar Group WPP Group (IIC) 1401
5 GfK GfK Group 1397
6 Ipsos Ipsos 1077
7 Synovate Aegis 740
8 IRI 665
9 Westat 426
10 Arbitron Arbitron 329
Source: Inside Research, Honomichl Top 25
Top 10 market share* %Market information – a growth industry* $bn
Regional market information revenue breakdown 2006* %
Europe 43
North America 36
Asia Pacific 14
Regional market growth rates 2006* %Adjusted for inflation
Latin America 5
Middle East 2& Africa
Europe
North America
Asia Pacific
Latin America
Middle East & Africa
*Source: Esomar Global Market Research Report 2007
06
05 23.4
04
03
02
24.6
21.9
19.2
16.9
06
02
92
57
43
36
2
4
6
8
10
12
10
12
0
-2
-4
-6
-820022001200019991998 2003 2004 2005 2006 2007e 2008e
Market information
GDP
Advertising
Source: Esomar, IMF, McCann
%
Market information growth vs GDP and advertising% growth
11.3
9.5
6.6
3.4
2.8
Our market environment
26 www.tnsglobal.com
Directors’ Report – Business Review
Directors’ Report –Governance
Financial Statements
Shareholder Information
further increases in levels of off-shoring.In 2007, over 630,000 hours of workwas off-shored to lower costdestinations, representing an increaseof over 50 per cent from 2006.
We continue to reduce unit costs of datacollection, including the transition of moresurveys to the internet. In 2007, theamount of business attributable to datacollected using internet access panelsgrew by 15 per cent. In Europe and Asia,this growth was over 20 per cent. Theproportion of revenue attributed to onlinedata collection in our custom business isnow 25 per cent. This makes TNS by farthe largest global provider of internetresearch. Our goal is for this proportionto reach 40 per cent by 2010-2012. In2008, we will continue to expand internetresearch coverage in Europe, Asia andLatin America.
Clients are increasingly focused on theneed for high-quality data. We believeTNS’ internet access panels aremanaged to the highest standard in theindustry, with consistent processes andcontrols in place across the group. In2007, TNS continued to be a strongadvocate for quality requirements ininternet research in our industry,marketing our differentiation in this areato clients and chairing a new industryinitiative – the Online Research QualityCouncil for the Advertising ResearchFoundation in the US.
Understanding consumerbehaviourAcross the business, new services were launched in 2007, with particularemphasis on the areas of clients’ productdevelopment, innovation and consumerengagement. These developments arepart of the strategy to deliver moreinsights and added-value to clients. A measure of this in the custom businessis the revenue growth from BusinessSolutions, TNS’ proprietary productsand services that provide analysis forclients, which was 25 per cent.
Two areas of increasing importance forclients are the significance of the retailenvironment and the need to understandconsumer behaviour in a digitised world.In 2007, TNS made good progress indeveloping new services in these areas.
TNS built on existing retail and shopper services with the acquisition of three specialist consultancies; two in the US and one in the UK.
Performance in 2007
A successful year2007 was a successful year for TNS. The group reported revenue growthof 6.3 per cent and improved adjustedoperating margin by 60 basis points.Cash generation was strong, allowing the completion of our share buy backprogramme. In total, £100 million hasbeen returned to shareholders, achievinga more efficient balance sheet. The groupcontinued to make excellent progressagainst key strategic objectives. By theend of 2007, TNS was a strongerbusiness, with the right structure in place to deliver our strategic goal.
Strategy delivering growthThe performance in 2007 validates ourstrategy to become the global leader indelivering value-added insights that help our clients make more effective businessdecisions. The strategy is based on clearmessages from clients and key industrytrends: major accounts seeking globalpartnerships; the growing requirement for cost effective, high-quality datacollection; and the demand for informed insights and actionablerecommendations.
This strategic goal is supported by fourcore ‘principles’: client orientation, serviceexcellence and cost efficiency, expertiseand innovation and people development.For each principle, we have establishedtargets to be achieved by 2010-2012.Key performance indicators have beenput in place to measure progress against those targets. Each plank of the strategy has an organisationalstructure in place and is managed by a dedicated team, with resources toensure effective implementation.
Good performance in syndicated servicesOur major syndicated businesses againperformed well, based on their marketleading positions and the strength of theirservice offering. There were several keydevelopments and highlights in 2007. For TNS Media, TNS won contracts fornew digital services in TV audiencemeasurement. Based on the innovativesolution we put forward, we also won the prestigious BARB (BroadcastersAudience Research Board) contract inthe UK, which will run from 2010. Thesecontract wins provide further evidenceof TNS’ leading position in the audiencemeasurement field.
Chief Executive’s strategic review
In Media Intelligence, good progresswas made with new services launchedin the US, including strong demand forTNS MI Cymfony, which providesanalysis of new forms of social media.Acquisitions made in the year havestrengthened our European newsmonitoring offering.
TNS Worldpanel, the group’s continuousconsumer purchasing business, wonmajor new contracts in key markets. In Asia, new speciality panels werelaunched and in Latin America, thegeographic footprint was extended by increasing ownership of LatinPanelInternational to 100 per cent in January 2008.
Strong growth in Global AccountsGlobal Clients and Sectors, whichoperates across the custom business,had an excellent year. Revenue growthfrom our Global Partnership Accountswas 13 per cent, which is more thandouble the rate of the group overall. Our Global Partnership Accounts aremajor multinationals that have indicated a desire to partner with fewer suppliersand therefore offer the potential for highershare of their market information spend.They now represent 16 per cent ofcustom revenue. This indicates goodprogress towards achieving our targetthat they represent 20 per cent ofcustom revenue by 2010-2012.
The overall global account programmehas been extended to 50 clients. Weexpect that this will continue to be a keygrowth driver for the group in 2008, asour largest clients look to partner withTNS based on the strength of our globalcapability. The continued developmentof the role of the Global Account Directorwill contribute to that growth.
Good progress was also made with theGlobal Sectors within TNS; building theirrole to identify trends, set sector strategy,implement processes and co-ordinateaccount planning.
Improvements in operationsIn 2007, we continued to focus onbecoming more cost efficient by making improvements to our operationalinfrastructure. A new position, GlobalHead of Operations, was created to co-ordinate the drive for standardisationof operations across the group. Thisincludes the more effective use of callcentres, a significant reduction in thenumber of delivery platforms and
TNS Annual Report and Accounts 2007 27
The combination of these businesses with our consumer panel and custominformation provides us with a uniqueoffering that advises retailers andmanufacturers on understanding in-store consumer behaviour.
To take advantage of the substantialopportunities provided by mediafragmentation, TNS has combined itsMedia Intelligence and iTRAMbusinesses. There has been investment,both organically and by acquisition, toprovide clients with new services in thearea of digital media. Examples in 2007include the acquisition of Cymfony,which assesses the impact of consumergenerated media, and the ongoingprogress made with digital TV audiencemeasurement services in the US andother markets.
On 29 February 2008, we announcedthat TNS has agreed to acquireCompete, Inc., a leading digitalintelligence company in the US. Thisacquisition is an important move for TNS that builds on our ability to helpclients understand consumer behaviourin the new and highly complex digitalworld. Compete has built a world-classdigital intelligence capability that deliversmultiple perspectives on how consumersengage with brands online. Its strengthlies in its ability to provide competitiveanalysis of individuals’ online behaviour, a rapidly growing section of the marketthat has enormous potential.
TNS will enhance this offering by puttingit together with the understanding ofconsumer attitudes and behaviour thatwe gain from our access panels. We willuse our network to offer this powerfulcombination to clients across the globe.In the longer term, we will look at theopportunities to add further value byusing our Worldpanel, retail and shopperand audience measurement capabilitiesto integrate data on purchasing andviewing behaviour with internet searchand shopping behaviour. We believe this will allow TNS to develop newsyndicated and custom products, unique in our industry.
Investment in new services that helpclients understand consumer behaviour,especially in the area of digital media,will continue to be a priority in 2008.
Outlook Clients look to market information tohelp them identify growth opportunitiesand support their marketing decisions,especially in times of increasingcompetitive pressures. Marketinformation remains a small, but rapidlygrowing, proportion of GDP, especiallyin emerging markets. For TNS, oursyndicated services are typically basedon annual contracts and tend to growsteadily through the economic cycle.In custom research, TNS has a strongfranchise and established marketpositions in most major markets. Inemerging markets such as Asia, wheremarket growth is anticipated to remainhealthy, TNS is the market leader.
People developmentDelivering actionable insight andmanaging client relationships are key tomeeting these demands. Both requirehighly skilled and motivated people.
Client orientationOur largest international accounts areseeking partnership relationships with fewersuppliers, which have the capability to meettheir requirements for co-ordinated serviceon a global basis.
TNS’ strategic goal is to be recognised as the global leader in delivering value-added information and insights that help our clients to make more effectivebusiness decisions. To achieve this goal, we are focusing on four core principles.These are based on clear messages from clients and key industry trends.
Service excellence and cost efficiencyThere is a growing requirement for cost-effective data collection. At the same time,clients are increasingly focused on ensuringthat the data they receive is high quality.
Clients are challenging their marketinformation suppliers to develop newservices and deliver the insight that willhelp them understand consumer behaviourin complex markets.
Expertise and innovation
Although the near-term macro economicoutlook is uncertain, we believe that thegrowth potential of the market informationindustry remains strong. Levels of newbusiness activity in early 2008 areimproved on the previous year. For theremainder of the year, it is anticipated thatgrowth in syndicated services will continueto be healthy. In custom research, it isexpected that continued growth will beachieved in Europe and North America,with ALM expected to be strong. Growthagainst strategic objectives should alsocontinue to be strong. The group is,therefore, confident that 2008 willrepresent another year of good progress.
Our strategic goal

28 www.tnsglobal.com
Directors’ Report – Business Review
Directors’ Report –Governance
Financial Statements
Shareholder Information
and this was the case for our NorthAmerican custom business in 2007. As part of the turnaround, we increasedskill levels and filled over 300 roles boththrough internal promotion and externalrecruitment. In our European custombusiness, we created a new regionalboard of directors to simplify reportingstructures. During the year, wesuccessfully integrated several smallacquisitions into the business. Havingregular, consistent communications withemployees in person was key to thissuccess. All of the changes that havetaken place in 2007 have been designedto create the right business environmentfor TNS employees to achieve their ownsuccess and help the company deliveron its strategy.
People development
It is a testament to the quality of ourpeople that the business made goodprogress towards our strategic goals in 2007. We believe in engaging ouremployees around our strategy, so theycan play their part in our success. We areasking them to think and operate in newways, to tap more proactively into ourglobal network, to provide actionableinsight and deepen their relationships with clients. Our people developmentstrategy reflects these fundamental shifts.
Organisational change and integrationAll businesses need to reorganise fromtime to time to support strategic goals,
Chief Executive’s strategic review
Client orientation • Focus on the role of the Global AccountDirector in building client relationships. Since2006, nine new Global Account Directorshave been appointed to run the 13 Global Partnership Accounts.
• Overall Global Account Programme extendedto 50 clients.
• New products and services acquired andlaunched to address current client issues.
• Acquisition of specialist consultancies to buildon existing capabilities in Retail & Shopper.
• Creation of TNS Media, combining expertisein media intelligence and audiencemeasurement, as powerful base from whichto develop further capability in digital media.
Global Clients and Sectors sets thestrategy across the custom business.A structure is in place to manageGlobal Accounts, drive sector revenuesand co-ordinate multi-country projects.
Service excellence and cost efficiency
• Creation of a new role – Global Head ofOperations – with responsibility for drivingefficiencies across the group.
• TNS’ 6th dimension internet access panelsexpanded in Europe and Asia.
Improving efficiency and reducingduplication in the operationalinfrastructure allows TNS to offer morecost-effective services to clients andimprove margins. A key focus is onstandardising systems and processes.
Global Partnership Accounts % of custom revenue
Proportion of custom revenueattributable to data collected byinternet access panels %
Revenue growth from business solutions %
Employee commitment TRI*M score
Expertise andinnovationTNS applies a unique combination ofsector knowledge and researchexpertise to meet the demand forinsight and analysis that helps clientsunderstand consumer behaviour.
People development • Detailed plans implemented for each businessunit, in response to issues raised by LookInside TRI*M employee commitment survey.
• Increased emphasis on career development.• Focus on assessing strength of leadership
pool and equipping top 200 managers tobe leaders of change.
TNS emphasises recruitment, trainingand development in order to have theright people to deliver insight and buildstronger relationships with clients.
Key developments KPIs – measuring progress
07
06
16
15
07
06
25
23
07
06
25
8
07
05
52
56
13% growth in Global Partnership Accounts.
Level of off-shoring increased 50%. Revenue from internet access panels up 15%.
Delivering our strategy
TNS Annual Report and Accounts 2007 29
Talent management andleadership developmentIn 2007, we focused on assessing thestrength of our top leadership pool. Thebusiness heads and I have been involved in determining how we should assess individual performance and potential,strengths and development areas, career planning, retention risk andsuccession planning. We also ran aseries of Leadership Developmentprogrammes to equip our top 200managers to be leaders of change, using 360 degree feedback onbehavioural style and adaptability as key indicators of personal effectiveness.By the end of 2007, almost 50 per centof our top leadership group had taken
part in this programme, with additionalleadership development offerings beingimplemented in 2008.
Career development andmanagementOur employee surveys have highlightedthat career development is particularlyimportant to our talented employees. In the ALM region, we introduced severalinitiatives to respond to these findings,including new toolkits that allowmanagers to have high quality, quarterlycareer progression discussions. In theNorth American custom business, wedeveloped clear career paths byimplementing consistent job titles andsalary grade structures, and launched a formal career planning programme. In Europe, employees can now moreeasily progress their career by movingacross functions and geographies,through job rotation and other initiatives.Around the group we are ensuring thatboth employees and TNS gain maximumbenefit from experience overseas.
Learning and developmentIn 2007, we continued to offer a robustlearning and development agenda, withmultiple offerings available across thecompany, under the umbrella of the TonyCowling Academy, our learning brand. In Europe and ALM we held several TNSUniversity programmes – events in whichour researchers immerse themselves inour Areas of Expertise and BusinessSolutions. North America launched a new Learning Management System tomanage all activities, supported by 70live online classes.
Performance managementCreating a high performance cultureis a top priority for TNS. Several steps have been taken to support this goal.Firstly, we communicate our core androle-specific competencies across thegroup. Secondly, TNS ensures thatmanagers participate fully in theperformance appraisal process, whichincludes performance assessment,development planning, career planningand objective setting. High rates ofappraisal uptake exist across the company,in many cases up to 100 per cent. Thirdly, we are creating more direct linksbetween performance management andrewards, to emphasise the value we placeon high performance.
Global Partnership Accounts to represent20% of custom revenue by 2010-2012.
20%
KPIs – targets
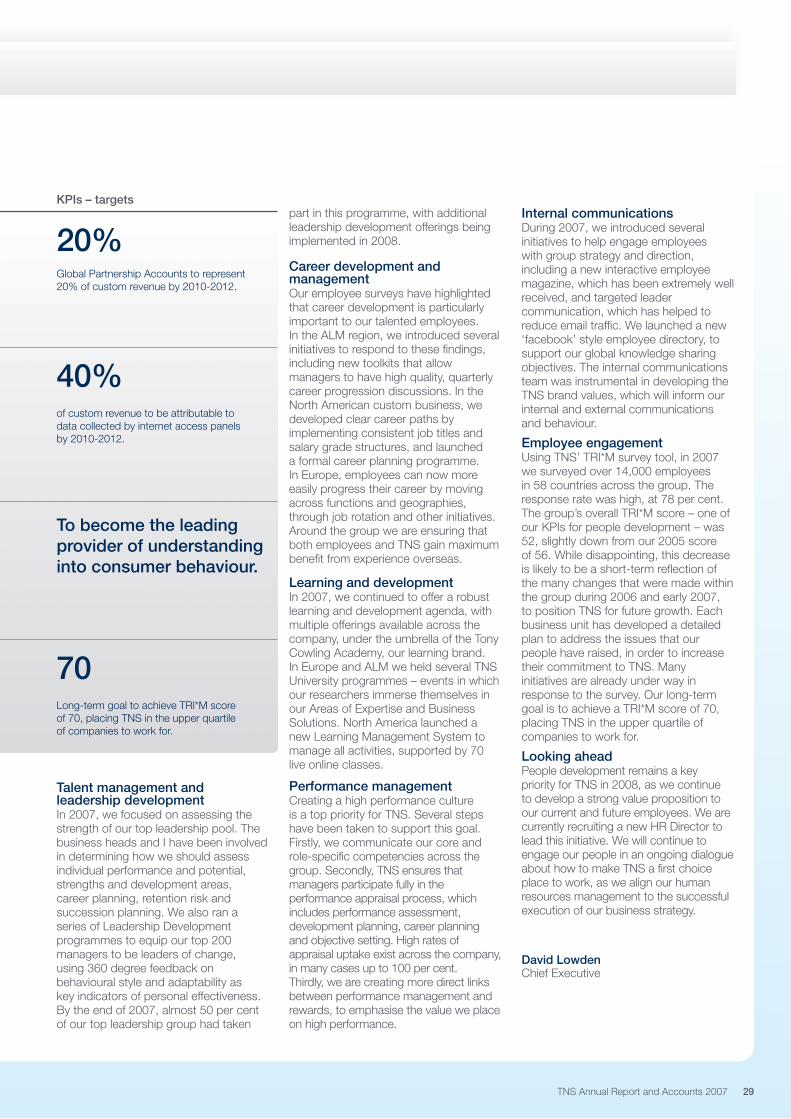
Long-term goal to achieve TRI*M scoreof 70, placing TNS in the upper quartileof companies to work for.
70
To become the leadingprovider of understandinginto consumer behaviour.
of custom revenue to be attributable todata collected by internet access panelsby 2010-2012.
40%
Internal communicationsDuring 2007, we introduced severalinitiatives to help engage employeeswith group strategy and direction,including a new interactive employeemagazine, which has been extremely wellreceived, and targeted leadercommunication, which has helped toreduce email traffic. We launched a new‘facebook’ style employee directory, tosupport our global knowledge sharingobjectives. The internal communicationsteam was instrumental in developing theTNS brand values, which will inform ourinternal and external communicationsand behaviour.
Employee engagementUsing TNS’ TRI*M survey tool, in 2007we surveyed over 14,000 employeesin 58 countries across the group. Theresponse rate was high, at 78 per cent.The group’s overall TRI*M score – one ofour KPIs for people development – was52, slightly down from our 2005 scoreof 56. While disappointing, this decreaseis likely to be a short-term reflection ofthe many changes that were made withinthe group during 2006 and early 2007,to position TNS for future growth. Eachbusiness unit has developed a detailedplan to address the issues that ourpeople have raised, in order to increasetheir commitment to TNS. Manyinitiatives are already under way inresponse to the survey. Our long-termgoal is to achieve a TRI*M score of 70,placing TNS in the upper quartile ofcompanies to work for.
Looking aheadPeople development remains a key priority for TNS in 2008, as we continue to develop a strong value proposition toour current and future employees. We arecurrently recruiting a new HR Director tolead this initiative. We will continue toengage our people in an ongoing dialogueabout how to make TNS a first choiceplace to work, as we align our humanresources management to the successfulexecution of our business strategy.
David LowdenChief Executive

30 www.tnsglobal.com
Delivering responsibly
Directors’ Report – Business Review
Directors’ Report –Governance
Financial Statements
Shareholder Information
The group has an active EqualOpportunities Policy from recruitmentand selection, through training anddevelopment, to appraisal andpromotion. Wherever possiblevacancies are advertised internallyand due consideration is given to allapplications for positions of employment,regardless of gender, race, ethnic ornational origin, disability, age, sexualorientation, religious or political beliefs.
The group is supportive of continuingthe employment and advancement ofemployees who become disabledduring their employment and, wherevernecessary, provides appropriate training.
The group aims to comply with all healthand safety and related legislation in thevarious countries and legal jurisdictionsin which it operates, particularly inseeking to provide a safe and positiveworking environment for all employees.
Over recent years, TNS has increasedits emphasis on keeping employeeswell informed regarding the strategyand performance of the business andof issues relevant to their locality. Anoverview of our internal communicationsinitiatives can be found on page 29.Additional communication takes placewith employee representatives in theWorks Councils that exist in severalEuropean countries.
The group actively encourages employeeparticipation in its future through shareownership. A total of 4,907,336 shareswere allocated to the group’s share plansin 2007. Further detail regarding theseallocations and employee participationis included in the directors’ remunerationreport on pages 50 to 54.
Behaving with considerationfor the environmentTaking a group perspective…As a market information and insightprovider, TNS has a relatively low impacton the environment. This has beenrecognised by our ‘low impact’ weightingin the FTSE4Good Index, of which we area member. However, we recognise thatwe have a responsibility to lessen ourenvironmental impact as far as possible.We have in place a group-levelenvironmental policy, which states thatTNS is committed to achieving itsbusiness and organisation goals while
Applying global standardsof behaviourTNS strives to operate as a trulyglobal company and has in place globalstandards of behaviour. These standardsare described in the TNS code ofconduct, which provides comprehensiveguidance and assistance on how weshould conduct business throughoutTNS and on how we should managerelationships with our stakeholders:customers, employees, shareholders,financial institutions and otherbusiness partners.
In addition, the group adheres to theprofessional standards and codes ofconduct of market research associationsin the countries in which it operates.
The TNS code of conduct forms thebasis of the standards TNS expectsits employees to meet. There is also anexpectation that all joint venture partnersand third parties with whom the groupdoes business will be made aware ofand adhere to this code.
Being a responsibleemployerTNS is committed to attracting, trainingand developing high calibre individualswith imagination and talent. Thiscommitment is described in moredetail on pages 28 to 29.
TNS takes a global view of itsresponsibilities as an employerand its role in the community.
TNS has a commitment to beinga responsible business, whichis sponsored at board level byChief Executive, David Lowden. Thiscommitment covers four main areas:
• Applying global standards of behaviour
• Being a responsible employer
• Behaving with consideration forthe environment
• Supporting the community.
Four areas of focus
www.tnsglobal.com/csr �
TNS Annual Report and Accounts 2007 31
available for the first time in 2008. Bestpractice will be shared and encouragedthroughout TNS, using examples ofthe initiatives various group businesseshave taken to reduce theirenvironmental impact.
... and acting locallyWhile TNS has only recently issued adetailed group-wide environmental policy,we are aware that there is already asignificant amount of activity locally.
EuropeAcross the region, energy conservationis encouraged, waste materials arerecycled as far as practical and there isprofessional disposal of electrical andcomputer goods.
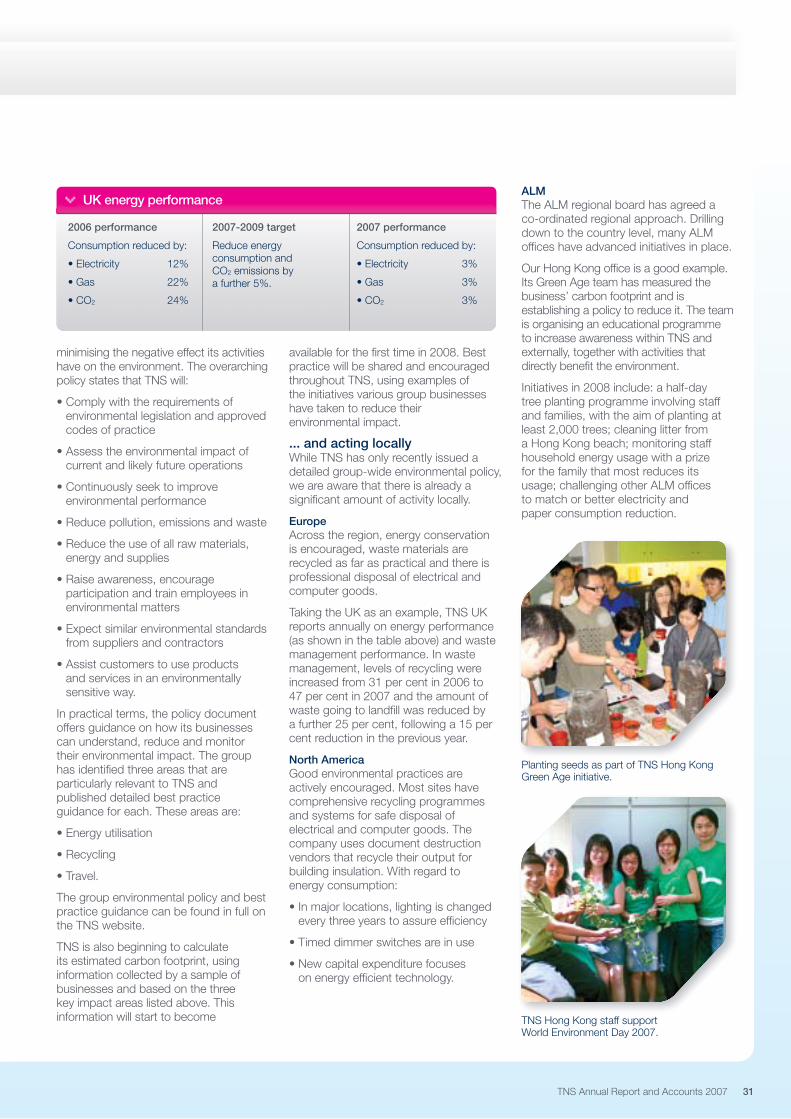
Taking the UK as an example, TNS UKreports annually on energy performance(as shown in the table above) and wastemanagement performance. In wastemanagement, levels of recycling wereincreased from 31 per cent in 2006 to47 per cent in 2007 and the amount ofwaste going to landfill was reduced bya further 25 per cent, following a 15 percent reduction in the previous year.
North AmericaGood environmental practices areactively encouraged. Most sites havecomprehensive recycling programmesand systems for safe disposal ofelectrical and computer goods. Thecompany uses document destructionvendors that recycle their output forbuilding insulation. With regard toenergy consumption:
• In major locations, lighting is changedevery three years to assure efficiency
• Timed dimmer switches are in use
• New capital expenditure focuseson energy efficient technology.
ALMThe ALM regional board has agreed aco-ordinated regional approach. Drillingdown to the country level, many ALMoffices have advanced initiatives in place.
Our Hong Kong office is a good example.Its Green Age team has measured thebusiness’ carbon footprint and isestablishing a policy to reduce it. The teamis organising an educational programmeto increase awareness within TNS andexternally, together with activities thatdirectly benefit the environment.
Initiatives in 2008 include: a half-daytree planting programme involving staffand families, with the aim of planting atleast 2,000 trees; cleaning litter froma Hong Kong beach; monitoring staffhousehold energy usage with a prizefor the family that most reduces itsusage; challenging other ALM officesto match or better electricity andpaper consumption reduction.
minimising the negative effect its activitieshave on the environment. The overarchingpolicy states that TNS will:
• Comply with the requirements ofenvironmental legislation and approvedcodes of practice
• Assess the environmental impact ofcurrent and likely future operations
• Continuously seek to improveenvironmental performance
• Reduce pollution, emissions and waste
• Reduce the use of all raw materials,energy and supplies
• Raise awareness, encourageparticipation and train employees inenvironmental matters
• Expect similar environmental standardsfrom suppliers and contractors
• Assist customers to use productsand services in an environmentallysensitive way.
In practical terms, the policy documentoffers guidance on how its businessescan understand, reduce and monitortheir environmental impact. The grouphas identified three areas that areparticularly relevant to TNS andpublished detailed best practiceguidance for each. These areas are:
• Energy utilisation
• Recycling
• Travel.
The group environmental policy and bestpractice guidance can be found in full onthe TNS website.
TNS is also beginning to calculateits estimated carbon footprint, usinginformation collected by a sample ofbusinesses and based on the threekey impact areas listed above. Thisinformation will start to become
Planting seeds as part of TNS Hong KongGreen Age initiative.
TNS Hong Kong staff supportWorld Environment Day 2007.
2006 performance
Consumption reduced by:
• Electricity 12%
• Gas 22%
• CO2 24%
2007-2009 target
Reduce energyconsumption andCO2 emissions by a further 5%.
2007 performance
Consumption reduced by:
• Electricity 3%
• Gas 3%
• CO2 3%
UK energy performance

32 www.tnsglobal.com
Directors’ Report – Business Review
Directors’ Report –Governance
Financial Statements
Shareholder Information
Supporting the communityPartnering with UNICEFThe global partnership approach that issuch a key driver of our service to clientsalso extends into our communityinvolvement. In 2005, TNS entered intoits first three-year commitment withUNICEF, which for 60 years has beenthe world’s leader for children, workingon the ground in 156 territories to helpchildren survive and thrive, from earlychildhood through adolescence.
The response from TNS people has beenoutstanding and is a clear illustration ofour organisation working as one teamacross the world. The UNICEF Imagine…project is given a high profile in groupcommunications and at seniormanagement conferences, underlining thegroup’s commitment to this relationship.
Imagine… in CambodiaIn Cambodia, the majority of youngchildren, especially in rural areas,miss out on early learning opportunities.To help tackle the problem, TNS isfunding a UNICEF project that enablescommunities to set up and run their owncommunity pre-schools – an importantelement in UNICEF’s efforts to rebuildcommunities in rural Cambodia.
In October 2007, we reached our three-year fund raising target of US$388,000.TNS people have raised this moneythrough a range of diverse and innovativefund raising activities, as well as directdonation. The energy and enthusiasmthey have put into this task is a clearillustration of the passion that they alsoshow in their work. Funds have alsocome from respondents to our research,who have generously donated theirincentives to Imagine… .
The money will allow UNICEF to build120 pre-school shelters. 47 have alreadybeen completed using TNS funds andthey are proving to be more than just aneducational facility; they are now actingas a centre for village activities and areattended by 1,175 children. UNICEFactively works with each community’scommune council, to identify how theshelters are built, taking on board localconstruction concerns and costs. TNShas provided $1,000 to each of 24commune councils, to help them planand manage the projects. Theprogramme has also provided 899community pre-school teachers withtraining and technical assistance.
An important element of TNS Imagine…is giving our employees an opportunityto see the project in action. In November,three TNS people selected for theircontribution to local fund raising,witnessed firsthand the real differencethat TNS is making, in equipping thenext generation for the future. They metPeu Nom, the deputy village chief inAng Kanh. She now has a dedicated sitewhere she can teach the community’schildren, which provides a symbol tothe community of the importance ofeducation. They saw that basic children’srights, hygiene and sanitation are taughtas part of the curriculum developed by
Stephanie Bennett sees firsthand how children have the opportunityto play in a safe environment funded by TNS employees.
Delivering responsibly
Pre-schoolers receive first paper planemaking lesson from Tim Kidd.

TNS Annual Report and Accounts 2007 33
UNICEF. This better understanding ofhygiene and sanitation has reducedsickness and directly improved pre-school and primary school attendancelevels, as well as health in the villagecommunity as a whole.
Imagine… in MalawiThe next three years of the Imagine…programme will involve funding‘Children’s Corners’ in Malawi. Theseare dedicated community buildings setup by UNICEF to support the thousandsof orphaned children in Malawi, who havelost their parents to AIDS. Children’sCorners are a safe place for children tolearn, play and come to terms with theirloss. We are challenging TNS peoplefrom around the group to raise $600,000that will fund more than 40 Children’sCorners and train over 180 community-based care workers. In this way, TNS willbe acting as a global team to provide abetter future for more than 12,000children in one of the poorest countriesin the world.
Extending the partnershipTNS also uses its business expertiseto support UNICEF as a client. Over thepast five years, TNS Opinion in Brusselshas conducted three multi-countryprojects, the results of which have helpedUNICEF raise awareness and defineaction plans to increase income throughdonations and fund raising activities.
The UNICEF partnership began whenthe group made a donation in responseto the tsunami disaster. Since then,TNS has worked closely with UNICEFto review and monitor the tsunami reliefeffort in Aceh and has played a key rolein prioritising future activities. UNICEFalso sought advice from TNS to evaluatethe social development effort behind thenational avian influenza initiative in whichUNICEF, the Indonesian Government andmany other organisations work togetherto educate people about avian influenzaprevention. Based on this experience,TNS is now conducting similar workfor The Academy of EducationalDevelopment in the Mekong region.This work is being conducted from ourVietnam office, which is building a strongbody of work with UNICEF, particularlyin Cambodia.
Working with our localcommunitiesTNS is aware of its position in the localcommunities in which it operates and thegroup encourages local management toplay an active part in those communities.This activity takes many forms and thefollowing are a few examples to illustrateour local community involvement.
EuropeIn Poland, TNS Obop is a member ofthe Foundation for Corporate SocialResponsibility, a group of socially-responsible companies that takes aproactive stance against social injusticesin the communities in which thosecompanies operate. TNS has supportedthe Foundation in the supply of schoolmeals to deprived children living inNorthwest Poland. The business hasalso conducted pro-bono work related toa social programme against corruption.
Examples of predominantly pro-bono workcan be found in Spain. We conduct an
annual survey for the FundaciónEmpresa y Sociedad, of which we area member, looking at people’s viewson the social policies of companies andbanks. We also provide market informationservices to La Fageda, a foundationthat employs people with disabilities.
North AmericaOur offices in the region activelysupport over 40 national and localcharities, through fund raising, donationand volunteering. One example mirrorsthe group partnership approach to clientrelationships. In collaboration with oneof its clients, Luxottica Group, a leadingdesigner, manufacturer and distributorof prescription frames and sunglasses,TNS participates in the Gift of Sightprogramme, which provides free visioncare and eyewear to people in need inNorth America and around the world.
ALMStaff at TNS Worldpanel Philippinesreacted immediately when they learnedthat some of their panellists lived in theareas hit by Typhoon Durian and withinfive days had launched a campaign tohelp. Donations of all kinds – clothes,blankets, groceries – were packed anddistributed by TNS people. The cashdonated was used to buy sacks of ricefor each of the affected panel households.
Employee volunteering The group recognises the positive impactthat volunteering can have on individualemployee development and teambuilding and encourages companies tofacilitate this. During 2007, for example,50 people from TNS UK split into smallteams and spent a day gardening,creating a vegetable plot and paintingthe nursery at a primary school localto the group’s corporate office.
Panel incentivesSpain, the Netherlands and the USare just a few examples of countrieswhere panel members are offered theopportunity to donate their incentivesto a number of charitable causes,including UNICEF Imagine… .
In 2007, the group made charitabledonations totalling £245,381(2006 £181,266).
raised by TNS employees acrossworld to support pre-schooleducation in Cambodia
$388,000
children in Malawi will be helpedby new TNS Imagine… project
12,000
34 www.tnsglobal.com
Revenue
Reported revenue increased by 6.3 percent to £1,067.7 million (2006 £1,004.2million). Underlying revenue growth was5.4 per cent. Acquisitions and disposalshad a positive impact of 2.6 per cent.Foreign exchange movements had anegative impact of 1.7 per cent.
Calculation of underlying revenue growthThe group’s calculation of underlyingrevenue growth remains consistent withthat published in previous years.Underlying revenue growth is calculatedby taking the increase in 2007 revenueover 2006 pro forma revenue, atconstant exchange rates. The pro formarevenue assumes that any acquisitionswere owned and any discontinuedoperations or disposals excluded, forthe comparable period in the prior year.
Regional revenue performanceThe group reports three regions: Europe(including disclosure of UK, France, Rest ofEurope), North America and Asia Pacific,Latin America and the Middle East & Africa(ALM). Previously Middle East & Africa wasincluded in Europe and Latin America wasshown as part of the Americas. Prior yearcomparatives reflecting this change areshown in the figures opposite.
EuropeEurope achieved underlying growth of5.8 per cent, reflecting a goodperformance across the region in boththe custom and syndicated businesses.
Performance in the UK was ahead ofa flat market, with the Technology andsyndicated media sectors especiallystrong. As anticipated, growth wasweighted to the first half due to thedeferral of some project completionsin custom from the prior year.
In France, the custom businesscontinues to be strong, especially inthe Consumer sector, where a greaterproportion of surveys have beentransitioned to the internet. The businessalso benefited from additional pollingwork for the French presidential electionsin the first half. Syndicated servicesdelivered a steady performance.
Underlying revenue growth in the Restof Europe was strong, particularly inGermany; and also boosted by goodperformances in Spain, Russia andEastern Europe.
2007 was a successful year for TNS,with good revenue growth, marginimprovement and cash generation.
Directors’ Report – Business Review
Directors’ Report –Governance
Financial Statements
Shareholder Information
Finance Director’s report on performance
Andy BolandFinance Director

TNS Annual Report and Accounts 2007 35
North AmericaUnderlying growth in the North Americaregion overall was 2.4 per cent.
2007 was a year of rebuilding for the UScustom business. Growth was over 2 percent, which is ahead of expectations atthe start of the year, driven by goodperformance in Global PartnershipAccounts. The business is increasinglyseeing the benefits of the changes madeto bring it in line with group strategy, toimprove the level of value-addedservices. This is a process that willcontinue and the group is confidentabout the growth prospects for thatbusiness in 2008.
TNS Media Intelligence in the US sawgood demand for new services andbusiness wins from advertisers andmedia owners.
Asia Pacific, Latin America, Middle East& Africa (ALM)Strong performance in the ALM regionbenefited from positive market conditionsand the quality of TNS’ regional network.Underlying growth for the region overallwas 8.0 per cent, with growth especiallystrong in China, Korea, Australia andHong Kong. In 2007, ALM represented16 per cent of group revenues, againstthe target of 20 per cent by 2010-2012.
Sector revenue performanceConsumerTNS Worldpanel, the group’s consumerpurchasing panel business, continued to perform well across all major regions,especially in Asia. In January 2008, the group increased its ownership ofLatinPanel International in Latin Americato 100 per cent, reinforcing itsinternational offering. In custom, therewas a strong performance fromConsumer Global Accounts, a key partof the growth strategy for the sector.
MediaGrowth in television and radio audiencemeasurement has been strong and thegroup continues to win contracts acrossthe world, based on its expertise in thisarea and the introduction of new digitalservices. TNS won the BARB contractin the UK (commencing in 2010), as wellas tenders in Denmark and Norway.Digital audience measurement contractswere also won in the US and SouthAfrica. TNS Media Intelligenceperformed well. The group announcedacquisitions in the UK, Poland andGermany in 2007, and Ireland in 2008,enhancing its Media Intelligence offeringin Europe.
Business ServicesBusiness Services performed well,with good growth in Financial Services,particularly in Europe and Asia.
TechnologyTechnology is one of the faster growingparts of the market information industryand an important part of TNS’ sectorgrowth strategy. Good underlyinggrowth in Technology for the groupoverall was driven by Asia and NorthAmerica. In 2008, TNS will build onexisting syndicated services in thesector, with the launch of a continuousmeasurement service for the consumermobile market.
HealthcareThe strategy to focus on moreconsumer-related research continuesto work well. Underlying growth in theHealthcare sector was good, driven bya strong performance in Europe.
OtherGrowth in the Automotive sector wasstrong, especially in Europe, where thegroup has continued to win majorcontracts with the large manufacturers.The good performance in the Politicaland Social sector was boosted byelections in France, as well as furtherproject wins with the European Unionand other international organisations.
Year to 31 December ChangeRestated
2007 2006 Reported Underlying£m £m % %
UK 161.9 151.1 7.1 6.1
France 145.8 145.5 0.2 3.1
Rest of Europe 380.2 352.6 7.8 6.7
Europe 687.9 649.2 6.0 5.8
North America 205.5 209.2 (1.8) 2.4
ALM 174.3 145.8 19.6 8.0
Total 1,067.7 1,004.2 6.3 5.4
Year to 31 December ChangeRestated
2007 2006 Reported Underlying£m £m % %
Consumer 327.3 313.8 4.3 3.5
Media 226.2 206.3 9.6 7.5
Business Services 141.1 138.9 1.6 4.6
Technology 117.9 105.5 11.7 7.1
Healthcare 102.4 96.5 6.1 7.7
Other 152.8 143.2 6.7 4.6
Total 1,067.7 1,004.2 6.3 5.4
Regional revenue performance Sector revenue performance
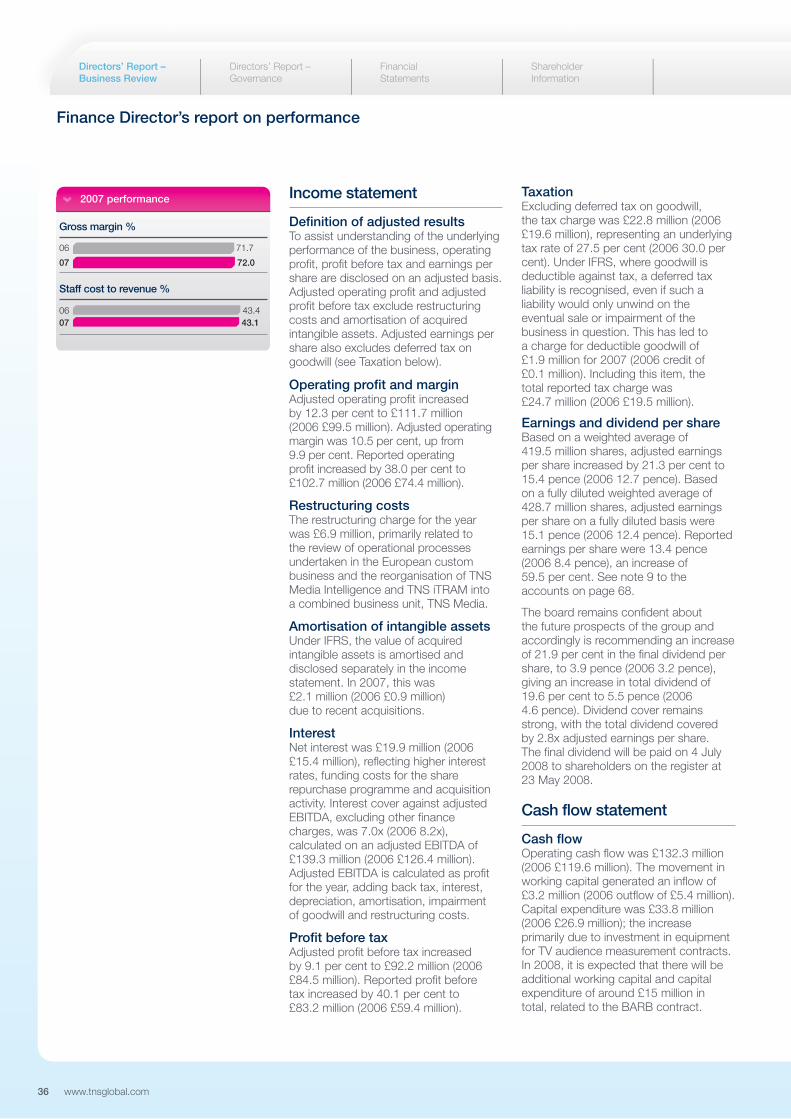
36 www.tnsglobal.com
Directors’ Report – Business Review
Directors’ Report –Governance
Financial Statements
Shareholder Information
TaxationExcluding deferred tax on goodwill, the tax charge was £22.8 million (2006 £19.6 million), representing an underlyingtax rate of 27.5 per cent (2006 30.0 percent). Under IFRS, where goodwill isdeductible against tax, a deferred taxliability is recognised, even if such aliability would only unwind on theeventual sale or impairment of thebusiness in question. This has led to a charge for deductible goodwill of £1.9 million for 2007 (2006 credit of £0.1 million). Including this item, the total reported tax charge was £24.7 million (2006 £19.5 million).
Earnings and dividend per shareBased on a weighted average of419.5 million shares, adjusted earningsper share increased by 21.3 per cent to15.4 pence (2006 12.7 pence). Based on a fully diluted weighted average of 428.7 million shares, adjusted earningsper share on a fully diluted basis were15.1 pence (2006 12.4 pence). Reportedearnings per share were 13.4 pence(2006 8.4 pence), an increase of 59.5 per cent. See note 9 to theaccounts on page 68.
The board remains confident about the future prospects of the group andaccordingly is recommending an increaseof 21.9 per cent in the final dividend pershare, to 3.9 pence (2006 3.2 pence),giving an increase in total dividend of19.6 per cent to 5.5 pence (2006 4.6 pence). Dividend cover remainsstrong, with the total dividend covered by 2.8x adjusted earnings per share. The final dividend will be paid on 4 July2008 to shareholders on the register at23 May 2008.
Cash flow statement
Cash flowOperating cash flow was £132.3 million(2006 £119.6 million). The movement inworking capital generated an inflow of£3.2 million (2006 outflow of £5.4 million).Capital expenditure was £33.8 million(2006 £26.9 million); the increaseprimarily due to investment in equipmentfor TV audience measurement contracts.In 2008, it is expected that there will beadditional working capital and capitalexpenditure of around £15 million in total, related to the BARB contract.
Income statement
Definition of adjusted resultsTo assist understanding of the underlyingperformance of the business, operatingprofit, profit before tax and earnings pershare are disclosed on an adjusted basis.Adjusted operating profit and adjustedprofit before tax exclude restructuringcosts and amortisation of acquiredintangible assets. Adjusted earnings pershare also excludes deferred tax ongoodwill (see Taxation below).
Operating profit and marginAdjusted operating profit increased by 12.3 per cent to £111.7 million(2006 £99.5 million). Adjusted operatingmargin was 10.5 per cent, up from 9.9 per cent. Reported operating profit increased by 38.0 per cent to£102.7 million (2006 £74.4 million).
Restructuring costsThe restructuring charge for the year was £6.9 million, primarily related to the review of operational processesundertaken in the European custombusiness and the reorganisation of TNSMedia Intelligence and TNS iTRAM into a combined business unit, TNS Media.
Amortisation of intangible assetsUnder IFRS, the value of acquiredintangible assets is amortised anddisclosed separately in the incomestatement. In 2007, this was £2.1 million (2006 £0.9 million) due to recent acquisitions.
InterestNet interest was £19.9 million (2006£15.4 million), reflecting higher interestrates, funding costs for the sharerepurchase programme and acquisitionactivity. Interest cover against adjustedEBITDA, excluding other financecharges, was 7.0x (2006 8.2x),calculated on an adjusted EBITDA of£139.3 million (2006 £126.4 million).Adjusted EBITDA is calculated as profitfor the year, adding back tax, interest,depreciation, amortisation, impairment of goodwill and restructuring costs.
Profit before taxAdjusted profit before tax increased by 9.1 per cent to £92.2 million (2006 £84.5 million). Reported profit before tax increased by 40.1 per cent to£83.2 million (2006 £59.4 million).
Finance Director’s report on performance
07
06 71.7
72.0
0706
43.143.4
2007 performance
Gross margin %
Staff cost to revenue %
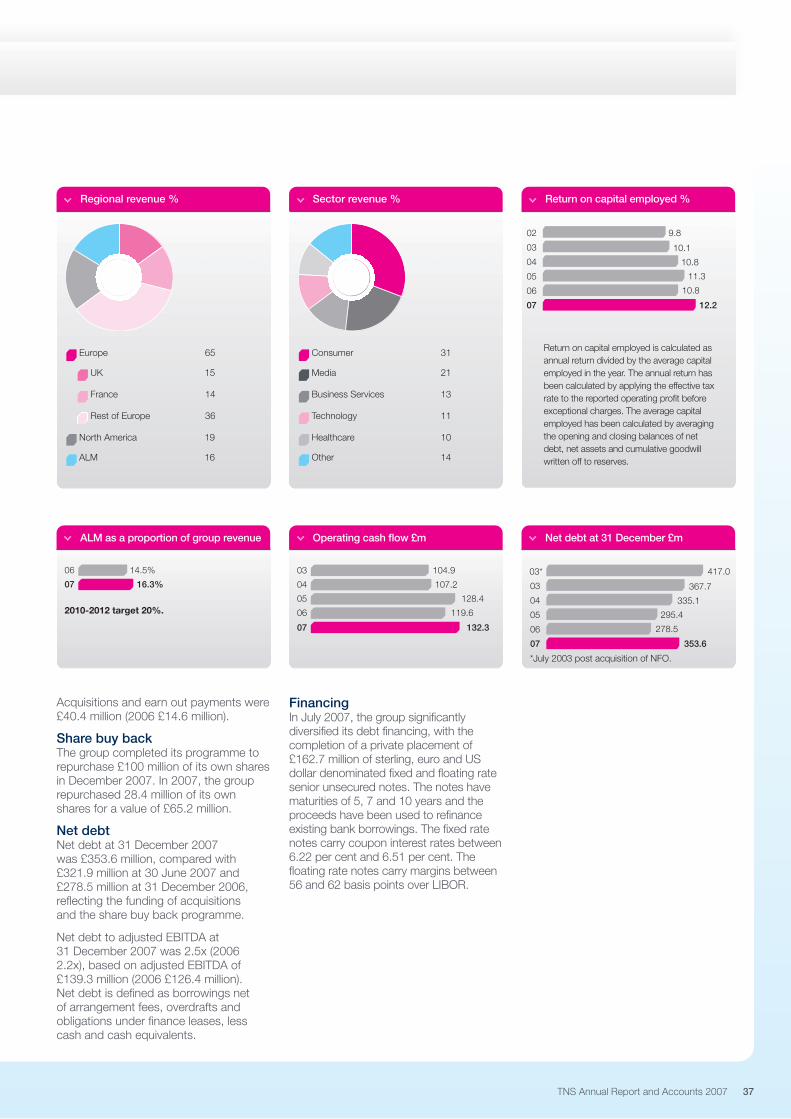
TNS Annual Report and Accounts 2007 37
Acquisitions and earn out payments were£40.4 million (2006 £14.6 million).
Share buy backThe group completed its programme torepurchase £100 million of its own sharesin December 2007. In 2007, the grouprepurchased 28.4 million of its ownshares for a value of £65.2 million.
Net debtNet debt at 31 December 2007 was £353.6 million, compared with£321.9 million at 30 June 2007 and£278.5 million at 31 December 2006,reflecting the funding of acquisitions and the share buy back programme.
Net debt to adjusted EBITDA at 31 December 2007 was 2.5x (20062.2x), based on adjusted EBITDA of£139.3 million (2006 £126.4 million). Net debt is defined as borrowings net of arrangement fees, overdrafts andobligations under finance leases, lesscash and cash equivalents.
FinancingIn July 2007, the group significantlydiversified its debt financing, with thecompletion of a private placement of£162.7 million of sterling, euro and USdollar denominated fixed and floating ratesenior unsecured notes. The notes havematurities of 5, 7 and 10 years and theproceeds have been used to refinanceexisting bank borrowings. The fixed ratenotes carry coupon interest rates between6.22 per cent and 6.51 per cent. Thefloating rate notes carry margins between56 and 62 basis points over LIBOR.
UK 15
France 14
Rest of Europe 36
North America 19
ALM 16
Europe 65
Media 21
Business Services 13
Technology 11
Healthcare 10
Other 14
Consumer 31
2010-2012 target 20%.
07
06
16.3%
14.5%
07
06 119.6
05
04
03
132.3
128.4
107.2
104.9
07
06 278.5
05
04
03
03*
353.6
295.4
335.1
367.7
417.0
07
06 10.8
05
04
03
02
12.2
11.3
10.8
10.1
9.8
Return on capital employed is calculated asannual return divided by the average capitalemployed in the year. The annual return hasbeen calculated by applying the effective taxrate to the reported operating profit beforeexceptional charges. The average capitalemployed has been calculated by averagingthe opening and closing balances of netdebt, net assets and cumulative goodwillwritten off to reserves.
*July 2003 post acquisition of NFO.
Regional revenue % Sector revenue % Return on capital employed %
ALM as a proportion of group revenue Operating cash flow £m Net debt at 31 December £m
38 www.tnsglobal.com
Directors’ Report – Business Review
Directors’ Report –Governance
Financial Statements
Shareholder Information
Investing in the brandIn 2007, TNS implemented a new globalmarketing organisation. It supports thegroup’s strategy through the adoptionof stronger branding and a new brandarchitecture that reflects the GlobalSector structure and the Areas ofExpertise. Marketing resource wasplaced in the Global Sectors, to enablethem to interact more closely with theneeds of key clients. Marketing activitieswere also strengthened in two of thegroup’s major custom markets: NorthAmerica and the UK.
TNS launched a new corporate websiteat the end of August 2007. It providesthe base for the group’s online marketingstrategy and a dynamic thought-leadership platform. Widespread useof video and downloads has delivereda world-class interactive website. Trafficlevels to the new website have risensharply since its launch and a searchengine optimisation programme willcontinue through 2008, to maintain thisgrowth in traffic.
A global corporate PR function wasestablished in 2007, with the aim ofbuilding the awareness of TNS throughstructured and co-ordinated use of PRaround the world.
Andy BolandFinance Director
Finance Director’s report on performance
Resources
PropertyThe group has in place an ongoingproperty programme, through which it reviews and manages its spacerequirements. The programme continuesto identify opportunities for cost savingsover the medium term, through bothoffice consolidation and the more efficientuse of existing space.
Intellectual propertyTNS has written policies that assist in the management and protection of the group’s intellectual property rights.Policies relating to the registration oftrade marks and patents are available to all employees via the intranet, withupdates and reminders communicated to relevant employees as appropriate.TNS also maintains a communicationsand information security policy on its intranet.
TNS protects its inventions by filingpatents. On occasion TNS obtainslicences for relevant third partytechnology, software and know how,which it uses to sell further or enhancedproducts to clients. TNS has asubstantial international trade markportfolio, which covers all the relevantcountries for its corporate TNS nameand logo, Business Solutions and otherbusiness brands. The group has a secureonline trade mark management system,to assist in the management of its brandportfolio. Trade mark licences are in placebetween Taylor Nelson Sofres plc and itssubsidiaries, for the use of relevant trademarks such as the TNS name and logo.TNS’ deliverables and work products areprotected by copyright and are markedwith copyright notices.
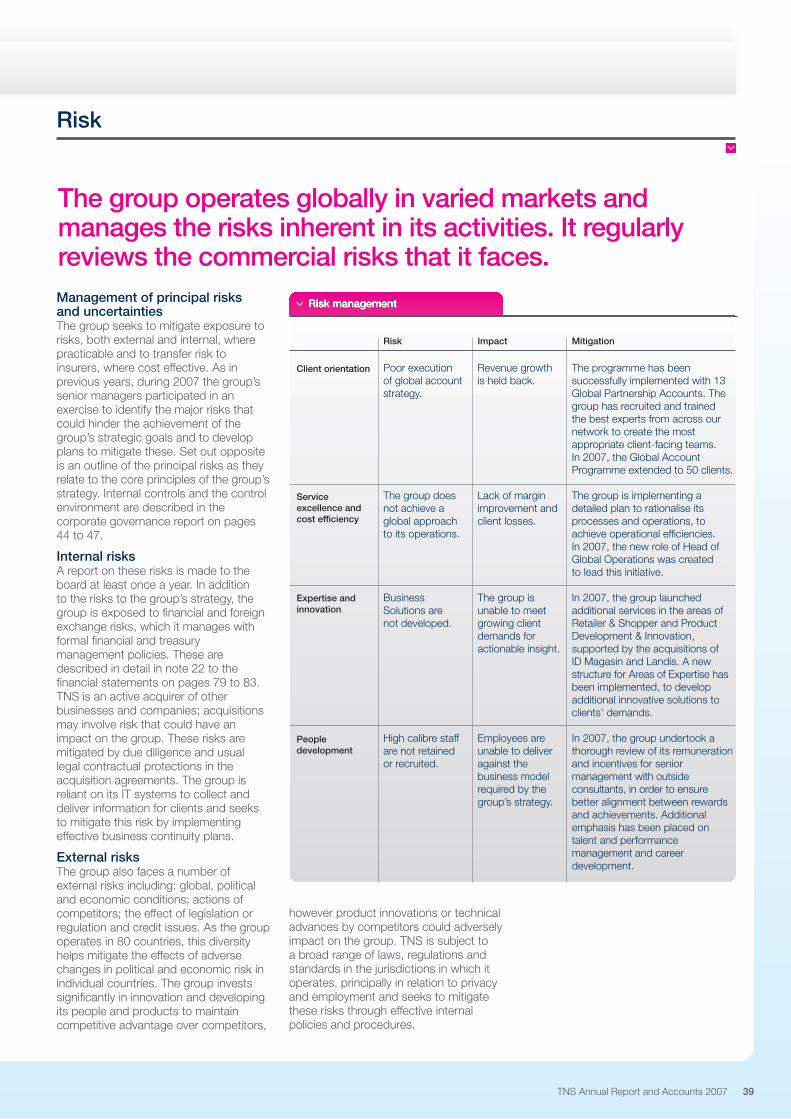
TNS Annual Report and Accounts 2007 39
Management of principal risks and uncertaintiesThe group seeks to mitigate exposure torisks, both external and internal, wherepracticable and to transfer risk toinsurers, where cost effective. As inprevious years, during 2007 the group’ssenior managers participated in anexercise to identify the major risks thatcould hinder the achievement of thegroup’s strategic goals and to developplans to mitigate these. Set out oppositeis an outline of the principal risks as theyrelate to the core principles of the group’sstrategy. Internal controls and the controlenvironment are described in thecorporate governance report on pages44 to 47.
Internal risksA report on these risks is made to theboard at least once a year. In additionto the risks to the group’s strategy, thegroup is exposed to financial and foreignexchange risks, which it manages withformal financial and treasurymanagement policies. These aredescribed in detail in note 22 to thefinancial statements on pages 79 to 83.TNS is an active acquirer of otherbusinesses and companies; acquisitionsmay involve risk that could have animpact on the group. These risks aremitigated by due diligence and usuallegal contractual protections in theacquisition agreements. The group isreliant on its IT systems to collect anddeliver information for clients and seeksto mitigate this risk by implementingeffective business continuity plans.
External risksThe group also faces a number ofexternal risks including: global, politicaland economic conditions; actions ofcompetitors; the effect of legislation orregulation and credit issues. As the groupoperates in 80 countries, this diversityhelps mitigate the effects of adversechanges in political and economic risk inindividual countries. The group investssignificantly in innovation and developingits people and products to maintaincompetitive advantage over competitors,
Risk
The group operates globally in varied markets andmanages the risks inherent in its activities. It regularlyreviews the commercial risks that it faces.
however product innovations or technicaladvances by competitors could adverselyimpact on the group. TNS is subject toa broad range of laws, regulations andstandards in the jurisdictions in which itoperates, principally in relation to privacyand employment and seeks to mitigatethese risks through effective internalpolicies and procedures.
Risk management
Risk
Poor execution of global accountstrategy.
The group doesnot achieve aglobal approachto its operations.
BusinessSolutions are not developed.
High calibre staffare not retainedor recruited.
Client orientation
Serviceexcellence andcost efficiency
Expertise andinnovation
Peopledevelopment
Impact
Revenue growthis held back.
Lack of marginimprovement andclient losses.
The group isunable to meetgrowing clientdemands foractionable insight.
Employees areunable to deliveragainst thebusiness modelrequired by thegroup’s strategy.
Mitigation
The programme has beensuccessfully implemented with 13Global Partnership Accounts. Thegroup has recruited and trained the best experts from across ournetwork to create the mostappropriate client-facing teams. In 2007, the Global AccountProgramme extended to 50 clients.
The group is implementing adetailed plan to rationalise itsprocesses and operations, toachieve operational efficiencies. In 2007, the new role of Head ofGlobal Operations was created to lead this initiative.
In 2007, the group launchedadditional services in the areas ofRetailer & Shopper and ProductDevelopment & Innovation,supported by the acquisitions of ID Magasin and Landis. A newstructure for Areas of Expertise hasbeen implemented, to developadditional innovative solutions toclients’ demands.
In 2007, the group undertook athorough review of its remunerationand incentives for seniormanagement with outsideconsultants, in order to ensurebetter alignment between rewardsand achievements. Additionalemphasis has been placed ontalent and performancemanagement and careerdevelopment.

40 www.tnsglobal.com
Directors’ Report – Business Review
Directors’ Report –Governance
Financial Statements
Shareholder Information
Donald Brydon CBE
Chairman (62)
January 2006. Nomination (Chairman) and Remuneration.
Chairman of Smiths Group plc, The London Metal Exchangeand the ifs School of Finance.
20 year career with Barclays Group, during which time he wasChairman and Chief Executive of BZW Investment Management,followed by 10 years as President of AXA Investment Managers.Most recently was also Chairman of Amersham plc and adirector of Allied Domecq plc and Scottish Power plc.
Name
Title and age
Date joined boardand committeemembership
Otherappointments
Experience
David Lowden
Chief Executive (50)
Appointed TNS Chief Executive in January 2006. Joined groupand appointed to board in 1999 as Finance Director andbecame Chief Operating Officer in 2003. Previously workedfor a number of international companies including ACNielsenand Federal Express Corporation.
As Chief Executive, he has restructured the business to meetclients’ demands for globalisation of services, cost effectivenessand quality of data collection, increased insight and analysis,and innovation.
Name
Title and age
Career summary
Achievements
Andy Boland
Finance Director (38)
Joined TNS and appointed to board in January 2004. Previouslyheld a number of senior finance positions at WPP Group plcand Cordiant Communications Group plc.
Has established a strong finance function that supportsmanagement of business performance across the group.Focused on implementing group strategy through businessprocess improvements, internal investments and mergerand acquisition activity.
Name
Title and age
Career summary
Achievements
Pedro Ros
Managing Director – Global Clients and Sectors (46)Acting Head of North America custom
Joined TNS board in January 2006, when appointed to currentposition. Since joining TNS in 1985, roles included Global Headof TNS Worldpanel and Regional Manager for Southern Europe,Latin America, Middle East and Africa.
Has built a strong team to deliver on group’s increasingly globalapproach to servicing major clients. Has established a GlobalAccount Programme for 50 clients, reinforced strength of group’scustom sectors and improved international project management.
Name
Title and age
Career summary
Achievements
Board of directors

TNS Annual Report and Accounts 2007 41
Paul Murray
Senior Independent Director (46)
May 2005. Appointed Senior Independent Director inAugust 2005. Audit (Chairman) and Remuneration.
Non-executive director of Thomson SA and TangentCommunications PLC.
Finance Director of Carlton Communications plc from 2001to 2004. Prior to that, Finance Director of LASMO plc.
Name
Title and age
Date joined boardand committeemembership
Otherappointments
Experience
Drummond Hall
Non-executive director (58)
12 April 2007. Audit, Nomination and Remuneration.
Deputy Chairman of Mitchells & Butler plc.
Chief Executive of Dairy Crest plc from 2002 to 2006, havingjoined as a main board director in 1991. Prior to that, ManagingDirector of the Cider and Beer Division of HP Bulmer. Before thenhe was Marketing Director for Pepsi-Cola Northern Europe andheld marketing positions in Mars and Procter & Gamble.
Name
Title and age
Date joined boardand committeemembership
Otherappointments
Experience
Alice Perkins CB
Non-executive director (58)
March 2005. Audit, Nomination and Remuneration (Chair).
External member of the Oxford University Council and onthe Business Advisory Forum at the Said Business School.
Left the civil service and her role in the Cabinet Office as the civilservice’s HR Director in 2005. Previously also a non-executivedirector of BAA plc and The Littlewoods Organisation plc.
Name
Title and age
Date joined boardand committeemembership
Otherappointments
Experience
Rémy Sautter
Non-executive director (62)
November 2002. Nomination and Remuneration.
Chairman of RTL Radio and Chairman of the board of Five. Non-executive director of PartnerRe Ltd., a NYSE-listed globalreinsurance company and two media companies listed inFrance: M6-Métropole Télévision SA and Pages Jaune SA.
22 year career with RTL Group, including six years as head of radiodivision and four as CEO. Formerly CFO of Havas and held variouspositions at French institutional investor Caisse des Dépôts.
Name
Title and age
Date joined boardand committeemembership
Otherappointments
Experience
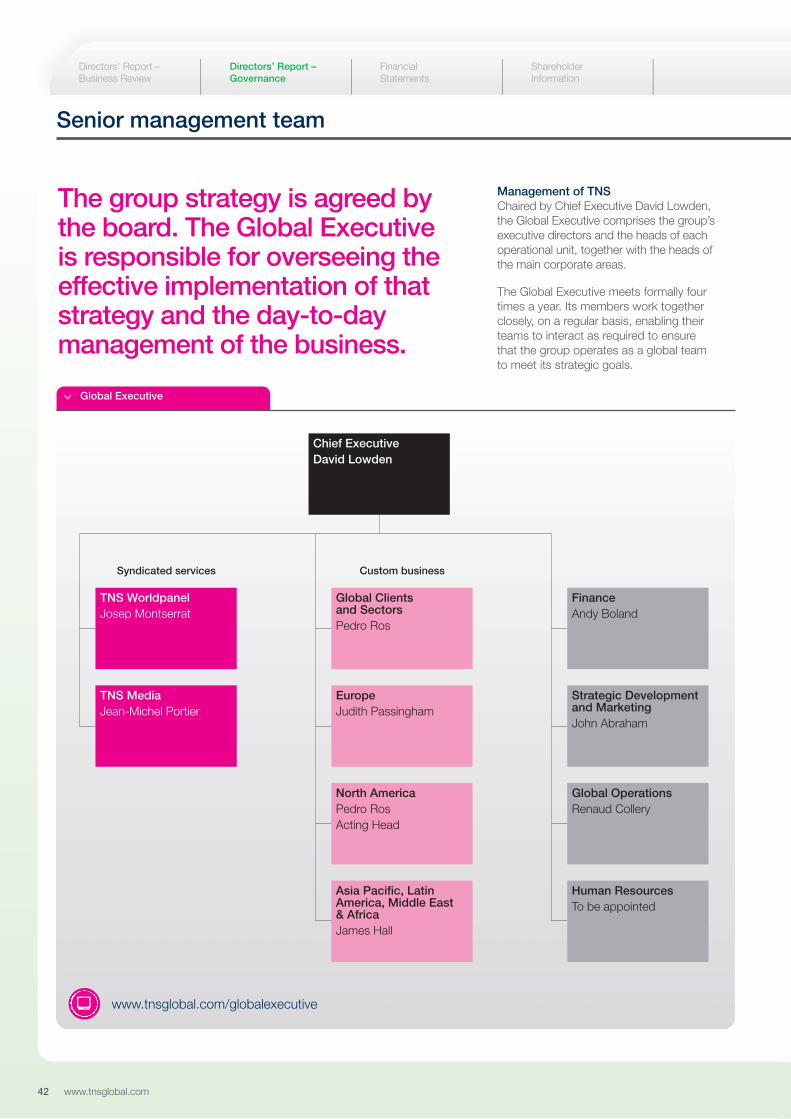
42 www.tnsglobal.com
Directors’ Report – Business Review
Directors’ Report –Governance
Financial Statements
Shareholder Information
Senior management team
Management of TNSChaired by Chief Executive David Lowden, the Global Executive comprises the group’sexecutive directors and the heads of eachoperational unit, together with the heads ofthe main corporate areas.
The Global Executive meets formally fourtimes a year. Its members work togetherclosely, on a regular basis, enabling theirteams to interact as required to ensurethat the group operates as a global teamto meet its strategic goals.
The group strategy is agreed by the board. The Global Executive is responsible for overseeing theeffective implementation of thatstrategy and the day-to-daymanagement of the business.
Custom businessSyndicated services
Global Clientsand SectorsPedro Ros
Chief ExecutiveDavid Lowden
FinanceAndy Boland
Strategic Development and MarketingJohn Abraham
Global OperationsRenaud Collery
Human ResourcesTo be appointed
EuropeJudith Passingham
TNS WorldpanelJosep Montserrat
TNS MediaJean-Michel Portier
North AmericaPedro RosActing Head
Asia Pacific, LatinAmerica, Middle East& AfricaJames Hall
www.tnsglobal.com/globalexecutive�
Global Executive

TNS Annual Report and Accounts 2007 43
James Hall
Managing Director,TNS Asia Pacific, LatinAmerica, Middle East & Africa
Placed special emphasis onemerging markets, as driverfor growth in region, and furtherexpansion of regional capabilities.Successful integration ofacquisitions and mergers inJapan, South Africa, Chile,Australia and New Zealand.
Name
Title
Keyachievements
Renaud Collery
Head of Global Operations
Joined TNS in mid 2007 in thisnewly-created position. Hasfocused his efforts on aligningthe global operational structureand targeting prioritystandardisation opportunities,in order to drive productivityimprovements.
Name
Title
Keyachievements
Jean-Michel Portier
Chief Executive, TNS Media
Appointed to lead TNS Media,the combined media intelligenceand audience measurementbusiness, in October 2007.During year, extended TNS MIservices into social media withacquisition of Cymfony andreinforced leading ad and newsmonitoring position in Europethrough a number of acquisitions.
Name
Title
Keyachievements
Judith Passingham
Managing Director, TNS Europe
Since appointment to role in2007, reorganised the Europeanmanagement structure andlaunched a number of initiativeswith this team. These include amajor process efficiency initiative,optimisation of the 6th dimensiononline access panel andenhancement of the multi-country project unit.
Name
Title
Keyachievements
John Abraham
Strategic Development andMarketing Director
Active in the development ofthe group’s strategy and buildingTNS’ capabilities in Digital Media,Retail & Shopper and CustomerIntelligence. Increasing focus onAreas of Expertise.
Name
Title
Keyachievements
Josep Montserrat
Managing Director, TNS Worldpanel
Since appointment to role in2007, has strengthened theadded-value offering andincreased focus on learningand development. ReinforcedTNS Worldpanel presence inChina and Latin America.
Name
Title
Keyachievements

44 www.tnsglobal.com
Corporate governance report
Directors’ Report – Business Review
Directors’ Report –Governance
Financial Statements
Shareholder Information
The board is pleased to confirm that throughout 2007 the groupcomplied in full with all provisions of the June 2006 version of theCombined Code on Corporate Governance, with the sole exceptionthat following the resignation of Sharon Studer and until DrummondHall was appointed there were only two independent non-executivedirectors appointed to the audit committee.
The board: composition, non-executives, responsibilities and attendance
CompositionAs at 29 February 2008, the board comprises the Chairman, theChief Executive, the Finance Director and a further executive director,together with four independent non-executives. All of the currentlyappointed directors served throughout the financial year, with theexception of Drummond Hall who was appointed in April 2007.Dawn Airey was also appointed to the board as a non-executivedirector in April 2007, but resigned in May 2007 following herappointment at ITV plc. Paul Murray continued to act as SeniorIndependent Director. Biographical information for current boarddirectors is given on pages 40 to 41.
In accordance with the articles of association, executive directorsretire by rotation and submit themselves for re-election every threeyears and non-executive directors every two years. The board hascollectively agreed that the directors proposed for re-election in 2008have made significant contributions to the business since their lastre-election and each has a key role to play in the formulation of thegroup’s future strategy.
Non-executivesThroughout the financial year the board comprised a majority ofindependent non-executives. The non-executive directors continueto contribute their considerable collective experience and wide-ranging skills to the board and provide a valuable independentperspective; where necessary constructively challenging proposals,policy and practices. In addition, they helped formulate the group’sstrategy at specifically held board meetings. During the year, theChairman met the other non-executives in the absence of theexecutive directors to re-confirm and take account of their views. All have sufficient time to fulfil their commitments to the company.
ResponsibilitiesThe board meets regularly, with eight meetings scheduled and held in 2007. It was only necessary for the board to hold oneunscheduled board meeting in the year. Directors were provided with comprehensive background information for this meeting and all directors were available to participate. There remains in place a formal schedule of matters specifically reserved for boardconsideration and approval, which includes matters related tostrategy and management; acquisitions and disposals; structure andcapital; financial reporting and controls; internal controls; significantchanges to group operations; board constitution, communicationsand performance evaluation; remuneration and delegated authorities.
In 2007, the board remained satisfied that the roles of the Chairman,Chief Executive and other executive directors continued to be clearlyand comprehensively defined.
Paul Murray, the Senior Independent Director, remained available toshareholders throughout 2007, to address concerns not satisfied bynormal channels. He was not approached during the year.
In seeking to maintain and comply with the highest possiblegovernance standards, the board has continued to delegate certainresponsibilities and aspects of its work to its three committees: audit,nomination and remuneration. Each committee has specific terms ofreference, which are available on the group website and on requestfrom the Company Secretary.
Audit committeeChaired by Paul Murray, who has recent relevant financialexperience, the committee consists of three independent non-executive directors. There were four committee meetings duringthe financial year, all previously scheduled. The external auditor,PricewaterhouseCoopers LLP, attended each meeting and metprivately with the committee after each meeting.
The primary responsibilities delegated to, and discharged by, thecommittee included: monitoring the effectiveness of internal controland risk management systems and associated functions; approvingand amending group accounting policies; reviewing and ensuring theintegrity of interim and annual financial statements before submissionto the board; monitoring and approving the scope and costs of audit;and ensuring audit independence by approving significant non-auditservices provided by the auditor in accordance with the appropriatecommittee policy. A summary of non-audit fees incurred during2007, including due diligence, tax advisory and tax compliance work,is included in note 3 to the financial statements on page 65.
The audit committee is regularly updated regarding use of thecompany’s Ethics helpline, has full powers of investigation andremains entitled to take independent professional advice.
Nomination committeeChaired by Donald Brydon with effect from 28 February 2007, thecommittee consists of four independent non-executive directors. TheChief Executive attends committee meetings by invitation. There wasone committee meeting during the first quarter of the year.
The primary responsibilities delegated to, and discharged by, thecommittee included: regularly reviewing the composition of theboard; the consideration of succession planning and thedevelopment of associated policies; and the identification andrecommendation of candidates to join the board whenever deemedappropriate. Thorough appointment processes and policies havebeen developed by the committee, involving the development ofobjective criteria, creation of precise job specifications taking intoaccount existing board expertise, the use of external searchconsultancies and appropriate interviewing. These processes andpolicies were followed in respect of the appointment of DrummondHall and Dawn Airey in April 2007.
Remuneration committeeChaired by Alice Perkins, the composition and delegatedresponsibilities of the remuneration committee are outlined in thedirectors’ remuneration report on pages 50 to 54, together with aconsideration of the company’s application of the Combined Code.

TNS Annual Report and Accounts 2007 45
The directors are satisfied that all relevant provisions have beencomplied with.
AttendanceThe following table details board and committee meetings held in2007, and individual directors’ attendance. However, directors
attend numerous other meetings and visits throughout the year and the board considers that directors’ contributions should bemeasured beyond simple attendance records.
Board meetings Committee meetings
Regular Ad hoc1 Audit Nomination Remuneration
Number of meetings in year 8 1 4 1 4
Executive directors
David Lowden 7 1 – – –
Andy Boland 8 1 – – –
Pedro Ros 8 1 – – –
Non-executive directors
Donald Brydon 8 1 –3 1 4
Paul Murray 8 1 4 – 4
Drummond Hall2 6 1 2 04 3
Alice Perkins 8 1 4 1 4
Rémy Sautter 8 1 – 1 4
1 The meeting was convened on 24 May 2007 to consider Dawn Airey’s request to step down from the board.2 Appointed 12 April 2007 and to the audit committee with effect from 1 August 2007.3 Donald Brydon was in attendance at all audit committee meetings held in the year.4 Committee meeting held prior to appointment.– Indicates not a member of that committee.
The board: performance evaluation, information and developmentIn 2007, the board, utilising an independent process overseen byProfessor Goffee of the London Business School, completed anannual evaluation of its own performance and that of its committeesand individual directors. The directors individually evaluated each ofthese areas by questionnaire, with the results being collated,analysed and reported to the board as a whole by Professor Goffee,who also assisted by benchmarking performance and facilitatingagreement to a plan to improve performance. Where appropriate, theresults have been incorporated into board and individual objectivesfor 2008.
The board has established reporting mechanisms, whichsimultaneously ensure that it receives timely and appropriate reportsand proposals from senior management in advance of its scheduledmeetings, and is immediately informed of significant developmentsaffecting the business. The reporting framework ensures thatdirectors have appropriate time to consider all information relevant tokey decisions and are kept informed of market, regulatory andlegislative developments.
Newly appointed directors can expect a detailed and systematicinduction on joining the board. They meet various members of seniormanagement and familiarise themselves with all core aspects of the
group’s operations. On request, meetings can be arranged with themajor shareholders. Drummond Hall underwent a thorough inductionfrom April 2007 onwards. Continuing directors are also givenopportunities to meet with senior management, and to have anyinternal or external training they feel may benefit them in their role.Tailored arrangements were made during the year for certaindirectors. In 2007, the board also conducted site visits in New Yorkand Paris.
Directors’ dutiesThe directors note the gradual implementation of the 2006Companies Act, having been made fully aware of their restated legal responsibilities through a series of related presentations and updates.
All directors are entitled to seek independent professional adviceunder an agreed board procedure, which would then be organisedby the Company Secretary & Group General Counsel, Paul Wright.No director sought such advice in 2007. All directors additionallyhave access to the services provided by the Company Secretary &Group General Counsel. The removal of the Company Secretary &Group General Counsel remains a matter for the board as a whole.
The Company Secretary takes responsibility for organising andrenewing the Directors and Officers’ Liability insurance maintained by
46 www.tnsglobal.com
Corporate governance report
the company, further details of which are included on page 48 ofthe other statutory information report. He additionally overseesthe operation of the group pension plans and post-retirementarrangements on behalf of the company. The group operates anumber of defined benefit and defined contribution plans, the assetsof which are held independently from those of the group.
In the UK, pension assets are held under trust and managed byTaylor Nelson Sofres Trustees Limited, the board of which comprisesboth employee representatives and group executives in accordancewith the requirements of the Pensions Act, 1995. In the Netherlands,the funds are held by Stitching NIPO Pension funds. In the US,pension assets are now held and managed by Fidelity ManagementTrust Company. Competitive Media Reporting LLC separatelymaintains a Union Pension Plan and sponsored defined benefitplans, the assets of which are held under trust by Wells Fargo Bank.The group also maintains a defined benefit plan in the US closed tonew participants: the former NFO Worldgroup, Inc. Pension Plan, theassets of which are held under trust by KeyBank. Details of pensioncontributions and obligations are provided in note 23 to the financialstatements on page 83.
Financial reporting, internal controls and control environmentIn presenting this report, and having monitored, reviewed or approvedall shareholder communications in 2007 and since, the board isconfident that it has presented a balanced and understandableassessment of the company’s position and prospects.
In accordance with the 2005 Turnbull Guidance on Internal Control,the group has a sound system of internal control based onassessment of risk and a framework of control procedures. Thisincludes a well-established internal audit function responsible forreviewing, reporting and monitoring improvements in internal controlperformance and risk management across its global operations. Thisis achieved by: performing internal audits and making associatedrecommendations, completed at 17 group subsidiaries in 2007;reviewing progress against previous recommendations, completed at7 group subsidiaries in 2007; and an internal control effectivenessquestionnaire, completed by all subsidiaries and operating units in2007. Responsibility for managing day-to-day compliance andresponding to recommendations is delegated to senior managementat the relevant operating units.
The internal audit function has specific procedures, processes andpolicies that have been in place throughout the financial year. Theseinclude an annual review and prioritisation of the key risks facing thebusiness, which is reported to the board. By these means the boardhas reviewed, to its satisfaction, the effectiveness of the group’ssystem of internal controls for the financial year. The board confirmsthat any necessary action has been or is being taken to remedy anysignificant failings or weaknesses identified from the review and thatit accords with the guidance of the 2005 Turnbull Guidance.
The group’s system of internal controls and audit is designed toensure local legal and regulatory compliance and manage, ratherthan eliminate, the risk of failure to achieve business objectives. Itcan therefore only provide reasonable and not absolute assuranceagainst material misstatement or loss.
The group has a widely publicised Code of Conduct, a specificdelegated authorities framework, and a dedicated Ethics hotline.Performance across the group is also closely scrutinised againstbudget and forecasts. These initiatives help establish and promotean improved control environment and working practices. All enquiriesto the helpline were appropriately investigated and reported to theaudit committee.
The head of the internal audit function reports directly to the auditcommittee, the board and senior management, highlightingsignificant findings and key recommendations, and updatingperformance against previous recommendations.
Investor relations (IR) and communicationsThe company has well-established IR procedures and processes,which support a structured programme of communications withexisting and potential investors and analysts. Executive directors and members of the IR team regularly meet or are in contact withexisting and potential institutional investors from around the world,ensuring that group performance and future strategy is effectivelycommunicated, within regulatory constraints. Other representativesof the board and senior management meet with investors from time to time. The IR team provides regular reports to the board onrelated matters, issues of concern to investors, and analyst viewsand opinions.
Whenever required, the executive directors, the Chairman and theSenior Independent Director communicate with the company’sbrokers to confirm shareholder sentiment and to consult ongovernance issues.
During 2007, 24 regulatory announcements were released informing the market of acquisitions, financial results, the results of annual general meetings and board changes. Copies of theseannouncements, together with other IR information and documents,are available on the group website.
The annual general meeting (AGM)The 2007 AGM was held in May. All directors, including Rémy Sautter who joined via video-conferencing link, were present, and made themselves available to answer questions fromshareholders. The AGM provides an opportunity for the directors tocommunicate personally performance and future strategy to non-institutional shareholders and for those shareholders to meet withand question the board. The enclosed circular notice convening the2008 AGM, circulated over 20 days in advance of the meeting as in previous years and including substantially separate resolutions,outlines the business to be considered. All directors again plan to bepresent. All results of proxy votes are read out, made available forreview at the meeting, recorded in the minutes of the meeting andcommunicated to the market and via the group website.
By order of the board
Paul WrightCompany Secretary & Group General Counsel29 February 2008
Directors’ Report – Business Review
Directors’ Report –Governance
Financial Statements
Shareholder Information

TNS Annual Report and Accounts 2007 47
Directors’ responsibility statementThe directors are required by UK company law as adopted by theEuropean Union to prepare financial statements for each financialperiod, which give a true and fair view of the state of affairs of thecompany and the group and of the profit and loss for that period.
The directors consider that, in preparing the accounts, appropriateaccounting policies have been used and applied consistently,supported by reasonable and prudent judgements and estimates,and the accounts have been prepared in accordance withInternational Financial Reporting Standards (IFRS) as adopted by the European Union and on a going concern basis. Applicable UK accounting standards have also been applied for the holdingcompany accounts.
The directors are also responsible for maintaining adequateaccounting records that disclose with reasonable accuracy thefinancial position of the company and the group, which enable them to ensure that the financial statements comply with the UK Companies Act and Article 4 of the International AuditingStandards Regulation.
The directors are responsible for the maintenance and integrity of theinformation included on the group website, www.tnsglobal.com. Thework carried out by the auditors does not involve consideration ofthese matters and, accordingly, the auditors accept no responsibilityfor any changes that may have occurred to the financial statementssince they were initially presented on the website. Legislation in theUK governing the preparation and dissemination of information of thefinancial statements may differ from legislation in other jurisdictions.
The directors have general responsibility for taking such steps as arereasonably open to them to safeguard the assets of the companyand the group and to prevent and detect fraud or other irregularities.The directors, having prepared the financial statements, havepermitted the auditors to take whatever steps and undertakewhatever inspections they consider to be appropriate for thepurpose of enabling them to give their audit opinion.

48 www.tnsglobal.com
Other statutory information
Directors’ Report – Business Review
Directors’ Report –Governance
Financial Statements
Shareholder Information
Principal activities of the groupTaylor Nelson Sofres plc is the holding company of the TNS groupof companies (the group), which comprises various marketinformation and insight businesses. The group operates globally,conducting business in 80 countries.
Business review and future developmentA more detailed review of the markets in which the group operates;the performance of its individual businesses; changes during theyear; the future events and developments potentially impacting onthe group; and the group’s strategy to address these various factorsis included on pages 18 to 39. This review forms part of theDirectors’ Report.
DividendsThe directors recommend a final dividend for 2007 of 3.9 pence per share, which will be paid on 4 July 2008 to shareholders on theregister at the close of business on 23 May 2008. The total dividendfor the year, including the interim dividend of 1.6 pence per sharepaid in December, amounts to 5.5 pence per share (2006: 4.6 pence).Details regarding the waiving of dividends are provided in note 8 tothe financial statements on page 68.
Post balance sheet eventsOn 11 January 2008, the company announced the acquisition ofMediaWatch Limited, a media intelligence business in the Republic ofIreland. On 31 January 2008, the group completed the acquisition ofLatinPanel International Ltd, a continuous consumer panel businessserving Latin America. On 29 February 2008, the group agreedto acquire Compete, Inc., a leading digital intelligence companybased in the United States.
Directors, remuneration and corporate governanceDonald Brydon, David Lowden, Andy Boland, Pedro Ros, Paul Murray, Alice Perkins and Rémy Sautter all served throughoutthe financial year and remain appointed to the board. DrummondHall and Dawn Airey both joined the board as non-executives witheffect from 12 April 2007. Dawn Airey subsequently resigned herposition on 24 May 2007, as a result of her appointment at ITV plc.Biographical details of current directors are shown on pages 40to 41.
In accordance with the articles of association, the board isrecommending the re-election of Donald Brydon, David Lowdenand Paul Murray at the 2008 AGM.
The powers of the directors to allot and re-purchase shares in thecompany, and to fix the auditors’ remuneration will be renewed atthe company’s AGM. Further information is provided in the enclosedcircular notice convening the 2008 AGM. It is proposed to adoptnew articles of association at the 2008 AGM, to bring the company’sconstitution into line with changes in law and practice. The rulesgoverning the appointment and replacement of directors andamendments to the company’s articles of association have notchanged. Details of the changes to the articles of association andan explanation are set out in the accompanying circular notice.
No director had any material interest in any of the company’ssubsidiaries at any time during the year or in any transaction ofsignificance in relation to the group’s business.
There are no significant agreements to which the company is partythat take effect, alter or terminate upon a change of control of thecompany following a takeover bid.
Appropriate Directors and Officers’ Liability insurance has beenmaintained by the company throughout the financial year. Thecompany has also provided indemnities for its directors and theCompany Secretary, which are qualifying third party indemnitiesfor the purposes of s.236 of the 2006 Companies Act.
Further information relating to the board and individual directors isgiven in the directors’ remuneration report on pages 50 to 54, theapproval of which will be proposed as an ordinary resolution at the2008 AGM, and the corporate governance report on pages 44 to 47.The directors’ remuneration report includes details of arrangementswith directors for compensation for loss of office or employment.
Share capitalIn accordance with s.992 Companies Act 2006, the company’sauthorised share capital consists solely of 600,000,000 ordinary 5pshares. The company operates a Level 1 American DepositaryReceipt program. The rights and obligations relating to the ordinaryshare capital are outlined in the articles of association; there are norestrictions on the transfer of securities, no restrictions on votingrights and no securities carry special voting rights with regard tocontrol of the company. As at 27 February 2008, the company has429,874,882 ordinary 5p shares in issue. Details of movements inthe company’s issued share capital during 2007 are shown in note26 to the financial statements on page 90.
Under Article 51 of its current articles of association the companyis empowered to purchase its own shares. In December 2007 thecompany duly completed its market purchase programme, asinitially outlined to shareholders. In 2007, the company purchased28,444,805 ordinary shares (6.6 per cent of the current issued sharecapital) under the programme for an aggregate consideration of£65.2 million, of which 17,663,105 shares (4.1 per cent of the issuedshare capital) were subsequently cancelled, and 50,000 shares (0.01 per cent) were released under an employee share plan. As at31 December 2007, and the date of this report, 17,490,389 ordinaryshares (4.1 per cent) were held in Treasury.
The directors wish to retain sufficient flexibility to make future marketpurchases, following completion of the market purchase programme.They therefore propose that the authority to make purchases of ownshares should remain at 10 per cent of the issued share capital of thecompany. An appropriate special resolution will accordingly beproposed at the 2008 AGM.
As at 27 February 2008, the company has been notified inaccordance with the Transparency Directive of the followingsubstantial interests (3 per cent or more) in its voting rights (per centinterests are at the date of the notification and may not take accountof subsequent activity under the TNS market purchase programme,which was completed on 10 December 2007).

TNS Annual Report and Accounts 2007 49
Shareholder Holding %
Cedar Rock Capital Limited 34,484,273 8.37
Goldman Sachs Group, Inc. 25,269,714 6.14
UBS Global Asset Management 20,836,532 5.06
Fidelity International Limited 20,836,780 5.05
Legal & General Group 18,205,485 4.42
Insight Investment Management 17,925,387 4.041
FMR Corp. 7,553,800 1.762
1 The company is aware that this interest may have since reduced below 3 per cent, but has not been informed.
2 The interests of Fidelity International Limited and FMR Corp. wereaggregated prior to implementation of the Transparency Directive.
The company is not aware of any agreements between holders ofsecurities that may result in restrictions on the transfer of securitiesor on voting rights.
The interests of directors, their families and any connected personsin the share capital of the company, and group option and awardschemes, are outlined in the remuneration report on pages 50 to 54.There were no changes in these interests between 31 December2007 and 29 February 2008.
Auditor, audit information and going concernPricewaterhouseCoopers LLP, having indicated their willingness tocontinue to act, will accordingly be proposed for re-appointment atthe 2008 AGM, along with a resolution authorising the directors todetermine their remuneration.
The directors each confirm, so far as they are aware, that there isno relevant audit information of which the auditors are unaware; andthat each director has taken all reasonable steps to makethemselves aware of any relevant audit information, and to establishthat the auditors were aware of that information.
As a result of their monitoring of the business through the financialyear, and making appropriate enquiries, the directors have areasonable expectation that the group and company has satisfactoryresources to continue to operate for the foreseeable future. Thefinancial statements included in this report have accordingly beenprepared on a going concern basis.
Annual general meeting (AGM)The 2008 AGM will be held on 7 May 2008 at midday at thecompany’s registered office address. Further information is providedin the notice convening the 2008 AGM, which is enclosed with thisreport as a separate circular.
The above reports, information and statements together constitutethe annual report of the directors of Taylor Nelson Sofres plc for theyear ended 31 December 2007. The report will be put before theshareholders of the company at the 2008 AGM for approval. Theshareholders have the power to require amendments after boardapproval and issue.
By order of the board
Paul WrightCompany Secretary & Group General CounselTaylor Nelson Sofres plc (registered in England and Wales with number 912624)29 February 2008
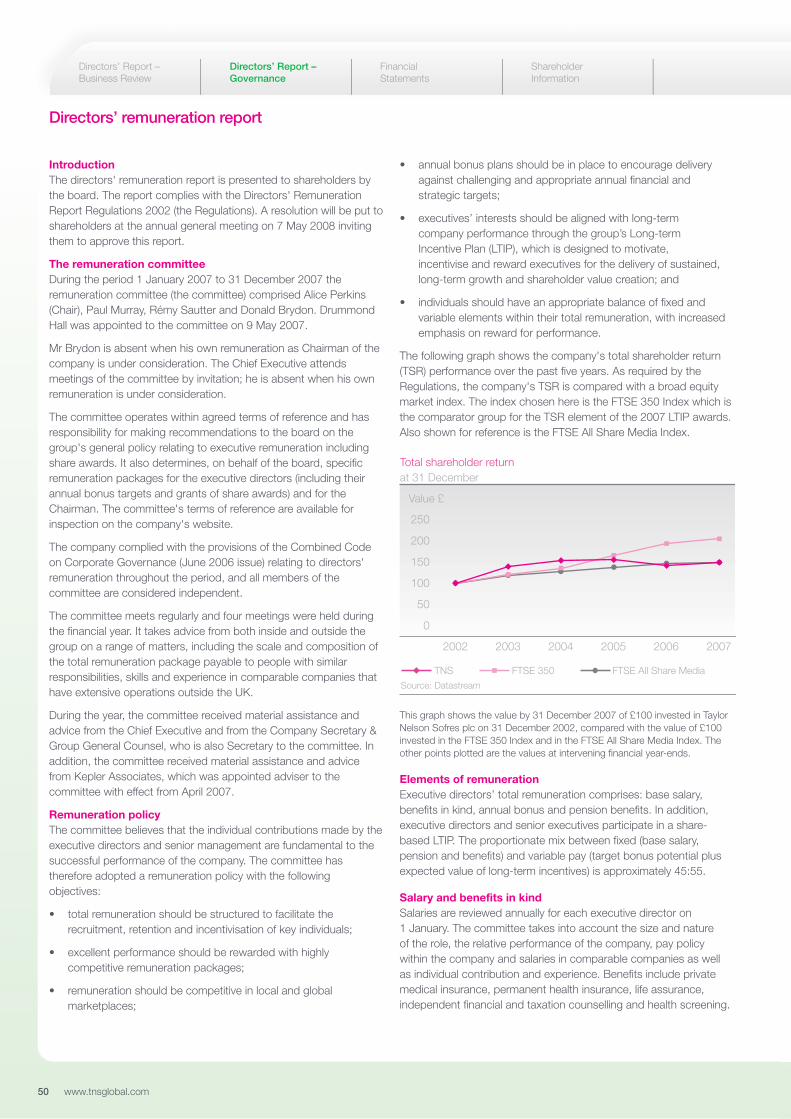
50 www.tnsglobal.com
Directors’ remuneration report
Directors’ Report – Business Review
Directors’ Report –Governance
Financial Statements
Shareholder Information
IntroductionThe directors' remuneration report is presented to shareholders bythe board. The report complies with the Directors' RemunerationReport Regulations 2002 (the Regulations). A resolution will be put toshareholders at the annual general meeting on 7 May 2008 invitingthem to approve this report.
The remuneration committeeDuring the period 1 January 2007 to 31 December 2007 theremuneration committee (the committee) comprised Alice Perkins(Chair), Paul Murray, Rémy Sautter and Donald Brydon. DrummondHall was appointed to the committee on 9 May 2007.
Mr Brydon is absent when his own remuneration as Chairman of thecompany is under consideration. The Chief Executive attendsmeetings of the committee by invitation; he is absent when his ownremuneration is under consideration.
The committee operates within agreed terms of reference and hasresponsibility for making recommendations to the board on thegroup's general policy relating to executive remuneration includingshare awards. It also determines, on behalf of the board, specificremuneration packages for the executive directors (including theirannual bonus targets and grants of share awards) and for theChairman. The committee's terms of reference are available forinspection on the company's website.
The company complied with the provisions of the Combined Codeon Corporate Governance (June 2006 issue) relating to directors'remuneration throughout the period, and all members of thecommittee are considered independent.
The committee meets regularly and four meetings were held duringthe financial year. It takes advice from both inside and outside thegroup on a range of matters, including the scale and composition ofthe total remuneration package payable to people with similarresponsibilities, skills and experience in comparable companies thathave extensive operations outside the UK.
During the year, the committee received material assistance andadvice from the Chief Executive and from the Company Secretary &Group General Counsel, who is also Secretary to the committee. Inaddition, the committee received material assistance and advicefrom Kepler Associates, which was appointed adviser to thecommittee with effect from April 2007.
Remuneration policyThe committee believes that the individual contributions made by theexecutive directors and senior management are fundamental to thesuccessful performance of the company. The committee hastherefore adopted a remuneration policy with the followingobjectives:
• total remuneration should be structured to facilitate therecruitment, retention and incentivisation of key individuals;
• excellent performance should be rewarded with highlycompetitive remuneration packages;
• remuneration should be competitive in local and globalmarketplaces;
• annual bonus plans should be in place to encourage deliveryagainst challenging and appropriate annual financial andstrategic targets;
• executives’ interests should be aligned with long-term company performance through the group’s Long-term Incentive Plan (LTIP), which is designed to motivate, incentivise and reward executives for the delivery of sustained,long-term growth and shareholder value creation; and
• individuals should have an appropriate balance of fixed andvariable elements within their total remuneration, with increasedemphasis on reward for performance.
The following graph shows the company's total shareholder return(TSR) performance over the past five years. As required by theRegulations, the company's TSR is compared with a broad equitymarket index. The index chosen here is the FTSE 350 Index which isthe comparator group for the TSR element of the 2007 LTIP awards.Also shown for reference is the FTSE All Share Media Index.
This graph shows the value by 31 December 2007 of £100 invested in TaylorNelson Sofres plc on 31 December 2002, compared with the value of £100invested in the FTSE 350 Index and in the FTSE All Share Media Index. Theother points plotted are the values at intervening financial year-ends.
Elements of remunerationExecutive directors’ total remuneration comprises: base salary,benefits in kind, annual bonus and pension benefits. In addition,executive directors and senior executives participate in a share-based LTIP. The proportionate mix between fixed (base salary,pension and benefits) and variable pay (target bonus potential plusexpected value of long-term incentives) is approximately 45:55.
Salary and benefits in kindSalaries are reviewed annually for each executive director on 1 January. The committee takes into account the size and nature of the role, the relative performance of the company, pay policywithin the company and salaries in comparable companies as well as individual contribution and experience. Benefits include privatemedical insurance, permanent health insurance, life assurance,independent financial and taxation counselling and health screening.
0
50
100
150
200
250
Value £
Total shareholder returnat 31 December
2002
TNS FTSE 350 FTSE All Share Media
2003 2004 2005 2006 2007
Source: Datastream
TNS Annual Report and Accounts 2007 51
Annual bonusExecutive directors are eligible to participate in an annual bonus planbased on a combination of corporate financial goals and individualachievements. The maximum level of bonus that could have beenawarded for the financial year 2007 was 100 per cent of base salaryfor David Lowden, Pedro Ros and Andy Boland.
In 2007, bonuses for the main board were based 80 per cent onfinancial performance measures, comprising revenue, operatingprofit and cash flow, with the remaining 20 per cent being based onpersonal objectives. In 2007, a bonus multiplier of up to 120 per centwas introduced, although payments remained subject to the overalllimit of 100 per cent of base pay. The level of the multiplier wassubject to the achievement of additional strategic objectives.This multiplier was part of the transition to a new bonus structuredescribed later in this report.
PensionsExecutive directors are all members of an independently manageddefined contribution pension plan. Company pension contributionsfor directors were reviewed in 2006 and were increased with effectfrom 1 January 2007.
Executives may choose to sacrifice salary and bonus in return foradditional company contributions to their pension fund, or to taketaxable cash in lieu of company pension contributions at neutral costto the company.
Directors’ annual bonus payments and any gains made under shareoption plans are not pensionable.
Equity-based incentive plansThe company operates a range of share-based incentive plans forexecutive directors, senior management and other employees. In2007, the committee approved the use of approximately 4.9 millionshares across all equity plans.
2005 Long-term Incentive Plan (LTIP)Executive directors and selected employees of the company areeligible to participate in the LTIP at the discretion of the committee.The LTIP enables annual conditional awards of shares (or nil costoptions) to be made up to an annual limit of 200 per cent of annualbase salary in any financial year. Following the 2007 review ofremuneration arrangements, and after consultation with majorshareholders, the performance criteria for 2007 awards wereamended to the following.
Vesting of awards for executive directors is based 25 per cent on theachievement of total shareholder return, relative to the FTSE 350Index, and 75 per cent on average compounded earnings per share(EPS) growth1. This growth must be over and above the rate ofgrowth of the UK Retail Price Index (RPI) over a period of three years.
For 2007 grants, full vesting of the TSR related element of the awardwill be achieved if the company's TSR exceeds that of the FTSE 350Index by at least 10 per cent per annum; 25 per cent of the awardvests if the company's TSR equals that of the index. Awards will veston a straight-line pro rata basis between these points. The remainder
of the award will be subject to compounded average EPS growthtarget. Full vesting will occur if the EPS growth above RPI is 16 percent per annum and 25 per cent vesting will occur if EPS growthabove RPI is four per cent per annum. Vesting will be on a straight-line basis between these points.
The committee considers the use of two measures, in theseproportions, to be appropriate. The TSR performance measure isdependent on the company’s relative long-term share priceperformance and so provides a strong alignment with shareholders’interests. This is used in conjunction with EPS growth, which is theprimary internal benchmark of financial performance and ties in withthe company’s strategic goals.
2001 Executive Share Option Plan (ESP)The LTIP is now used in preference to the 2001 ESP. However, inexceptional circumstances, flexibility exists to permit grants of HerMajesty’s Revenue and Customs (HMRC) approved share optionsto UK-based executives under this Plan. In 2007 no awards were made.
Key Employee Equity Plan (KEEP)KEEP allows the group to make share awards each year, primarilyfor retention purposes, to a small number of specifically targetedparticipants (excluding executive directors). It requires a personalinvestment in TNS shares, with participants potentially receiving amatching award share for each one deposited after three years,subject to continued employment. The maximum level ofparticipation is around £25,000.
Worldwide Employee Sharesave Plan (WESP) Since 1999, the group has also operated a HMRC approvedSharesave plan which is replicated and operated internationally(WESP). Employees can save from salary, up to a maximum of£250 per month, over a fixed period of time (minimum three years).Savings can then be used to purchase shares at a fixed price,which may be at a discount to the market value.
2008 amendments to reward programme In order to sharpen the link between performance and reward, andfollowing a consultation exercise with major shareholders andshareholder bodies, the committee has approved a number ofamendments to the reward programme. From 1 January 2008, theannual bonus structure will change, with focus on greater leverageof awards against personal and business performance. As thisprogramme is phased in over the next two years, it will eventuallyincrease the overall maximum opportunity for executive directors to150 per cent of salary, with directors required to defer half of anybonus earned above target into shares. Target is currently set at50 per cent of salary. Shares deferred would vest after two years,subject to continued employment.
Changes to the KEEP from 1 January 2008 will enable a small groupof selected employees to receive a straight grant of restricted shares,vesting 50 per cent after two years and 50 per cent after three years.
None of the above planned changes will adversely affect dilution limits.
1 Adjusted EPS as discussed in the company’s report and accounts beforeIFRS 2 charges but on a fully diluted basis.

52 www.tnsglobal.com
Directors’ remuneration report
Directors’ Report – Business Review
Directors’ Report –Governance
Financial Statements
Shareholder Information
Dilution under employee share plansThe LTIP and other employees share plans incorporate variousdilution limits, which restrict the issuance of new shares. One limitrestricts dilution to 14 per cent of the issued share capital over any10 year period. In relation to this limit, by 31 December 2007, 10.21 per cent of issued share capital has been utilised. In relationto another limit, which restricts dilution to 10 per cent of issued sharecapital from June 2002, 8.01 per cent has been utilised. In relationto the third limit, restricting dilution to 1.5 per cent of issued sharecapital in any one year, 1.12 per cent has been utilised. By 2010, thegroup expects to be able to operate within a dilution limit of ‘10 percent in 10 years’ in accordance with institutional investor guidelines.
Directors’ interests in the company’s shares
31 Dec 2007
Beneficial Non-beneficial
Executive directors
Andy Boland 20,000 –
David Lowden 319,402 –
Pedro Ros 37,493 –
Non-executive directors
Donald Brydon 30,000 –
Drummond Hall 1 5,000 –
Paul Murray 14,749 –
Alice Perkins 2,000 –
Rémy Sautter 10,000 –
1 Drummond Hall joined the board on 12 April 2007.
There have been no changes in the beneficial and non-beneficialinterests of these directors between 31 December 2007 and thedate of this report.
Share ownership guidelinesExecutive directors are bound by shareholding guidelines under therules of the LTIP. The Chief Executive is expected to retain ashareholding of one and a half times base salary in TNS shares andthe other executive directors are expected to build a shareholdingof one times base salary from exercises under the LTIP. Executivesmust retain at least 50 per cent of the after tax value of sharesdelivered through the company’s LTIP until they have achievedthe appropriate share ownership level.
Service contractsDirectors’ service contracts reflect current practice and the specificcircumstances of the group. In the event of termination, allcontractual obligations would be honoured by the company, subjectto mitigation. If any of the contracts were to be terminated withoutgiving proper notice, damages for breach of contract wouldcomprise salary and any other benefits such as pension contribution,health and life assurance, but these would be subject to mitigationby the director. Andy Boland is entitled to receive a paymentequivalent to 110 per cent of his base salary at the time, in the eventhis contract is terminated without giving proper notice. If any of thedirectors’ contracts were to be terminated with proper notice beinggiven, no damages would be paid. There are no contractual earlytermination liabilities for any of the directors.
Original contract or
appointment Election or Rolling notice date re-election date period
Chairman
Donald Brydon Jan 2006 May 2008 6 months
Executive directors
Andy Boland Jan 2004 May 2007 12 months
David Lowden Dec 1998 May 2008 12 months
Pedro Ros Jan 2006 May 2009 12 months
Non-executive directors
Drummond Hall Apr 2007 May 2007 n/a
Paul Murray May 2005 May 2008 n/a
Alice Perkins Mar 2005 May 2007 n/a
Rémy Sautter Nov 2002 May 2007 n/a
Chairman and non-executive directorsThe fees of the non-executive directors are a matter reserved for theexecutive directors. The non-executive directors do not participate inthe company’s pension, annual bonus or equity plans and their feesare paid entirely in cash. Fee levels for non-executive directors wereincreased with effect from 1 January 2007, to bring them in line withmarket practice and to continue to reflect the time commitments ofthe role in line with the requirements of the Combined Code.
Gains made by directors on share optionsNo share options were exercised by directors during 2007.

TNS Annual Report and Accounts 2007 53
Directors’ interests in shares and share options
MarketOption price on
Plan 1 Jan 2007 Granted Lapsed 31 Dec 2007 price grant Exercise period
Andy Boland ESOP 15,037 15,037 199.50p 195.50p 31 Mar 2007 – 30 Mar 2014
ESOP 184,963 184,963 199.50p 195.50p 31 Mar 2007 – 30 Mar 2011
2005 LTIP 261,000 261,000 Nil 201.75p 14 Oct 2008 – 14 Oct 2015
2006 LTIP 265,000 265,000 Nil 211.25p 9 Oct 2009 – 9 Oct 2016
2006 LTIP 150,000 150,000 Nil 211.25p 9 Oct 2009 – 9 Oct 2016
2007 LTIP 287,703 287,703 Nil 215.50p 15 Oct 2010 – 15 Oct 2017
WESP 4,503 4,503 214.50p 261.00p 1 July 2011 – 31 Dec 2011
David Lowden ESOP 15,000 15,000 184.00p 177.00p 31 Jul 2005 – 31 Jul 2012
ESOP 185,000 185,000 184.00p 177.00p 31 Jul 2005 – 31 Jul 2009
ESOP 150,000 150,000 102.00p 102.00p 4 Apr 2006 – 3 Apr 2010
ESOP 150,000 150,000 203.50p 205.00p 30 Jun 2004 – 30 Jun 2008
ESOP 200,000 200,000 223.75p 222.00p 28 Sep 2007 – 27 Sep 2011
1993 LTIP1 180,000 180,000 Nil 195.50p 31 Mar 2009 – 30 Mar 2011
2005 LTIP 351,000 351,000 Nil 201.75p 14 Oct 2008 – 14 Oct 2015
2006 LTIP 376,000 376,000 Nil 211.25p 9 Oct 2009 – 9 Oct 2016
2007 LTIP 386,079 386,079 Nil 215.50p 15 Oct 2010 – 15 Oct 2017
WESP 5,981 5,981 164.00p 198.00p 1 Jul 2009 – 31 Dec 2009
Pedro Ros ESOS2 80,000 20,000 60,000 218.00p 218.00p 23 Apr 2004 – 22 Apr 2008
ESOP 80,000 80,000 195.00p 201.00p 30 June 2005 – 29 Jun 2009
ESOP 80,000 80,000 102.00p 102.00p 4 Apr 2006 – 3 Apr 2010
ESOP 80,000 80,000 223.75p 222.00p 28 Sep 2007 – 27 Sep 2011
2005 LTIP 125,000 125,000 Nil 207.75p 14 Oct 2008 – 14 Oct 2015
2006 LTIP 120,689 120,689 Nil 256.50p 11 Apr 2009 – 11 Apr 2016
2006 LTIP 148,000 148,000 Nil 211.25p 9 Oct 2009 – 9 Oct 2016
2007 LTIP 304,037 304,037 Nil 215.50p 15 Oct 2010 – 15 Oct 2017
EPP 28,846 28,846 Nil 197.50p 14 Apr 2007 – 13 Apr 2014
Totals 3,236,019 977,819 20,000 4,193,838
1 David Lowden was given a one-off award to reflect promotion to the role of Chief Operating Officer. The award is subject to the EPS performancecondition described below, except that performance will be measured over a five-year period. No re-tests are permissible.
2 The ESOS options granted to Pedro Ros on 23 April 2001 remain partially exercisable, to reflect performance against the associated regionalperformance criteria.
• Options granted under the LTIP are subject to the same performance conditions as described under the heading 2005 Long-term Incentive Plan.
• Options granted under the ESOP are subject to the following performance conditions: for 50 per cent of the award to vest, the real compound growth of thegroup’s adjusted EPS before goodwill charges, over three consecutive financial years must exceed at least 4 per cent. The options are only exercisable in fullif the rate so calculated is 8 per cent. Should the exercise conditions not be met for grants prior to September 2004, re-testing may occur annually for up totwo years from the original fixed base year. Only one re-test is permissible for September 2004 awards.
• Options granted under the 1993 LTIP are subject to the following performance conditions: for 2000 and 2001 the real compound annual growth of thegroup’s adjusted EPS before goodwill charges, over three consecutive financial years, must exceed at least 6 per cent. In most cases, the options are onlyexercisable in full if the rate so calculated is 12 per cent. Should the exercise conditions not be met, re-testing may occur on a rolling three-year basisthroughout the life of the plan.
• The middle market quotation for the ordinary shares was 207.5p on 31 December 2007 and the range during the year was 191.0p to 267.5p.

54 www.tnsglobal.com
Directors’ remuneration report
Directors’ Report – Business Review
Directors’ Report –Governance
Financial Statements
Shareholder Information
Directors’ emoluments
Total Pension contributions
Salary Bonus Benefits Fees 2007 2006 2007 2006£000 £000 £000 £000 £000 £000 £000 £000
Executive directors
Andy Boland 310 288 5 – 603 360 37 32
David Lowden 416 416 21 – 853 472 75 60
Pedro Ros1 329 328 37 – 693 375 39 38
Non-executive directors
Dawn Airey2 – – – 6 6 – – –
Donald Brydon – – – 172 172 160 – –
Drummond Hall3 – – – 34 34 – – –
Paul Murray – – – 50 50 49 – –
Alice Perkins – – – 49 49 45 – –
Rémy Sautter4 – – – 43 43 44 – –
1,055 1,032 64 354 2,504 1,505 152 130
Pierre Weill resigned from the board on 12 June 2001. Under the terms of his contract he remains entitled to receive benefits of £107,000 per year.
Tony Cowling resigned from the board on 12 January 2006. He remains President of TNS, a non-board position. For this he received £55,000 in salary andbenefits during 2007.1 The company bears the expense of Pedro Ros’ accommodation in London and company car, this is included under Benefits. 2 Dawn Airey joined the board on 12 April 2007 and stepped down from board on 24 May 2007.3 Drummond Hall joined the board on 12 April 2007 and joined the audit committee on 1 August 2007.4 Rémy Sautter stepped down as Chairman of the nomination committee on 28 February 2007 and was replaced by Donald Brydon.
Auditable partThe following form the auditable part of this report: the directors’ emoluments table and accompanying notes, the directors’ interests in thecompany’s shares table and the directors’ interests in shares and share options table, along with the gains made by directors on share options.
By order of the board
Paul WrightCompany Secretary & Group General Counsel29 February 2008

TNS Annual Report and Accounts 2007 55
Independent auditors’ report to the members of Taylor Nelson Sofres plc
We have audited the group and parent company financialstatements (the ‘financial statements’) of Taylor Nelson Sofres plcfor the year ended 31 December 2007 which comprise theConsolidated Income Statement, the Consolidated and ParentCompany Balance Sheets, the Consolidated and Parent CompanyCash Flow Statements, the Consolidated and Parent CompanyStatements of Recognised Income and Expense and the relatednotes. These financial statements have been prepared underthe accounting policies set out therein. We have also auditedthe information in the Directors’ Remuneration Report that isdescribed as having been audited.
Respective responsibilities of directors and auditorsThe directors’ responsibilities for preparing the Annual Report, theDirectors’ Remuneration Report and the financial statements inaccordance with applicable law and International Financial ReportingStandards (IFRSs) as adopted by the European Union are set outin the Statement of Directors’ Responsibilities.
Our responsibility is to audit the financial statements and thepart of the Directors’ Remuneration Report to be audited inaccordance with relevant legal and regulatory requirements andInternational Standards on Auditing (UK and Ireland). This report,including the opinion, has been prepared for and only for thecompany’s members as a body in accordance with Section 235 ofthe Companies Act 1985 and for no other purpose. We do not, ingiving this opinion, accept or assume responsibility for any otherpurpose or to any other person to whom this report is shown orinto whose hands it may come save where expressly agreed byour prior consent in writing.
We report to you our opinion as to whether the financial statementsgive a true and fair view and whether the financial statements andthe part of the Directors’ Remuneration Report to be audited havebeen properly prepared in accordance with the Companies Act 1985and, as regards the group financial statements, Article 4 of the IASRegulation. We also report to you whether in our opinion theinformation given in the Other Statutory Information section isconsistent with the financial statements.
In addition we report to you if, in our opinion, the company has notkept proper accounting records, if we have not received all theinformation and explanations we require for our audit, or ifinformation specified by law regarding directors’ remuneration andother transactions is not disclosed.
We review whether the Corporate Governance Statementreflects the company’s compliance with the nine provisions ofthe Combined Code 2006 specified for our review by the ListingRules of the Financial Services Authority, and we report if it does not.We are not required to consider whether the board’s statements oninternal control cover all risks and controls, or form an opinion on theeffectiveness of the group’s corporate governance procedures or itsrisk and control procedures.
We read other information contained in the Annual Reportand consider whether it is consistent with the audited financialstatements. The other information comprises only: Understandingthe big issues; the Directors’ Report – Business Review; theDirectors’ Report – Governance and Shareholder Information.
We consider the implications for our report if we become awareof any apparent misstatements or material inconsistencies withthe financial statements. Our responsibilities do not extend toany other information.
Basis of audit opinionWe conducted our audit in accordance with International Standardson Auditing (UK and Ireland) issued by the Auditing Practices Board.An audit includes examination, on a test basis, of evidence relevantto the amounts and disclosures in the financial statements and thepart of the Directors’ Remuneration Report to be audited. It alsoincludes an assessment of the significant estimates and judgmentsmade by the directors in the preparation of the financial statements,and of whether the accounting policies are appropriate to thegroup’s and company’s circumstances, consistently applied andadequately disclosed.
We planned and performed our audit so as to obtain all theinformation and explanations which we considered necessaryin order to provide us with sufficient evidence to give reasonableassurance that the financial statements and the part of theDirectors’ Remuneration Report to be audited are free from materialmisstatement, whether caused by fraud or other irregularity or error.In forming our opinion we also evaluated the overall adequacy of thepresentation of information in the financial statements and the partof the Directors’ Remuneration Report to be audited.
OpinionIn our opinion:• the group financial statements give a true and fair view, inaccordance with IFRSs as adopted by the European Union,of the state of the group’s affairs as at 31 December 2007and of its profit and cash flows for the year then ended;
• the parent company financial statements give a true and fair view,in accordance with IFRSs as adopted by the European Union asapplied in accordance with the provisions of the Companies Act1985, of the state of the parent company’s affairs as at31 December 2007 and cash flows for the year then ended;
• the financial statements and the part of the Directors’Remuneration Report to be audited have been properlyprepared in accordance with the Companies Act 1985 and,as regards the group financial statements, Article 4 of theIAS Regulation; and
• the information given in the Other Statutory Informationsection is consistent with the financial statements.
PricewaterhouseCoopers LLPChartered Accountants and Registered AuditorsLondon29 February 2008
Notes:• The maintenance and integrity of the Taylor Nelson Sofres plc website isthe responsibility of the directors; the work carried out by the auditors doesnot involve consideration of these matters and, accordingly, the auditorsaccept no responsibility for any changes that may have occurred to thefinancial statements since they were initially presented on the website.
• Legislation in the United Kingdom governing the preparation anddissemination of financial statements may differ from legislation inother jurisdictions.
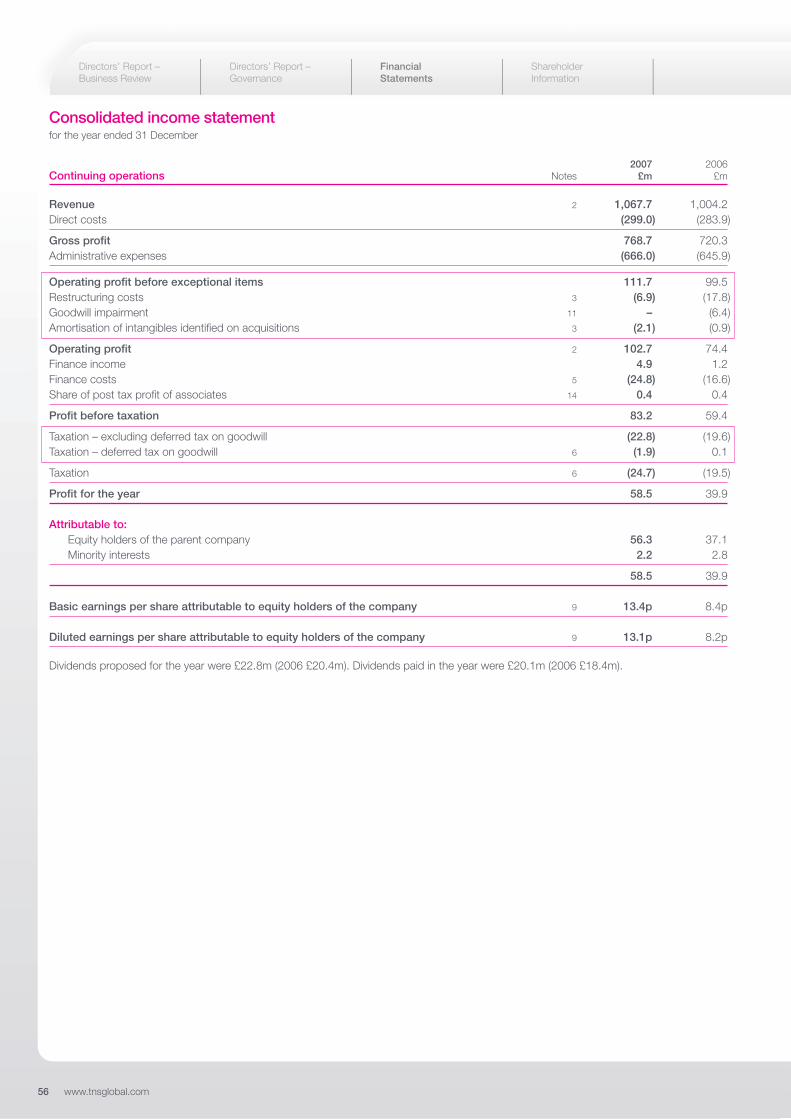
56 www.tnsglobal.com
Consolidated income statementfor the year ended 31 December
2007 2006Continuing operations Notes £m £m
Revenue 2 1,067.7 1,004.2 Direct costs (299.0) (283.9)
Gross profit 768.7 720.3 Administrative expenses (666.0) (645.9)
Operating profit before exceptional items 111.7 99.5 Restructuring costs 3 (6.9) (17.8)Goodwill impairment 11 – (6.4)Amortisation of intangibles identified on acquisitions 3 (2.1) (0.9)
Operating profit 2 102.7 74.4 Finance income 4.9 1.2 Finance costs 5 (24.8) (16.6)Share of post tax profit of associates 14 0.4 0.4
Profit before taxation 83.2 59.4
Taxation – excluding deferred tax on goodwill (22.8) (19.6)Taxation – deferred tax on goodwill 6 (1.9) 0.1
Taxation 6 (24.7) (19.5)
Profit for the year 58.5 39.9
Attributable to:Equity holders of the parent company 56.3 37.1 Minority interests 2.2 2.8
58.5 39.9
Basic earnings per share attributable to equity holders of the company 9 13.4p 8.4p
Diluted earnings per share attributable to equity holders of the company 9 13.1p 8.2p
Dividends proposed for the year were £22.8m (2006 £20.4m). Dividends paid in the year were £20.1m (2006 £18.4m).
Directors’ Report – Business Review
Directors’ Report –Governance
Financial Statements
Shareholder Information

TNS Annual Report and Accounts 2007 57
Balance sheetsat 31 December
Group Company
2007 2006 2007 2006Notes £m £m £m £m
AssetsNon-current assetsGoodwill 11 437.1 378.1 – –Intangible assets 12 22.2 16.2 – –Property, plant and equipment 13 82.7 68.8 – –Investments in associates 14 4.5 2.9 – –Investment in subsidiaries 14 – – 529.7 525.8 Other financial assets 15 10.6 0.4 – –Deferred tax assets 6 38.6 32.4 – –
Total non-current assets 595.7 498.8 529.7 525.8
Current assetsInventories 16 55.5 48.8 – –Trade and other receivables 17 291.5 256.2 41.1 25.1 Current tax receivable 6 4.6 3.7 – 0.2 Other financial assets 15 0.6 0.3 – –Cash and cash equivalents 18 90.2 61.8 15.4 2.5
Total current assets 442.4 370.8 56.5 27.8
Total assets 1,038.1 869.6 586.2 553.6
LiabilitiesCurrent liabilitiesBorrowings 19 (51.2) (23.3) – (2.6)Trade and other payables 20 (338.1) (293.3) (43.1) (48.6)Current tax payable 6 (33.2) (32.2) (0.1) (0.5)Provisions 21 (15.7) (16.8) – –
Total current liabilities (438.2) (365.6) (43.2) (51.7)
Net current assets/(liabilities) 4.2 5.2 13.3 (23.9)
Non-current liabilitiesBorrowings 19 (400.9) (316.9) – –Trade and other payables 20 (9.2) (1.9) (335.7) (328.9)Deferred tax liabilities 6 (32.7) (25.7) – –Retirement benefit obligations 23 (15.7) (12.9) – –Provisions 21 (26.3) (19.5) – –
Total non-current liabilities (484.8) (376.9) (335.7) (328.9)
Total liabilities (923.0) (742.5) (378.9) (380.6)
Total net assets 115.1 127.1 207.3 173.0
EquityIssued share capital 26 21.5 22.1 21.5 22.1 Share premium 27 141.5 134.2 141.5 134.2 Other reserves 27 1.3 0.4 2.9 2.1 Retained earnings 27 (57.0) (37.8) 41.4 14.6
Total parent shareholders’ equity (107.3) 118.9 207.3 173.0 Minority interests in equity 27 7.8 8.2 – –
Total equity 115.1 127.1 207.3 173.0
The financial statements on pages 56 to 94 were approved by the board on 29 February 2008 and were signed on its behalf by
Andy BolandFinance Director
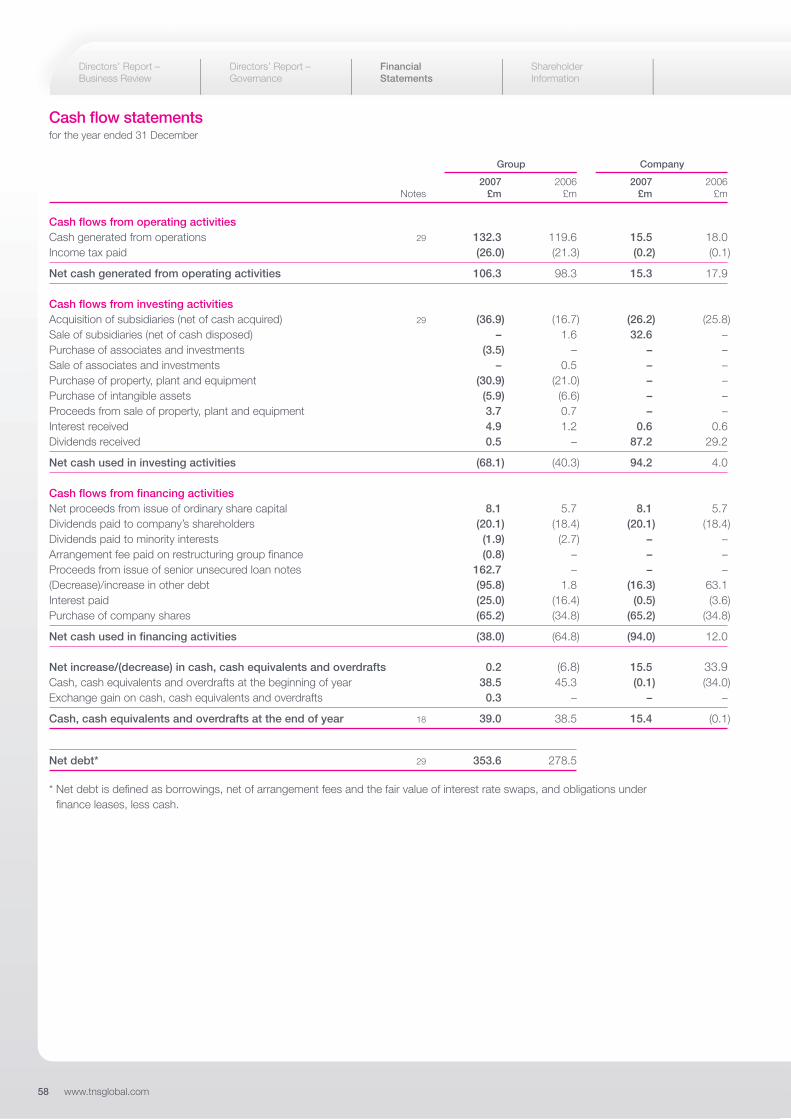
58 www.tnsglobal.com
Cash flow statementsfor the year ended 31 December
Directors’ Report – Business Review
Directors’ Report –Governance
Financial Statements
Shareholder Information
Group Company
2007 2006 2007 2006Notes £m £m £m £m
Cash flows from operating activities Cash generated from operations 29 132.3 119.6 15.5 18.0 Income tax paid (26.0) (21.3) (0.2) (0.1)
Net cash generated from operating activities 106.3 98.3 15.3 17.9
Cash flows from investing activitiesAcquisition of subsidiaries (net of cash acquired) 29 (36.9) (16.7) (26.2) (25.8)Sale of subsidiaries (net of cash disposed) – 1.6 32.6 –Purchase of associates and investments (3.5) – – –Sale of associates and investments – 0.5 – –Purchase of property, plant and equipment (30.9) (21.0) – –Purchase of intangible assets (5.9) (6.6) – –Proceeds from sale of property, plant and equipment 3.7 0.7 – –Interest received 4.9 1.2 0.6 0.6 Dividends received 0.5 – 87.2 29.2
Net cash used in investing activities (68.1) (40.3) 94.2 4.0
Cash flows from financing activitiesNet proceeds from issue of ordinary share capital 8.1 5.7 8.1 5.7 Dividends paid to company’s shareholders (20.1) (18.4) (20.1) (18.4)Dividends paid to minority interests (1.9) (2.7) – –Arrangement fee paid on restructuring group finance (0.8) – – –Proceeds from issue of senior unsecured loan notes 162.7 – – –(Decrease)/increase in other debt (95.8) 1.8 (16.3) 63.1 Interest paid (25.0) (16.4) (0.5) (3.6)Purchase of company shares (65.2) (34.8) (65.2) (34.8)
Net cash used in financing activities (38.0) (64.8) (94.0) 12.0
Net increase/(decrease) in cash, cash equivalents and overdrafts 0.2 (6.8) 15.5 33.9 Cash, cash equivalents and overdrafts at the beginning of year 38.5 45.3 (0.1) (34.0)Exchange gain on cash, cash equivalents and overdrafts 0.3 – – –
Cash, cash equivalents and overdrafts at the end of year 18 39.0 38.5 15.4 (0.1)
Net debt* 29 353.6 278.5
* Net debt is defined as borrowings, net of arrangement fees and the fair value of interest rate swaps, and obligations underfinance leases, less cash.
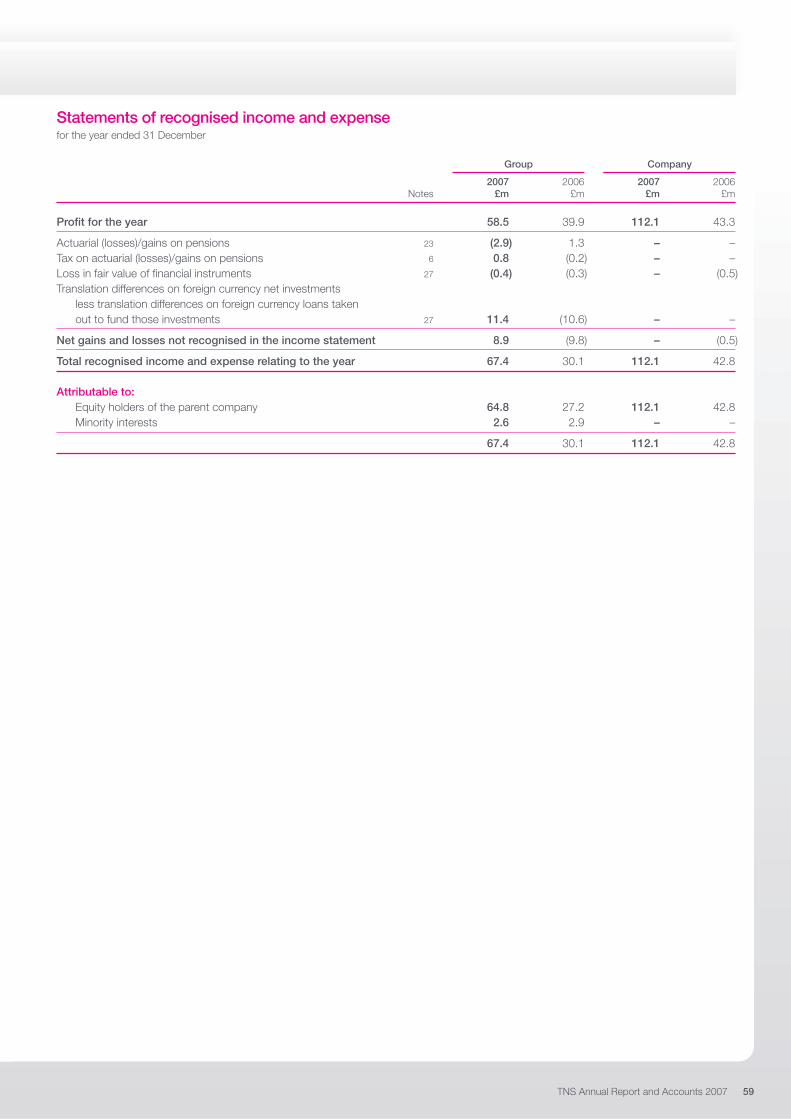
TNS Annual Report and Accounts 2007 59
Group Company
2007 2006 2007 2006Notes £m £m £m £m
Profit for the year 58.5 39.9 112.1 43.3
Actuarial (losses)/gains on pensions 23 (2.9) 1.3 – –Tax on actuarial (losses)/gains on pensions 6 0.8 (0.2) – –Loss in fair value of financial instruments 27 (0.4) (0.3) – (0.5)Translation differences on foreign currency net investments
less translation differences on foreign currency loans taken out to fund those investments 27 11.4 (10.6) – –
Net gains and losses not recognised in the income statement 8.9 (9.8) – (0.5)
Total recognised income and expense relating to the year 67.4 30.1 112.1 42.8
Attributable to:Equity holders of the parent company 64.8 27.2 112.1 42.8 Minority interests 2.6 2.9 – –
67.4 30.1 112.1 42.8
Statements of recognised income and expensefor the year ended 31 December

60 www.tnsglobal.com
Notes to the financial statements
Directors’ Report – Business Review
Directors’ Report –Governance
Financial Statements
Shareholder Information
1 Accounting policies
Basis of preparationThese financial statements have been prepared in accordance withInternational Financial Reporting Standards (IFRS) and InternationalFinancial Reporting Interpretations Committee (IFRIC) interpretationsendorsed by the European Union (EU) and with those parts of theCompanies Act 1985 applicable to companies reporting under IFRS.The financial statements have been prepared under the historicalcost convention as modified by the revaluation of available for saleinvestments, financial assets and liabilities held for trading.
Changes in accounting policyThe principal accounting policies adopted in the preparation ofthese financial statements and set out below have beenconsistently applied to all years presented.
IFRS 7 ‘Financial Instruments: Presentation and Disclosure’,which introduces new disclosure requirements relating to financialinstruments, became effective in 2007 and has been appliedfor the first time in these financial statements.
The following standards, amendments and interpretations,which also became effective in 2007, have been applied buthave no significant effect on amounts recognised or disclosed.
• IFRIC 8 – Scope of IFRS 2 (Share based payments)• IFRIC 9 – Re-assessment of embedded derivatives• IFRIC 10 – Interim Financial Reporting and Impairment
During 2007, IFRS 3 (Revised) ‘Business Combinations’ waspublished, which modifies certain acquisition accounting principles.The revised standard is not effective for the group until the yearcommencing 1 January 2010 and will not alter amounts previouslyrecognised when implemented. The following amendments andinterpretations that were also published in 2007 or earlier but arenot effective until later years, are not expected to have any significantimpacts on the financial statements when implemented, and havenot been early adopted by the group.
• IAS 23 (Revised) – Borrowing Costs (not yet endorsed by the EU)• IFRS 8 – Operating Segments• IFRIC 11 – IFRS 2 – Group and Treasury Share Transactions• IFRIC 12 – Service concession arrangements• IFRIC 13 – Customer loyalty programmes• IFRIC 14 – IAS 19 – The limit on a defined benefit asset,
minimum funding requirements and their interaction
No other amendments and interpretations becoming effective in the yearor published since 1 January 2007 are relevant to the group’s operations.
Significant estimates and assumptionsThe preparation of financial statements in conformity with generallyaccepted accounting principles requires the use of estimates andassumptions that affect the reported amounts of assets and liabilitiesat the date of the financial statements and the reported amounts ofrevenues and expenses during the reporting period. Although theseestimates are based on management’s best knowledge of the amount,event or actions, actual results may ultimately differ from thoseestimates. In particular, management’s assumptions in performingthe annual goodwill impairment review (as disclosed in note 11),in assessing the recoverability of deferred tax assets against future
taxable profits (as disclosed in note 6) and in forecasting contingentdeferred consideration payments payable in the future for acquisitions(as disclosed in notes 21 and 31) are considered key sources ofestimation uncertainty at the balance sheet date.
Restatement of prior year comparativesThe group has modified the definition of its primary reporting segmentsin note 2 to reflect the creation of the Asia Pacific, Latin America, MiddleEast & Africa (ALM) region. The group now reports three regions:Europe, North America and ALM. Previously, Middle East & Africa wasincluded in Europe and Latin America was shown as part of theAmericas. Prior year comparatives have been restated for consistency.
Basis of consolidationThe annual group financial statements consolidate the results ofTaylor Nelson Sofres plc (the ‘company’), its subsidiary undertakingsand proportionate share of jointly controlled entities, and incorporate thepost-acquisition results of its share of associates for each financial year.
SubsidiariesSubsidiaries are those entities controlled by the group. Control existswhen the group has the power, directly or indirectly, to govern thefinancial and operating policies of an entity so as to obtain benefitsfrom its activities. In assessing control, potential voting rights thatare presently exercisable or convertible are taken into account.The results of all subsidiary undertakings acquired or disposed ofare included in the income statement from the effective date ofcontrol until the date that control ceases. The acquisition methodof accounting is used to account for the acquisition of subsidiariesand adjustments are made if necessary to ensure consistency ofsubsidiaries’ accounting policies with the group. All intra-grouptransactions are eliminated as part of the consolidation process.
Jointly controlled entitiesJoint ventures are those entities in which the group holds a long-terminterest and which are jointly controlled by the group and one ormore venturers under a contractual agreement. The consolidatedfinancial statements include the group’s proportionate share of theentities’ assets, liabilities, revenue and expenses and cash flows on a line by line basis, from the date that joint control commences untilthe date that joint control ceases. The results of joint ventures areadjusted where necessary to ensure consistency with groupaccounting policies. Unrealised gains or losses on transactionsbetween the group and its joint ventures are eliminated to the extentof the group’s interest.
AssociatesAssociates are those undertakings, other than subsidiaries and jointlycontrolled entities, in which the group holds a long-term participatinginterest and exerts a significant influence but not control. The group’sshare of profits or losses of associates after interest and taxation isincluded in the group income statement and the group’s share oftheir net assets, together with goodwill arising on acquisition, isincluded in the group balance sheet. The group’s share of losses isrecognised up to the carrying value of the individual associate, unlessthe group has incurred obligations or made payments on behalf ofthe associate. The results of associates are adjusted wherenecessary to ensure consistency with group accounting policies.Unrealised gains or losses on transactions between the group andits associates are eliminated to the extent of the group’s interest.
Directors’ Report – Business Review
Directors’ Report –Governance
Financial Statements
Shareholder Information
TNS Annual Report and Accounts 2007 61
Segmental reportingA segment is a distinguishable component of the group that is engagedeither in providing products or services within a particular economicenvironment (geographic segment) or providing products or servicesthat are subject to risks and rewards that are different to othersegments (business segment). Shared costs are charged to segmentsbased on arms-length service agreements, or allocated on a basisconsistent with the consumption of the associated goods or services.
Revenue recognitionRevenue consists of the fair value of the consideration received orreceivable on the sale of products and services net of sales tax, rebatesand discounts after eliminating sales within the group. Revenue andprofits on short-term projects are recognised on the completion ofthe project, once the product and the significant risks and rewardsof ownership have been transferred to the client. Costs incurredon projects up to completion are included within work-in-progress.Revenue and profits on long-term or continuous projects arerecognised on the satisfactory completion of each service deliveryphase of the project. Costs incurred on projects are included withinwork-in-progress until completion of each phase. Amounts invoicedto clients in advance of revenue and profits being recognised areshown as payments received on account within creditors.
Share based paymentsThe fair value of the equity settled employee share option plans iscalculated at the date of grant using appropriate models. Inaccordance with IFRS 2 ‘Share Based Payments’, the fair value ofthe share option is charged to the income statement over the vestingperiod of the options. The value of the charge is adjusted to reflectexpected and actual levels of option vesting.
Exceptional itemsItems are highlighted as exceptional in the income statementwhen separate disclosure is considered helpful in understandingthe underlying performance of the business.
Bank facility arrangement feesBank facility arrangement fees are capitalised and charged to theincome statement over the life of the bank facilities.
GoodwillGoodwill represents the excess of the fair value of the considerationgiven over the fair value of the group’s share of the identifiable netassets acquired at the date of acquisition of the subsidiary, joint ventureor associate. Goodwill is considered to have an indefinite life and istested for impairment annually and whenever events or changes incircumstances indicate that the carrying value may not be recoverable.Goodwill is carried at cost less accumulated impairment losses. Inrespect of associates, the carrying amount of the goodwill is included inthe carrying amount of the investment in the associate. If the fair valueof net assets acquired exceeds the consideration given, then theexcess is credited to the income statement in the year of acquisition.Gains and losses on the disposal of an entity include the carrying valueof related goodwill. Any goodwill previously written off directly toreserves is not included in the gain or loss on disposal.
Intangible assetsCosts that are directly associated with the production of software for internal use in the business are capitalised as an intangible asset. Software that forms an integral part of related hardware is
capitalised with the hardware and included within property, plant and equipment. Acquired intangible assets comprise softwarelicences, patents, customer-related assets, trade marks and brands,measured initially at fair value. Intangible assets are capitalised and amortised on a straight-line basis over their expected usefuleconomic lives as follows:
Patents and licenses 20 years or remaining life if shorter
Software and databases and other assets 5 years or remaining life if shorter
Intangible assets are reviewed for impairment whenever events orchanges in circumstances indicate that the carrying value may notbe recoverable.
Impairment lossesAn impairment loss is recognised equal to the difference betweenthe carrying amount and the recoverable amount of goodwill or anintangible asset, and taken immediately to the income statement.The recoverable amount is the higher of the asset’s fair value lesscost to sell and its value in use. For the purposes of assessingimpairment, assets are grouped at the lowest level for which thereare separately identifiable cash flows.
Property, plant and equipment (PPE)PPE is stated at original cost including costs directly attributableto acquiring assets or, where appropriate, fair value when acquired,less accumulated depreciation and impairment losses. Where anitem of PPE comprises major components having different usefullives, they are accounted for as separate items of PPE. Assets underconstruction consists of costs directly attributable to purchasingand installing PPE ahead of their productive use. External andinternal costs are capitalised to the extent that they enhance futureeconomic benefits accruing to the group. Internal costs are onlycapitalised if they are incremental to the group. Provisions are madeand charged to the income statement where the carrying value ofassets exceeds their recoverable value to the business.
Depreciation is calculated to write off the cost less the estimatedresidual value of each asset on a straight-line basis over itsexpected useful life, as follows:
Freehold land no depreciationFreehold buildings 33 yearsShort leasehold land and buildings term of leaseEquipment 3-10 years
No depreciation is charged on assets under construction until theyare brought into use by the business.
Finance and operating leasesLeases in which the group assumes substantially all the risks andrewards of ownership are classified as finance leases. Assets heldunder finance leases and hire purchase contracts are capitalisedand depreciated over their useful lives, or the term of the lease ifshorter. The corresponding liability to the lessor is included in thebalance sheet as a finance lease obligation. Lease payments areapportioned between finance charges and reduction of the leaseobligation, so as to achieve a constant rate of interest on theremaining liability. Rentals under operating leases are charged directlyto the income statement on a straight line basis over the lease term.

62 www.tnsglobal.com
Notes to the financial statements
1 Accounting policies (continued)
Inventories – work-in-progressInventories are stated at the lower of cost and net realisable value.Cost includes direct costs incurred on incomplete client projects and an appropriate element of attributable overheads.
Pension arrangementsThe group operates a number of contributory pension plans. Themajority of employees participate in defined contribution plans thatare set up through insurance companies. Contributions are alsomade to personal pension plans at equivalent rates. Payments inrespect of such current service contributions are charged to theincome statement as they fall due.
The group also operates a number of defined benefit pensionplans which are accounted for under IAS 19 ‘Employment Benefits’.Obligations under defined benefit plans are measured at discountedpresent value by actuaries, while plan assets are recorded at fairvalue. The operating and financing costs of such plans arerecognised separately in the income statement. Service costs arerecorded in operating costs and are spread over the working livesof employees. Financing costs are recorded in finance costs andrecognised in the years in which they arise. Actuarial gains andlosses are taken directly to reserves in the year in which they arise,the group having taken this option under IAS 19.
Employee share ownership plansShares in Taylor Nelson Sofres plc held by the Employee ShareOwnership Plan (ESOP) and the Employee Benefit Trust (EBT) areincluded within equity at cost less provisions for any permanentdiminution in value. Net operating income from the plans is includedunder finance income in the group’s consolidated income statement.Costs of administration are included in the consolidated incomestatement as they accrue. Profits arising on the disposal of shares heldby the EBT as a result of the exercise of options are taken to reserves.
TaxationThe charge for taxation is based on the profit for the year as adjustedfor items that are not taxable or not deductible and takes into accounttaxation deferred because of temporary differences between thetreatment of certain items for taxation and accounting purposes. Fullprovision is made for the tax effects of these differences. Taxation ischarged to the income statement except to the extent that it relatesto items recognised directly in equity, in which case the taxation isalso recognised in equity. Tax deferred or accelerated by the effect oftemporary differences is accounted for to the extent that a transactionor event that has occurred at the balance sheet date gives rise to anobligation to pay more tax or a right to pay less tax in the future.Deferred tax assets are recognised to the extent that, based onavailable evidence, it is probable that suitable taxable profits will arisefrom which the reversal of the asset can be deducted. Deferred taxassets and liabilities are not discounted.
DividendsFinal dividends are recognised as a liability in the year in whichthey are approved by the company’s shareholders in generalmeeting. Interim dividends are recognised when paid.
Cash and cash equivalentsCash and cash equivalents comprises cash in hand, bank depositsavailable on demand and other short-term highly liquid investmentswith original maturities of three months or less. Bank overdrafts thatare repayable on demand and form an integral part of the group’scash management are included as a component of cash and cashequivalents for the purpose of the statement of cash flows, and areshown within borrowings under current liabilities on the balance sheet.
Trade receivablesTrade receivables are stated at their nominal value reduced byestimated irrecoverable amounts. Provision for impairment isrecognised where there is evidence that the full amount of the tradereceivable is not collectible, and is charged to the income statement.
ProvisionsA provision is recognised in the balance sheet when the group hasa legal or constructive obligation as a result of a past event, and itis more likely than not that an outflow of economic benefits will berequired to settle the obligation and the amount can be reliablyestimated. Provisions are discounted where the effect is material.
Financial assetsUnder IFRS, financial assets are categorised as financial assets heldat fair value through the income statement, loans and receivables,held-to-maturity investments, or available for sale financial assets.This categorisation depends on the purpose for which theinvestments are acquired and is determined by management atinitial recognition and then re-evaluated at each reporting date.
Financial assets held for trading and those designated as held atfair value by management at inception are initially recognised andsubsequently measured at fair value through the income statement.
Loans and receivables that are not derivative financial assets, with fixedor determinable payments and that are not quoted in active markets,are initially recognised and then carried at amortised cost using theeffective interest method, with changes in carrying value recognisedin the income statement. Loans and receivables exclude items thatthe group intends to sell immediately or in the short term (which arecategorised as held for trading) and those for which the group maynot recover substantially all of its initial investment other than becauseof credit deterioration (which are categorised as available for sale).
Financial assets are categorised as held to maturity if the grouphas positive intent and ability, from inception, to hold the securitiesto their maturity date. These financial assets have fixed ordeterminable payments and a fixed maturity. Held to maturityfinancial assets are initially recognised and susequently reportedat amortised cost using the effective interest method, withchanges in carrying value recognised in the income statement.
Financial assets categorised as available for sale are eitherspecifically designated in this category or not categorised in any ofthe other categories. Available for sale assets are initially recognisedand carried at fair value, with unrealised gains and losses (except forchanges in exchange rates for monetary items and interest andimpairment losses) recognised in equity until the financial asset isderecognised, at which time the cumulative gain or loss previouslyrecognised in equity is taken to the income statement.
Directors’ Report – Business Review
Directors’ Report –Governance
Financial Statements
Shareholder Information

TNS Annual Report and Accounts 2007 63
Financial liabilitiesFinancial liabilities are stated at fair value adjusted for transaction costsattributable to the issue of financial liabilities. Financial liabilities aresubsequently measured at amortised cost using the effective interestmethod and, if included in a fair value hedge relationship, are revaluedto reflect the fair value movements on the effective portion of thehedged risk associated with the financial liability. The effect of thecurrency element of currency swaps acting as hedges against debtis reported separately in current and non-current assets and liabilities.
Derivative financial instrumentsThe group uses derivative financial instruments mainly to reduceexposure to foreign exchange risks and interest rate movements.The group does not hold or issue derivative financial instruments forfinancial trading purposes. However, derivatives that do not qualifyfor hedge accounting are accounted for as trading instruments.
Derivative financial instruments are recognised at fair value on thedate the contract is entered into. Subsequent to initial recognition,for derivative financial instruments categorised as held for trading,gains and losses on re-measurement to fair value are recognisedimmediately in the income statement within administrative expensesor finance costs. Where derivatives qualify for hedge accounting,recognition of any resultant gain or loss depends on the nature ofthe hedge (see hedge accounting policies below). Derivative financialinstruments are classified as current assets (within other receivables)or current liabilities (within other payables) where they are held fortrading, or have a maturity within twelve months. Where derivativefinancial instruments have a maturity greater than twelve months andare designated as in a hedge relationship, they are classified withineither non-current assets or non-current liabilities consistent withthe maturity profile of the underlying hedged items.
The fair value of swaps is the estimated amount that the groupwould receive or pay to terminate the swap at the balance sheetdate, taking into account current interest and foreign exchange rates.The fair value of forward exchange contracts is their quoted marketprice at the balance sheet date, being the present value of thequoted forward price. Derivatives embedded within assets andliabilities, which are not closely related to the underlying item,are measured at fair value and accounted for separately.
When a hedging instrument expires or is sold, terminated orexercised, or the entity revokes the designation of the hedgerelationship but the hedged financial asset or liability remains orforecast transaction is still expected to occur, the cumulative gain orloss at that point remains in equity and is recognised in accordancewith the above policy when the transaction occurs. If the hedgedtransaction is no longer expected to take place or the underlyinghedged financial asset or liability no longer exists, then thecumulative unrealised gain or loss recognised in equity isrecognised immediately in the income statement.
Cash flow hedge accountingWhen a derivative financial instrument is designated as a hedgeof the variability in cash flows of a recognised asset or liability, ora highly probable transaction, the effective part of any gain or losson the derivative instrument is recognised directly in equity. Theassociated cumulative gain or loss is removed from equity andrecognised in the income statement in the same period or periodsduring which the hedged forecast transaction affects the income
statement. The ineffective part of any gain or loss is recognisedimmediately in the income statement, in line with the treatment ofthe underlying hedged transaction.
When the forecast transaction subsequently results in the recognitionof a non-financial asset or non-financial liability, or the forecasttransaction for a non-financial asset or non-financial liability, theassociated cumulative gain or loss is removed from equity and includedin the initial cost or carrying amount of the non-financial asset or liability.If a hedge of a forecast transaction subsequently results in therecognition of a financial asset or a financial liability, then the associatedgains and losses that were recognised directly in equity are reclassifiedinto the income statement in the same year or years during which theasset acquired or liability assumed affects the income statement.
Fair value hedge accountingWhen a derivative instrument is designated as a hedge of thevariability in fair value of a recognised asset or liability, or a highlyprobable transaction, the change in fair value of the derivativesthat are designated as fair value hedges are recorded in the incomestatement, together with any changes in fair value of the hedgedasset or liability that is attributable to the hedged risk.
Hedge of net investment in foreign operationExchange differences arising from the retranslation of the net investmentin foreign entities and of borrowings and other currency instrumentsdesignated as hedges of such investment are taken to shareholders’equity on consolidation to the extent the hedges are deemed effective.All other exchange gains or losses are dealt with through the incomestatement and are included within the group’s operating profit.
Foreign currency translationAmounts included in the financial statements of each of the group’sentities are measured using the currency of the primary economicenvironment in which the entity operates (the functional currency).
Transactions in foreign currencies are translated into the functionalcurrency using the exchange rate prevailing at the date oftransaction. Foreign exchange gains and losses resulting from thesettlement of such transactions and from the translation at year endexchange rates of monetary assets and liabilities denominated inforeign currencies, are recognised in the income statement,except when deferred in equity as qualifying cash flow orinvestment hedges. Translation differences on non-monetary items,such as available-for-sale investments are included in equity.
On consolidation, the assets and liabilities of all group companies thathave a functional currency other than sterling are translated at the rateprevailing at the balance sheet date, and their income and expensesare translated at average exchange rates for the year. Exchangedifferences arising from the translation of the net investment in foreignentities, and of borrowings and other currency instruments designatedas hedges of such investments, are taken to equity. When a foreignoperation is sold, these exchange differences are recognised in theincome statement as part of the gain or loss on sale.
Goodwill and fair value adjustments on the acquisition of a foreignentity are treated as assets and liabilities of the foreign entity andare translated at the closing rate.

64 www.tnsglobal.com
Notes to the financial statements
2 Segmental reporting
Primary reporting format – geographic segmentsEurope North America ALM Total
Year ended 31 December 2007 £m £m £m £m
Revenue 687.9 205.5 174.3 1,067.7
Segment operating result before exceptional items 87.3 5.3 19.1 111.7
Restructuring costs (6.0) (0.9) – (6.9)Goodwill impairment – – – – Amortisation of intangibles identified on acquisitions (0.8) (0.5) (0.8) (2.1)
Total exceptional items (6.8) (1.4) (0.8) (9.0)
Segment operating result 80.5 3.9 18.3 102.7
Segment assets and liabilitiesSegment assets 596.1 269.4 172.6 1,038.1
Segment liabilities (775.7) (71.5) (75.8) (923.0)
Other segment itemsCapital expenditure (22.0) (6.5) (8.3) (36.8)Depreciation (13.2) (4.5) (3.9) (21.6)Amortisation of intangibles (3.4) (2.6) (1.7) (7.7)
Europe North America ALM TotalYear ended 31 December 2006 – restated £m £m £m £m
Revenue 649.2 209.2 145.8 1,004.2
Segment operating result before exceptional items 78.7 4.9 15.9 99.5
Restructuring costs (8.6) (9.2) – (17.8)Goodwill impairment – (6.4) – (6.4)Amortisation of intangibles identified on acquisitions (0.7) (0.1) (0.1) (0.9)
Total exceptional items (9.3) (15.7) (0.1) (25.1)
Segment operating result 69.4 (10.8) 15.8 74.4
Segment assets and liabilitiesSegment assets 506.5 233.9 129.2 869.6
Segment liabilities (633.8) (64.5) (44.2) (742.5)
Other segment itemsCapital expenditure (15.3) (7.2) (5.1) (27.6)Depreciation (14.0) (4.3) (3.1) (21.4)Amortisation of intangibles (3.6) (2.0) (0.8) (6.4)
Finance income, finance costs, share of post tax profit of associates and taxation are not allocated to geographic segments.
Directors’ Report – Business Review
Directors’ Report –Governance
Financial Statements
Shareholder Information

TNS Annual Report and Accounts 2007 65
2 Segmental reporting (continued)
Secondary reporting format – business segmentsRevenue Segment assets Capital expenditure
2007 2006 2007 2006 2007 2006£m £m £m £m £m £m
Consumer 327.3 313.8 38.6 15.8 (1.5) (0.2)Media 226.2 206.3 132.3 125.7 (6.5) (6.2)Business Services 141.1 138.9 – – – – Technology 117.9 105.5 – – – – Healthcare 102.4 96.5 32.8 33.7 (0.2) (0.2)Unallocated and non-segment items 152.8 143.2 834.4 694.4 (28.6) (21.0)
1,067.7 1,004.2 1,038.1 869.6 (36.8) (27.6)
There are immaterial sales between the geographic and business segments. Unallocated amounts represent corporate and shared assetswhich are not managed on a business segment basis.
3 Operating profit2007 2006
£m £m
The following items have been included in arriving at operating profit:Depreciation of owned property, plant and equipment (21.6) (21.4)Impairment of goodwill – (6.4)Impairment of trade receivables (1.0) (1.8)Amortisation of intangible assets (in administrative expenses) (7.7) (6.4)Profit/(loss) on disposal of property, plant and equipment 1.9 (0.1)Operating lease rentals payable on equipment (1.5) (1.8)Operating lease rentals payable on property (33.6) (32.3)Property rents receivable 2.0 1.4 Net foreign exchange difference 1.7 (0.7)
Exceptional itemsDuring the year the group concluded a programme of global restructuring to streamline its organisational structure and improve operationalprocesses, including the replacement of senior employees. In addition, one-off restructuring costs relating to the reorganisation of theMedia Intelligence and iTRAM businesses into a combined business unit were also incurred in the year as part of the group’s strategy to takeadvantage of growth opportunities arising from developments in digital media. Total restructuring costs incurred in the year totalled £6.9m(2006 £17.8m).
Amortisation of intangible assets identified separately from goodwill on acquisitions under IFRS of £2.1m (2006 £0.9m) has also beenhighlighted separately in the income statement.
2007 2006Auditors’ remuneration £m £m
Fees payable to the company’s auditor for the audit of the company’s annual accounts (0.4) (0.4)
Fees payable to the company’s auditor and its associates for other servicesThe audit of the company’s subsidiaries, pursuant to legislation (1.5) (1.3)Further assurance services (0.2) (0.2)Tax compliance services (0.2) (0.3)Tax advisory services (0.5) (0.3)
(2.4) (2.1)
(2.8) (2.5)
Auditors’ remuneration for audit services includes £15,000 (2006 £15,000) in respect of the company.
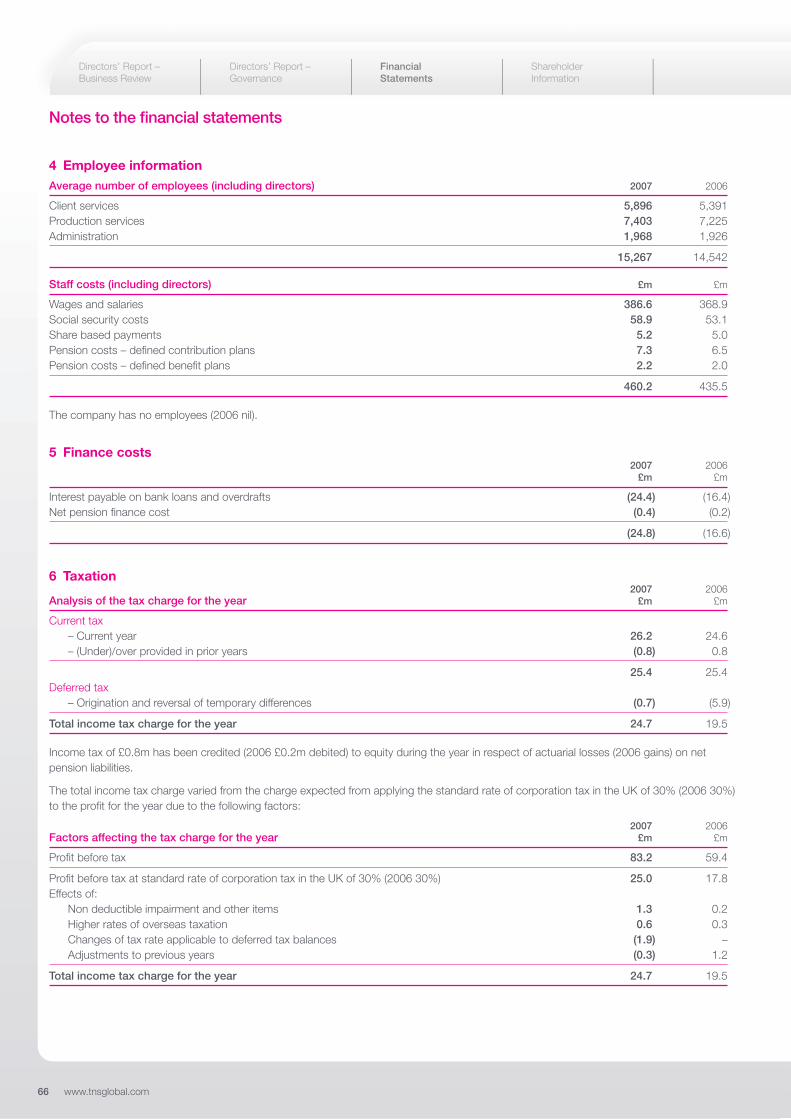
66 www.tnsglobal.com
Notes to the financial statements
4 Employee informationAverage number of employees (including directors) 2007 2006
Client services 5,896 5,391 Production services 7,403 7,225 Administration 1,968 1,926
15,267 14,542
Staff costs (including directors) £m £m
Wages and salaries 386.6 368.9 Social security costs 58.9 53.1 Share based payments 5.2 5.0 Pension costs – defined contribution plans 7.3 6.5 Pension costs – defined benefit plans 2.2 2.0
460.2 435.5
The company has no employees (2006 nil).
5 Finance costs2007 2006
£m £m
Interest payable on bank loans and overdrafts (24.4) (16.4)Net pension finance cost (0.4) (0.2)
(24.8) (16.6)
6 Taxation2007 2006
Analysis of the tax charge for the year £m £m
Current tax– Current year 26.2 24.6 – (Under)/over provided in prior years (0.8) 0.8
25.4 25.4 Deferred tax
– Origination and reversal of temporary differences (0.7) (5.9)
Total income tax charge for the year 24.7 19.5
Income tax of £0.8m has been credited (2006 £0.2m debited) to equity during the year in respect of actuarial losses (2006 gains) on netpension liabilities.
The total income tax charge varied from the charge expected from applying the standard rate of corporation tax in the UK of 30% (2006 30%)to the profit for the year due to the following factors:
2007 2006Factors affecting the tax charge for the year £m £m
Profit before tax 83.2 59.4
Profit before tax at standard rate of corporation tax in the UK of 30% (2006 30%) 25.0 17.8 Effects of:
Non deductible impairment and other items 1.3 0.2 Higher rates of overseas taxation 0.6 0.3 Changes of tax rate applicable to deferred tax balances (1.9) – Adjustments to previous years (0.3) 1.2
Total income tax charge for the year 24.7 19.5
Directors’ Report – Business Review
Directors’ Report –Governance
Financial Statements
Shareholder Information
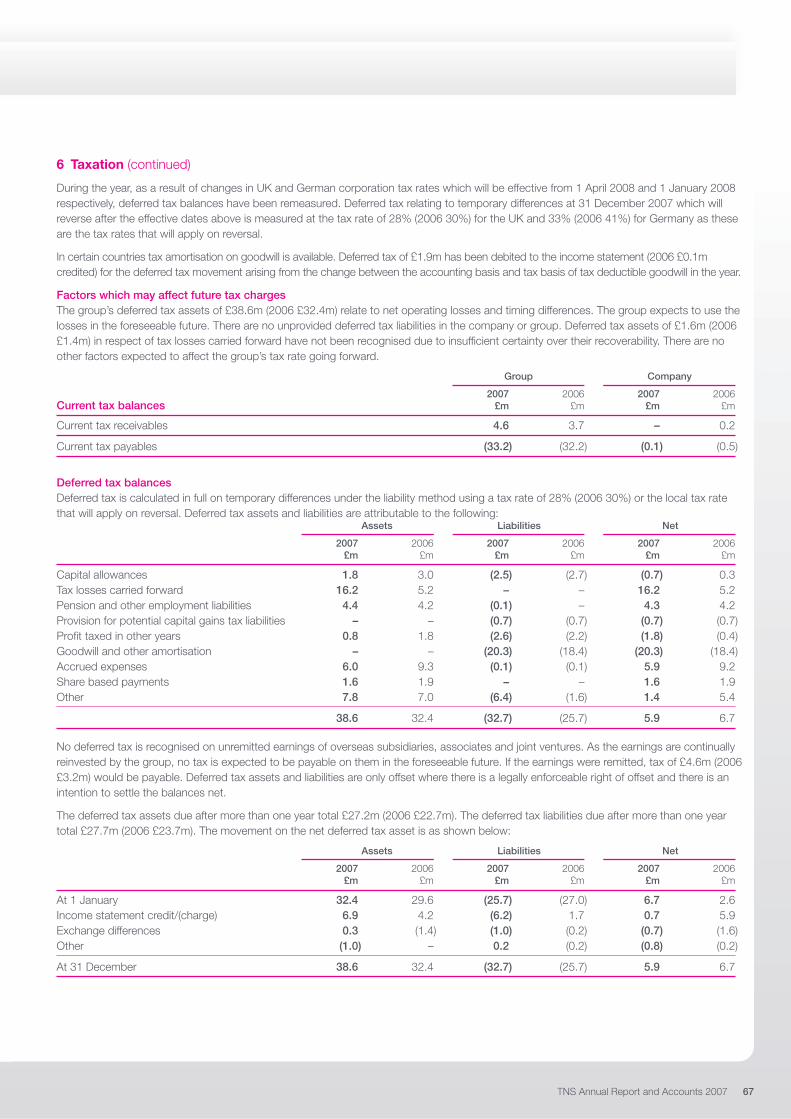
TNS Annual Report and Accounts 2007 67
6 Taxation (continued)
During the year, as a result of changes in UK and German corporation tax rates which will be effective from 1 April 2008 and 1 January 2008respectively, deferred tax balances have been remeasured. Deferred tax relating to temporary differences at 31 December 2007 which willreverse after the effective dates above is measured at the tax rate of 28% (2006 30%) for the UK and 33% (2006 41%) for Germany as theseare the tax rates that will apply on reversal.
In certain countries tax amortisation on goodwill is available. Deferred tax of £1.9m has been debited to the income statement (2006 £0.1mcredited) for the deferred tax movement arising from the change between the accounting basis and tax basis of tax deductible goodwill in the year.
Factors which may affect future tax chargesThe group’s deferred tax assets of £38.6m (2006 £32.4m) relate to net operating losses and timing differences. The group expects to use thelosses in the foreseeable future. There are no unprovided deferred tax liabilities in the company or group. Deferred tax assets of £1.6m (2006£1.4m) in respect of tax losses carried forward have not been recognised due to insufficient certainty over their recoverability. There are noother factors expected to affect the group’s tax rate going forward.
Group Company
2007 2006 2007 2006Current tax balances £m £m £m £m
Current tax receivables 4.6 3.7 – 0.2
Current tax payables (33.2) (32.2) (0.1) (0.5)
Deferred tax balancesDeferred tax is calculated in full on temporary differences under the liability method using a tax rate of 28% (2006 30%) or the local tax ratethat will apply on reversal. Deferred tax assets and liabilities are attributable to the following:
Assets Liabilities Net
2007 2006 2007 2006 2007 2006£m £m £m £m £m £m
Capital allowances 1.8 3.0 (2.5) (2.7) (0.7) 0.3 Tax losses carried forward 16.2 5.2 – – 16.2 5.2 Pension and other employment liabilities 4.4 4.2 (0.1) – 4.3 4.2 Provision for potential capital gains tax liabilities – – (0.7) (0.7) (0.7) (0.7)Profit taxed in other years 0.8 1.8 (2.6) (2.2) (1.8) (0.4)Goodwill and other amortisation – – (20.3) (18.4) (20.3) (18.4)Accrued expenses 6.0 9.3 (0.1) (0.1) 5.9 9.2 Share based payments 1.6 1.9 – – 1.6 1.9 Other 7.8 7.0 (6.4) (1.6) 1.4 5.4
38.6 32.4 (32.7) (25.7) 5.9 6.7
No deferred tax is recognised on unremitted earnings of overseas subsidiaries, associates and joint ventures. As the earnings are continuallyreinvested by the group, no tax is expected to be payable on them in the foreseeable future. If the earnings were remitted, tax of £4.6m (2006£3.2m) would be payable. Deferred tax assets and liabilities are only offset where there is a legally enforceable right of offset and there is anintention to settle the balances net.
The deferred tax assets due after more than one year total £27.2m (2006 £22.7m). The deferred tax liabilities due after more than one yeartotal £27.7m (2006 £23.7m). The movement on the net deferred tax asset is as shown below:
Assets Liabilities Net
2007 2006 2007 2006 2007 2006£m £m £m £m £m £m
At 1 January 32.4 29.6 (25.7) (27.0) 6.7 2.6 Income statement credit/(charge) 6.9 4.2 (6.2) 1.7 0.7 5.9 Exchange differences 0.3 (1.4) (1.0) (0.2) (0.7) (1.6)Other (1.0) – 0.2 (0.2) (0.8) (0.2)
At 31 December 38.6 32.4 (32.7) (25.7) 5.9 6.7

68 www.tnsglobal.com
Notes to the financial statements
7 Profit for the year
As permitted under section 230 of the Companies Act 1985, the parent company’s income statement has not been included in thesefinancial statements. The profit for the year was £112.1m (2006 £43.3m).
8 Dividends2007 2006
£m £m
Final 2006 dividend of 3.2p per share (2005 2.75p) approved in subsequent year 13.6 12.2 Interim 2007 dividend of 1.6p per share (2006 1.4p) paid in the year 6.5 6.2
20.1 18.4
Final 2007 dividend of 3.9p (2006 3.2p) per share proposed for approval and recognition in 2008 16.3 14.2
The trustee of the ESOP (see note 25) has waived its right to all but 0.001p per share of the dividends due on the 0.2 million shares it holdsat 31 December 2007, until further notice. The amount waived in respect of the 2007 interim dividend was £3,000 (2006 £3,000) and themaximum to be waived in respect of the 2007 final dividend on shares currently held by the ESOP is £7,800 (2006 £6,000). The trusteesof the EBT (see note 25) have also waived their right to all but 0.001p per share of the dividends due on the 4.0 million shares the EBT holdsat 31 December 2007 until further notice. The amount waived in respect of the 2007 interim dividend was £67,000 (2006 £62,000) andthe maximum to be waived in respect of the 2007 final dividend shares currently held by the EBT is £156,000 (2006 £140,000).
The final proposed dividend does not include a dividend on shares issued on the exercise of employee share options, on allotments ofnew shares since 31 December 2007 or on other options that may be exercised prior to 23 May 2008, the record date.
9 Earnings per share
Basic earnings per share of 13.4p (2006 8.4p) have been calculated on the profit for the year attributable to equity holders of the parentcompany of £56.3m (2006 £37.1m) and on 419.5 million shares (2006 442.4 million), being the weighted average number of shares in issueduring the year, excluding those held in the ESOP and the EBT, which are treated as cancelled. The diluted earnings per share of 13.1p (20068.2p) have been calculated in accordance with the provisions of IAS 33, ‘Earnings Per Share’, with the weighted average number of shares inissue being adjusted to assume conversion of all dilutive potential shares for the period they were outstanding. Shares held by the ESOP andthe EBT, which are under performance-based options, are included in the diluted weighted average number of shares, as the performanceconditions are deemed to have been met for the purposes of this calculation.
The weighted average number of ordinary shares in issue during the year for the purpose of these calculations is as follows:
2007 2006millions millions
Share capital 439.0 450.7 Shares held in Treasury (14.7) (3.5)Shares held by ESOP (0.2) (0.2)Shares held by EBT (4.6) (4.6)
Basic earnings per share denominator 419.5 442.4 Dilutive effect of share options 9.2 10.4
Diluted earnings per share denominator 428.7 452.8
Directors’ Report – Business Review
Directors’ Report –Governance
Financial Statements
Shareholder Information

TNS Annual Report and Accounts 2007 69
9 Earnings per share (continued)
An adjusted earnings per share using an adjusted profit for the year attributable to equity holders of the parent company is also presented,as the directors believe that this assists in understanding the underlying performance of the group. The adjusted earnings per share isbased on the profit as adjusted for the items shown below.
2007 2006£m £m
Profit for the year attributable to equity holders of the parent company 56.3 37.1 Adjusted for exceptional items:Restructuring costs 6.9 17.8 Goodwill impairment – 6.4 Amortisation of intangibles identified on acquisitions 2.1 0.9
9.0 25.1 Tax on exceptional items at 27.5% (2.5) (5.9)Deferred tax on goodwill 1.9 (0.1)
8.4 19.1
Adjusted profit for the year attributable to equity holders of the parent company 64.7 56.2
Adjusted earnings per share 15.4 12.7
Profit used for Weighted averageEPS purposes number of shares Earnings per share
2007 2006 2007 2006 2007 2006£m £m millions millions pence pence
Basic 56.3 37.1 419.5 442.4 13.4 8.4 Diluted 56.3 37.1 428.7 452.8 13.1 8.2 Adjusted 64.7 56.2 419.5 442.4 15.4 12.7
10 Acquisitions% Date
Name acquired acquired in 2007 Business Country
Research Surveys (Pty) Ltd 55 12 January Custom research South AfricaSorensen Associates 100 12 February Custom research USCymfony, Inc. 100 23 February Media Intelligence USExpert Monitor 67 7 March Media Intelligence PolandRetail Forward, Inc. 100 7 March Custom research USConversa Global1 100 6 July Custom research New ZealandPresswatch GmbH 100 31 July Media Intelligence GermanyI D Magasin 100 30 September Custom research UKLandis Strategy & Innovation LLC 100 6 December Custom research US
These acquisitions contributed revenues of £24.4m and operating profit of £1.7m to the group for the year to 31 December 2007.If all acquisitions had occurred on 1 January 2007, group revenue would have been £1,077.9m and group operating profit would havebeen £104.4m.
1 Acquisition of trade and assets.

70 www.tnsglobal.com
Notes to the financial statements
10 Acquisitions (continued)Carrying Provisional Adjustments
values pre fair value Total 2007 to prior yearacquisition adjustments acquisitions acquisitions Total
Net assets acquired and goodwill arising £m £m £m £m £m
Non-current assetsProperty, plant and equipment 1.4 (0.2) 1.2 – 1.2Intangible assets 0.6 7.3 7.9 0.6 8.5
2.0 7.1 9.1 0.6 9.7Current assetsInventories 2.3 – 2.3 – 2.3Trade and other receivables 5.8 (0.1) 5.7 – 5.7Cash and cash equivalents 2.1 – 2.1 – 2.1
10.2 (0.1) 10.1 – 10.1
Total assets 12.2 7.0 19.2 0.6 19.8LiabilitiesTrade and other payables (13.6) (2.3) (15.9) – (15.9)Minority interest in acquired net assets (0.6) – (0.6) 0.5 (0.1)
Fair value of net assets acquired (2.0) 4.7 2.7 1.1 3.8Minority interests purchased 1.2 – 1.2 – 1.2Goodwill (note 11) 48.2 (4.7) 43.5 0.3 43.8
Consideration 47.4 – 47.4 1.4 48.8
Consideration satisfied by:Cash 38.6 0.4 39.0Deferred consideration – contingent (see note 21 and 31) 8.8 1.0 9.8
47.4 1.4 48.8
The provisional fair value adjustment to intangible assets of £7.3m relates to the recognition of customer-related assets and brandsseparately from goodwill under acquisition accounting rules, which were previously not recognised in the acquisition balance sheet.
During the year, provisional fair values recognised in the prior year have been adjusted as the fair value process was completed. Prior yearbalances have not been restated as the adjustments are not significant to the group.
Goodwill arising on the acquisitions represents the value of assembled workforces and synergies available to the group. All intangibleassets acquired with the businesses have been recognised at their respective fair values separately from goodwill. Each 2007 acquisitionis considered to be a separate cash generating unit for the purpose of impairment reviews.
Directors’ Report – Business Review
Directors’ Report –Governance
Financial Statements
Shareholder Information
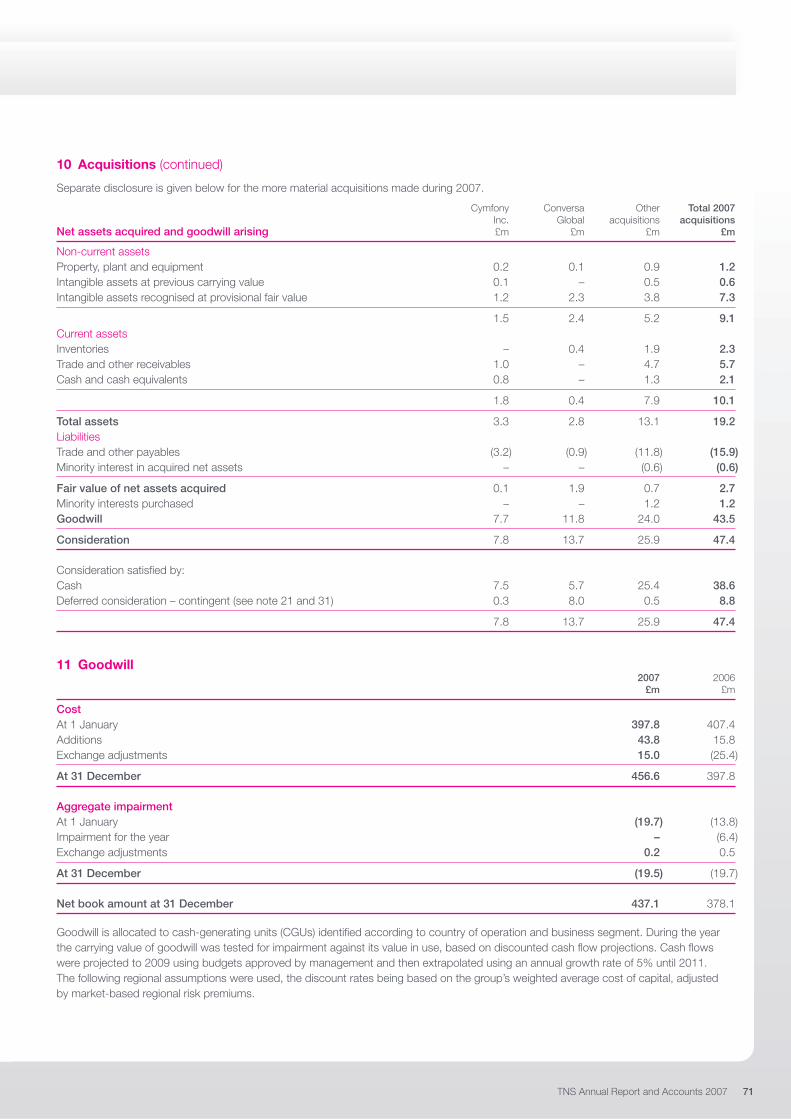
TNS Annual Report and Accounts 2007 71
10 Acquisitions (continued)
Separate disclosure is given below for the more material acquisitions made during 2007.
Cymfony Conversa Other Total 2007Inc. Global acquisitions acquisitions
Net assets acquired and goodwill arising £m £m £m £m
Non-current assetsProperty, plant and equipment 0.2 0.1 0.9 1.2 Intangible assets at previous carrying value 0.1 – 0.5 0.6Intangible assets recognised at provisional fair value 1.2 2.3 3.8 7.3
1.5 2.4 5.2 9.1Current assetsInventories – 0.4 1.9 2.3Trade and other receivables 1.0 – 4.7 5.7Cash and cash equivalents 0.8 – 1.3 2.1
1.8 0.4 7.9 10.1
Total assets 3.3 2.8 13.1 19.2LiabilitiesTrade and other payables (3.2) (0.9) (11.8) (15.9)Minority interest in acquired net assets – – (0.6) (0.6)
Fair value of net assets acquired 0.1 1.9 0.7 2.7Minority interests purchased – – 1.2 1.2Goodwill 7.7 11.8 24.0 43.5
Consideration 7.8 13.7 25.9 47.4
Consideration satisfied by:Cash 7.5 5.7 25.4 38.6Deferred consideration – contingent (see note 21 and 31) 0.3 8.0 0.5 8.8
7.8 13.7 25.9 47.4
11 Goodwill2007 2006
£m £m
CostAt 1 January 397.8 407.4 Additions 43.8 15.8 Exchange adjustments 15.0 (25.4)
At 31 December 456.6 397.8
Aggregate impairmentAt 1 January (19.7) (13.8)Impairment for the year – (6.4)Exchange adjustments 0.2 0.5
At 31 December (19.5) (19.7)
Net book amount at 31 December 437.1 378.1
Goodwill is allocated to cash-generating units (CGUs) identified according to country of operation and business segment. During the yearthe carrying value of goodwill was tested for impairment against its value in use, based on discounted cash flow projections. Cash flowswere projected to 2009 using budgets approved by management and then extrapolated using an annual growth rate of 5% until 2011.The following regional assumptions were used, the discount rates being based on the group’s weighted average cost of capital, adjustedby market-based regional risk premiums.

72 www.tnsglobal.com
Notes to the financial statements
11 Goodwill (continued)Pre tax
Tax rate discount rate Book value% % £m
Germany 35.0 14.2 89.3Rest of Europe 30.0 13.1 131.5North America 35.0 14.2 148.9ALM 35.0 14.6 67.4
437.1
As a result of the prior year impairment review, goodwill allocated to TES, a Media Intelligence business in the US, was written down by£6.4m to £nil. No goodwill has been impaired as a result of the 2007 review.
Had the tax rate, growth rate or discount rate assumptions been varied within a range considered reasonably possible by management,no additional impairments would have arisen. The projected cash flows used in the impairment calculations are management’s bestestimates, but are dependent on uncertain future events.
12 Intangible assetsPatents and Software and
licences databases Other Total£m £m £m £m
CostAt 1 January 2006 4.7 27.6 3.8 36.1 Additions at cost 1.0 4.5 1.1 6.6 Acquisitions – 0.3 0.2 0.5 Disposals (0.1) (2.4) (0.6) (3.1)Reclassifications 0.2 – (0.2) – Exchange adjustments (0.1) (2.3) (0.2) (2.6)
At 31 December 2006 5.7 27.7 4.1 37.5 Additions at cost 0.1 3.7 2.1 5.9 Acquisitions (note 10) 0.1 0.2 8.2 8.5 Disposals – (3.1) (0.2) (3.3)Reclassifications 0.6 0.2 (0.8) – Exchange adjustments 0.2 1.2 (0.1) 1.3
At 31 December 2007 6.7 29.9 13.3 49.9
AmortisationAt 1 January 2006 (2.5) (15.2) (1.8) (19.5)Charge for year (0.7) (4.6) (1.1) (6.4)Disposals 0.1 2.4 0.5 3.0 Exchange adjustments (0.1) 1.6 0.1 1.6
At 31 December 2006 (3.2) (15.8) (2.3) (21.3)Charge for year (0.7) (4.9) (2.1) (7.7)Disposals – 2.4 0.2 2.6 Reclassifications (1.4) (0.2) 1.6 – Exchange adjustments (0.1) (1.2) – (1.3)
At 31 December 2007 (5.4) (19.7) (2.6) (27.7)
Net book value at 31 December 2007 1.3 10.2 10.7 22.2
Net book value at 31 December 2006 2.5 11.9 1.8 16.2
Other intangible assets consist principally of customer-related assets and brands recognised with acquisitions made since transition to IFRS.Additions in the prior year included assets purchased with deferred consideration of £1.4m. No similar purchases were made in the currentyear. All amortisation charges have been charged to administration expenses.
The company has no intangible assets (2006 £nil).
Directors’ Report – Business Review
Directors’ Report –Governance
Financial Statements
Shareholder Information

TNS Annual Report and Accounts 2007 73
13 Property, plant and equipmentShort
leaseholdFreehold Freehold land and
land buildings buildings Equipment Total£m £m £m £m £m
CostAt 1 January 2006 2.6 30.0 6.9 122.9 162.4 Additions at cost – – 1.1 19.9 21.0 Acquisitions – – 0.1 0.1 0.2 Disposals – – (1.8) (14.2) (16.0)Reclassifications – (1.8) 1.8 – – Exchange adjustments (0.2) (2.1) (1.4) (6.6) (10.3)
At 31 December 2006 2.4 26.1 6.7 122.1 157.3 Additions at cost 1.0 – 0.1 29.8 30.9 Acquisitions (note 10) – – – 1.2 1.2 Disposals – (0.4) – (23.9) (24.3)Reclassifications 0.4 (1.5) 1.1 – – Exchange adjustments 0.1 1.7 0.2 11.3 13.3
At 31 December 2007 3.9 25.9 8.1 140.5 178.4
DepreciationAt 1 January 2006 – (10.1) (1.7) (77.5) (89.3)Charge for year – (0.7) (0.9) (19.8) (21.4)Disposals – – 1.5 13.8 15.3 Exchange adjustments – 1.5 0.2 5.2 6.9
At 31 December 2006 – (9.3) (0.9) (78.3) (88.5)Charge for year – (0.2) (0.6) (20.8) (21.6)Disposals – 0.3 – 22.9 23.2 Reclassifications – 0.5 (0.5) – – Exchange adjustments – (0.8) (0.1) (7.9) (8.8)
At 31 December 2007 – (9.5) (2.1) (84.1) (95.7)
Net book value at 31 December 2007 3.9 16.4 6.0 56.4 82.7
Net book value at 31 December 2006 2.4 16.8 5.8 43.8 68.8
The company has no property, plant or equipment (2006 £nil).
14 Fixed asset investments2007 2006
Group – investments in associates accounted for using the equity method £m £m
At 1 January 3.4 3.0 Acquisitions 1.5 – Share of profits 0.4 0.4 Dividends (0.5) (0.1)Exchange adjustments 0.2 0.1
At 31 December 5.0 3.4
ProvisionsAt 1 January and 31 December (0.5) (0.5)
Net book value at 31 December 4.5 2.9

74 www.tnsglobal.com
Notes to the financial statements
14 Fixed asset investments (continued)
The following amounts represent the group’s share of the assets and liabilities, and sales and results of its associates and joint ventures:
Associates Joint ventures
2007 2006 2007 2006Group £m £m £m £m
AssetsNon-current assets 0.5 0.3 7.7 4.6 Current assets 2.5 2.3 10.2 10.6
3.0 2.6 17.9 15.2
LiabilitiesCurrent liabilities (2.0) (1.4) (6.3) (4.1)Non-current liabilities (0.5) (0.2) (0.2) (0.2)
(2.5) (1.6) (6.5) (4.3)
Net assets 0.5 1.0 11.4 10.9
Income 8.5 8.4 21.0 19.4 Expenses (8.0) (7.8) (16.4) (15.5)
Profit before income tax 0.5 0.6 4.6 3.9 Income tax (0.1) (0.2) (0.6) (0.6)
Profit after income tax 0.4 0.4 4.0 3.3
As at 31 December 2006 and 2007, the joint ventures have no significant contingent liabilities to which the group is exposed and nor hasthe group any significant contingent liabilities in relation to its interest in the joint ventures other than the bank guarantees set out in note 31.
The group has not recognised its share of losses of associate entities amounting to £0.1m (2006 £nil) for the year and £0.4m(2006 £0.3m) cumulatively.
Long-termloans to Interests in
subsidiaries subsidiaries TotalCompany £m £m £m
CostAt 1 January 2006 206.4 496.4 702.8 Additions at cost – 25.8 25.8 Disposals (196.0) – (196.0)
At 31 December 2006 10.4 522.2 532.6 Additions at cost – 28.6 28.6 Disposals – (25.0) (25.0)Exchange adjustments 0.3 – 0.3
At 31 December 2007 10.7 525.8 536.5
Provisions against investmentsAt 1 January and 31 December 2006 and 2007 – (6.8) (6.8)
Net book value at 31 December 2007 10.7 519.0 529.7
Net book value at 31 December 2006 10.4 515.4 525.8
Directors’ Report – Business Review
Directors’ Report –Governance
Financial Statements
Shareholder Information
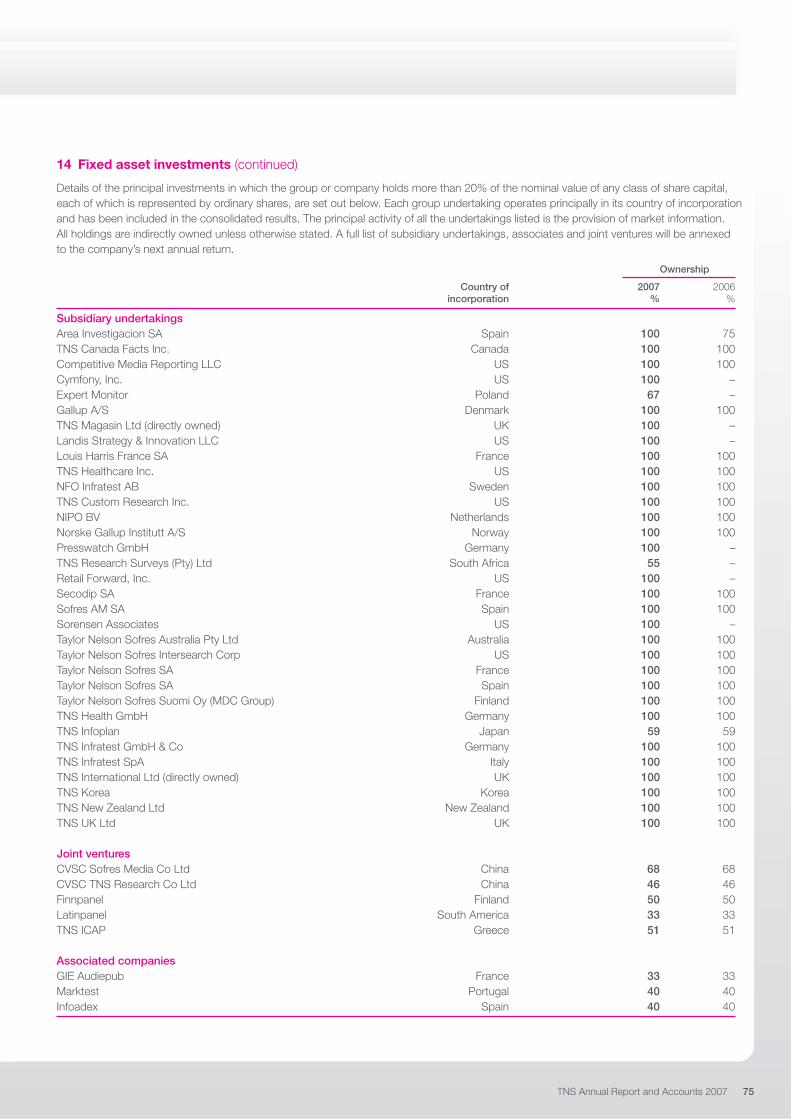
TNS Annual Report and Accounts 2007 75
14 Fixed asset investments (continued)
Details of the principal investments in which the group or company holds more than 20% of the nominal value of any class of share capital,each of which is represented by ordinary shares, are set out below. Each group undertaking operates principally in its country of incorporationand has been included in the consolidated results. The principal activity of all the undertakings listed is the provision of market information.All holdings are indirectly owned unless otherwise stated. A full list of subsidiary undertakings, associates and joint ventures will be annexedto the company’s next annual return.
Ownership
Country of 2007 2006incorporation % %
Subsidiary undertakingsArea Investigacion SA Spain 100 75TNS Canada Facts Inc. Canada 100 100Competitive Media Reporting LLC US 100 100Cymfony, Inc. US 100 –Expert Monitor Poland 67 –Gallup A/S Denmark 100 100TNS Magasin Ltd (directly owned) UK 100 –Landis Strategy & Innovation LLC US 100 –Louis Harris France SA France 100 100TNS Healthcare Inc. US 100 100NFO Infratest AB Sweden 100 100TNS Custom Research Inc. US 100 100NIPO BV Netherlands 100 100Norske Gallup Institutt A/S Norway 100 100Presswatch GmbH Germany 100 –TNS Research Surveys (Pty) Ltd South Africa 55 –Retail Forward, Inc. US 100 –Secodip SA France 100 100Sofres AM SA Spain 100 100Sorensen Associates US 100 –Taylor Nelson Sofres Australia Pty Ltd Australia 100 100Taylor Nelson Sofres Intersearch Corp US 100 100Taylor Nelson Sofres SA France 100 100Taylor Nelson Sofres SA Spain 100 100Taylor Nelson Sofres Suomi Oy (MDC Group) Finland 100 100TNS Health GmbH Germany 100 100TNS Infoplan Japan 59 59TNS Infratest GmbH & Co Germany 100 100TNS Infratest SpA Italy 100 100TNS International Ltd (directly owned) UK 100 100TNS Korea Korea 100 100TNS New Zealand Ltd New Zealand 100 100TNS UK Ltd UK 100 100
Joint venturesCVSC Sofres Media Co Ltd China 68 68CVSC TNS Research Co Ltd China 46 46Finnpanel Finland 50 50Latinpanel South America 33 33TNS ICAP Greece 51 51
Associated companiesGIE Audiepub France 33 33Marktest Portugal 40 40Infoadex Spain 40 40

76 www.tnsglobal.com
Notes to the financial statements
15 Other financial assetsGroup Company
2007 2006 2007 2006£m £m £m £m
CurrentLoans and receivables 0.6 0.3 – –
Non-currentInterest rate swap at fair value 8.4 – – – Available for sale investments 2.2 0.4 – –
10.6 0.4 – –
The interest rate swap is designated as a hedge of new debt financing in the year (see note 19). Other non-current investments representminority shareholdings and other investments in a number of unlisted companies. Other than the interest rate swap carried at fair value,all these financial assets are carried at cost.
16 Inventories – work-in-progressGroup Company
2007 2006 2007 2006£m £m £m £m
Work-in-progress 55.5 48.8 – –
17 Trade and other receivablesGroup Company
2007 2006 2007 2006£m £m £m £m
Trade receivables 243.7 218.4 – – Less: provision for bad debts (5.0) (5.6) – –
Trade receivables – net 238.7 212.8 – – Amounts owed by related parties 2.6 2.7 40.7 24.2 Other receivables 16.5 14.2 0.1 0.1 Prepayments and accrued income 33.7 26.5 0.3 0.8
291.5 256.2 41.1 25.1
All trade and other receivables except prepayments and accrued income are financial assets categorised as loans and receivables, carriedat amortised cost. There is no concentration of credit risk with respect to trade receivables as the group has a large number of customers,dispersed internationally.
2007 2006Provision for bad debts – Group £m £m
At 1 January (5.6) (5.4)Trade receivables written off in the year 1.5 1.5 Charged to the income statement on impairment of trade receivables (1.0) (1.8)Released to the income statement on collection of debts 0.6 – Exchange adjustments (0.5) 0.1
At 31 December (5.0) (5.6)
Directors’ Report – Business Review
Directors’ Report –Governance
Financial Statements
Shareholder Information
TNS Annual Report and Accounts 2007 77
18 Cash and cash equivalentsGroup Company
2007 2006 2007 2006£m £m £m £m
Cash at bank and in hand 90.2 61.8 15.4 2.5
Cash at bank and in hand includes £45.1m (2006 £21.5m) of deposits benefiting from notional netting arrangements with the group’sbankers. The banks offset these credit balances against equivalent overdraft balances, shown within borrowings in note 19, for thepurposes of calculating interest and covenant compliance. These amounts are not presented on a net basis in these financial statements,in compliance with IAS 39 ‘Financial Instruments: Recognition and Measurement’, because no legal right of set-off exists.
Group Company
Cash, cash equivalents and bank overdrafts include the following 2007 2006 2007 2006for the purposes of the cash flow statement: £m £m £m £m
Cash and cash equivalents 90.2 61.8 15.4 2.5 Bank overdrafts (note 19) (51.2) (23.3) – (2.6)
39.0 38.5 15.4 (0.1)
19 Borrowings Group Company
2007 2006 2007 2006£m £m £m £m
CurrentBank overdrafts 51.2 23.3 – 2.6
Non-currentBank loans 227.9 316.9 – –Senior unsecured loan notes 173.0 – – –
400.9 316.9 – –
Group Company
2007 2006 2007 2006Maturity analysis £m £m £m £m
Between one and two years – 1.0 – –Between two and five years 257.8 315.9 – –Over five years 143.1 – – –
400.9 316.9 – –
During the year £162.7m of fixed and floating rate senior unsecured notes, denominated in sterling, euro and US dollars, were issued througha private placement. The notes have maturities of 5, 7 and 10 years and the proceeds have been used to refinance existing bank borrowings.The fixed rate notes carry coupon interest rates between 6.22% and 6.51%. The floating rate notes carry margins of between 56 and 62basis points over LIBOR.
Interest on the group’s committed revolving credit facility of £350.0m (2006 £500.0m) is payable at the rate of 0.4% (2006 0.5%) aboveLIBOR. In addition, the company has uncommitted facilities of £45.0m (2006 £43.4m) upon which interest is payable at between 0.2%and 0.4% (2006 0.2% and 0.5%) above LIBOR.
All borrowings are financial liabilities carried at amortised cost using the effective interest method, except for the senior unsecured loansnotes, which are carried at amortised cost plus a fair value adjustment for the interest rate risk hedged. Bank loans and overdrafts arestated net of arrangement fees of £1.1m (2006 £0.6m).
2007 2006Effective interest rates at 31 December % %
Bank borrowings 5.0 4.7 Senior unsecured notes 6.1 –
78 www.tnsglobal.com
Notes to the financial statements
20 Trade and other payablesGroup Company
2007 2006 2007 2006Current £m £m £m £m
Payments received on account 95.1 93.4 – –Trade payables 48.4 41.1 – –Amounts owed to related parties 3.1 1.9 42.8 48.1 Other taxation and social security 33.6 29.1 – –Other creditors 8.8 10.8 0.2 0.4 Obligations under finance leases 0.1 0.1 – –Accruals 149.0 116.9 0.1 0.1
338.1 293.3 43.1 48.6
Group Company
2007 2006 2007 2006Non-current £m £m £m £m
Amounts owed to related parties – – 335.7 328.9 Potential obligations to purchase minority interests 4.4 – – –Other creditors 4.8 1.9 – –
9.2 1.9 335.7 328.9
Potential obligations to purchase minority interests represent the fair value of put options entered into on the acquisition of certainsubsidiaries, under which minority interests can require the group to purchase their shares. The put option price will be determined onexercise by reference to the future performance of the acquired businesses. These financial liabilities are carried at fair value, basedon management’s best estimates of future amounts payable. Their recognition at fair value has given rise to the ‘Potential acquisition ofminority interests’ reserve (see note 27), and any future adjustment to their fair value, whether as a result of revised estimates or finalsettlement, will be recorded to finance costs in the Income Statement.
All trade and other payables are financial liabilities except for payments received on account (which are non-financial liabilities). With theexception of the put options described above and other derivative financial instruments which are carried at fair value (see note 22),all trade and other payable are carried at amortised cost.
21 ProvisionsContingent Onerous
deferred property Panelconsideration leases incentives Other Total
£m £m £m £m £m
At 1 January 2006 7.8 6.5 11.4 10.6 36.3 Charged to the income statement – 0.6 11.2 4.4 16.2 Released to the income statement – (0.2) (0.2) (0.3) (0.7)Utilised (0.7) (1.6) (10.2) (8.2) (20.7)Acquisitions (note 10) 9.8 – – – 9.8 Exchange differences 0.8 – 0.5 (0.2) 1.1
At 31 December 2007 17.7 5.3 12.7 6.3 42.0
2007 2006Analysis between current and non-current £m £m
Current 15.7 16.8 Non-current 26.3 19.5
42.0 36.3
Directors’ Report – Business Review
Directors’ Report –Governance
Financial Statements
Shareholder Information
TNS Annual Report and Accounts 2007 79
21 Provisions (continued)
Deferred consideration represents management’s best estimate of amounts that the group is contractually bound to pay in the futurefor acquisitions, where such estimates can be made reliably. The amounts payable are based on the future performance of the acquiredbusinesses, and the provisions recognised are determined with reference to the latest forecasts available. The deferred consideration isexpected to be paid within one to three years of the balance sheet date, and provisions are discounted where the effect is material usingdiscount rates comparable with bank lending rates available to the group.
Onerous lease provisions represent the net rental cost to the group of empty leasehold properties and the net rent in excess of marketrents for properties acquired with acquisitions to the end of the relevant lease periods. The provisions are expected to be utilised by 2013.
Panel incentives represent best estimates of rewards payable in the future to panellists for their participation in panels research. Amountsare estimated based on the value of incentives earned and are expected to be satisfied within one to two years.
Other provisions consist of liabilities arising as a result of ongoing litigation or claims, restructuring provisions (excluding property) of £2.9m(2006 £6.8m) and other amounts that are not individually material to the group. The amounts are expected to be paid within one to five years.
No provisions were held by the company as at 31 December 2007 (2006 nil).
22 Financial risk management and financial instruments
The group’s international operations and significant debt financing expose it to a range of financial risks that include changes in interest rates,currency exchange rates and bank solvency credit ratings. The group has a risk management policy to manage these financial risks over theshort and medium term, to reduce volatility to earnings and shareholders’ funds and to aid future planning, by seeking to limit the impact ofadverse movements in these variables. The group holds foreign currency debt and uses interest rate and currency exchange rate financialinstruments as part of this policy.
The board has delegated to a Financing Committee, chaired by the Finance Director, the responsibility for ensuring compliance with thegroup’s financial risk management policy and on a semi-annual basis formally reviews this policy and its performance in delivering the board’sobjectives. The group has a centralised treasury and financial risk function, which implements the risk management policy and it formallyreports, on a monthly basis, the results of its activities and its compliance with the policy to the Financing Committee. Group Treasury is nota profit centre and no speculative trades are permitted or executed.
Interest rate riskOn 31 December 2007, the group had liquid resources of £90.2m (2006 £61.8m) held at floating rates and borrowings of £316.6m (2006£340.2m) at floating rates. It is therefore exposed to variations in primarily UK, US and Eurozone interest rates on these financial assets andliabilities. The group has a policy of using financial instruments, primarily interest rate swaps and forward rate agreements, to ensure that thelevel of effective fixed rate debt after the effect of these instruments is between 55% and 75% of total net debt. At the year end 68.6% (200668.0%) of net debt was at effective fixed rates.
Based on debt, interest rates and hedge levels existing at 31 December 2007, a 1% rise in interest rates before the effect of the interest ratehedge would increase the annual interest charge as follows: on USD loans £0.7m (2006 £1.6m), EUR £1.4m (2006 £1.5m) and GBP £0.7m(2006 £0.1m). A 1% rise in interest rates on a hedged basis would increase the annual interest charge as follows: USD £0.7m (2006 £0.6m),EUR £0.1m (2006 £0.5m) and GBP £0.8m (2006 £0.1m). A 1% decrease in interest rates would have the opposite effect in each case.
Had interest rates been 1% higher or lower at 31 December 2007, the fair value of interest rate hedge instruments held in equity at thatdate would not have been significantly different.
Currency riskThe group’s principal exposure to currency exchange rate fluctuations arises on the translation of overseas earnings and net assets intosterling for accounting purposes and the sterling value of dividends paid up to the group. The material foreign currencies in terms of earningsand net assets are the US dollar and Euro. The group has a policy of holding a substantial amount of its bank debt in these currencies, toprovide a natural hedge for currency earnings by currency interest payments and for currency net assets by the currency loan principal. Thepolicy ensures that the level of currency hedge (debt and currency forwards where used) should be greater than 75% and less than 100%of net assets for all currencies where net assets are greater than £10.0m. The group uses forward currency contracts for hedging futurecertain and material dividend flows to the group.

80 www.tnsglobal.com
Notes to the financial statements
22 Financial risk management and financial instruments (continued)
Had the US dollar been 10% weaker against sterling throughout the year with all other variables held constant, the group’s post-tax profit forthe year would have been £0.4m lower (2006 £0.3m higher). Had the US dollar been 10% stronger against sterling at 31 December 2007,the retranslation of gross US dollar financial liabilities at that date would have resulted in a reduction in the group’s equity of £31.1m (2006£28.5m). Had the Euro been 10% weaker against sterling throughout the year with all other variables held constant, the group’s post-taxprofit for the year would have been £4.4m (2006 £1.9m) lower. Had the Euro been 10% stronger against sterling at 31 December 2007, theretranslation of gross Euro financial liabilities at that date would have resulted in a reduction in the group’s equity of £45.2m (2006 £44.1m). Ineach case, an opposite movement in exchange rates would have given rise to an opposite effect on post-tax profit and equity. As required byIFRS 7, ‘Financial Instruments: Disclosure’, this analysis excludes the mitigating effects of the natural hedges discussed above and of hedgeinstruments actually in place throughout the year and as at 31 December 2007.
The group is exposed to transactional foreign exchange risk from sales and purchases of services between members of the group. This ishedged initially by matching cash flows through a netting process, and finally by using forward currency contracts where material. The levelof net transactional exposure is currently not considered material.
Currency and interest rate exposures of financial liabilitiesThe interest rate and currency exposures of the group’s financial liabilities at 31 December, after taking account of interest and currencyswaps, were:
Not interest Average years to maturitybearing Floating rate Fixed rate Total
2007 £m £m £m £m Floating rate Fixed rate
Sterling (47.9) (117.9) (13.7) (179.5) 3.3 2.1Euro (118.4) (21.3) (122.0) (261.7) 3.4 2.1US dollar (27.7) (70.5) (105.8) (204.0) 7.4 4.7Other (57.7) (1.3) – (59.0) 1.7 –
(251.7) (211.0) (241.5) (704.2) 4.7 3.2
Not interest Average years to maturitybearing Floating rate Fixed rate Total
2006 £m £m £m £m Floating rate Fixed rate
Sterling (38.4) (31.4) (7.6) (77.4) 0.8 2.5 Euro (73.6) (55.9) (95.8) (225.3) 1.4 3.0 US dollar (46.3) (62.8) (99.6) (208.7) 1.9 3.2 Other (14.5) (0.6) (0.6) (15.7) 0.3 2.0
(172.8) (150.7) (203.6) (527.1) 1.4 3.1
Floating rate financial liabilities bear interest at rates based on LIBOR or EURIBOR. Fixed rate financial liabilities relate to the hedgedproportion of borrowings and deferred consideration. The weighted average interest rate for fixed rate financial liabilities is sterling 6.7%(2006 5.8%), US dollar 5.9% (2006 5.1%) and Euro 4.2% (2006 4.1%).
Currency and interest rate exposures of financial assetsThe currency and interest rate exposures of financial assets at 31 December were:
Not interest Not interestbearing Floating rate 2007 bearing Floating rate 2006
£m £m £m £m £m £m
Sterling 44.5 35.3 79.8 40.6 19.2 59.8 Euro 117.8 25.2 143.0 84.2 16.8 101.0 US dollar 36.7 1.2 37.9 90.5 1.9 92.4 Other 70.0 28.5 98.5 14.4 23.9 38.3
269.0 90.2 359.2 229.7 61.8 291.5
Financial assets represents cash which attracts interest at floating rates and trade and other receivables that are not interest bearing.Cash bears interest at rates based on LIBOR.
Directors’ Report – Business Review
Directors’ Report –Governance
Financial Statements
Shareholder Information
TNS Annual Report and Accounts 2007 81
22 Financial risk management and financial instruments (continued)
Hedge accounting and hedging gains and lossesDerivatives are initially recognised at fair value on the date a derivative contract is entered into and subsequently measured at fair value. The gainor loss on re-measurement is taken to the income statement, except where the derivative is designated as a hedging instrument. The accountingtreatment for derivatives classified as hedges depends on their designation. The group designates derivatives either as a hedge of the income orcost of a highly probable forecasted transaction or commitment (cash flow hedge), as a hedge of the variability in fair value of a recognised assetor liability (fair value hedge), or a hedge of a net investment in a foreign entity. In order to qualify for hedge accounting, the group is required todocument in advance the relationship between the item being hedged and the hedging instrument. The group is also required to document therelationship between the hedged item and the hedging instrument and demonstrate that the hedge will be highly effective on an on-going basis.This effectiveness testing is re-performed at each period end, to ensure that the hedge remains highly effective.
Unrealised gains or losses on cash flow hedges that are regarded as highly effective are recognised in equity. Gains or losses deferred inequity are transferred to the income statement in the period in which the forecast transaction affects the income statement.
Gains or losses on fair value hedges are recorded in the income statement as they arise, together with any changes in fair value of the hedged item.
Where foreign currency debt is used to hedge long-term currency net investments, gains and losses on any residual net investment are takendirectly to reserves using hedge accounting. If the group uses derivatives as the hedging instrument for net investments, the effective portionof the hedge is recognised in equity, with any ineffective portion being recognised in the income statement.
Derivative financial instruments used for hedgingExcluding currency borrowings designated as net investment hedges (disclosed below) and interest rate fair value hedges (disclosed withinnet debt in note 29), the following gains and losses were accounted for using hedge accounting.
Interest rate cash Foreign currency fairflow hedge instruments value hedge instruments
2007 2006 2007 2006£m £m £m £m
Unrealised gains at 1 January 0.2 0.5 – 0.2 Interest rate hedge (losses)/gains arising in the year (0.8) 0.3 –Interest rate hedge losses/(gains) recognised in finance costs 0.4 (0.6) – –Currency hedge (losses)/gains recognised in administrative expenses – – (0.2) 0.4 Currency hedge (gains)/losses realised on settlement during the year – – 0.3 (0.6)
Unrealised (losses)/gains at 31 December (0.2) 0.2 0.1 –
Gains of £0.1m (2006 losses of £0.8m) arose in the year on the foreign currency assets and liabilities subject to the above fair value hedges.Of the £0.2m of unrecognised losses (2006 £0.2m gains) on interest rate cash flow hedges at the end of the year, a £0.1m gain (2006 £0.5mloss) is expected to be recognised in the 2008 income statement and a £0.2m loss (2006 £0.7m gain) is expected to be recognised in 2009.
Book and fair values of financial instruments The fair values of financial instruments are not materially different from their book values unless otherwise disclosed in the relevant balancesheet notes. Excluding currency borrowings designated as net investment hedges (disclosed below) and interest rate fair value hedges(disclosed within net debt in note 29), derivative instruments open at the balance sheet date are carried at the following fair values:
Assets Liabilities
2007 2006 2007 2006£m £m £m £m
Instruments held to manage interest rate exposure – cash flow hedges 1.2 0.7 (1.4) (0.5)
Instruments held to manage currency exposure – fair value hedges 0.3 0.1 (0.2) (0.1)
Currency borrowings designated as net investment hedgesThe group had both US dollar and Euro denominated borrowings at the balance sheet date, which it has designated as a hedge for the netinvestment in its subsidiaries in the US and the Eurozone. The fair value of the US dollar borrowings at 31 December 2007 was £176.3m(2006 £157.2m) and the Euro borrowings £136.7m (2006 £149.0m).
In 2007, gains and losses taken to reserves on net currency investments totalled a gain of £11.4m (2006 £10.6m loss), including net losseson foreign currency debt of £9.4m (2006 £26.0m gains).
Embedded derivativesManagement has a policy of not entering into contracts that involve embedded derivatives. The group has performed a review of contractsand has concluded that no embedded derivatives exist.
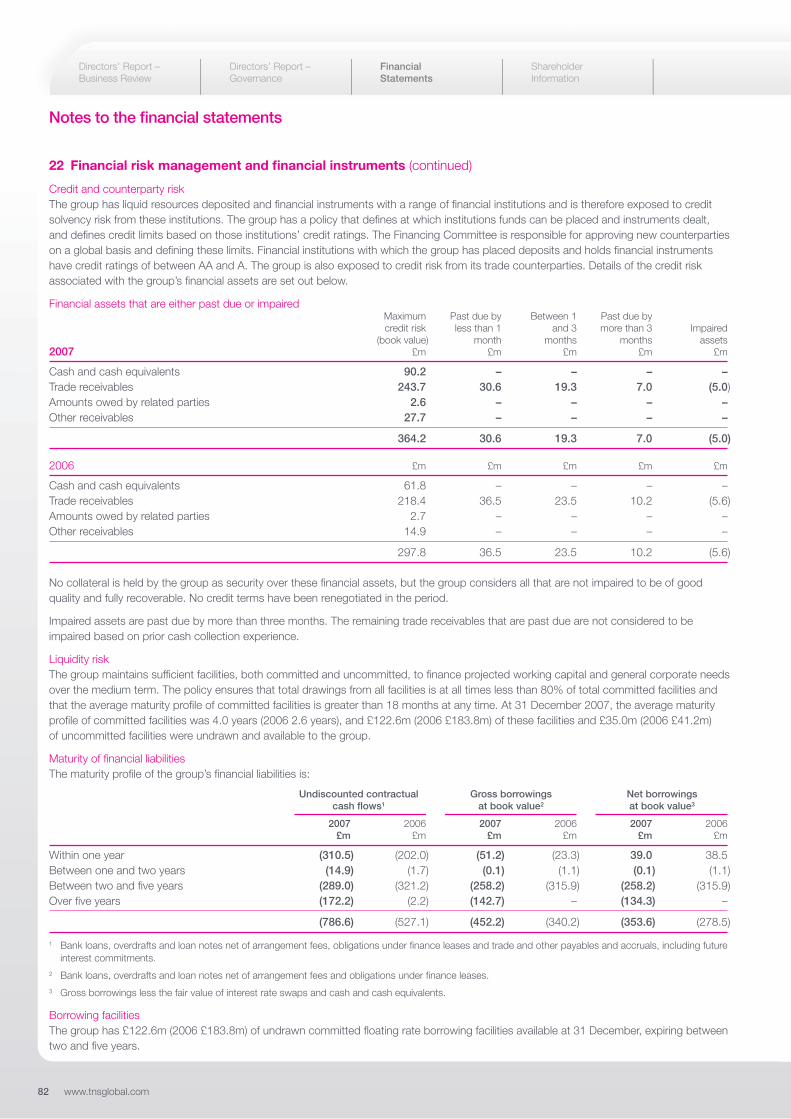
82 www.tnsglobal.com
Notes to the financial statements
22 Financial risk management and financial instruments (continued)
Credit and counterparty riskThe group has liquid resources deposited and financial instruments with a range of financial institutions and is therefore exposed to creditsolvency risk from these institutions. The group has a policy that defines at which institutions funds can be placed and instruments dealt,and defines credit limits based on those institutions’ credit ratings. The Financing Committee is responsible for approving new counterpartieson a global basis and defining these limits. Financial institutions with which the group has placed deposits and holds financial instrumentshave credit ratings of between AA and A. The group is also exposed to credit risk from its trade counterparties. Details of the credit riskassociated with the group’s financial assets are set out below.
Financial assets that are either past due or impairedMaximum Past due by Between 1 Past due bycredit risk less than 1 and 3 more than 3 Impaired
(book value) month months months assets2007 £m £m £m £m £m
Cash and cash equivalents 90.2 – – – –Trade receivables 243.7 30.6 19.3 7.0 (5.0)Amounts owed by related parties 2.6 – – – –Other receivables 27.7 – – – –
364.2 30.6 19.3 7.0 (5.0)
2006 £m £m £m £m £m
Cash and cash equivalents 61.8 – – – –Trade receivables 218.4 36.5 23.5 10.2 (5.6)Amounts owed by related parties 2.7 – – – –Other receivables 14.9 – – – –
297.8 36.5 23.5 10.2 (5.6)
No collateral is held by the group as security over these financial assets, but the group considers all that are not impaired to be of goodquality and fully recoverable. No credit terms have been renegotiated in the period.
Impaired assets are past due by more than three months. The remaining trade receivables that are past due are not considered to beimpaired based on prior cash collection experience.
Liquidity riskThe group maintains sufficient facilities, both committed and uncommitted, to finance projected working capital and general corporate needsover the medium term. The policy ensures that total drawings from all facilities is at all times less than 80% of total committed facilities andthat the average maturity profile of committed facilities is greater than 18 months at any time. At 31 December 2007, the average maturityprofile of committed facilities was 4.0 years (2006 2.6 years), and £122.6m (2006 £183.8m) of these facilities and £35.0m (2006 £41.2m)of uncommitted facilities were undrawn and available to the group.
Maturity of financial liabilitiesThe maturity profile of the group’s financial liabilities is:
Undiscounted contractual Gross borrowings Net borrowingscash flows1 at book value2 at book value3
2007 2006 2007 2006 2007 2006£m £m £m £m £m £m
Within one year (310.5) (202.0) (51.2) (23.3) 39.0 38.5 Between one and two years (14.9) (1.7) (0.1) (1.1) (0.1) (1.1)Between two and five years (289.0) (321.2) (258.2) (315.9) (258.2) (315.9)Over five years (172.2) (2.2) (142.7) – (134.3) –
(786.6) (527.1) (452.2) (340.2) (353.6) (278.5)
1 Bank loans, overdrafts and loan notes net of arrangement fees, obligations under finance leases and trade and other payables and accruals, including futureinterest commitments.
2 Bank loans, overdrafts and loan notes net of arrangement fees and obligations under finance leases.3 Gross borrowings less the fair value of interest rate swaps and cash and cash equivalents.
Borrowing facilitiesThe group has £122.6m (2006 £183.8m) of undrawn committed floating rate borrowing facilities available at 31 December, expiring betweentwo and five years.
Directors’ Report – Business Review
Directors’ Report –Governance
Financial Statements
Shareholder Information
TNS Annual Report and Accounts 2007 83
22 Financial risk management and financial instruments (continued)
Capital risk managementThe group’s objectives when managing its capital base are to safeguard the group’s ability to continue as a going concern in order to providereturns for shareholders and benefits for other stakeholders and to maintain an optimal capital structure between equity and debt to minimisethe cost of overall capital employed in the business. Consistent with others in the industry, the group monitors the capital structure byreference to the ratio of net debt to EBITDA and the gearing ratio, defined as net debt divided by total capital employed. Net debt is definedas borrowings net of arrangement fees and the fair value of interest rate swaps, and obligations under finance leases, less cash. Total capitalemployed is calculated as ‘equity’ as shown in the consolidated balance sheet plus net debt.
In 2007, the group completed the share buy back programme it initiated in 2006, through which £100.0m was returned to shareholders.In July 2007, the group significantly diversified its debt financing with the completion of the £162.7m private placement described in note 19.As a result of these activities and acquisitions made in 2007, its gearing ratio increased from 68.7% at 31 December 2006 to 75.4% at31 December 2007. Further analysis of the movement in net debt in the year is given in note 29.
23 Retirement benefit obligations
The group operates a number of pension and post-retirement benefit plans for its employees throughout the world, as well as complyingwith local laws and regulations relating to the payment of retirement benefits. The assets of all funded pension plans are held separately fromthose of the group, and full actuarial valuations are performed at least every three years. Contributions in 2008 are expected to be consistentwith 2007 levels.
UKThe pension plans in the UK are primarily defined contribution plans and the group’s contribution to such plans ranges from 4% to 8% ofsalary, rising with the age of employees. There are also two defined benefit final salary plans, which are closed to new members and futureaccruals. Independent qualified actuaries performed valuations for these in 2007 and 2006 using the projected unit method, details of whichare given below.
FranceCompanies in France participate in compulsory state arrangements. Regulations in France require that a lump sum be paid to employeeson retirement, based on their final salary and the number of years’ service. The provisions required to meet these amounts were assessedby independent qualified actuaries in 2007 and 2006 and details of their valuations are provided below.
USThe group operates both defined contribution and defined benefit final salary pension plans in the US. Unfunded post retirement healthcareand life assurance plans are also operated, which at 31 December contributed £0.7m (2006: £1.1m) to the total US defined benefit pensionobligation disclosed below. All defined benefit plans, and the healthcare and life assurance plans, have been valued by independent qualifiedactuaries in 2007 and 2006 and details are given in aggregate below.
NetherlandsThe Dutch defined benefit final salary plan operated by the group is insured, although indexation increases to pensions in payment remainthe responsibility of the company. Provision for these indexation increases is made based on actuarial assessments made by independentqualified actuaries in 2007 and 2006, using the projected unit method.
Other countriesWhere there are local arrangements to provide lump sum payments and other post employment benefits, provision has been made forthe liabilities identified based on local actuarial assessments. Details of these arrangements are given in aggregate in the following pages.

84 www.tnsglobal.com
Notes to the financial statements
23 Retirement benefit obligations (continued)
Income statementThe amounts recognised in the income statement are as follows:
UK France US Netherlands Other Total£m £m £m £m £m £m
2007Current service cost – (0.2) – (1.0) (1.0) (2.2)Curtailments and settlements – – – – – –
Total expense included in operating costs – (0.2) – (1.0) (1.0) (2.2)
Interest cost (0.1) (0.2) (0.6) (1.1) – (2.0)Expected return on assets 0.1 – 0.5 1.0 – 1.6
Total expense included in finance costs – (0.2) (0.1) (0.1) – (0.4)
2006Current service cost 0.1 (0.2) (0.1) (0.8) (1.0) (2.0)Curtailments and settlements (0.1) – – – – (0.1)
Total expense included in operating costs – (0.2) (0.1) (0.8) (1.0) (2.1)
Interest cost (0.1) (0.1) (0.7) (0.9) – (1.8)Expected return on assets 0.2 – 0.6 0.8 – 1.6
Total expense included in finance costs 0.1 (0.1) (0.1) (0.1) – (0.2)
Statement of recognised income and expenseThe amounts recognised in the statement of recognised income and expense are as follows:
UK France US Netherlands Other Total£m £m £m £m £m £m
2007Valuation gains and losses on plan assets – – 0.1 (4.7) – (4.6)Assumption gains and losses on plan liabilities 0.2 0.7 0.2 3.7 (0.7) 4.1 Experience gains and losses on plan liabilities 0.1 (0.7) (0.4) (0.8) (0.6) (2.4)
Total actuarial gains and losses 0.3 – (0.1) (1.8) (1.3) (2.9)
2006Valuation gains and losses on plan assets (0.1) – 0.1 (0.1) (0.7) (0.8)Assumption gains and losses on plan liabilities (0.2) (0.8) 0.6 0.4 1.4 1.4 Experience gains and losses on plan liabilities 0.1 (0.1) 0.6 0.1 – 0.7
Total actuarial gains and losses (0.2) (0.9) 1.3 0.4 0.7 1.3
Directors’ Report – Business Review
Directors’ Report –Governance
Financial Statements
Shareholder Information
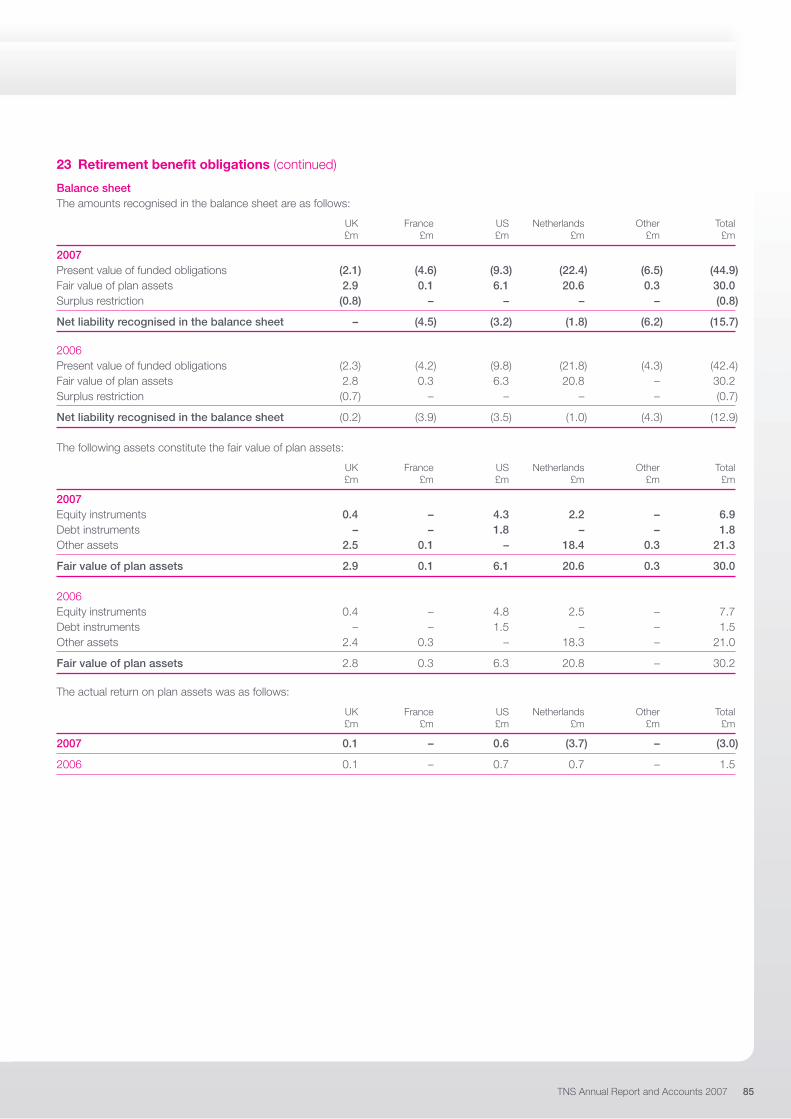
TNS Annual Report and Accounts 2007 85
23 Retirement benefit obligations (continued)
Balance sheetThe amounts recognised in the balance sheet are as follows:
UK France US Netherlands Other Total£m £m £m £m £m £m
2007Present value of funded obligations (2.1) (4.6) (9.3) (22.4) (6.5) (44.9)Fair value of plan assets 2.9 0.1 6.1 20.6 0.3 30.0 Surplus restriction (0.8) – – – – (0.8)
Net liability recognised in the balance sheet – (4.5) (3.2) (1.8) (6.2) (15.7)
2006Present value of funded obligations (2.3) (4.2) (9.8) (21.8) (4.3) (42.4)Fair value of plan assets 2.8 0.3 6.3 20.8 – 30.2 Surplus restriction (0.7) – – – – (0.7)
Net liability recognised in the balance sheet (0.2) (3.9) (3.5) (1.0) (4.3) (12.9)
The following assets constitute the fair value of plan assets:
UK France US Netherlands Other Total£m £m £m £m £m £m
2007Equity instruments 0.4 – 4.3 2.2 – 6.9Debt instruments – – 1.8 – – 1.8Other assets 2.5 0.1 – 18.4 0.3 21.3
Fair value of plan assets 2.9 0.1 6.1 20.6 0.3 30.0
2006Equity instruments 0.4 – 4.8 2.5 – 7.7 Debt instruments – – 1.5 – – 1.5 Other assets 2.4 0.3 – 18.3 – 21.0
Fair value of plan assets 2.8 0.3 6.3 20.8 – 30.2
The actual return on plan assets was as follows:
UK France US Netherlands Other Total£m £m £m £m £m £m
2007 0.1 – 0.6 (3.7) – (3.0)
2006 0.1 – 0.7 0.7 – 1.5
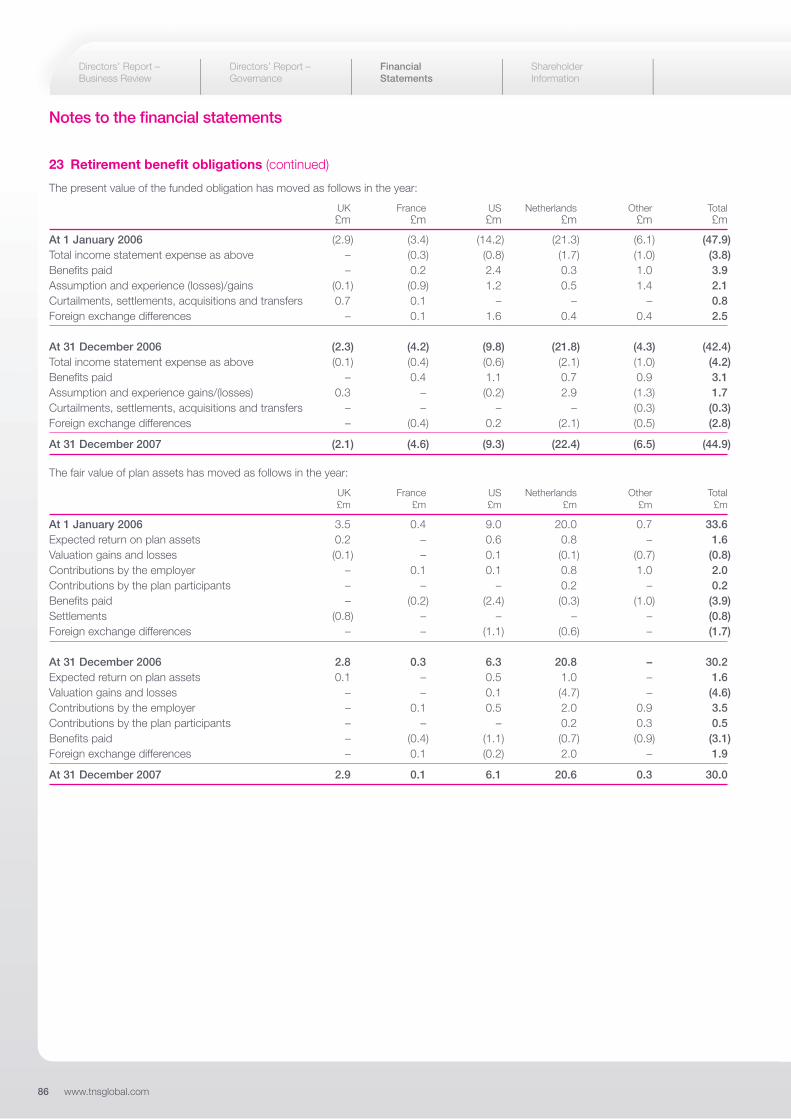
86 www.tnsglobal.com
Notes to the financial statements
23 Retirement benefit obligations (continued)
The present value of the funded obligation has moved as follows in the year:
UK France US Netherlands Other Total£m £m £m £m £m £m
At 1 January 2006 (2.9) (3.4) (14.2) (21.3) (6.1) (47.9)Total income statement expense as above – (0.3) (0.8) (1.7) (1.0) (3.8)Benefits paid – 0.2 2.4 0.3 1.0 3.9Assumption and experience (losses)/gains (0.1) (0.9) 1.2 0.5 1.4 2.1Curtailments, settlements, acquisitions and transfers 0.7 0.1 – – – 0.8 Foreign exchange differences – 0.1 1.6 0.4 0.4 2.5
At 31 December 2006 (2.3) (4.2) (9.8) (21.8) (4.3) (42.4)Total income statement expense as above (0.1) (0.4) (0.6) (2.1) (1.0) (4.2)Benefits paid – 0.4 1.1 0.7 0.9 3.1 Assumption and experience gains/(losses) 0.3 – (0.2) 2.9 (1.3) 1.7 Curtailments, settlements, acquisitions and transfers – – – – (0.3) (0.3)Foreign exchange differences – (0.4) 0.2 (2.1) (0.5) (2.8)
At 31 December 2007 (2.1) (4.6) (9.3) (22.4) (6.5) (44.9)
The fair value of plan assets has moved as follows in the year:
UK France US Netherlands Other Total£m £m £m £m £m £m
At 1 January 2006 3.5 0.4 9.0 20.0 0.7 33.6 Expected return on plan assets 0.2 – 0.6 0.8 – 1.6 Valuation gains and losses (0.1) – 0.1 (0.1) (0.7) (0.8)Contributions by the employer – 0.1 0.1 0.8 1.0 2.0 Contributions by the plan participants – – – 0.2 – 0.2 Benefits paid – (0.2) (2.4) (0.3) (1.0) (3.9)Settlements (0.8) – – – – (0.8)Foreign exchange differences – – (1.1) (0.6) – (1.7)
At 31 December 2006 2.8 0.3 6.3 20.8 – 30.2 Expected return on plan assets 0.1 – 0.5 1.0 – 1.6Valuation gains and losses – – 0.1 (4.7) – (4.6)Contributions by the employer – 0.1 0.5 2.0 0.9 3.5 Contributions by the plan participants – – – 0.2 0.3 0.5 Benefits paid – (0.4) (1.1) (0.7) (0.9) (3.1)Foreign exchange differences – 0.1 (0.2) 2.0 – 1.9
At 31 December 2007 2.9 0.1 6.1 20.6 0.3 30.0
Directors’ Report – Business Review
Directors’ Report –Governance
Financial Statements
Shareholder Information
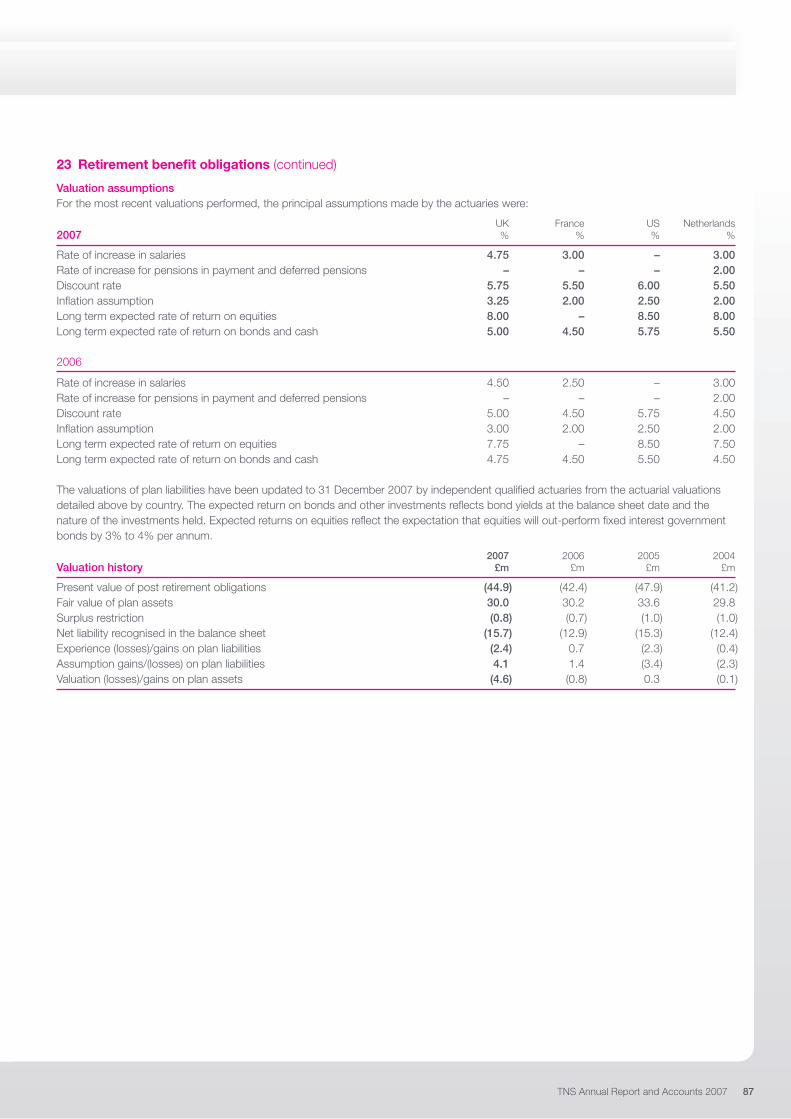
TNS Annual Report and Accounts 2007 87
23 Retirement benefit obligations (continued)
Valuation assumptionsFor the most recent valuations performed, the principal assumptions made by the actuaries were:
UK France US Netherlands2007 % % % %
Rate of increase in salaries 4.75 3.00 – 3.00Rate of increase for pensions in payment and deferred pensions – – – 2.00Discount rate 5.75 5.50 6.00 5.50Inflation assumption 3.25 2.00 2.50 2.00Long term expected rate of return on equities 8.00 – 8.50 8.00Long term expected rate of return on bonds and cash 5.00 4.50 5.75 5.50
2006
Rate of increase in salaries 4.50 2.50 – 3.00 Rate of increase for pensions in payment and deferred pensions – – – 2.00 Discount rate 5.00 4.50 5.75 4.50 Inflation assumption 3.00 2.00 2.50 2.00 Long term expected rate of return on equities 7.75 – 8.50 7.50 Long term expected rate of return on bonds and cash 4.75 4.50 5.50 4.50
The valuations of plan liabilities have been updated to 31 December 2007 by independent qualified actuaries from the actuarial valuationsdetailed above by country. The expected return on bonds and other investments reflects bond yields at the balance sheet date and thenature of the investments held. Expected returns on equities reflect the expectation that equities will out-perform fixed interest governmentbonds by 3% to 4% per annum.
2007 2006 2005 2004Valuation history £m £m £m £m
Present value of post retirement obligations (44.9) (42.4) (47.9) (41.2)Fair value of plan assets 30.0 30.2 33.6 29.8 Surplus restriction (0.8) (0.7) (1.0) (1.0)Net liability recognised in the balance sheet (15.7) (12.9) (15.3) (12.4)Experience (losses)/gains on plan liabilities (2.4) 0.7 (2.3) (0.4)Assumption gains/(losses) on plan liabilities 4.1 1.4 (3.4) (2.3)Valuation (losses)/gains on plan assets (4.6) (0.8) 0.3 (0.1)
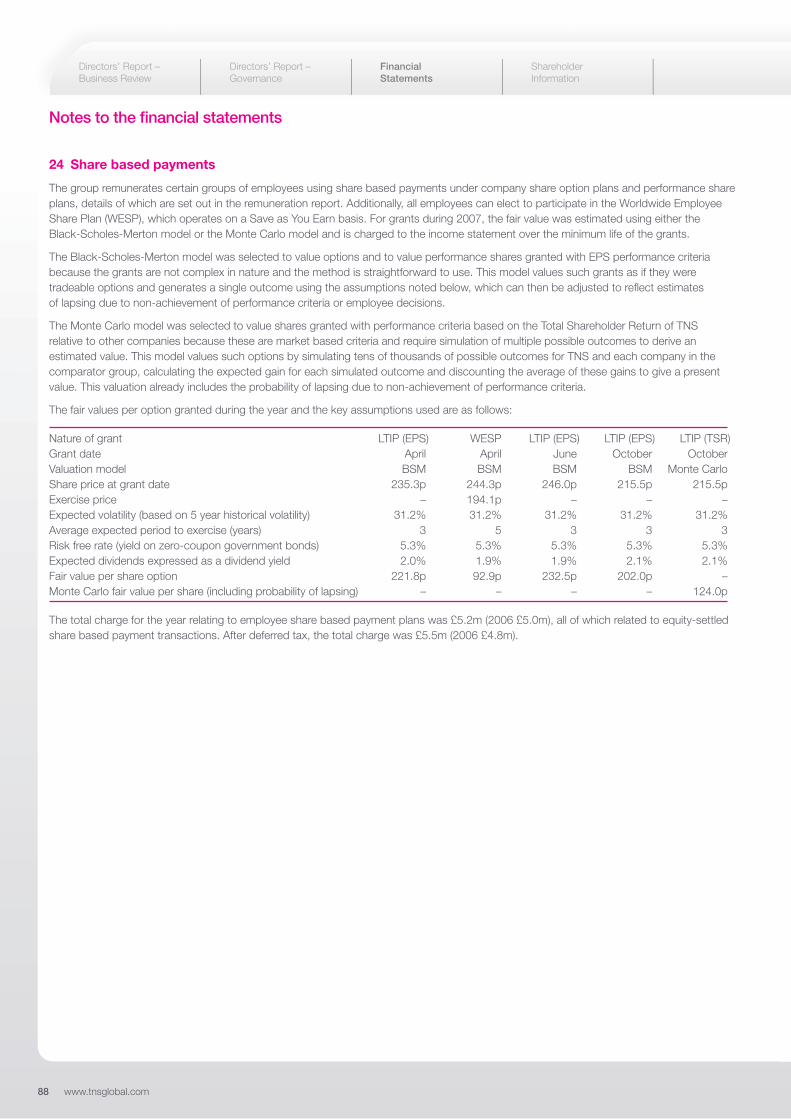
88 www.tnsglobal.com
Notes to the financial statements
24 Share based payments
The group remunerates certain groups of employees using share based payments under company share option plans and performance shareplans, details of which are set out in the remuneration report. Additionally, all employees can elect to participate in the Worldwide EmployeeShare Plan (WESP), which operates on a Save as You Earn basis. For grants during 2007, the fair value was estimated using either the Black-Scholes-Merton model or the Monte Carlo model and is charged to the income statement over the minimum life of the grants.
The Black-Scholes-Merton model was selected to value options and to value performance shares granted with EPS performance criteriabecause the grants are not complex in nature and the method is straightforward to use. This model values such grants as if they weretradeable options and generates a single outcome using the assumptions noted below, which can then be adjusted to reflect estimatesof lapsing due to non-achievement of performance criteria or employee decisions.
The Monte Carlo model was selected to value shares granted with performance criteria based on the Total Shareholder Return of TNSrelative to other companies because these are market based criteria and require simulation of multiple possible outcomes to derive anestimated value. This model values such options by simulating tens of thousands of possible outcomes for TNS and each company in thecomparator group, calculating the expected gain for each simulated outcome and discounting the average of these gains to give a presentvalue. This valuation already includes the probability of lapsing due to non-achievement of performance criteria.
The fair values per option granted during the year and the key assumptions used are as follows:
Nature of grant LTIP (EPS) WESP LTIP (EPS) LTIP (EPS) LTIP (TSR)Grant date April April June October OctoberValuation model BSM BSM BSM BSM Monte CarloShare price at grant date 235.3p 244.3p 246.0p 215.5p 215.5p Exercise price – 194.1p – – –Expected volatility (based on 5 year historical volatility) 31.2% 31.2% 31.2% 31.2% 31.2%Average expected period to exercise (years) 3 5 3 3 3Risk free rate (yield on zero-coupon government bonds) 5.3% 5.3% 5.3% 5.3% 5.3%Expected dividends expressed as a dividend yield 2.0% 1.9% 1.9% 2.1% 2.1%Fair value per share option 221.8p 92.9p 232.5p 202.0p –Monte Carlo fair value per share (including probability of lapsing) – – – – 124.0p
The total charge for the year relating to employee share based payment plans was £5.2m (2006 £5.0m), all of which related to equity-settledshare based payment transactions. After deferred tax, the total charge was £5.5m (2006 £4.8m).
Directors’ Report – Business Review
Directors’ Report –Governance
Financial Statements
Shareholder Information
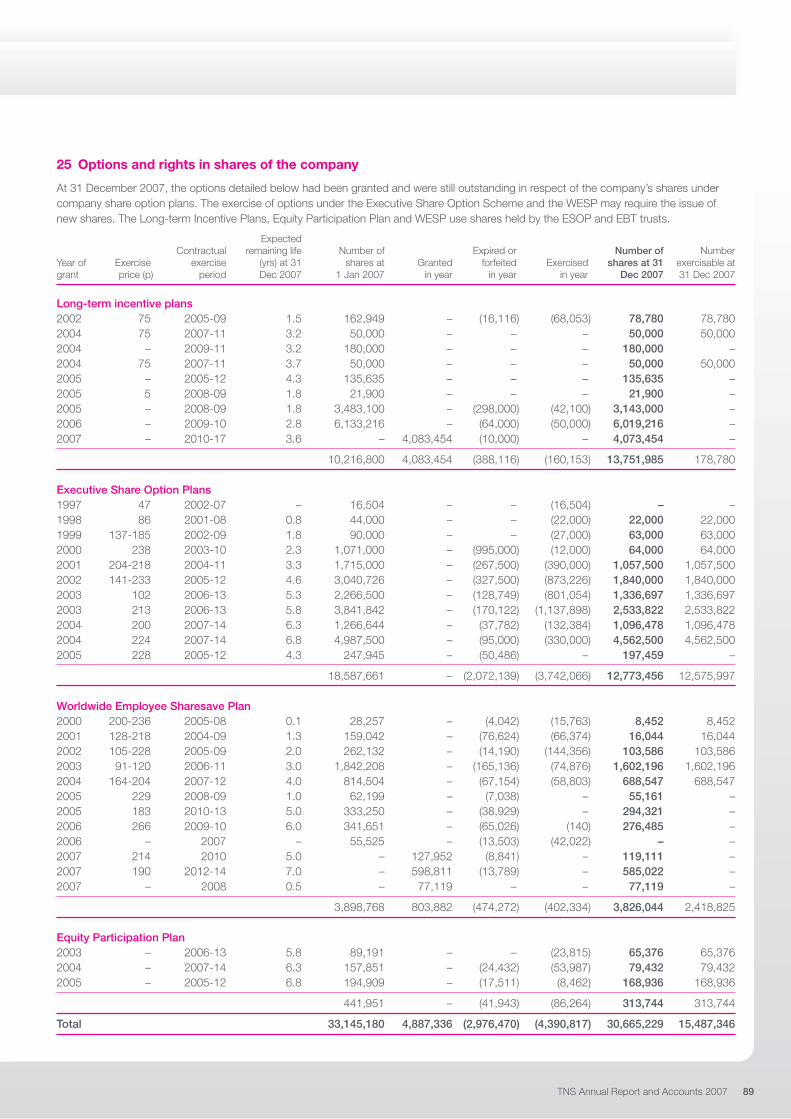
TNS Annual Report and Accounts 2007 89
25 Options and rights in shares of the company
At 31 December 2007, the options detailed below had been granted and were still outstanding in respect of the company’s shares undercompany share option plans. The exercise of options under the Executive Share Option Scheme and the WESP may require the issue ofnew shares. The Long-term Incentive Plans, Equity Participation Plan and WESP use shares held by the ESOP and EBT trusts.
ExpectedContractual remaining life Number of Expired or Number of Number
Year of Exercise exercise (yrs) at 31 shares at Granted forfeited Exercised shares at 31 exercisable atgrant price (p) period Dec 2007 1 Jan 2007 in year in year in year Dec 2007 31 Dec 2007
Long-term incentive plans2002 75 2005-09 1.5 162,949 – (16,116) (68,053) 78,780 78,780 2004 75 2007-11 3.2 50,000 – – – 50,000 50,000 2004 – 2009-11 3.2 180,000 – – – 180,000 –2004 75 2007-11 3.7 50,000 – – – 50,000 50,000 2005 – 2005-12 4.3 135,635 – – – 135,635 –2005 5 2008-09 1.8 21,900 – – – 21,900 –2005 – 2008-09 1.8 3,483,100 – (298,000) (42,100) 3,143,000 –2006 – 2009-10 2.8 6,133,216 – (64,000) (50,000) 6,019,216 –2007 – 2010-17 3.6 – 4,083,454 (10,000) – 4,073,454 –
10,216,800 4,083,454 (388,116) (160,153) 13,751,985 178,780
Executive Share Option Plans1997 47 2002-07 – 16,504 – – (16,504) – –1998 86 2001-08 0.8 44,000 – – (22,000) 22,000 22,000 1999 137-185 2002-09 1.8 90,000 – – (27,000) 63,000 63,000 2000 238 2003-10 2.3 1,071,000 – (995,000) (12,000) 64,000 64,000 2001 204-218 2004-11 3.3 1,715,000 – (267,500) (390,000) 1,057,500 1,057,500 2002 141-233 2005-12 4.6 3,040,726 – (327,500) (873,226) 1,840,000 1,840,000 2003 102 2006-13 5.3 2,266,500 – (128,749) (801,054) 1,336,697 1,336,697 2003 213 2006-13 5.8 3,841,842 – (170,122) (1,137,898) 2,533,822 2,533,822 2004 200 2007-14 6.3 1,266,644 – (37,782) (132,384) 1,096,478 1,096,478 2004 224 2007-14 6.8 4,987,500 – (95,000) (330,000) 4,562,500 4,562,500 2005 228 2005-12 4.3 247,945 – (50,486) – 197,459 –
18,587,661 – (2,072,139) (3,742,066) 12,773,456 12,575,997
Worldwide Employee Sharesave Plan2000 200-236 2005-08 0.1 28,257 – (4,042) (15,763) 8,452 8,452 2001 128-218 2004-09 1.3 159,042 – (76,624) (66,374) 16,044 16,044 2002 105-228 2005-09 2.0 262,132 – (14,190) (144,356) 103,586 103,5862003 91-120 2006-11 3.0 1,842,208 – (165,136) (74,876) 1,602,196 1,602,1962004 164-204 2007-12 4.0 814,504 – (67,154) (58,803) 688,547 688,5472005 229 2008-09 1.0 62,199 – (7,038) – 55,161 –2005 183 2010-13 5.0 333,250 – (38,929) – 294,321 –2006 266 2009-10 6.0 341,651 – (65,026) (140) 276,485 –2006 – 2007 – 55,525 – (13,503) (42,022) – –2007 214 2010 5.0 – 127,952 (8,841) – 119,111 –2007 190 2012-14 7.0 – 598,811 (13,789) – 585,022 –2007 – 2008 0.5 – 77,119 – – 77,119 –
3,898,768 803,882 (474,272) (402,334) 3,826,044 2,418,825
Equity Participation Plan2003 – 2006-13 5.8 89,191 – – (23,815) 65,376 65,376 2004 – 2007-14 6.3 157,851 – (24,432) (53,987) 79,432 79,432 2005 – 2005-12 6.8 194,909 – (17,511) (8,462) 168,936 168,936
441,951 – (41,943) (86,264) 313,744 313,744
Total 33,145,180 4,887,336 (2,976,470) (4,390,817) 30,665,229 15,487,346
90 www.tnsglobal.com
Notes to the financial statements
25 Options and rights in shares of the company (continued)
At 31 December 2007, the ESOP trust held 0.2m (2006 0.2m) ordinary 5p shares in the company. Of those, nil (2006 nil) have had optionsgranted over them under the Long-term Incentive Plan. At 31 December 2007, the EBT held 4.0m (2006 4.4m) ordinary 5p shares in thecompany. Of those, 0.5m (2006 0.6m) have had rights granted over them under the Long-term Incentive Plan and a further 1.2m (2006 1.4m)under other plans. Shares over which options have not yet been granted had a market value at 31 December 2007 of £4.8m (2006 £5.4m).Shares held through the ESOP trust are shown as a deduction in arriving at shareholders’ funds, which have thereby been reduced by £4.8m(2006 £5.4m). Profits or losses arising on the disposal of shares following the exercise of share options relating to the EBT are taken to otherreserves in the consolidated financial statements.
Options exercised in 2007 resulted in 4,385,299 shares being issued at £1.75 each (2006 4,211,836 shares at £1.26 each). The relatedweighted average price at the time of exercise was £2.41 (2006 £2.46) per share.
26 Share capital2007 2006 2007 2006
No of shares No of shares £’000 £’000
AuthorisedOrdinary shares of 5p each 600,000,000 600,000,000 30,000 30,000
Allotted, called up and fully paidAt 1 January 442,827,989 447,934,240 22,141 22,397 Acquisitions – 820,312 – 41 Share options exercised during yearExecutive Share Plans 3,742,066 3,387,802 187 169 Savings Related Share Plans – 41,368 – 2 WESP 356,532 644,267 18 32 Shares held in treasury cancelled (17,663,105) (10,000,000) (883) (500)
At 31 December 429,263,482 442,827,989 21,463 22,141
The company issued 820,312 shares during 2006 to satisfy £2.1m of deferred consideration in relation to the purchase of Area Investigacion,a subsidiary in Spain. No similar issue was made in 2007. Since 31 December 2007, no shares have been issued to employees on theexercise of options granted under the Executive Share Option Scheme, and 57,425 shares have been issued to employees on the exerciseof options under the WESP.
During the year the company purchased 28,444,805 of its own shares from the market for cash consideration of £65.2m (2006 16,758,689shares for £34.8m) (see note 27). Of these, 17,663,105 shares were cancelled and the remaining 10,781,700 are held as treasury sharesat 31 December 2007 (2006 6,758,689). In total, the company held 17,540,389 of its own shares in treasury at 31 December 2007(2006 6,758,689).
Directors’ Report – Business Review
Directors’ Report –Governance
Financial Statements
Shareholder Information

TNS Annual Report and Accounts 2007 91
27 Statements of changes in shareholders’ equityShare Share Other Retained Minority Total
capital premium reserves earnings Total interests equityGroup £m £m £m £m £m £m £m
At 1 January 2006 22.4 126.7 1.8 (18.6) 132.3 10.0 142.3 Profit for the year – – – 37.1 37.1 2.8 39.9Actuarial losses on pensions net of tax – – – 1.1 1.1 – 1.1Currency translation differences net of tax – – – (10.7) (10.7) 0.1 (10.6)Marked-to-market gain in fair value of financial instruments – – – 0.3 0.3 – 0.3Financial instrument fair value taken to income statement – – – (0.6) (0.6) – (0.6)Minority interests in acquisitions – – – – – 0.6 0.6Minority interests purchased – – – – – (2.6) (2.6)Minority interest dividends – – – – – (2.7) (2.7)New share capital issued net of expenses 0.2 7.5 – – 7.7 – 7.7Purchase of own shares – – – (34.8) (34.8) – (34.8)Treasury shares cancelled (0.5) – 0.5 – – – – Net proceeds on exercise of options – – (1.9) 1.8 (0.1) – (0.1)Share based payments – – – 5.0 5.0 – 5.0Equity dividends – – – (18.4) (18.4) – (18.4)
At 31 December 2006 22.1 134.2 0.4 (37.8) 118.9 8.2 127.1 Profit for the year – – – 56.3 56.3 2.2 58.5Actuarial losses on pensions net of tax – – – (2.1) (2.1) – (2.1)Currency translation differences net of tax – – – 11.0 11.0 0.4 11.4Marked-to-market loss in fair value of financial instruments – – – (0.8) (0.8) – (0.8)Financial instrument fair value taken to income statement – – – 0.4 0.4 – 0.4Minority interests in acquisitions – – – – – 0.1 0.1Minority interests purchased – – – – – (1.2) (1.2)Minority interest dividends – – – – – (1.9) (1.9)Potential acquisition of minority interests – – – (4.4) (4.4) – (4.4)New share capital issued net of expenses 0.2 7.3 – – 7.5 – 7.5Purchase of own shares – – – (65.2) (65.2) – (65.2)Treasury shares cancelled (0.8) – 0.8 – – – –Net proceeds on exercise of options – – 0.1 0.5 0.6 – 0.6 Share based payments – – – 5.2 5.2 – 5.2Equity dividends – – – (20.1) (20.1) – (20.1)
At 31 December 2007 21.5 141.5 1.3 (57.0) 107.3 7.8 115.1
At 1 Jan Movements in At 31 Dec2007 the year 2007
Cumulative amounts included within retained earnings £m £m £m
Currency translation differences (12.6) 11.0 (1.6)Financial instrument fair value adjustments 0.2 (0.4) (0.2)Potential acquisition of minority interests (note 20) – (4.4) (4.4)Pension valuation gains and losses (6.9) (2.9) (9.8)Own shares held in treasury and Trust (40.2) (64.6) (104.8)Share based payment charges 12.1 5.2 17.3
Goodwill arising on consolidation prior to 1 January 1998 of £144.7m (2006 £144.7m) has been eliminated against reserves.
Other reserves include amounts transferred from share capital on the cancellation of shares, and gains and losses recognised on theutilisation of own shares held at cost to satisfy exercised options. A merger reserve in the company which arose in prior years on the issueof shares as consideration for acquisitions has been offset against retained earnings on consolidation.
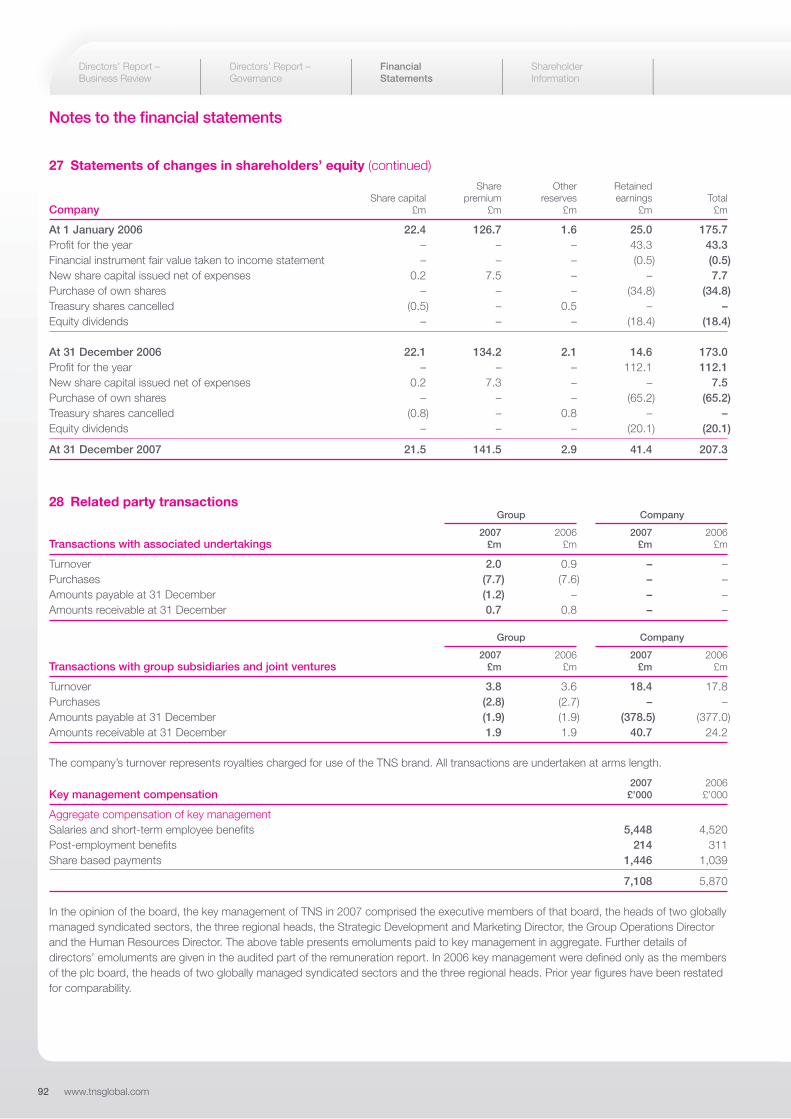
92 www.tnsglobal.com
Notes to the financial statements
27 Statements of changes in shareholders’ equity (continued)Share Other Retained
Share capital premium reserves earnings TotalCompany £m £m £m £m £m
At 1 January 2006 22.4 126.7 1.6 25.0 175.7 Profit for the year – – – 43.3 43.3Financial instrument fair value taken to income statement – – – (0.5) (0.5)New share capital issued net of expenses 0.2 7.5 – – 7.7Purchase of own shares – – – (34.8) (34.8)Treasury shares cancelled (0.5) – 0.5 – –Equity dividends – – – (18.4) (18.4)
At 31 December 2006 22.1 134.2 2.1 14.6 173.0 Profit for the year – – – 112.1 112.1New share capital issued net of expenses 0.2 7.3 – – 7.5Purchase of own shares – – – (65.2) (65.2)Treasury shares cancelled (0.8) – 0.8 – –Equity dividends – – – (20.1) (20.1)
At 31 December 2007 21.5 141.5 2.9 41.4 207.3
28 Related party transactionsGroup Company
2007 2006 2007 2006Transactions with associated undertakings £m £m £m £m
Turnover 2.0 0.9 – – Purchases (7.7) (7.6) – – Amounts payable at 31 December (1.2) – – – Amounts receivable at 31 December 0.7 0.8 – –
Group Company
2007 2006 2007 2006Transactions with group subsidiaries and joint ventures £m £m £m £m
Turnover 3.8 3.6 18.4 17.8 Purchases (2.8) (2.7) – – Amounts payable at 31 December (1.9) (1.9) (378.5) (377.0)Amounts receivable at 31 December 1.9 1.9 40.7 24.2
The company’s turnover represents royalties charged for use of the TNS brand. All transactions are undertaken at arms length.
2007 2006Key management compensation £’000 £’000
Aggregate compensation of key managementSalaries and short-term employee benefits 5,448 4,520 Post-employment benefits 214 311 Share based payments 1,446 1,039
7,108 5,870
In the opinion of the board, the key management of TNS in 2007 comprised the executive members of that board, the heads of two globallymanaged syndicated sectors, the three regional heads, the Strategic Development and Marketing Director, the Group Operations Directorand the Human Resources Director. The above table presents emoluments paid to key management in aggregate. Further details ofdirectors’ emoluments are given in the audited part of the remuneration report. In 2006 key management were defined only as the membersof the plc board, the heads of two globally managed syndicated sectors and the three regional heads. Prior year figures have been restatedfor comparability.
Directors’ Report – Business Review
Directors’ Report –Governance
Financial Statements
Shareholder Information
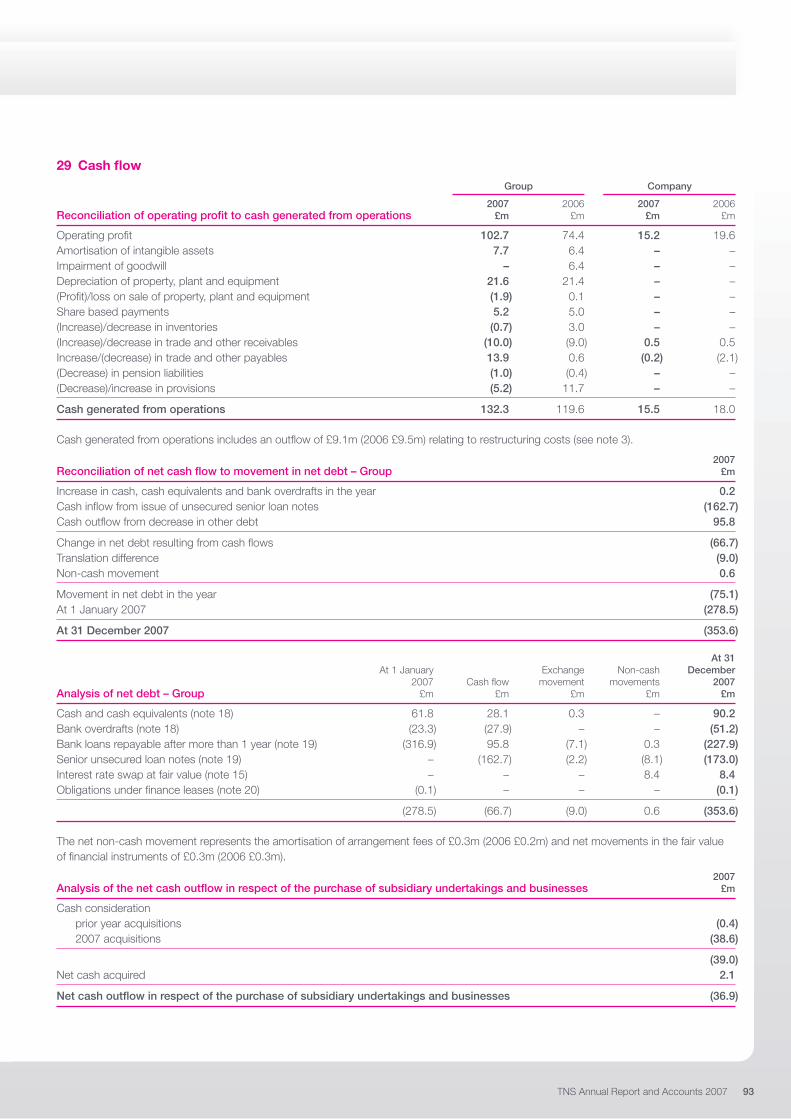
TNS Annual Report and Accounts 2007 93
29 Cash flowGroup Company
2007 2006 2007 2006Reconciliation of operating profit to cash generated from operations £m £m £m £m
Operating profit 102.7 74.4 15.2 19.6 Amortisation of intangible assets 7.7 6.4 – – Impairment of goodwill – 6.4 – – Depreciation of property, plant and equipment 21.6 21.4 – – (Profit)/loss on sale of property, plant and equipment (1.9) 0.1 – – Share based payments 5.2 5.0 – – (Increase)/decrease in inventories (0.7) 3.0 – – (Increase)/decrease in trade and other receivables (10.0) (9.0) 0.5 0.5 Increase/(decrease) in trade and other payables 13.9 0.6 (0.2) (2.1)(Decrease) in pension liabilities (1.0) (0.4) – – (Decrease)/increase in provisions (5.2) 11.7 – –
Cash generated from operations 132.3 119.6 15.5 18.0
Cash generated from operations includes an outflow of £9.1m (2006 £9.5m) relating to restructuring costs (see note 3).
2007Reconciliation of net cash flow to movement in net debt – Group £m
Increase in cash, cash equivalents and bank overdrafts in the year 0.2 Cash inflow from issue of unsecured senior loan notes (162.7)Cash outflow from decrease in other debt 95.8
Change in net debt resulting from cash flows (66.7)Translation difference (9.0)Non-cash movement 0.6
Movement in net debt in the year (75.1)At 1 January 2007 (278.5)
At 31 December 2007 (353.6)
At 31At 1 January Exchange Non-cash December
2007 Cash flow movement movements 2007Analysis of net debt – Group £m £m £m £m £m
Cash and cash equivalents (note 18) 61.8 28.1 0.3 – 90.2Bank overdrafts (note 18) (23.3) (27.9) – – (51.2)Bank loans repayable after more than 1 year (note 19) (316.9) 95.8 (7.1) 0.3 (227.9)Senior unsecured loan notes (note 19) – (162.7) (2.2) (8.1) (173.0)Interest rate swap at fair value (note 15) – – – 8.4 8.4Obligations under finance leases (note 20) (0.1) – – – (0.1)
(278.5) (66.7) (9.0) 0.6 (353.6)
The net non-cash movement represents the amortisation of arrangement fees of £0.3m (2006 £0.2m) and net movements in the fair valueof financial instruments of £0.3m (2006 £0.3m).
2007Analysis of the net cash outflow in respect of the purchase of subsidiary undertakings and businesses £m
Cash considerationprior year acquisitions (0.4)2007 acquisitions (38.6)
(39.0)Net cash acquired 2.1
Net cash outflow in respect of the purchase of subsidiary undertakings and businesses (36.9)

94 www.tnsglobal.com
Notes to the financial statements
30 Financial commitments2007 2006
Property Equipment Property EquipmentTotal lease commitments £m £m £m £m
Operating leases payableWithin one year 29.2 3.0 25.7 2.4 In two to five years 46.5 2.9 46.6 2.3 Over five years 10.1 0.1 12.5 0.1
85.8 6.0 84.8 4.8
The group leases various assets under non-cancellable operating leases. The leases have various terms, escalation clauses and renewalrights. There are no obligations contracted but not provided for in the group or company (2006 nil).
31 Guarantees and contingent liabilities
Contingent liabilities relating to acquisitionsThe group is contractually bound to pay contingent deferred consideration for certain current and prior year acquisitions, based on thefuture performance of those acquired businesses. Liabilities have been recognised based on management’s best estimates of futureamounts payable, where such estimates can be made reliably (see note 21). For certain acquisitions made in 2007, deferred considerationonly becomes payable if significant performance improvements are acheived, in which case the amount payable is sensitive to the level ofimprovement achieved. In these cases, until the level of future performance improvement becomes more certain, management are unableto make a reliable estimate of future amounts payable, and no deferred consideration liability has been recognised. The maximum contingentdeferred consideration payable for these acquisitions is £48.1m (2006 £nil), but management considers that there is only a remote possibilityof future payments approaching this level. Amounts become payable between two and five years and any adjustment to deferredconsideration as a result of revised estimates or final settlement will be recorded to goodwill.
Other guarantees and contingent liabilitiesThe company and certain subsidiary undertakings have jointly and severally guaranteed bank loans and credit facilities of the group. Themaximum liabilities that could arise under these arrangements are £350.0m (2006 £500.0m). At 31 December 2007, amounts outstandingwere £227.4m (2006 £315.7m). A number of group companies have provided guarantees relating to rental commitments and commercialcontracts in the normal course of business. At 31 December 2007, the total amounts guaranteed were £6.4m (2006 £6.6m).
Various group companies are parties to legal actions and claims of £0.9m (2006 £0.9m), the most significant of which are associated withemployment-related matters. Although there is uncertainty regarding the final outcome of these claims, the directors believe that adequateprovision has been made for anticipated liabilities. The group is also involved in various other legal proceedings arising out of the normalcourse of business. Management believe that the outcome of these proceedings is uncertain but is unlikely to have a material effect onthe group’s financial position.
32 Post balance sheet events
On 11 January 2008, the group announced the acquisition of MediaWatch Limited (MediaMarket), a media intelligence business in theRepublic of Ireland, with gross assets of £4.8m. On 31 January 2008, the group completed the acquisition of LatinPanel International Ltd,a continuous consumer panel business serving Latin America with gross assets of £4.5m, which at 31 December 2007 was 33% ownedand accounted for as a joint venture. On 29 February 2008, the group agreed to acquire Compete, Inc., a leading digital intelligencecompany based in the United States with gross assets of £5.6m, for initial consideration of £37.7m.
Directors’ Report – Business Review
Directors’ Report –Governance
Financial Statements
Shareholder Information
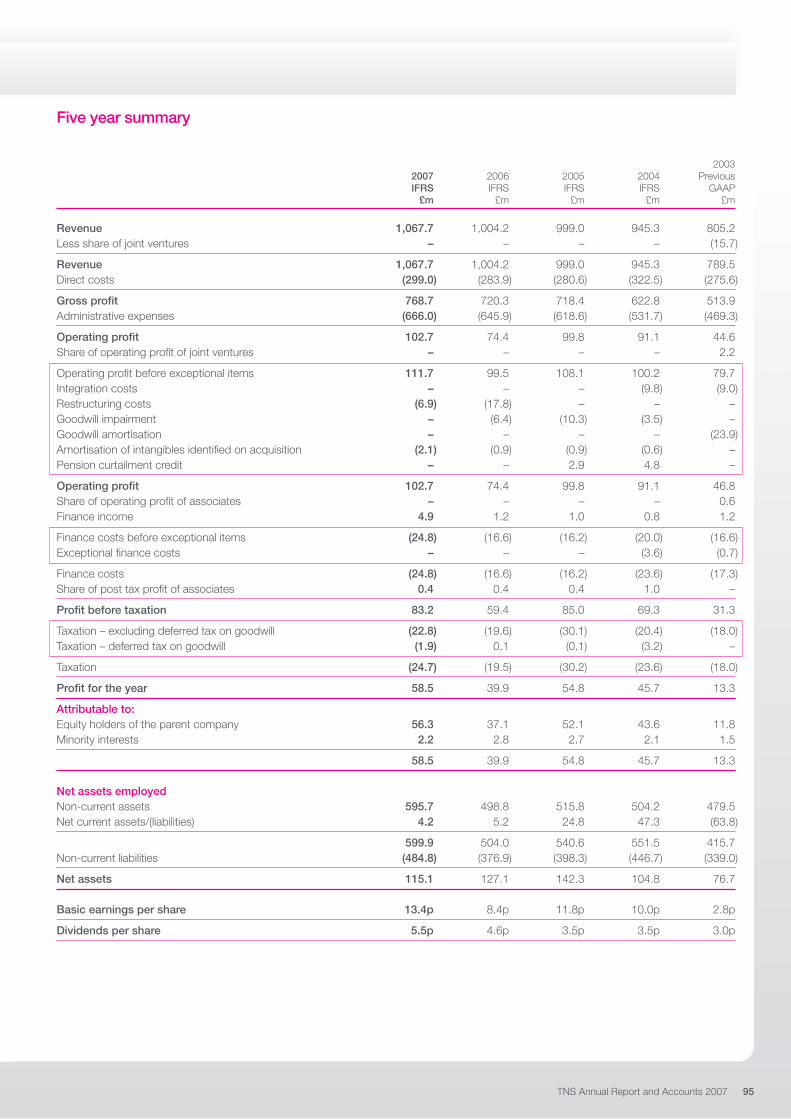
TNS Annual Report and Accounts 2007 95
Five year summary
20032007 2006 2005 2004 Previous IFRS IFRS IFRS IFRS GAAP
£m £m £m £m £m
Revenue 1,067.7 1,004.2 999.0 945.3 805.2 Less share of joint ventures – – – – (15.7)
Revenue 1,067.7 1,004.2 999.0 945.3 789.5 Direct costs (299.0) (283.9) (280.6) (322.5) (275.6)
Gross profit 768.7 720.3 718.4 622.8 513.9 Administrative expenses (666.0) (645.9) (618.6) (531.7) (469.3)
Operating profit 102.7 74.4 99.8 91.1 44.6 Share of operating profit of joint ventures – – – – 2.2
Operating profit before exceptional items 111.7 99.5 108.1 100.2 79.7 Integration costs – – – (9.8) (9.0)Restructuring costs (6.9) (17.8) – – –Goodwill impairment – (6.4) (10.3) (3.5) –Goodwill amortisation – – – – (23.9)Amortisation of intangibles identified on acquisition (2.1) (0.9) (0.9) (0.6) –Pension curtailment credit – – 2.9 4.8 –
Operating profit 102.7 74.4 99.8 91.1 46.8 Share of operating profit of associates – – – – 0.6 Finance income 4.9 1.2 1.0 0.8 1.2
Finance costs before exceptional items (24.8) (16.6) (16.2) (20.0) (16.6)Exceptional finance costs – – – (3.6) (0.7)
Finance costs (24.8) (16.6) (16.2) (23.6) (17.3)Share of post tax profit of associates 0.4 0.4 0.4 1.0 –
Profit before taxation 83.2 59.4 85.0 69.3 31.3
Taxation – excluding deferred tax on goodwill (22.8) (19.6) (30.1) (20.4) (18.0)Taxation – deferred tax on goodwill (1.9) 0.1 (0.1) (3.2) –
Taxation (24.7) (19.5) (30.2) (23.6) (18.0)
Profit for the year 58.5 39.9 54.8 45.7 13.3
Attributable to:Equity holders of the parent company 56.3 37.1 52.1 43.6 11.8 Minority interests 2.2 2.8 2.7 2.1 1.5
58.5 39.9 54.8 45.7 13.3
Net assets employedNon-current assets 595.7 498.8 515.8 504.2 479.5 Net current assets/(liabilities) 4.2 5.2 24.8 47.3 (63.8)
599.9 504.0 540.6 551.5 415.7 Non-current liabilities (484.8) (376.9) (398.3) (446.7) (339.0)
Net assets 115.1 127.1 142.3 104.8 76.7
Basic earnings per share 13.4p 8.4p 11.8p 10.0p 2.8p
Dividends per share 5.5p 4.6p 3.5p 3.5p 3.0p
96 www.tnsglobal.com
Information for shareholders
Latest informationThe group’s website address is www.tnsglobal.com. Groupannouncements and webcasts of financial presentations are postedon the Investor Centre on the day of release. To register for alertswhen announcements are published on the website and for receiptof company reports, go to ‘IR email updates’ on the Investor Centrehome page. Other information of interest to investors, including theshare price, can also be found there.
Contact detailsFor investor enquiries, please contact:Janis ParksHead of Investor Relations Taylor Nelson Sofres plc TNS House Westgate London W5 1UATel +44 (0)20 8967 1584Fax +44 (0)20 8967 1386Email: [email protected]
RegistrarThe company’s registrar, Computershare Investor Services, has awebsite containing a range of information, which can be accessedvia the Investor Centre at www.tnsglobal.com or by email [email protected].
Computershare has a dedicated phone line for Taylor NelsonSofres plc – 0870 707 1367. Shareholders have the option togain automatic access to detailed information or speak to ahelpline assistant.
Otherwise please write to:Computershare Investor Services PLCP O Box 82 The Pavilions Bridgwater RoadBristol BS99 7NH
All correspondence should refer to Taylor Nelson Sofres plc andinclude the registered name and address of the shareholder.
Electronic communicationsTNS can provide electronic notification when its annual report andnotices of general meeting are posted on to the group’s website.To register for this free service, go to the Computershare website,details above.
American Depositary Receipts (ADRs)Taylor Nelson Sofres plc has a sponsored Level 1 AmericanDepository Receipt (ADR) program, for which The Bank of New YorkMellon acts as Depository. A Level 1 ADR program is not listed on aUS stock exchange and trades in the over-the-counter (OTC) market.The ADR trading symbol is TYNLY and price quotes can be obtainedfrom www.adrbny.com. One ADR represents 4 ordinary shares.
When dividends are paid to shareholders, the Depository makesthe equivalent payment in US dollars to ADR holders. For ADRshareholder enquiries, please contact:
Shareholder Relations The Bank of New York Mellon PO Box 11248 Church Street Station New York, NY 10286-1258 USA Tel +1 215 815 3700From the USA 1-888-BNY-ADRS (toll free)Email: [email protected]: www.adrbny.com
Annual general meeting (AGM)The AGM will be held at midday on 7 May 2008 at Taylor NelsonSofres plc, TNS House, Westgate, London W5 1UA.
Financial calendar 20083 March 2007 results announced11 April Interim management statement21 May Ex-dividend date23 May Final dividend record date4 July Final dividend payable11 July Trading update29 August 2008 interim results announcedOctober Interim management statement
AdvisersAuditorsPricewaterhouseCoopers LLP1 Embankment PlaceLondon WC2N 6RHTel +44 (0)20 7583 5000
StockbrokersDeutsche Bank AG London1 Great Winchester StreetLondon EC2N 2DBTel +44 (0)20 7545 8000
JPMorgan Cazenove20 MoorgateLondon EC2R 6DATel +44 (0)20 7588 2828
Head and registered officeTaylor Nelson Sofres plcTNS HouseWestgateLondonW5 1UATel +44 (0)20 8967 0007Fax +44 (0)20 8967 4060
Registered number 912624
BankersThe Royal Bank of Scotland plcCorporate Banking8th Floor135 BishopsgateLondon EC2M 3URTel +44 (0)20 7085 8943
Financial advisersDeutsche Bank AG London1 Great Winchester StreetLondon EC2N 2DBTel +44 (0)20 7545 8000
Directors’ Report – Business Review
Directors’ Report –Governance
Financial Statements
Shareholder Information
www.tnsglobal.com/investors�

Designed by Black Sun Plc
Printed in the UK by Beacon Press, a CarbonNeutral® printer, on paper sourced from a mill that is certified to the ISO14001 environ-mental management standard and certified to the EMAS environmentalmanagement standard. The paper is from an FSC Mixed Sources prod-uct group from well managed forests and other controlled sources. Thepaper pulp is bleached using Totally Chlorine Free (TCF) and ElementalChlorine Free (ECF) processes. This document is fully recyclable.
Visit us at: www.tnsglobal.com
TNS’ website provides detailed further informationon the group, including our industry focus, our ex-pertise and our locations around the world. The siteis regularly updated with videos, blogs and pointsof view from our thought leaders across TNS’ globalnetwork, as well as latest investor news and currentshare price information.

� www.tnsglobal.com
Taylor Nelson Sofres plcTNS HouseWestgateLondon W5 1UAUnited Kingdom
Tel +44 (0)20 8967 0007Fax +44 (0)20 8967 4060