shall we dense? / save: my life - irbnet.de · shall we dense? / save: my life simon mcpherson ......
TRANSCRIPT

Shall we Dense? / Save: My Life
Simon McPhersonDirectorSJB Urban Australia [email protected]
Adam HaddowDirectorSJB Architects Australia [email protected]
Summary
This paper comprises two main parts. The Research component describes the purpose, process and outcomes of an analytical study of urban planning policy and various city locations, to identify strategic directions towards more efficient, equitable and sustainable urban development. The second, Application component describes a proposed interactive tool for guiding these outcomes, from a consumer preference viewpoint, rather than through policy action.
Keywords: Density, urban design, planning, housing, app, policy, dwelling, sprawl, suburb, compact

1. Research component – “Shall we Dense?”
The research component of this project is aimed at establishing, and communicating, a comprehensive understanding of development patterns, residential density, and the implications for achieving policy aspirations and sustainable urban form, relevant to Australian cities.
1.1 The context of major Australian cities
Australian cities are experiencing unprecedented population growth, with over 1500 people moving into Melbourne each week. Housing price levels are among the highest in the developed world, and transport systems and other infrastructures are under increasing strain.
This growth is driving significant higher-density development in central, well-serviced locations, coupled with significant resistance to change in established, ‘middle-ring’ suburbs. There remains a strong commitment to, and demand for, new suburban, low-density ‘sprawl’ development, often regarded as a strategy to address housing shortages and affordability issues, and resulting in an ever-expanding metropolitan area. Melbourne is approaching an expanse of 100km from east to west.
This pattern is similar in other major Australia cities, with some localised variation.
Australian cities, like many American cities, reflect the shift towards car-based transport and development patterns from around the 1960s. Inner- and middle- urban areas (within 10-15km of the city centre) display predominantly grid-based street layouts, extensive medium- and higher-density development (multi-unit residential developments), and a dense network of local, accessible urban centres, with good transport services.
The outer suburbs (15-50+km from the city centre), however, are highly dispersed, vastly dominated by single detached dwellings on individual lots, irregular and fragmented street patterns, and a general lack of local urban centres.
These areas are highly dependent on car-based transport. Public transport services are more dispersed and less frequent, and walking and cycling are discouraged, by lack of appropriate infrastructure, and significant distances to destinations.
As evidenced by recent events, Australian cities and towns are highly exposed to severe weather events. Severe drought and water shortages, bushfires, severe storms and dramatic flood events in recent months and years have caused many fatalities and extensive damage. These events are expected to continue to increase in frequency and impact due to climate change.
1.2 Policy context
In 2002, the Victorian State Government launched the metropolitan strategy Melbourne 2030 [1], establishing a range of initiatives to guide our urban response to projected population growth over 30 years and to limit outward urban sprawl, including urban consolidation in existing Activity Centres and large redevelopment sites, and planned suburban development in identified growth corridors.
An Urban Growth Boundary was established, but has been moved outwards multiple times to allow for further greenfield land supply, generally in response to the prominent argument linking land supply with housing affordability and responding to population growth. In 2010 an additional 43,600 hectares of land was brought inside the boundary.
Melbourne 2030 called for a new approach to suburban development, establishing clustered neighbourhoods which provide walkable access to local facilities and services, reducing reliance on automobiles.
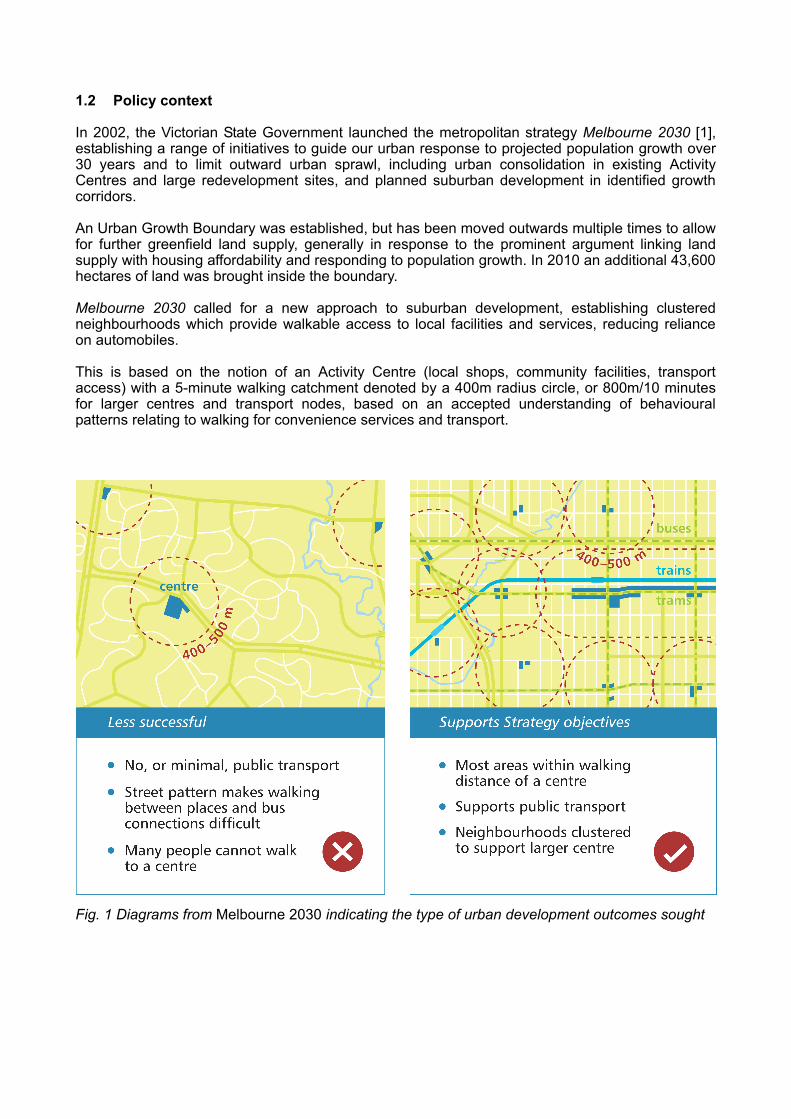
This is based on the notion of an Activity Centre (local shops, community facilities, transport access) with a 5-minute walking catchment denoted by a 400m radius circle, or 800m/10 minutes for larger centres and transport nodes, based on an accepted understanding of behavioural patterns relating to walking for convenience services and transport.
[Image: Melbourne 2030 diagrams]
Fig. 1 Diagrams from Melbourne 2030 indicating the type of urban development outcomes sought
However the Melbourne 2030 Strategy also suggested that in new growth areas, a general increase in residential density to approximately 15 dwellings per hectare should be achieved. The link between this modest density aim, and the objective for walkable and serviceable neighbourhoods, was never fully explored or tested.
Perth’s Liveable Neighbourhoods policy [2] similarly suggests a minimum net density of 15 dwellings per hectare in new urban areas, suggesting that this will approximately support the minimum size urban centre to support walkable neighbourhoods.
Sydney is more spatially constrained than Melbourne and Perth, located between the ocean and a mountain range. Its’ new Metropolitan Plan for Sydney 2036 [3] suggests that all centres would have a minimum level of medium density (defined as 25-60 dw/ha), with low density (less that 25 dw/ha) reserved for heritage or physically constrained areas, and higher density (greater than 60 dw/ha) around larger centres.
In 2009, the Victorian Growth Areas Authority, responsible for planning and initiating development in the growth corridors, launched the Precinct Structure Planning Guidelines [4] for Melbourne’s growth areas. This document also suggests a density aim of 15 dwellings per hectare.
1.3 People need services / services need people: understanding the links between density and accessibility
A key tenet of sustainable urban planning and design is supporting the viable provision of facilities and services (shops, community and health facilities, public transport, schools), which are accessible by walking, cycling and public transport. In suburban ‘sprawl’ (density range approximately 7-12 dw/ha), development patterns fail to support a sufficient level of localised, accessible services, forcing residents to rely on car-based transport.
Therefore we identified our objective, to establish the level of residential development intensity that is required to deliver the urban outcomes sought by the strategic plans for our cities.
1.4 Learning from Melbourne: testing real places
It was clear that current suburban development patterns were not delivering the stated objectives of walkable, accessible neighbourhoods, and we understood that the aim of 15 dw/ha was also insufficient, based on international references such as Towards an Urban Renaissance [5] which suggests a density of approximately 60 dw/ha to ensure that everyone can walk, usage of local facilities increases and bus services are more frequent. The update to this document [6] suggests specifying a minimum density of 40 dw/ha for all urban development.
However, local relevance and applicability would require local examples, and clear demonstration of the relationships between residential density, urban form and performance outcomes in the Australian context.
We studied several locations within metropolitan Melbourne and Sydney in detail, with the aim of understanding the parameters which would support a more sustainable urban form in other development areas.
Analysis of existing urban areas, local centres and transport services across various regions reveals that inner- and middle-areas benefit from a clustered structure of walkable neighbourhoods, with most dwellings within walking distance of a local centre, and comprehensive public transport coverage. Outer areas, however, display large suburban expanses without any centres, and highly dispersed transport services, reflecting car-dependent development.
In order to understand what ‘ingredients’ contributed to these visible performance outcomes, our analysis ‘zoomed in’ to selected inner, middle and outer urban locations, in Melbourne and Sydney, to investigate development patterns and residential densities, which determine broader patterns of urban structure (clustered and walkable, or dispersed and car-dependent).
This analysis also looked at other factors, towards confirming the relationships between development patterns, travel behaviours and accessibility, including: Land area per capita, and resultant density Car ownership per household Transport behaviours (travel mode to work) Income and housing mortgage
While the results of this investigation were predictable, they confirmed that outer, lower-density suburban locations demanded increased car ownership and usage, thereby limiting choice and options for those unable to drive or own a car, and forcing an additional personal financial impost.
1.5 Housing affordability and real costs
A study by Melbourne-based urban economics consultancy Charter Keck Cramer [7], investigated the personal financial implications of car ownership, as a basis for planning policy decisions which may reduce the need for car usage.
This study found that, by running one less car in the household over the period of home ownership or mortgage payments (25 years), the household could: Accumulate in excess of an additional $1 million (694,000 Euro) in superannuation over their
working life in 2008 dollars, or; Repay a $300,000 housing loan in 12 years instead of 25 years, saving $245,000 (170,000
Euro) in interest payments, or; Purchase a home which is $110,000 (76,300 Euro) more expensive than they would otherwise
be able to, at the outset.
The study concluded that: Excessive car dependency may impact upon our ability to achieve key economic and social objectives. Lower income households are forced to live in what would at first appear to be more affordable locations, but are actually entering a lifetime of car dependency and the costs associated with that.
The policy implications are that governments may play a key role in creating awareness of the economic benefits of reduced car ownership, and facilitating this through appropriate infrastructure investment. Such an approach will provide the foundation for more sustainable and equitable cities.
By assessing living costs more holistically, these results go some way to disproving the popular assumption that fringe development is the most affordable option.
Other studies and reports have described the additional personal and social costs which can result from low-density living, including social isolation and disconnection, lack of accessibility for those unable to drive, and loss of family/leisure time caused by long-distance commuting and traffic congestion.
1.6 Triggers and thresholds
Our investigation now turns to the population thresholds required to support local shops, facilities and services, or the numbers required to ‘trigger’ the financially viable and sustainable provision of services.
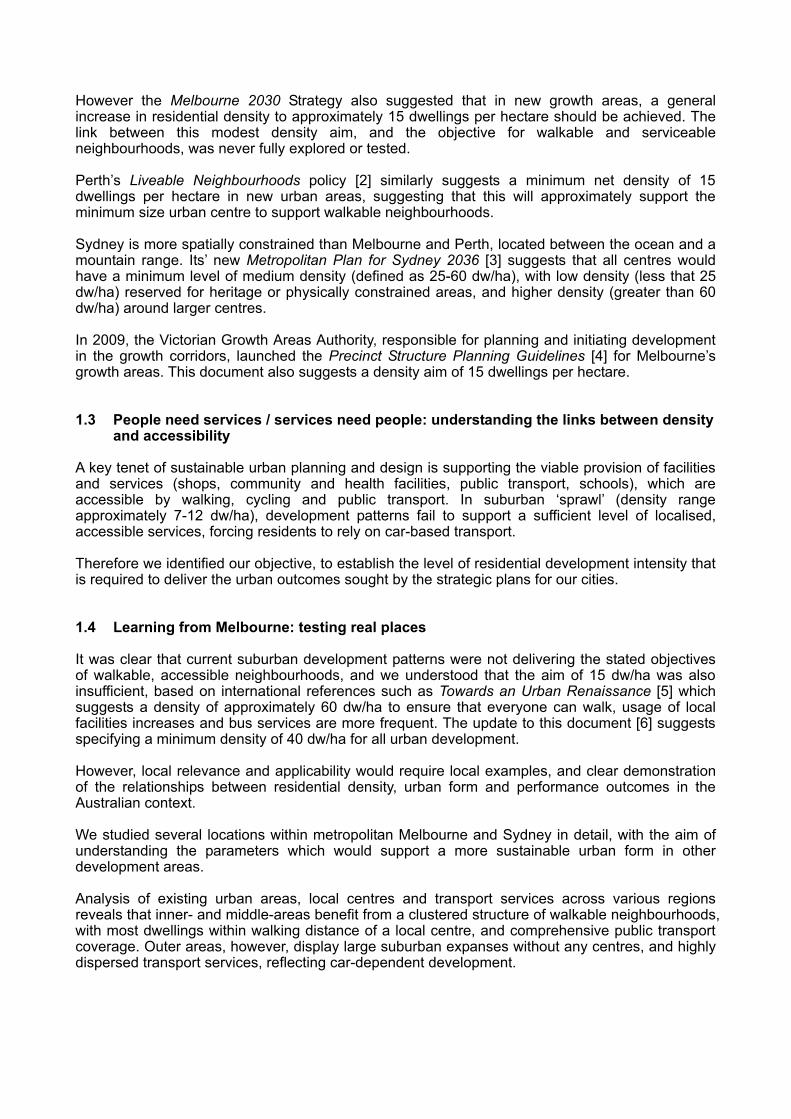
The threshold population must be located within easy walking distance of the centre, to encourage patronage of local centres, and therefore their ongoing viability. Beyond 5-10 minutes walk, the behavioural tendency is to opt for car use, and then to potentially bypass local centres to travel further to larger centres, undermining the viability of the smaller centres. Some of these indicative thresholds are outlined below:
Table 1 Facilities population thresholds
Community/commercial facilities in activity centre Population threshold for viability
Local shops/corner store 800 – 1,000 dwellings Small Neighbourhood Activity Centre (shops, community centre, primary school) 1,200 – 4,000 dwellings
Large Neighbourhood Activity Centre 4,000 – 10,000 dwellings Community health centre 8,000 – 12,000 dwellings Primary School 1,200 – 5,000 dwellings Secondary School 8,000 – 10,000 dwellings Train Station 10,000 – 12,000 dwellings Civic Centre 12,000 – 48,000 dwellings
1.7 Disproving the policy
In many ways, the smallest, lowest-order Activity Centre is the most important, providing localised access for small communities, and forming the ‘glue’ within the wider urban structure, filling the gaps between the larger nodes within a clustered network. These centres also help to define neighbourhoods, forming a local focus point and meeting place which is familiar and close to home. Without these small centres, there would be large areas of suburban development without local access to facilities and services.
To support these centres, the minimum threshold population must be accommodated within easy walking distance, to provide a sufficient number of residents with a realistic and convenient alternative to car usage.
To fit the minimum threshold of 800-1000 dwellings for the smallest local centre within 5 minutes’ walk of that centre, while also allowing space for non-residential uses, requires a density of approximately 26 dwellings per hectare.
Developing the same catchment area at 15 dw/ha, as the policy suggests, delivers approximately 510 dwellings within walking distance, or just over half of the required population to support the centre’s viability and sustainability, and so the centre is unlikely to be economically viable.
It is therefore evident that developing suburbs at an average of 15 dw/ha will fail to support local centres, and therefore will fail to achieve the clustered network of neighbourhoods which the policy framework encourages. There is a fundamental disconnect between the objectives of the policy framework, and the guidance provided.
1.8 The model: aligning centres and populations
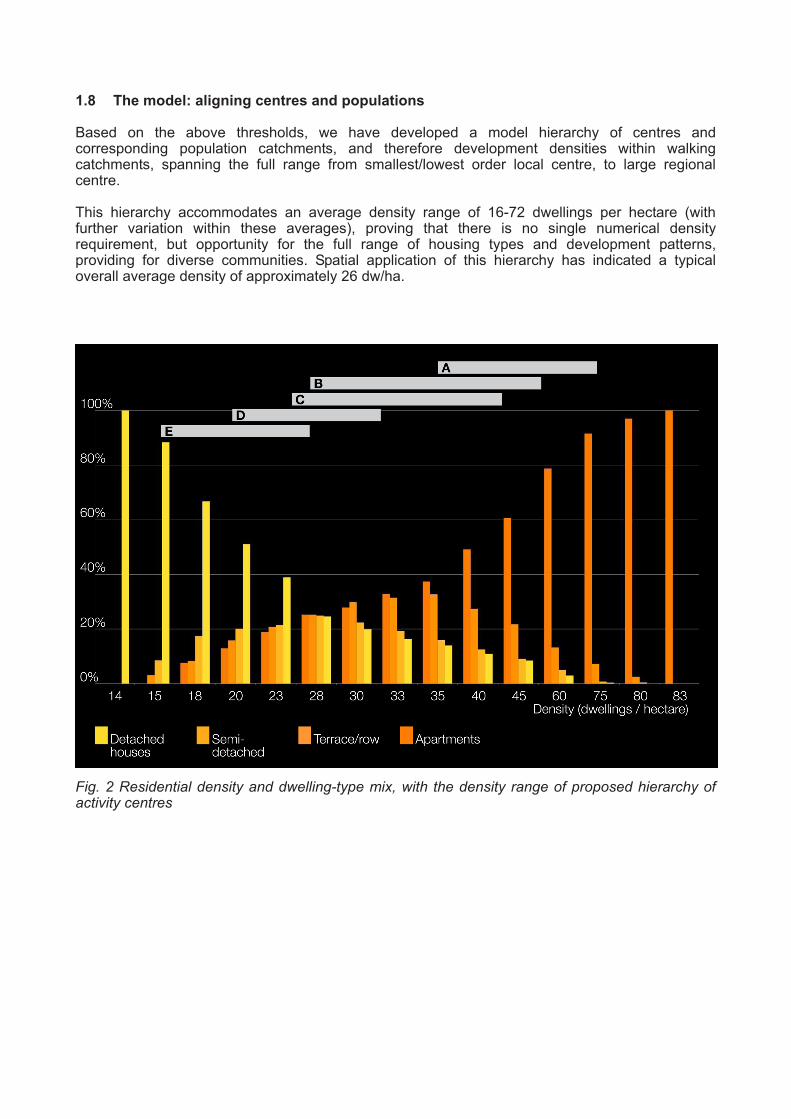
Based on the above thresholds, we have developed a model hierarchy of centres and corresponding population catchments, and therefore development densities within walking catchments, spanning the full range from smallest/lowest order local centre, to large regional centre.
This hierarchy accommodates an average density range of 16-72 dwellings per hectare (with further variation within these averages), proving that there is no single numerical density requirement, but opportunity for the full range of housing types and development patterns, providing for diverse communities. Spatial application of this hierarchy has indicated a typical overall average density of approximately 26 dw/ha.
[Image: SWD density column chart with ABCDE bars across top]
Fig. 2 Residential density and dwelling-type mix, with the density range of proposed hierarchy of activity centres
2. Application – “Save: My Life”
2.1 Taking action: a proposition
2.1.1 Identifying the potential
It is clear that urban policy is failing to address the disconnect between objectives and specific requirements through policy or ‘top-down’ intervention. Therefore, we sought to identify and facilitate ‘bottom-up’ change, shifting consumer preferences through increased information, guiding a move towards more compact, centrally located, accessible and sustainable housing choices, as a way to influence urban outcomes.
While the work is aimed at better planning outcomes and more sustainable urban development, which supports sustainable transport, more compact housing development, increased mixing of uses and greater diversity of housing and tenure types, we realised that it may be more achievable ‘by stealth’.
That is, using communication of the personal implications (financial, health, lifestyle) to encourage ‘grass-roots’ or ‘bottom-up’ action, allowing informed consumer choice about how and where one lives, to drive urban change.
2.1.2 Cost now, and costs later
When we purchase a dwelling, we are told its up-front purchase price, but there is no information relating to the ongoing costs associated with living in that house.
As discussed above, research indicates that ongoing costs relating to housing choice can be very significant, potentially altering personal choices at the purchase stage. A moderately more expensive dwelling purchase can potentially form a much less expensive and financially beneficial option, when considered over the extended period of living in the dwelling.
2.1.3 Reference: Fuel Consumption Label
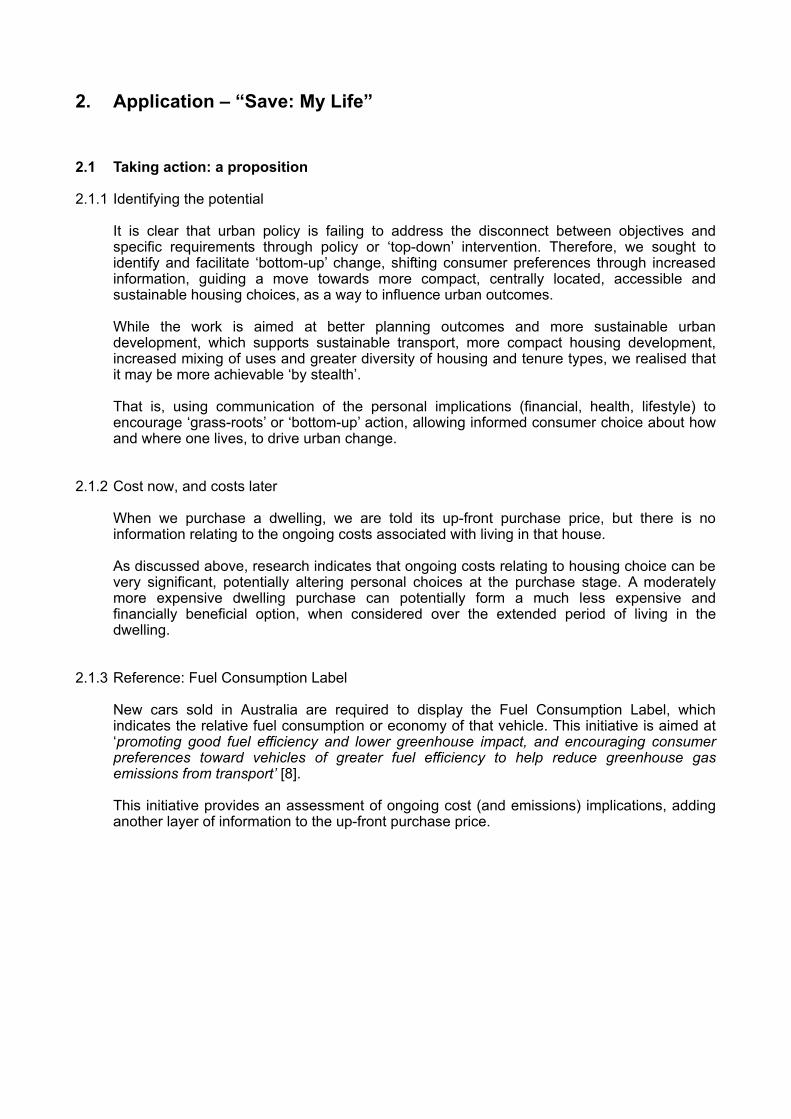
New cars sold in Australia are required to display the Fuel Consumption Label, which indicates the relative fuel consumption or economy of that vehicle. This initiative is aimed at ‘promoting good fuel efficiency and lower greenhouse impact, and encouraging consumer preferences toward vehicles of greater fuel efficiency to help reduce greenhouse gas emissions from transport’ [8].
This initiative provides an assessment of ongoing cost (and emissions) implications, adding another layer of information to the up-front purchase price.
[Image: Fuel Consumption Label]
Fig. 3 Fuel Consumption Label [8]
2.1.4 Initial idea: ‘House consumption label’
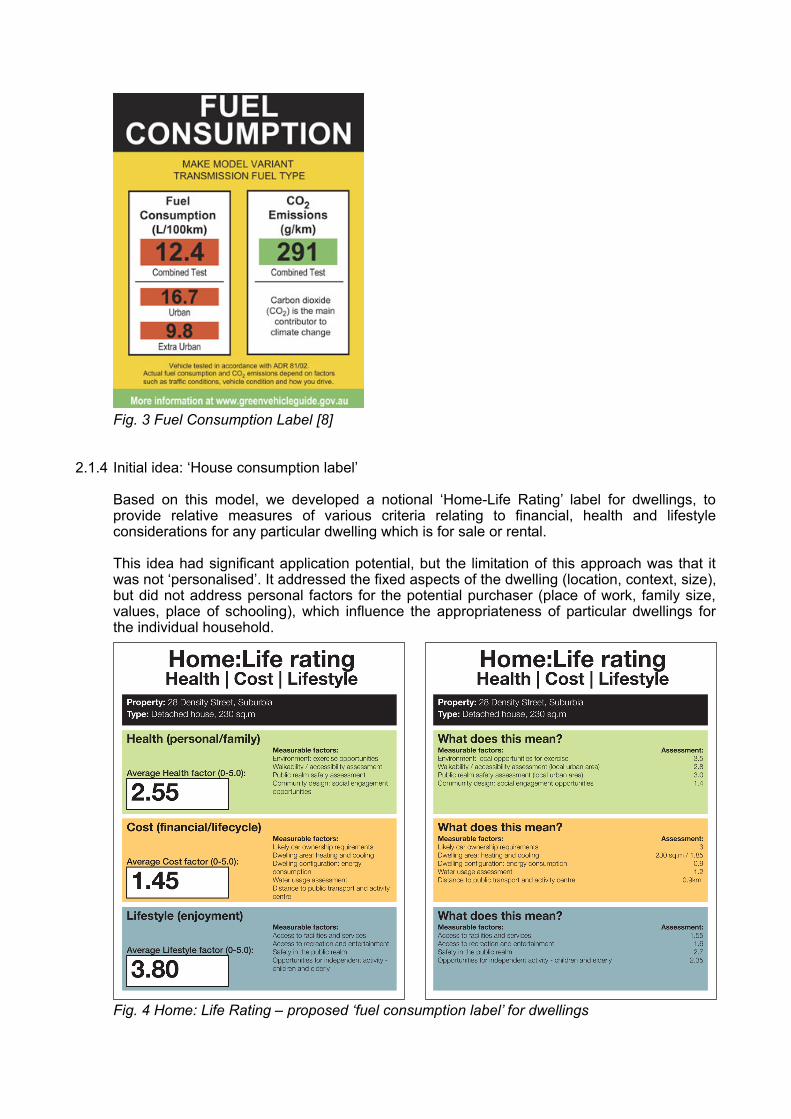
Based on this model, we developed a notional ‘Home-Life Rating’ label for dwellings, to provide relative measures of various criteria relating to financial, health and lifestyle considerations for any particular dwelling which is for sale or rental.
This idea had significant application potential, but the limitation of this approach was that it was not ‘personalised’. It addressed the fixed aspects of the dwelling (location, context, size), but did not address personal factors for the potential purchaser (place of work, family size, values, place of schooling), which influence the appropriateness of particular dwellings for the individual household.
[Image: SWD HomeLife Rating]
Fig. 4 Home: Life Rating – proposed ‘fuel consumption label’ for dwellings
2.2 “Save: My Life”: personal rating tool for dwellings
The emergence of online and smartphone-based applications prompted us to propose an integrated “App” (smartphone application) and online portal which can provide measures, ratings, comparisons and recommendations to inform personal choice of particular dwellings.
This tool is currently a work in progress, and is yet to be fully developed, tested or released. The proposal and planned product remain the intellectual property of the authors.
The application utilises multiple source data access and manipulation, interfacing the fixed qualities of the selected dwelling and locality, with the variable, personal factors which influence appropriate housing choice.
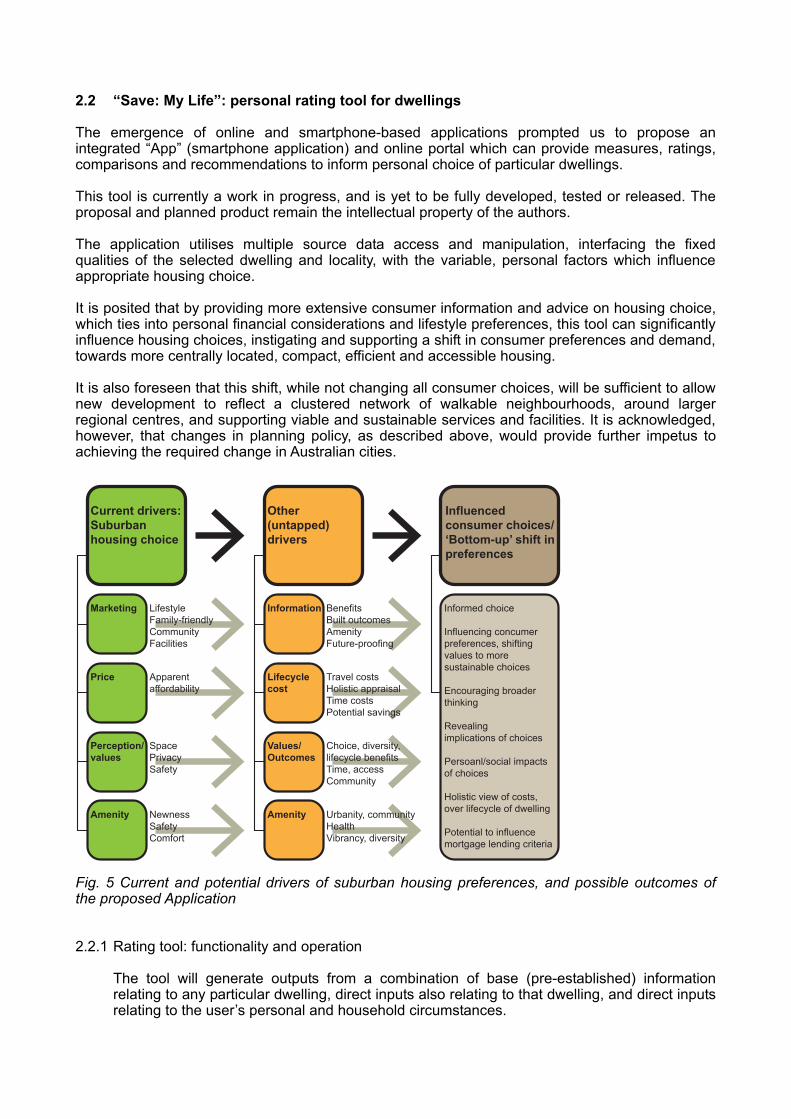
It is posited that by providing more extensive consumer information and advice on housing choice, which ties into personal financial considerations and lifestyle preferences, this tool can significantly influence housing choices, instigating and supporting a shift in consumer preferences and demand, towards more centrally located, compact, efficient and accessible housing.
It is also foreseen that this shift, while not changing all consumer choices, will be sufficient to allow new development to reflect a clustered network of walkable neighbourhoods, around larger regional centres, and supporting viable and sustainable services and facilities. It is acknowledged, however, that changes in planning policy, as described above, would provide further impetus to achieving the required change in Australian cities.
[Image: Bottom SMc illustrator diagram: drivers]
Fig. 5 Current and potential drivers of suburban housing preferences, and possible outcomes of the proposed Application
2.2.1 Rating tool: functionality and operation
The tool will generate outputs from a combination of base (pre-established) information relating to any particular dwelling, direct inputs also relating to that dwelling, and direct inputs relating to the user’s personal and household circumstances.
Dwelling (fixed)
Personal (variable)
Recommended option/ informed choice+
Location
Parameters
Household/ family
Activities
Values
Locality
Cost/ economic
Dwelling
Current drivers:Suburban housing choice
Other (untapped) drivers
Information
Lifecycle cost
Choice, diversity, lifecycle benefitsTime, accessCommunity
Urbanity, communityHealth Vibrancy, diversity
Information
Ratings
Advice
Result
Compare
Marketing
Price
Perception/values
Amenity
Influenced consumer choices/‘Bottom-up’ shift in preferences
Inputs: Outputs:
Values/Outcomes
Amenity
Informed choice
Influencing concumer preferences, shifting values to more sustainable choices
Encouraging broader thinking
Revealing implications of choices
Persoanl/social impacts of choices
Holistic view of costs, over lifecycle of dwelling
Potential to influence mortgage lending criteria
ProximityAccess
Dwelling sizeConfigurationCost
PeopleAges
EmploymentEducation
PreferencesPrioritiesPrinciples
AccessMobilityLifestyle
Holistic/Lifecycle
SizeTypeForm
Score/measureCategories
RecommendationsAlternativesLocations
ImplicationFinancialLifestyle
Other optionsCurrent dwelling
BenefitsBuilt outcomesAmenityFuture-proofing
LifestyleFamily-friendlyCommunityFacilities
NewnessSafetyComfort
Apparentaffordability
SpacePrivacySafety
Travel costsHolistic appraisalTime costsPotential savings
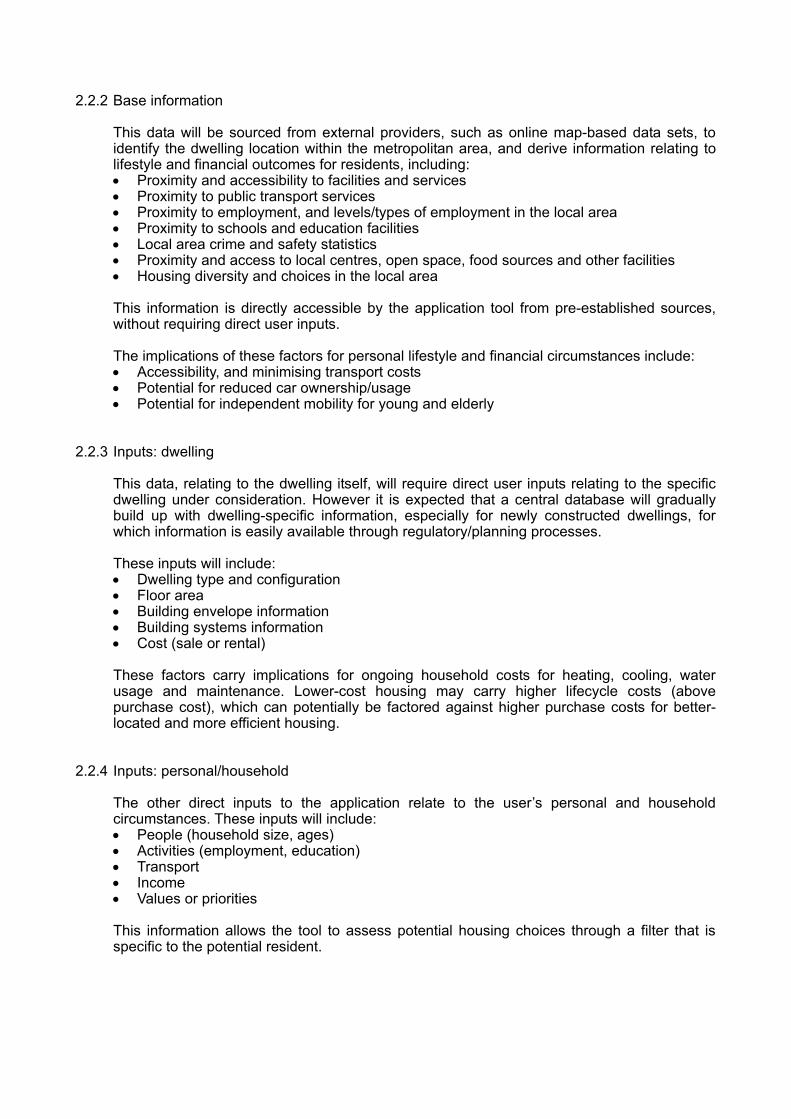
2.2.2 Base information
This data will be sourced from external providers, such as online map-based data sets, to identify the dwelling location within the metropolitan area, and derive information relating to lifestyle and financial outcomes for residents, including: Proximity and accessibility to facilities and services Proximity to public transport services Proximity to employment, and levels/types of employment in the local area Proximity to schools and education facilities Local area crime and safety statistics Proximity and access to local centres, open space, food sources and other facilities Housing diversity and choices in the local area
This information is directly accessible by the application tool from pre-established sources, without requiring direct user inputs.
The implications of these factors for personal lifestyle and financial circumstances include: Accessibility, and minimising transport costs Potential for reduced car ownership/usage Potential for independent mobility for young and elderly
2.2.3 Inputs: dwelling
This data, relating to the dwelling itself, will require direct user inputs relating to the specific dwelling under consideration. However it is expected that a central database will gradually build up with dwelling-specific information, especially for newly constructed dwellings, for which information is easily available through regulatory/planning processes.
These inputs will include: Dwelling type and configuration Floor area Building envelope information Building systems information Cost (sale or rental)
These factors carry implications for ongoing household costs for heating, cooling, water usage and maintenance. Lower-cost housing may carry higher lifecycle costs (above purchase cost), which can potentially be factored against higher purchase costs for better-located and more efficient housing.
2.2.4 Inputs: personal/household
The other direct inputs to the application relate to the user’s personal and household circumstances. These inputs will include: People (household size, ages) Activities (employment, education) Transport Income Values or priorities
This information allows the tool to assess potential housing choices through a filter that is specific to the potential resident.
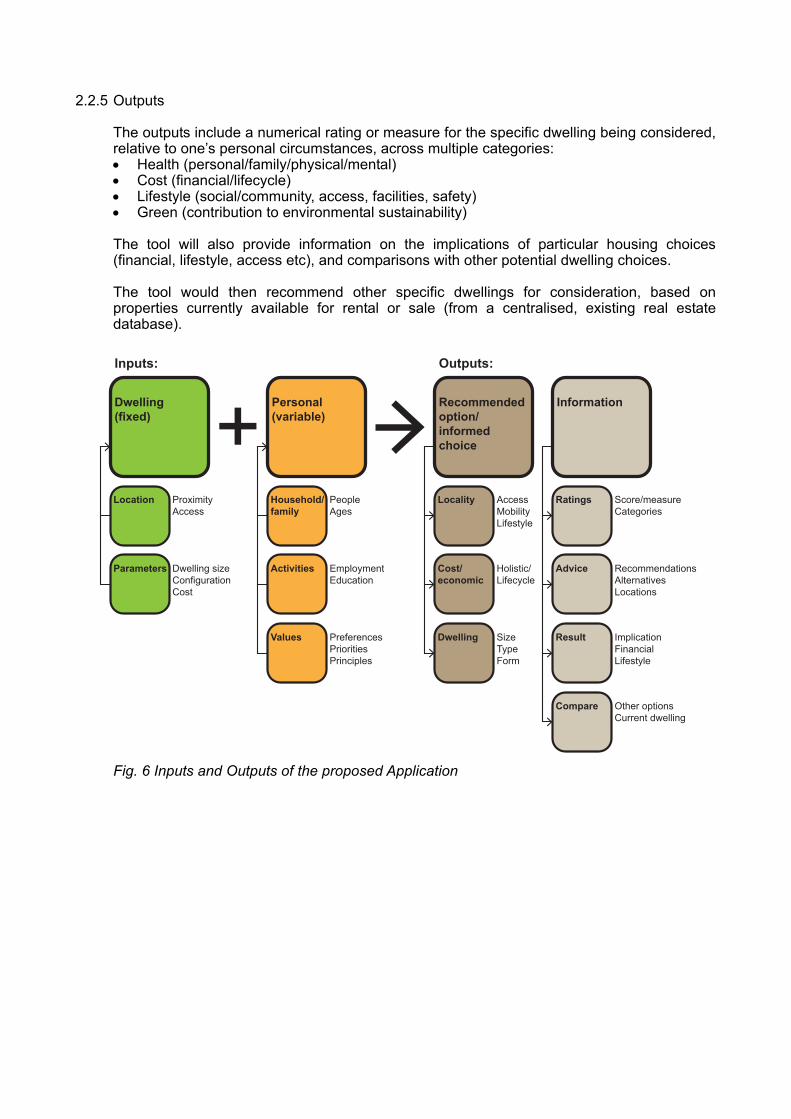
2.2.5 Outputs
The outputs include a numerical rating or measure for the specific dwelling being considered, relative to one’s personal circumstances, across multiple categories: Health (personal/family/physical/mental) Cost (financial/lifecycle) Lifestyle (social/community, access, facilities, safety) Green (contribution to environmental sustainability)
The tool will also provide information on the implications of particular housing choices (financial, lifestyle, access etc), and comparisons with other potential dwelling choices.
The tool would then recommend other specific dwellings for consideration, based on properties currently available for rental or sale (from a centralised, existing real estate database).
[Image: Bottom SMc illustrator diagram: inputs & outputs]
Fig. 6 Inputs and Outputs of the proposed Application
Dwelling (fixed)
Personal (variable)
Recommended option/ informed choice+
Location
Parameters
Household/ family
Activities
Values
Locality
Cost/ economic
Dwelling
Current drivers:Suburban housing choice
Other (untapped) drivers
Information
Lifecycle cost
Choice, diversity, lifecycle benefitsTime, accessCommunity
Urbanity, communityHealth Vibrancy, diversity
Information
Ratings
Advice
Result
Compare
Marketing
Price
Perception/values
Amenity
Influenced consumer choices/‘Bottom-up’ shift in preferences
Inputs: Outputs:
Values/Outcomes
Amenity
Informed choice
Influencing concumer preferences, shifting values to more sustainable choices
Encouraging broader thinking
Revealing implications of choices
Persoanl/social impacts of choices
Holistic view of costs, over lifecycle of dwelling
Potential to influence mortgage lending criteria
ProximityAccess
Dwelling sizeConfigurationCost
PeopleAges
EmploymentEducation
PreferencesPrioritiesPrinciples
AccessMobilityLifestyle
Holistic/Lifecycle
SizeTypeForm
Score/measureCategories
RecommendationsAlternativesLocations
ImplicationFinancialLifestyle
Other optionsCurrent dwelling
BenefitsBuilt outcomesAmenityFuture-proofing
LifestyleFamily-friendlyCommunityFacilities
NewnessSafetyComfort
Apparentaffordability
SpacePrivacySafety
Travel costsHolistic appraisalTime costsPotential savings
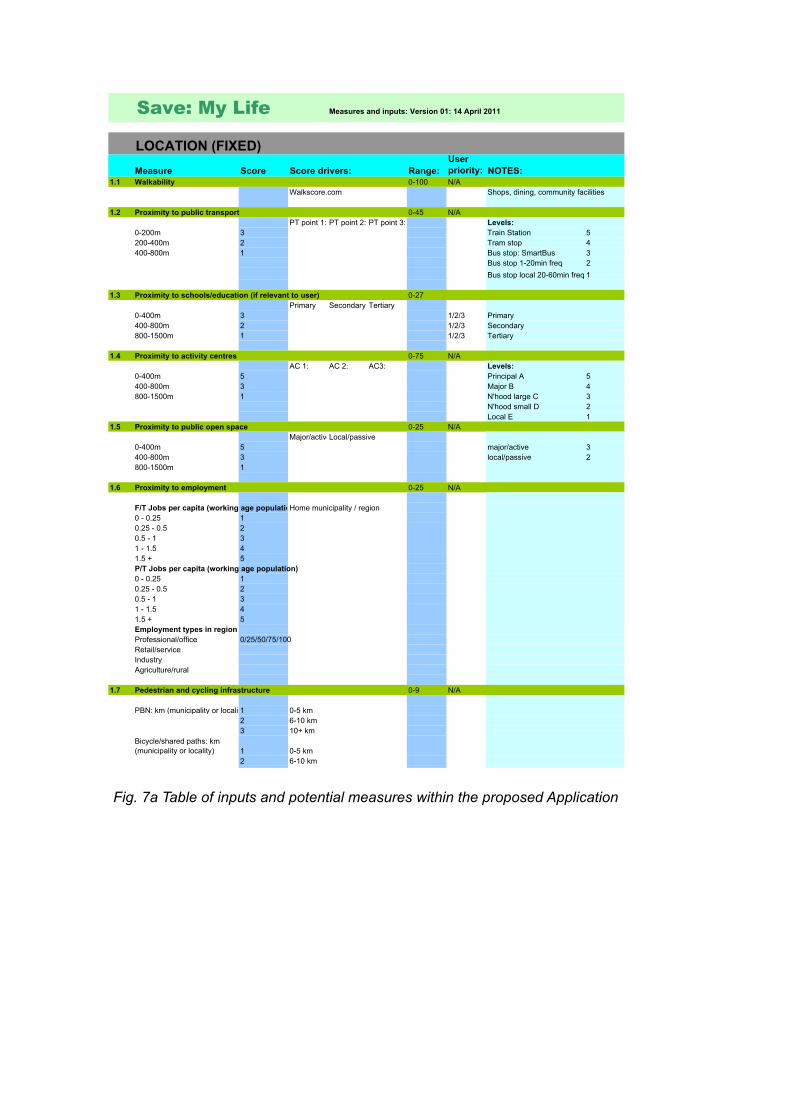
[Image (overleaf, across 2 pages?: SMc excel spreadsheet]
Fig. 7a Table of inputs and potential measures within the proposed Application
Save: My Life Measures and inputs: Version 01: 14 April 2011
LOCATION (FIXED)Measure Score Score drivers: Range:
Userpriority: NOTES:
1.1 Walkability 0-100 N/AWalkscore.com Shops, dining, community facilities
1.2 Proximity to public transport 0-45 N/APT point 1: PT point 2: PT point 3: Levels:
0-200m 3 Train Station 5200-400m 2 Tram stop 4400-800m 1 Bus stop: SmartBus 3
Bus stop 1-20min freq 2Bus stop local 20-60min freq 1
1.3 Proximity to schools/education (if relevant to user) 0-27Primary Secondary Tertiary
0-400m 3 1/2/3 Primary400-800m 2 1/2/3 Secondary800-1500m 1 1/2/3 Tertiary
1.4 Proximity to activity centres 0-75 N/AAC 1: AC 2: AC3: Levels:
0-400m 5 Principal A 5400-800m 3 Major B 4800-1500m 1 N'hood large C 3
N'hood small D 2Local E 1
1.5 Proximity to public open space 0-25 N/AMajor/activeLocal/passive
0-400m 5 major/active 3400-800m 3 local/passive 2800-1500m 1
1.6 Proximity to employment 0-25 N/A
F/T Jobs per capita (working age populatioHome municipality / region0 - 0.25 10.25 - 0.5 20.5 - 1 31 - 1.5 41.5 + 5P/T Jobs per capita (working age population)0 - 0.25 10.25 - 0.5 20.5 - 1 31 - 1.5 41.5 + 5Employment types in regionProfessional/office 0/25/50/75/100Retail/serviceIndustryAgriculture/rural
1.7 Pedestrian and cycling infrastructure 0-9 N/A
PBN: km (municipality or localit1 0-5 km2 6-10 km3 10+ km
Bicycle/shared paths: km (municipality or locality) 1 0-5 km
2 6-10 km

Fig. 7b Table of inputs and potential measures within the proposed Application
Save: My Life Measures and inputs: Version 01: 14 April 2011
DWELLING (FIXED)PhysicalDwelling type Detached/Semi-det/terrace/apartment
Floor area sq.m Implications for heating/cooling costs
No. of bedrooms Approporiate to family size
Shared walls Proportion of total Implications for heating/coolingIndicator of compact development
Building envelope Materials, insulation, glazing type Implications for heating/cooling costsEnergy efficiency
Building systems Hot water, appliances, heating Implications for energy efficiencyEnergy/water efficiency
Water demands Private outdoor space, swimming pool Implications for water costs
Rating (if available) 0-7Star rating 7/6/5/4/3/2/1 Energy / water
CostSale price $ORRent (per month) $ per month
HOUSEHOLD (variable)People/activitiesWorking adults (18+) Location of work (curre Employment type: Employment level:
1 1: (Location) Professional/office Full-time2 2: (Location) Retail/service Part-time / casual3 3: (Location) Industry4 4: (Location) Agriculture/rural
Non-working adults (including students) Location of study/training1 1: (Location)2 2: (Location)3 3: (Location)
Children/adolescents (0-17) Location of school (current)Kindergartern/childcare 0/1/2/3 1: (Location)Primary school 0/1/2/3 2: (Location)Secondary school 0/1/2/3 3: (Location)
4: (Location)5: (Location)
Interests/activities No. of personsA B C A - Level of participationSport 0/1/2/3/4/5/6 0/1/2/3 B - Primary current locationReligion C - Level of commitment to this locationShoppingDining
IncomeHousehold income (gross) $000,000 H/M/L
TransportHousehold motor vehicles 0/1/2/3/4
Mode: Physical abilityPrimary transport mode Adult 1 Car/walk/bi 1/2/3
Adult 2Adult 3
Child 1Child 2Child 3Child 4
Personal prioritiesLifestyleTime at home, work-life balanc 1/2/3Relaxation, less stress 1/2/3Independent mobility, accessib1/2/3Entertainment, nightlife 1/2/3
Place characterVibrant location, activity 1/2/3Quiet, serenity 1/2/3Space, privacy 1/2/3
ValuesSustainability, green living 1/2/3Community, social interaction 1/2/3Cost saving 1/2/3Location/region (specify) 1/2/3
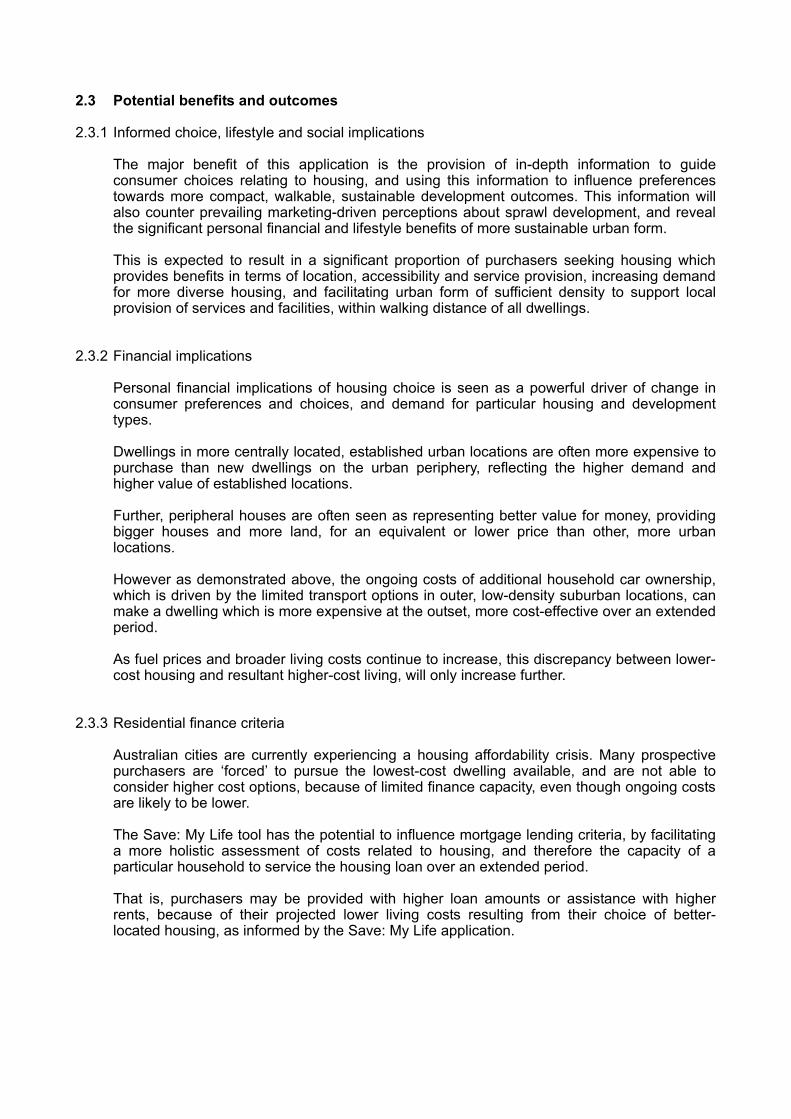
2.3 Potential benefits and outcomes
2.3.1 Informed choice, lifestyle and social implications
The major benefit of this application is the provision of in-depth information to guide consumer choices relating to housing, and using this information to influence preferences towards more compact, walkable, sustainable development outcomes. This information will also counter prevailing marketing-driven perceptions about sprawl development, and reveal the significant personal financial and lifestyle benefits of more sustainable urban form.
This is expected to result in a significant proportion of purchasers seeking housing which provides benefits in terms of location, accessibility and service provision, increasing demand for more diverse housing, and facilitating urban form of sufficient density to support local provision of services and facilities, within walking distance of all dwellings.
2.3.2 Financial implications
Personal financial implications of housing choice is seen as a powerful driver of change in consumer preferences and choices, and demand for particular housing and development types.
Dwellings in more centrally located, established urban locations are often more expensive to purchase than new dwellings on the urban periphery, reflecting the higher demand and higher value of established locations.
Further, peripheral houses are often seen as representing better value for money, providing bigger houses and more land, for an equivalent or lower price than other, more urban locations.
However as demonstrated above, the ongoing costs of additional household car ownership, which is driven by the limited transport options in outer, low-density suburban locations, can make a dwelling which is more expensive at the outset, more cost-effective over an extended period.
As fuel prices and broader living costs continue to increase, this discrepancy between lower-cost housing and resultant higher-cost living, will only increase further.
2.3.3 Residential finance criteria
Australian cities are currently experiencing a housing affordability crisis. Many prospective purchasers are ‘forced’ to pursue the lowest-cost dwelling available, and are not able to consider higher cost options, because of limited finance capacity, even though ongoing costs are likely to be lower.
The Save: My Life tool has the potential to influence mortgage lending criteria, by facilitating a more holistic assessment of costs related to housing, and therefore the capacity of a particular household to service the housing loan over an extended period.
That is, purchasers may be provided with higher loan amounts or assistance with higher rents, because of their projected lower living costs resulting from their choice of better-located housing, as informed by the Save: My Life application.
2.4 Next steps
This project has attracted significant interest over the past year from all levels of government, agencies, Universities, consultants and practitioners in Australia and New Zealand, through various industry presentations and conferences. We have identified various potential partnerships to assist with the development of Save: My Life, and are currently working on confirming the project team, participants and process for implementation, as well as the format, content, functionality and operation of the application.
We look forward to the prototype completion in the near future for testing and development, towards commercial release and distribution of the application.
2.5 References
[1] DEPARTMENT OF INFRASTRUCTURE (VICTORIA), Melbourne 2030, 2002, pp. 63, 101-102.
[2] DEPARTMENT FOR PLANNING AND INFRASTRUCTURE (WESTERN AUSTRALIA), “Element 1: Community Design”, Liveable Neighbourhoods, Update 02, 2009, pp 2-3.
[3] DEPARTMENT FOR PLANNING (NEW SOUTH WALES), Metropolitan Plan for Sydney 2026, 2010, pp. 107-113
[4] GROWTH AREAS AUTHORITY (VICTORIA), “Part Two: Preparing the Precinct Structure Plan”, Precinct Structure Planning Guidelines, 2009, pp 20.
[5] URBAN TASK FORCE, Towards an Urban Renaissance, 1999. [6] URBAN TASK FORCE, Towards a Strong Urban Renaissance, 2005. [7] CHARTER KECK CRAMER, Urban Economics and Policy Review, Issue 1: November 2008. [8] DEPARTMENT OF SUSTAINABILITY, ENVIRONMENT, WATER, POPULATION AND
COMMUNITIES (AUSTRALIA), Fuel Consumption Label, www.environment.gov.au