sg cowen & co. health care conference - iis windows...
TRANSCRIPT
SG Cowen & Co. SG Cowen & Co. Health Care Health Care ConferenceConference
David C. Colby,Executive Vice President &Chief Financial OfficerMarch 6, 2006
2
Safe Harbor StatementSafe Harbor Statement
Safe Harbor Statement Under the Private Securities Litigation Reform Act of 1995:
The statements made during this presentation that are not historical facts are forward-looking statements within the meaning for the Federal securities laws, and may involve a number of risks and uncertainties.
Factors that could cause actual results to differ materially from expectations include, but are not limited to, the risks discussed in the Company’s most recent filings with the SEC, including its Annual Report on Form 10-K for the year ended December 31, 2005.
3
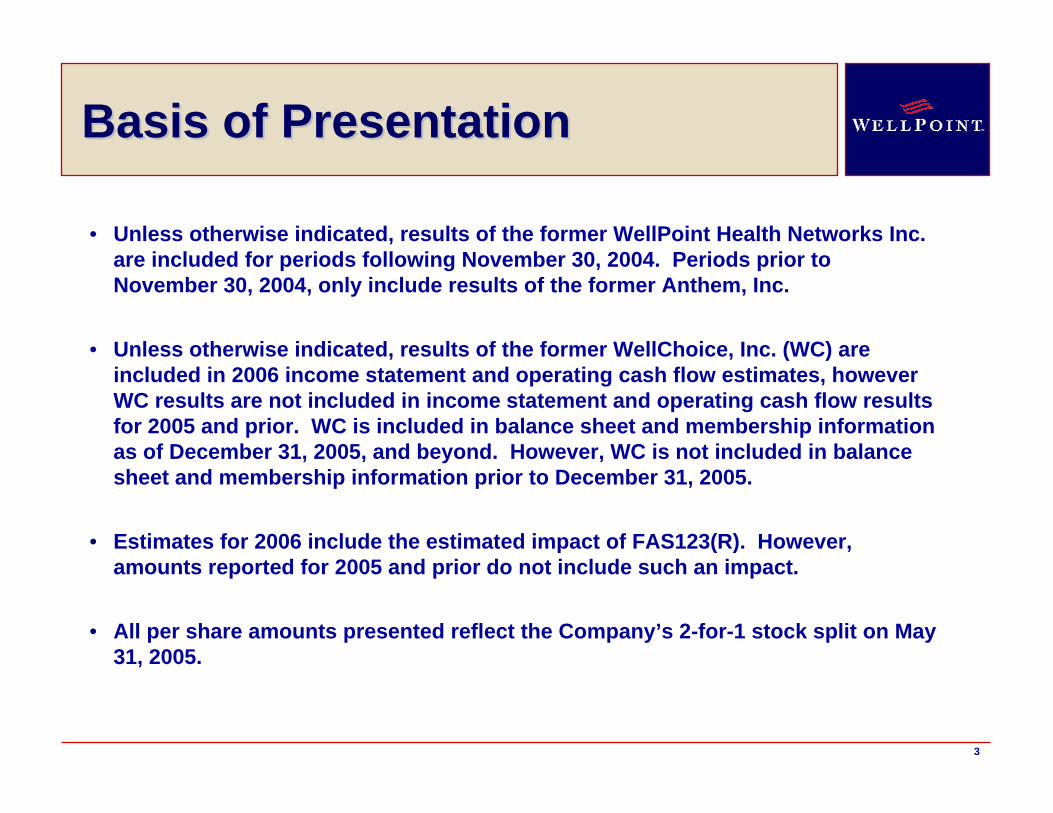
Basis of PresentationBasis of Presentation
• Unless otherwise indicated, results of the former WellPoint Health Networks Inc. are included for periods following November 30, 2004. Periods prior to November 30, 2004, only include results of the former Anthem, Inc.
• Unless otherwise indicated, results of the former WellChoice, Inc. (WC) are included in 2006 income statement and operating cash flow estimates, however WC results are not included in income statement and operating cash flow results for 2005 and prior. WC is included in balance sheet and membership information as of December 31, 2005, and beyond. However, WC is not included in balance sheet and membership information prior to December 31, 2005.
• Estimates for 2006 include the estimated impact of FAS123(R). However, amounts reported for 2005 and prior do not include such an impact.
• All per share amounts presented reflect the Company’s 2-for-1 stock split on May 31, 2005.
4
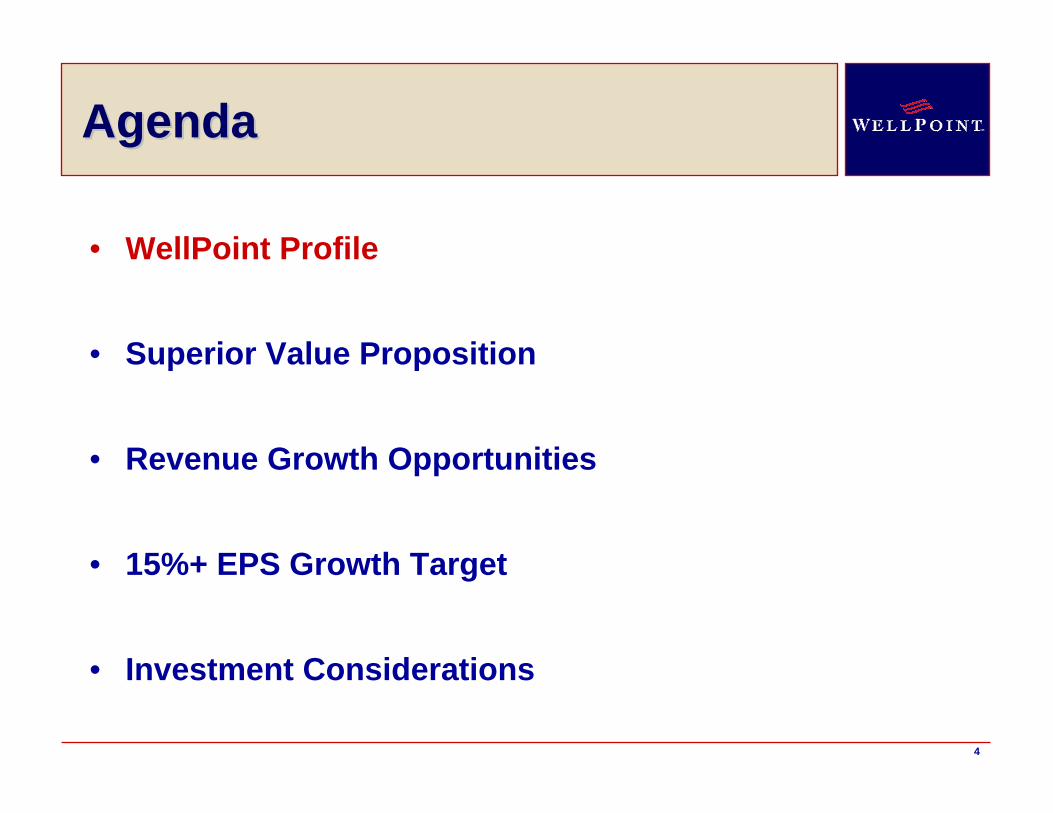
AgendaAgenda
• WellPoint Profile
• Superior Value Proposition
• Revenue Growth Opportunities
• 15%+ EPS Growth Target
• Investment Considerations
5
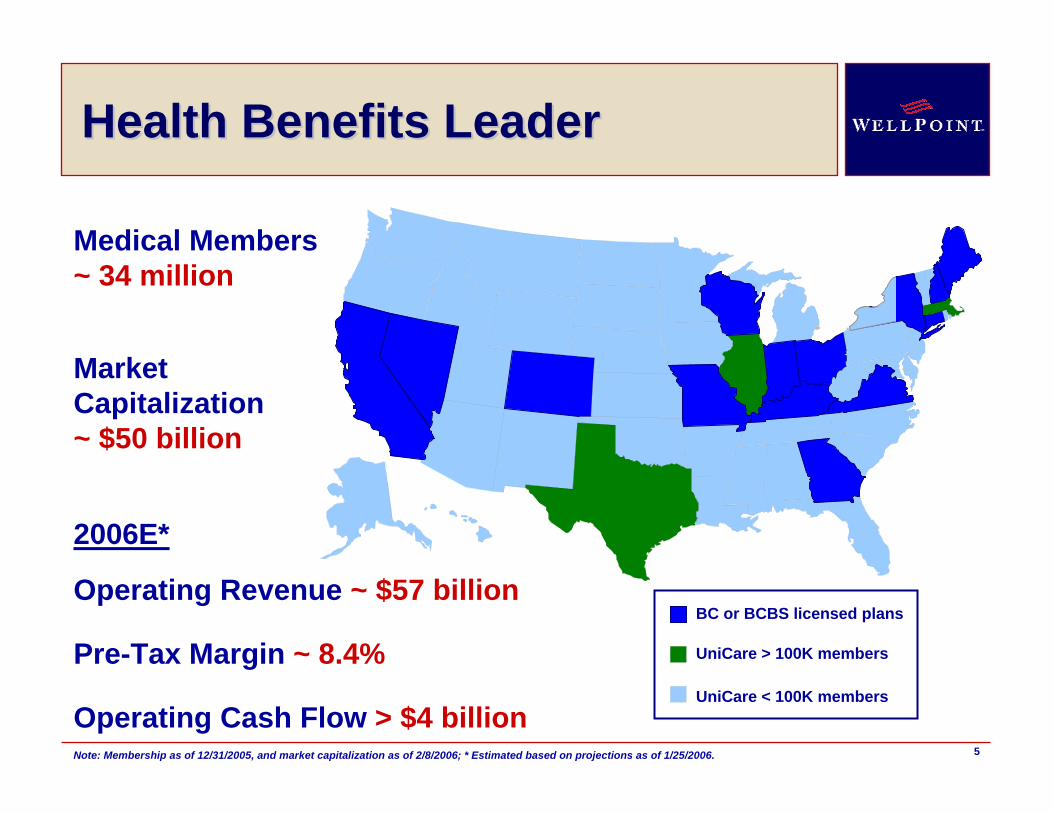
Health Benefits LeaderHealth Benefits Leader
Medical Members~ 34 million
2006E*
Operating Cash Flow > $4 billion
BC or BCBS licensed plans
UniCare > 100K members
UniCare < 100K members
Market Capitalization~ $50 billion
Pre-Tax Margin ~ 8.4%
Operating Revenue ~ $57 billion
Note: Membership as of 12/31/2005, and market capitalization as of 2/8/2006; * Estimated based on projections as of 1/25/2006.

6
Diverse Membership BaseDiverse Membership Base
Individual & Small Group
Senior1.2M
5.7M
State Sponsored1.9M
National Accounts4.8M
BlueCard3.9M
Large Group16.4M
Self-Funded~ 48%
Fully Insured~ 52%
Note: Membership data as of 12/31/2005.
No commercial customer represents more than 2% of earnings
7
Cos
t
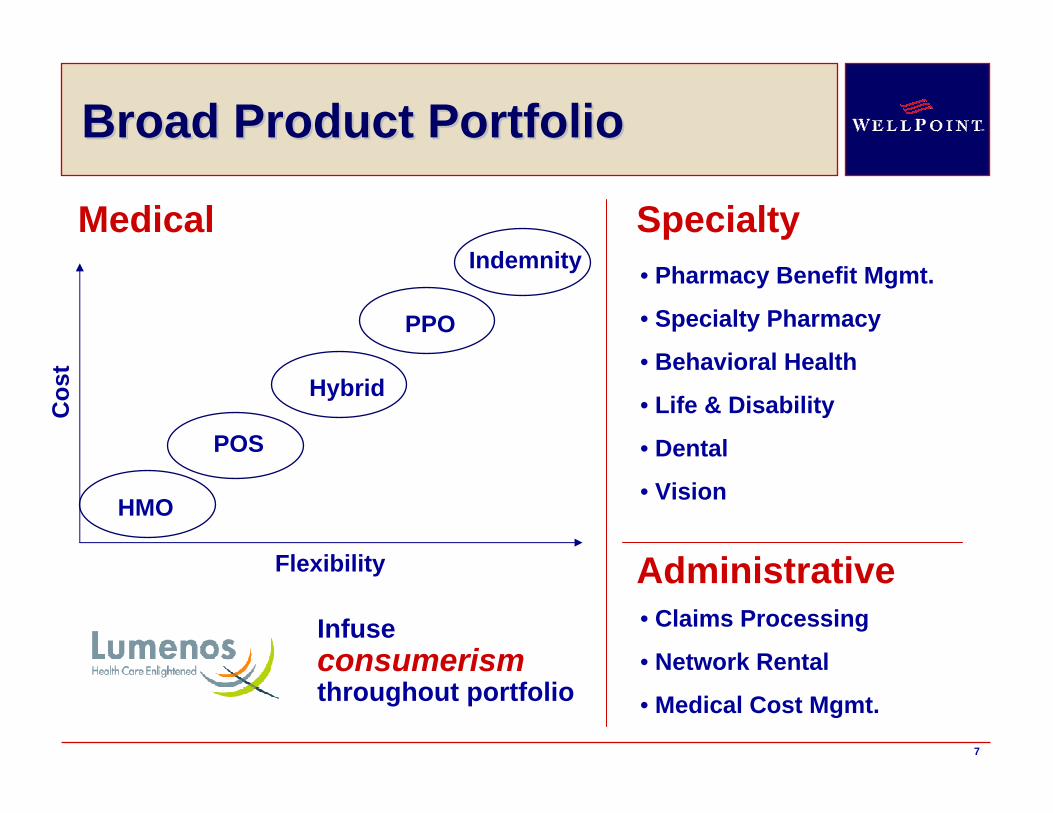
Broad Product PortfolioBroad Product Portfolio
Medical
Flexibility
SpecialtyIndemnity
PPO
Hybrid
POS
HMO
Infuse consumerismthroughout portfolio
• Pharmacy Benefit Mgmt.
• Specialty Pharmacy
• Behavioral Health
• Life & Disability
• Dental
• Vision
Administrative• Claims Processing
• Network Rental
• Medical Cost Mgmt.
8
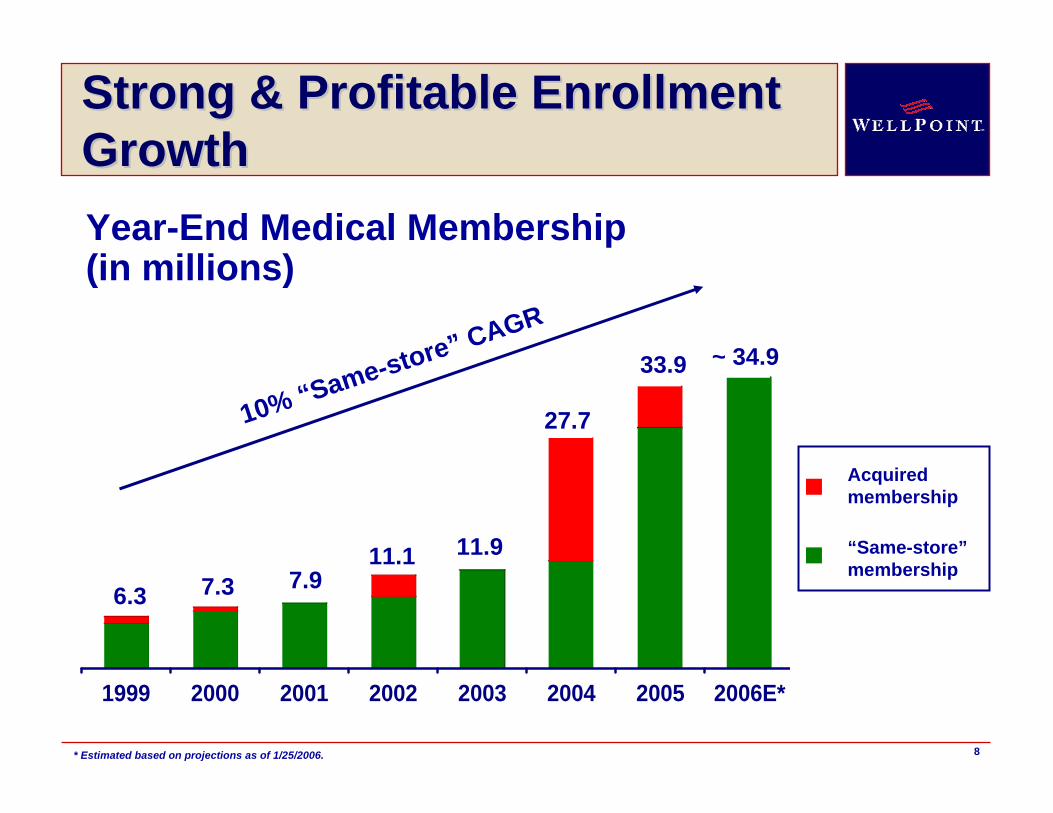
Acquiredmembership
1999 2000 2001 2002 2003 2004 2005 2006E*
Strong & Profitable Enrollment Strong & Profitable Enrollment GrowthGrowthYear-End Medical Membership (in millions)
6.311.1
7.97.3
27.7
11.9
33.9
10% “Same-store” CAGR
“Same-store”membership
~ 34.9
* Estimated based on projections as of 1/25/2006.
9
AgendaAgenda
• WellPoint Profile
• Superior Value Proposition
• Revenue Growth Opportunities
• 15%+ EPS Growth Target
• Investment Considerations
10
0%
25%
50%
75%
100%
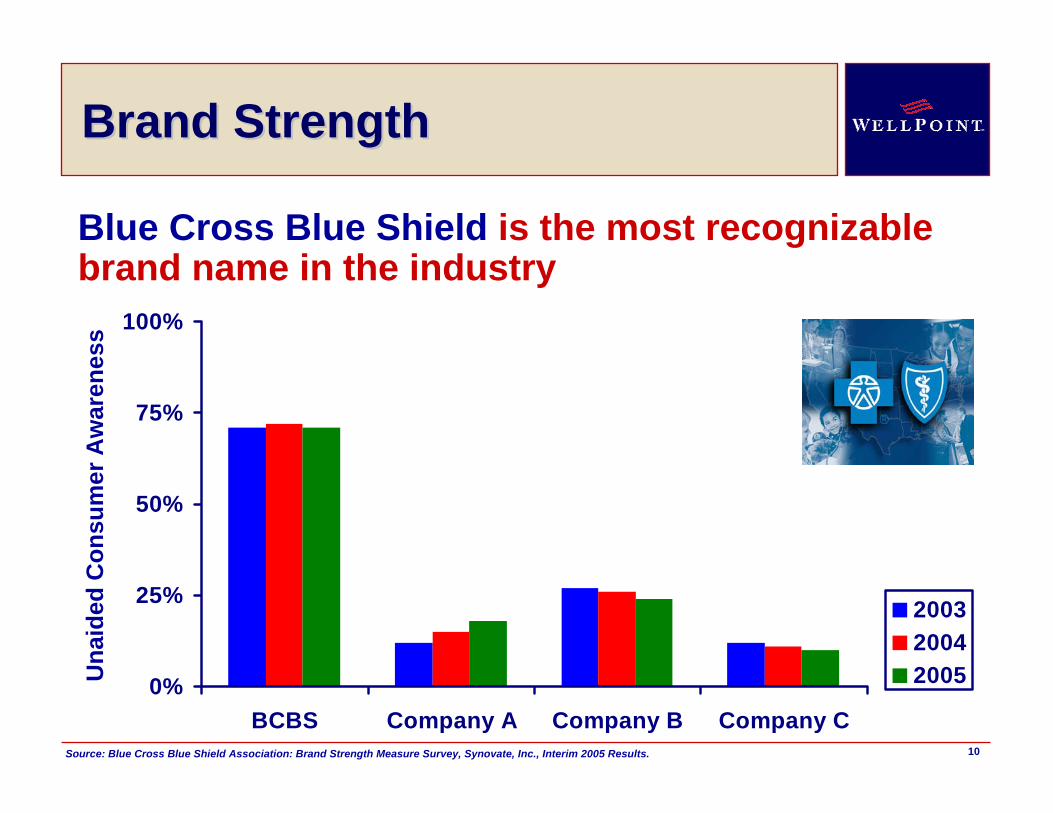
BCBS Company A Company B Company C
200320042005
Brand StrengthBrand Strength
Source: Blue Cross Blue Shield Association: Brand Strength Measure Survey, Synovate, Inc., Interim 2005 Results.
Una
ided
Con
sum
er A
war
enes
s
Blue Cross Blue Shield is the most recognizable brand name in the industry
11
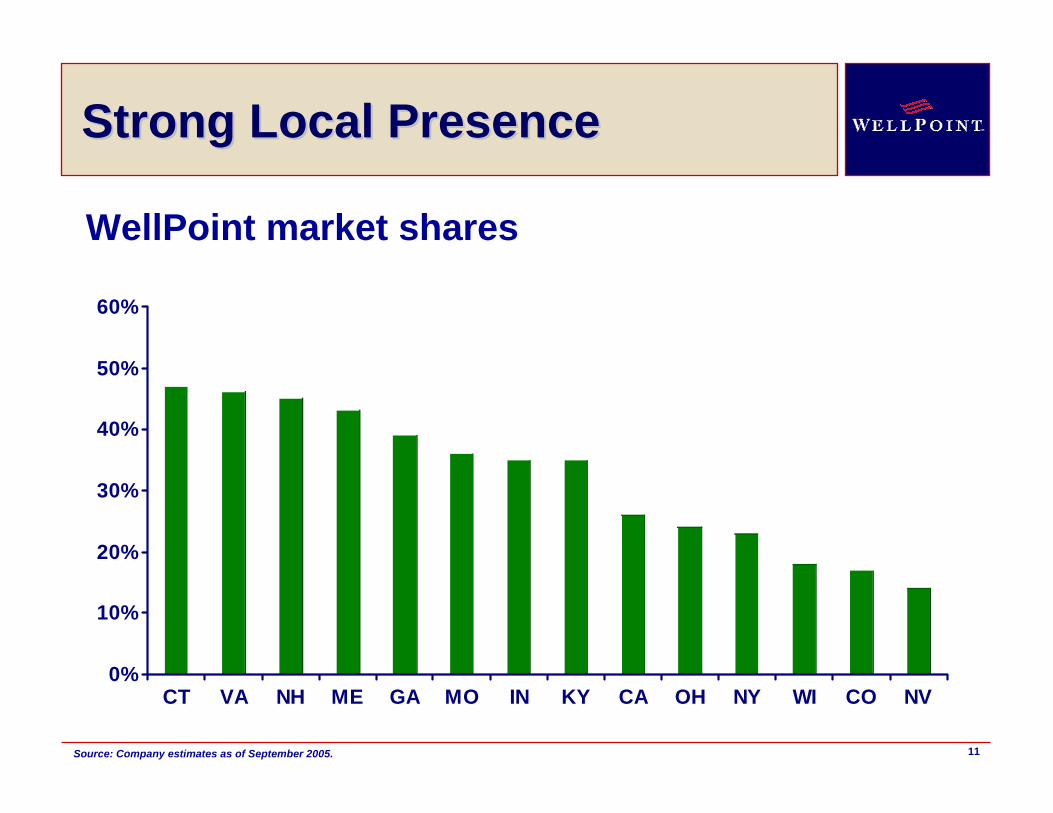
Strong Local PresenceStrong Local Presence
0%
10%
20%
30%
40%
50%
60%
CT VA NH ME GA MO IN KY CA OH NY WI CO NV
Source: Company estimates as of September 2005.
WellPoint market shares
12
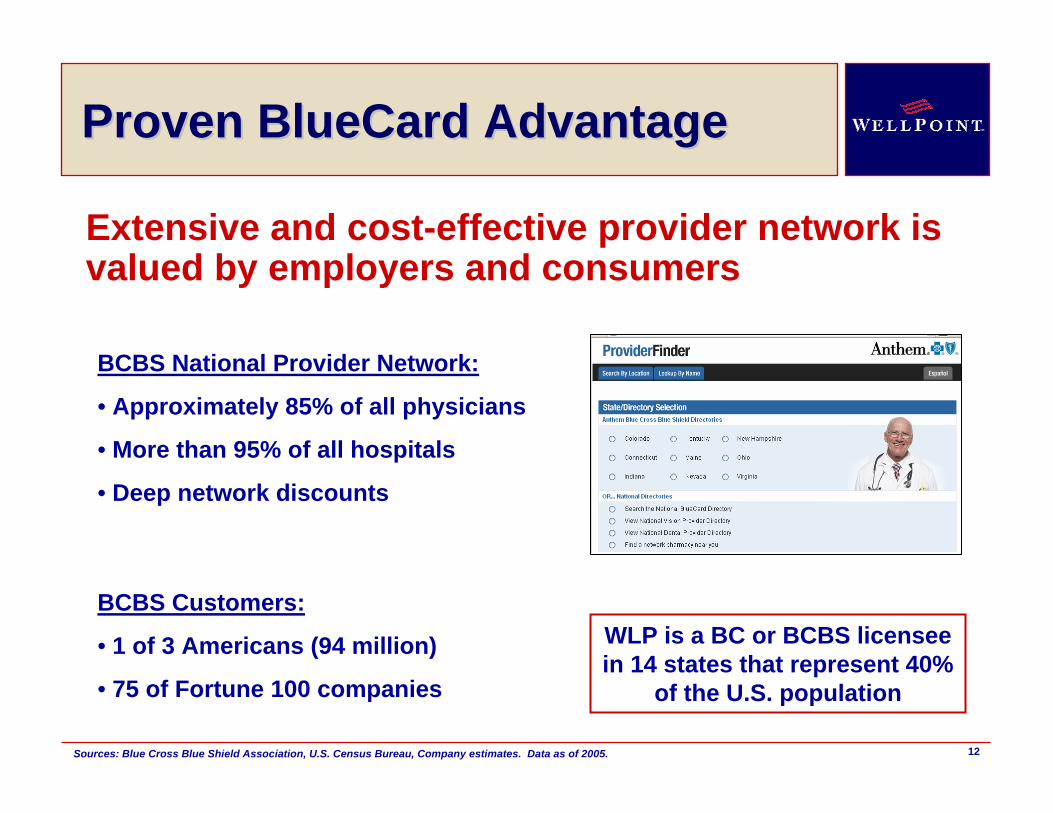
Proven BlueCard Advantage Proven BlueCard Advantage
Extensive and cost-effective provider network is valued by employers and consumers
BCBS National Provider Network:
• Approximately 85% of all physicians
• More than 95% of all hospitals
• Deep network discounts
BCBS Customers:
• 1 of 3 Americans (94 million)
• 75 of Fortune 100 companies
Sources: Blue Cross Blue Shield Association, U.S. Census Bureau, Company estimates. Data as of 2005.
WLP is a BC or BCBS licensee in 14 states that represent 40%
of the U.S. population
13
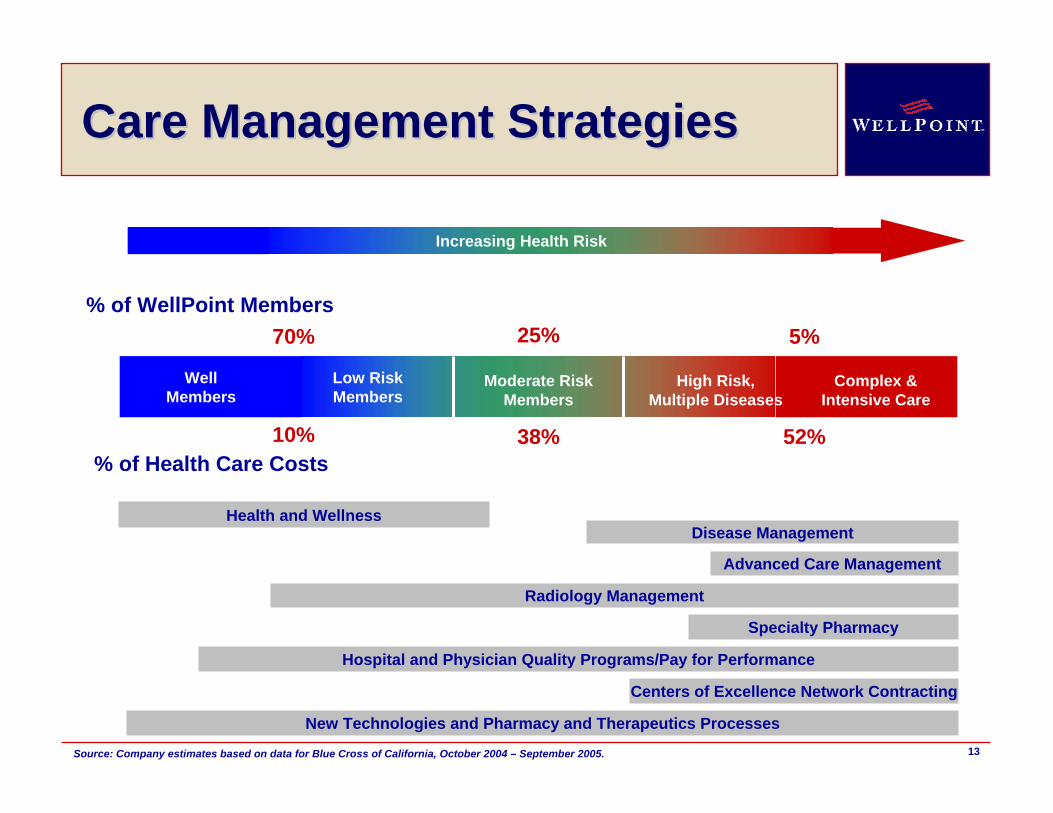
Increasing Health Risk
% of WellPoint Members
% of Health Care Costs
WellMembers
Low RiskMembers
Moderate Risk Members
High Risk,Multiple Diseases
Complex & Intensive Care
Health and WellnessDisease Management
Specialty Pharmacy
Advanced Care Management
Radiology Management
Centers of Excellence Network Contracting
Hospital and Physician Quality Programs/Pay for Performance
New Technologies and Pharmacy and Therapeutics Processes
25%
38% 52%
Care Management StrategiesCare Management Strategies
70%
10%
5%
Increasing Health Risk
Source: Company estimates based on data for Blue Cross of California, October 2004 – September 2005.
14
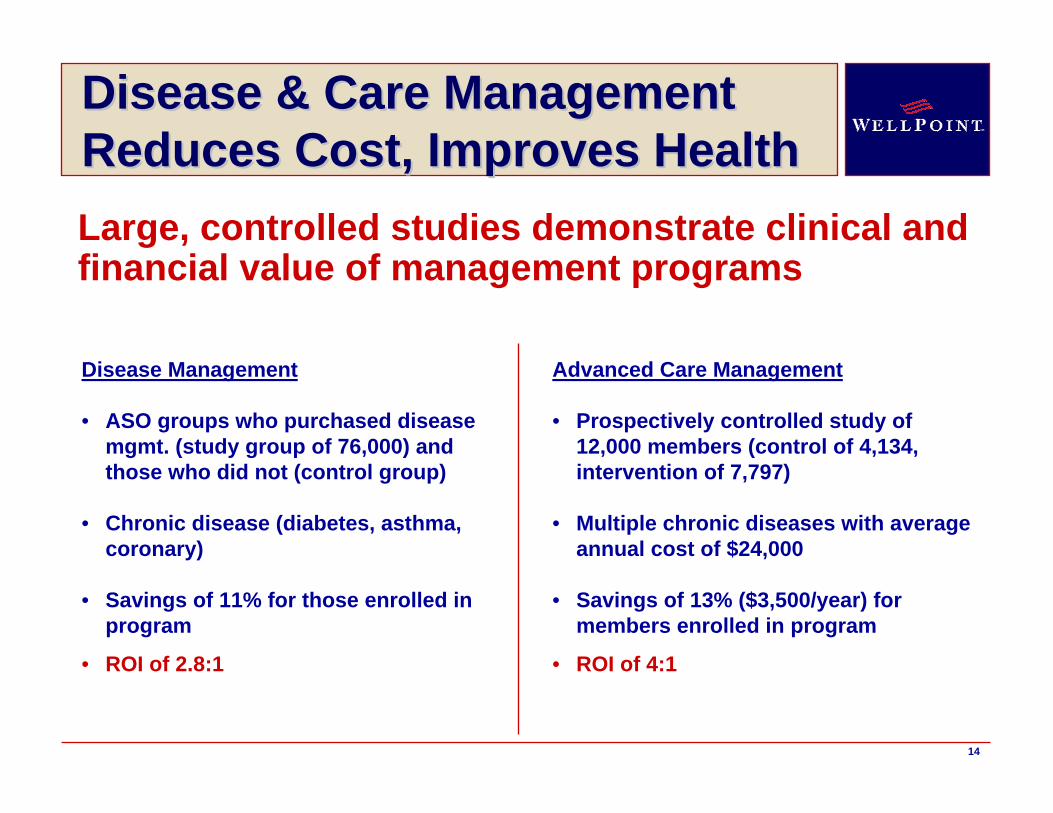
Disease & Care Management Disease & Care Management Reduces Cost, Improves HealthReduces Cost, Improves Health
Disease Management
• ASO groups who purchased disease mgmt. (study group of 76,000) and those who did not (control group)
• Chronic disease (diabetes, asthma, coronary)
• Savings of 11% for those enrolled in program
• ROI of 2.8:1
Large, controlled studies demonstrate clinical and financial value of management programs
Advanced Care Management
• Prospectively controlled study of 12,000 members (control of 4,134, intervention of 7,797)
• Multiple chronic diseases with average annual cost of $24,000
• Savings of 13% ($3,500/year) for members enrolled in program
• ROI of 4:1
15
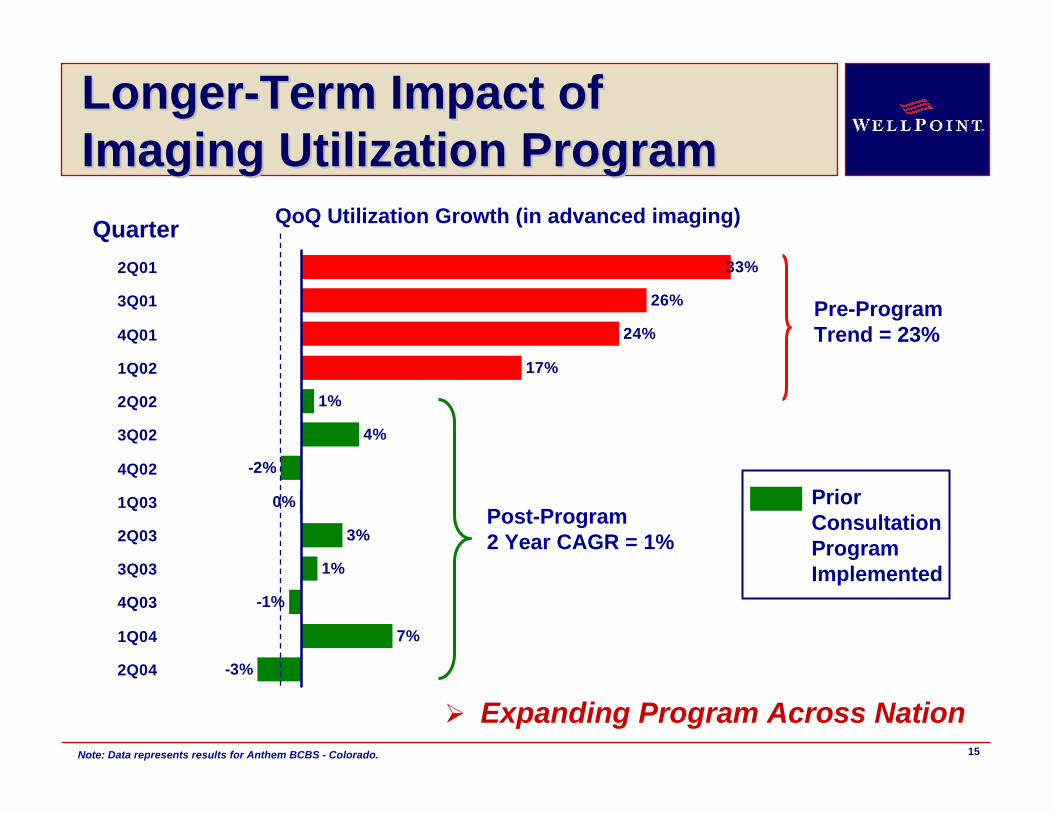
LongerLonger--Term Impact ofTerm Impact ofImaging Utilization ProgramImaging Utilization Program
QoQ Utilization Growth (in advanced imaging)Quarter
-3%
7%
-1%
1%
3%
0%
-2%
4%
1%
17%
24%
26%
33%2Q01
3Q01
4Q01
1Q02
2Q02
3Q02
4Q02
1Q03
2Q03
3Q03
4Q03
1Q04
2Q04
Note: Data represents results for Anthem BCBS - Colorado.
Prior Consultation Program Implemented
Post-Program2 Year CAGR = 1%
Pre-ProgramTrend = 23%
Expanding Program Across Nation
16
AgendaAgenda
• WellPoint Profile
• Superior Value Proposition
• Revenue Growth Opportunities
• 15%+ EPS Growth Target
• Investment Considerations

17* Data includes both the former Anthem, Inc. and the former WellPoint Health Networks Inc.
5,599
6,675
8,691
National Accounts Year-End Membership
Increase of almost2 million members, or 35%,
over last 2 years(excluding WellChoice)
(In T
hous
ands
)
BlueCard membership
Control Accounts
The Choice for National AccountsThe Choice for National Accounts
7,549
2003 * 2004 2005(w/o WC)
2005(w/ WC)

18
ABC, Inc.WellPoint Value Summary
January 01, 2005 Through December 31, 2005
17.83$ 2,503,332$
9.00$ 1,263,600$ 21,060,000$
26.83$ 3,766,932$ 21,060,000$
IRIS Patient Safety 2.54$ 356,616$ 820,217$
1.95$ 273,780$ 903,474$
Primary Nurse 0.25$ 35,100$ 63,180$
0.90$ 126,360$ 265,356$
0.75$ 105,300$ 136,890$
6.39$ 897,156$ 2,189,117$
15.39$ 2,160,756$ 23,249,117$ Total Savings
Total ROI per $1 in Provider Management fees 16.7 Total ROI per $1 in Medical Management fees 2.4
Total ROI per $1 in Provider and Med Management fees 10.8
* Any network access fees are subtracted from provider savings.
Basic Administrative Fees
TPA services
Claims cost and Provider management services
Provider Management Savings
Other Programs -- Interventions by Anthem ( Baby Benefits, Health Advocate)
Basic Administrative Fee Total
Medical Mangement Fees Medical Management Savings
Disease State Management Programs
Other Programs -- Employee Initiative Programs ( 24 hour Nurseline, HRA, Web Site, Worksite wellness, Intune)
Total Medical Mangement Administrative fees Total Med Mgmt Savings
Grand Total - All Administrative Fees, except TPA services
WellPoint Value Administrative
fees PEPM
WellPoint Value Administrative fees
Total PaidWellPoint Savings on
Services Provided
Provider Discounts, Claims Quest, Provider Review, Precert
Report 1.3Report 1.3
WellPoint saves $10.80 for every $1.00 of Provider and Medical Management fees invested by ABC, Inc.
Demonstrating Value to Demonstrating Value to CustomersCustomers
10.8Total ROI per $1 in Provider and Med. Mgmt. Fees2.4Total ROI per $1 in Medical Management Fees
16.7Total ROI per $1 in Provider Management Fees
Sample report for illustrative
purposes
19
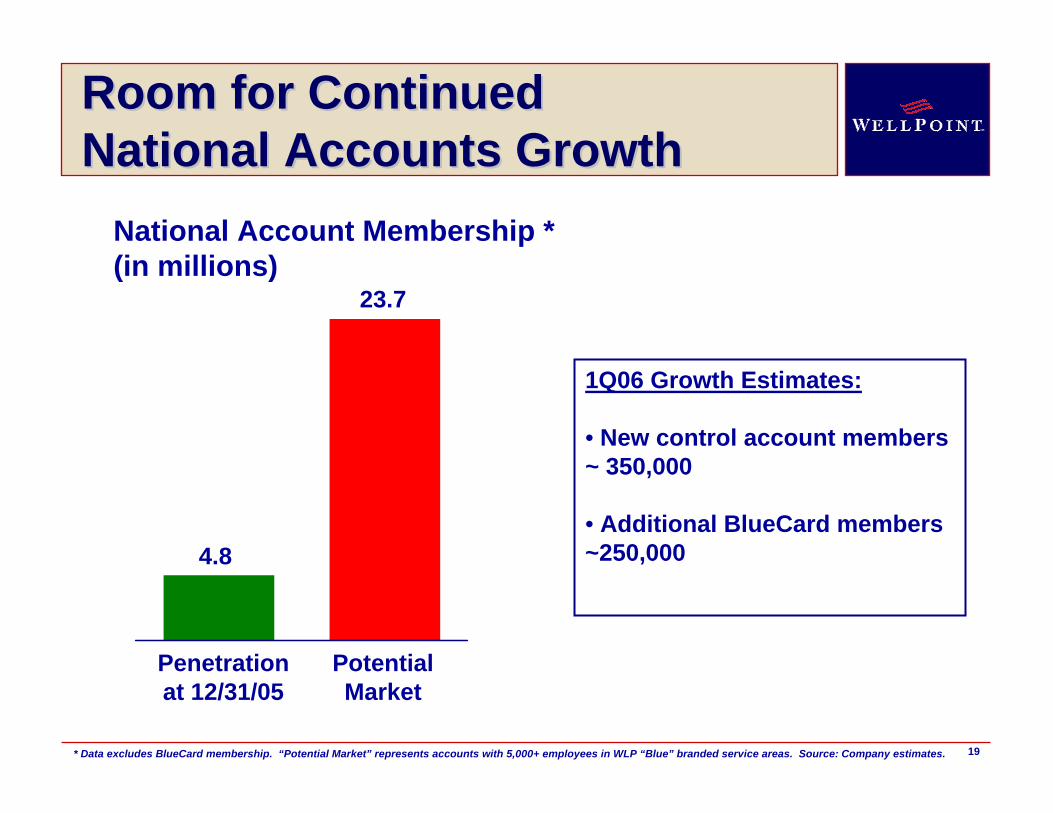
Room for ContinuedRoom for ContinuedNational Accounts GrowthNational Accounts Growth
* Data excludes BlueCard membership. “Potential Market” represents accounts with 5,000+ employees in WLP “Blue” branded service areas. Source: Company estimates.
National Account Membership * (in millions)
23.7
4.8
Penetrationat 12/31/05
PotentialMarket
1Q06 Growth Estimates:
• New control account members ~ 350,000
• Additional BlueCard members ~250,000

20
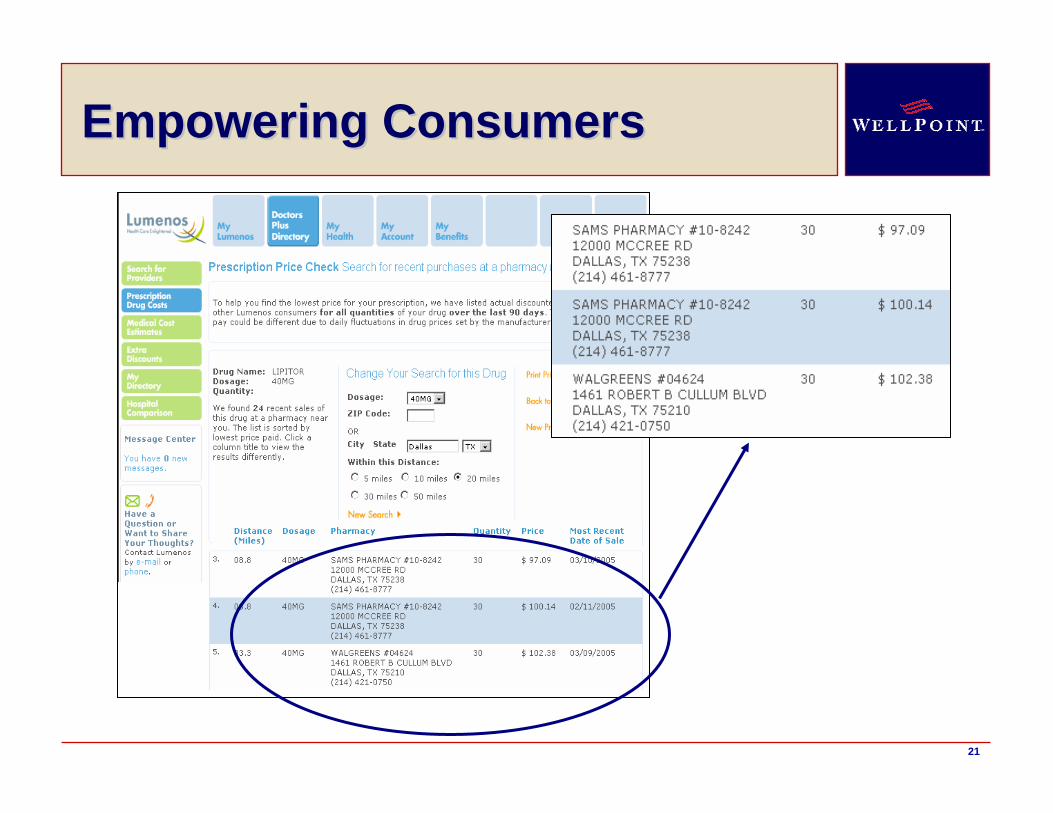
A Leader in ConsumerA Leader in Consumer--Directed Directed Health CareHealth Care
• 75% of 1/1/06 National Account RFP’s requested CDHP options
• 12 new 1/1/06 account wins were joint sales with Lumenos
• 507,000 CDHP members at 12/31/05, including an increase of 28% since 6/30/05
21
Empowering ConsumersEmpowering Consumers
22
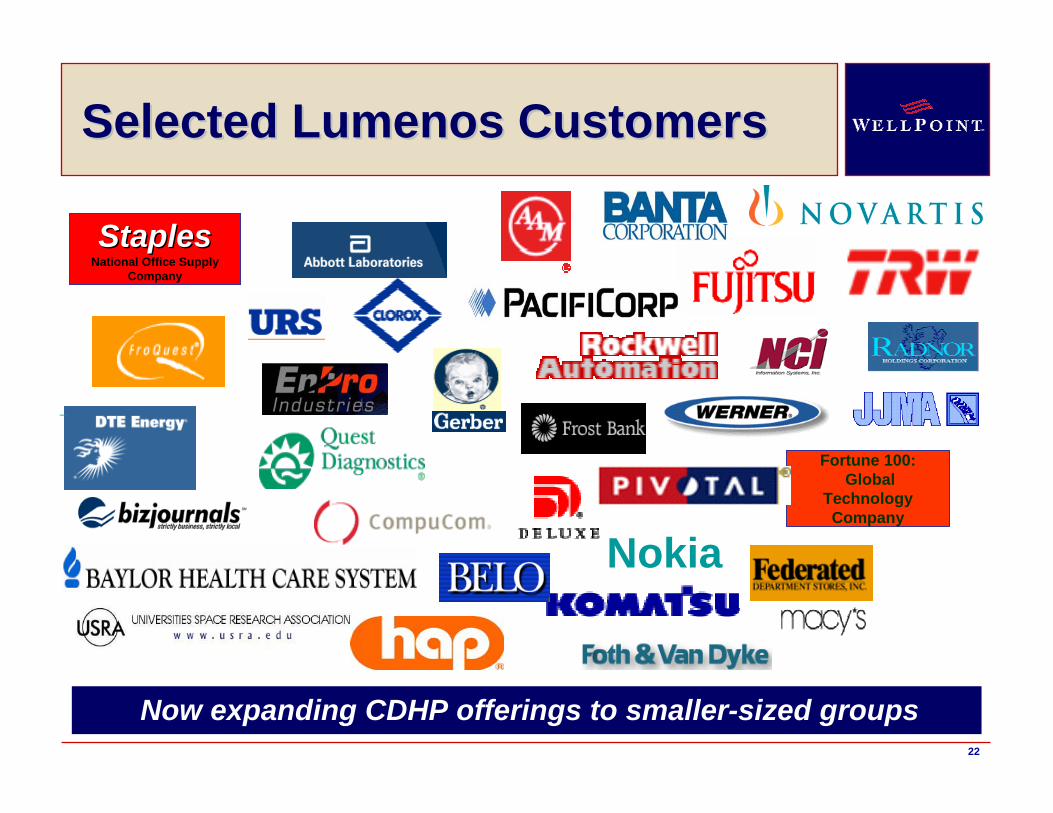
Selected Lumenos CustomersSelected Lumenos Customers
Fortune 100:Global
Technology Company
StaplesStaplesNational Office Supply
Company
Nokia
Now expanding CDHP offerings to smaller-sized groups

23
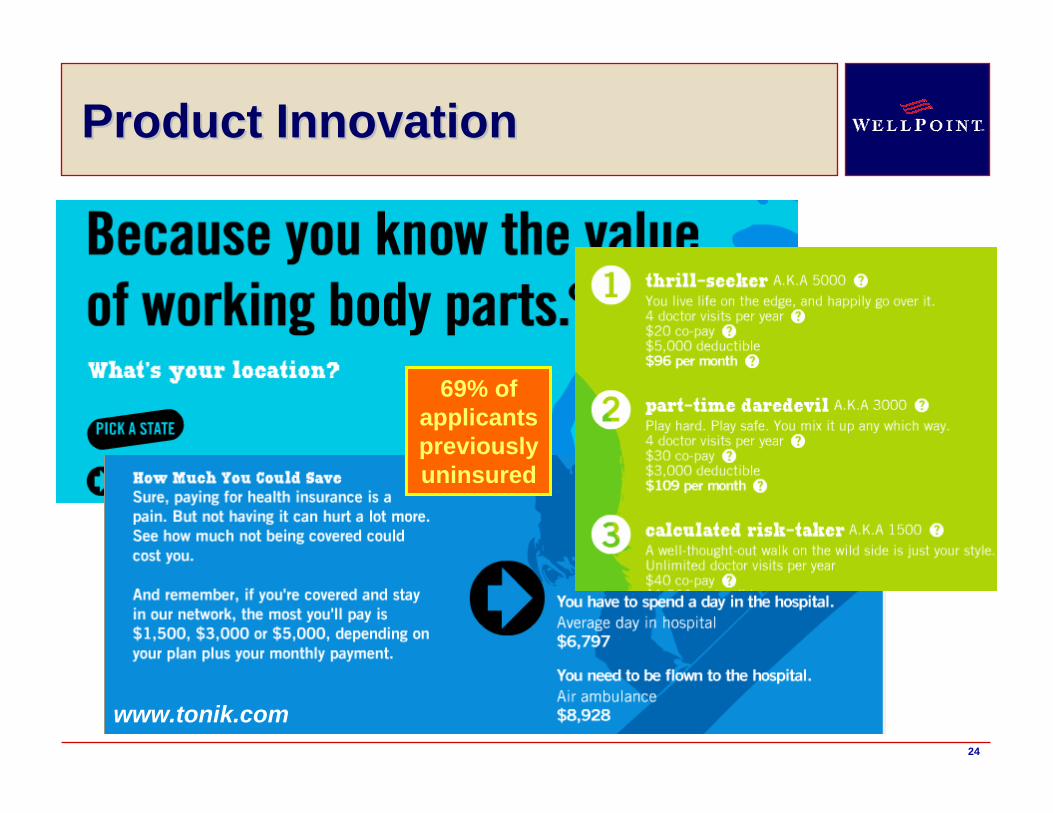
DirigoChoice
Uninsured Americans:Uninsured Americans:A Growth OpportunityA Growth OpportunityIn 2005, approximately 378,000 new WLP enrollees were previously uninsured
Tonik
Blue Access Economy
BeneFits
Community resource centers
Enrollment vans
Low-to-moderate
income~ 16M
Eligible for public programs~14M
Household income > $50,000
~ 16M
SelectHMO & PPO
Sources: Blue Cross Blue Shield Association, U.S. Census Bureau, August 2005.
BasicChoice
24
Product InnovationProduct Innovation
www.tonik.com
69% of applicants previously uninsured
25
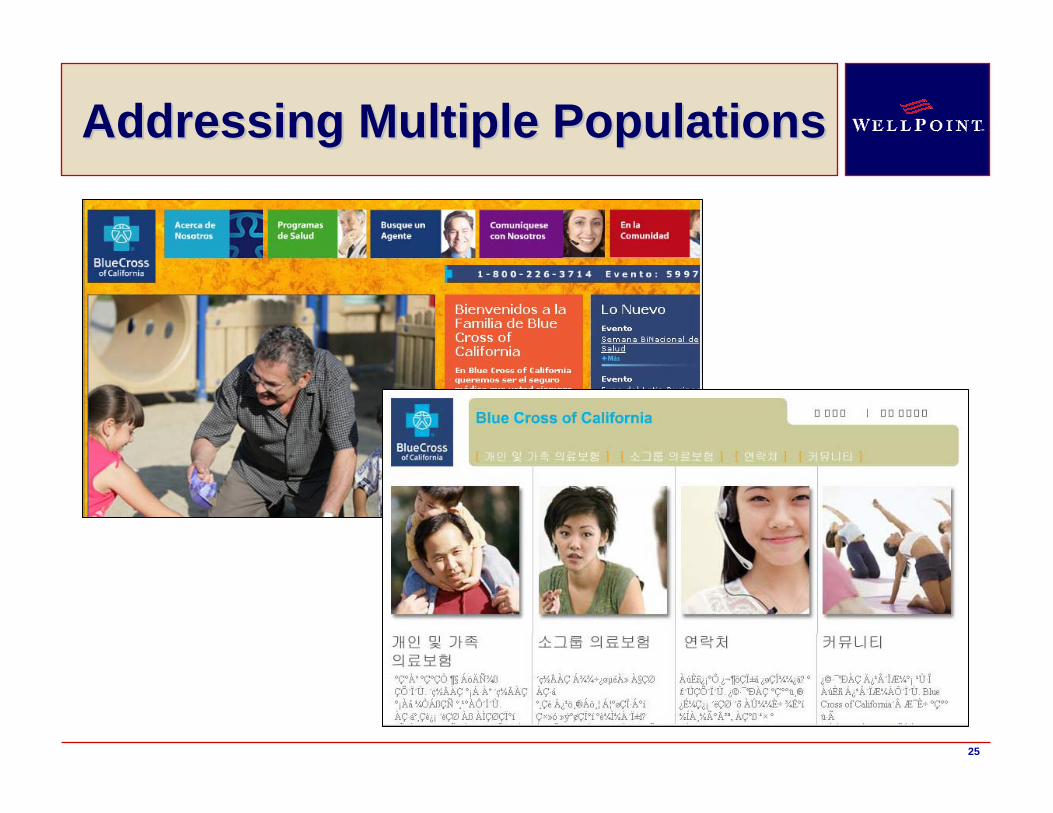
Addressing Multiple PopulationsAddressing Multiple Populations
26
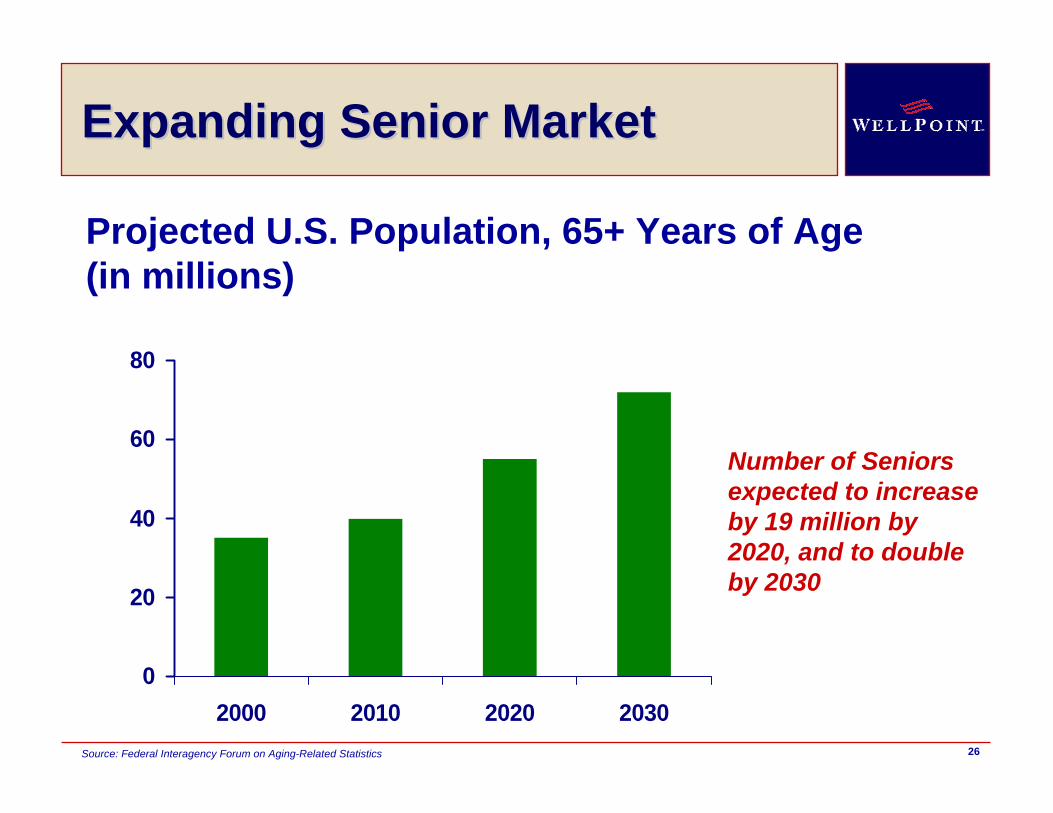
Expanding Senior MarketExpanding Senior Market
0
20
40
60
80
2000 2010 2020 2030
Projected U.S. Population, 65+ Years of Age (in millions)
Source: Federal Interagency Forum on Aging-Related Statistics
Number of Seniors expected to increase by 19 million by 2020, and to double by 2030
27
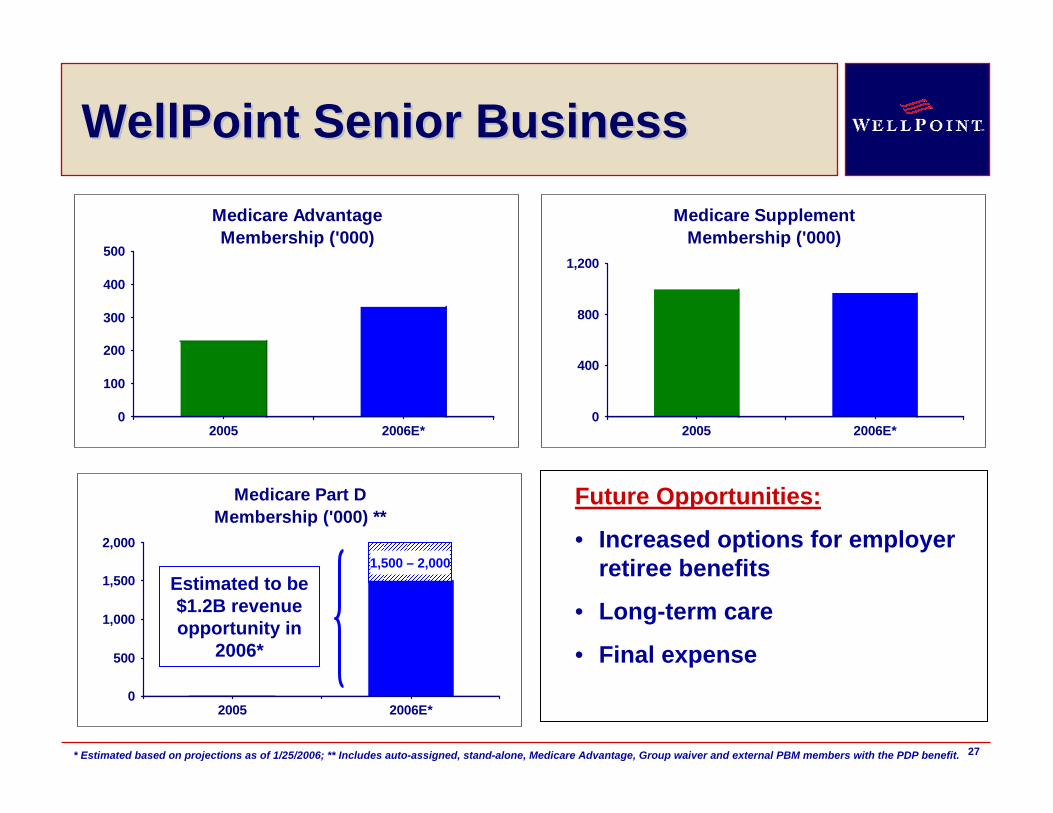
0
500
1,000
1,500
2,000
2005 2006E*
Medicare Part DMembership ('000) **
WellPoint Senior BusinessWellPoint Senior Business
0
100
200
300
400
500
2005 2006E*
Medicare AdvantageMembership ('000)
0
400
800
1,200
2005 2006E*
Medicare SupplementMembership ('000)
* Estimated based on projections as of 1/25/2006; ** Includes auto-assigned, stand-alone, Medicare Advantage, Group waiver and external PBM members with the PDP benefit.
Estimated to be $1.2B revenue opportunity in
2006*
Future Opportunities:
• Increased options for employer retiree benefits
• Long-term care
• Final expense
1,500 – 2,000
28
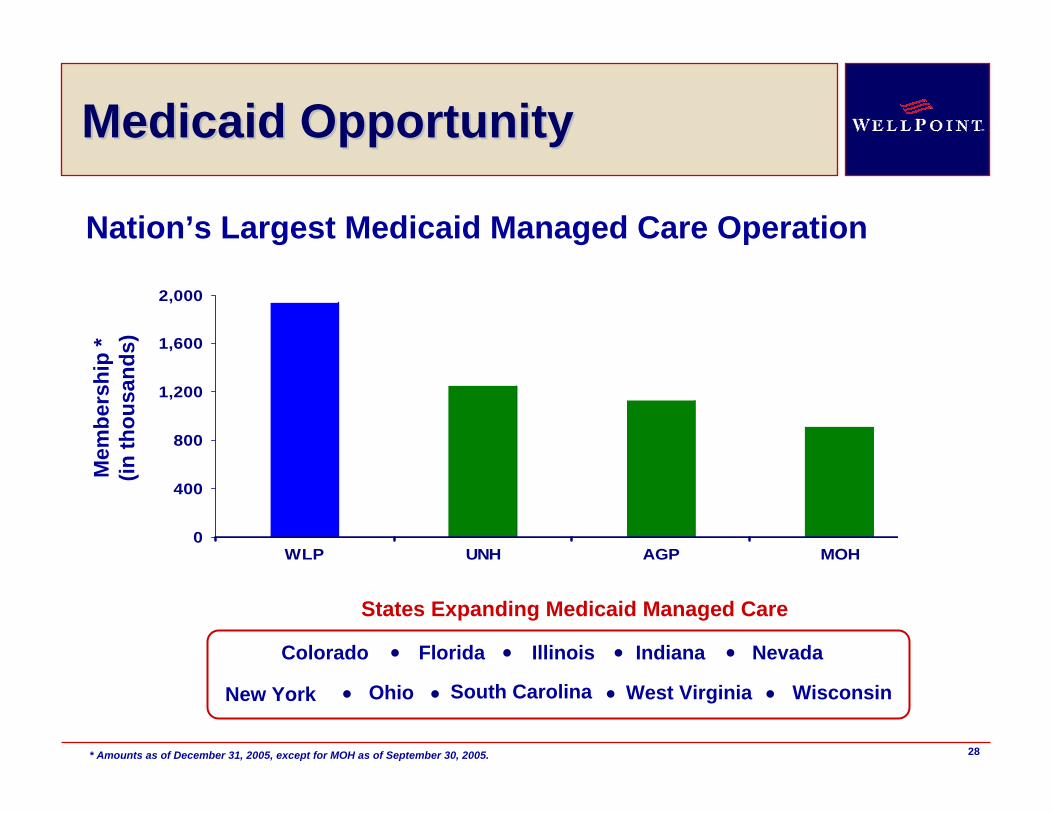
0
400
800
1,200
1,600
2,000
WLP UNH AGP MOH
States Expanding Medicaid Managed Care
Medicaid Opportunity Medicaid Opportunity
Nation’s Largest Medicaid Managed Care Operation
Mem
bers
hip
* (in
thou
sand
s)
* Amounts as of December 31, 2005, except for MOH as of September 30, 2005.
Ohio
Indiana
South Carolina Wisconsin
FloridaColorado Illinois Nevada
New York West Virginia
29
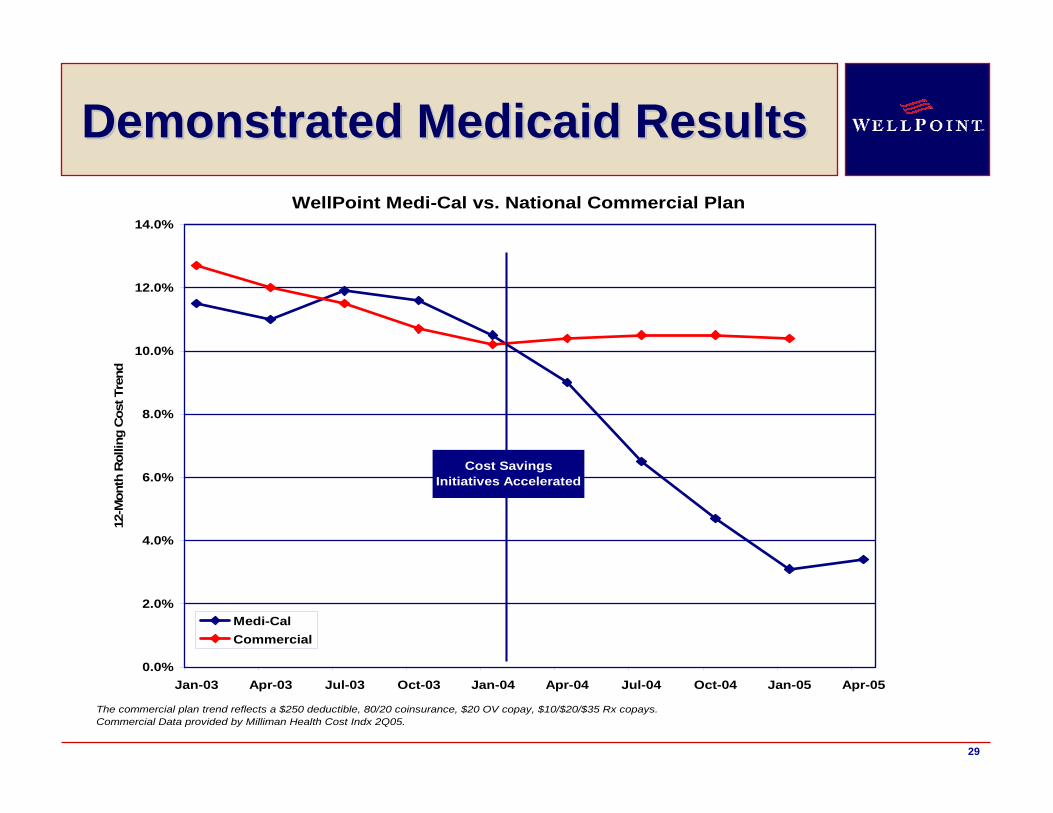
Demonstrated Medicaid ResultsDemonstrated Medicaid ResultsWellPoint Medi-Cal vs. National Commercial Plan
0.0%
2.0%
4.0%
6.0%
8.0%
10.0%
12.0%
14.0%
Jan-03 Apr-03 Jul-03 Oct-03 Jan-04 Apr-04 Jul-04 Oct-04 Jan-05 Apr-05
12-M
onth
Rol
ling
Cos
t Tre
nd
Medi-CalCommercial
The commercial plan trend reflects a $250 deductible, 80/20 coinsurance, $20 OV copay, $10/$20/$35 Rx copays.Commercial Data provided by Milliman Health Cost Indx 2Q05.
Cost Savings Initiatives Accelerated
30
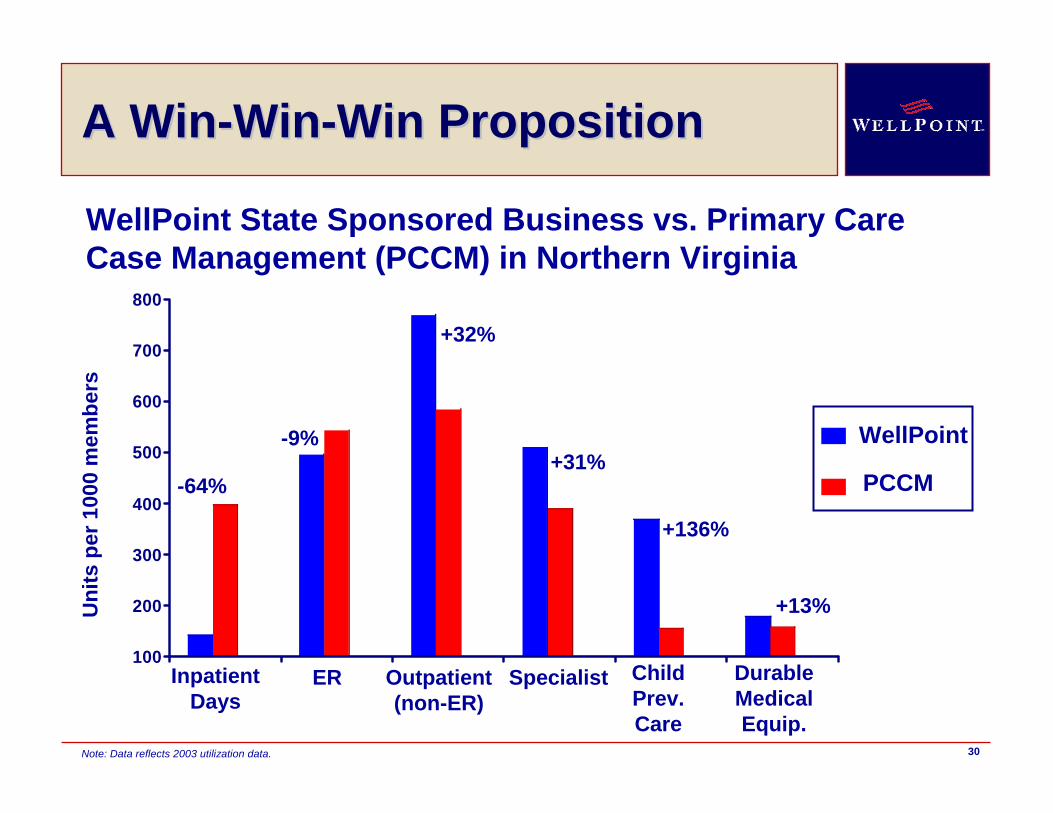
100
200
300
400
500
600
700
800
WellPoint
PCCM-64%
-9%
+32%
+31%
+136%
+13%Uni
ts p
er 1
000
mem
bers
Inpatient Days
ER Outpatient(non-ER)
Specialist Child Prev. Care
Durable Medical Equip.
WellPoint State Sponsored Business vs. Primary Care Case Management (PCCM) in Northern Virginia
A WinA Win--WinWin--Win PropositionWin Proposition
Note: Data reflects 2003 utilization data.
31
AgendaAgenda
• WellPoint Profile
• Superior Value Proposition
• Revenue Growth Opportunities
• 15%+ EPS Growth Target
• Investment Considerations
32
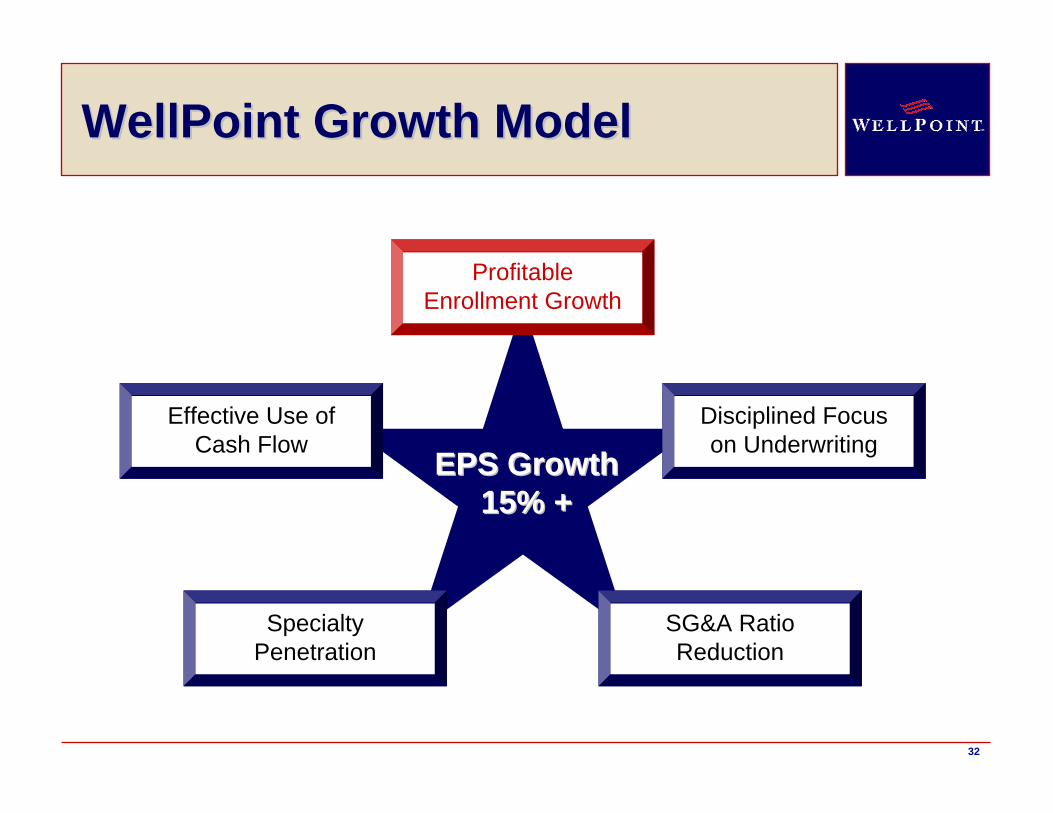
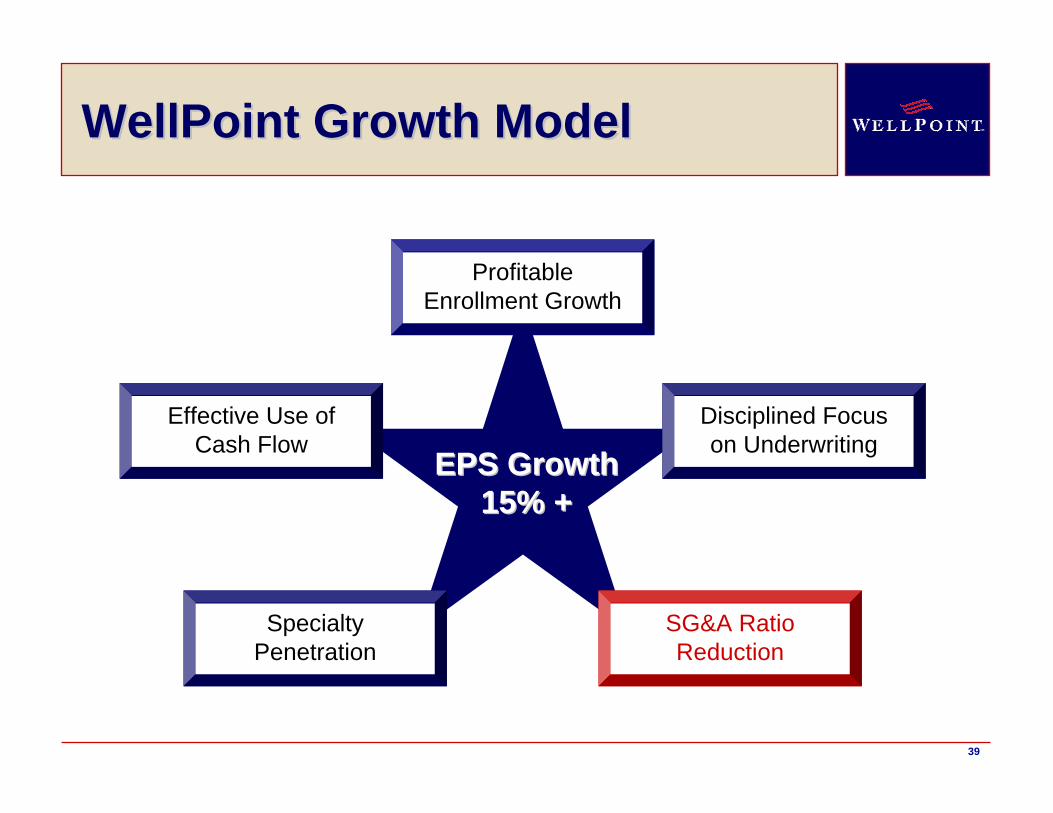
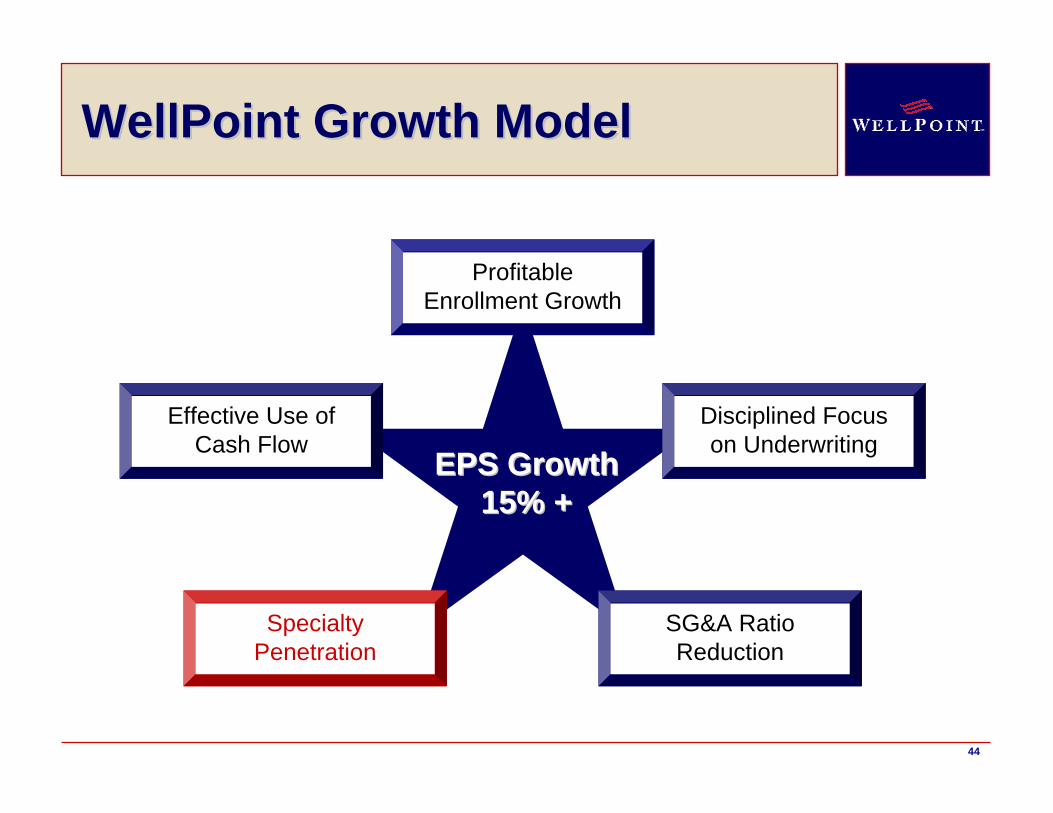
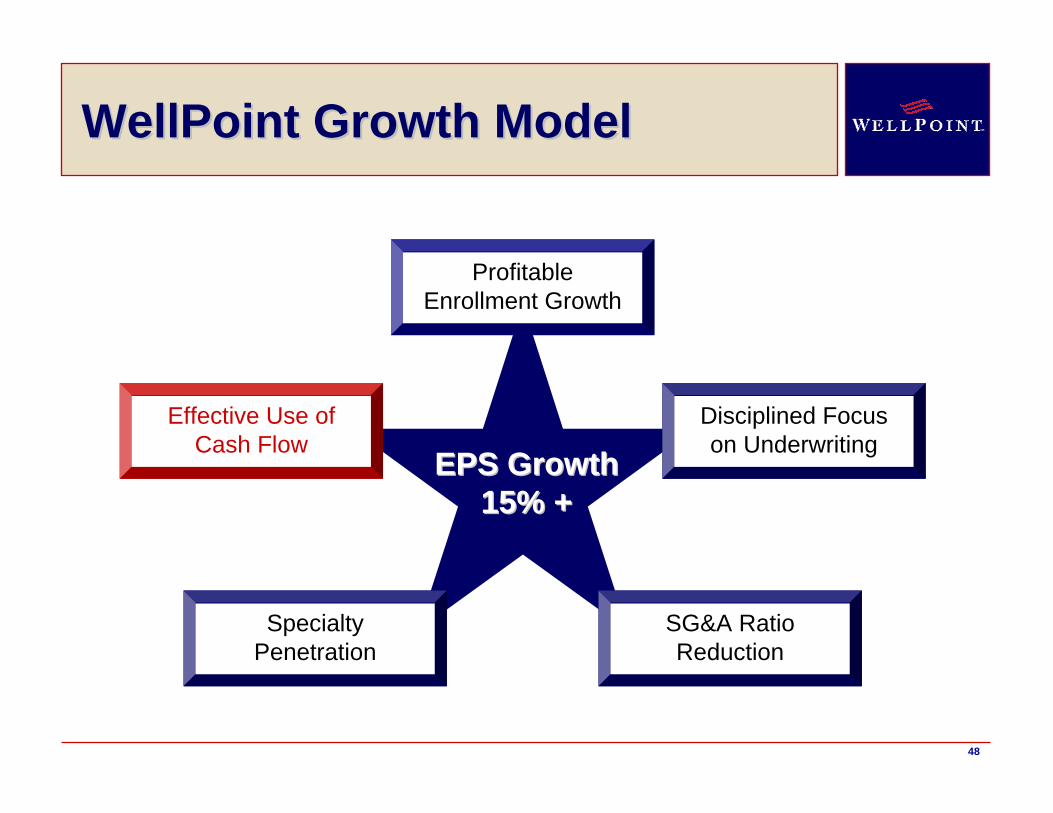
WellPoint Growth ModelWellPoint Growth Model
EPS GrowthEPS Growth15% +15% +
Profitable Enrollment Growth
Disciplined Focus on Underwriting
Effective Use of Cash Flow
SG&A Ratio Reduction
Specialty Penetration

33
Significant Growth OpportunitiesSignificant Growth Opportunities

34
WellPoint Growth ModelWellPoint Growth Model
EPS GrowthEPS Growth15% +15% +
Profitable Enrollment Growth
Disciplined Focus on Underwriting
Effective Use of Cash Flow
SG&A Ratio Reduction
Specialty Penetration
35
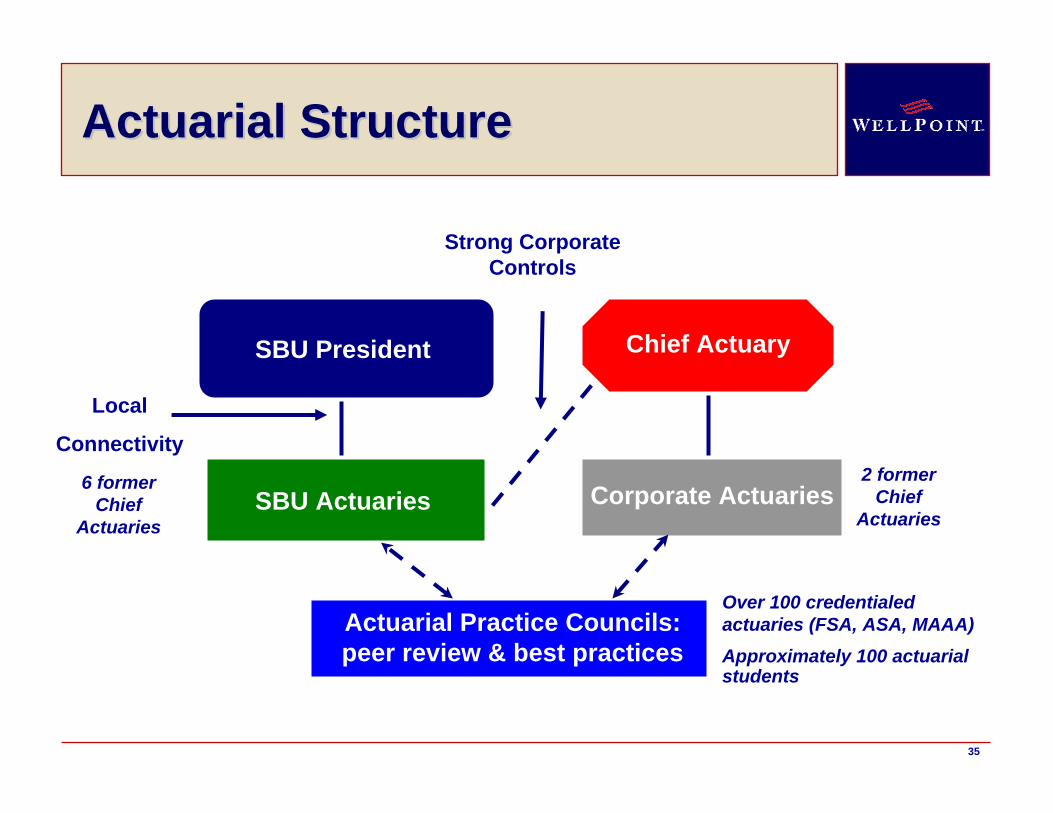
Actuarial StructureActuarial Structure
Actuarial Practice Councils:peer review & best practices
SBU President
SBU Actuaries
Chief Actuary
Local
Connectivity
Over 100 credentialed actuaries (FSA, ASA, MAAA)Approximately 100 actuarial students
Corporate Actuaries2 former
Chief Actuaries
6 formerChief
Actuaries
Strong Corporate Controls
36
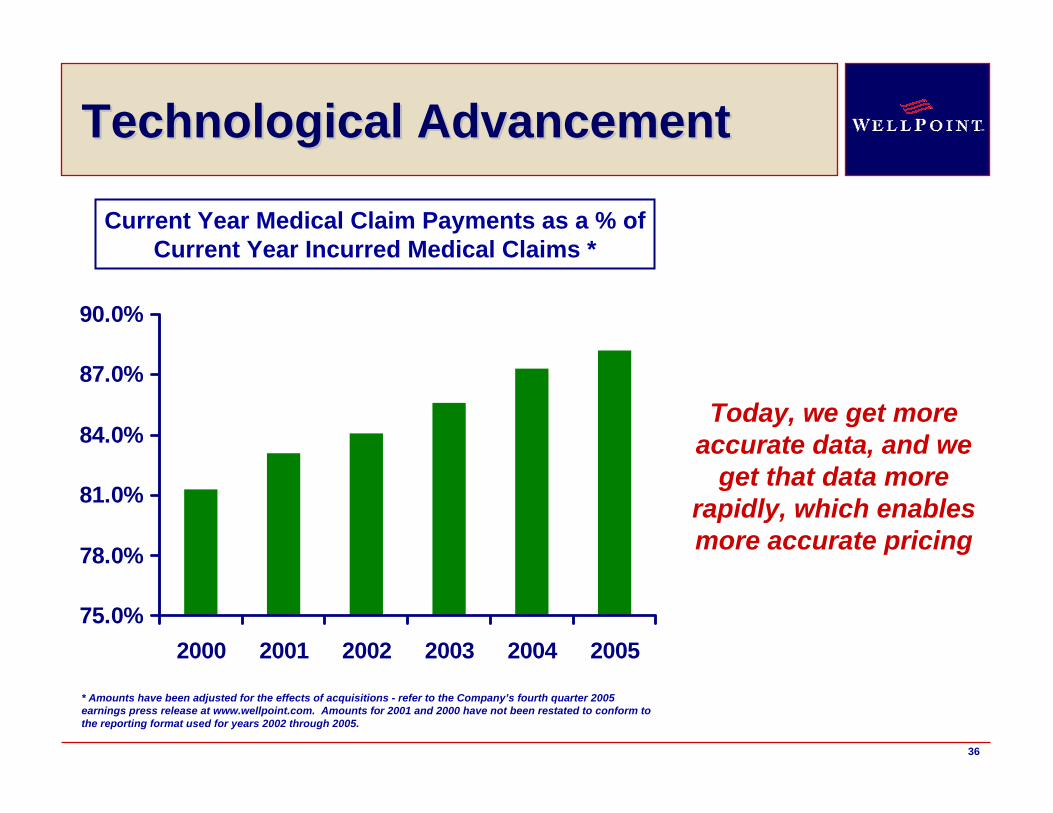
Technological AdvancementTechnological Advancement
Today, we get more accurate data, and we
get that data more rapidly, which enables more accurate pricing
75.0%
78.0%
81.0%
84.0%
87.0%
90.0%
2000 2001 2002 2003 2004 2005
Current Year Medical Claim Payments as a % of Current Year Incurred Medical Claims *
* Amounts have been adjusted for the effects of acquisitions - refer to the Company’s fourth quarter 2005 earnings press release at www.wellpoint.com. Amounts for 2001 and 2000 have not been restated to conform to the reporting format used for years 2002 through 2005.
37
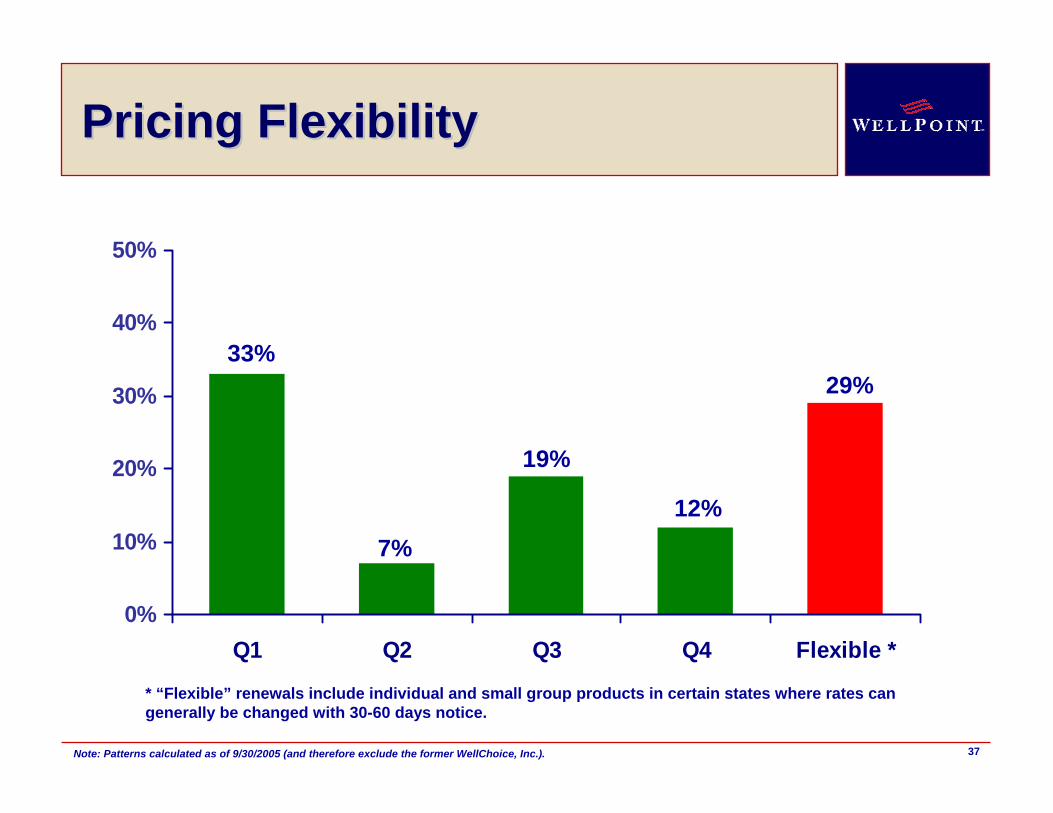
Pricing FlexibilityPricing Flexibility
0%
10%
20%
30%
40%
50%
Q1 Q2 Q3 Q4 Flexible *
* “Flexible” renewals include individual and small group products in certain states where rates can generally be changed with 30-60 days notice.
33%
7%
19%
12%
29%
Note: Patterns calculated as of 9/30/2005 (and therefore exclude the former WellChoice, Inc.).
38
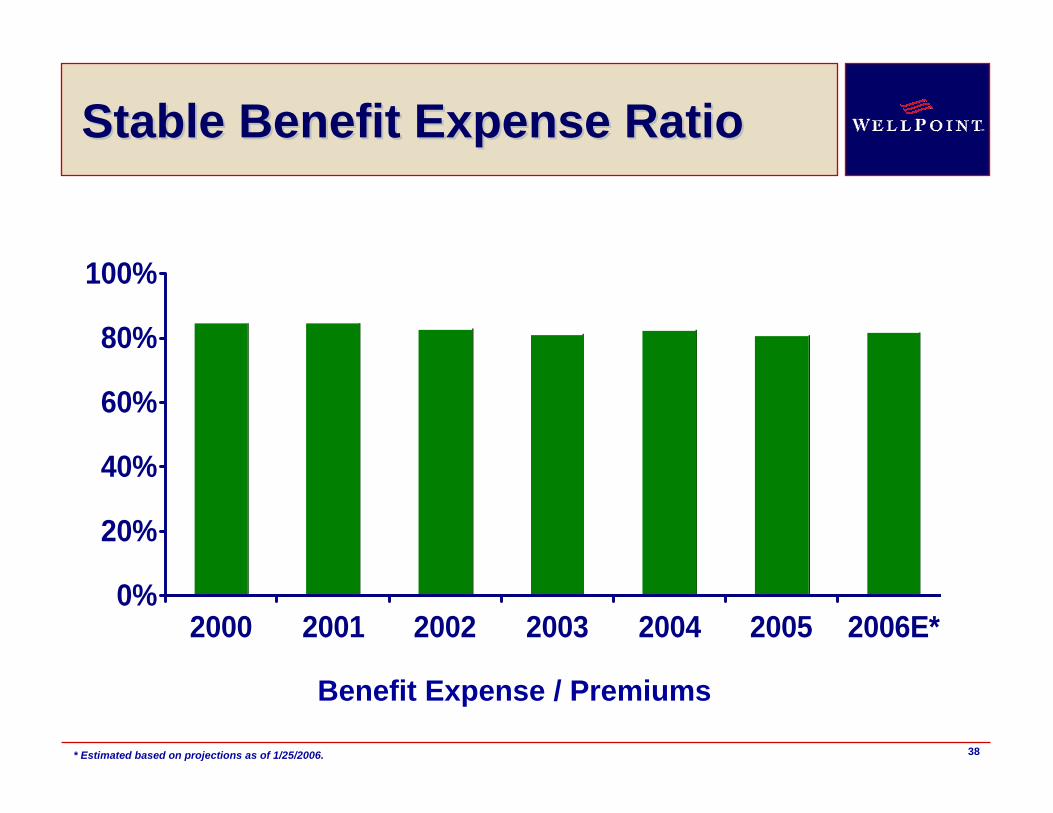
0%
20%
40%
60%
80%
100%
2000 2001 2002 2003 2004 2005 2006E*
Benefit Expense / Premiums
Stable Benefit Expense RatioStable Benefit Expense Ratio
* Estimated based on projections as of 1/25/2006.
39
WellPoint Growth ModelWellPoint Growth Model
EPS GrowthEPS Growth15% +15% +
Profitable Enrollment Growth
Disciplined Focus on Underwriting
Effective Use of Cash Flow
SG&A Ratio Reduction
Specialty Penetration
40
0%
5%
10%
15%
20%
25%
2000 2001 2002 2003 2004 2005 2006E*
SG&A Expense / Total Operating Revenue
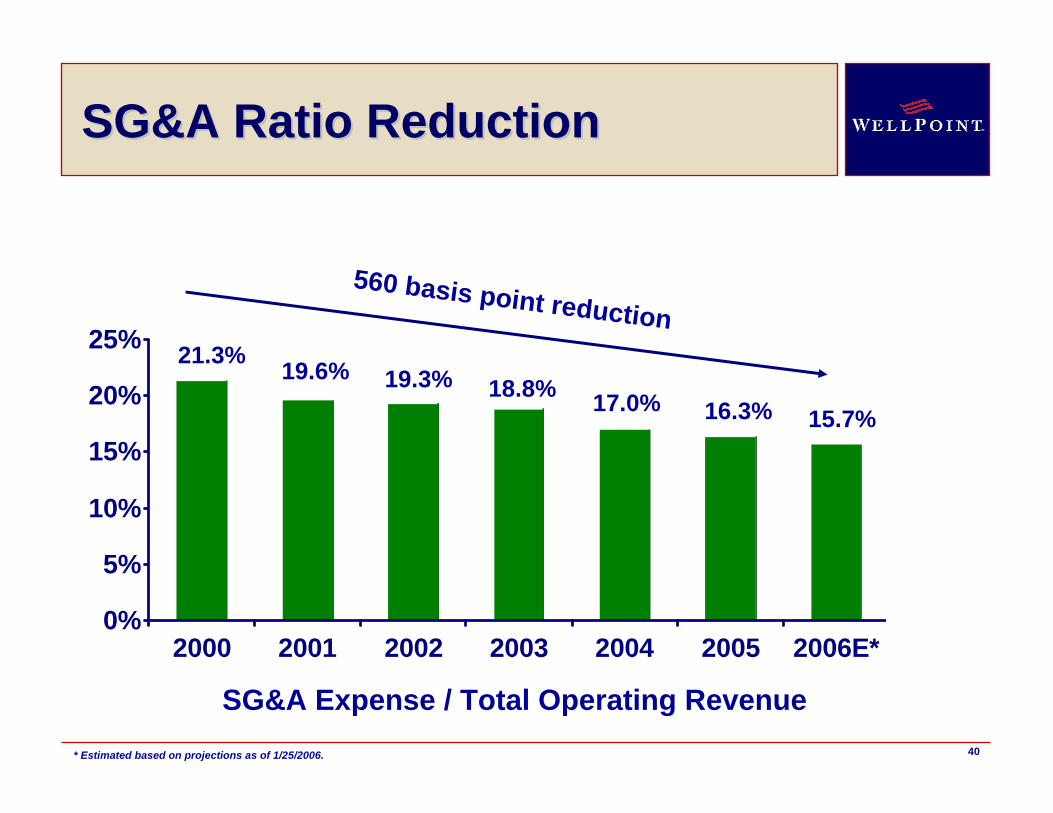
SG&A Ratio ReductionSG&A Ratio Reduction
560 basis point reduction21.3% 19.6% 19.3% 18.8% 17.0% 16.3%
* Estimated based on projections as of 1/25/2006.
15.7%
41
Leveraging TechnologyLeveraging Technology
71.3%
73.4%
69.0%
70.0%
71.0%
72.0%
73.0%
74.0%
75.0%
76.0%
4Q04 4Q05
Auto-Adjudication Rates
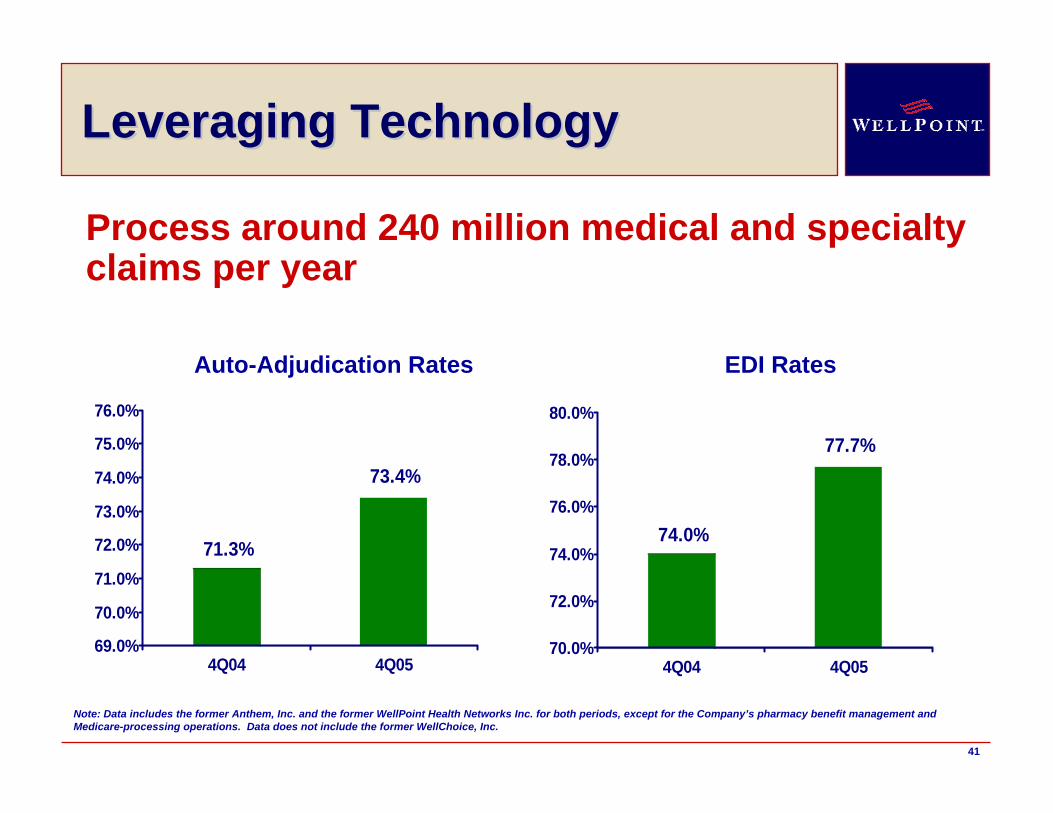
Process around 240 million medical and specialty claims per year
74.0%
77.7%
70.0%
72.0%
74.0%
76.0%
78.0%
80.0%
4Q04 4Q05
EDI Rates
Note: Data includes the former Anthem, Inc. and the former WellPoint Health Networks Inc. for both periods, except for the Company’s pharmacy benefit management and Medicare-processing operations. Data does not include the former WellChoice, Inc.
42
Becoming More EfficientBecoming More Efficient
450
550
650
750
850
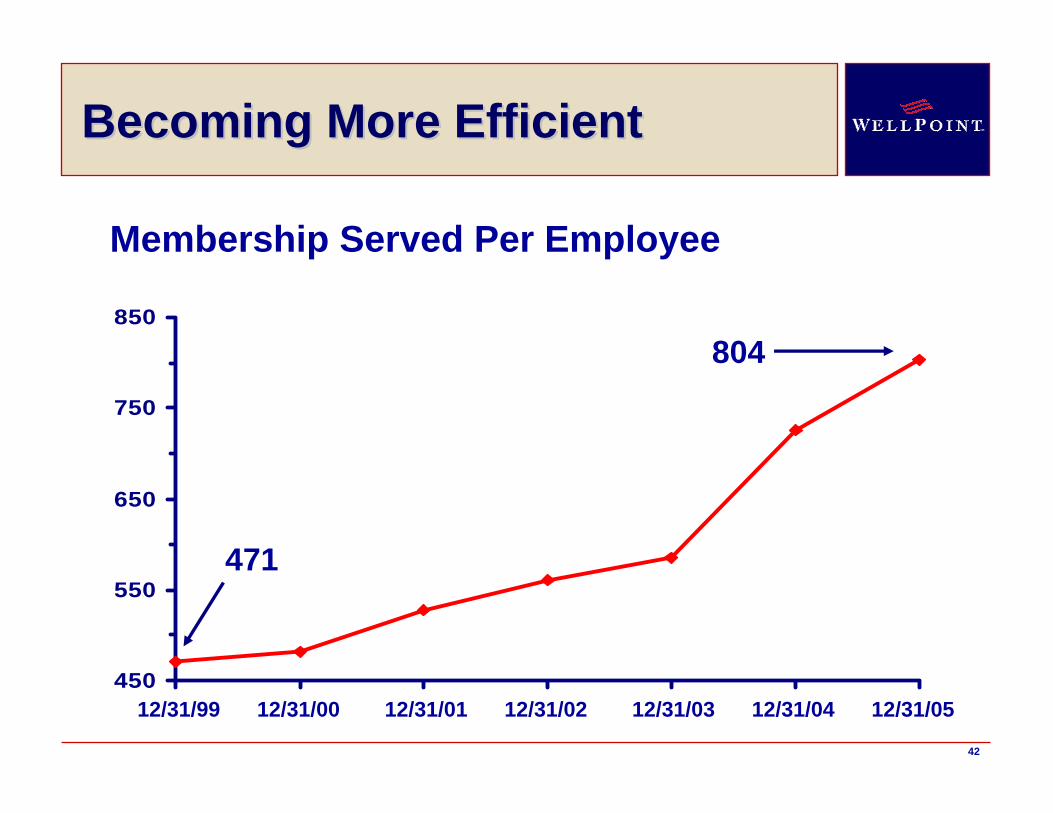
Membership Served Per Employee
12/31/99 12/31/01 12/31/03 12/31/0512/31/00 12/31/02 12/31/04
804
471
43
Integration Synergies (PreIntegration Synergies (Pre--Tax)Tax)
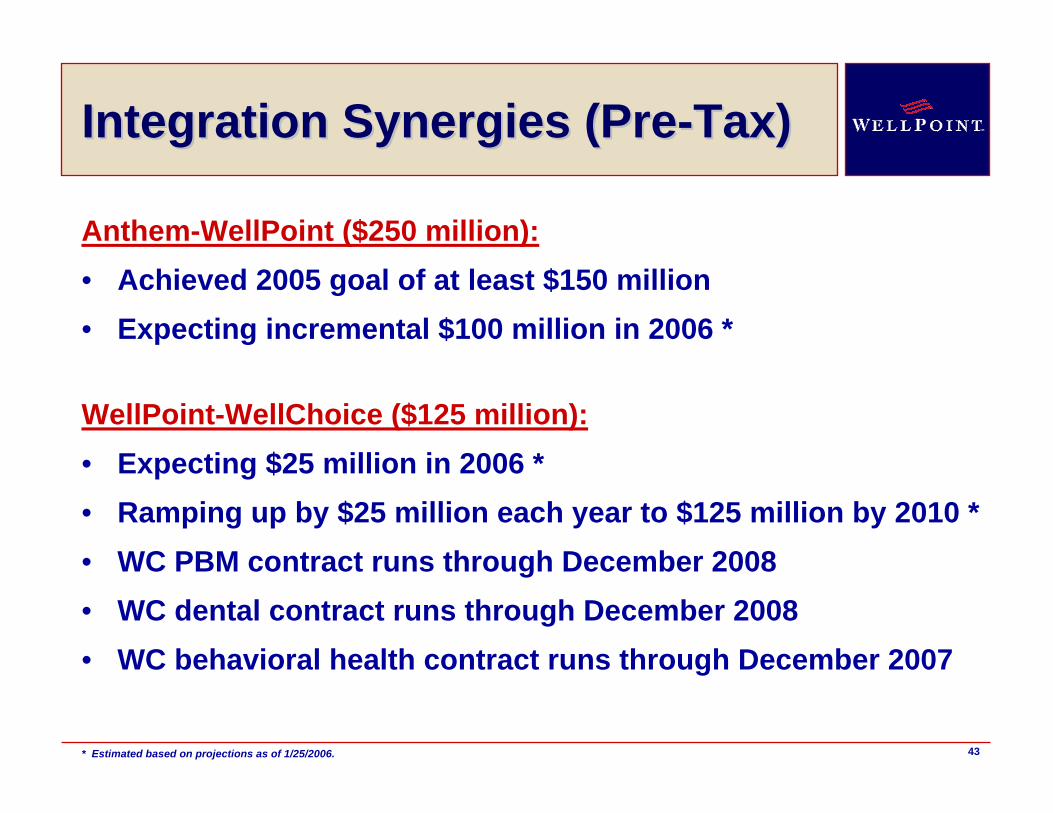
Anthem-WellPoint ($250 million):• Achieved 2005 goal of at least $150 million• Expecting incremental $100 million in 2006 *
* Estimated based on projections as of 1/25/2006.
WellPoint-WellChoice ($125 million):• Expecting $25 million in 2006 *• Ramping up by $25 million each year to $125 million by 2010 *• WC PBM contract runs through December 2008• WC dental contract runs through December 2008• WC behavioral health contract runs through December 2007
44
WellPoint Growth ModelWellPoint Growth Model
EPS GrowthEPS Growth15% +15% +
Profitable Enrollment Growth
Disciplined Focus on Underwriting
Effective Use of Cash Flow
SG&A Ratio Reduction
Specialty Penetration
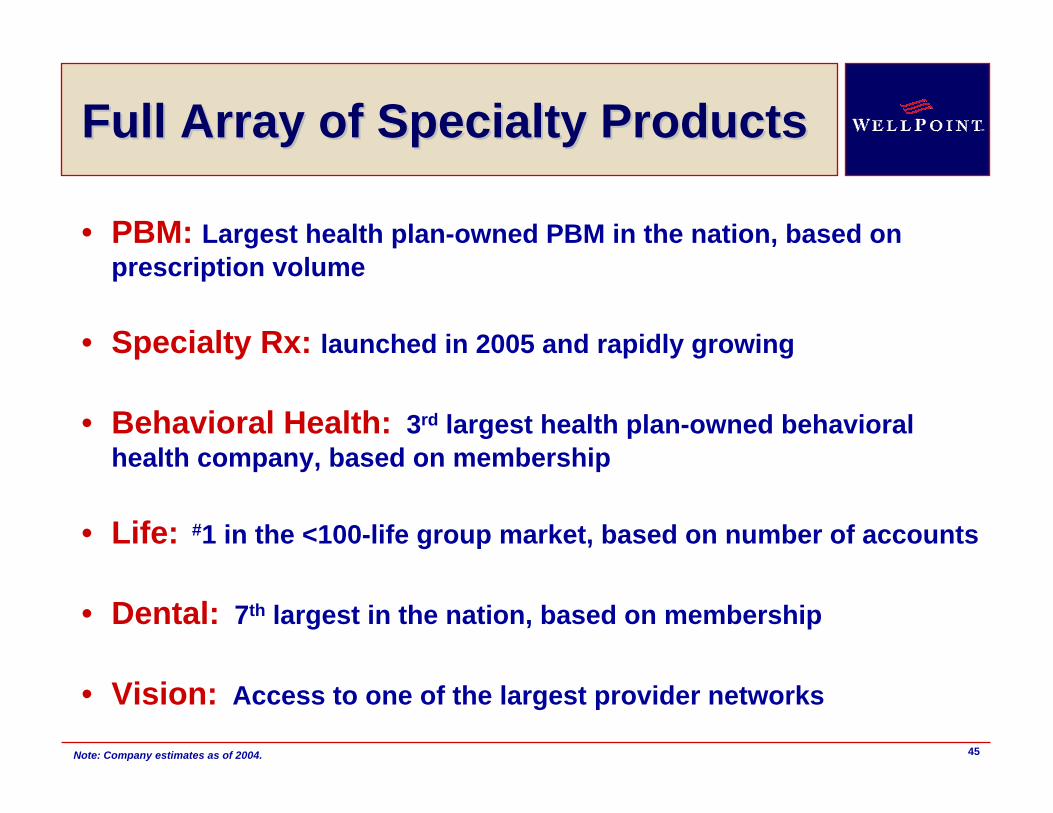
45
• PBM: Largest health plan-owned PBM in the nation, based on prescription volume
• Specialty Rx: launched in 2005 and rapidly growing
• Behavioral Health: 3rd largest health plan-owned behavioral health company, based on membership
• Life: #1 in the <100-life group market, based on number of accounts
• Dental: 7th largest in the nation, based on membership
• Vision: Access to one of the largest provider networks
Full Array of Specialty Products Full Array of Specialty Products
Note: Company estimates as of 2004.
46
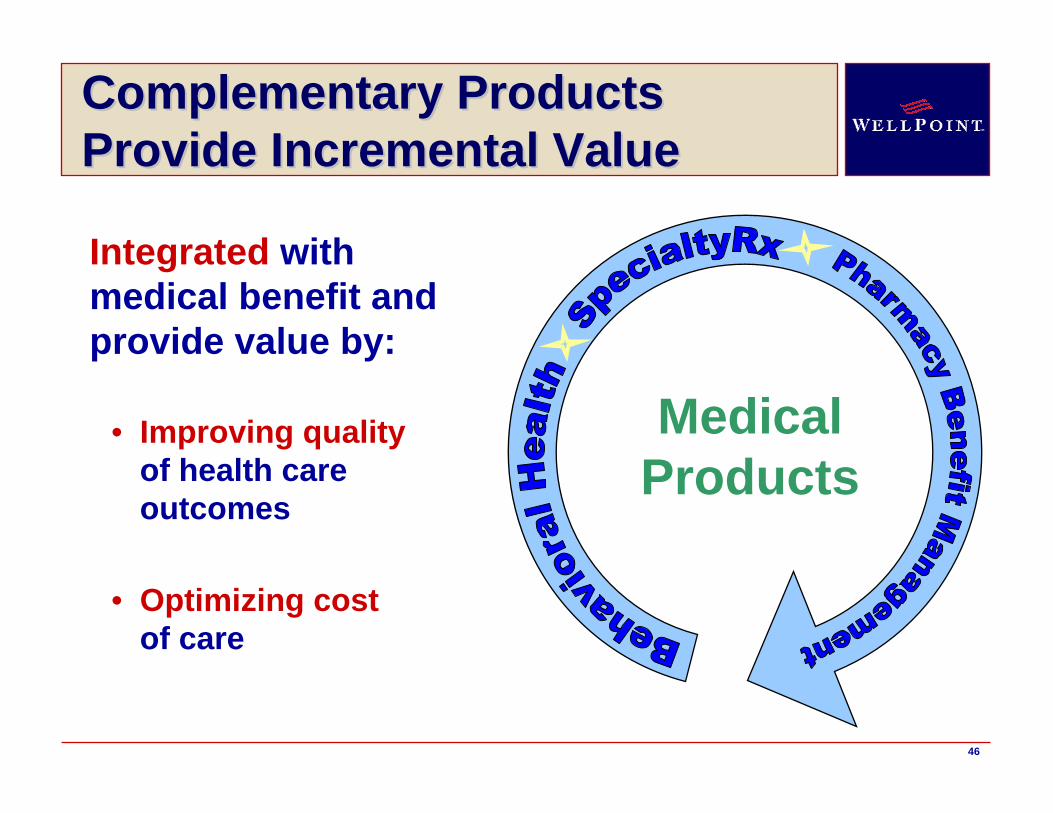
Integrated with medical benefit and provide value by:
• Improving qualityof health care outcomes
• Optimizing cost of care
Medical Products
Complementary Products Complementary Products Provide Incremental ValueProvide Incremental Value
47
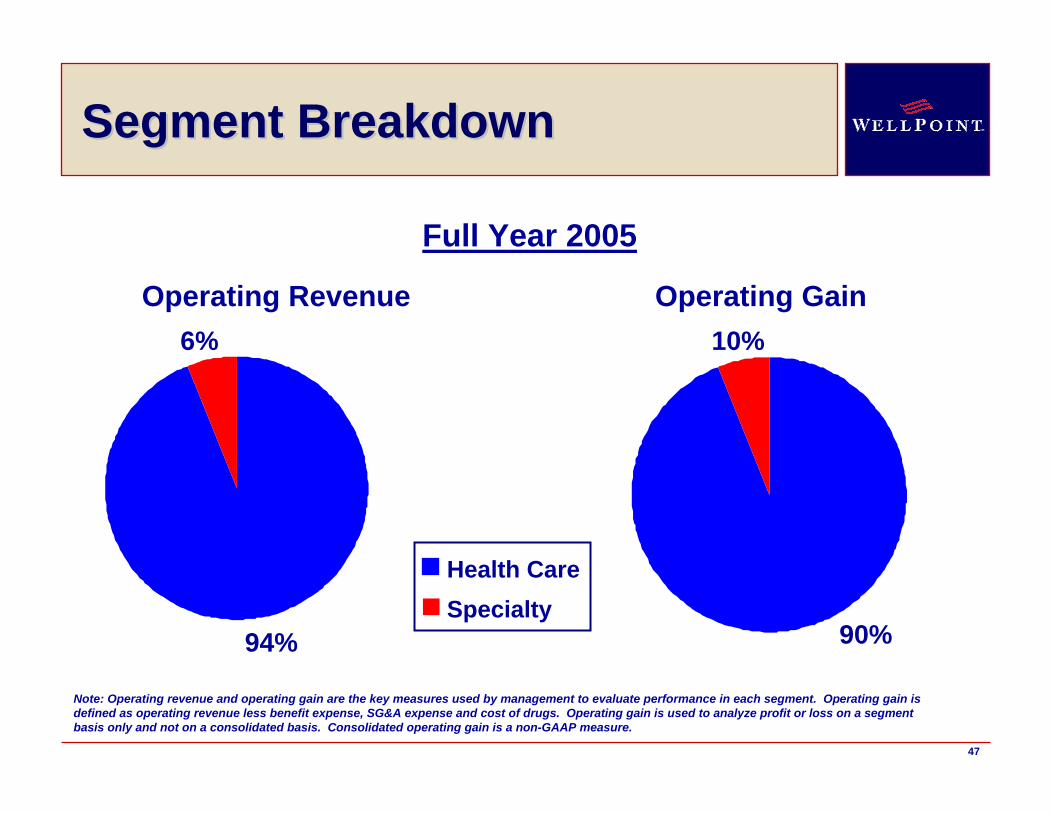
Segment Breakdown Segment Breakdown
94%
6% 10%
90%
Health CareSpecialty
Operating Revenue Operating Gain
Note: Operating revenue and operating gain are the key measures used by management to evaluate performance in each segment. Operating gain is defined as operating revenue less benefit expense, SG&A expense and cost of drugs. Operating gain is used to analyze profit or loss on a segment basis only and not on a consolidated basis. Consolidated operating gain is a non-GAAP measure.
Full Year 2005
48
WellPoint Growth ModelWellPoint Growth Model
EPS GrowthEPS Growth15% +15% +
Profitable Enrollment Growth
Disciplined Focus on Underwriting
Effective Use of Cash Flow
SG&A Ratio Reduction
Specialty Penetration
49
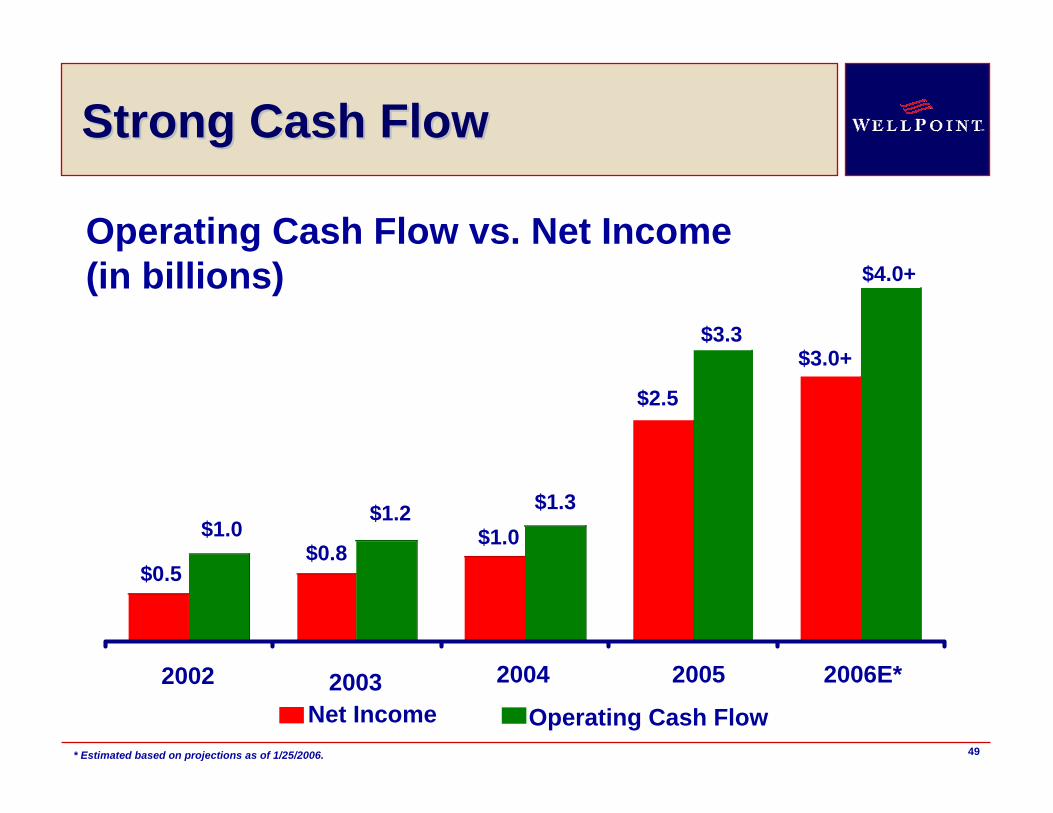
Strong Cash FlowStrong Cash Flow
2002 2003 2004Net Income Operating Cash Flow
$0.5
$1.0$0.8
$1.2$1.0
$1.3
$3.3
$2.5
2005
Operating Cash Flow vs. Net Income(in billions)
* Estimated based on projections as of 1/25/2006.
2006E*
$3.0+
$4.0+
50
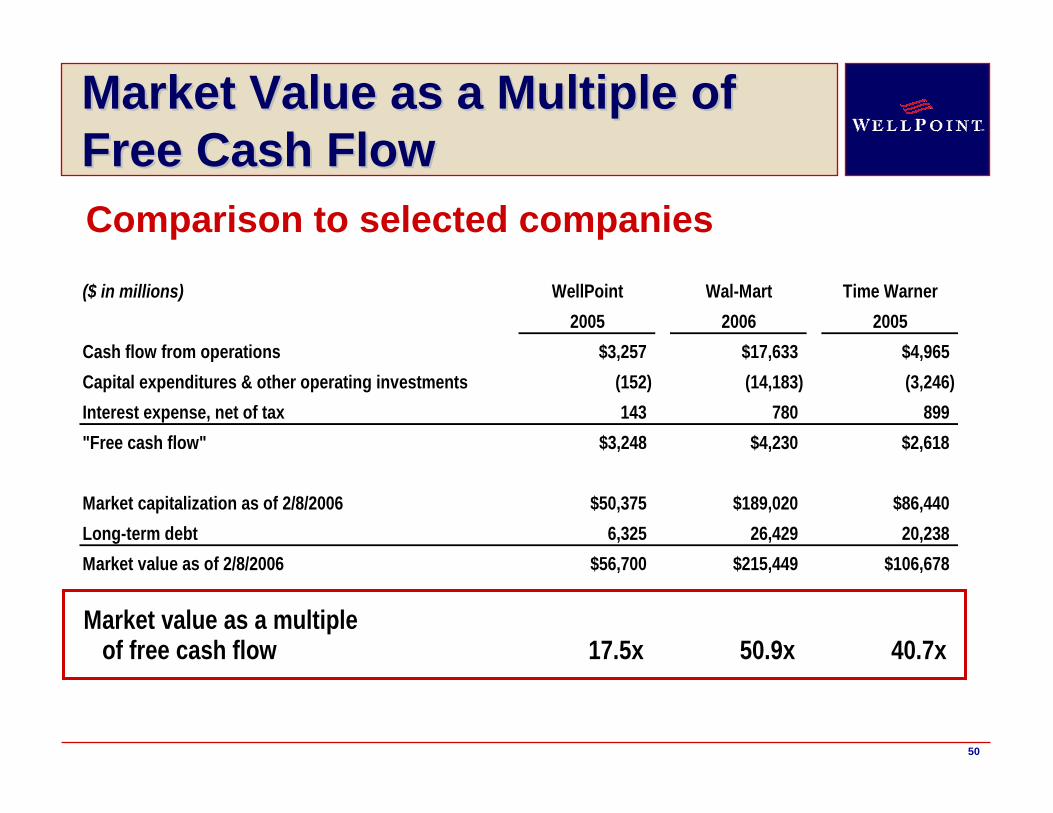
Market Value as a Multiple of Market Value as a Multiple of Free Cash Flow Free Cash Flow Comparison to selected companies
($ in millions) WellPoint Wal-Mart Time Warner2005 2006 2005
Cash flow from operations $3,257 $17,633 $4,965Capital expenditures & other operating investments (152) (14,183) (3,246) Interest expense, net of tax 143 780 899 "Free cash flow" $3,248 $4,230 $2,618
Market capitalization as of 2/8/2006 $50,375 $189,020 $86,440Long-term debt 6,325 26,429 20,238 Market value as of 2/8/2006 $56,700 $215,449 $106,678
Market value as a multiple of free cash flow 17.5x 50.9x 40.7x
51
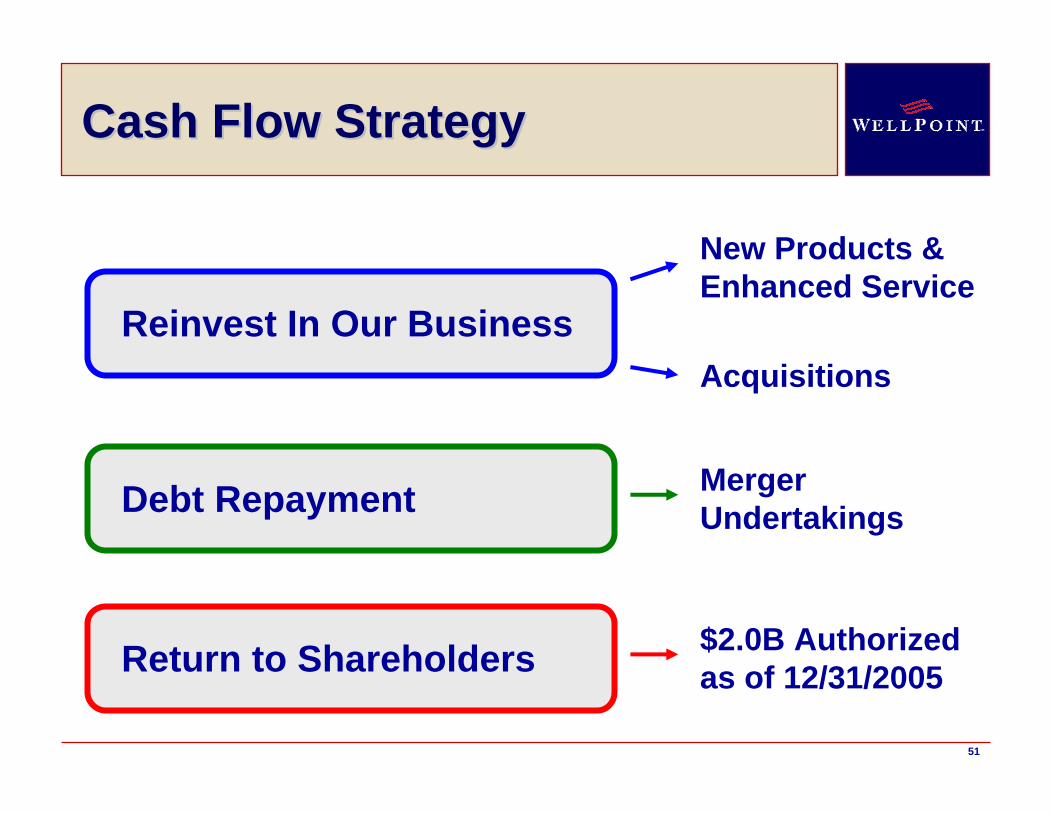
Cash Flow StrategyCash Flow Strategy
Reinvest In Our Business
New Products & Enhanced Service
Debt Repayment
Acquisitions
Return to Shareholders
Merger Undertakings
$2.0B Authorized as of 12/31/2005
52
AgendaAgenda
• WellPoint Profile & Success
• Superior Value Proposition
• Revenue Growth Opportunities
• 15% EPS Growth Target
• Investment Considerations
53
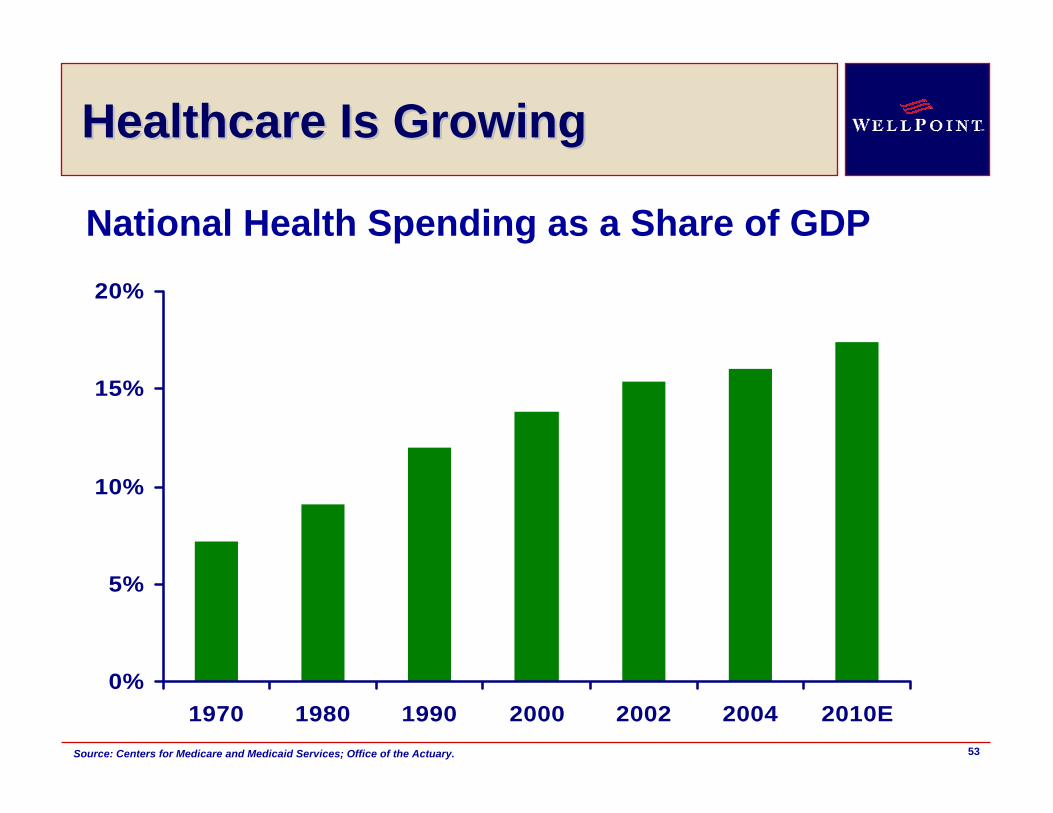
Healthcare Is GrowingHealthcare Is Growing
0%
5%
10%
15%
20%
1970 1980 1990 2000 2002 2004 2010E
National Health Spending as a Share of GDP
Source: Centers for Medicare and Medicaid Services; Office of the Actuary.
54
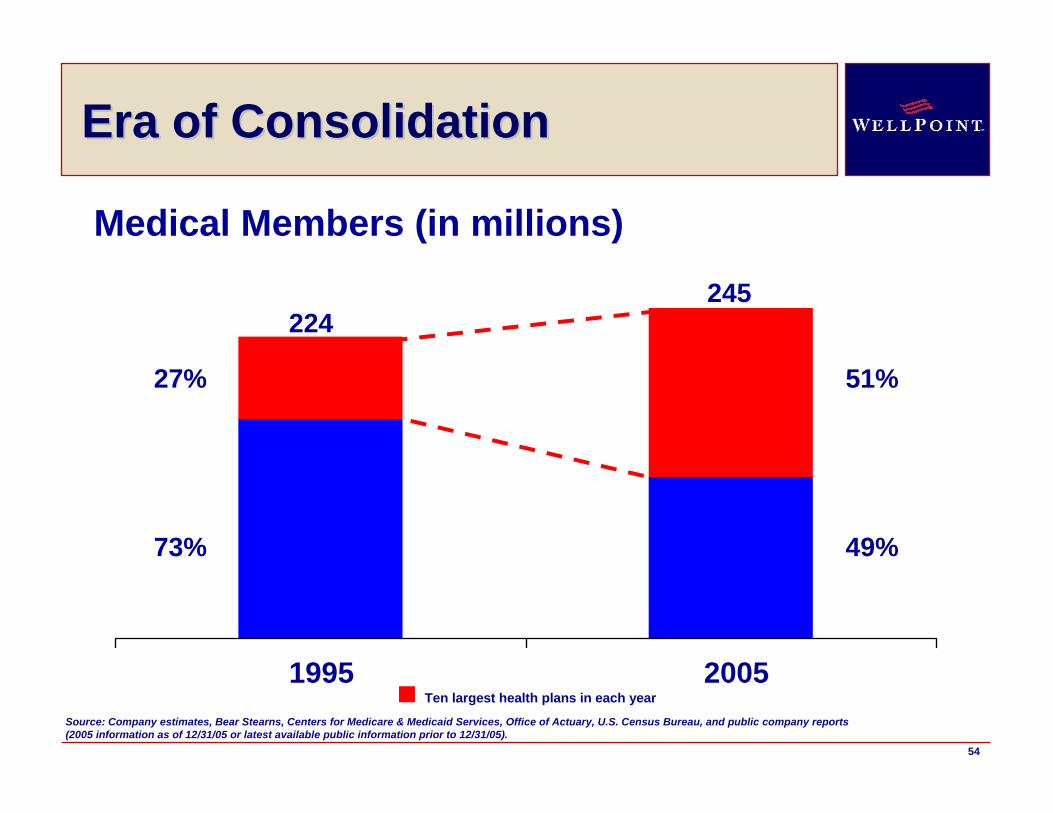
Era of ConsolidationEra of Consolidation
Ten largest health plans in each year1995 2005
27%
73%
51%
49%
224 245
Medical Members (in millions)
Source: Company estimates, Bear Stearns, Centers for Medicare & Medicaid Services, Office of Actuary, U.S. Census Bureau, and public company reports (2005 information as of 12/31/05 or latest available public information prior to 12/31/05).
55
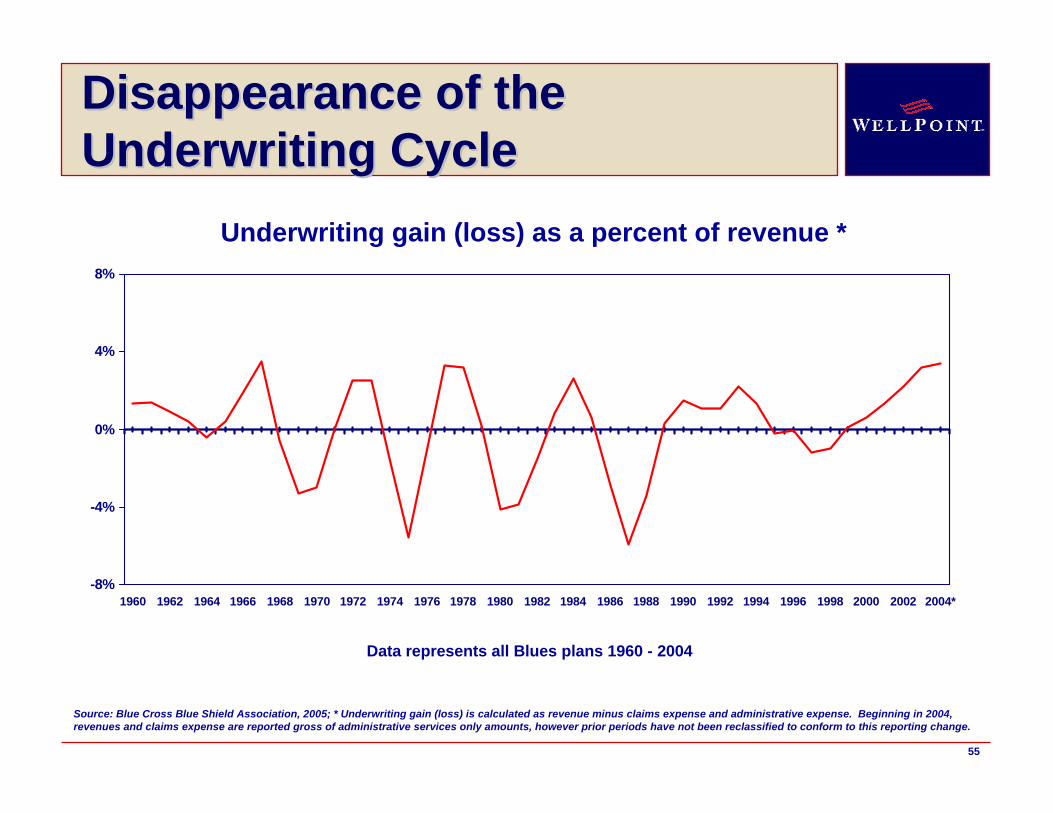
-8%
-4%
0%
4%
8%
1960 1962 1964 1966 1968 1970 1972 1974 1976 1978 1980 1982 1984 1986 1988 1990 1992 1994 1996 1998 2000 2002 2004*
Underwriting gain (loss) as a percent of revenue *
Source: Blue Cross Blue Shield Association, 2005; * Underwriting gain (loss) is calculated as revenue minus claims expense and administrative expense. Beginning in 2004, revenues and claims expense are reported gross of administrative services only amounts, however prior periods have not been reclassified to conform to this reporting change.
Data represents all Blues plans 1960 - 2004
Disappearance of the Disappearance of the Underwriting CycleUnderwriting Cycle
56
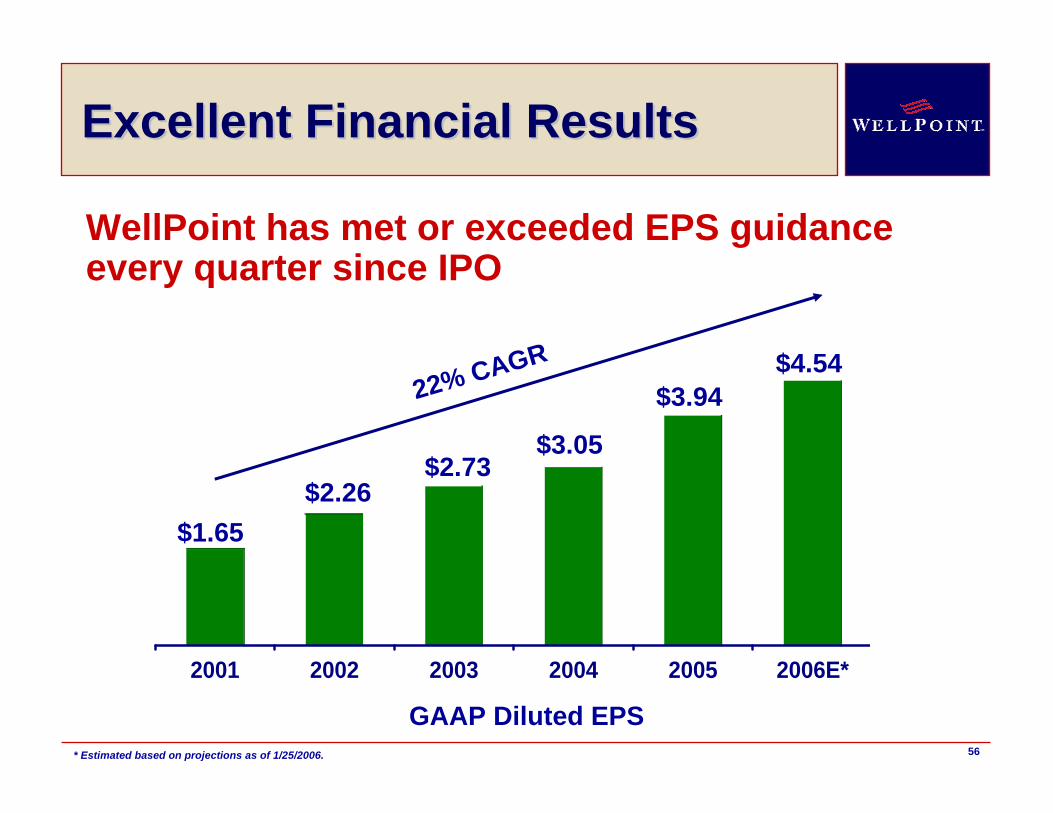
Excellent Financial ResultsExcellent Financial Results
2001 2002 2003 2004 2005 2006E*
$1.65$2.26
$2.73$3.05
$4.5422% CAGR
$3.94
WellPoint has met or exceeded EPS guidance every quarter since IPO
* Estimated based on projections as of 1/25/2006.
GAAP Diluted EPS
57
Compelling Value PropositionCompelling Value Proposition
WWide-reaching, cost-effective provider networksEExcellent financial performance LLarge local market shares with revenue diversityLLeading brand in the sector PPositive cash flow in excess of net incomeOOutstanding management teamIIntegration discipline and success for M&ANNation’s largest health plan membershipTTremendous industry with growth opportunities

58