sewage collection system inspection form city … · sewage collection system inspection form city...
TRANSCRIPT
City of Alameda April 2, 2009
SEWAGE COLLECTION SYSTEM INSPECTION FORM City of Alameda, CA
GENERAL INFORMATION
Inspection Date: April 2 – 3, 2009
Utility Name: City of Alameda Address: City Hall West, 950 W. Mall Square, Room 110, Alameda, CA 94501 Maintenance Service Center, 1616 Fortmann Way, Alameda, CA 94501 Contact Person: Paul Soo, Jr. (City Hall West), Larry Strunk (Maintenance) Phone: (510) 749-5840, (510) 747-7400 Cell: (510) 919-9301 (Larry) Fax: (510) 749-5867 (City Hall West), (510) 521-8762 (Maintenance) Email: [email protected] , [email protected]
Inspectors Names Agency/Contractor Michelle Moustakas EPA Region 9 Anna Yen EPA Region 9 Russell Norman SWRCB Bill Hahn SAIC Dianne Stewart SAIC
Utility personnel who accompanied inspectors
Name Title Matthew Naclerio Public Works Director Barbara Hawkins City Engineer Flavio Barrantes Maintenance Superintendent Larry Strunk Maintenance Supervisor Max Arbios Team Leader Paul Soo, Jr. Engineer
SYSTEM OVERVIEW
Population: 75,000 Service Area (Sqr. Miles): 11 Service Area Description: City of Alameda (including Naval Air Station & Fleet Industry Supply Center)
Residential Commercial Industrial Total Number of service connections
19,185 734 130 20,049
Combined Sewers (% of system): 0
1

City of Alameda April 2, 2009
Name and NPDES permit number for WWTP(s) owned or operated by the collection system utility: NA Name and NPDES permit number for WWTP(s) that receive flow from the collection system utility: East Bay Municipal Utility District (EBMUD). Order No. 01-072, NPDES Permit No. CA0037702
Names of upstream collection systems sending flow to the collection system utility: The City has a lease with the Navy to operate and maintain the collection system in the Alameda Point area. This includes 10 pump stations.
Names of downstream collection systems receiving flow from the collection system utility: NA
Do any interagency agreements exist with upstream collection systems? NA
Does the utility maintain the legal authority to limit flow from upstream satellite collection systems? No
Comment:
EBMUD has a detention basin and four to six pump stations located in the City. The City has no responsibilities for these structures.
SYSTEM INVENTORY (list only assets owned by utility)
Miles of gravity main
Miles of force main
Miles of Laterals
Number of maintenance
access structures
Number of pump
stations
Number of siphons
136 6 100 3012 34 0
Utility responsibility for laterals (none, whole, lower): Lower
Size Distribution of Collection System Diameter in inches Gravity Sewer (miles) Force Mains (miles) 6 inches or less 58 1 8 inches 49 1 9 - 18 inches 26 2 19 - 36 inches 3 2 > 36 inches 0 0
2
City of Alameda April 2, 2009
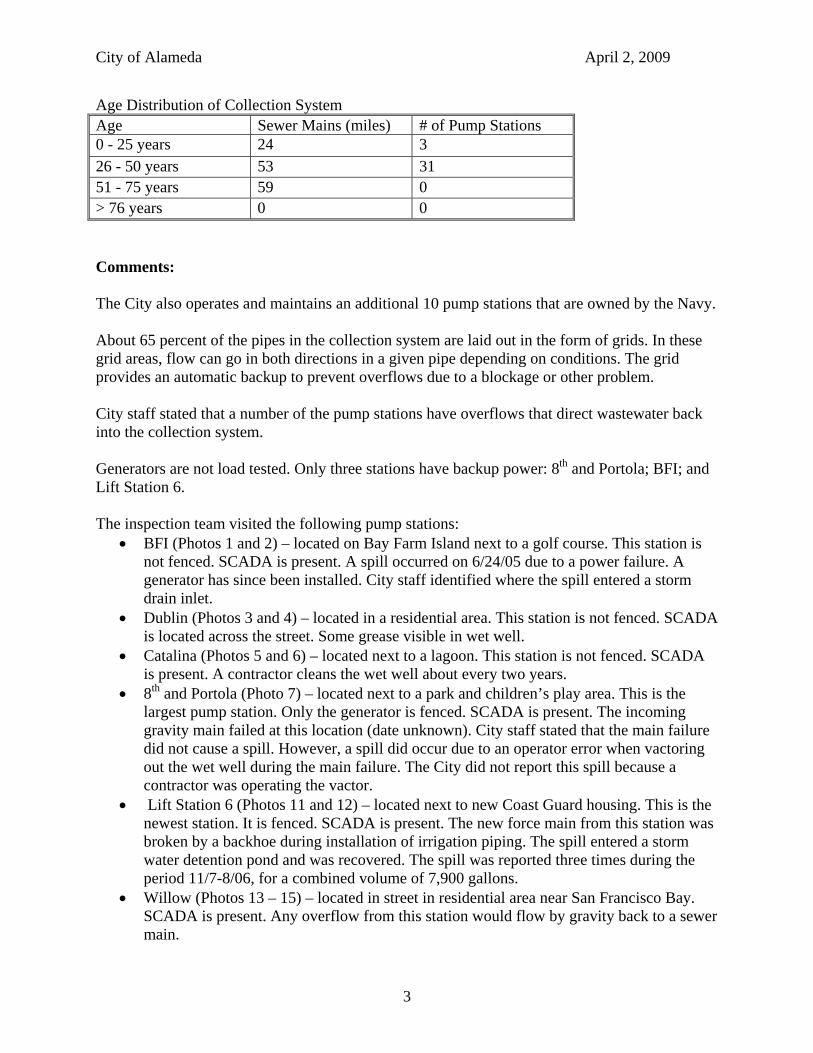
Age Distribution of Collection System Age Sewer Mains (miles) # of Pump Stations 0 - 25 years 24 3 26 - 50 years 53 31 51 - 75 years 59 0 > 76 years 0 0
Comments:
The City also operates and maintains an additional 10 pump stations that are owned by the Navy.
About 65 percent of the pipes in the collection system are laid out in the form of grids. In these grid areas, flow can go in both directions in a given pipe depending on conditions. The grid provides an automatic backup to prevent overflows due to a blockage or other problem.
City staff stated that a number of the pump stations have overflows that direct wastewater back into the collection system.
Generators are not load tested. Only three stations have backup power: 8th and Portola; BFI; and Lift Station 6.
The inspection team visited the following pump stations: BFI (Photos 1 and 2) – located on Bay Farm Island next to a golf course. This station is
not fenced. SCADA is present. A spill occurred on 6/24/05 due to a power failure. A generator has since been installed. City staff identified where the spill entered a storm drain inlet.
Dublin (Photos 3 and 4) – located in a residential area. This station is not fenced. SCADA is located across the street. Some grease visible in wet well.
Catalina (Photos 5 and 6) – located next to a lagoon. This station is not fenced. SCADA is present. A contractor cleans the wet well about every two years.
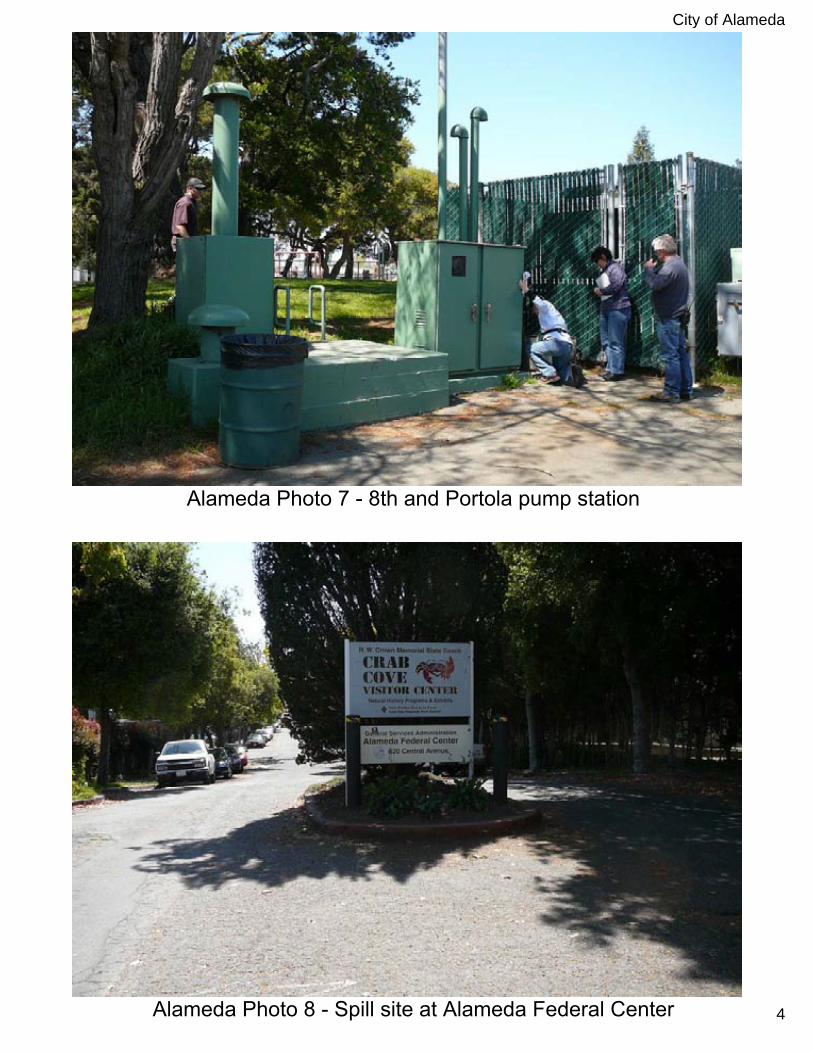
8th and Portola (Photo 7) – located next to a park and children’s play area. This is the largest pump station. Only the generator is fenced. SCADA is present. The incoming gravity main failed at this location (date unknown). City staff stated that the main failure did not cause a spill. However, a spill did occur due to an operator error when vactoring out the wet well during the main failure. The City did not report this spill because a contractor was operating the vactor.
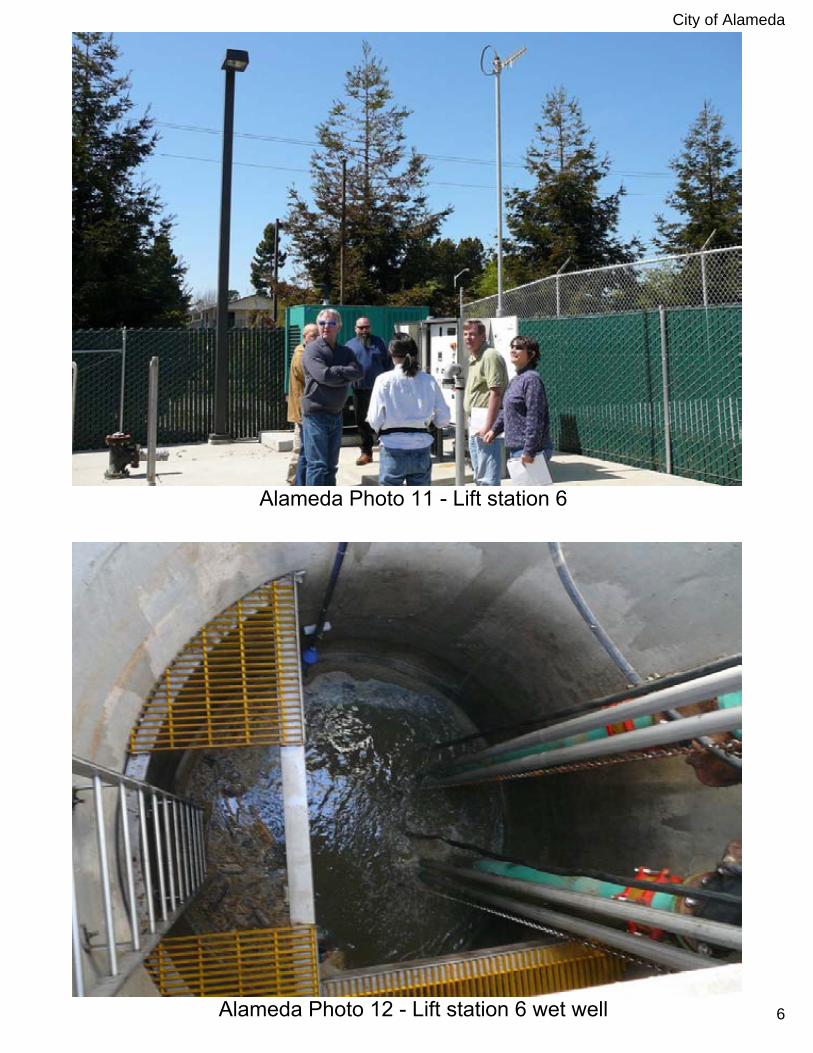
Lift Station 6 (Photos 11 and 12) – located next to new Coast Guard housing. This is the newest station. It is fenced. SCADA is present. The new force main from this station was broken by a backhoe during installation of irrigation piping. The spill entered a storm water detention pond and was recovered. The spill was reported three times during the period 11/7-8/06, for a combined volume of 7,900 gallons.
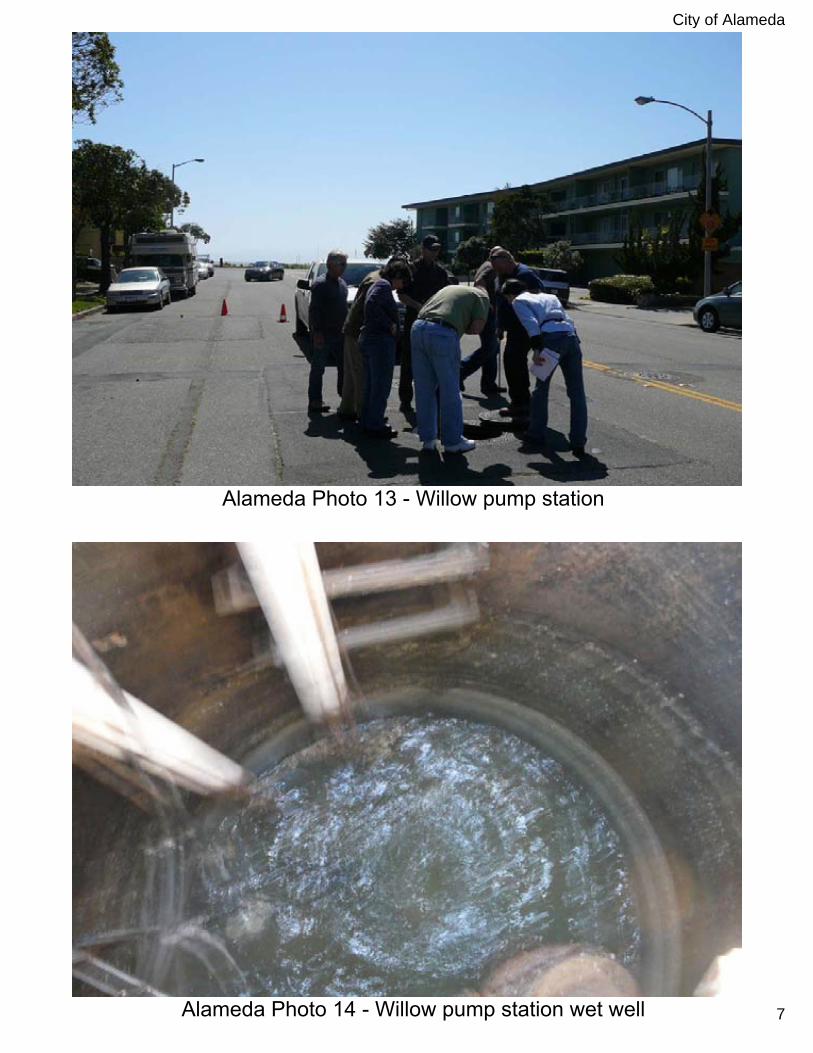
Willow (Photos 13 – 15) – located in street in residential area near San Francisco Bay. SCADA is present. Any overflow from this station would flow by gravity back to a sewer main.
3
______________________________________________________________________________ ______________________________________________________________________________ ______________________________________________________________________________ ______________________________________________________________________________
City of Alameda April 2, 2009
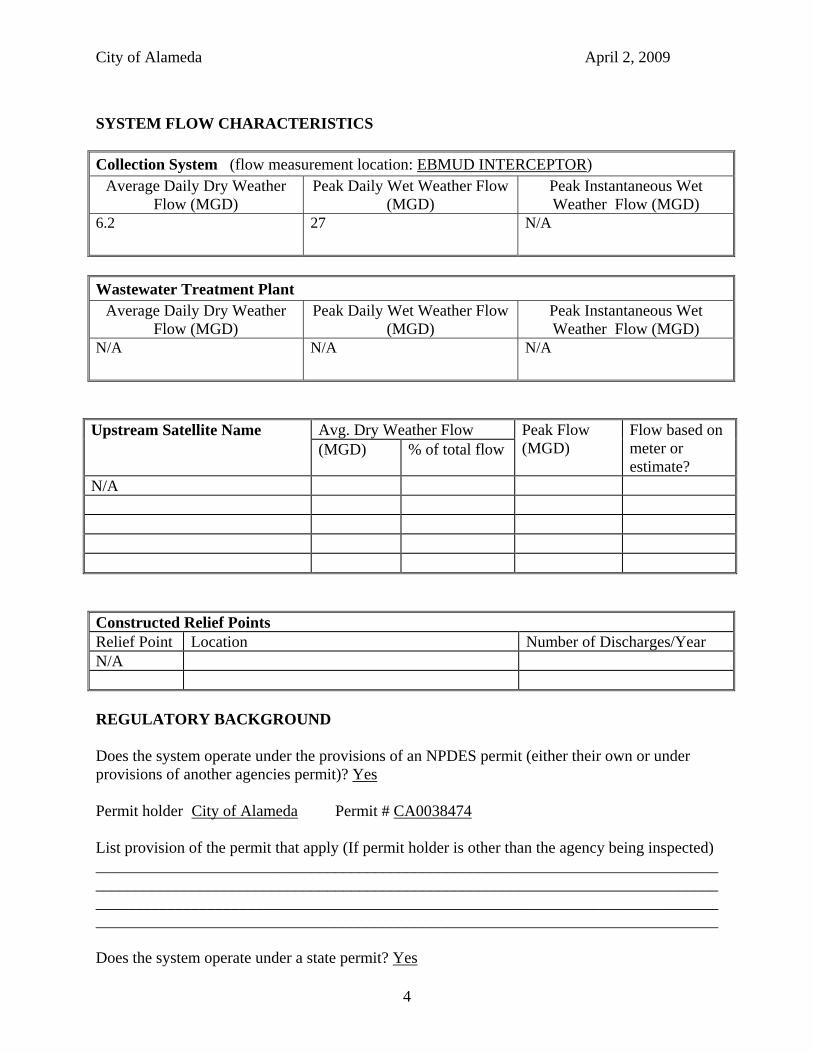
SYSTEM FLOW CHARACTERISTICS
Collection System (flow measurement location: EBMUD INTERCEPTOR) Average Daily Dry Weather
Flow (MGD) Peak Daily Wet Weather Flow
(MGD) Peak Instantaneous Wet Weather Flow (MGD)
6.2 27 N/A
Wastewater Treatment Plant Average Daily Dry Weather
Flow (MGD) Peak Daily Wet Weather Flow
(MGD) Peak Instantaneous Wet Weather Flow (MGD)
N/A N/A N/A
Upstream Satellite Name Avg. Dry Weather Flow Peak Flow (MGD)
Flow based on meter or estimate?
(MGD) % of total flow
N/A
Constructed Relief Points Relief Point Location Number of Discharges/Year N/A
REGULATORY BACKGROUND
Does the system operate under the provisions of an NPDES permit (either their own or under provisions of another agencies permit)? Yes
Permit holder City of Alameda Permit # CA0038474
List provision of the permit that apply (If permit holder is other than the agency being inspected)
Does the system operate under a state permit? Yes
4
City of Alameda April 2, 2009
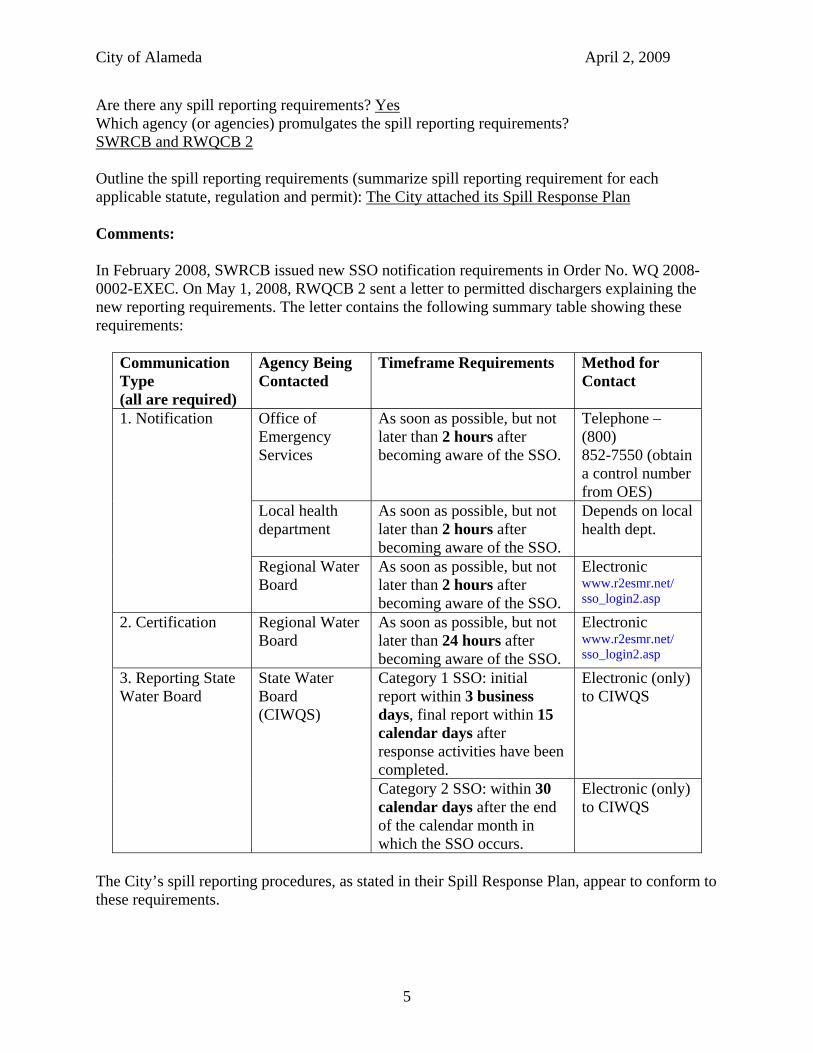
Are there any spill reporting requirements? Yes Which agency (or agencies) promulgates the spill reporting requirements? SWRCB and RWQCB 2
Outline the spill reporting requirements (summarize spill reporting requirement for each applicable statute, regulation and permit): The City attached its Spill Response Plan
Comments:
In February 2008, SWRCB issued new SSO notification requirements in Order No. WQ 2008-0002-EXEC. On May 1, 2008, RWQCB 2 sent a letter to permitted dischargers explaining the new reporting requirements. The letter contains the following summary table showing these requirements:
Communication Type (all are required)
Agency Being Contacted
Timeframe Requirements Method for Contact
1. Notification Office of Emergency Services
As soon as possible, but not later than 2 hours after becoming aware of the SSO.
Telephone – (800) 852-7550 (obtain a control number from OES)
Local health department
As soon as possible, but not later than 2 hours after becoming aware of the SSO.
Depends on local health dept.
Regional Water Board
As soon as possible, but not later than 2 hours after becoming aware of the SSO.
Electronic www.r2esmr.net/ sso_login2.asp
2. Certification Regional Water Board
As soon as possible, but not later than 24 hours after becoming aware of the SSO.
Electronic www.r2esmr.net/ sso_login2.asp
3. Reporting State Water Board
State Water Board (CIWQS)
Category 1 SSO: initial report within 3 business days, final report within 15 calendar days after response activities have been completed.
Electronic (only) to CIWQS
Category 2 SSO: within 30 calendar days after the end of the calendar month in which the SSO occurs.
Electronic (only) to CIWQS
The City’s spill reporting procedures, as stated in their Spill Response Plan, appear to conform to these requirements.
5
City of Alameda April 2, 2009
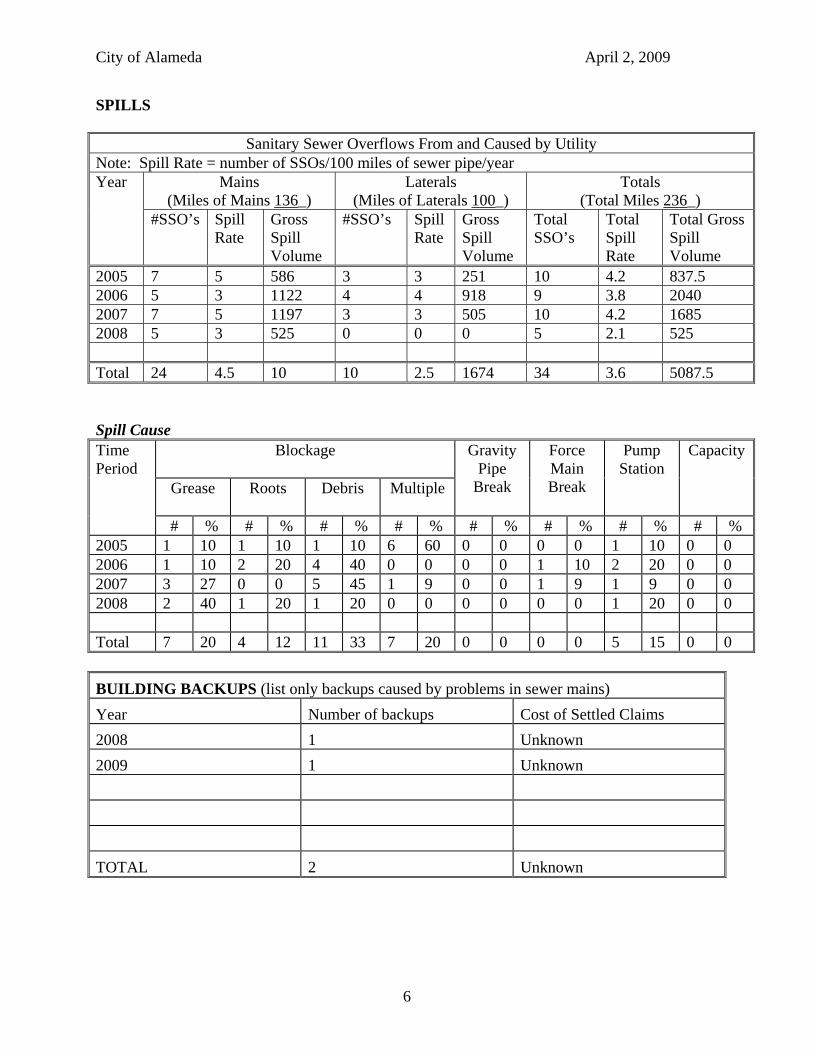
SPILLS
Sanitary Sewer Overflows From and Caused by Utility Note: Spill Rate = number of SSOs/100 miles of sewer pipe/year Year Mains
(Miles of Mains 136_) Laterals
(Miles of Laterals 100_) Totals
(Total Miles 236_) #SSO’s Spill
Rate Gross Spill Volume
#SSO’s Spill Rate
Gross Spill Volume
Total SSO’s
Total Spill Rate
Total Gross Spill Volume
2005 7 5 586 3 3 251 10 4.2 837.5 2006 5 3 1122 4 4 918 9 3.8 2040 2007 7 5 1197 3 3 505 10 4.2 1685 2008 5 3 525 0 0 0 5 2.1 525
Total 24 4.5 10 10 2.5 1674 34 3.6 5087.5
Spill Cause Time Period
Blockage Gravity Pipe
Break
Force Main Break
Pump Station
Capacity
Grease Roots Debris Multiple
# % # % # % # % # % # % # % # % 2005 1 10 1 10 1 10 6 60 0 0 0 0 1 10 0 0 2006 1 10 2 20 4 40 0 0 0 0 1 10 2 20 0 0 2007 3 27 0 0 5 45 1 9 0 0 1 9 1 9 0 0 2008 2 40 1 20 1 20 0 0 0 0 0 0 1 20 0 0
Total 7 20 4 12 11 33 7 20 0 0 0 0 5 15 0 0
BUILDING BACKUPS (list only backups caused by problems in sewer mains)
Year Number of backups Cost of Settled Claims
2008 1 Unknown
2009 1 Unknown
TOTAL 2 Unknown
6
City of Alameda April 2, 2009
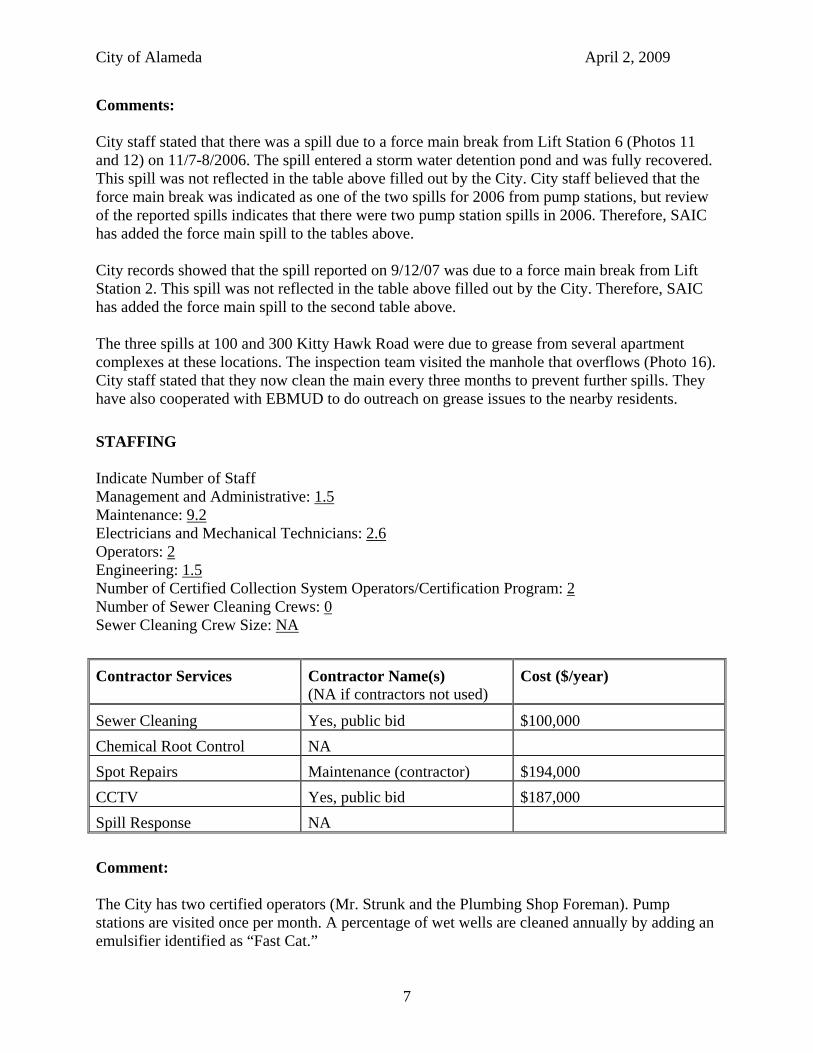
Comments:
City staff stated that there was a spill due to a force main break from Lift Station 6 (Photos 11 and 12) on 11/7-8/2006. The spill entered a storm water detention pond and was fully recovered. This spill was not reflected in the table above filled out by the City. City staff believed that the force main break was indicated as one of the two spills for 2006 from pump stations, but review of the reported spills indicates that there were two pump station spills in 2006. Therefore, SAIC has added the force main spill to the tables above.
City records showed that the spill reported on 9/12/07 was due to a force main break from Lift Station 2. This spill was not reflected in the table above filled out by the City. Therefore, SAIC has added the force main spill to the second table above.
The three spills at 100 and 300 Kitty Hawk Road were due to grease from several apartment complexes at these locations. The inspection team visited the manhole that overflows (Photo 16). City staff stated that they now clean the main every three months to prevent further spills. They have also cooperated with EBMUD to do outreach on grease issues to the nearby residents.
STAFFING
Indicate Number of Staff Management and Administrative: 1.5 Maintenance: 9.2 Electricians and Mechanical Technicians: 2.6 Operators: 2 Engineering: 1.5 Number of Certified Collection System Operators/Certification Program: 2 Number of Sewer Cleaning Crews: 0 Sewer Cleaning Crew Size: NA
Contractor Services Contractor Name(s) (NA if contractors not used)
Cost ($/year)
Sewer Cleaning Yes, public bid $100,000
Chemical Root Control NA
Spot Repairs Maintenance (contractor) $194,000
CCTV Yes, public bid $187,000
Spill Response NA
Comment:
The City has two certified operators (Mr. Strunk and the Plumbing Shop Foreman). Pump stations are visited once per month. A percentage of wet wells are cleaned annually by adding an emulsifier identified as “Fast Cat.”
7

City of Alameda April 2, 2009
EQUIPMENT
List Major Equipment Owned by the Utility:
Equipment Number Number in Service
Combination Trucks
(hydroflush and vactor)
2 – but not used for routine
sewer pipe cleaning
2
Hydroflusher 0 0
Mechanical Rodder 3 3
CCTV Truck 0 0
Utility Truck 2 2
Portable Pumps 2 2
Portable Generator 4 4
Comment:
About 5 of the 10 pump stations owned by the Navy have permanent generators. For pump stations without generators, the City would use one of the portable generators if needed. They say that power failures seldomly occur.
FINANCIAL
REVENUES Revenue Source Annual Revenue ($/year) User Fees $5,700,000 Connection Fees $321,000 Grants N/A Bonds N/A SRF Loans N/A TOTAL $6,021,000
8
City of Alameda April 2, 2009
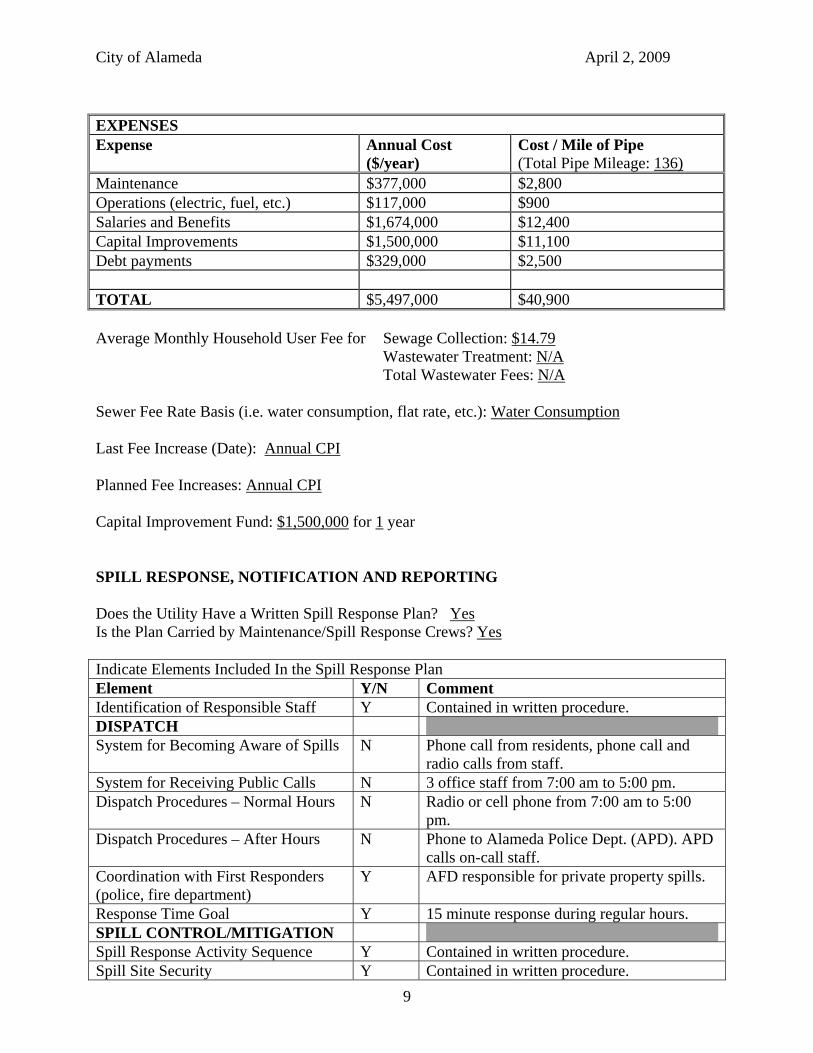
EXPENSES Expense Annual Cost
($/year) Cost / Mile of Pipe (Total Pipe Mileage: 136)
Maintenance $377,000 $2,800 Operations (electric, fuel, etc.) $117,000 $900 Salaries and Benefits $1,674,000 $12,400 Capital Improvements $1,500,000 $11,100 Debt payments $329,000 $2,500
TOTAL $5,497,000 $40,900
Average Monthly Household User Fee for Sewage Collection: $14.79 Wastewater Treatment: N/A Total Wastewater Fees: N/A
Sewer Fee Rate Basis (i.e. water consumption, flat rate, etc.): Water Consumption
Last Fee Increase (Date): Annual CPI
Planned Fee Increases: Annual CPI
Capital Improvement Fund: $1,500,000 for 1 year
SPILL RESPONSE, NOTIFICATION AND REPORTING
Does the Utility Have a Written Spill Response Plan? Yes Is the Plan Carried by Maintenance/Spill Response Crews? Yes
Indicate Elements Included In the Spill Response Plan Element Y/N Comment Identification of Responsible Staff Y Contained in written procedure. DISPATCH System for Becoming Aware of Spills N Phone call from residents, phone call and
radio calls from staff. System for Receiving Public Calls N 3 office staff from 7:00 am to 5:00 pm. Dispatch Procedures – Normal Hours N Radio or cell phone from 7:00 am to 5:00
pm. Dispatch Procedures – After Hours N Phone to Alameda Police Dept. (APD). APD
calls on-call staff. Coordination with First Responders (police, fire department)
Y AFD responsible for private property spills.
Response Time Goal Y 15 minute response during regular hours. SPILL CONTROL/MITIGATION Spill Response Activity Sequence Y Contained in written procedure. Spill Site Security Y Contained in written procedure.
9
City of Alameda April 2, 2009
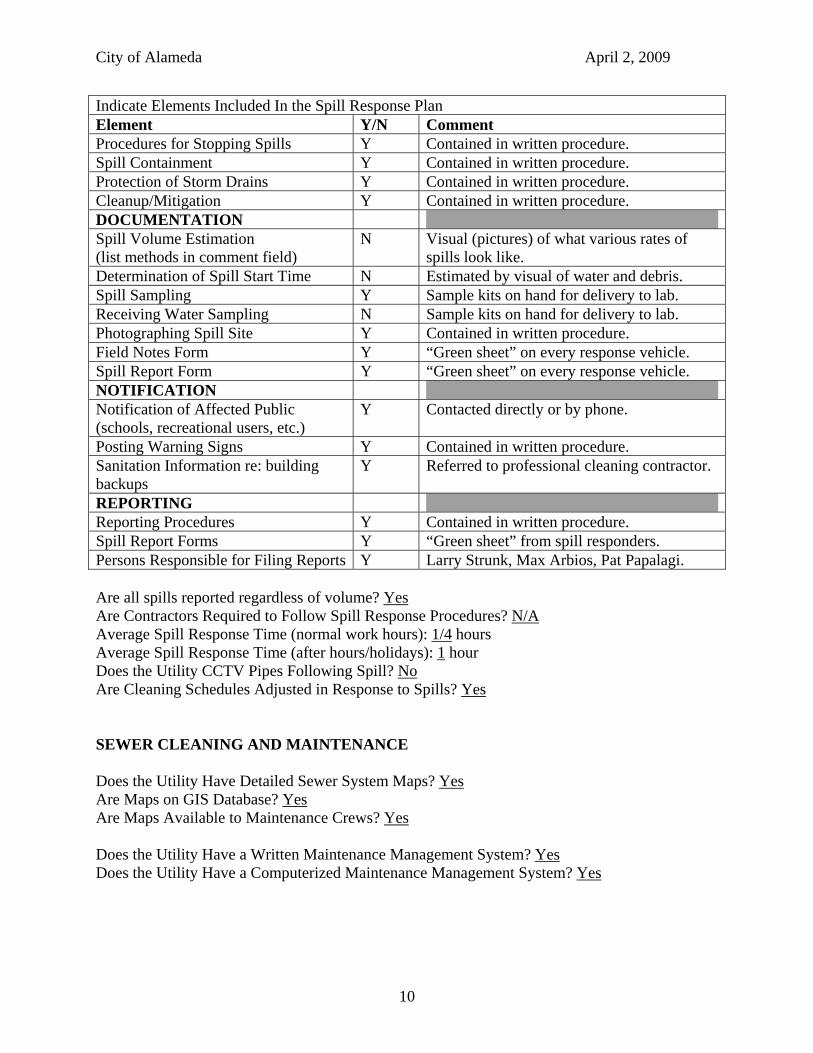
Indicate Elements Included In the Spill Response Plan Element Y/N Comment Procedures for Stopping Spills Y Contained in written procedure. Spill Containment Y Contained in written procedure. Protection of Storm Drains Y Contained in written procedure. Cleanup/Mitigation Y Contained in written procedure. DOCUMENTATION Spill Volume Estimation (list methods in comment field)
N Visual (pictures) of what various rates of spills look like.
Determination of Spill Start Time N Estimated by visual of water and debris. Spill Sampling Y Sample kits on hand for delivery to lab. Receiving Water Sampling N Sample kits on hand for delivery to lab. Photographing Spill Site Y Contained in written procedure. Field Notes Form Y “Green sheet” on every response vehicle. Spill Report Form Y “Green sheet” on every response vehicle. NOTIFICATION Notification of Affected Public (schools, recreational users, etc.)
Y Contacted directly or by phone.
Posting Warning Signs Y Contained in written procedure. Sanitation Information re: building backups
Y Referred to professional cleaning contractor.
REPORTING Reporting Procedures Y Contained in written procedure. Spill Report Forms Y “Green sheet” from spill responders. Persons Responsible for Filing Reports Y Larry Strunk, Max Arbios, Pat Papalagi.
Are all spills reported regardless of volume? Yes Are Contractors Required to Follow Spill Response Procedures? N/A Average Spill Response Time (normal work hours): 1/4 hours Average Spill Response Time (after hours/holidays): 1 hour Does the Utility CCTV Pipes Following Spill? No Are Cleaning Schedules Adjusted in Response to Spills? Yes
SEWER CLEANING AND MAINTENANCE
Does the Utility Have Detailed Sewer System Maps? Yes Are Maps on GIS Database? Yes Are Maps Available to Maintenance Crews? Yes
Does the Utility Have a Written Maintenance Management System? Yes Does the Utility Have a Computerized Maintenance Management System? Yes
10
City of Alameda April 2, 2009
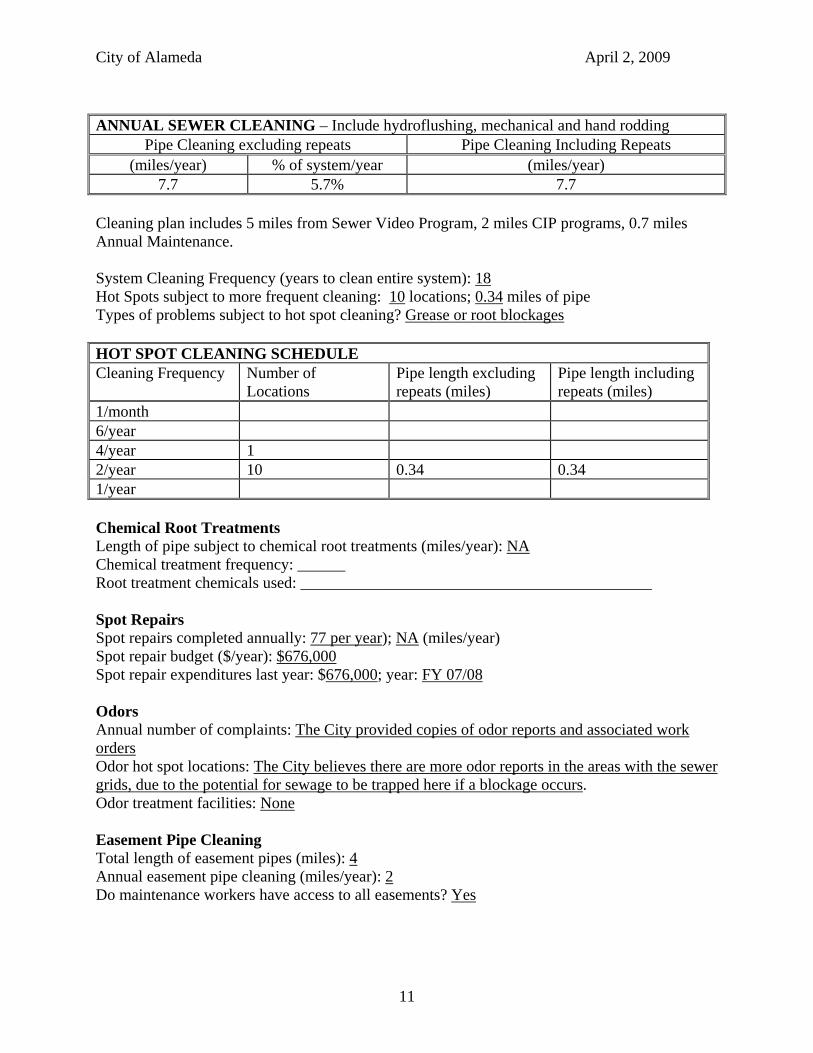
ANNUAL SEWER CLEANING – Include hydroflushing, mechanical and hand rodding Pipe Cleaning excluding repeats Pipe Cleaning Including Repeats
(miles/year) % of system/year (miles/year) 7.7 5.7% 7.7
Cleaning plan includes 5 miles from Sewer Video Program, 2 miles CIP programs, 0.7 miles Annual Maintenance.
System Cleaning Frequency (years to clean entire system): 18 Hot Spots subject to more frequent cleaning: 10 locations; 0.34 miles of pipe Types of problems subject to hot spot cleaning? Grease or root blockages
HOT SPOT CLEANING SCHEDULE Cleaning Frequency Number of
Locations Pipe length excluding repeats (miles)
Pipe length including repeats (miles)
1/month 6/year 4/year 1 2/year 10 0.34 0.34 1/year
Chemical Root Treatments Length of pipe subject to chemical root treatments (miles/year): NA Chemical treatment frequency: ______ Root treatment chemicals used: ____________________________________________
Spot Repairs Spot repairs completed annually: 77 per year); NA (miles/year) Spot repair budget ($/year): $676,000 Spot repair expenditures last year: $676,000; year: FY 07/08
Odors Annual number of complaints: The City provided copies of odor reports and associated work orders Odor hot spot locations: The City believes there are more odor reports in the areas with the sewer grids, due to the potential for sewage to be trapped here if a blockage occurs. Odor treatment facilities: None
Easement Pipe Cleaning Total length of easement pipes (miles): 4 Annual easement pipe cleaning (miles/year): 2 Do maintenance workers have access to all easements? Yes
11
City of Alameda April 2, 2009
Comments:
SAIC added one location to the hot spot cleaning schedule table above, because the City stated that they clean the Kitty Hawk spill site quarterly.
The 7.7 miles of Annual Cleaning per year is cleaning which the City contracts out.
The City provided hard copies of a number of odor complaints dating from 2001 to the present. There were no complaints that were obviously related to spills among these reports. The City stated that odor complaints are fairly common, partly because of the grid system and the fact that some mains are located in backyards. They also mentioned that EBMUD facilities appear to be involved with some of them.
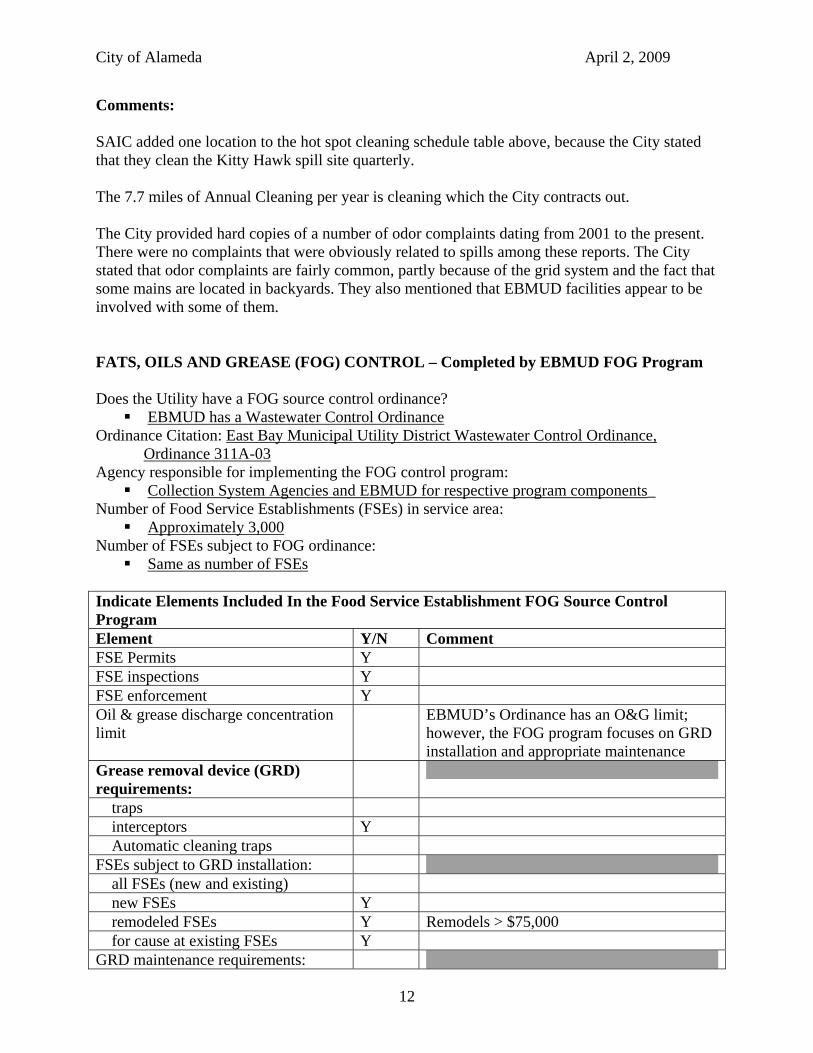
FATS, OILS AND GREASE (FOG) CONTROL – Completed by EBMUD FOG Program
Does the Utility have a FOG source control ordinance? EBMUD has a Wastewater Control Ordinance
Ordinance Citation: East Bay Municipal Utility District Wastewater Control Ordinance, Ordinance 311A-03
Agency responsible for implementing the FOG control program: Collection System Agencies and EBMUD for respective program components_
Number of Food Service Establishments (FSEs) in service area: Approximately 3,000
Number of FSEs subject to FOG ordinance: Same as number of FSEs
Indicate Elements Included In the Food Service Establishment FOG Source Control Program Element Y/N Comment FSE Permits Y FSE inspections Y FSE enforcement Y Oil & grease discharge concentration limit
EBMUD’s Ordinance has an O&G limit; however, the FOG program focuses on GRD installation and appropriate maintenance
Grease removal device (GRD) requirements:
traps interceptors Y Automatic cleaning traps FSEs subject to GRD installation:
all FSEs (new and existing) new FSEs Y
remodeled FSEs Y Remodels > $75,000 for cause at existing FSEs Y GRD maintenance requirements:
12

City of Alameda April 2, 2009
Indicate Elements Included In the Food Service Establishment FOG Source Control Program Element Y/N Comment
Cleaning frequency Y Every 3 months or more as needed 25% rule (grease and solids
accumulation) Y EBMUD requires increased pumping
frequency if >25% grease/solids Kitchen BMP Requirements (list required BMPs below)
BMPs are recommended, not required (BMP information attached)
Allowance for chemical additives? See BMPs (“Do not use emulsifiers or solvents…”)
Allowance for biological additives? Not recommended FOG Disposal Requirements See permit for maintenance and disposal
requirements FOG Disposal Manifest System See permit for documentation/manifest
requirements
Number of FOG Program staff: Inspectors 10
Permit writers 1 Other 4
FSE Inspection frequency: Every 5 years for routine inspections, as needed for Hotspot Response Annual number of FSE inspections: _______ Does Utility use CCTV to identify FOG sources? Yes
Does sewer maintenance staff coordinate with FOG source control program staff? Yes. Collection system agencies report hotspots to EBMUD Staff
Cleaning targeted to FOG hot spots? ______ Maintenance crew referrals to FOG program? ______ Pipe repairs at FOG hot spots? ______
Describe program for public outreach and education related to residential FOG sources: EBMUD conducts outreach to businesses (FSEs), universities and residents, both
throughout the year and during the holidays. EBMUD has expanded its multi-lingual targeted outreach in residential areas that have SSOs and blockages.
o EBMUD includes outreach with permit issuances and inspections via BMPs, posters, and brochures, most in multiple languages (English, Chinese, Spanish, Korean, and Vietnamese).
o EBMUD has coordinated with UC Berkeley for targeted outreach to the university’s residential areas
o EBMUD has general residential outreach including Customer Pipeline articles, articles in other newsletters, and information on the EBMUD website. EBMUD also targets residential outreach to hotspot areas in coordination with the collection system communities, via distribution of doorhangers with information in English, Chinese, and Spanish.
13
City of Alameda April 2, 2009
o EBMUD has a container at the entrance to its wastewater treatment plant for residents to bring used grease. This bin collected approximately 2,400 gallons in 2008.
o EBMUD has a hotline phone number and email address for customers to contact us for additional information regarding FOG.
EBMUD also partners with the nongovernmental organization Baykeeper to expand its FOG control message to residential customers. Information on FOG control is on Baykeeper’s website. EBMUD and Baykeeper collaborate to expand the FOG-control message by working with “big box” retailers that sell turkey fryers and with grocers during the holiday season. We provide information to go on the turkey fryers and pull-off tags for use at grocery stores to communicate not to put FOG down the drain and with contact information for EBMUD for additional information.
Comments:
City staff do not know how many FSEs are present within the city.
The 10 inspectors identified as FOG program staff are also responsible for pollution prevention and industrial user inspections in addition to FOG. One of these staff is a senior inspector whose primary job responsibility is FOG.
It does not appear that there is a consistent feedback mechanism between the satellite and EBMUD on such issues as enforcement actions against non-complying FSEs and feedback on follow-up to FSEs referred to EBMUD.
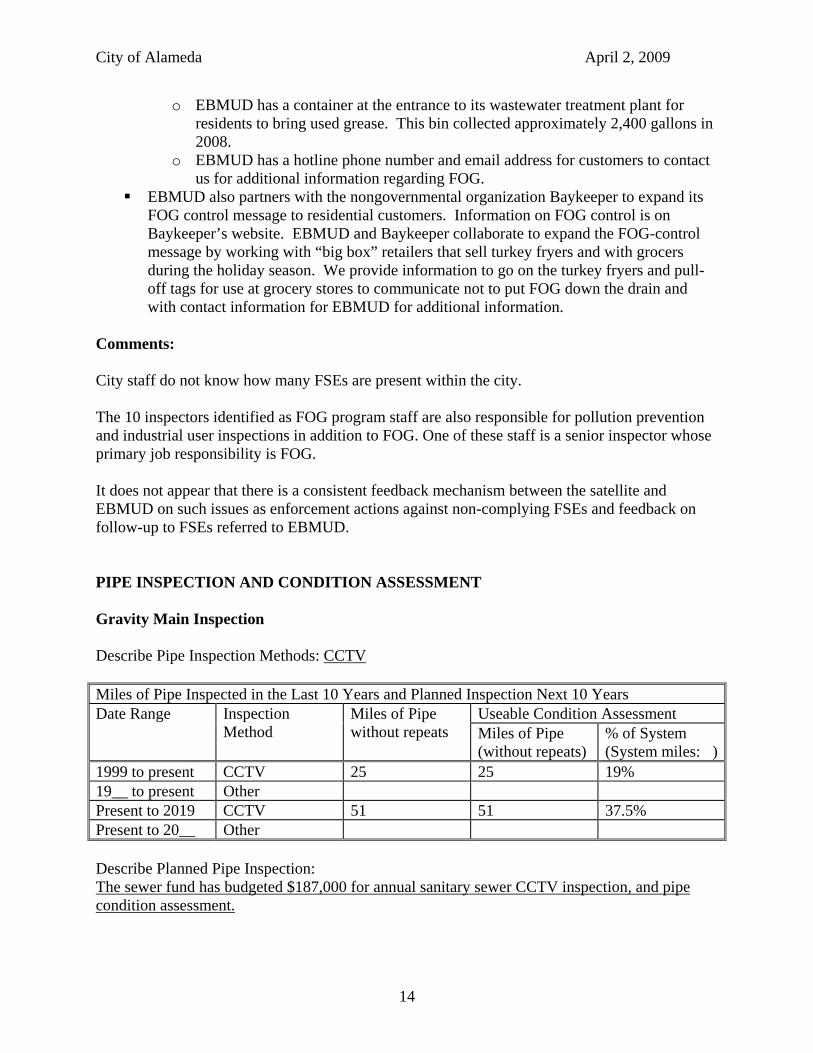
PIPE INSPECTION AND CONDITION ASSESSMENT
Gravity Main Inspection
Describe Pipe Inspection Methods: CCTV
Miles of Pipe Inspected in the Last 10 Years and Planned Inspection Next 10 Years Date Range Inspection
Method Miles of Pipe without repeats
Useable Condition Assessment Miles of Pipe (without repeats)
% of System (System miles: )
1999 to present CCTV 25 25 19% 19__ to present Other Present to 2019 CCTV 51 51 37.5% Present to 20__ Other
Describe Planned Pipe Inspection: The sewer fund has budgeted $187,000 for annual sanitary sewer CCTV inspection, and pipe condition assessment.
14
City of Alameda April 2, 2009
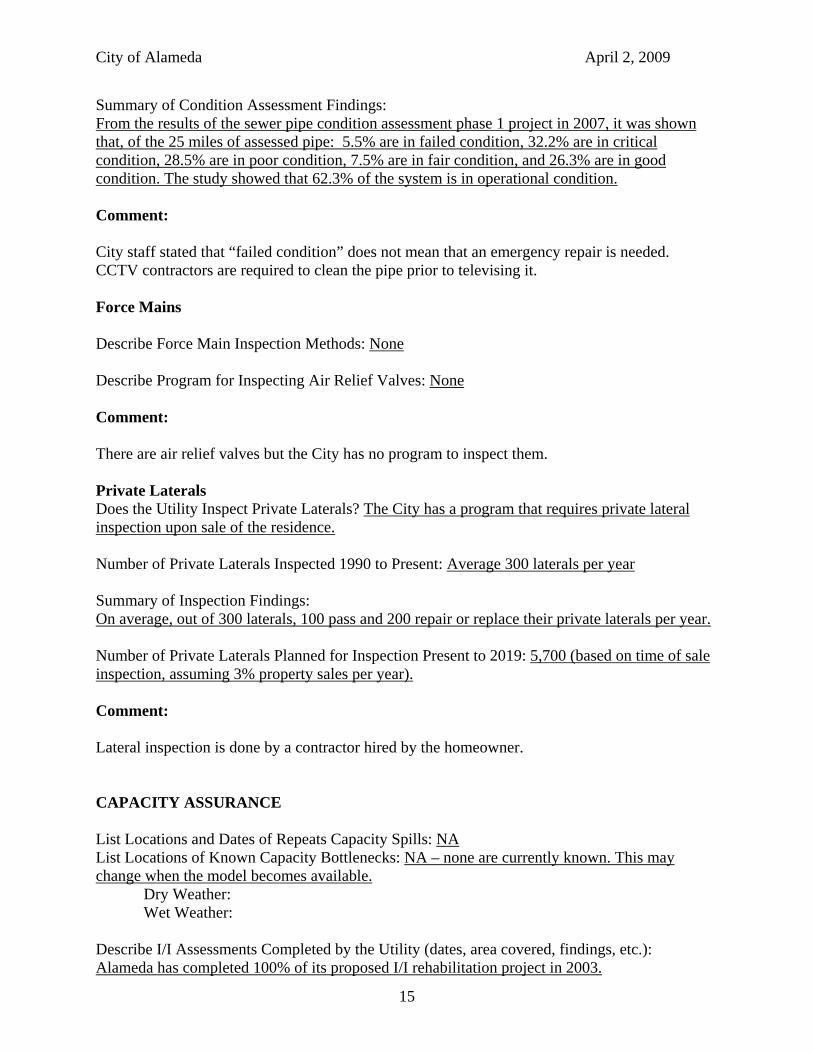
Summary of Condition Assessment Findings: From the results of the sewer pipe condition assessment phase 1 project in 2007, it was shown that, of the 25 miles of assessed pipe: 5.5% are in failed condition, 32.2% are in critical condition, 28.5% are in poor condition, 7.5% are in fair condition, and 26.3% are in good condition. The study showed that 62.3% of the system is in operational condition.
Comment:
City staff stated that “failed condition” does not mean that an emergency repair is needed. CCTV contractors are required to clean the pipe prior to televising it.
Force Mains
Describe Force Main Inspection Methods: None
Describe Program for Inspecting Air Relief Valves: None
Comment:
There are air relief valves but the City has no program to inspect them.
Private Laterals Does the Utility Inspect Private Laterals? The City has a program that requires private lateral inspection upon sale of the residence.
Number of Private Laterals Inspected 1990 to Present: Average 300 laterals per year
Summary of Inspection Findings: On average, out of 300 laterals, 100 pass and 200 repair or replace their private laterals per year.
Number of Private Laterals Planned for Inspection Present to 2019: 5,700 (based on time of sale inspection, assuming 3% property sales per year).
Comment:
Lateral inspection is done by a contractor hired by the homeowner.
CAPACITY ASSURANCE
List Locations and Dates of Repeats Capacity Spills: NA List Locations of Known Capacity Bottlenecks: NA – none are currently known. This may change when the model becomes available. Dry Weather: Wet Weather:
Describe I/I Assessments Completed by the Utility (dates, area covered, findings, etc.): Alameda has completed 100% of its proposed I/I rehabilitation project in 2003.
15
City of Alameda April 2, 2009
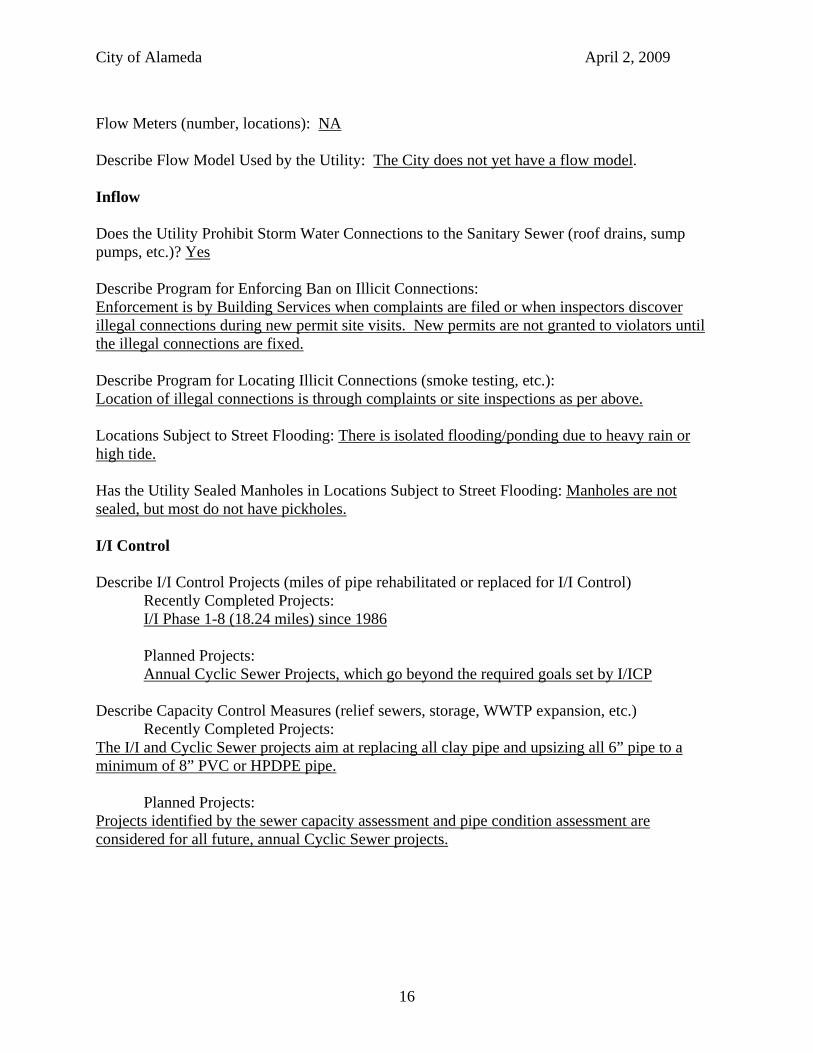
Flow Meters (number, locations): NA
Describe Flow Model Used by the Utility: The City does not yet have a flow model.
Inflow
Does the Utility Prohibit Storm Water Connections to the Sanitary Sewer (roof drains, sump pumps, etc.)? Yes
Describe Program for Enforcing Ban on Illicit Connections: Enforcement is by Building Services when complaints are filed or when inspectors discover illegal connections during new permit site visits. New permits are not granted to violators until the illegal connections are fixed.
Describe Program for Locating Illicit Connections (smoke testing, etc.): Location of illegal connections is through complaints or site inspections as per above.
Locations Subject to Street Flooding: There is isolated flooding/ponding due to heavy rain or high tide.
Has the Utility Sealed Manholes in Locations Subject to Street Flooding: Manholes are not sealed, but most do not have pickholes.
I/I Control
Describe I/I Control Projects (miles of pipe rehabilitated or replaced for I/I Control) Recently Completed Projects: I/I Phase 1-8 (18.24 miles) since 1986
Planned Projects: Annual Cyclic Sewer Projects, which go beyond the required goals set by I/ICP
Describe Capacity Control Measures (relief sewers, storage, WWTP expansion, etc.) Recently Completed Projects:
The I/I and Cyclic Sewer projects aim at replacing all clay pipe and upsizing all 6” pipe to a minimum of 8” PVC or HPDPE pipe.
Planned Projects: Projects identified by the sewer capacity assessment and pipe condition assessment are considered for all future, annual Cyclic Sewer projects.
16
City of Alameda April 2, 2009
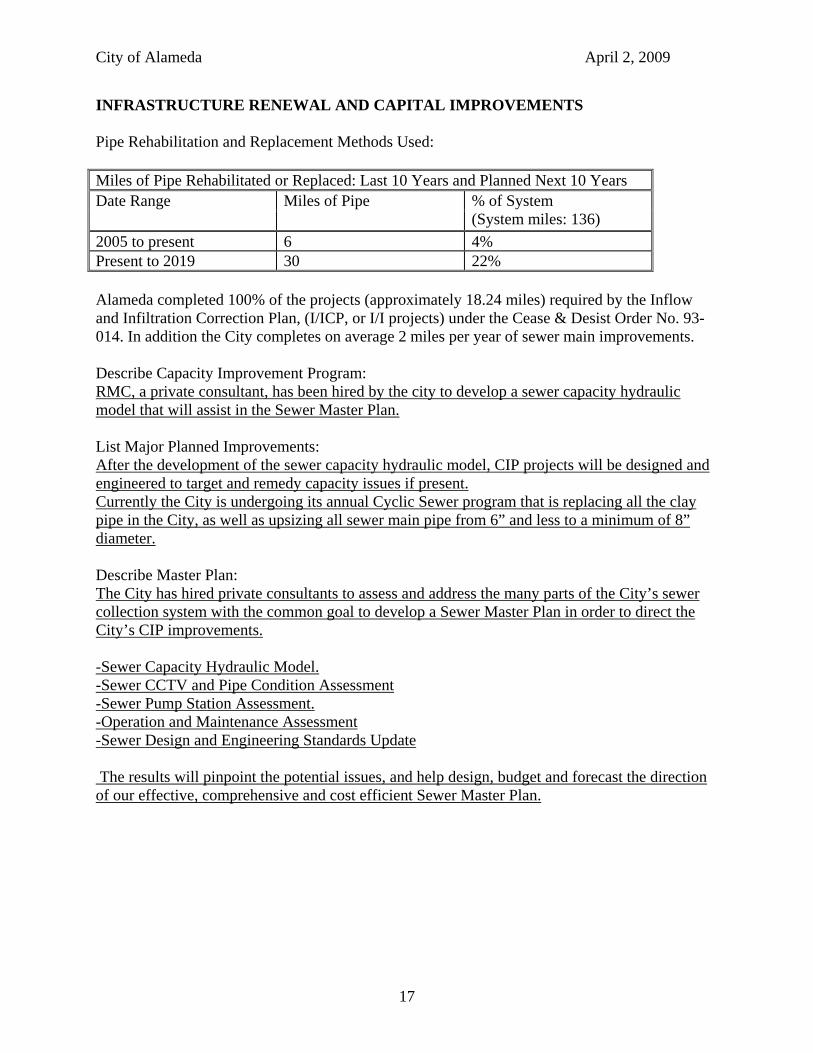
INFRASTRUCTURE RENEWAL AND CAPITAL IMPROVEMENTS
Pipe Rehabilitation and Replacement Methods Used:
Miles of Pipe Rehabilitated or Replaced: Last 10 Years and Planned Next 10 Years Date Range Miles of Pipe % of System
(System miles: 136)
2005 to present 6 4% Present to 2019 30 22%
Alameda completed 100% of the projects (approximately 18.24 miles) required by the Inflow and Infiltration Correction Plan, (I/ICP, or I/I projects) under the Cease & Desist Order No. 93-014. In addition the City completes on average 2 miles per year of sewer main improvements.
Describe Capacity Improvement Program: RMC, a private consultant, has been hired by the city to develop a sewer capacity hydraulic model that will assist in the Sewer Master Plan.
List Major Planned Improvements: After the development of the sewer capacity hydraulic model, CIP projects will be designed and engineered to target and remedy capacity issues if present. Currently the City is undergoing its annual Cyclic Sewer program that is replacing all the clay pipe in the City, as well as upsizing all sewer main pipe from 6” and less to a minimum of 8” diameter.
Describe Master Plan: The City has hired private consultants to assess and address the many parts of the City’s sewer collection system with the common goal to develop a Sewer Master Plan in order to direct the City’s CIP improvements.
-Sewer Capacity Hydraulic Model. -Sewer CCTV and Pipe Condition Assessment -Sewer Pump Station Assessment. -Operation and Maintenance Assessment -Sewer Design and Engineering Standards Update
The results will pinpoint the potential issues, and help design, budget and forecast the direction of our effective, comprehensive and cost efficient Sewer Master Plan.
17

City of Alameda Pump Stations
N# Location WO# Type of Pump Frame Type INS.
Class Reliance I.D. HP 1 Adelphian 55.31
2 Catalina 55.17 Drywell M620IS ABS 90081 20
55.17 Drywell M620IS ABS E9009 20 3 Channing 55.2 Submersible QD 210TY CS F C21G2701C 3 4 Sheffield/Cumberland 55.18 X180TY CS C18G2703K 3 5 Aughinbaugh 55.16 Submersible QD 210TY P F P21G2701HWL 10
55.16 Submersible QD 210TY P F P21G2701 10
6 Seaview I 55.22 Submersible QD X210TY CS F 17MX212701 3 55.22 Submersible QD 210TY CS F C21G27010TK 3 55.22 Submersible QD 210TY CS F C21G2701G 3
7 Seaview II 55.29 Submersible QD X160TY OS P C18G2702IT 2 8 Dublin 55.25 Submersible QD 210TY CS F C21G2702G 5
55.25 Submerisble QD 210TY CS F C21O2702O 5 9 Verdemar 55.12 Submersible QD 210TY CF F C2162701C 3
55.12 Submersible QD 210TY CF F P18G2728G 3
10 Harbor Bay Parkway I 55.19 Drywell Close Connected H3090303 B B 63-02857-598 3 11 Harbor Bay Parkway II 55.24 Drywell T4A3-B G.R.845187
55.24 Drywell T4A3-B G.R.845186 12 BFI 55.01 X320TY P F P32G2700B 30 13 Bay Fairway Hall 55.32 14 Eastshore/Myers 55.11 Submersible QD X18CTY F P C18C2700F 1 15 Bayview 55.1 210TY CS F C21G2702G 5 16 Park/Otis 55.06 Drywell X250TY P F P2562702H 25
Druwell 3152 FLYGHT 4670396 20 17 Willow 55.21 Submersible QD X210TY P F P21G2701H 10
X210TY P F P21G2701H 10 18 Willow/Whitehall 55.07 Submersible QD X180TY P F C18G2704F 3
55.07 Submersible QD X180TY P F C18G2704F 3
1

City of Alameda Pump Stations
N# Location Q (GPM) RPM Volts Amps Hz S.F. Design Code Phase 1 Adelphian
2 Catalina 1750 230/460 56/28 60
1750 230/460 56/28 60 3 Channing 1160 115/230 42/21 60 1.15 J 1 4 Sheffield/Cumberland 1725 115/230 40/20 60 1.15 J 1 5 Aughinbaugh 1755 230/460 27/13.5 60 1.15 B J 3
1755 230/460 27/13.5 60 1.15 B J 3
6 Seaview I 1160 115/230 43/21 60 1.15 J 1 1160 115/230 42/21 60 1.15 J 1 1160 115/2309 42/21 60 1.15 J 1
7 Seaview II 1720 115/230 25/12.5 60 1.15 1 8 Dublin 1730 230 30 60 1.15 H 1
1730 230 30 60 1.15 H 1 9 Verdemar 1160 230 21 60 1.15 J 1
1160 230 21 60 1.15 J 1
10 Harbor Bay Parkway I 855 208 13.2 60 1 B J 3 11 Harbor Bay Parkway II
12 BFI 1165 460 40 60 1.15 3 13 Bay Fairway Hall 14 Eastshore/Myers 1150 115/230 17.2/8.6 60 1.15 K 1 15 Bayview 1730 230 30 60 1.15 H 1 16 Park/Otis 1750 230/460 66/33 50 1.15 B G 3
1750 230/460 50/25 50 17 Willow 1755 230/460 27/13.5 60 1.15 B H 3
1755 230/460 27/13 60 1.15 3 18 Willow/Whitehall 1725 115/230 40/20 60 1.15 J 1
1725 115/230 40/20 60 1.15 J 1
2
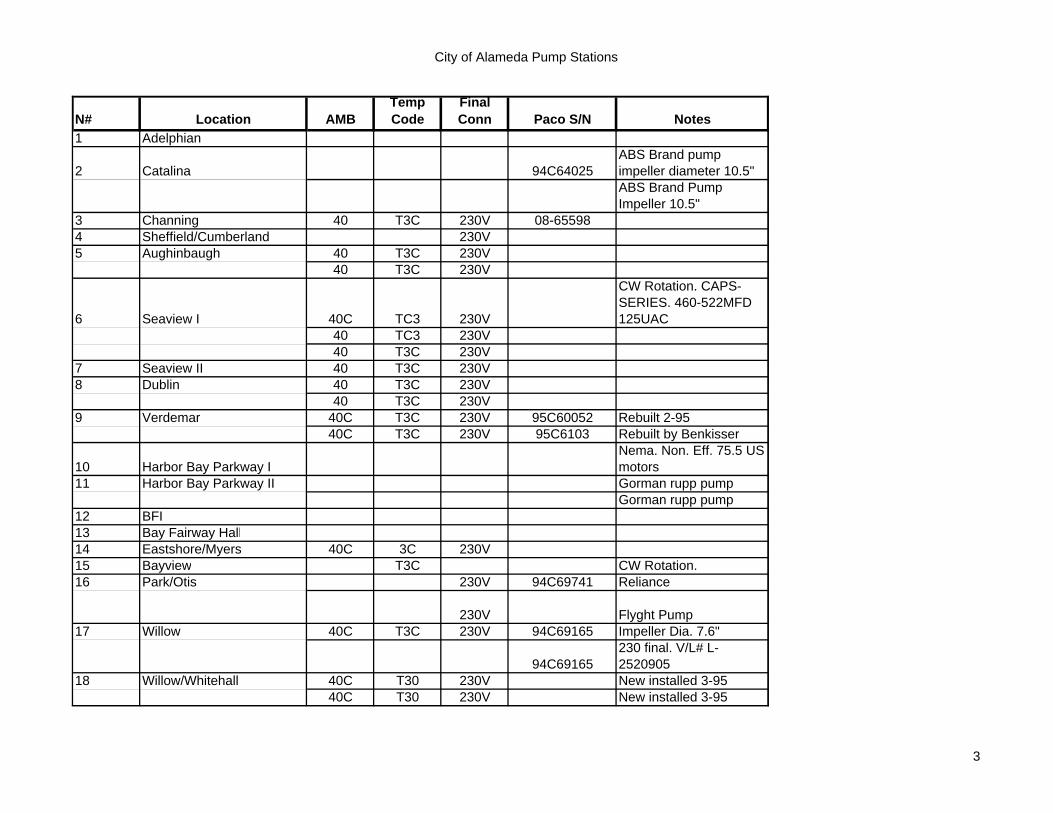
City of Alameda Pump Stations
N# Location AMB Temp Code
Final Conn Paco S/N Notes
1 Adelphian
2 Catalina 94C64025 ABS Brand pump impeller diameter 10.5" ABS Brand Pump Impeller 10.5"
3 Channing 40 T3C 230V 08-65598 4 Sheffield/Cumberland 230V 5 Aughinbaugh 40 T3C 230V
40 T3C 230V
6 Seaview I 40C TC3 230V
CW Rotation. CAPS-SERIES. 460-522MFD 125UAC
40 TC3 230V 40 T3C 230V
7 Seaview II 40 T3C 230V 8 Dublin 40 T3C 230V
40 T3C 230V 9 Verdemar 40C T3C 230V 95C60052 Rebuilt 2-95
40C T3C 230V 95C6103 Rebuilt by Benkisser
10 Harbor Bay Parkway I Nema. Non. Eff. 75.5 US motors
11 Harbor Bay Parkway II Gorman rupp pump Gorman rupp pump
12 BFI 13 Bay Fairway Hall 14 Eastshore/Myers 40C 3C 230V 15 Bayview T3C CW Rotation. 16 Park/Otis 230V 94C69741 Reliance
230V Flyght Pump 17 Willow 40C T3C 230V 94C69165 Impeller Dia. 7.6"
94C69165 230 final. V/L# L-2520905
18 Willow/Whitehall 40C T30 230V New installed 3-95 40C T30 230V New installed 3-95
3

City of Alameda Pump Stations
N# Location WO# Type of Pump Frame Type INS.
Class Reliance I.D. HP 19 Yorkshire/Franciscan 55.3 X180TY CS F C18G2703K 3 20 Pond/Otis 55.08 Submersible QD X180TY CS F C1862701H 1.5
21 Grand/Shoreline 55.27 X180TY F C18G2703K 3
22 Grand/Otis 55.05 Drywell 6 FLYGHT 8740033 14
55.05 Drywell 6 FLYGHT 8740034 14 23 Sand Beach 55.09 X140TY 2 24 Paru 55.04 25 Eighth/Portola 55.02 26 Eighth/Taylor 55.05 27 Tideway 55.14 X210TY P F 2102701H 10 28 Cola Ballena 55.13 X210TY P F P2102701H 10
29 Encinal boat ramp 55.26 Submersible QD (FLYGHT) 8740015 3
30 Triumph/Independence 55.28 Submersible QD 210TY P F P21G2705C 7.5 55.28 Submersible QD 210TY P F P21G2705G 7.5
31 Marina Village 55.23 Submersible QD 250TY P F 1YUB38514A2 10 55.23 Submersible QD 250TY P F 1YUB38514A1 10 55.23 Submersible QD 250TY P F 1YUB38514A4 10 55.23 Submersible QD 250TY P F ILEGIBLE 10
32 L/S #2 AP 855.02 33 L/S #3 AP 855.03 34 L/S #4 AP 855.04 35 L/S #5 AP 855.05 36 L/S #6 AP 855.06 37 L/S #8 AP 855.08 38 L/S #14 AP 855.14 39 L/S #19 AP 855.19 40 L/S #20 AP 855.2 41 L/S #551 AP 855.511 42 Haile 43 Grand Street Submersible FLYGT NP3127 10
4
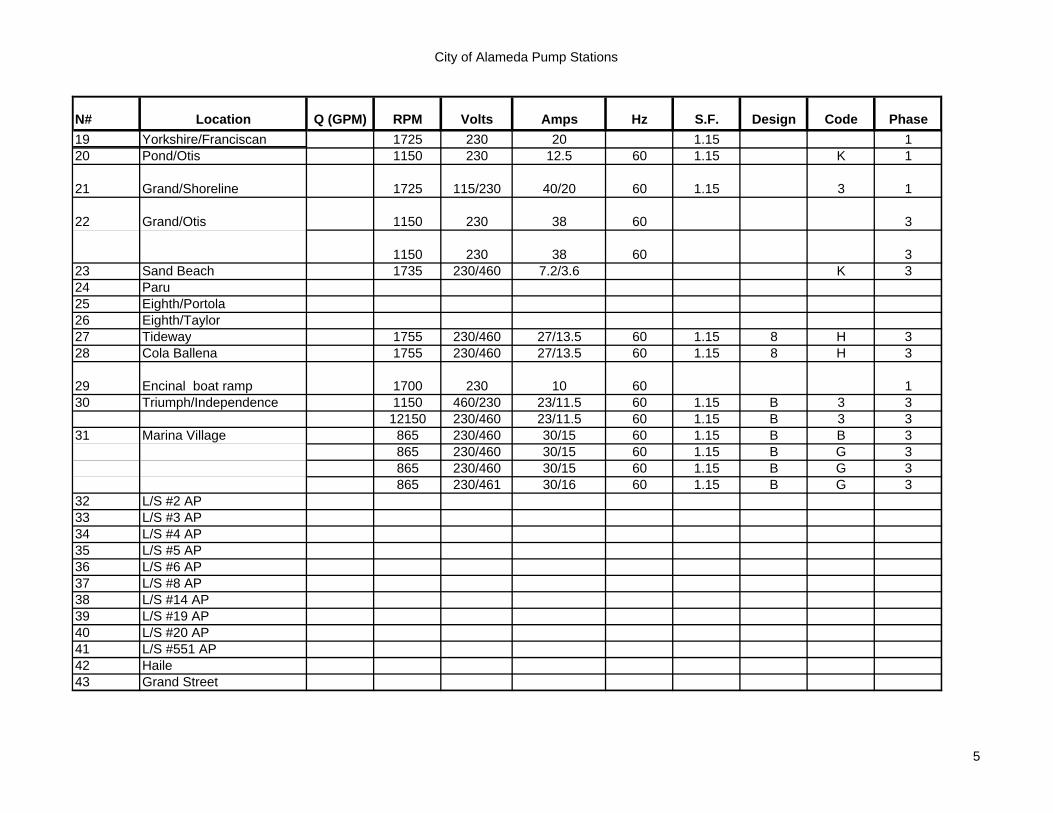
City of Alameda Pump Stations
N# Location Q (GPM) RPM Volts Amps Hz S.F. Design Code Phase 19 Yorkshire/Franciscan 1725 230 20 1.15 1 20 Pond/Otis 1150 230 12.5 60 1.15 K 1
21 Grand/Shoreline 1725 115/230 40/20 60 1.15 3 1
22 Grand/Otis 1150 230 38 60 3
1150 230 38 60 3 23 Sand Beach 1735 230/460 7.2/3.6 K 3 24 Paru 25 Eighth/Portola 26 Eighth/Taylor 27 Tideway 1755 230/460 27/13.5 60 1.15 8 H 3 28 Cola Ballena 1755 230/460 27/13.5 60 1.15 8 H 3
29 Encinal boat ramp 1700 230 10 60 1 30 Triumph/Independence 1150 460/230 23/11.5 60 1.15 B 3 3
12150 230/460 23/11.5 60 1.15 B 3 3 31 Marina Village 865 230/460 30/15 60 1.15 B B 3
865 230/460 30/15 60 1.15 B G 3 865 230/460 30/15 60 1.15 B G 3 865 230/461 30/16 60 1.15 B G 3
32 L/S #2 AP 33 L/S #3 AP 34 L/S #4 AP 35 L/S #5 AP 36 L/S #6 AP 37 L/S #8 AP 38 L/S #14 AP 39 L/S #19 AP 40 L/S #20 AP 41 L/S #551 AP 42 Haile 43 Grand Street
5
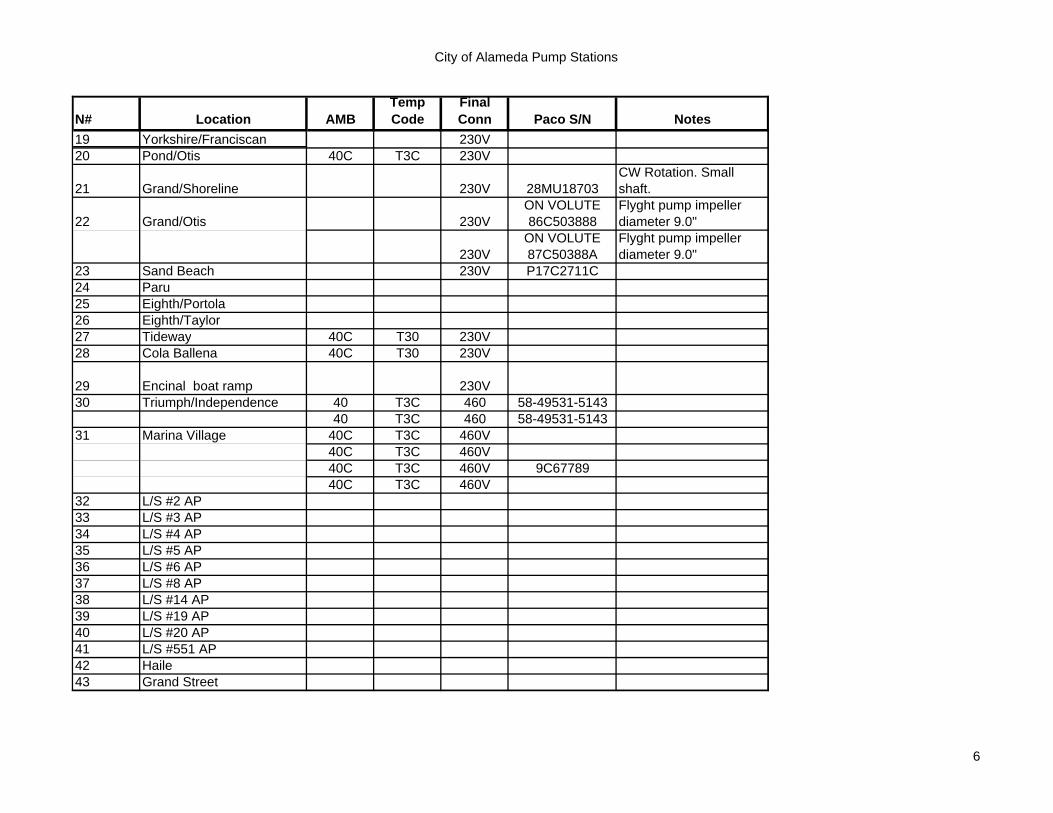
City of Alameda Pump Stations
N# Location AMB Temp Code
Final Conn Paco S/N Notes
19 Yorkshire/Franciscan 230V 20 Pond/Otis 40C T3C 230V
21 Grand/Shoreline 230V 28MU18703 CW Rotation. Small shaft.
22 Grand/Otis 230V ON VOLUTE 86C503888
Flyght pump impeller diameter 9.0"
230V ON VOLUTE 87C50388A
Flyght pump impeller diameter 9.0"
23 Sand Beach 230V P17C2711C 24 Paru 25 Eighth/Portola 26 Eighth/Taylor 27 Tideway 40C T30 230V 28 Cola Ballena 40C T30 230V
29 Encinal boat ramp 230V 30 Triumph/Independence 40 T3C 460 58-49531-5143
40 T3C 460 58-49531-5143 31 Marina Village 40C T3C 460V
40C T3C 460V 40C T3C 460V 9C67789 40C T3C 460V
32 L/S #2 AP 33 L/S #3 AP 34 L/S #4 AP 35 L/S #5 AP 36 L/S #6 AP 37 L/S #8 AP 38 L/S #14 AP 39 L/S #19 AP 40 L/S #20 AP 41 L/S #551 AP 42 Haile 43 Grand Street
6
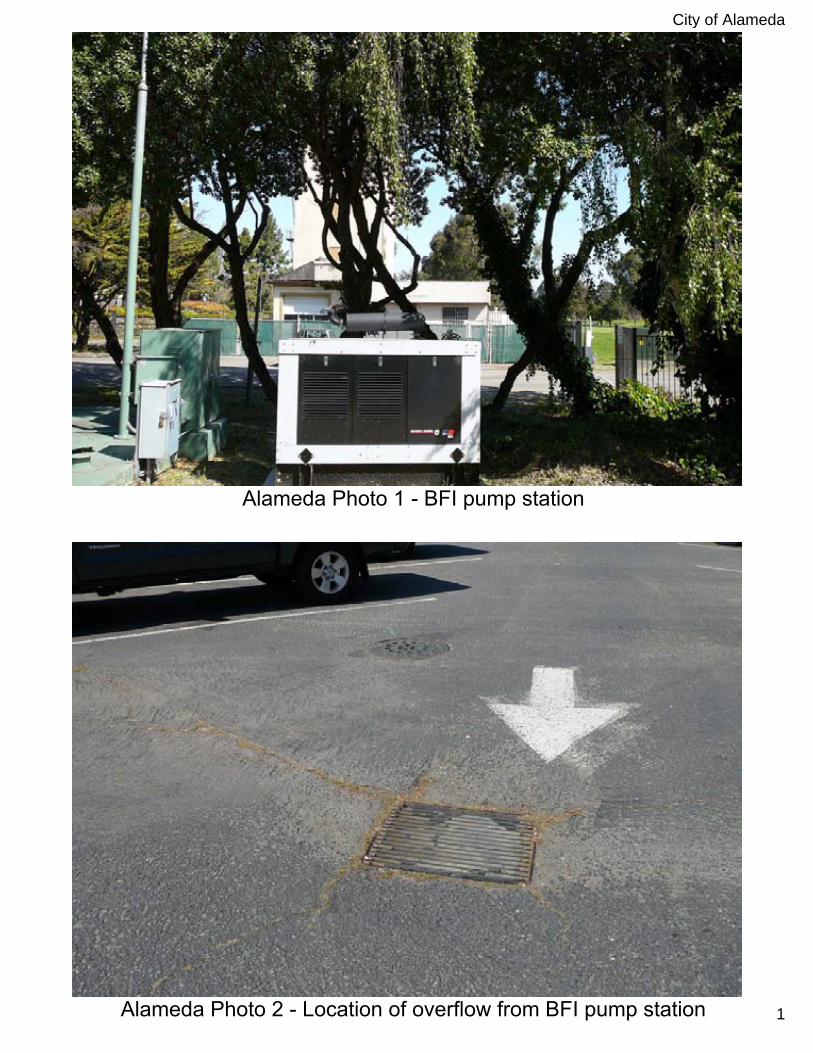
City of Alameda
Alameda Photo 1 - BFI pump station
Alameda Photo 2 - Location of overflow from BFI pump station 1
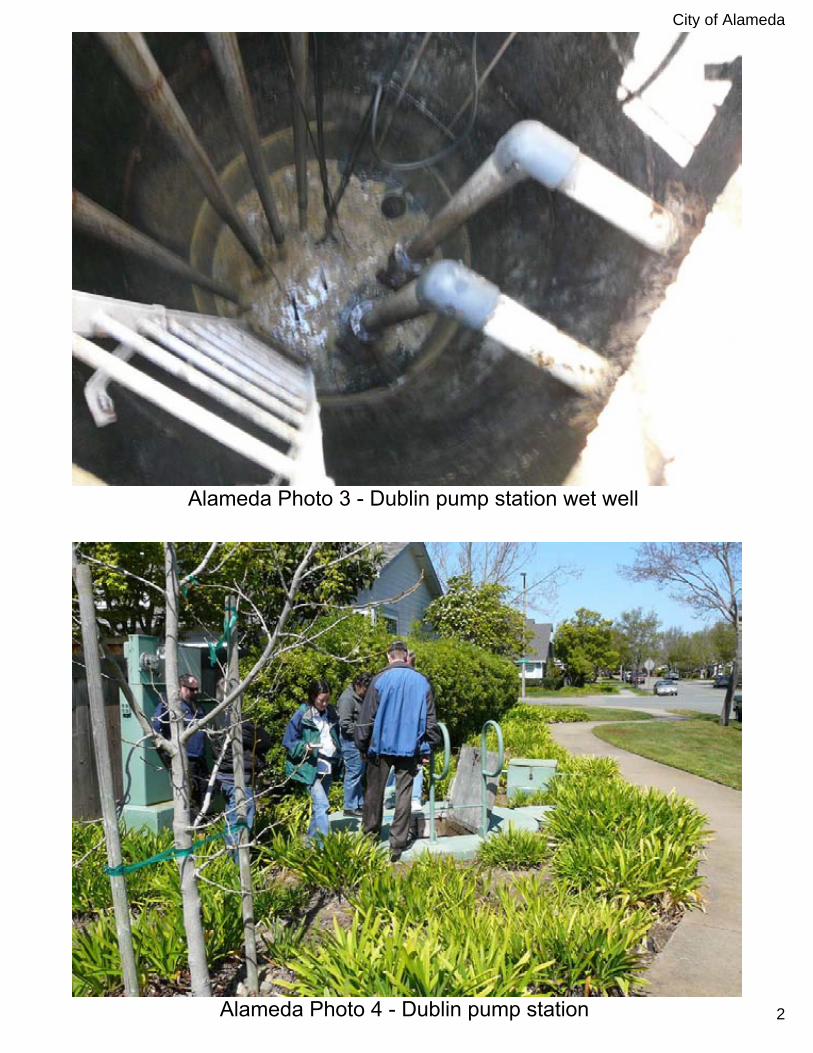
City of Alameda
Alameda Photo 3 - Dublin pump station wet well
Alameda Photo 4 - Dublin pump station 2
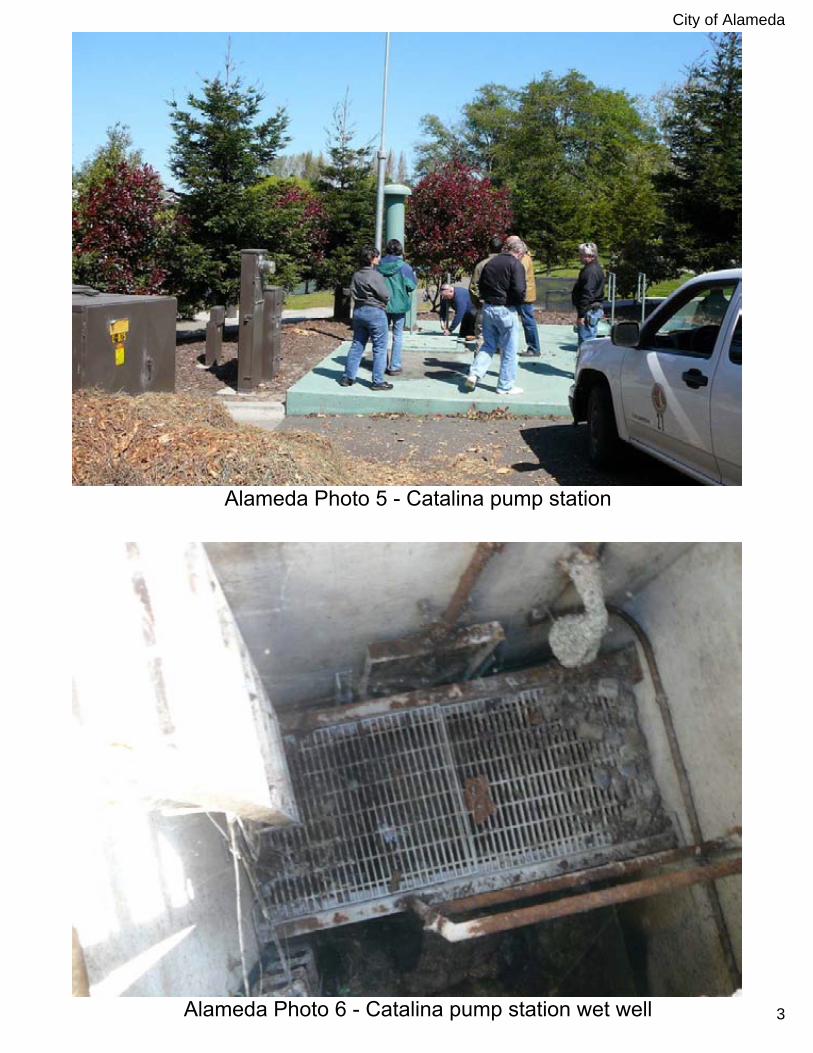
City of Alameda
Alameda Photo 5 - Catalina pump station
Alameda Photo 6 - Catalina pump station wet well 3
City of Alameda
Alameda Photo 7 - 8th and Portola pump station
Alameda Photo 8 - Spill site at Alameda Federal Center 4
City of Alameda
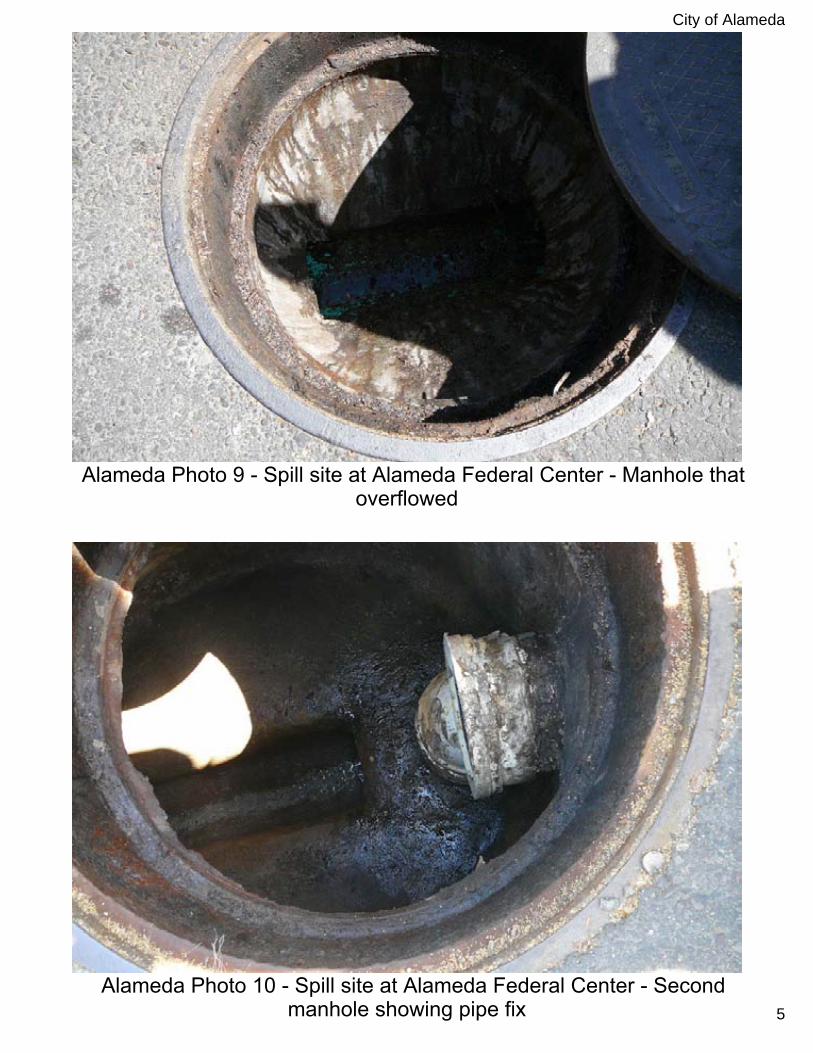
Alameda Photo 9 - Spill site at Alameda Federal Center - Manhole thatoverflowed
Alameda Photo 10 - Spill site at Alameda Federal Center - Secondmanhole showing pipe fix 5
City of Alameda
Alameda Photo 11 - Lift station 6
Alameda Photo 12 - Lift station 6 wet well 6
City of Alameda
Alameda Photo 13 -Willow pump station
Alameda Photo 14 -Willow pump station wet well 7
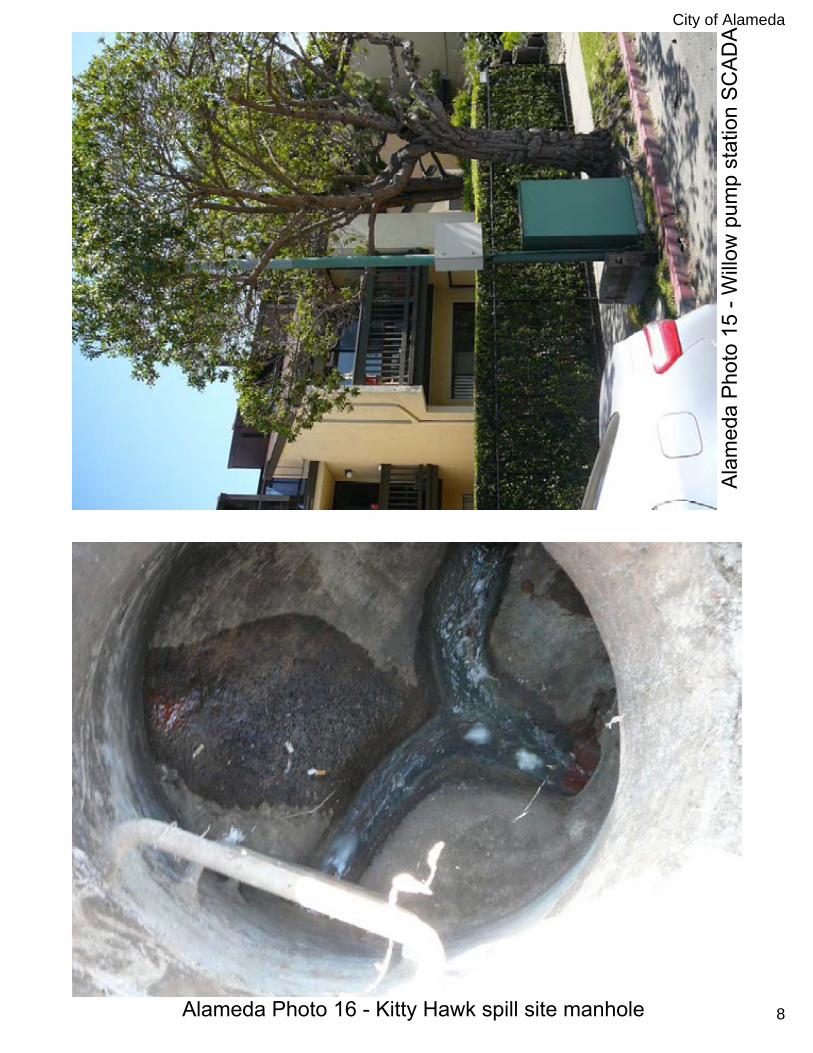
Alameda Photo 15 -W
illow
pum
p station SCADA City of Alameda
Alameda Photo 16 - Kitty Hawk spill site manhole 8