rethinking collection system cleaning using acoustic inspection
TRANSCRIPT

WEFTEC 2012 Session 114 O&M of Collection Systems
Rethinking Collection System Cleaning Using Acoustic Inspection
Ivan Howitt1*
, John Fishburne2
1 InfoSense, Inc., Charlotte, North Carolina.
2 Charlotte-Mecklenburg Utilities, Charlotte, North Carolina.
* Email: [email protected]
ABSTRACT
Setting up a utility’s preventative maintenance program for their gravity-fed collection system’s
cleaning involves recognizing that many pipe segments scheduled for cleaning will not need it.
But, this cost of over cleaning must be balanced against insufficient maintenance resulting in
excessive overflows. We present herein a new diagnostic tool, the Sewer Line – Rapid
Assessment Tool or SL-RAT™. The SL-RAT is an onsite inspection device developed by
InfoSense with the support of Charlotte-Mecklenburg Utilities (CMU). The SL-RAT diagnostic
capability allows cleaning requirements for pipe segments to be economically prioritized prior to
conducting cleaning operations. We show that significant cost savings can be achieved through:
reduced asset condition assessment costs, reduced cleaning-related overflows, and reduced non-
value added cleaning effort. In this paper, CMU Case Studies are reviewed and used to show
how the SL-RAT acoustic inspection system can be used to establish a Sewer Line Condition
Based Maintenance (SL-CBM™) program.
KEYWORDS
Sewer line inspection, wastewater operation management, pipe blockage assessment, collection
system cleaning, condition based maintenance, acoustic pipe inspection.
INTRODUCTION
Based on Charlotte Mecklenburg Utilities’ (CMU) ongoing efforts to enhance their gravity-fed
collection system’s maintenance operations, it has been recognized that 50% or more of pipe
segments cleaned receive little to no benefit as they were essentially already clean prior to
maintenance. This insight is further compounded by the fact that locations chosen for
conducting cleaning operations were identified using spatial analysis as well as historical
performance and institutional system knowledge as inputs. Collection system maintenance
requires allocating cleaning resources to the right place prior to system failure (SSO, mainline
blockages and building backups). CMU’s overall overflow rate has been between 8 and 9
overflows/100 miles/year with over 20% of the system cleaned annually. For comparison, a
scatter plot of overflows/100 miles vs. percentage system cleaned is depicted in Figure 1. The
plot is based on self reporting from sixteen municipalities’ annual performance reports. As
would be anticipated, linear regression indicates a strong correlation between cleaning effort and
overflow reduction. Due to the inherent random nature of the underlying mechanisms that build
up to overflows, there is likely a diminishing return with more cleaning. Therefore, as the
percentage of the system cleaned increases, an even larger proportion of wasteful and
unnecessary cleaning will be conducted, unless, an improved method for targeting cleaning
operations can be implemented.

WEFTEC 2012 Session 114 O&M of Collection Systems
Figure 1 Comparison of sixteen municipalities’ performance in maintaining their collection
system’s overflow rates based on the percentage of the system cleaned annually.
Historically, using condition based inspection to determine where and when to deploy collection
system cleaning resources has not been economically feasible. Existing pipe inspection methods
are either too cost prohibitive for wide spread use or provide inadequate condition assessment.
The Sewer Line – Rapid Assessment Tool or SL-RAT™ is a new diagnostic tool specifically
designed to address the need for identifying pipe blockage in support of an overall collection
system maintenance program. The SL-RAT is an onsite inspection device developed by
InfoSense with the support of CMU. The SL-RAT diagnostic capability allows cleaning
requirements for pipe segments to be economically prioritized prior to conducting cleaning
operations. The acoustic testing equipment provides a clear condition assessment directly
correlated with cleaning requirements. The acoustic inspection operation requires significantly
less resources than is required for current maintenance practices. This provides the opportunity
to rethink using condition based maintenance as a viable tool for deploying cleaning resources.
This novel approach can both improve maintenance quality and reduce unnecessary maintenance
operations.
Over the past two years, CMU has conducted well over three thousand SL-RAT acoustic
inspections of pipe segments. This has provided a condition assessment for over 850 thousand
feet of their collection system. In the past year, the focus of inspections has changed from
evaluating the SL-RAT technology, to incorporating the technology as the enabler for a newly
evolving collection system cleaning CBM program based on acoustic inspections. The objective
of the paper is to provide:
1. Direct evaluation of the SL-RAT as a condition based assessment tool. This evaluation is
based on a pilot project conducted by CMU to evaluate the SL-RAT’s effectiveness in
prioritizing maintenance operations, as well as to evaluate its cost effectiveness and ease
of operation. This study involved a systemic comparison between acoustic inspection
and corresponding CCTV assessment both before and after maintenance operations.
2. Direct evaluation of integrating the SL-RAT for condition based assessment. An
illustrative case study is presented to examine the procedural and operational advantage
10 20 30 40 50 60 70 800
5
10
15
20
25
% System Cleaned Annually
Ove
rflo
ws /
10
0m
i
76%
Charlotte
2
Linear Regression –Standard Deviation: 2.5
One Sigma Below Mean
45%

WEFTEC 2012 Session 114 O&M of Collection Systems
for using the SL-RAT as a conditional based assessment tool for a consolidated cleaning
project.
3. Evaluate the capability and requirements for developing a Sewer Line Condition Based
Maintenance (SL-CBM™) program based on SL-RAT acoustic inspections. Examine the
trade-offs in developing a SL-CBM program to achieve a collection system performance
goal of 2 overflows/100 miles/year without increasing the current operations cost for
cleaning.
4. Evaluate the Cost versus Performance for an SL-CBM using the SL-RAT based on the
spatial and temporal overflow patterns within the CMU collection system. This
evaluation is based on an analytical model which incorporates the CMU overflow data
for the past thirteen years and the SL-RAT acoustic inspection data collected over the
past two years.
METHODOLOGY
Acoustic Inspection – SL-RAT Operation
The sewer-line rapid assessment tool (SL-RAT™) exploits the similarities and differences
between water and sound transmission through a sewer line segment in order to diagnose the
extent of the pipe’s blockage. This novel, patented methodology (Howitt 2009) is based on
measuring the signal received from an active acoustic transmission through a segment. Figure 2
depicts the general configuration of the SL-RAT device. The acoustic transmitter generates
sound waves just below the entrance to the manhole which naturally couple into the connecting
sewer line segments, whether the depth of the manhole is 3 feet or greater than 20 feet. The
sound wave propagates in the air gap above the wastewater flow from the speaker to the
receiving microphone located at the adjacent manhole. Segment lengths exceeding 700 feet have
been successfully evaluated. The acoustic receiver measures the acoustic plane wave from the
transmitted signal in order to evaluate the condition of an entire segment and provides an onsite
assessment in less than three minutes. An important practical aspect of the SL-RAT is that both
the speaker and the microphone are placed just within the opening of the manhole and never
come in contact with the wastewater flow and the operators have no requirement for confined
space entry.
Figure 2 Concept and operation of the SL-RAT Acoustic Inspection System.
AcousticTransmitter
AcousticReceiver
6” Diameter or Greater Sewer Line Segment

WEFTEC 2012 Session 114 O&M of Collection Systems
A pipe segment is a natural acoustic waveguide (Philip 1968). As illustrated in Figure 2,
commonly encountered sanitary sewer defects, such as roots, grease, pipe sags and pipe
breakages naturally absorb or reflect acoustic energy. These defects change a segment’s acoustic
properties and produce a measurable impact on the received signal at the microphone, i.e., the
segment’s acoustic fingerprint (SAF). Each segment has an individual SAF representative of its
current state. The SAF changes over time as the condition of the segment varies. The SL-RAT
uses the SAF to determine the SL-RAT Blockage Assessment, i.e., an estimate of the aggregate
blockage within the pipe segment between the acoustic transmitter and acoustic receiver. The
aggregate blockage assessment is provided to the operator at the end of each test on a scale from
0-10 with zero indicating complete blockage and ten indicating an essentially clean segment.
Using the blockage assessment, the operator can determine whether or not maintenance is
needed.
Case Studies
CMU Pilot Project integrated the SL-RAT evaluation into an ongoing preventative maintenance
program which focuses cleaning and inspection resources into a consolidated area. A detailed
presentation of both the approach and the results of the pilot project are presented in Howitt and
Fisburne (2010). Key points from this paper are summarized here due to their importance in
validating the SL-RAT and to establish its operational performance. The performance results
from this study are important for developing and motivating the SL-CBM program based on the
SL-RAT.
CMU Pilot Project objectives:
1. Assess the ability of the SL-RAT acoustical tool to
a. Reveal a state of partial obstruction in a pipe segment,
b. Define the progression of partial to complete obstruction for a pipe segment.
2. Establish the suitability of the SL-RAT acoustical tool for CMU to realize operating cost
savings and prevent system failures
a. Economically identify pipe segments requiring maintenance (prioritization aid,
failure prevention method),
b. Establish optimal maintenance cycles (sustainable failure prevention).
Approach used in evaluating the CMU Pilot Project objectives:
1. Use the following data collection sequence within the Consolidated Cleaning Area:
a. Collect pre-cleaning acoustical profile of pipe segments
b. Collect pre-cleaning video inspection of pipe segments
c. Collect post-cleaning video inspection of pipe segments
d. Collect post-cleaning acoustical profile of pipe segments
2. Analyze and assess acoustical profiles and compare with assessment based on video
inspections.
3. Evaluate SL-RAT use by CMU field staff to identify reduced capacity within pipe
segments without the benefit of having a previous acoustical profile
a. Define and analyze range of profiles for clean pipes,
b. SL-RAT classification analysis: False Positive Rate and False Negative Rate
c. Cost saving analysis.

WEFTEC 2012 Session 114 O&M of Collection Systems
The pipe segments to be evaluated by the SL-RAT acoustic inspection were based on the pre-
cleaning requirements for the basin cleaning project. CMU has found that pre-cleaning needs to
be an integral part of a consolidated cleaning project in order to reduce the risk of spills during
their systematic cleaning operation. Prior to Basin 17-100 cleaning operations, an Engineering
Assessment was made on which pipe segments were at high risk of being obstructed. These pipe
segments were then used to define the pipe segments included in the SL-RAT acoustic testing as
indicated in Figure 3 by the highlighted pipe segments.
The pre-cleaning classification results in Figure 3 are based on using the SL-RAT Blockage
Assessment to evaluate the pre-cleaning classification. The SL-RAT acoustic inspection
successfully identified the pipe segments requiring pre-cleaning. The number of pipe segments
identified was approximately one-third that identified originally using CMU’s standard method
of Engineering Assessment using historical data. These results were confirmed using CCTV, as
presented in the following discussion.
Figure 3 GIS map for Basin 17-100, CMU Pilot Project location. Highlighted pipe
segments represent locations evaluated with the SL-RAT acoustic inspection. The three
CCTV snapshots illustrate comparison between the SL-RAT Blockage Assessment and the
CCTV Blockage Assessment.
An important aspect of the methodology employed in the CMU Pilot Project was collecting
CCTV videos both prior-to and after cleaning the pipe segments. This approach allowed the
technical feasibility of the SL-RAT to be validated. In order to make a comparative analysis
between the CCTV and the SL-RAT, the CCTV videos were independently reviewed to assess
the aggregate blockage within each pipe segment, i.e., CCTV Blockage Assessment. A rank
order was used in the assessment with 10 indicating a pipe segment was essentially clean and 0

WEFTEC 2012 Session 114 O&M of Collection Systems
indicating a pipe segment was substantially obstructed. Three examples are given in Figure 3
comparing the CCTV Blockage Assessment with the SL-RAT Blockage Assessment with an
accompanying CCTV snapshot to illustrate the condition of the pipe segment.
The scatter plot in Figure 4 provides a comparison based on the two assessments. Each point on
the plot represents the CCTV Blockage Assessment versus the SL-RAT Blockage Assessment
for one pipe segment. If the two assessment where identical, then all the points would lie along
the diagonal line from (0, 0) to (10, 10). As observed in Figure 4, almost all points in the scatter
plot lie in the triangle below the diagonal. This implies the SL-RAT Blockage Assessment will
tend to be more conservative than the CCTV Blockage Assessment. The scatter plot also
indicates a threshold can be established for the SL-RAT Blockage Assessment which allows us
to discriminate between essentially clean and essentially dirty pipe segments. This is indicated
as the SL-RAT Standard Threshold in Figure 4. Using this threshold, all pipe segments with a
SL-RAT Blockage Assessment less than the threshold would require cleaning and all those
above would be classified as sufficiently clean and not require additional maintenance. Based on
the pipe segments evaluated for the CMU Pilot Project, using the SL-RAT Standard Threshold, a
61% reduction in the cleaning requirement is recommended. A second threshold is indicated on
the graph, SL-RAT Critical Threshold. This threshold discriminates between pipe segments in
critical need of maintenance and those that are not. Using this threshold indicates 85% of the
pipe segments in the CMU Pilot Project are not in need of immediate maintenance, based on the
acoustic inspection. On the other hand, 15% should have immediate action taken, whether it is
cleaning or a more detailed inspection such as CCTV. The results recommended using the SL-
RAT Thresholds are consistent with the CCTV Blockage Assessments. For both of the SL-RAT
Thresholds considered, there is no failure in identifying a pipe segment which required further
maintenance as one that did not.
To estimate the SL-RAT cost savings, we need to estimate the cost for operating the SL-RAT by
a two person field crew. The assumptions used are given in Table 1 where the values in the table
reflect typical industry values. The onsite work hours per day has been selected conservatively.
The average number of segments inspected per hour using the SL-RAT is based on
CMU/InfoSense field experience using the SL-RAT during the course of the CMU Pilot Project.
The inspected segments per hour varied from 4 to 10 with 6 being the average. This productivity
estimate continues to hold based on CMU’s extensive use of the SL-RAT with several different
field crews. Using the values from Table 1, the SL-RAT operational cost per foot is
$0.09/ft22065.5251
24000680002
(1)

WEFTEC 2012 Session 114 O&M of Collection Systems
Figure 4 Scatter plot comparing the CCTV Blockage Assessment with the SL-RAT
Blockage Assessment for sewer line segments within the CMU Pilot Project. SL-RAT
Thresholds used to discriminate between those pipe segments requiring additional
maintenance (below the threshold) and those that do not (above the threshold).
Table 1 Assumption Used for Evaluating SL-RAT Cost Based on the CMU Pilot Project
Number of Crew Members 2
Annual Fully Loaded Salary $68,000
Annual Equipment Costs (Including Truck & SL-RAT) $24,000
Work Days Per Year 251
Onsite Work Hours Per Day 5.5
SL- RAT Average Number of Segments Inspected Per Hour 6
Average Sewer Line Segment Length in feet 220
Cost Per Foot $0.09/ft
Next, in order to evaluate the SL-RAT cost-performance, we need to first estimate the cost of the
cleaning operation without the SL-RAT. The CMU Current Basin Cleaning Operation is based
on cleaning an entire basin followed by CCTV inspection to verify the cleaning operation. For
the evaluation we have used one dollar as the average costs per foot ($1.00/ft) for both the CCTV
crew inspection and the cleaning crew operation. To generalize the results, we have used typical
0 2 4 6 8 100
2
4
6
8
10
CCTV Based Blockage Assessment
SL
-RA
T B
locka
ge
Asse
ssm
ent
SL-RAT Standard Threshold
SL-RAT Critical Threshold

WEFTEC 2012 Session 114 O&M of Collection Systems
industry cleaning and CCTV costs and not specific values from the CMU Basin Cleaning
Project. To simplify the evaluation, we have excluded the cost for easement cleaning and
clearing. Using these assumptions, the Current Basin Cleaning Operation cost per foot of sewer
line pipe is $2.00/ft.
The cost saving analysis for the SL-RAT Based Basin Cleaning Operation needs to balance the
cost increase associated with using the SL-RAT with the cost savings obtained by reducing the
number of segments to be cleaned. Ideally, we would eliminate all segments requiring minimal
maintenance. Using the SL-RAT Standard Threshold reduces the number of pipe segments by
61%. In addition, using this SL-RAT threshold, no pipe segments requiring cleaning are missed.
The cost saving is driven by the difference between the total cost estimated for the CMU Current
Basin Cleaning Operation and the total cost estimated for the SL-RAT Based Basin Cleaning
Operation:
,tNumber Fee$2.00/ft Cleaning sinCurrent Ba CMU (2)
, Number Ft.$2.00/ft0.61-1$0.09/ft Cleaning Basin BasedRAT-SL (3)
t.Number Fee$1.13/ft
tNumber Fee$2.00/ft0.39$0.09/ft$2.00/ft SavingsCost
(4)
Basin Cleaning Project was conducted to further test and to fully implement the use of the SL-
RAT within a basin cleaning project. The goal of the project was to use acoustic inspection to
discriminate between pipe segments requiring cleaning and those that do not (Charlotte 2011). A
52,000 ft basin within CMU’s collection system was selected. The basin selected was scheduled
for consolidated cleaning which would typically require the entire basin to be cleaned and then
videoed with CCTV. Instead, acoustic inspection was used to assess the cleaning requirements
within the entire basin prior to cleaning. A more conservative SL-RAT Standard Threshold was
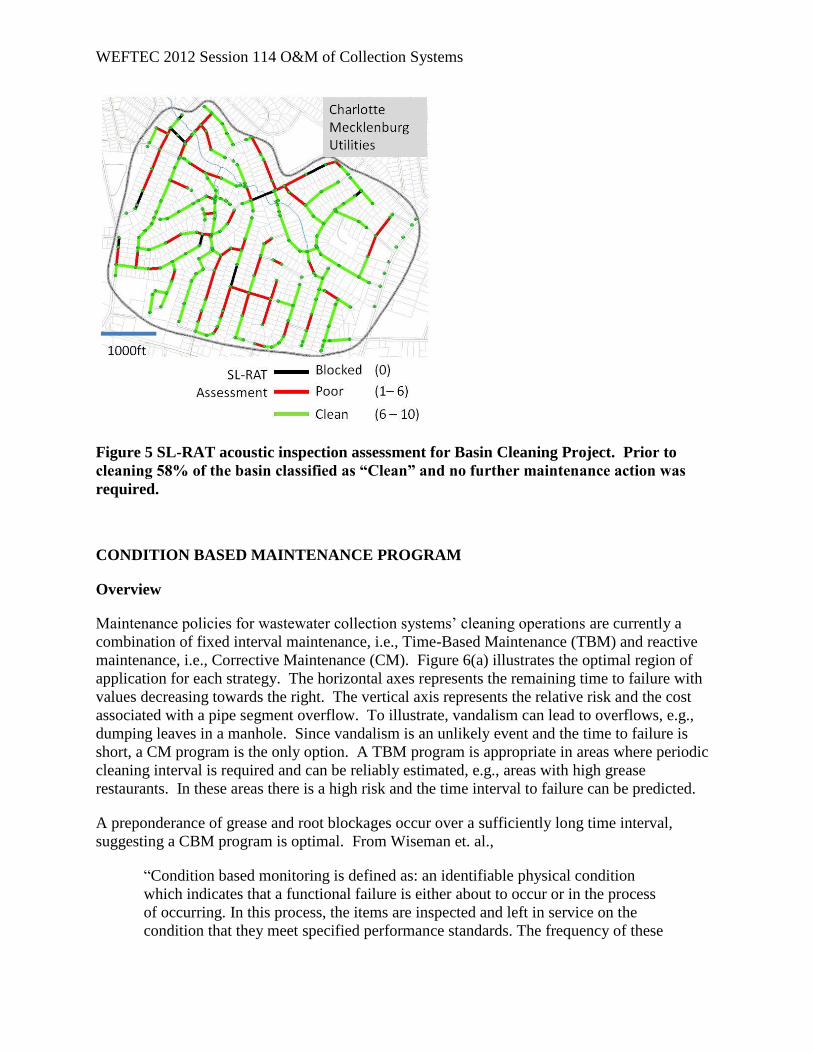
used for the project, i.e., the threshold was set to 6 rather than 4 as used in the CMU Pilot
Project. The results of the acoustic inspection are depicted in Figure 5. With the acoustic
inspection results, cleaning was reduced to 22,000 ft (42% of the basin). The 30,000 ft (58%) of
sewer which passed the conditional assessment required no maintenance, i.e., cleaning or post
cleaning verification. In addition, seven of the eleven segments classified as "Blocked" were
found to be full pipe sags and were scheduled for repair. Using the same cost analysis as given in
equations (2) –(4), the cost savings for the Basin Cleaning Project was
55,640.$000,25$1.07/ft
tNumber Fee$2.00/ft0.42$0.09/ft$2.00/ft SavingsCost
(5)
WEFTEC 2012 Session 114 O&M of Collection Systems
Figure 5 SL-RAT acoustic inspection assessment for Basin Cleaning Project. Prior to
cleaning 58% of the basin classified as “Clean” and no further maintenance action was
required.
CONDITION BASED MAINTENANCE PROGRAM
Overview
Maintenance policies for wastewater collection systems’ cleaning operations are currently a
combination of fixed interval maintenance, i.e., Time-Based Maintenance (TBM) and reactive
maintenance, i.e., Corrective Maintenance (CM). Figure 6(a) illustrates the optimal region of
application for each strategy. The horizontal axes represents the remaining time to failure with
values decreasing towards the right. The vertical axis represents the relative risk and the cost
associated with a pipe segment overflow. To illustrate, vandalism can lead to overflows, e.g.,
dumping leaves in a manhole. Since vandalism is an unlikely event and the time to failure is
short, a CM program is the only option. A TBM program is appropriate in areas where periodic
cleaning interval is required and can be reliably estimated, e.g., areas with high grease
restaurants. In these areas there is a high risk and the time interval to failure can be predicted.
A preponderance of grease and root blockages occur over a sufficiently long time interval,
suggesting a CBM program is optimal. From Wiseman et. al.,
“Condition based monitoring is defined as: an identifiable physical condition
which indicates that a functional failure is either about to occur or in the process
of occurring. In this process, the items are inspected and left in service on the
condition that they meet specified performance standards. The frequency of these

WEFTEC 2012 Session 114 O&M of Collection Systems
inspections is determined by the potential failure (P-F) interval, which is the
interval between the emergence of the potential failure and its decay in to a
functional failure.”
Developing an overall maintenance policy that balances the maintenance strategies is the goal of
Reliability Centered Maintenance (RCM) (Moubray 1997). RCM allocates cleaning resources
based on optimizing the cost and risk associated with overflows.
Figure 6 (a) Regions of optimal application for four maintenance strategies (Lehtonen
2006); (b) Relationship between inspection and P-F in a CBM based maintenance strategy
(Moubray 1997 and Wiseman et. al.).
Historically, using condition based inspection to determine where and when to deploy collection
system cleaning resources has not been economically feasible. The available inspection
technologies are either cost prohibitive or provide inadequate information. The SL-RAT
acoustic inspection equipment provides a clear condition assessment directly correlated with the
cleaning requirements. Acoustic inspection requires significantly fewer resources compared to
normal maintenance, i.e., SL-RAT acoustic inspection has been shown to be less than 1/10th
the
cost of cleaning or just $0.09/ft. This provides the opportunity to rethink using condition based
maintenance as a viable tool for deploying cleaning resources. This approach can improve
maintenance quality, reduce unnecessary maintenance operations and, at the same time, reduce
costs.
The previous discussion motivates the value proposition for implementing the Sewer Line
Condition Based Maintenance (SL-CBM) program based on the SL-RAT inspection. Figure
6(b) illustrates the concept and the challenges with implementation. The graph in the figure is a
standard P-F curve (Moubray 1997 and Wiseman et. al.) depicting a graceful degradation in a
pipe segment with the condition assessment graph representative of a grease or root mode of
failure. Point P represents the initial time performance degradation can be detected and Point D
represents the time performance degradation is detected based on the SL-RAT CBM inspection
schedule. Point F represents the operation time at which the sewer line pipe segment
functionally fails, e.g., the blockage is sufficient to cause an overflow. Each pipe segment has a
Remaining Time to Failure, ΔT
RCMCBM
CM
TBM
Max Min
Ove
rflo
w R
isk
& C
ost
Min
Max
F, FunctionalFailure
P, PotentialFailure
D, Detect Potential Failure
SL-S
egm
ent C
on
dit
ion
Operation Time
CBM Inspections
ΔT
F-P
ΔTD
F-D
(a) (b)

WEFTEC 2012 Session 114 O&M of Collection Systems
unique P-F curve governed by underlying factors influencing its failure rate. The goal of the SL-
CBM is to estimate the CBM inspection and maintenance times to ensure maintenance is
scheduled and conducted prior to the pipe segments failure at a significant cost savings over
current maintenance programs.
The SL-RAT is an essential tool in developing an effective SL-CBM cleaning program. To
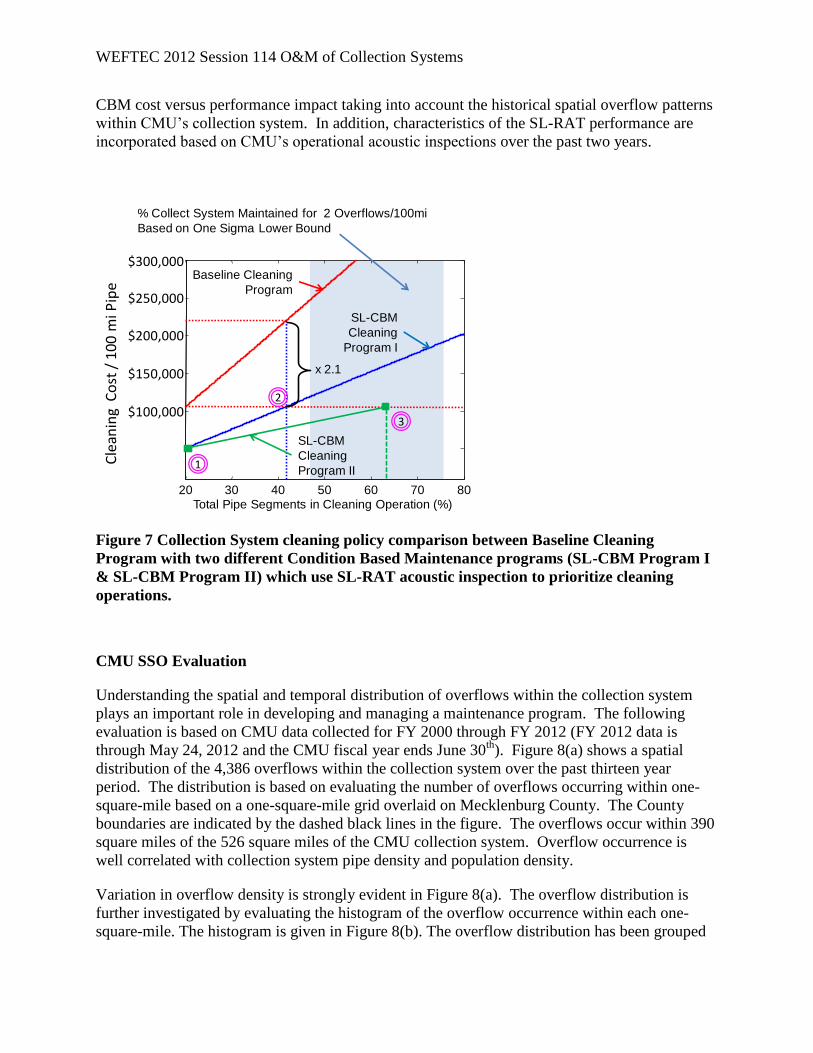
explore the significance of an SL-CBM cleaning program, we extrapolate the results from the
CMU Pilot Project. The graph in Figure 7 provides a hypothetical comparison of the cost
effectiveness between three cleaning programs. The purpose of the comparison is to illustrate
the flexibility and trade-offs available in designing a cleaning program based on acoustic
inspection. We draw upon the results of the linear regression in Figure 1 to set a performance
goal for the collection system cleaning program. From the linear regression, to achieve an
operations performance goal of 2 overflows/100 miles/ year, requires 76% of the collection
system to be maintained annually. The corresponding one standard deviation below the mean
requires 45% of the system to be maintained. This result is translated to Figure 8 where the blue
region highlights the range of possible solutions for the collection system cleaning cost/100
miles of pipe to be within the corresponding 45% to 76% system maintenance requirements.
In Figure 7 at Point-1, for the baseline cleaning policy, 20% of the pipes are cleaned annually at
$1/ft. For this cost analysis we only consider the cost of cleaning and do not include any cost for
post cleaning inspection with CCTV. The other two polices are based on using the acoustic
inspection tool prior to cleaning. For these two policies, 20% of the pipes have been inspected
and, based on their SL-RAT Blockage Assessment, only 7.8% are estimated to require cleaning
resulting in over a 50% cost savings. Only segments which are diagnosed as essentially clean
are removed from the cleaning operations resulting in no impact on collection system
performance.
Next we look at keeping the budget fixed at the 20% annual baseline cleaning cost and look at
two different cleaning and inspection policies using the SL-RAT. For SL-CBM I, we continue
using the policy that only essentially clean line segments are removed from the cleaning
operations based on their acoustic blockage assessment. This allows us to acoustic inspect
41.6% of the collection system and based on the SL-RAT Blockage Assessment only 16.2%
require cleaning, Point-2. SL-CBM II takes a different approach by switching modes to focus on
only cleaning the pipe segments which are in immediate need, i.e., only clean if diagnosed with a
significantly low SL-RAT Blockage Assessment. The policy transfers more resources towards
inspection rather than cleaning, allowing 63.4% of the collection system to be acoustic inspected,
with an estimated 14.1% cleaned and with an estimated 9.5% diagnosed as having a significant
blockage assessment by the SL-RAT acoustic inspection tool, Point-3. This suggests that by
using acoustic inspection, over 60% of the collection system can be maintained annually at a
comparable cost as a 20% annual baseline cleaning program. This achieves the goal of
maintaining the collection system between 45% and 76% without increasing the annual cost. The
SL-RAT acoustic condition assessment is used to cost effectively target cleaning resources to
locations with a higher likelihood to cause overflows.
The previous discussion provides a general assessment of SL-CBM program using the SL-RAT
acoustic inspection. Variations in implementation are examined under the assumption that
overflows are equally likely within the collection system. We next turn to evaluating the SL-
WEFTEC 2012 Session 114 O&M of Collection Systems
CBM cost versus performance impact taking into account the historical spatial overflow patterns
within CMU’s collection system. In addition, characteristics of the SL-RAT performance are
incorporated based on CMU’s operational acoustic inspections over the past two years.
Figure 7 Collection System cleaning policy comparison between Baseline Cleaning
Program with two different Condition Based Maintenance programs (SL-CBM Program I
& SL-CBM Program II) which use SL-RAT acoustic inspection to prioritize cleaning
operations.
CMU SSO Evaluation
Understanding the spatial and temporal distribution of overflows within the collection system
plays an important role in developing and managing a maintenance program. The following
evaluation is based on CMU data collected for FY 2000 through FY 2012 (FY 2012 data is
through May 24, 2012 and the CMU fiscal year ends June 30th
). Figure 8(a) shows a spatial
distribution of the 4,386 overflows within the collection system over the past thirteen year
period. The distribution is based on evaluating the number of overflows occurring within one-
square-mile based on a one-square-mile grid overlaid on Mecklenburg County. The County
boundaries are indicated by the dashed black lines in the figure. The overflows occur within 390
square miles of the 526 square miles of the CMU collection system. Overflow occurrence is
well correlated with collection system pipe density and population density.
Variation in overflow density is strongly evident in Figure 8(a). The overflow distribution is
further investigated by evaluating the histogram of the overflow occurrence within each one-
square-mile. The histogram is given in Figure 8(b). The overflow distribution has been grouped
Cle
an
ing
Co
st
/ 1
00
mi P
ipe
(M
illio
ns $
)
20 30 40 50 60 70 80
0.05
0.1
0.15
0.2
0.25
0.3
Total Pipe Segments in Cleaning Operation (%)
Baseline Cleaning
Program
SL-CBM
Cleaning
Program I
SL-CBM
Cleaning
Program II
x 2.1
1
3
2$100,000
Cle
anin
g C
ost
/ 1
00 m
i Pip
e
$300,000
$200,000
$250,000
$150,000
% Collect System Maintained for 2 Overflows/100mi
Based on One Sigma Lower Bound

WEFTEC 2012 Session 114 O&M of Collection Systems
into four regions as indicated by four colors. Region 0 includes the 136 one-square-mile
locations with no reported overflows in the past thirteen years. Region I through Region III are
defined based on the overflow ranges specified in the figure’s legend. Above each
corresponding Region in the histogram, the following two items are given: the total number of
overflows within the region and the number of square miles encompassed by the region.
The regions identified in Figure 8(b) help identify areas within the collection system requiring
different levels of priority for allocating maintenance resources based on the historical overflow
data. To illustrate, the 136 square miles with zero reported overflows, Region 0, requires
minimal change in resources allocated to it or perhaps even a reduction in resources is warranted.
Whereas, Region III includes 80 one-square-mile locations with each location averaging over
two overflows per year; Region III locations would be good targets for reducing the annual
overflow rate. This segmentation will be further exploited in evaluating the overflow
characteristic within CMU and in developing the CMU SL-CBM program based on the SL-RAT.
Figure 8 CMU SSO Evaluation for FY 00 through FY12 (a) Spatial representation of the
overflows that occurred within one-mile-square grid over the thirteen year period; (b)
Histogram of the number of overflows that occurred within a one-mile-square over the
thirteen year period with the bar color distinguishing between three disjoint regions.
Figure 8 provides an aggregate historical perspective on the distribution of overflow events
within the collection systems, but does not provide an indication of when they occurred. To
obtain a different perspective, the temporal occurrence of the overflows is examined. In Figure
9, moving averages are provided based on the CMU’s recorded date for each overflow
occurrence within FY 2000 to FY 2012. The moving averages are normalized to provide the
overflow rate per 100 miles of linear feet of pipe occurring in a year, i.e., overflows/100mi./year.
Both three month and twelve month moving averages are depicted in Figure 9. Seasonal
variations in the overflow rate are evident in the three month moving average. In addition to the
moving average, the past four year trend in the overflow rate is evaluated by linear regression
over the 12 month moving average. Both the graph of the linear regression and the ±50%
confidence for the linear regression is depicted in the figure. The slope of the linear regression
provides a measure of the annual rate of change in the overflows/100mi. The slope is -0.6,
0
10
20
30
40
50
60
265 270 275 280 285 290
90
95
100
105
110
115
120
Location (miles)
Location
(m
iles)
390sq. mi.
Tota
l Ove
rflo
ws/
Squ
are
Mile
(a) (b)
0 10 20 30 40 50 60 700
20
40
60
80
100
120
140
136
922
11572307
Spill Event Distribution within 1 sq. mi. grid
Re
lative O
ccura
nce
0 Overflows0 < Overflows ≤ 1010 < Overflows ≤ 20Overflows > 20
0 overflows/136 mi2
922 overflows /233 mi2
1157 / 77 mi22307/ 80 mi2

WEFTEC 2012 Session 114 O&M of Collection Systems
indicating a reduction in the overflows/100mi of 0.6 for each of the past four years. The terminal
date for the linear regression is November 2011. Evaluating the linear regression for this date,
the overflow rate is 7.3 overflows/100mi. Using the same approach, temporal characteristics of
the overflows in Regions I, II and III are evaluated. Figure 10 provides the corresponding graphs
and Table 2 summarizes data associated with both the temporal and the spatial overflow
evaluation. These results will be used in developing and evaluating the CMU SL-CBM program
based on the SL-RAT.
Figure 9 Both short time and long time moving averages of the Overflows / 100miles
normalized to a one year time interval based on the CMU SSO data for FY 00 to FY 12.
Table 2 CMU Overflow Temporal and Spatial Data Summary Based on FY 00 to FY 12.
Entire
Collectio
n System
Regio
n 0
Regio
n I
Region
II
Regio
n III
Total number of overflows 4386 0 922 1157 2307
Number of square miles 526 136 233 77 80
Number of linear miles of pipe line 4261 437 1869 874 1081
Overflow/100mi rate of change (linear
regression slope, Figure 9 and 10)
-0.6 0 0.4 -1.4 -1.7
Overflow/100mi at November 2011 from
linear regression Figure 9 and 10
7.3 0 5.1 8.2 13.4
2000 2002 2004 2006 2008 2010 20122
4
6
8
10
12
14
16
18
Year
Ove
rflo
w R
ate
/ 1
00
mi /
Yea
r
3 Month Moving Avg.12 Month Moving Avg.2007-2012 Linear Regression+/-50% Confidence

WEFTEC 2012 Session 114 O&M of Collection Systems
Figure 10 Both short time and long time moving averages of the Overflows / 100miles
normalized to a one year time interval based on the CMU SSO data for FY 00 to FY 12 (a)
Region I – 0<Overflows/SqMi≤10; (b) Region II 10<Overflows/SqMi≤20; (c) Region III
Overflows/SqMi > 20.
2000 2002 2004 2006 2008 2010 20121
2
3
4
5
6
7
8
Year
Ove
rflo
w R
ate
/ 1
00
mi /
Yea
r
3 Month Moving Average12 Month Moving Average2007-2012 Linear Regression+/-50% Confidence
(a)
2000 2002 2004 2006 2008 2010 20120
5
10
15
20
25
30
Year
Ove
rflo
w R
ate
/ 1
00
mi /
Yea
r
3 Month Moving Average12 Month Moving Average2007-2012 Linear Regression+/-50% Confidence
(c)
(b)
2000 2002 2004 2006 2008 2010 20125
10
15
20
25
30
35
40
Year
Ove
rflo
w R
ate
/ 1
00
mi /
Yea
r
3 Month Moving Average12 Month Moving Average2007-2012 Linear Regression+/-50% Confidence

WEFTEC 2012 Session 114 O&M of Collection Systems
CMU Acoustic Inspection Evaluation
Over the past two years CMU has conducted well over three thousand SL-RAT acoustic
inspections of pipe segments. This has provided a condition assessment for over 850 thousand
feet of the collection system. In the past year, the focus of the inspections has changed from
evaluating the SL-RAT technology, to incorporating the technology as the enabler for a newly
evolving collection system cleaning CBM program based on acoustic inspections.
Figure 11(a) provides a spatial representation for the SL-RAT acoustic inspection locations
conducted by CMU. The spatial representation is based on a one-square-mile grid system; the
same system used in evaluating the overflows in Figure 8(a). For each one-square-mile location,
the percentage of pipe inspected by the SL-RAT over the past two years is indicated. The
inspections included in the evaluation are restricted to those inspections conducted prior-to
cleaning operations. This included almost three thousand measurements.
By comparing Figure 11(a) with Figure 8(a), an important observation is that the SL-RAT
acoustic inspections were conducted predominately within either moderate or high overflow
locations, i.e., Region II and III. Using this observation, then the SL-RAT Blockage Assessment
provides an estimate for the cleaning requirements within the CMU collection system biased
towards locations which are historically more prone to overflows. The corresponding histogram
of the SL-RAT Blockage Assessments is given in Figure 11(b). Based on the classification
employed by the SL-RAT: 58% of the pipe segments are considered Good, 19% Fair, 14% Poor,
and 9% Blocked. The pipe segment condition assessment is an important component in
developing and evaluating the SL-CBM program. An additional refinement would be to evaluate
the SL-RAT Blockage Assessment for each region (Region I, II and III) individually. To date,
the SL-RAT measurement data set does not support estimating the blockage assessment
distribution in each Region. Therefore, the distribution in Figure 11(b) is used to represent the
three regions.
Figure 11 CMU Acoustic Inspection – (a) Spatial representation of the percentage of pipes
inspected within each square mile grid; (b) Histogram of the blockage assessment.
0 1 2 3 4 5 6 7 8 9 100
100
200
300
400
500
600
700
Blockage Assessment (0-Blocked thru 10-Clean)
Re
lative O
ccura
nce
9%
14%19%
58%
(a) (b)
% P
ipe
Insp
ect
ed
wit
hin
Sq
ua
re M
ile
0
10
20
30
40
50
60
265 270 275 280 285 290
90
95
100
105
110
115
120
Location (miles)
Location
(m
iles)
216sq. mi.

WEFTEC 2012 Session 114 O&M of Collection Systems
CMU SL-CBM Program Evaluation
The hypothetical SL-CBM evaluation presented in the Overview is extended by incorporating
the CMU SSO evaluation presented in the previous section and the CMU acoustic inspection
program implemented over the past year. To date, insufficient data and insufficient time has
elapsed to allow direct evaluation of the SL-CBM program being established at CMU; therefore,
a performance model is derived based on the empirical data collected to date.
The approach is to evaluate the Cost associated with the SL-CBM program based on establishing
a new collection system cleaning program to achieve a desired number of overflows/ 100mi of
linear pipe, i.e., the performance goal
T
TT
N
OP (6)
where TO is the total number of overflows within the collection system based on the utilities
maintenance program and TN is the number of 100mi lengths of pipe within the collection
system. The evaluation model is derived to evaluate the total cost of the maintenance program
i
iT CC (7)
where iC is the cleaning operation cost for the ith
Region. The value of iC is evaluated for two
cases: Cleaning Only program with no Acoustic Inspection and SL-CBM program based on
Acoustic Inspection, i.e.,
iiCi NACC [Cleaning Only no Acoustic Inspection] (8)
iiIiCi NICACC [SL-CBM with Acoustic Inspection] (9)
where CC is the cost to clean 100mi length of pipe and IC is the cost to acoustic inspect 100mi
length of pipe with the SL-RAT. iA is the fraction of the ith
Region cleaned and iI is the fraction
of the ith
Region inspected with the SL-RAT. For the SL-CBM program, iA is determined based
on the SL-RAT Threshold used to discriminate between pipe segments requiring cleaning and
those that do not. The relationship between the SL-RAT Threshold and the fraction of pipe
segment cleaned, D , is derived based on the CMU acoustic inspections and the relative
occurrence of blockage assessments as depicted in the histogram in Figure 11(b). The SL-RAT
Thresholds evaluated are the same as those used in the case studies presented above and the
values D for the SL-RAT Thresholds are given in Table 3. Then using ii IDA , the SL-CBM
cost for the ith
Region’s is
iiICi NICDCC [SL-CBM with Acoustic Inspection] (10)
Next, the total number of overflows is given by
i
iiT NOO (11)

WEFTEC 2012 Session 114 O&M of Collection Systems
where iO is the number of overflows/100mi of linear pipe in the ith
Region and iN is the number
of 100mi lengths of pipe in the ith
Region.
From the graphs in Figure 10, the overflows/100mi for the ith
Region can be estimated for the
CMU maintenance program prior to the effect of the acoustic inspection. These values are
estimated based on the linear regression and are given in Table 2 and are used in evaluating iO .
To evaluate iO , the new maintenance program performance needs to be evaluated in terms of the
former maintenance program. Using this approach, the ith
Region’s overflow/100mi is modeled
by
iiCiCi RFRARO [Cleaning Only no Acoustic Inspection] (12)
iiCiCi RFRIRO [SL-CBM with Acoustic Inspection] (13)
where for the SL-CBM program it is implicit that the fraction of the ith
Region cleaned is
ii IDA . CR is the rate of change in the number of overflows/100mi based on the change in the
fraction of the area maintained (cleaned or inspected). iF is the fraction of the ith
Region cleaned
under the former maintenance program and iR is the overflow/100mi in the ith
Region based on
the former maintenance program.
Table 3 Parameter Values Used in Evaluating the SL-CBM Program Cost-Performance
Parameter Value
Fraction of pipe segments cleaned, D, for SL-RAT Threshold
1
0.17
Fraction of pipes segments cleaned, D, for SL-RAT
Threshold 3
0.23
Fraction of pipes segments cleaned, D, for SL-RAT
Threshold 5
0.34
Ratio SL-RAT acoustic inspect cost to cleaning cost, CI/CC 0.09
Rate of change in the number of overflows/100mi to the
change in the fraction of the collection system area
maintained, RC
-7.8
CR is an important parameter in evaluating the effectiveness of a maintenance program. It
specifies the rate in achieving the performance goal based on either cleaning more pipe segments
or by improving the selection process for targeting cleaning resources to the pipe segments
requiring cleaning. CR is estimated using the slope from the linear regression from the scatter
plot data depicted in Figure 1. For the results presented in the paper, the value is considered a

WEFTEC 2012 Session 114 O&M of Collection Systems
constant. This provides a first order approximation. CR is likely to be region dependent and
dependent on the maintenance program followed, i.e., for the SL-CBM program, CR will be
impacted by the SL-RAT Threshold selected. As the SL-RAT Threshold is increased, the
number of pipe segments scheduled for cleaning increases. In addition, the cleaning targets pipe
segments which are increasingly cleaner. Therefore, the value of CR will initially rapidly
improve with a diminishing improvement as the SL-RAT Threshold increases. This relationship
has not been established and therefore is not used in evaluating the results in the paper.
The desired model for relating the total cost in terms of the overflows/100mi of linear pipe is
obtained by combining equations (6) through (13)
i
iiCi
iiTC
TT NR
R
KNFKP
R
KNC (14)
where cCK [Cleaning Only no Acoustic Inspection] (15)
Ic CDCK [SL-CBM with Acoustic Inspection] (16)
Looking at the three terms in equation (14) provides insight into the model. The first term,
TCT PRKN , provides the head room savings based on the performance goal being greater
than zero overflows/ 100mi. The second term, i
ii NFK , is the cost of meeting the Former
maintenance performance using the new maintenance program and the third term,
i
iiC NRRK , is the cost of mitigating the reported overflows based on the new maintenance
program.
By relating equations (15) and (16), the mechanism for achieving substantial cost savings using
the SL-CBM over the Clean-Only program can be readily evaluated. For the same performance
goal, the SL-CBM will be less expensive than the Clean-Only program given
Icc CDCC
DC
C
c
I 1 (17)
As discussed in previous sections, the cost of acoustic inspection is, conservatively, less than a
tenth the cost of cleaning. In addition, the fraction of pipe segments not requiring servicing (
D1 ) are at least 50% and often significantly greater. The inequality in equation (17) is well
met, leading to substantial cost savings for the same performance goal.
The total maintenance program cost, TC , is evaluated using equations (14) through (16) based
on varying the performance goal, TP . Graphs of the evaluation are depicted in Figure 12. The
cost in Figure 12 has been normalized by the estimated cost for cleaning 20% of CMU’s
collection system ( CTCN2.0 ). This normalization removes the uncertainty associated with
cleaning cost, CC . The parameter values used in evaluating the equations are summarized in

WEFTEC 2012 Session 114 O&M of Collection Systems
Tables 2 and 3. Three SL-CBM programs are compared based on using different SL-RAT
Thresholds. These results are compared to the program based on Cleaning-Only.
From Figure 12, a SL-CBM program using an SL-RAT Threshold of 3, results in a performance
of four overflows/ 100mi without increasing cost. To achieve the same performance with the
Clean-Only program requires over 3 times the cost.
Figure 12 Cost versus performance evaluation for the SL-CBM. Cost is evaluated based on
the ratio between the cost of the SL-CBM program with the cost of the current cleaning
program, i.e., Cleaning 20% of the Collection System/Year. Performance is based on the
number of overflows per 100 miles in a year.
SUMMARY & CONCLUSIONS
In summary, we have explained the basic operational principles of a new pipe inspection
technology and shown through several examples from Charlotte-Mecklenburg Utilities, (CMU),
multiple ways that active acoustic inspection can significantly improve the maintenance cost and
performance of gravity-fed wastewater collections systems. This patented technology is
embodied in a device called the Sewer Line Rapid Assessment Tool or SL-RAT which has
inspected over 850 thousand feet of pipe during the past two years of field use.
The underlying novel technology itself was described to make the principle of operation clear.
The SL-RAT is composed of two components – a transmitter and receiver which are each placed
in adjacent connected manholes. The transmitter generates sound waves that naturally couple
into the pipe segment. The sound waves propagate in the air gap within the pipe segment. The
receiver measures the acoustic plane wave received from the transmitter and, through a
proprietary algorithm, evaluates the condition of the pipe in the form of a blockage assessment.
This blockage assessment is an aggregate measure of the blockage level within the pipe and is
scored on a relative scale of 0 to 10. The blockage assessment scale is empirically correlated
with CCTV where zero means fully blocked and ten means the pipe is fully clear.
2 3 4 5 6 7 80
0.5
1
1.5
2
2.5
3
3.5
4
4.5
Overflows/100mi in One Year
Co
st
Ratio (
CB
M C
ost)
/(C
urr
en
t C
ost) 1 - SL-RAT Threshold
35Clean Only
Current Cleaning Cost
Current Performance
Over 3x Cost Savings
~2x Performance Improvement

WEFTEC 2012 Session 114 O&M of Collection Systems
Additionally, multiple operational benefits of the SL-RAT relative to existing alternatives were
covered. The SL-RAT does not require confined space entry and does not contact the
wastewater flow making it safer to operate. It also does not require the support of cleaning
equipment, provides the blockage assessment in 3 minutes or less, has been practically operated
in a typical wastewater collection field environment under a variety of conditions, and can be
easily operated by a field crew of two operators.
The results of multiple pilots and field studies conducted by CMU in conjunction with Infosense
were reviewed which show the efficacy, the economics, and the operational advantages of the
SL-RAT device. The efficacy of acoustic inspection technology was highlighted in a study
conducted by CMU and InfoSense to correlate CCTV video with the aggregate blockage
measurement provided by the SL-RAT. Acoustic inspections were shown to successfully detect
blockages within a pipe segment and to provide acceptable resolution for delineating when pipe
cleaning activity should take place and when it should not. This same field study estimated the
cost of operating active acoustic inspection equipment and found that the SL-RAT’s relatively
low cost of operation combined with detecting where the high cost of cleaning pipes can be
avoided can generate savings in the range of $1.07 to $1.13 per foot inspected.
Finally, we looked at extending the use of acoustic inspection technology to enable the
establishment of a Condition Based Maintenance (CBM) program for gravity-fed collection
system pipe maintenance. An example was illustrated using data from CMU to extrapolate that
for a system targeting 2 overflows/100 miles/year, implementing an SL-RAT-enabled CBM
program could reduce cleaning costs by 50% or more. The improvement compounds as more
resources are shifted to the relatively cheaper task of acoustic inspection and away from the
relatively expensive and partially wasteful task of scheduled pipe cleaning. The financial benefit
comes through better focusing cleaning crews on blocked pipes and away from cleaning pipes
that do not need cleaning. These results were extended further to develop a performance model
which illustrates mathematically that using SL-RAT data as part of a CBM program can provide
significant benefits to wastewater system operators by producing BOTH a significant positive
impact on overflow performance as well as system maintenance costs.
REFERENCES
Charlotte Mecklenburg (2011), Wastewater Performance Report July 1, 2010 – June 30, 2011.
Howitt, Ivan; Fisburne, John; Wilson, Brian, (2010) “Active acoustic methodology for detecting
sewer line obstructions,” NC-AWWA Annual Conference, November 2010.
Howitt, Ivan, (2009) Monitoring systems and methods for sewer and other conduit systems, Pat.
Pending, Application No. 12/399,492, 2009.
Lehtonen, Matti (2006), “On the optimal strategies of condition monitoring and maintenance
allocation in distribution systems,” 9th International Conference on Probabilistic Methods
Applied to Power Systems, June 11-15, 2006.
Moubray, John, (1997) Reliability-Centered Maintenance 2nd
Ed., Industrial Press Inc.
Philip, Morse M., Ingard, K. Uno, (1968) Theoretical Acoustics, Mcgraw-Hill Inc.
Wiseman, Murray; Lin, Daming; Gurvitz, Naaman; Dundics, Marton; “The Elusive P-F
Interval,” http://www.omdec.com.