seventh caribbean islands water … proceedings seventh caribbean islands water resources congress...
TRANSCRIPT
SEVENTH CARIBBEAN ISLANDS WATER RESOURCES CONGRESS
OCTOBER 25 – 26, 2007
UNIVERSITY OF THE VIRGIN ISLANDS ST. CROIX, USVI
PROCEEDINGS
ii
PROCEEDINGS
SEVENTH CARIBBEAN ISLANDS WATER RESOURCES CONGRESS
Edited by
Sangchul (San) Hwang, Ph.D. Department of Civil Engineering and Surveying
University of Puerto Rico at Mayaguez Mayaguez, Puerto Rico 00681-9041
Sponsored by
VIRGIN ISLANDS WATER RESOURCES RESEARCH INSTITUTE
PUERTO RICO WATER RESOURCES AND ENVIRONMENTAL RESEARCH INSTITUTE
UNITED STATES GEOLOGICAL SURVEY
OCTOBER 25 – 26, 2007 UNIVERSITY OF THE VIRGIN ISLANDS
ST. CROIX, USVI
iii
FOREWORD
The water resources issues affecting the lives of the people living in the Caribbean and tropical countries are as diverse as their culture, history and politics. A major concern in one island may be that the lack of surface and ground water forces residents to use seawater desalination as the only source for satisfying potable water demands. Yet, a neighboring island might be interested in controlling flooding problems or the degradation of water quality produced by streams and rivers in steep watersheds. Additionally, some islands are of volcanic origin with mountainous terrain while others are of limestone origin with low relief and constantly in danger from ocean swells.
With all their diversity, the islands do have many similarities. They all have distinct rainy seasons often punctuated with hurricanes; have national objectives that include preservation of coastal waters from land based contamination; have a need for waste water disposal with minimal environmental impact; and a need to better manage and conserve limited water resources.
With all their peculiarities, how are the water resources policies in these countries responding to the accelerated changes taking place due to the globalization? How is the society preparing to deal with new water resources management that includes conservation, reuse, rehabilitation of water systems and increased costs of preserving and creating new infrastructure? These are some of the important issues to be addressed in this Congress.
The papers are grouped into specific sessions according to the topics requested in the Call for Abstracts. First drafts of papers were peer-reviewed and returned to the authors for preparation of the final manuscripts. These are the papers presented in this Proceedings. The Proceedings will be useful to students, practitioners, and researchers alike due to the diverse numbers of contributors. Contributions from universities, research institutes, government agencies, and consulting firms are indicative of the widespread involvement of a gamut of organizations in the field of hydrology and water resources in the Caribbean islands.
Sangchul (San) Hwang, Ph.D. Editor and Technical Program Chair
Department of Civil Engineering and Surveying University of Puerto Rico at Mayagüez

iv
ACKNOWLEDGMENTS
The 7th Caribbean Islands Water Resources Congress has been possible due to the contributions of many individuals who collaborated with no other interest than accomplishing the success of the Congress. We appreciate Ms. Raquel Santiago-Silver at the University of the Virgin Islands Cooperative Extension Service for the help she has provided to the Congress. Also, we thank Mr. Sigfredo Torres-Gonzalez and Mr. Francisco Maldonado from the Caribbean Water Science Center, US Geological Survey for their kindly participation in the technical review of the papers and the design of the Congress bag’s logo, respectively.
The Congress would like to express sincere appreciation to the Cooperative Extension
Service and Virgin Islands Experimental Program to Stimulate Competitive Research (VI-EPSCoR), both at the University of the Virgin Islands in helping and supporting with the Congress.
Lastly, but not the least, the Congress is grateful to the invited speakers Mr. Aaron
Hutchins from the US Virgin Islands Department of Planning and Natural Resources, Dr. Matthew Larsen from the US Geological Survey, and Mr. Ferdinand Quinones, independent contractor, Puerto Rico. We are also thankful to the authors for their contributions to the success of the Congress.

v
ORGANIZING COMMITTEE
Congress General Chair
Henry H. Smith Director
Virgin Islands Water Resources Research Institute (340) 693-1062
Fax: (340) 693-1065 [email protected]
Congress Co-Chairs
Jorge Rivera-Santos Director
Puerto Rico Water Resources and Environmental Research Institute
University of Puerto Rico at Mayagüez
(787)832-4040 x3781 Fax: (787) 833-3985
Pedro L. Diaz Director
Caribbean Water Science Center US Geological Survey
Guaynabo, Puerto Rico (787) 749-4346 x222 Fax: (787) 749-4301
Congress Technical Program Chair/Editor
Sangchul (San) Hwang Assistant Professor
Department of Civil Engineering and Surveying University of Puerto Rico at Mayagüez
(787) 832-4040 x3454 Fax: (787) 832-8260 [email protected]
vi
TABLE OF CONTENTS
PROCEEDINGS
SEVENTH CARIBBEAN ISLANDS WATER RESOURCES CONGRESS Table of Contents ----------------------------------------------------------------------------------------- vi Paper Title Index --------------------------------------------------------------------------------------- 102 Author Index --------------------------------------------------------------------------------------------- 104
Watershed Management Caribbean Water Management Implications of Potential Climate Change
Adrian Cashman, John Charlery, and Leonard Nurse ----------------------------------------- 2 Numerical Simulation of Rivers in Floodplains
Walter F. Silva-Araya and Alejandra Rojas ---------------------------------------------------11 The Role of a Community-based Nongovernmental Organization in promoting Active Research and Stewardship of Water and Other Environmental Resources in the US Virgin Islands
Sharon L. Coldren -------------------------------------------------------------------------------- 16 Effect of Spatial and Temporal Resolution Uncertainty on Predicted BMP Efficiency
Robert Miskewitz, Josef Kardos, Christopher Obropta, and Katie Buckley -------------- 21 Sediment Production from Natural and Disturbed Surfaces in Dry Tropical Areas of La Parguera, PR, 2003 - 2005
Carlos E. Ramos-Scharron --------------------------------------------------------------------- 26
The Caribbean Water Initiative (CARIWIN) Alicia Suchorski, Catherine Senecal, and Chandra Madamootoo ------------------------- 30
Advances in Water Sanitization Hydraulic and Biochemical characteristics of Coal Combustion Byproducts Aggregates as Alternative Daily Cover for Landfills
Arelys Fonseca, Sangchul Hwang, and Zalleris Escobar ----------------------------------- 34 Telemetry Monitoring of Small Water Supply
Sacha Sanchez, Sangchul Hwang, and Daniel Concepcion --------------------------------- 39 Innovative on site Wastewater Disposal Systems Outreach and Demonstration Project
Rafael F. Davila, Y. Toro, and R. Santini ----------------------------------------------------- 43
vii
Surface and Ground Water Quality Groundwater Levels in Puerto Rico, 1987-2006
Ronald T. Richards ------------------------------------------------------------------------------- 49 Effects of Aquifer Development and Changes in Irrigation Practices on the Groundwater Discharge to the Jobos Bay National Estuarine Research Reserve, South-Central, Puerto Rico
Jesus Rodriguez-Martinez and Jose M. Rodríguez ------------------------------------------ 54 Nutrient Load Estimation at Lago Dos Bocas, Puerto Rico
Christian A. Villata Calderon, Luis R. Perez-Alegria, and Alvaro Bernal Bernal ------- 59 Use of Stable Isotopes to Determine Potential Sources of Nitrate and Contribution of Surface Water to Aquifer Recharge in the Salinas Area, South Coastal Plain Alluvial Aquifer, Puerto Rico
Jose M. Rodriguez ------------------------------------------------------------------------------- 64
Management of Limited Freshwater Resources Impacts of Watershed Development on Diversity of Freshwater Fish and Crustaceans on St. Thomas, U.S. Virgin Islands
Donna Nemeth, Renata Platenberg, Rifca Mathurin, and Duvane Hodge ---------------- 70 Effectiveness of Mandatory Law of Cistern Construction for Rainwater Harvesting on Supply and Demand of Public Water in U.S. Virgin Islands
Hossana Solomon and Henry H. Smith ------------------------------------------------------- 75 Hydrologic Studies using Vflo in Western Puerto Rico
Alejandra Rojas and Eric Harmsen ------------------------------------------------------------ 81
Poster Session Evaluation of the Adsorption Behavior of Tetracycline onto Crumb Rubber in Aqueous Solution
J. Lopez-Morales, S. Nieto-Zambrano, F. Roman-Velazquez, and O. Perales-Perez --- 87
Use of Recycled Tires Crumb Rubber to Remove Ethylbenzene, Toluene and Xylene in Single Component, Multi-Components Systems and Gasoline from Aqueous Solutions
L. Alamo-Nole, F. Roman, and O. Peralez-Perez -------------------------------------------- 92 Removal of Lead, Copper, and Cadmium Ions From Aqueous Solutions using Waste Tire Crumb Rubber
D. Sanchez, L. Alamo, A. del Valle, F. Roman, and O. Perales-Rerez ------------------- 97
WATERSHED MANAGEMENT
1
OCTOBER SEVENTH CARIBBEAN ISLANDS WATER RESOURCES CONGRESS 2007
Caribbean Water Management Implications of Potential Climate Change
Dr Adrian Cashman1, Dr John Charlery2 and Dr Leonard Nurse1
ABSTRACT Concerns over the status of freshwater availability in the Caribbean Region and in particular the Eastern Caribbean States have been expressed for at least the last thirty years (CEHI, 2002). There is a growing realisation that availability will be vulnerable to extremes of climate behaviour and increasing demand for water. Climate modelling for the Caribbean Region under a range of scenarios suggests a continuation of a warming in average temperatures, a lengthening of seasonal dry periods and increases in frequency of occurrence of drought conditions. Using information from the most recent IPCC Report and regional downscaling we suggest what some of the macro level changes in temperature and rainfall might be and the implications for water resources availability. This paper evaluates the existing availability of water resources, the implications of the most recent climate change modelling for the Caribbean and the impact of on existing service provision strategies. We also provide a critique of some of the proposed responses such as desalination.
KEYWORDS: Water Resources, Climate Change, Drought
INTRODUCTION Freshwater resources rank very high on the priority list of Small Island Developing States (SIDS) given the sensitivity and vulnerability to extremes of climatic behaviour (UNEP, 2004). Concerns over the status of freshwater availability in the Caribbean Region and in particular the Eastern Caribbean States have been expressed for at least the last thirty years (CEHI, 2002). In spite of the significant progress that has been made in extending the coverage of water supply and sanitation services there are increasing challenges in maintaining access, coverage and quality standards. In the face of population pressures, urbanisation, economic development and growth in tourism pressures on water resources have increased significantly. Many Caribbean states are increasingly vulnerable to the dual challenges of increasing demand for water and climatic variability where even a slight reduction in rainfall would have serious consequences (UNEP, 2003). Climate modelling for the Caribbean Region under a range of scenarios suggests a continuation of a warming in average temperatures, a lengthening of seasonal dry periods and increases in frequency of occurrence of drought conditions.
1 Centre for Resource Management and Environmental Studies, University of the West Indies, Barbados ([email protected])
2 Department of Computer Science, Mathematics and Physics, University of West Indies, Barbados
2
The ability of Caribbean states to cope with a growing water stress imbalance and the consequences for their social and economic well-being needs to be explored. Caribbean states have high levels of indebtedness and are economically vulnerable to the impacts of adverse climatic events (CDB, 2004). At the same time, demand for water is growing rapidly in all economic and social sectors. Using information from the most recent IPCC Report and regional downscaling we suggest what some of the macro level changes in temperature and rainfall might be and the implications for water resources availability. This paper seeks to evaluate the existing availability of water resources, projections of potential demand trajectories are assessed and the impact on existing service provision strategies and a critique of some of the proposed responses such as desalination is given. The potential social and economic effects associated with increasing water resources stress are outlined and discussed.
WATER RESOURCES AND CONSUMPTION Geographically the region sits between the North American coast of Florida and the South American mainland, spread out as an arc of islands varying in size and topography. The region has a maritime tropical climate with wide variation in rainfall, influenced by topography and size of landmass. Seasonal variability of rainfall is marked by a distinct dry period, usually December to March/April and peak rainfall coinciding with the Hurricane season of June to November, especially at the start and end of the season. The lack of geographic homogeneity makes the drawing of any general observations about water resources problematic. Some rely solely on groundwater whilst for others rainfall and topography allow the utilisation of rivers and streams.
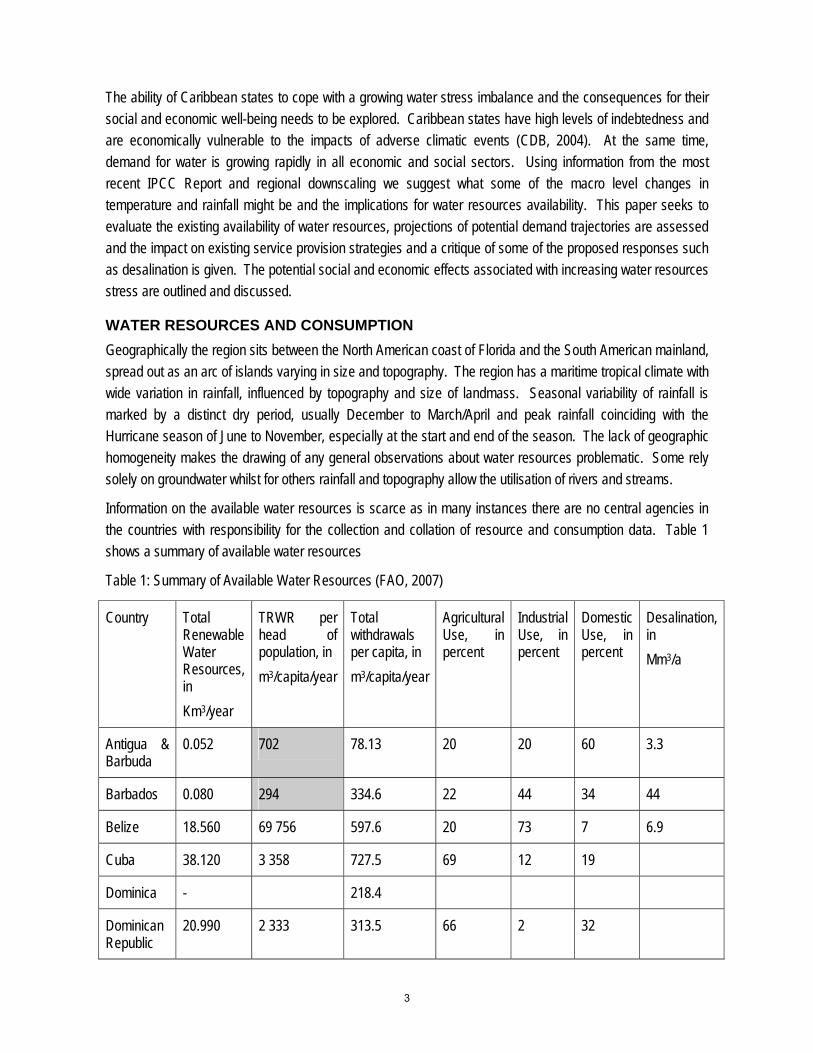
Information on the available water resources is scarce as in many instances there are no central agencies in the countries with responsibility for the collection and collation of resource and consumption data. Table 1 shows a summary of available water resources
Table 1: Summary of Available Water Resources (FAO, 2007)
Country Total Renewable Water Resources, in Km3/year
TRWR per head of population, in m3/capita/year
Total withdrawals per capita, in m3/capita/year
Agricultural Use, in percent
Industrial Use, in percent
Domestic Use, in percent
Desalination, in Mm3/a
Antigua & Barbuda
0.052 702 78.13 20 20 60 3.3
Barbados 0.080 294 334.6 22 44 34 44
Belize 18.560 69 756 597.6 20 73 7 6.9
Cuba 38.120 3 358 727.5 69 12 19
Dominica - 218.4
Dominican Republic
20.990 2 333 313.5 66 2 32
3

Grenada -
Guyana 241.000 313 802 2 147.0 97 1 2
Haiti 14.030 1 641 120.5 94 1 5
Jamaica 9.404 3 482 156.1 49 17 34 0.5
Puerto Rico
7.100 1 814
St Kitts & Nevis
0.024 571
St Lucia -
St Vincent & Grenadines
- 85.78
Trinidad & Tobago
3.840 2 929 238.8 6 26 68 36.5
Source: Food and Agriculture Organization, Aquastat database, Water scarce countries are those with less than 1000 m3/capita
The above table indicates that at least in theory the availability of adequate water resources is not a constraint. Indeed, only three of the reported countries are considered water scarce – though this is a very crude measure. However, the total exploitable water resources, that which is available to be utilised to support development taking into consideration the economic, environmental and physical factors is usually significantly smaller than the natural water resources. Depending on particular circumstances the percentage can lie anywhere between 15 – 85 % (e.g. for Malta it is 30%). However, it is not so much the total amounts but rather the seasonality of the availability that is of importance and the ability to capture peak season precipitation and make it available at other times of the year. This is a function of the nature of the resource (groundwater or surface water) as well as infrastructure and institutional capacity.
It is already known that many Caribbean island States experience difficulties in meeting demands at certain times of the year. In Barbados demand already exceeds the total annual renewable freshwater resource (CEHI, 2002) meaning the country is reliant on desalination to meet the shortfall. Antigua & Barbuda is reliant on desalination and rainwater harvesting for a large part of its supply. In other instances e.g. St Lucia and St Vincent and the Grenadines, demand exceeds supply during the dry months and even on Dominica water shortages are experienced (USACE, 2004). On island such as Bequia and others in The Grenadines where the main source of supply is ‘roof water’, fluctuations in rainfall patterns means that every year local supplies run out and have to be supplemented by water shipped in by the Government (Durrant, 2007). In addition periodic droughts have affected even water rich countries such as Guyana and Trinidad (CEHI, 2007; Daily Nation, April 2007).
4
In many of the countries demand is constrained by factors such as the seasonal effects on water resources and intermittent supply (CEHI, 2007). Unmet demand for water is not uncommon, for example it has been reported that only 14% of Trinidadians received water 24/7 and that the difference between estimated demand and actual supply in 2000 was 11% (Schneiderman & Reddock, 2004). Thus any calculation of the real level of demand is problematic. What can be inferred though is that the demand for water, whether fully realised or not will grow. The factors that will drive this will be population demographics and economic development. The populations of many of the islands are set to rise in the medium term (UN, 2006) and an increasing proportion will become urbanised. Governments are committed to trying to meet the Millennium Development Goals, which has implications for water services provision and hence demand. More land will be brought under irrigated agriculture and in their national plans many island states are seeking to continue to promote industrial development and growth in tourism.
A preliminary estimate for Barbados for example indicates that potential water demand could increase by nearly 50% over present levels of consumption. Often peak levels of demand coincide with the dry season. With demand for water set to increase throughout the region, even without the effects of climate change the existing problems arising from the seasonality of water resources would be exacerbated.
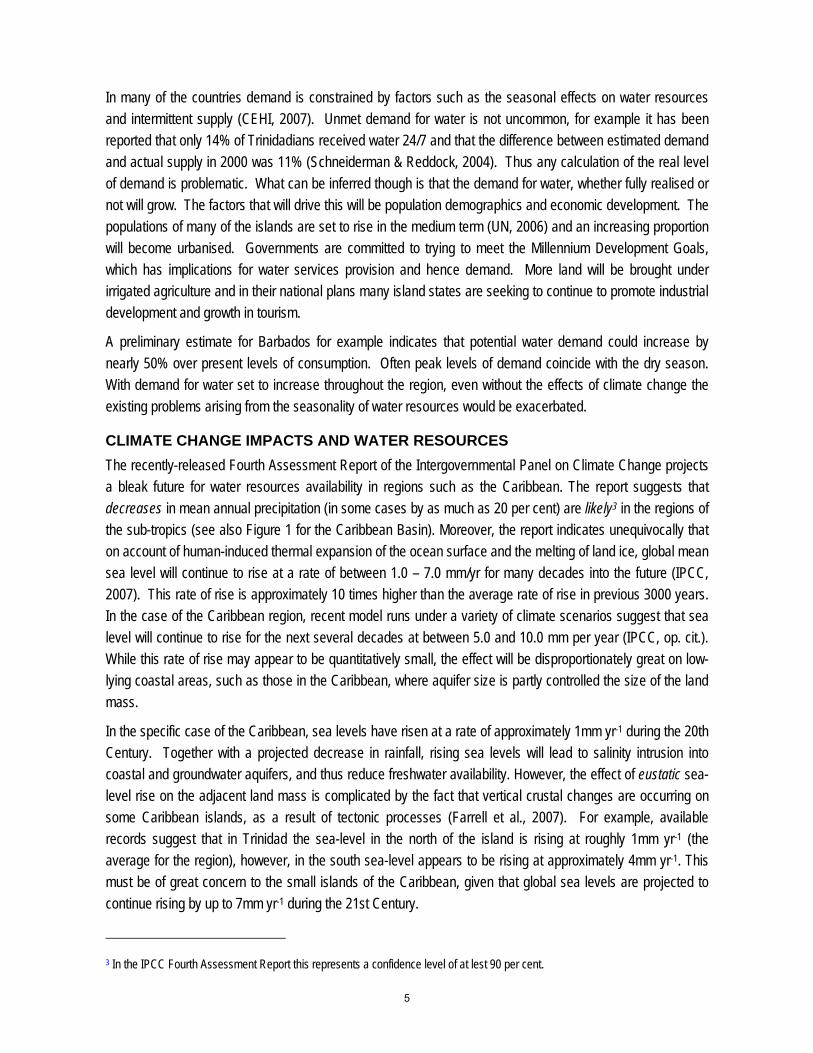
CLIMATE CHANGE IMPACTS AND WATER RESOURCES The recently-released Fourth Assessment Report of the Intergovernmental Panel on Climate Change projects a bleak future for water resources availability in regions such as the Caribbean. The report suggests that decreases in mean annual precipitation (in some cases by as much as 20 per cent) are likely3 in the regions of the sub-tropics (see also Figure 1 for the Caribbean Basin). Moreover, the report indicates unequivocally that on account of human-induced thermal expansion of the ocean surface and the melting of land ice, global mean sea level will continue to rise at a rate of between 1.0 – 7.0 mm/yr for many decades into the future (IPCC, 2007). This rate of rise is approximately 10 times higher than the average rate of rise in previous 3000 years. In the case of the Caribbean region, recent model runs under a variety of climate scenarios suggest that sea level will continue to rise for the next several decades at between 5.0 and 10.0 mm per year (IPCC, op. cit.). While this rate of rise may appear to be quantitatively small, the effect will be disproportionately great on low-lying coastal areas, such as those in the Caribbean, where aquifer size is partly controlled the size of the land mass.
In the specific case of the Caribbean, sea levels have risen at a rate of approximately 1mm yr-1 during the 20th Century. Together with a projected decrease in rainfall, rising sea levels will lead to salinity intrusion into coastal and groundwater aquifers, and thus reduce freshwater availability. However, the effect of eustatic sea-level rise on the adjacent land mass is complicated by the fact that vertical crustal changes are occurring on some Caribbean islands, as a result of tectonic processes (Farrell et al., 2007). For example, available records suggest that in Trinidad the sea-level in the north of the island is rising at roughly 1mm yr-1 (the average for the region), however, in the south sea-level appears to be rising at approximately 4mm yr-1. This must be of great concern to the small islands of the Caribbean, given that global sea levels are projected to continue rising by up to 7mm yr-1 during the 21st Century.
3 In the IPCC Fourth Assessment Report this represents a confidence level of at lest 90 per cent.
5
Figure 1: Changes in Monthly Rainfall Patterns, A1B Scenario 1990’s-2070’s (Earth Simulator’s Super-High Resolution GCM – Japanese Model)
August
September
October
November
Recent projections from a macro-scale hydrological model using the IPCC SRES scenarios, suggest that many Caribbean islands are likely to become increasingly water-stressed in the future, as a result of climate change, see Figure 1, irrespective of the climate scenario employed (Arnell, 2004). Despite the widely varied conditions which drive the different climate scenarios, there is a large degree of agreement between the different climate models with respect to rainfall patterns in the Caribbean. In the case of the Eastern Caribbean under all three climatic scenarios examined (A1B, A2 and B2) (IPCC, 2007), the projection is for a substantially drier wet season (July-November) as shown in Figure 1, an even drier dry season (March-April) and a marginally wetter spell at the end of the year. Since the rate of demand is already exceeding the rate of supply, most of the islands are likely to experience increasing water deficits. It is worth pointing out that climate-changed induced water scarcity is likely to be a feature of most small islands, not just those in the Caribbean. For instance, a study commissioned by the World Bank (2000) shows that a 10 per cent decrease in mean rainfall by 2050 would be equivalent to a 20 per cent reduction in the extent of the freshwater aquifer on the Tarawa Atoll, Kiribati in the Pacific. Further, model outputs for Bonriki Island also in Tarawa, Kiribati, indicated that a 25 per cent decrease in rainfall combined with a 50 cm rise in sea-level could cause the freshwater lens to contract by approximately 65 per cent (World Bank, 2000).
6

Although little detailed work has been carried out on the effects of the most recent climate change scenarios on the water resources of individual islands and Caribbean states, a few general inferences may be made on the basis of on-going climate modelling of the Caribbean Basin. The modelling, as noted above indicates that irrespective of scenario a likely significant decrease in overall rainfall especially during the important rainy season of up to 30% over the period 1990s to 2070s, region wide. The effective lengthening of the dry season period coupled with reductions in received rainfall, higher temperatures and rates of evapotranspiration will not only cause greater ecological stress but also lead to what are likely to be significant reductions in available water resources and by implication higher levels of water stress for those countries reliant on surface water resources, such as Dominica, Grenada, Jamaica, St Lucia, St Vincent and Trinidad & Tobago. The changes in precipitation patterns will also affect runoff characteristics. More intense rainfall events will result in flashier run-off and potentially greater occurrence of flash flooding. Less overall rainfall and higher rates of run-off would lead to a corresponding decrease in water available for recharging groundwater aquifers as well as higher transport and pollutant loads. It will not only be groundwater aquifers that are affected, for those reliant on forms of rainwater capture and harvesting it is also anticipated that there would also be a decrease in availability. This would either be due to quality considerations or an inability to capture sufficient amounts of the runoff. This would affect among others countries such as Antigua & Barbuda, Barbados, The Grenadines, Jamaica, St Kitts & Nevis.
SOCIO-ECONOMIC EFFECTS Without much further research it is difficult to provide anything other than a qualitative overview of the possible social and economic impacts that would be associated with the climate changes outlined above. At a macroeconomic scale average public debt for Caribbean countries is almost 100% of GDP (Duncan, 2005) whilst per capita economic growth in GDP is expected to be between 2 -3% average for the Caribbean region (World Bank, 2005). With respect to levels of poverty, income inequality and Human Development Index the picture is more varied with significant instances of deprivation coupled with generally high rates of unemployment (Duncan, 2005), which contribute to the vulnerability of some states. Additionally migration rates among the better educated tend to be high coupled with low enrolment rates in tertiary education, thus weakening the region’s capacity for economic growth.
Against this background we consider the examples of rainwater harvesting and desalination and possible social and economic effects. For those reliant on rainwater harvesting an obvious adaptation strategy would be to invest in more storage where it already exists and to require the provision of storage for new developments. In the latter case it is unlikely that existing building regulations will be updated to take account of the need for greater storage. There are questions over the policing and enforcement of existing regulations, especially as these are seen by builders and developers as adding additional cost.
Those householders who rely most on rainwater collection systems for domestic supply, for example in The Grenadines include a significant number in lower income and disadvantaged groups. In the case of Bequia in The Grenadines for example residents have to appeal to the Government for assistance in the form of ‘water boats’ to be able to meet their basic water requirements during the dry season (Durrant, 2007). Such communities are the least able to afford to adopt adaptation strategies due to their high cost in relation to household incomes. An alternative strategy would be to extend existing communal collection and distribution systems which would require either forms of community financing or government-led interventions. The former
7
has similar draw backs as before whilst reliance on the state may be an uncertain prospect. Added to which there would be questions over financing, of the costs to the community, operation and equity considerations. On the other hand, those who are better off economically though they will be better placed to respond may well be disinclined to do so. Firstly, there are expectations that it is the responsibility of the state to ensure the adequacy of their water services. Secondly, there may be a reluctance to invest in adapting their homes and businesses especially if this entails having to self-operate an associated pump and purification system.
An increasingly popular strategy has been to invest in desalination plants as a way of countering seasonal or persistent water resource shortages. However, such a strategy is unlikely to be suitable under all circumstances. Small communities in many instances will not be able to afford the full cost of desalinated water and if the cost does go up it will be those who are least able to afford the costs that will be the most severely affected. In addition governments may be reluctant to subsidize some communities at the expense of others, especially when faced with the sorts of financial constraints outlined above. It is also expected that energy costs will continue to rise (Andrieu, 2005) and as desalination is an energy intensive process, the costs of production will also rise. If such costs are passed on to the consumer then once again it is those low income and vulnerable households where expenditures on necessities make up a proportionally large part of household budgets that will be most adversely affected. A recent study has also pointed out the environmental problems in the form of increased greenhouse gas emissions and damage to coastal and marine environments (WWF, 2007). Caribbean states by making increasing use of desalination could indirectly be having an adverse impact on marine resources that support fishing and tourism – two mainstays of many island economies.
Any under pricing of desalinated water could well be at the expense of other options. It has to be asked whether it is more cost effective to accept losses of 50% or more from water systems in comparison to options such as desalination.
CONCLUSIONS Although much more work needs to be carried out it is already possible to draw some general conclusions regarding the implications for water management arising from climate change. Irrespective of climate change scenario the water resources of the Caribbean Basin are going to come under increasing pressure. The likely decrease in rainfall, lengthening of dry seasons and temperature increases will result in less available water resources throughout the region. Decreases in monthly rainfall in the peak rainfall months could be as much as 50 percent under certain circumstances. At the same time it will not be possible (nor is it desirable) to turn back the economic development clock which implies that demand for and consumption of water will continue to rise. In spite of clear evidence from some countries of water stress, this lack of availability has not acted as a constraint on planned developments – yet, countries appear to be trying to desalinate themselves out of their water availability predicament.
In our brief review of the available literature it does not appear that Governments or water service providers through the region are taking the possibility of long-term water shortages fully into consideration in the development planning process. There have been some moves to consider the development of drought management plans but these have mostly been conceptual plans that have generally not been implemented. The issue of planning for drought management and creating the social and institutional capacity to deal with
8

significant decreases in available water resources needs to be taken a lot more seriously. The implications for important sectors of national economies such as agriculture and tourism are potentially severe in relation to their future growth. Many of the potential mitigation measures such as recycling, change of practices, more efficient use of water, tax and tariff incentives are already known and available, but much more needs to be done to ensure their sustained adoption.
REFERENCES Arnell, N.W.(2004) Climate change and global water resources: SRES emissions and socio-economic
scenarios. Global Environmental Change, 14, 31-52.es]. Andrieu, M. (2005). Long-term trends and the demand for infrastructure. Paris: Organisation for Economic
Cooperation and Development. CDB. (2004). Annual Economic Review 2004. Barbados: Caribbean Development Bank. CEHI. (2002). Water and Climate Change in the Caribbean. Castries, St Lucia: Caribbean Environmental
Health Institute Organisation of American States, Unit for Sustainable Development and Environment.
CEHI. (2007). Background Information. Castries, St Lucia: Caribbean Environmental Health Institute. Daily Nation (2007). Water Crisis in Trinidad. Daily Nation, 17 April 2007. Duncan, N. (2005). Highlights of a time to choose: Caribbean development in the 21st century. Paper
presented at the The Challenges of the Contemporary Caribbean, 7th General Assembly, Panama.
Durrant, S. (2007). Monitoring the effect of below average precipitation on water resources in Paget Farm, Bequia, Grenadines. MSc Research report, CERMES, UWI.
FAO. (2007). Aquastat. Retrieved 19 June, 2007, from www.fao.org/ag/agl/aglw/aquastat/ Farrell, D., L. Moseley and L. Nurse (2007): Managing Water Resources in the face of Climate Change: A
Caribbean Perspective”. In Proceedings of the 8th Annual Sir Arthur Lewis Institute of Social and Economic Studies (SALISES) Conference, UWI, St. Augustine, Trinidad, March 26-28, 2007, 11 pp.
Intergovernmental Panel on Climate Change (2007). Climate Change 2007: The Physical Science Basis – Summary for Policy Makers. Cambridge University Press, 18 pp.
Schneiderman, J.S. and Reddock, R. (2004).Water, women and community in Trinidad, West Indies. Natural Resources Forum 28. 179-188.
UN. (2006). World Population Prospects: The 2006 Revision Population Database. Retrieved 19 June, 2007, from http://esa.un.org/unpp/
UNEP. (2003). GEO Latin America and the Caribbean: Environmental Outlook 2003. Mexico: United Nations Environment Programme.
UNEP. (2004). UNEP's Assistance in the Implementation of the Barbados programme of Action for the Sustainable Development of Small Island Developing States. The Hague: United Nations Environment Programme.
USACE. (2004). Water Resources Assessment of Dominica, Antigua, Barbuda, St Kitts and Nevis. Mobile, Alabama: United States Army Corps of Engineers.
World Bank, 2000: Cities, Seas and Storms: Managing Change in Pacific Island Economies. Vol. IV, Adapting to Climate Change. World Bank, Washington, D.C., 72 pp.
9

World_Bank. (2005). Global Economic Prospects. Washington DC: World Bank. WWF. (2007). Making Water. Desalination: option or distraction for a thirsty world? : World Wildlife Fund
Australia.
10
OCTOBER SEVENTH CARIBBEAN ISLANDS WATER RESOURCES CONGRESS
2007
NUMERICAL SIMULATION OF STREAM CHANNEL IN FLOODPLAINS
Walter F. Silva-Araya1 and Alejandra Rojas2
ABSTRACT: This paper summarizes the results of numerical simulations of meandering rivers under flood conditions using the two-dimensional model Finite Element Surface Water Modeling System (FESWMS-2D) developed for the U.S. Federal Highway Administration. Among river and valley characteristics considered are: the meanders geometry and width of the floodplain. Changes in water surface elevation for different scenarios were simulated with the model. Results were compared and recommendations for improving one-dimensional models in floodplain studies are provided.
KEYWORDS: meandering rivers, flooding areas, channel geomorphology
INTRODUCTION
Two dimensional models are now accessible to practicing engineers for flood studies. They consider the velocity field in the horizontal plane and describe water surface elevation changes across the valley. Meandering rivers in alluvial floodplains are characterized by complex interactions between the flood waters and the main channel stream.
Due to consideration of the predominant bi-dimensional nature of the flow field, two-dimensional (2D) models are an excellent tool for improving construction and calibration of simpler one-dimensional models. Besides the existence of numerous one-dimensional models for floodplain hydraulics, no systematic approach for development of correction factors due to meandering and valley geometry have been developed. This paper is a contribution to the understanding of the effects of the river and flood valley characteristics on the water surface profiles.
EFFECT OF RIVER GEOMETRY AND FLOODPLAIN WIDTH IN THE WATER ELEVATION
Three meandering characteristics selected were sinuosity, the ratio between the meander amplitude and wave of length and the ratio between the width of the floodplain and the meander amplitude. These ratios could modify the flow patterns and have an effect on the water surface profile.
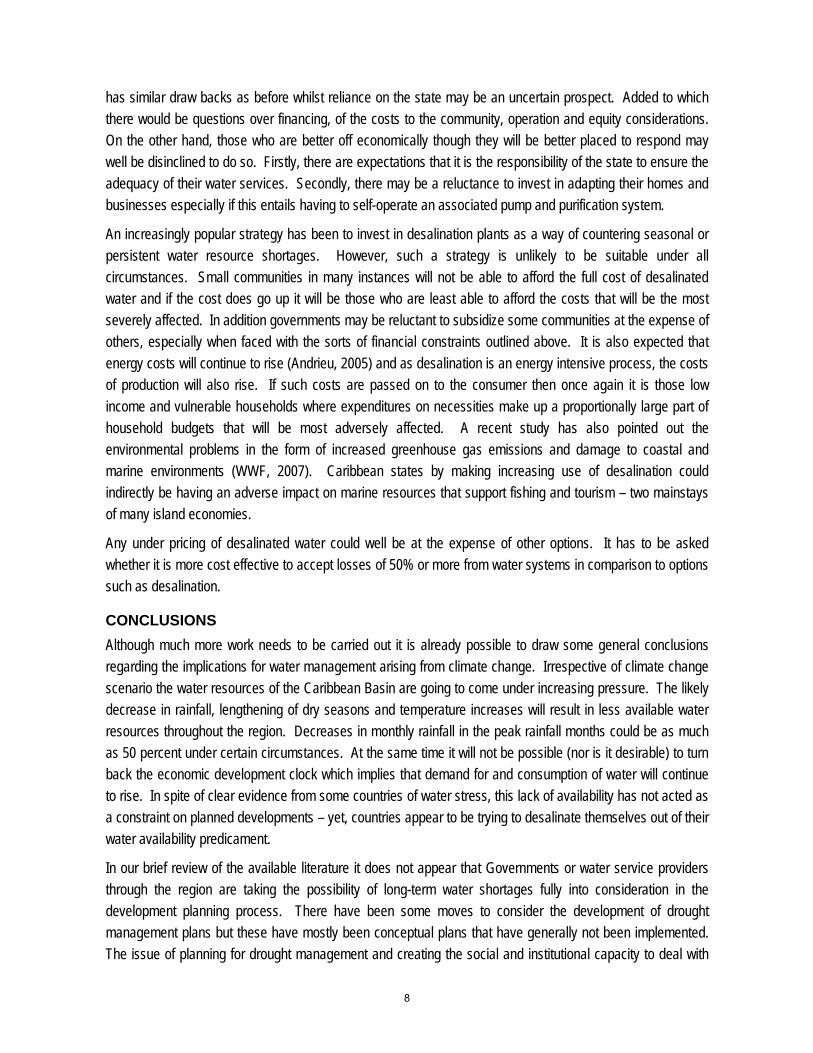
Figure 1 shows the typical distances used to describe meander geometry. Sinuosity (K) is defined as the relation between the path along the meander channel (L) and the meander wave length (Lm)
LmLK = (1)
The ratio of the meander amplitude (Am) and the wave length (Lm) is directly related to the frequency of the curves along the meandering river. Rosgen (1996) and Biederharn et al (1997) found that the sinuosity in natural rivers is in the range between one, for straight channels, up to three for pronounced meanders. The meander amplitude and wave length ratio varies between 0.5
1 Professor, Dept. of Engineering Science and Materials, Univ. of Puerto Rico, Mayaguez (Corresponding author) 2 Former MS Student, Dept. of Civil Engineering, Univ. of Puerto Rico, Mayaguez
11

and 1.5. The ratio between the meanders radius of curvature and the bankfull channel width (r/w) for natural rivers is in the range of 1.5 to 4.5.
Langbein and Leopold (1966) derived the following formula to describe the relation between the meander variables:
Figure 1. Geometric parameters in a river meander
5.0
5.1
)1(13 −=
KKL
r m (2)
where r is the radius of curvature, and Lm is the wave length.
The ratio between the radius of curvature and the bankfull channel width (r/w) for natural rivers is in the range of 1.5 to 4.5 (Biedenharn et al., 1997). Several meandering rivers with geometric characteristics within the range of values described before and satisfying Equation 2 were developed for numerical simulations.
The river geometry was described by the following function:
⎟⎟⎠
⎞⎜⎜⎝
⎛=
m
m
LxA
y π2sin2
(3)
where the coordinates x and y form the x-y plane to describe the geometry of the meandering river.
The main channel geometry was the same for all scenarios. The river cross section is trapezoidal, top width of 40 meters, bottom width of 30 meters and a longitudinal slope of 0.038%. These values correspond closely to the Río Grande de Añasco, in Puerto Rico. Manning’s coefficients used were 0.035 for the main channel banks and 0.015 for the bottom. In this part of the study the floodplain had a constant width of 1,000 meters and was 800 meters long; with a slope of 0.072% in the meandering area. A Mannings roughness coefficient of 0.05 was used uniformly in the floodplain. The downstream boundary condition was normal depth for the corresponding discharge obtained from a discharge curve. Each river was simulated using FESWMS-2D, available as part of the
L
Lm
Am
12
Surface Modeling System (SMS) package (Environmental Modeling Research Laboratory, 2000) with a turbulence viscosity of 5 m2/s across the grid.
A discharge of 1,000 m3/s produced a water depth of approximately 0.5 meters in the river valley and 6.02 meters in the first downstream main channel section. The ratio between the water depth in the floodplain (h) and the main channel water depth (H) is 0.126. This discharge allowed observing significant velocity gradients along the floodplain and in the channel cross section. A higher relation, h/H = 0.359 for a corresponding discharge of 4,000 m3/s was tested to determine the possibility of changes in the velocity vectors due to increase in the water floodwater depth.
RESULTS FROM THE TWO‐DIMENSIONAL MODEL
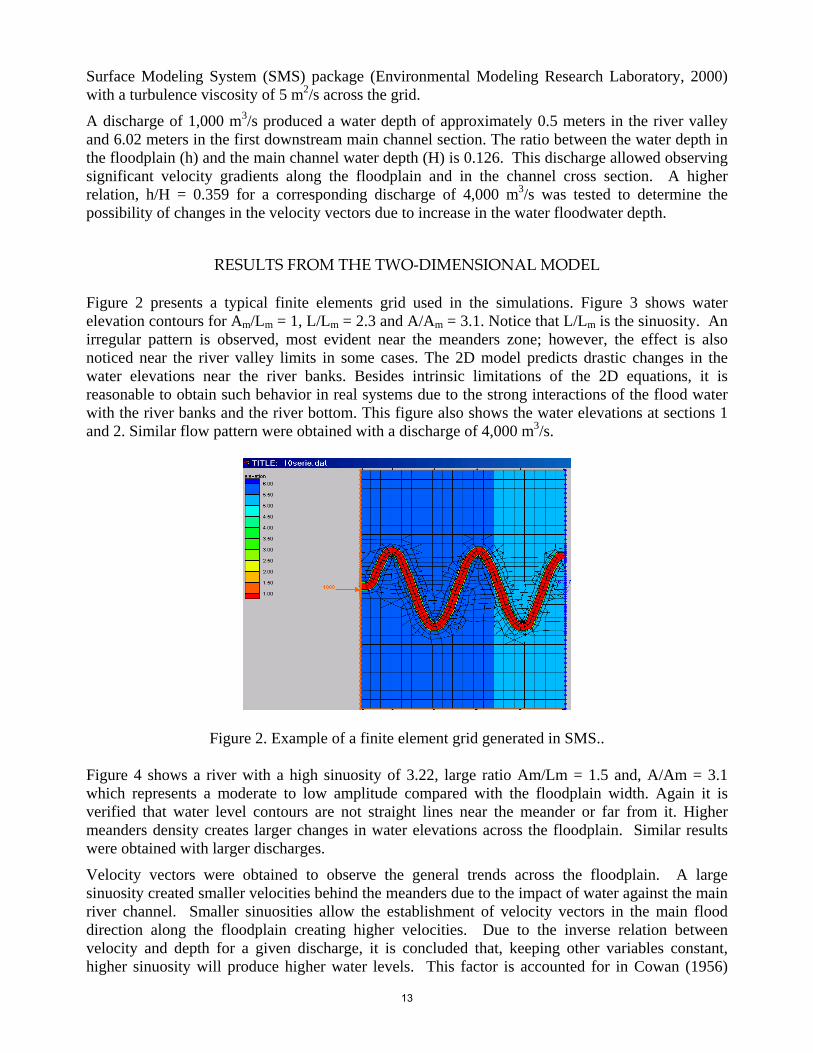
Figure 2 presents a typical finite elements grid used in the simulations. Figure 3 shows water elevation contours for Am/Lm = 1, L/Lm = 2.3 and A/Am = 3.1. Notice that L/Lm is the sinuosity. An irregular pattern is observed, most evident near the meanders zone; however, the effect is also noticed near the river valley limits in some cases. The 2D model predicts drastic changes in the water elevations near the river banks. Besides intrinsic limitations of the 2D equations, it is reasonable to obtain such behavior in real systems due to the strong interactions of the flood water with the river banks and the river bottom. This figure also shows the water elevations at sections 1 and 2. Similar flow pattern were obtained with a discharge of 4,000 m3/s.
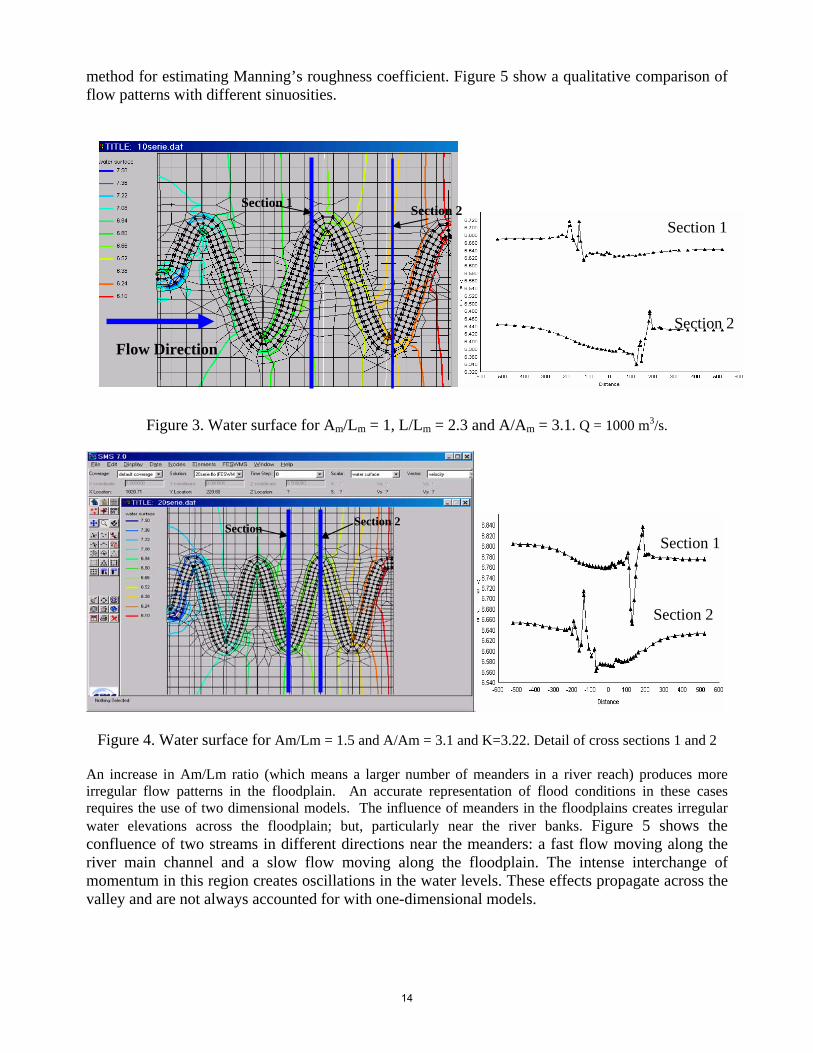
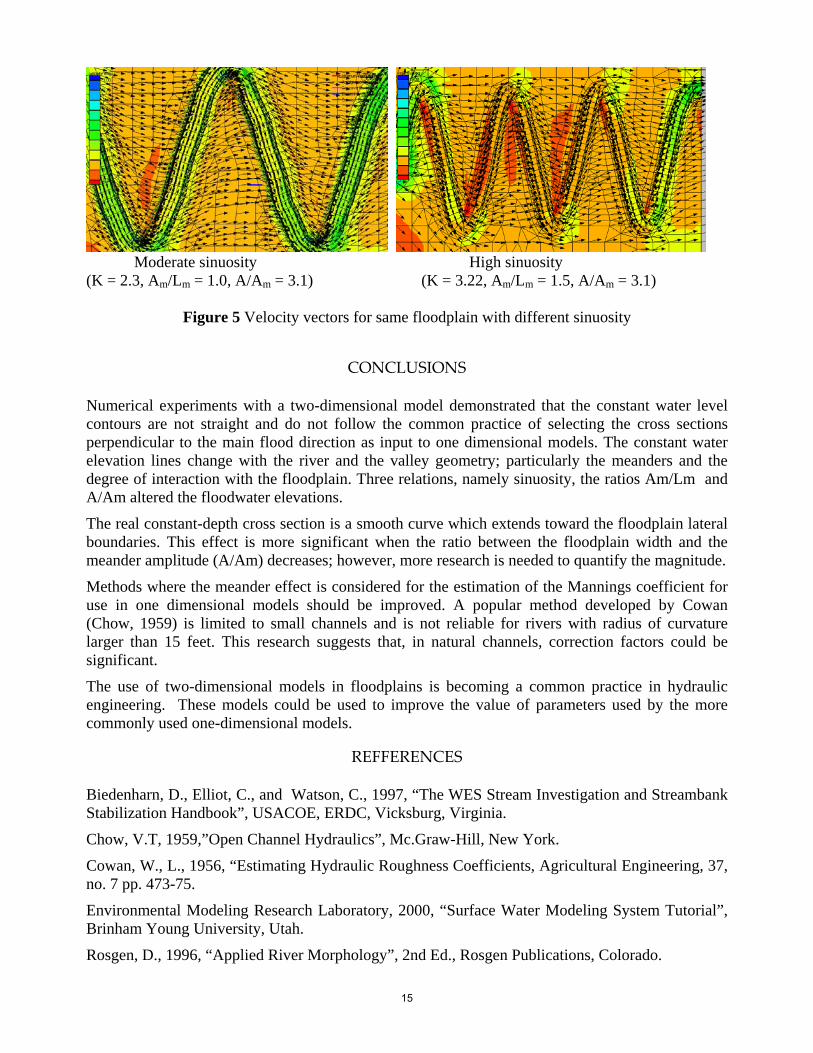
Figure 2. Example of a finite element grid generated in SMS.. Figure 4 shows a river with a high sinuosity of 3.22, large ratio Am/Lm = 1.5 and, A/Am = 3.1 which represents a moderate to low amplitude compared with the floodplain width. Again it is verified that water level contours are not straight lines near the meander or far from it. Higher meanders density creates larger changes in water elevations across the floodplain. Similar results were obtained with larger discharges.
Velocity vectors were obtained to observe the general trends across the floodplain. A large sinuosity created smaller velocities behind the meanders due to the impact of water against the main river channel. Smaller sinuosities allow the establishment of velocity vectors in the main flood direction along the floodplain creating higher velocities. Due to the inverse relation between velocity and depth for a given discharge, it is concluded that, keeping other variables constant, higher sinuosity will produce higher water levels. This factor is accounted for in Cowan (1956)
13
method for estimating Manning’s roughness coefficient. Figure 5 show a qualitative comparison of flow patterns with different sinuosities.
Figure 3. Water surface for Am/Lm = 1, L/Lm = 2.3 and A/Am = 3.1. Q = 1000 m3/s.
Figure 4. Water surface for Am/Lm = 1.5 and A/Am = 3.1 and K=3.22. Detail of cross sections 1 and 2
An increase in Am/Lm ratio (which means a larger number of meanders in a river reach) produces more irregular flow patterns in the floodplain. An accurate representation of flood conditions in these cases requires the use of two dimensional models. The influence of meanders in the floodplains creates irregular water elevations across the floodplain; but, particularly near the river banks. Figure 5 shows the confluence of two streams in different directions near the meanders: a fast flow moving along the river main channel and a slow flow moving along the floodplain. The intense interchange of momentum in this region creates oscillations in the water levels. These effects propagate across the valley and are not always accounted for with one-dimensional models.
Section 2 Section
Section 1 Section 2
Flow Direction Section 2
Section 1
Section 2
Section 1
14
Moderate sinuosity High sinuosity
(K = 2.3, Am/Lm = 1.0, A/Am = 3.1) (K = 3.22, Am/Lm = 1.5, A/Am = 3.1)
Figure 5 Velocity vectors for same floodplain with different sinuosity
CONCLUSIONS
Numerical experiments with a two-dimensional model demonstrated that the constant water level contours are not straight and do not follow the common practice of selecting the cross sections perpendicular to the main flood direction as input to one dimensional models. The constant water elevation lines change with the river and the valley geometry; particularly the meanders and the degree of interaction with the floodplain. Three relations, namely sinuosity, the ratios Am/Lm and A/Am altered the floodwater elevations.
The real constant-depth cross section is a smooth curve which extends toward the floodplain lateral boundaries. This effect is more significant when the ratio between the floodplain width and the meander amplitude (A/Am) decreases; however, more research is needed to quantify the magnitude.
Methods where the meander effect is considered for the estimation of the Mannings coefficient for use in one dimensional models should be improved. A popular method developed by Cowan (Chow, 1959) is limited to small channels and is not reliable for rivers with radius of curvature larger than 15 feet. This research suggests that, in natural channels, correction factors could be significant.
The use of two-dimensional models in floodplains is becoming a common practice in hydraulic engineering. These models could be used to improve the value of parameters used by the more commonly used one-dimensional models.
REFFERENCES Biedenharn, D., Elliot, C., and Watson, C., 1997, “The WES Stream Investigation and Streambank Stabilization Handbook”, USACOE, ERDC, Vicksburg, Virginia.
Chow, V.T, 1959,”Open Channel Hydraulics”, Mc.Graw-Hill, New York.
Cowan, W., L., 1956, “Estimating Hydraulic Roughness Coefficients, Agricultural Engineering, 37, no. 7 pp. 473-75.
Environmental Modeling Research Laboratory, 2000, “Surface Water Modeling System Tutorial”, Brinham Young University, Utah.
Rosgen, D., 1996, “Applied River Morphology”, 2nd Ed., Rosgen Publications, Colorado.
15
OCTOBER SEVENTH CARIBBEAN ISLANDS WATER RESOURCES CONGRESS
2007
The Role of a Community-based Nongovernmental Organization in Promoting Active Research and Stewardship of Water and Other Environmental Resources in
the U. S. Virgin islands
Sharon L. Coldren1 ABSTRACT: The presentation covers activities and accomplishments of the Coral Bay Community Council, a 4-year-old 501(c) (3) nonprofit volunteer organization, and the resources it has managed to focus on stormwater, watershed, and planned and sustainable development issues. Possible ways to replicate these efforts in other tropical communities and acknowledgement of the work over the decades of other organizations are included. The ongoing multi-agency project to develop a pilot watershed management plan for the Coral Bay watershed that can be replicated in other Virgin Islands’ watersheds will be discussed. Insights into the practical application of water resources research are also provided. KEYWORDS: NGO (nongovernmental organization), planning, development, watershed, stormwater
INTRODUCTION
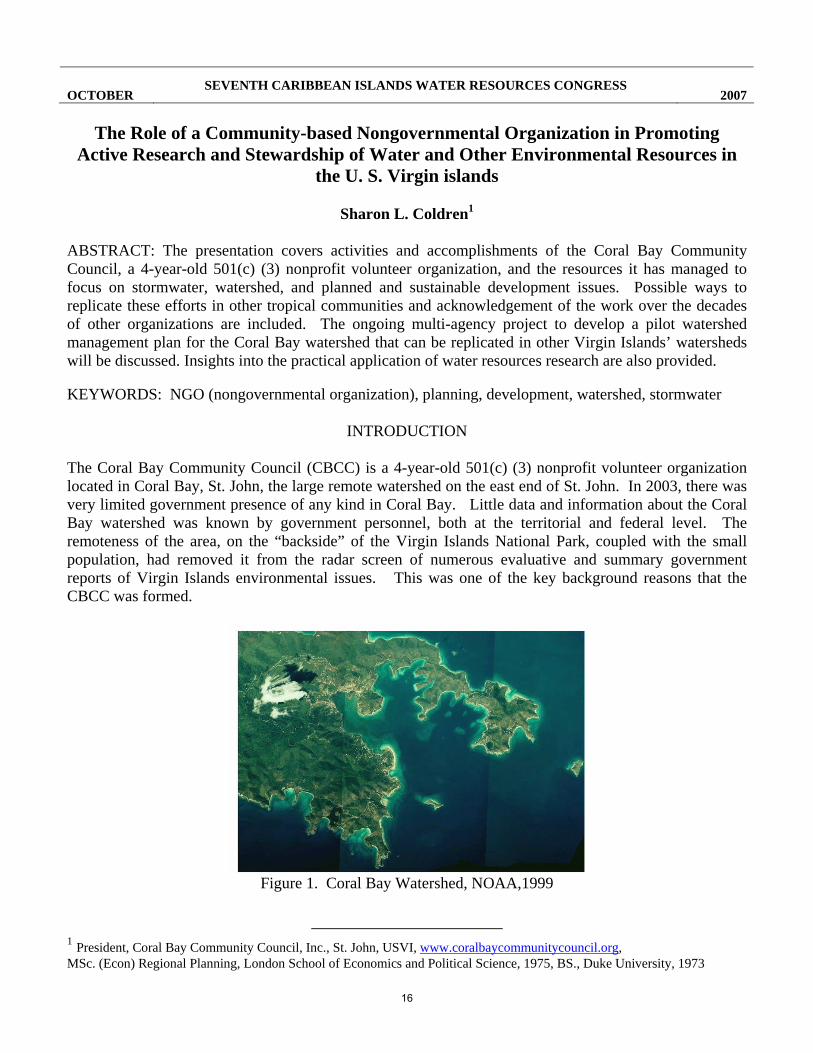
The Coral Bay Community Council (CBCC) is a 4-year-old 501(c) (3) nonprofit volunteer organization located in Coral Bay, St. John, the large remote watershed on the east end of St. John. In 2003, there was very limited government presence of any kind in Coral Bay. Little data and information about the Coral Bay watershed was known by government personnel, both at the territorial and federal level. The remoteness of the area, on the “backside” of the Virgin Islands National Park, coupled with the small population, had removed it from the radar screen of numerous evaluative and summary government reports of Virgin Islands environmental issues. This was one of the key background reasons that the CBCC was formed.
Figure 1. Coral Bay Watershed, NOAA,1999
1 President, Coral Bay Community Council, Inc., St. John, USVI, www.coralbaycommunitycouncil.org, MSc. (Econ) Regional Planning, London School of Economics and Political Science, 1975, BS., Duke University, 1973
16
Additionally, there were many rumors of major waterfront and marina developments, as well as the known current problems with stormwater and sediment erosion entering the bay’s waters. A group of citizens got together in November 2003 to form the CBCC, incorporate it, and begin attracting local membership – which has now grown, in 2007 to 232 people. It is a volunteer run organization with an annual budget from dues and donations of about $16,000 which funds operating an office, publicity, and some project expenses.
ESTABLISHING INFORMATION RESOURCES AND EXPERTISE
One important focus has been gathering available research on the watershed and its environmental resources. To do this, from CBCC’s inception, requests were made of the Island Resources Foundation, via the late Edward Towle and Bruce Potter, to provide copies of their long-standing research efforts and archives. They were invaluable in providing earlier documents and a digital archive of aerial and other photos of Coral Bay, as well as encouragement and advice on establishing focus.
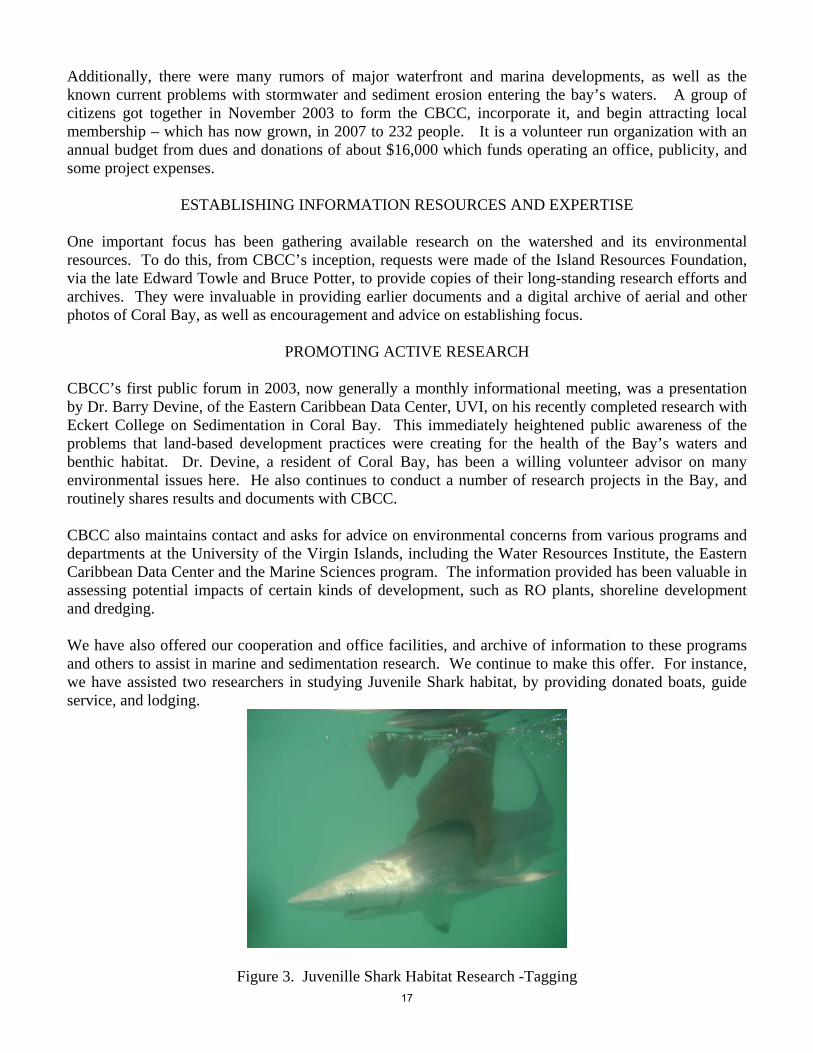
PROMOTING ACTIVE RESEARCH CBCC’s first public forum in 2003, now generally a monthly informational meeting, was a presentation by Dr. Barry Devine, of the Eastern Caribbean Data Center, UVI, on his recently completed research with Eckert College on Sedimentation in Coral Bay. This immediately heightened public awareness of the problems that land-based development practices were creating for the health of the Bay’s waters and benthic habitat. Dr. Devine, a resident of Coral Bay, has been a willing volunteer advisor on many environmental issues here. He also continues to conduct a number of research projects in the Bay, and routinely shares results and documents with CBCC. CBCC also maintains contact and asks for advice on environmental concerns from various programs and departments at the University of the Virgin Islands, including the Water Resources Institute, the Eastern Caribbean Data Center and the Marine Sciences program. The information provided has been valuable in assessing potential impacts of certain kinds of development, such as RO plants, shoreline development and dredging. We have also offered our cooperation and office facilities, and archive of information to these programs and others to assist in marine and sedimentation research. We continue to make this offer. For instance, we have assisted two researchers in studying Juvenile Shark habitat, by providing donated boats, guide service, and lodging.
Figure 3. Juvenille Shark Habitat Research -Tagging 17
Initially, CBCC intended to get environmental research/planning grants and contracts, hire appropriate professionals to do the work, and have both professional and volunteer elements to its program. However, for various reasons, this approach has yet to be successful, so CBCC has maximized what can be done on a volunteer basis. There are advantages: simpler finances and administration, allowing total focus on issues and services.
ENCOURAGE STEWARDSHIP OF WATER AND ENVIRONMENTAL RESOURCES
Our membership form asks “What are the most important issues facing Coral Bay?” Almost always, the answer given includes stormwater and sediment management, and protection of Coral Bay’s marine habitat in the face of development. We take this concern as a mandate from our members and the community. We not only encourage local residents and developers to use proper practices – we encourage EPA and DPNR to enact and enforce effective stormwater management regulations.
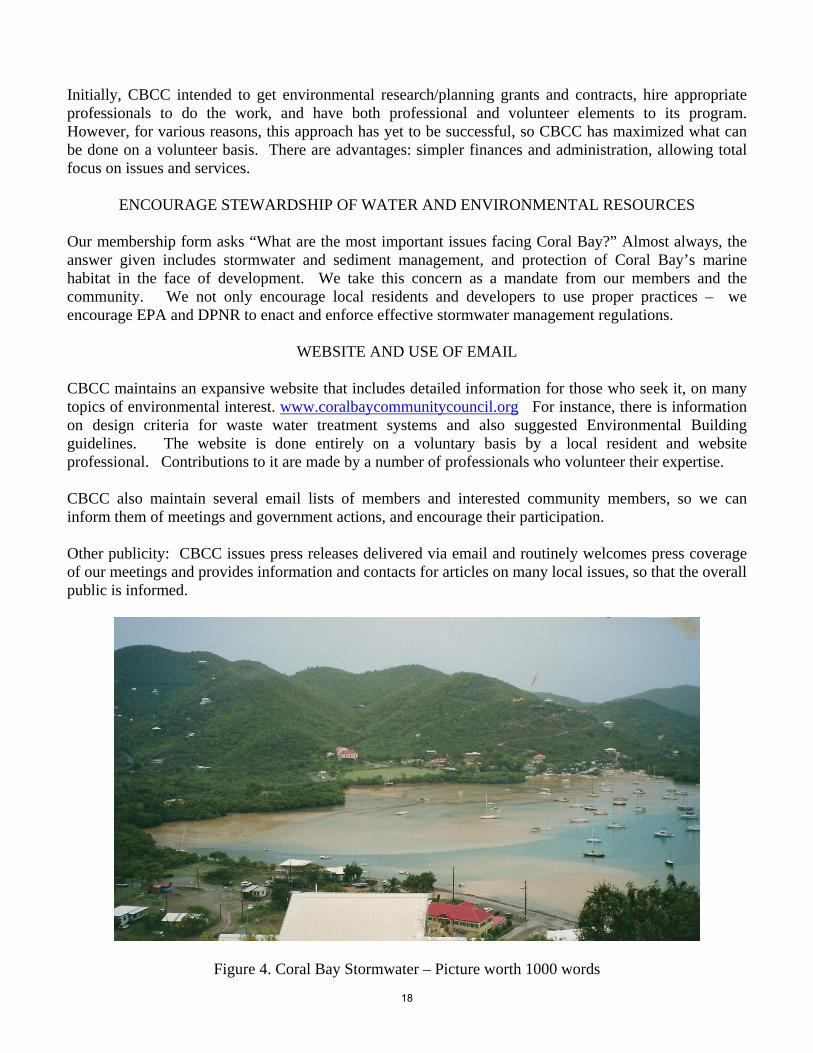
WEBSITE AND USE OF EMAIL CBCC maintains an expansive website that includes detailed information for those who seek it, on many topics of environmental interest. www.coralbaycommunitycouncil.org For instance, there is information on design criteria for waste water treatment systems and also suggested Environmental Building guidelines. The website is done entirely on a voluntary basis by a local resident and website professional. Contributions to it are made by a number of professionals who volunteer their expertise. CBCC also maintain several email lists of members and interested community members, so we can inform them of meetings and government actions, and encourage their participation. Other publicity: CBCC issues press releases delivered via email and routinely welcomes press coverage of our meetings and provides information and contacts for articles on many local issues, so that the overall public is informed.
Figure 4. Coral Bay Stormwater – Picture worth 1000 words
18
COOPERATION WITH GOVERNMENT AGENCIES
AND OTHER NONPROFIT ENVIRONMENTAL ORGANIZATIONS CBCC attempts to have good working relationships with staff at all levels in territorial government agencies, and contacts with the regional and national Federal agencies, such as NOAA and EPA. As a perceived “watchdog” organization, CBCC has an acknowledged role in providing information on local environmental impacts of development and government policies and practices. CBCC became a member of VIRC&D, the Virgin Islands Resource Conservation and Development Council, Inc. a couple years ago. The contacts, encouragement and mutual interests have been very instrumental in assisting CBCC to begin to discuss actual possibilities for a stormwater management pond project, as well overall watershed management issues. In addition, the contacts made here with the other members have provided a professional community of colleagues with similar interests – for feedback and ideas, and promotion of each other’s goals within the larger governmental and environmental community.
EXAMPLE PROJECT
For four years, CBCC has been actively promoting stormwater management. Due to the CBCC’s publicity on these concerns and the wiling cooperation of the local residents, in 2007, Coral Bay was chosen by DPNR and NOAA to be the site for a pilot watershed management plan for the Virgin Islands, a federally funded contract with the Center for Watershed Protection. Site visits were held in Coral Bay for 3 days in August and over 30 local residents participated in the visits and another 25 attended the public meeting. In addition, much new interest was generated among people who would like to know how to manage or pave dirt roads, and handle guts. The draft plan is currently under government review. CBCC hopes it will lead to public funding of certain needed community projects, effective administration of the new stormwater regulations, as well as technical assistance for private individuals seeking to reduce stormwater problems.
CONCLUSION
In conclusion, in every tropical paradise, we are facing the demands of development and the need to balance it with environmental concerns. Limited government staffing and funding, and the remoteness of some of our most pristine areas, means that nongovernmental organizations can play a very key role in augmenting government/public resources, and assuring that there can be focus on management in remoter areas. Similarly with research: remoteness often increases the cost of doing research in an area. An NGO can provide donated services that reduce the direct costs of research with little red tape, and also potentially be the sponsoring organization for the researcher and grants, if appropriate. The NGO can also disseminate the results of the research and its practical application, help to bring it to the attention of policymakers for action, if needed. NGOs, like CBCC, can provide the focus and coordination that allows efficiency and “success stories” to occur in the management of our water and other environmental resources.
RESOURCE ORGANIZATIONS
Island Resources Foundation, www.irf.org Bruce Potter, President,1718 "P" Street NW, Suite T-4, Washington, DC 20036 Telephone: 202/265-9712, Fax: 202/232-0748 e-mail [email protected]
19

Dr. Barry Devine, Eastern Caribbean Data Center, University of the Virgin Islands, [email protected] 340-693-1038 Virgin Islands Resource Conservation and Development Council (VIRC&D), coordinator: Julie Wright www.usvircd.org email: [email protected], Telephone:(340) 692-9632, ext. 5, FAX: (340) 692-9607 5030 Anchor Way, Suite 2, Gallows Bay, Christiansted, VI 00820 Center for Watershed Protection, www.cwp.org 8390 Main Street, 2nd Floor, Ellicott City, MD 21043 Phone: 410-461-8323 Fax: 410-461-8324 email: [email protected]
20
OCTOBER SEVENTH CARIBBEAN ISLANDS WATER RESOURCES CONGRESS
2007
EFFECT OF SPATIAL AND TEMPORAL RESOLUTION UNCERTAINTY ON PREDICTED BEST MANAGEMENT PRACTICE (BMP) EFFICIENCY
Robert Miskewitz1, Josef Kardos, Christopher Obropta, and Katie Buckley
ABSTRACT
An analysis of the effect of spatial and temporal uncertainty on predicted Best Management Practice (BMP) efficiency by a Soil Water Assessment Tool model was conducted for a small agricultural watershed in southern New Jersey. The Upper Cohansey River Watershed is a 65 square kilometer agriculturally-based watershed that drains to Delaware Bay. Two models were created; these include Model I, which was calibrated using monthly flow data a single point in the watershed, and Model II, which was calibrated using daily measurements at 12 locations throughout the watershed. The predictions of total phosphorus and sediment removal were compared for the two models to determine uncertainty related to the temporal resolution of the calibrations. The resulting reductions for total phosphorus are somewhat similar (± 15%); however, the actual load reductions vary by as much as 2,437 kilograms per year. This type of uncertainty can have large impacts on the ability of a BMP to perform to its anticipated standards and the potential success of total maximum daily load implementation projects.
INTRODUCTION The United States Environmental Protection Agency (USEPA) has reported there are over 34,000 impaired waters and over 58,000 associated impairments in the U.S (USEPA, 2006). In response to this problem, stakeholders have increasingly relied on complex numerical hydrologic and hydraulic models to simulate watershed conditions and forecast pollutant reductions from best management practices (BMPs) (Gitau et al., 2004; Arabi et al., 2006; Santhi et al., 2006). Arabi et al. (in press) demonstrated the effect of model parameter uncertainty on BMP efficiency. In addition to parameter uncertainty, the scales of spatial and temporal resolution represent another source of model uncertainty (Shirmohammadi et al., 2006). In particular, the uncertainty associated with the scale of model resolution could lead to inaccurate predictions of BMP efficiency. Consequently, decisions based on a low-resolution model could result in either over-design of BMPs, or conversely inadequate BMPs that cannot achieve the desired water quality improvements. Either case would represent a sub-optimal expenditure of resources. An analysis of the effect of spatial and temporal uncertainty on predicted BMP efficiency was conducted for a small agricultural watershed in southern New Jersey. The Upper Cohansey River Watershed (UCRW) is a 65 square kilometers agriculturally-based watershed that drains to Delaware Bay. The land use is predominantly vegetable, field and container nursery, and sod production. Based on the projections of a simple empirical model, a Total Maximum Daily Load (TMDL) was developed for the Upper Cohansey River that calls for a 91% reduction in total
1 Rutgers University, New Jersey, USA ([email protected])
21
phosphorus (TP) load (New Jersey Department of Environmental Protection, 2005). Implementation of agricultural BMPs is necessary to achieve a portion of this targeted reduction. This project modeled the UCRW with the Soil Water Assessment Tool (SWAT), developed by the United States Department of Agriculture-Agriculture Research Service (USDA-ARS) for the simulation of pollutant transport to rivers in large agricultural areas (Arnold et al., 1998; Neitsch et al., 2002). As demonstrated by Harmel et al. (2000) and Spruill et al. (2000), SWAT has been employed successfully in several smaller watersheds. The UCRW model delineated the watershed into 12 subbasins, whereby each subbasin outlet corresponded to a surface water sampling site. These sites were sampled biweekly for a period of six months in 2006. Flow rates, sediment, and nutrient concentrations were recorded. In addition, samples were collected during three storm events. A subset of the 12 sites was also sampled for flow rate and nutrient concentrations in 2002-2005. The data was used to calibrate the UCRW model and compare various simulations of BMP scenarios.
The UCRW model was developed in two phases. Model I was calibrated and validated for monthly flow using data from the United States Geological Survey (USGS) Gauge at Seeley Lake. The calibration period was September 2003 – September 2004, and the validation period was October 2004 – September 2005. The model was then calibrated at four subbasin outlets to predict daily average of total phosphorus (TP) concentration on an annual scale. The Nash-Sutcliff Correlation Factor for the monthly flows of 0.54. Investigation of Model I revealed inadequacies in its ability to correctly predict storm flows. As a result, Model II was developed. Model II was calibrated and validated for the same periods as Model I; however, it was calibrated using daily flow measurements from the USGS gauge at the watershed outlet. In addition, data was available for flow, sediment, and TP concentrations at the 12 water quality monitoring locations. Measurements were collected at these locations bi-weekly for a period of six months. The Nash-Sutcliff Correlation Factor for the daily water flow rate at watershed outlet for the calibration period was 0.73 and 0.36 for the validation period. Using this model, several scenarios were evaluated including: 1) installation of vegetated filter strips at the edges of farm areas, and 2) installation of bioretention areas at the container nurseries. Sediment and TP loadings were analyzed, and the predicted reductions resulting from these BMPs were determined on an annual scale.
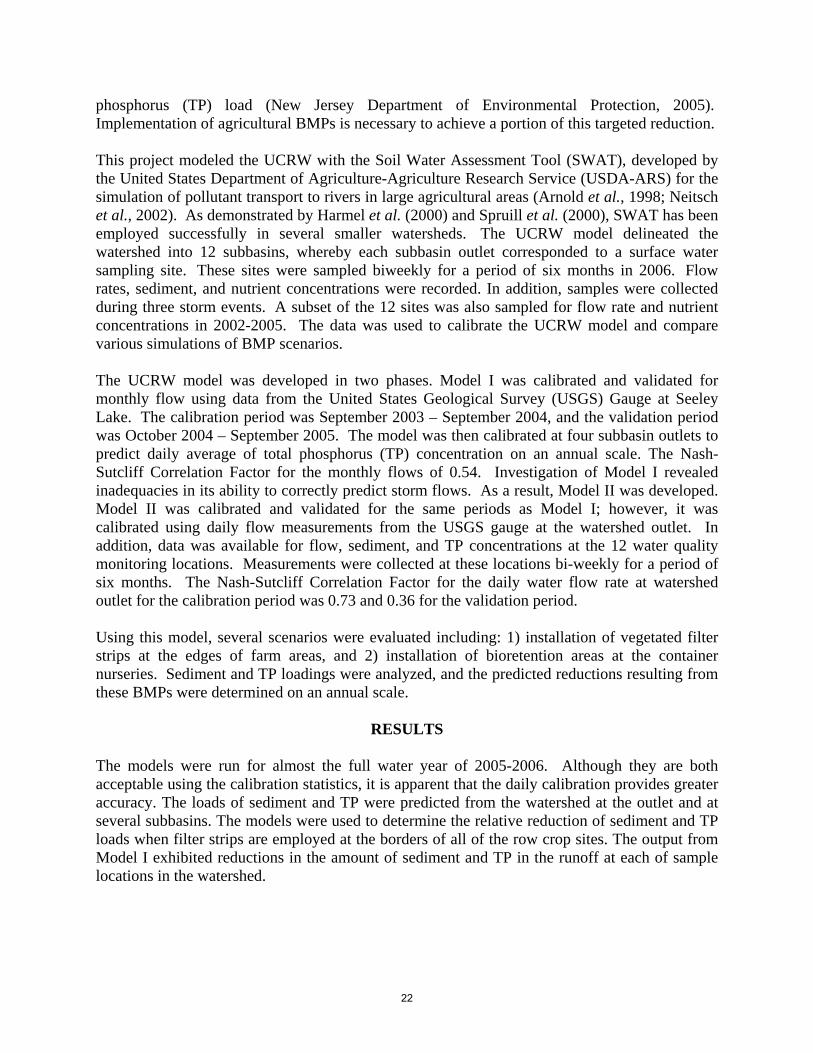
RESULTS The models were run for almost the full water year of 2005-2006. Although they are both acceptable using the calibration statistics, it is apparent that the daily calibration provides greater accuracy. The loads of sediment and TP were predicted from the watershed at the outlet and at several subbasins. The models were used to determine the relative reduction of sediment and TP loads when filter strips are employed at the borders of all of the row crop sites. The output from Model I exhibited reductions in the amount of sediment and TP in the runoff at each of sample locations in the watershed.
22
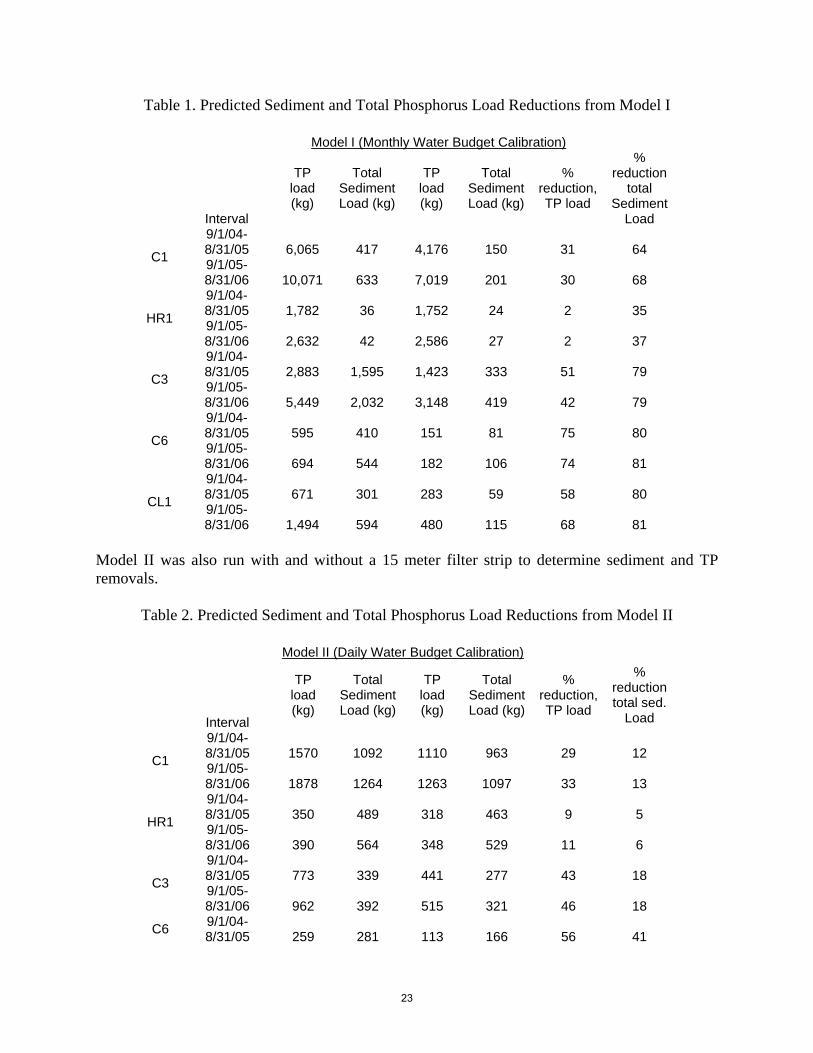
Table 1. Predicted Sediment and Total Phosphorus Load Reductions from Model I
Model I (Monthly Water Budget Calibration)
Interval
TP load (kg)
Total Sediment Load (kg)
TP load (kg)
Total Sediment Load (kg)
% reduction, TP load
% reduction
total Sediment
Load 9/1/04-8/31/05 6,065 417 4,176 150 31 64 C1 9/1/05-8/31/06 10,071 633 7,019 201 30 68 9/1/04-8/31/05 1,782 36 1,752 24 2 35 HR1 9/1/05-8/31/06 2,632 42 2,586 27 2 37 9/1/04-8/31/05 2,883 1,595 1,423 333 51 79 C3 9/1/05-8/31/06 5,449 2,032 3,148 419 42 79 9/1/04-8/31/05 595 410 151 81 75 80 C6 9/1/05-8/31/06 694 544 182 106 74 81 9/1/04-8/31/05 671 301 283 59 58 80 CL1 9/1/05-8/31/06 1,494 594 480 115 68 81
Model II was also run with and without a 15 meter filter strip to determine sediment and TP removals.
Table 2. Predicted Sediment and Total Phosphorus Load Reductions from Model II
Model II (Daily Water Budget Calibration)
Interval
TP load (kg)
Total Sediment Load (kg)
TP load (kg)
Total Sediment Load (kg)
% reduction, TP load
% reduction total sed.
Load 9/1/04-8/31/05 1570 1092 1110 963 29 12 C1 9/1/05-8/31/06 1878 1264 1263 1097 33 13 9/1/04-8/31/05 350 489 318 463 9 5 HR1 9/1/05-8/31/06 390 564 348 529 11 6 9/1/04-8/31/05 773 339 441 277 43 18 C3 9/1/05-8/31/06 962 392 515 321 46 18
C6 9/1/04-8/31/05 259 281 113 166 56 41
23
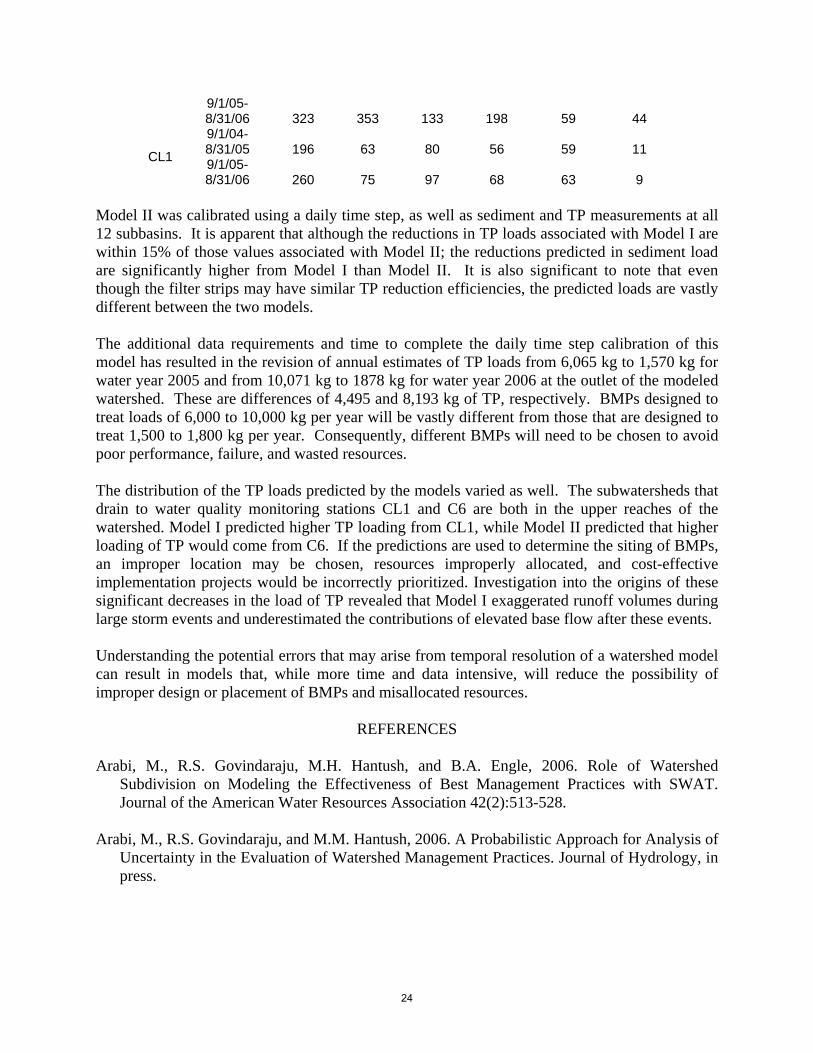
9/1/05-8/31/06 323 353 133 198 59 44 9/1/04-8/31/05 196 63 80 56 59 11 CL1 9/1/05-8/31/06 260 75 97 68 63 9
Model II was calibrated using a daily time step, as well as sediment and TP measurements at all 12 subbasins. It is apparent that although the reductions in TP loads associated with Model I are within 15% of those values associated with Model II; the reductions predicted in sediment load are significantly higher from Model I than Model II. It is also significant to note that even though the filter strips may have similar TP reduction efficiencies, the predicted loads are vastly different between the two models. The additional data requirements and time to complete the daily time step calibration of this model has resulted in the revision of annual estimates of TP loads from 6,065 kg to 1,570 kg for water year 2005 and from 10,071 kg to 1878 kg for water year 2006 at the outlet of the modeled watershed. These are differences of 4,495 and 8,193 kg of TP, respectively. BMPs designed to treat loads of 6,000 to 10,000 kg per year will be vastly different from those that are designed to treat 1,500 to 1,800 kg per year. Consequently, different BMPs will need to be chosen to avoid poor performance, failure, and wasted resources. The distribution of the TP loads predicted by the models varied as well. The subwatersheds that drain to water quality monitoring stations CL1 and C6 are both in the upper reaches of the watershed. Model I predicted higher TP loading from CL1, while Model II predicted that higher loading of TP would come from C6. If the predictions are used to determine the siting of BMPs, an improper location may be chosen, resources improperly allocated, and cost-effective implementation projects would be incorrectly prioritized. Investigation into the origins of these significant decreases in the load of TP revealed that Model I exaggerated runoff volumes during large storm events and underestimated the contributions of elevated base flow after these events. Understanding the potential errors that may arise from temporal resolution of a watershed model can result in models that, while more time and data intensive, will reduce the possibility of improper design or placement of BMPs and misallocated resources.
REFERENCES Arabi, M., R.S. Govindaraju, M.H. Hantush, and B.A. Engle, 2006. Role of Watershed
Subdivision on Modeling the Effectiveness of Best Management Practices with SWAT. Journal of the American Water Resources Association 42(2):513-528.
Arabi, M., R.S. Govindaraju, and M.M. Hantush, 2006. A Probabilistic Approach for Analysis of
Uncertainty in the Evaluation of Watershed Management Practices. Journal of Hydrology, in press.
24
Arnold, J.G., R. Srinivasan, R.S. Muttiah, and J.R. Williams, 1998. Large Area Hydrologic Modeling and Assessment Part I: Model Development. Journal of the American Water Resources Association 34(1):73-89.
Chen, E. and S. Mackay, 2004. Effects of Distribution-based Parameter Aggregation on a
Spatially Distributed Agricultural Nonpoint Source Pollution Model. Journal of Hydrology 295:211-224.
Gitau, M.W., T.L. Veith, W.J. Gburek, 2004. Farm-Level Optimization of BMP Placement for
Cost-Effective Pollution Reduction. Harmel, R.D., C.W. Richardson, and K.W. King, 2000. Hydrologic Response of a Small
Watershed Model to Generated Precipitation. Transactions of the ASAE 43(6):1483-1488. Neitsch, S.L., J.G. Arnold, J.R. Williams, J.R. Kiniry, K.W. King, 2002. Soil and Water
Assessment Tool (Version 2000) – Model Documentation. GSRWRL02-01, BREC 02-05, TR-191, Texas Water Research Institute, Texas A&M University, College Station, TX.
NJDEP, 2005. Total Maximum Daily Loads for Phosphorus to Address 5 Stream Segments in
the Lower Delaware Water Region. Trenton, NJ. Division of Watershed Management, New Jersey Department of Environmental Protection.
Santhi, C., R. Srinivasan, J.G. Arnold, and J.R. Williams, 2006. A Modeling Approach to
Evaluate the Impacts of Water Quality Management Plans Implemented in a Watershed in Texas. Environmental Modelling & Software 21:1141-1157.
Shirmohammadi, A., I. Chaubey, R.D. Harmel, D.D. Bosch, R. Munoz-Carpena, C. Dharmasri,
A. Sexton, M. Arabi, M.L. Wolfe, J. Frankenberger, C. Graff, and T.M. Sohrabi, 2006. Uncertainty in TMDL Models. Transactions of the ASABE 49(4):1033-1049.
Spruill, C.A., S.R. Workman, and J.L. Taraba, 2000. Simulation of Daily and Monthly Stream
Discharge from Watersheds Using the SWAT Model. Transactions of the ASAE 43(6):1431-1439.
Srinivasan, M.S., P. Gerard-Merchant, T.L. Veith, W.J. Gburek, and T. Steenhuis, 2005.
Watershed Scale Modeling of Critical Source Areas of Runoff Generation and Phosphorus Transport. Journal of the American Water Resources Association 41(2):361-375.
USEPA. 2006. Total Maximum Daily Load: National Section 303(d) List Fact Sheet.
Washington, D.C.: U.S. Environmental Protection Agency. Available at: http://oaspub.epa.gov/waters/national_rept.control. Accessed 9 February 2006.
25
OCTOBER SEVENTH CARIBBEAN ISLANDS WATER RESOURCES CONGRESS
2007
SEDIMENT PRODUCTION FROM NATURAL AND DISTURBED SURFACES
IN DRY TROPICAL AREAS OF LA PARGUERA-PR, 2003-2005
Carlos E. Ramos-Scharrón*†
ABSTRACT: Many coral reef systems within the Caribbean are at risk from land-based sources of sediment and this has prompted the U.S. Coral Reef Task Force to encourage local governments to develop erosion control strategies to mitigate their impacts. The lack of quantitative information and proper watershed assessment protocols is sometimes cited as a cause for inadequate land use decisions. This study begins to address the need for empirical data by quantifying the effects of land development on plot- and hillslope-scale sediment production rates in a tropical dry forest of southwestern Puerto Rico. Bounded plots were used to measure runoff and sediment yields from three freshly-disturbed surfaces between 2004 and 2005, while hillslope-scale sediment production rates were measured with sediment traps from eleven undisturbed hillslopes and nine unpaved road segments between 2003 and 2005. The mean sediment production rate from undisturbed hillslopes was 0.1 Megagrams per hectare per year. The mean sediment production rate from road segments and freshly-disturbed plots were 1.1 and 1.4 Mg ha-1 yr-1, respectively. These rates show that disturbance associated to land development in a dry tropical area induces at least a ten-fold increase in sediment production rates above undisturbed conditions. The data presented here will be combined with additional data from other areas in the Caribbean to develop a comprehensive surface erosion model for dry tropical areas. The incorporation of this model into a new Geographical Information System application will allow land managers to evaluate surface erosion problems at the watershed-scale and to standardize the development of erosion control strategies.
INTRODUCTION
The decline of coral cover observed over the past several decades throughout the Caribbean Region has been associated in part to localized increases in levels of land-based anthropogenic stresses (Gardner et al., 2003). The US Coral Reef Task Force has recommended the immediate reduction of land-based pollution to lessen the threats to Caribbean reefs, and has given special attention to the effects of land development on erosion and sediment delivery (USCRTF, 2000). Excess delivery of terrigenous sediments may have detrimental effects on coral reefs (Rogers, 1990), but with the exception of only a handful of studies (e.g., Ramos-Scharrón & MacDonald, 2007a, 2007b; Warne et al., 2005), limited information is available on sediment delivery rates to the marine environment (UNEP, 1994). In Puerto Rico (PR), most previous erosion-related research has centered on the larger river basins and has focused on agricultural lands, mass wasting processes, or on sedimentation of water reservoirs. These studies agree that maximum sediment yield rates from the major rivers must have occurred during the peak of the agricultural era (1930s-1950s) (Warne et al., 2005), but current yields remain high due to mass wasting, remobilization of agricultural-era sediment (Clark and Wilcock, 2000), and other currently active * Dept. of Geography and the Environment, Univ. of Texas-Austin, 1 University Station, A3100, Austin, TX USA 78712 Tel. 1-787-587-0416 Email: [email protected] † Island Resources Foundation, 1718 ‘P’ Street NW, Suite T4, Washington DC, 20036
26
sediment sources. However, some of the best remaining examples of nearshore reefs within the U.S. Caribbean are not in close proximity to the outlets of these major rivers, as they tend to face small coastal watersheds (< 1 km2 to ~10 km2) on dry-tropical climatic zones that currently are being heavily impacted by land development. These small watersheds have a low potential for mass wasting and a limited capacity for fluvial sediment storage, therefore surface erosion from disturbed lands is likely to control current sediment yield rates.
Coral reefs in the La Parguera Bay-PR have a high abundance of living coral relative to other sites on the island, but these reefs are threatened by increased sediment yields resulting from land clearing on the catchments draining into the bay (Morelock et al., 2000). Land development consists of vegetation removal and ground leveling associated to medium-scale construction sites (~10’s ha) and low-standard, steep unpaved roads. Very limited background information currently exists on this type of development on a dry tropical setting, but data from nearby St. John-USVI suggests that disturbed surfaces can erode at rates that are up to four-orders of magnitude higher than undisturbed surfaces (MacDonald et al., 2001; Ramos-Scharrón and MacDonald, 2005, 2007b), and that disturbance may increase catchment-scale sediment yields up to 9 times above background levels (Ramos-Scharrón and MacDonald, 2007a).
This project addresses some unresolved issues related to erosion processes in the Caribbean by focusing on these two objectives: 1) Collect field-based measurements in La Parguera to determine the impacts of land disturbance on sediment production (i.e., surface erosion) at the plot (3 m2) and hillslope (10’s-100’s m2) scales; and 2) Compare data collected in La Parguera with measurements previously collected in St. John-USVI between 1998 and 2001.
STUDY AREA
This study took place on the small coastal watersheds draining into the La Parguera Bay (Lat: 17.9, Long: -67.1) of southwestern PR, where land erosion associated to a rapid pace of land development for urbanization threatens one of the richest coral reef systems in the Caribbean. The lithology is dominated by the Parguera limestone and mainly consists of volcaniclastic calcarenite and calcareous mudstones. Soils are shallow (<30 cm) and very cobbly. The area has a semi-arid, very dry tropical climate with an average temperature of 27 C (81F), a mean rainfall of only 77 cm yr-1, and a potential evapotranspiration of 186 cm yr-1 (Goyal, 1988).
METHODS
Runoff plots: Runoff and sediment production from three freshly-disturbed unpaved road surfaces were measured with bounded runoff plots (~3 m2) connected to water containers. Road slopes ranged between 9-14%. A total of 17 measurements were taken between July-2004 and May-2005, and they consisted in determining the volume of water in 130-L containers and in collecting one to two 0.5-L water samples that were analyzed for suspended sediment content.
Sediment traps: The mass of sediment produced from unpaved road segments (75-350 m2) and undisturbed hillslopes (12 m2-2.5 ha) was measured between August-2003 and May-2005 with 9 and 14 filter fabric sediment traps, respectively (101 measurements). Slopes ranged from 1-22% for the unpaved roads, and 12-70% for undisturbed hillslopes. The point count method was used to determine the vegetation densities of all surfaces. All erosion measurements were matched against rainfall totals measured with a recording rain gauge.
27
RESULTS
A total of 183 cm of rainfall were recorded during the study period, and this is 25% higher than the expected based on the long-term local average measured at Magueyes Island (NOAA, 2002). Rainfall followed the typical wet-dry pattern of the region, but rainfall during the months of Nov-03 and May-05 was almost three times the monthly average. The large amounts of rainfall observed during the study period represented the first time in the last decade in which monthly precipitation notably exceeded potential evapotranspiration. The unpaved road segments, which had not been graded for at least 5-7 years, re-vegetated as a result of the available moisture.
Although the November-2003 monthly rainfall accounted for roughly 23% (42 cm) of the total recorded rainfall during the study period, the maximum intensity for this month (3.0 cm hr-1) was exceeded during both March-2004 and May-2004 (4.0 and 3.9 cm hr-1, respectively). A modified rainfall depth-intensity curve showed that 32% of the rainfall during the study period fell at intensities exceeding 2.0 cm hr-1. Rainfall intensity data previously collected on a similar dry-tropical setting on St. John from 1998 to 2001 (Ramos-Scharrón and MacDonald, 2005) showed a lower intensity pattern, as only 13-22% of the rainfall was recorded at intensities exceeding 2.0 cm hr-1. These analyses show that the 2003-2005 study period in La Parguera was characterized by a higher than normal rainfall pattern with high intensities.
Assuming an annual rainfall of 80 cm, the mean sediment production from undisturbed hillslopes and unpaved road segments is 0.11 and 1.1 Mg ha-1 yr-1, respectively. This difference was statistically significant and shows that unpaved roads increased sediment production rates by one-order of magnitude above natural conditions. Average sediment production from unpaved roads showed a strong, positive, non-linear relationship with slope (Figure 1a), but a surprisingly poor correlation with rainfall. This poor correlation was caused by a decrease in sediment production rates through time. The maximum sediment production rates were recorded between Aug-2003 and October-2003 when the maximum rainfall intensity was only 2.8 cm hr-1, and these erosion rates were generally higher than those associated with the high rainfall intensity periods of November-2003, March-2004, and May-2004. Given that the modified rainfall depth-intensity curves show that rainfall intensities were generally consistent throughout the entire study period, the drop in erosion rates must have been caused by a shift in the condition of the eroding surfaces. Qualitative observations suggest that the drop in erosion rates may have been caused by increased protection provided by re-vegetation of the road segments.
Sediment production—normalized by rainfall and slope— was inversely related to the vegetation cover of the road plots, road segments, and undisturbed hillslopes (Figure 1b). While the freshly-disturbed road plots had the lowest vegetation cover (1-3%), vegetation at the mid-point of the study period covered about 25-50% and 34-100% of the surface of the unpaved road segments and the undisturbed hillslopes, respectively. The lower vegetation cover of the freshly-disturbed road plots relative to that of the road segments and undisturbed hillslopes may be responsible for their higher average erosion rate (1.4 Mg ha-1 yr-1). It is difficult to distinguish the effect of vegetation cover in reducing sediment production rates from the effects of surface coarseness, as vegetation cover is auto-correlated with the surface particle-size distribution. While the median grain size of the surface of recently-disturbed plots was in the order of 1 mm, the median size for unpaved road segments and undisturbed hillslopes was in the order of 10-20 mm, respectively.
28

y = 7.16x1.5
R2 = 0.88
0.0
2.0
4.0
6.0
8.0
0.00 0.05 0.10 0.15 0.20 0.25
Slope (m m-1 )
Ave
rage
sedi
men
t pr
oduc
tion
(Mg
ha-1
yr-1
)
Unpaved road segments
1.E-05
1.E-04
1.E-03
1.E-02
1.E-01
1.E+00
1.E+01
0 25 50 75 100
Vegetation cover density (%)
Nor
mal
ized
sed
imen
t pr
oduc
tion
(Mg
ha-1
cm-1
m m
-1)
Road plotsRoad segmentsUndisturbed hillslopes
Figure 1a (left). Non-linear relationship between average road-segment slope and average annual sediment production from unpaved road segments in La Parguera. Figure 1b (right). Relationship between vegetation cover density and sediment production in La Parguera (in Mg) normalized by source area (in
ha), total rainfall (in cm), and slope (in decimal or m m-1).
Comparisons of the Parguera erosion data with that collected in St. John from 1998-2001 (Ramos-Scharrón and MacDonald, 2005, 2007b) show that while mean sediment production from undisturbed hillslopes on La Parguera is one-order of magnitude higher than on St. John, the unpaved roads on St. John erode at a rate that is one– to two-orders of magnitude higher than those in La Parguera (Table 1). The differences cannot be attributed to disparity in precipitation intensity, as analyses of modified rainfall depth-intensity curves show that rainfall in La Parguera (2003-2005) was slightly more intense than on St. John (1998-2001). The differences in erosion rates may be attributed to the effects of vehicular traffic. With the exception of abandoned roads, all roads on St. John were used by 10-300 vehicles per day and lacked any significant vegetation cover (Ramos-Scharrón and MacDonald, 2005), while blocked access prohibited vehicle traffic on vegetated road surfaces in La Parguera. The findings presented here support the hypotheses that sediment production from disturbed surfaces in dry tropical areas is strongly controlled by their degree of re-vegetation, and that this may be controlled by the presence or absence of vehicular traffic and the presence of enough soil moisture to support vegetation growth.
Table 1. Summary of average sediment production rates measured in
La Parguera-Puerto Rico and St. John-U.S. Virgin Islands. Sediment source Mean sediment production
(Mg ha-1 yr-1) La Parguera Hillslopes 0.11 Road plots 1.4 Road segments 1.1
St. John Hillslopes 0.01 Active road segments 64-110 Abandoned road segments 12
CONCLUSIONS
Sediment production rates were measured from undisturbed and disturbed surfaces in the dry tropical environment of La Parguera in southwestern Puerto Rico between 2003 and 2005. The
29
data showed that land disturbance for urban land development may increase sediment production rates by an order of magnitude relative to background sediment production rates. Sediment production rates from disturbed surfaces were controlled by the slope, vegetation cover density, and surface particle-size distribution. Results show a surprisingly complex relationship between rainfall and sediment production from unpaved road surfaces, with high sediment production rates at the onset of the study period followed by a sharp, one- to two-order of magnitude drop by the end of the study. This decline in sediment production from unpaved road surfaces lacking active vehicular traffic is attributed to increases in vegetation cover densities as time progressed throughout the study period. These results imply that in the absence of traffic, rainfall is still an indisputably important factor controlling sediment production as it provides the energy and means to induce erosion and sediment flux from eroding surfaces, but in this moisture-limited, semi-arid environment periods of high precipitation might also provoke a sharp reduction in sediment production by stimulating re-vegetation.
REFERENCES
Clark, J.J., Wilcock, P.W., 2000. Effects of land-use change on channel morphology in northeastern Puerto Rico. GSA Bulletin 112(12):1763-1777.
Gardner, T.A., Côte, I.M., Gill, J.A., Grant, A., Watkinson, A.R., 2003. Long-term region-wide declines in Caribbean corals. Science 301:958-960
U.S. Coral Reef Task Force, 2000. The National Action Plan to Conserve Coral Reefs. Washington, DC.
Rogers, C., 1990. Responses of coral reefs and reef organisms to sedimentation. Mar. Ecol. Prog. Ser. 62:185-202.
Goyal, M.R., 1988. Potential evapotranspiration for the south coast of Puerto Rico with the Hargreaves-Samani technique. Jrnl. Agric.-UPR 72(1):57-63.
MacDonald, L.H., Sampson R.W., Anderson, D.M., 2001. Runoff and road erosion at the plot and road segment scales, St. John, US Virgin Islands. Ea. Surf. Proc. Land. 26: 251-272.
Morelock, J., Ramírez, W.R., Bruckner, A.W., Carlo, M., 2001. Status of coral reefs southwest Puerto Rico. Carib. Jrnl. Sci. Special Publication, No. 4.
NOAA, 2002. Puerto Rico- Monthly normals of temperature, precipitation, and heating and cooling degree days, 1971-2000. Climatography of the U.S., No. 81. Asheville, N.C.
Ramos-Scharrón, C.E., MacDonald, L.H., 2007a. Development and application of a GIS-based sediment budget model. Journal Env. Mngt. 84, 157-172.
Ramos-Scharrón, C.E., MacDonald, L.H., 2007b. Measurement and prediction of erosion rates from natural and anthropogenic sources of sediment in St. John, U.S.V.I. Catena, 71: 250-266.
Ramos-Scharrón, C.E., MacDonald, L.H., 2005. Measurement and prediction of sediment production from unpaved roads, St. John, USVI. Ea. Surf. Proc. Land. 30: 1283-1304.
UNEP, 1994. Regional overview of land-based sources of pollution in the Wider Caribbean Region. CEP-Technical Report No. 33, 56 p.
Warne, A.G., Webb, R.M.T., Larsen, M.C., 2005. Water, sediment, and nutrient discharge characteristics in rivers of PR and their potential influence on coral reefs. USGS Sci. Inv. Report 2005-5206.
30
OCTOBER SEVENTH CARIBBEAN ISLANDS WATER RESOURCES CONGRESS
2007
The Caribbean Water Initiative (CARIWIN)
Alicia Suchorski1, Catherine Senecal2, and Chandra Madramootoo3
ABSTRACT: Water resources management is essential for sustainable growth and poverty reduction; it is also important for addressing such issues as gender equality, environmental sustainability, participatory decision-making, etc. A joint project between the Caribbean Institute for Meteorology and Hydrology and McGill University, was developed with the goal of implementing integrated water resources management in the three partner nations, Grenada, Guyana, and Jamaica. This will be achieved through strengthening the Caribbean Institute for Meteorology and Hydrology, a regional organization whose mandate is to provide training and capacity development in climatology and water management to the Caribbean Community and Common Market member states. Implementation will proceed at all levels of government. KEYWORDS: Integrated Water Resources Management, capacity-building, Grenada, Guyana, Jamaica
INTRODUCTION
Water resource management is central to sustainable and economic growth. The hydrologic extremes of drought and floods, coupled with pollution, affect Caribbean prosperity. At the local, national and regional levels in the Caribbean, water availability and variability contribute significantly to the risks people face every day in caring for their families and ensuring their livelihoods. The Caribbean Water Initiative (CARIWIN) is a collaborative project, designed jointly by the Caribbean Institute for Meteorology and Hydrology (CIMH), Caribbean partner governments, and McGill University’s Brace Centre for Water Resources Management (BCWRM) to address the complex challenges of water management in the Caribbean region. CARIWIN’s goal is to increase the capacity of Caribbean countries to deliver sustainable and equitable integrated water resources management (IWRM). The Global Water Partnership defines IWRM as “a process that promotes the coordinated management of water, land and related resources, in order to maximize equitable economic and social development without compromising the sustainability of vital ecosystems” (n.d.). In order to achieve the goal of IWRM in the Caribbean, CARIWIN’s proposes to strengthen the CIMH, a regional organization whose mandate is to provide training and capacity development in climatology and water management to Caribbean Community and Common Market 1 Graduate Student, Brace Centre for Water Resources Management, McGill University, Canada. E-mail: [email protected] 2 CARIWIN C1 Project Coordinator. E-mail: [email protected] 3 CARIWIN C1 Project Director, Dean of the Faculty of Agricultural and Environmental Sciences, McGill University. E-mail: [email protected]
31
(CARICOM) member states. By integrating the IWRM approach into CIMH training and capacity development initiatives, the project will have a significant multiplier effect throughout the Caribbean. Through CIMH, CARIWIN will pilot capacity building initiatives in IWRM, aimed at the national, local government and community levels in Jamaica, Guyana and Grenada. The CARIWIN project will increase the relevance and reach of CIMH while developing, testing and disseminating new capacity development and community governance models in IWRM in distinctly different socio-economic, cultural, environmental, jurisdictional and physiographic settings of three CARICOM countries. CARIWIN will be implemented regionally through the CIMH and its focal point institutions in each of the three targeted countries: the Water Resources Authority (WRA) under the Ministry of Water and Housing in Jamaica; the Hydrometeorological Service under Guyana’s Ministry of Agriculture; and the Land and Water Division of Grenada’s Ministry of Agriculture. Beyond these immediate partners, with whom CIMH and BCWRM will collaborate directly to plan and manage the project, CARIWIN will build the capacity of key water technicians, decision-makers and other water management stakeholders, including national departments of women’s affairs, to increase their understanding and application of IWRM and to integrate issues of gender equality, environmental sustainability and improved governance models into national policy dialogue and practice on water management. At the local government and community level, CARIWIN will work with selected, rural communities in each country, along with their local government interlocutors (Parish Councils in Jamaica and Regional Democratic Councils (RDCs) in Guyana), to strengthen existing community water-users groups and to test new community governance models which address IWRM principles.
REFERENCES
CARIWIN Project Implementation Plan. Prepared jointly by McGill University and CIMH. January 2007.
GWP. N.d. ToolBox – Why and How IWRM. Accessed July 23, 2007 from
http://www.gwptoolbox.org/index.cfm/site/465EBFAD-C0A3-9DDA-589E7C3A28B5B62E/pageid/46F480C6-9E54-8194-64583214C91B3114/index.cfm
32
ADVANCES IN WATER SANITIZATION
33
OCTOBER SEVENTH CARIBBEAN ISLANDS WATER RESOURCES CONGRESS
2007
HYDRAULIC AND BIOCHEMICAL CHARACTERISTICS OF COAL COMBUSTION BYPRODUCTS AGGREGATES AS AN ALTERNATIVE DAILY
COVER FOR LANDFILLS
Arelys Fonseca1, Sangchul Hwang2,*, Zalleris Escobar3 ABSTRACT (12 pt.): This research was conducted to develop a reliable and reactive alternative daily cover that would reduce associated landfill costs and conserve natural soil environments. Hydraulic and biochemical properties of aggregates as an alternative daily cover were compared with those of a conventional inorganic soil daily cover. Results of this study indicated that use of coal combustion byproducts aggregates for an alternative daily cover in lieu of soil could enhance landfill operations and environmental control. The coal combustion byproducts aggregates would be easily applied, saving landfill capacity, decreasing requirements for soil, and augmenting leachate control. KEYWORDS: Coal Combustion Byproducts, Daily Cover, Landfills, Leachate
INTRODUCTION Alternative daily covers (ADCs) have been studied with synthetic foams (Kramer et al., 1985) and geotextile sheets (DeMello, 1990). The former is sprayed onto a landfill face with high pressure spray equipment. Consequently, the application tends to blow away the waste materials. The latter is applied as a daily cover by spreading canvas-like geotextiles over the working face of a landfill. One major disadvantage of such sheets is their expenses in addition to their structural strengths. The demand for recycled products as ADCs has increased recently. As such, a method to develop an ADC using wastewater sludge and certain portions of municipal garbage was studied (Myers, 2007). However, care should be given to the biochemical characteristics of sludge, which may cause pathogenic disease and aesthetic problems. Aggregates of coal combustion byproducts (CCPs) could be reutilized as an ADC. They are a mixture of fly and bed ashes with water. The sandy gravel characteristics of the aggregates would provide a better structural integrity for post-closure land use. The cementitious and adsorbing characteristics will reduces the leaching of heavy metals from the wastes (Erol et al., 2005). Lin and Yang (2002) studied the adsorption capacity of bed ash for heavy metals, nitrogen, phosphorus, and chemical oxygen demand, and concluded that bed ash could be used as an efficient adsorption material for pollutant removal from landfill leachate. In addition, unlike other ADCs such as synthetic foams and sheets, the material is useful in either cold or hot climates. The purpose of this research was to develop a reliable and reactive ADC that would reduce associated landfill costs and conserve natural soil environments. It was these ends that the laboratory study has been developed to compare hydraulic and biochemical properties of aggregates ADC with a conventional inorganic soil daily cover.
1 Department of Chemical Engineering, University of Puerto Rico at Mayaguez 2 Department of Civil Engineering and Surveying, University of Puerto Rico at Mayaguez (*: corresponding author) 3 Department of Civil Engineering and Surveying, University of Puerto Rico at Mayaguez
34
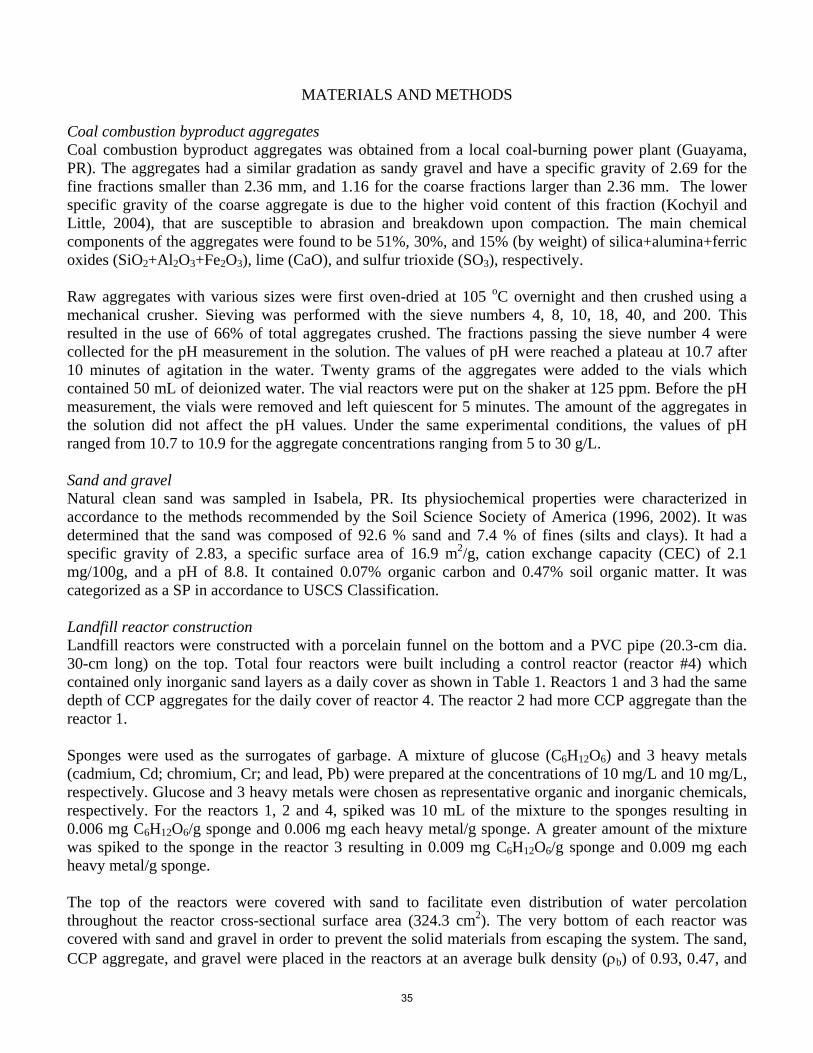
MATERIALS AND METHODS
Coal combustion byproduct aggregates Coal combustion byproduct aggregates was obtained from a local coal-burning power plant (Guayama, PR). The aggregates had a similar gradation as sandy gravel and have a specific gravity of 2.69 for the fine fractions smaller than 2.36 mm, and 1.16 for the coarse fractions larger than 2.36 mm. The lower specific gravity of the coarse aggregate is due to the higher void content of this fraction (Kochyil and Little, 2004), that are susceptible to abrasion and breakdown upon compaction. The main chemical components of the aggregates were found to be 51%, 30%, and 15% (by weight) of silica+alumina+ferric oxides (SiO2+Al2O3+Fe2O3), lime (CaO), and sulfur trioxide (SO3), respectively. Raw aggregates with various sizes were first oven-dried at 105 oC overnight and then crushed using a mechanical crusher. Sieving was performed with the sieve numbers 4, 8, 10, 18, 40, and 200. This resulted in the use of 66% of total aggregates crushed. The fractions passing the sieve number 4 were collected for the pH measurement in the solution. The values of pH were reached a plateau at 10.7 after 10 minutes of agitation in the water. Twenty grams of the aggregates were added to the vials which contained 50 mL of deionized water. The vial reactors were put on the shaker at 125 ppm. Before the pH measurement, the vials were removed and left quiescent for 5 minutes. The amount of the aggregates in the solution did not affect the pH values. Under the same experimental conditions, the values of pH ranged from 10.7 to 10.9 for the aggregate concentrations ranging from 5 to 30 g/L. Sand and gravel Natural clean sand was sampled in Isabela, PR. Its physiochemical properties were characterized in accordance to the methods recommended by the Soil Science Society of America (1996, 2002). It was determined that the sand was composed of 92.6 % sand and 7.4 % of fines (silts and clays). It had a specific gravity of 2.83, a specific surface area of 16.9 m2/g, cation exchange capacity (CEC) of 2.1 mg/100g, and a pH of 8.8. It contained 0.07% organic carbon and 0.47% soil organic matter. It was categorized as a SP in accordance to USCS Classification.
Landfill reactor construction Landfill reactors were constructed with a porcelain funnel on the bottom and a PVC pipe (20.3-cm dia. 30-cm long) on the top. Total four reactors were built including a control reactor (reactor #4) which contained only inorganic sand layers as a daily cover as shown in Table 1. Reactors 1 and 3 had the same depth of CCP aggregates for the daily cover of reactor 4. The reactor 2 had more CCP aggregate than the reactor 1. Sponges were used as the surrogates of garbage. A mixture of glucose (C6H12O6) and 3 heavy metals (cadmium, Cd; chromium, Cr; and lead, Pb) were prepared at the concentrations of 10 mg/L and 10 mg/L, respectively. Glucose and 3 heavy metals were chosen as representative organic and inorganic chemicals, respectively. For the reactors 1, 2 and 4, spiked was 10 mL of the mixture to the sponges resulting in 0.006 mg C6H12O6/g sponge and 0.006 mg each heavy metal/g sponge. A greater amount of the mixture was spiked to the sponge in the reactor 3 resulting in 0.009 mg C6H12O6/g sponge and 0.009 mg each heavy metal/g sponge. The top of the reactors were covered with sand to facilitate even distribution of water percolation throughout the reactor cross-sectional surface area (324.3 cm2). The very bottom of each reactor was covered with sand and gravel in order to prevent the solid materials from escaping the system. The sand, CCP aggregate, and gravel were placed in the reactors at an average bulk density (ρb) of 0.93, 0.47, and
35
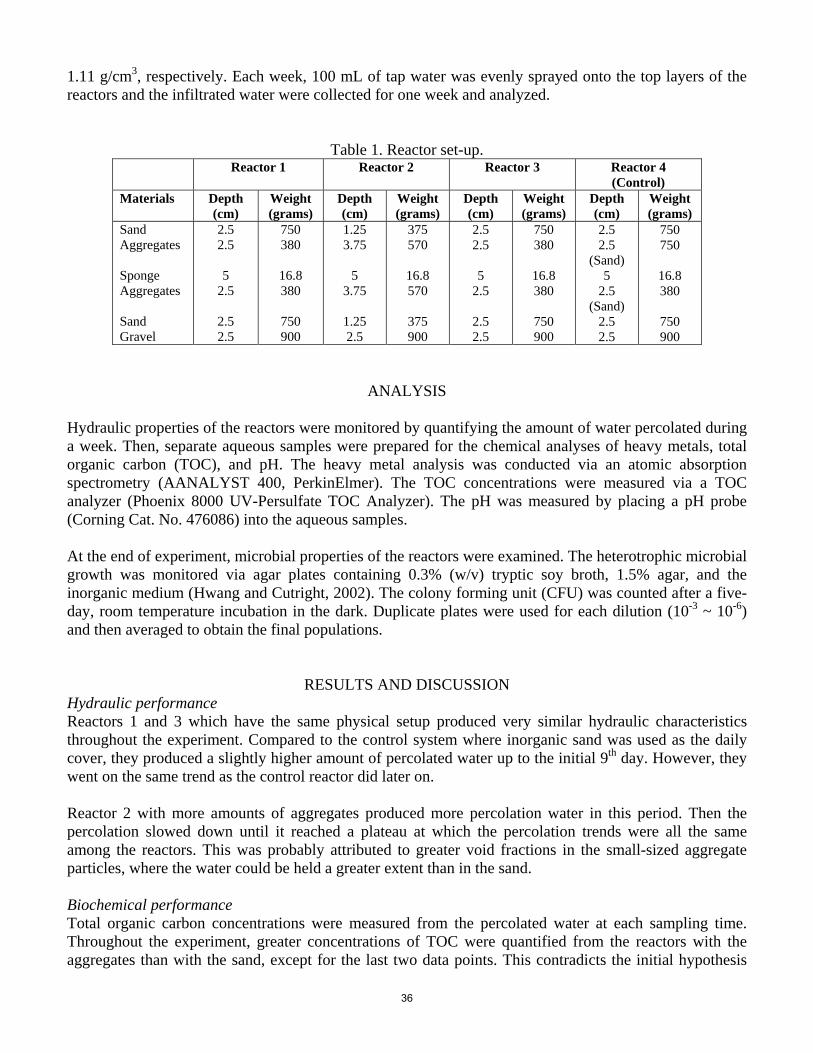
1.11 g/cm3, respectively. Each week, 100 mL of tap water was evenly sprayed onto the top layers of the reactors and the infiltrated water were collected for one week and analyzed.
Table 1. Reactor set-up. Reactor 1 Reactor 2 Reactor 3 Reactor 4
(Control) Materials Depth
(cm) Weight (grams)
Depth (cm)
Weight (grams)
Depth (cm)
Weight (grams)
Depth (cm)
Weight (grams)
Sand Aggregates Sponge Aggregates Sand Gravel
2.5 2.5
5
2.5
2.5 2.5
750 380
16.8 380
750 900
1.25 3.75
5
3.75
1.25 2.5
375 570
16.8 570
375 900
2.5 2.5
5
2.5
2.5 2.5
750 380
16.8 380
750 900
2.5 2.5
(Sand) 5
2.5 (Sand)
2.5 2.5
750 750
16.8 380
750 900
ANALYSIS Hydraulic properties of the reactors were monitored by quantifying the amount of water percolated during a week. Then, separate aqueous samples were prepared for the chemical analyses of heavy metals, total organic carbon (TOC), and pH. The heavy metal analysis was conducted via an atomic absorption spectrometry (AANALYST 400, PerkinElmer). The TOC concentrations were measured via a TOC analyzer (Phoenix 8000 UV-Persulfate TOC Analyzer). The pH was measured by placing a pH probe (Corning Cat. No. 476086) into the aqueous samples. At the end of experiment, microbial properties of the reactors were examined. The heterotrophic microbial growth was monitored via agar plates containing 0.3% (w/v) tryptic soy broth, 1.5% agar, and the inorganic medium (Hwang and Cutright, 2002). The colony forming unit (CFU) was counted after a five-day, room temperature incubation in the dark. Duplicate plates were used for each dilution (10-3 ~ 10-6) and then averaged to obtain the final populations.
RESULTS AND DISCUSSION Hydraulic performance Reactors 1 and 3 which have the same physical setup produced very similar hydraulic characteristics throughout the experiment. Compared to the control system where inorganic sand was used as the daily cover, they produced a slightly higher amount of percolated water up to the initial 9th day. However, they went on the same trend as the control reactor did later on. Reactor 2 with more amounts of aggregates produced more percolation water in this period. Then the percolation slowed down until it reached a plateau at which the percolation trends were all the same among the reactors. This was probably attributed to greater void fractions in the small-sized aggregate particles, where the water could be held a greater extent than in the sand. Biochemical performance Total organic carbon concentrations were measured from the percolated water at each sampling time. Throughout the experiment, greater concentrations of TOC were quantified from the reactors with the aggregates than with the sand, except for the last two data points. This contradicts the initial hypothesis
36
that less concentrations of TOC would be released from the aggregate-amended reactors due to their sorptive properties. Microbial activities were believed to contribute to this phenomenon.
0
20
40
60
80
100
120
0 20 40 60 80 100 120
Time (days)
Perc
olat
ed w
ater
vol
ume
(mL)
Reactor 1Reactor 2Reactor 3Reactor 4
Figure 1. The volume of water percolated through the column reactors.
A significantly greater TOC was released from the reactor 3 where higher concentration of glucose was spiked initially. When more aggregate was embedded in the system, higher concentrations of TOC were observed initially until the 20th day. The TOC profiles showed a similarity for the aggregate-amended reactors. Then after the 80th day, less TOC concentrations were monitored for the reactors amended with more aggregates.
Cumulative mass of TOC in the percolated water
0.0
5.0
10.0
15.0
20.0
25.0
30.0
0 20 40 60 80 100 120
Sampling duration (days)
Cum
ulat
ive
TOC
(mg) Reactor #1
Reactor #2Reactor #3Reactor #4
Figure 2. Trend of total organic carbon concentrations.
37
Analysis of heavy metals is still pending. The pH values of 5-day samples ranged from 7.2 to 7.5 for all 4 reactors. However, after 5 days, pH was stabilized at the values of 8.5 and 7.7 for the control reactor with sand and other reactors with CCP aggregates, respectively. The pH value from the control reactor was very similar to that measured in a slurry system (i.e., 8.8) by the method recommended by Soil Science Society of America (2002). However, pH values in the percolated water from the CCP aggregates-amended reactors were much lower than the values (i.e., 10.7 to 10.9) initially measured in the batch agitation method aforementioned. This would be attributed to shorter contact time between the water and the aggregates in the column reactor systems thereby causing a mass transfer limitation of hydroxide ions into the solution. Microbial activities Total heterotrophic bacteria counts were assessed to verify the assumption that greater microbial activities in the aggregate-amended reactors than in the control reactor. Results indicated that more than 1x10⁵ CFU were present regardless of the reactor types. However, more total heterotrophic bacteria (THB) were counted in the percolated water from the aggregate-amended reactors compared to those from the control reactor. In addition, more CFU were counted in the reactor which had more aggregates (i.e., reactor 2 vs. reactor 1), implying a better microbial environments provided by the aggregates (i.e., surface area, intraparticle pores, etc.). The CFU of the reactor 2 was not much different from that of the reactor 3, indicating negligible toxic effect by the heavy metals inoculated.
REFERENCES DeMello S.R. (1990). “Method and apparatus for applying a daily cover to dumped waste”, US Patent
4,909,667. Erol M., Kucukbayrak S., Ersoy-Mericboyu A., Ulubas T. (2005). “Removal of Cu2+ and Pb2+ in
aqueous solutions by fly ash.” Energy Conservation and Management, 46, 1319-1331. Hwang S., Cutright T. (2002), “Biodegradability of aged pyrene and phenanthrene in a natural soil.”
Chemosphere, 47, 898-899. Kochyil S., Little D.N. (2004), “Physical, Mechanical, and Chemical Evaluation of Manufactured
Aggregate”, Technical Report to AES, LLC. Kramer F., Skornscheck T.E., Struss E. (1985). “Apparatus and method for applying a foam layer to cover
and seal dumped waste”, US Patent 4,519,338. Lin C.Y., Yang D.H. (2002). “Removal of Pollutants from Wastewater by Coal Bottom Ash.” Journal of
Environmental Science and Health, 37(8), 1509-1522. Myers R.B. (2007). “Method to produce landfill daily cover from sewer sludge and MSW”, US Patent
7,195,425. Soil Science Society of America, 1996, Methods of Soil Analysis: Part 3. Chemical Methods, D.L. Sparks
(ed), Soil Science Society of America Inc., Wisconsin. Soil Science Society of America,2002, Methods of Soil Analysis: Part 4. Physical Methods, H. Dane and
G. Clarke Topp (eds), Soil Science Society of America Inc., Wisconsin. Tchobanoglous G., Kreith F. (2002). Handbook of solid waste management, second edition, McGraw-
Hill.
38
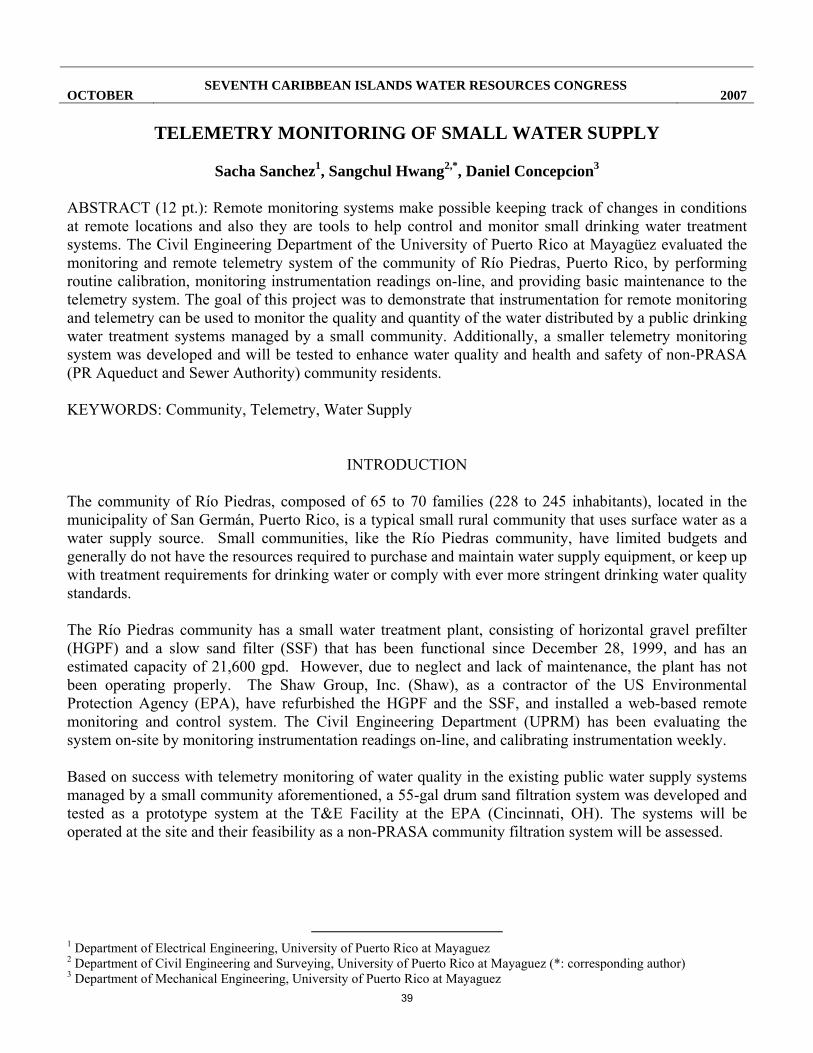
OCTOBER SEVENTH CARIBBEAN ISLANDS WATER RESOURCES CONGRESS
2007
TELEMETRY MONITORING OF SMALL WATER SUPPLY
Sacha Sanchez1, Sangchul Hwang2,*, Daniel Concepcion3 ABSTRACT (12 pt.): Remote monitoring systems make possible keeping track of changes in conditions at remote locations and also they are tools to help control and monitor small drinking water treatment systems. The Civil Engineering Department of the University of Puerto Rico at Mayagüez evaluated the monitoring and remote telemetry system of the community of Río Piedras, Puerto Rico, by performing routine calibration, monitoring instrumentation readings on-line, and providing basic maintenance to the telemetry system. The goal of this project was to demonstrate that instrumentation for remote monitoring and telemetry can be used to monitor the quality and quantity of the water distributed by a public drinking water treatment systems managed by a small community. Additionally, a smaller telemetry monitoring system was developed and will be tested to enhance water quality and health and safety of non-PRASA (PR Aqueduct and Sewer Authority) community residents. KEYWORDS: Community, Telemetry, Water Supply
INTRODUCTION The community of Río Piedras, composed of 65 to 70 families (228 to 245 inhabitants), located in the municipality of San Germán, Puerto Rico, is a typical small rural community that uses surface water as a water supply source. Small communities, like the Río Piedras community, have limited budgets and generally do not have the resources required to purchase and maintain water supply equipment, or keep up with treatment requirements for drinking water or comply with ever more stringent drinking water quality standards. The Río Piedras community has a small water treatment plant, consisting of horizontal gravel prefilter (HGPF) and a slow sand filter (SSF) that has been functional since December 28, 1999, and has an estimated capacity of 21,600 gpd. However, due to neglect and lack of maintenance, the plant has not been operating properly. The Shaw Group, Inc. (Shaw), as a contractor of the US Environmental Protection Agency (EPA), have refurbished the HGPF and the SSF, and installed a web-based remote monitoring and control system. The Civil Engineering Department (UPRM) has been evaluating the system on-site by monitoring instrumentation readings on-line, and calibrating instrumentation weekly. Based on success with telemetry monitoring of water quality in the existing public water supply systems managed by a small community aforementioned, a 55-gal drum sand filtration system was developed and tested as a prototype system at the T&E Facility at the EPA (Cincinnati, OH). The systems will be operated at the site and their feasibility as a non-PRASA community filtration system will be assessed.
1 Department of Electrical Engineering, University of Puerto Rico at Mayaguez 2 Department of Civil Engineering and Surveying, University of Puerto Rico at Mayaguez (*: corresponding author) 3 Department of Mechanical Engineering, University of Puerto Rico at Mayaguez
39
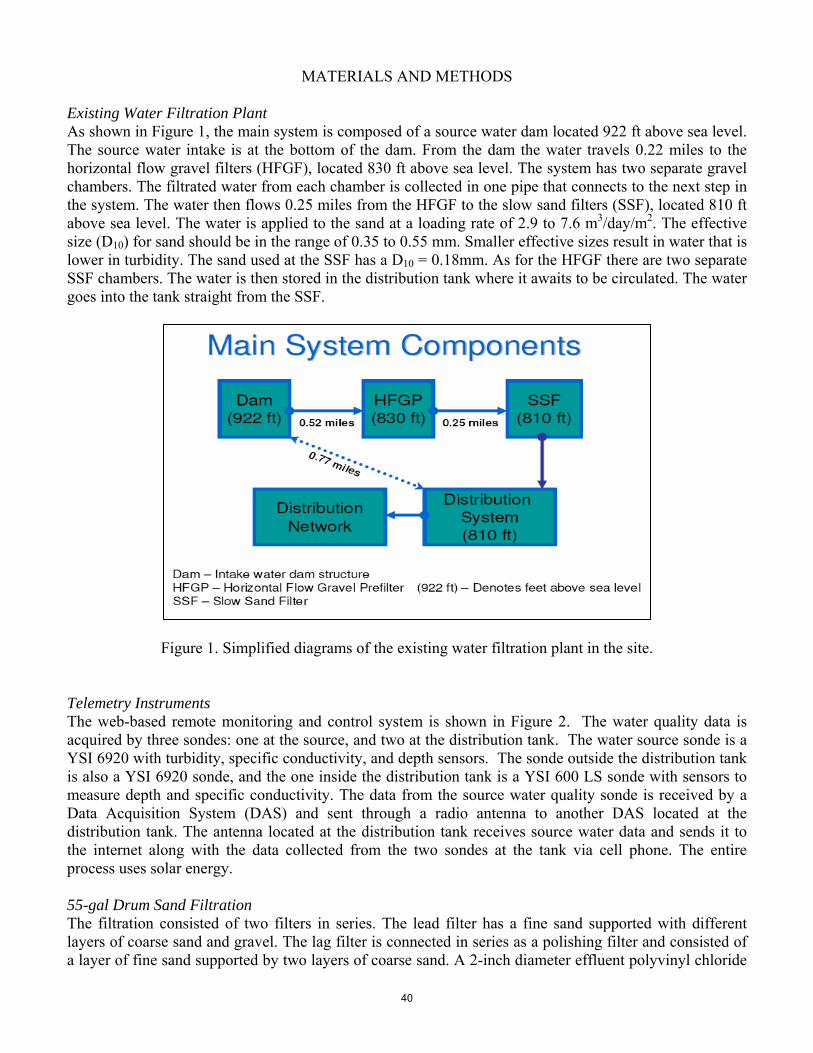
MATERIALS AND METHODS Existing Water Filtration Plant As shown in Figure 1, the main system is composed of a source water dam located 922 ft above sea level. The source water intake is at the bottom of the dam. From the dam the water travels 0.22 miles to the horizontal flow gravel filters (HFGF), located 830 ft above sea level. The system has two separate gravel chambers. The filtrated water from each chamber is collected in one pipe that connects to the next step in the system. The water then flows 0.25 miles from the HFGF to the slow sand filters (SSF), located 810 ft above sea level. The water is applied to the sand at a loading rate of 2.9 to 7.6 m3/day/m2. The effective size (D10) for sand should be in the range of 0.35 to 0.55 mm. Smaller effective sizes result in water that is lower in turbidity. The sand used at the SSF has a D10 = 0.18mm. As for the HFGF there are two separate SSF chambers. The water is then stored in the distribution tank where it awaits to be circulated. The water goes into the tank straight from the SSF.
Figure 1. Simplified diagrams of the existing water filtration plant in the site.
Telemetry Instruments The web-based remote monitoring and control system is shown in Figure 2. The water quality data is acquired by three sondes: one at the source, and two at the distribution tank. The water source sonde is a YSI 6920 with turbidity, specific conductivity, and depth sensors. The sonde outside the distribution tank is also a YSI 6920 sonde, and the one inside the distribution tank is a YSI 600 LS sonde with sensors to measure depth and specific conductivity. The data from the source water quality sonde is received by a Data Acquisition System (DAS) and sent through a radio antenna to another DAS located at the distribution tank. The antenna located at the distribution tank receives source water data and sends it to the internet along with the data collected from the two sondes at the tank via cell phone. The entire process uses solar energy. 55-gal Drum Sand Filtration The filtration consisted of two filters in series. The lead filter has a fine sand supported with different layers of coarse sand and gravel. The lag filter is connected in series as a polishing filter and consisted of a layer of fine sand supported by two layers of coarse sand. A 2-inch diameter effluent polyvinyl chloride
40
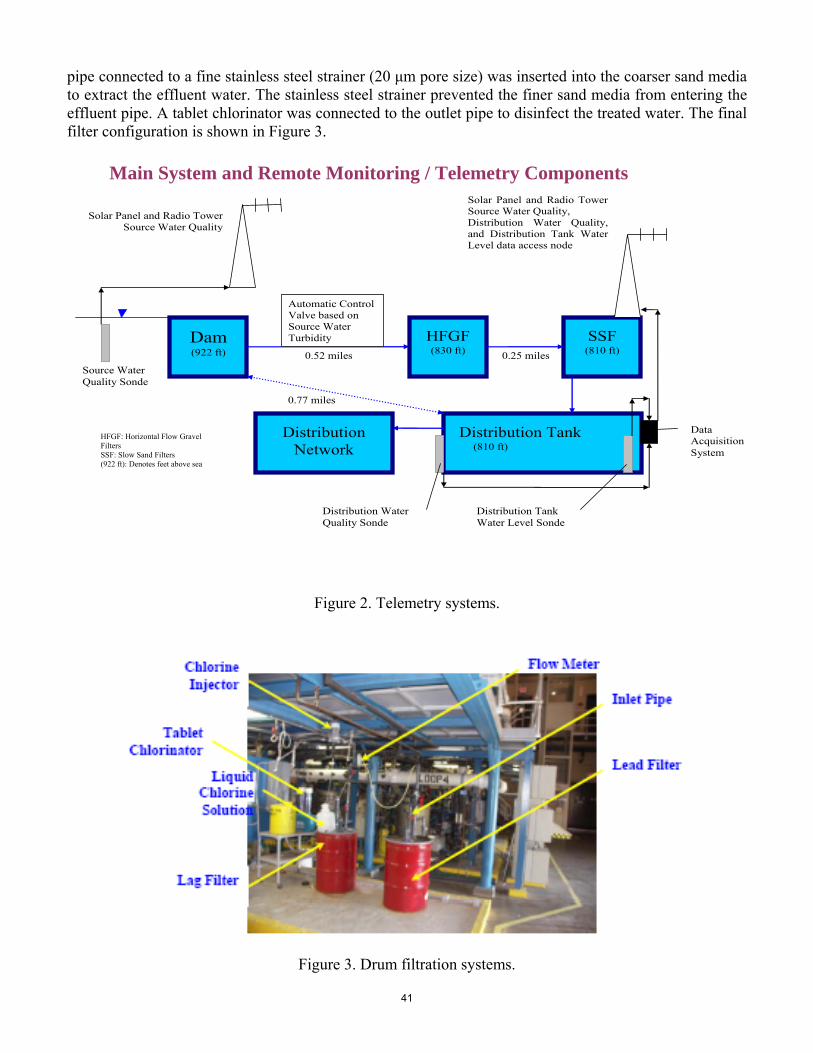
pipe connected to a fine stainless steel strainer (20 μm pore size) was inserted into the coarser sand media to extract the effluent water. The stainless steel strainer prevented the finer sand media from entering the effluent pipe. A tablet chlorinator was connected to the outlet pipe to disinfect the treated water. The final filter configuration is shown in Figure 3.
Figure 2. Telemetry systems.
Figure 3. Drum filtration systems.
Solar Panel and Radio Tower Source Water Quality, Distribution Water Quality, and Distribution Tank Water Level data access node
Source Water Quality Sonde
Solar Panel and Radio Tower Source Water Quality
Distribution Tank (810 ft)
Dam (922 ft) 0.52 miles
HFGF (830 ft)
Automatic Control Valve based on Source Water Turbidity SSF
(810 ft) 0.25 miles
Distribution Tank Water Level Sonde
Distribution Water Quality Sonde
Distribution Network
Data Acquisition System
0.77 miles
Main System and Remote Monitoring / Telemetry Components
HFGF: Horizontal Flow Gravel Filters SSF: Slow Sand Filters (922 ft): Denotes feet above sea
41

RESULTS AND DISCUSSION Existing filtration systems Monitored were the depth, turbidity, and specific conductivity at the source water and distribution tank using multi-probe sondes that collect data continuously and can be viewed remotely over the internet via YSI EcoNet site. Figure 4 shows turbidity of water telemetrically monitored, for examples.
Figure 4a. Turbidity (in NTU) of source water Figure 4b. Turbidity (in NTU) of distribution water 55-gal drum filter systems Two 55-gal drum filters in series with the final filter having a finer sand media were tested at 1.0 gpm using feed water at the T&E Facility in EPA. Results showed that the average influent turbidity was 5.78 NTU and the average effluent turbidity achieved for pre-chlorination and postchlorination samples were 0.79 NTU and 0.83 NTU, respectively. The final filtration configuration recommended for field evaluation would consist of three identically constructed drum filters arranged in parallel and filled with sand media as specified for the final filter configuration. The drums would be valved such that two drums would be online at all times while one drum would be placed in a backwash cycle. The rotation of the drums would be performed automatically using a timer. A tablet chlorinator and a liquid dosage chlorinator should both be evaluated in the field. This configuration is expected to yield approximately 1,400 gallons of drinking water per day. REFERENCES Cornwell, David A., and Mackenzie L. Davis (1998). “Introduction to Environmental Engineering”. 3rd
ed., McGraw-Hill.
42
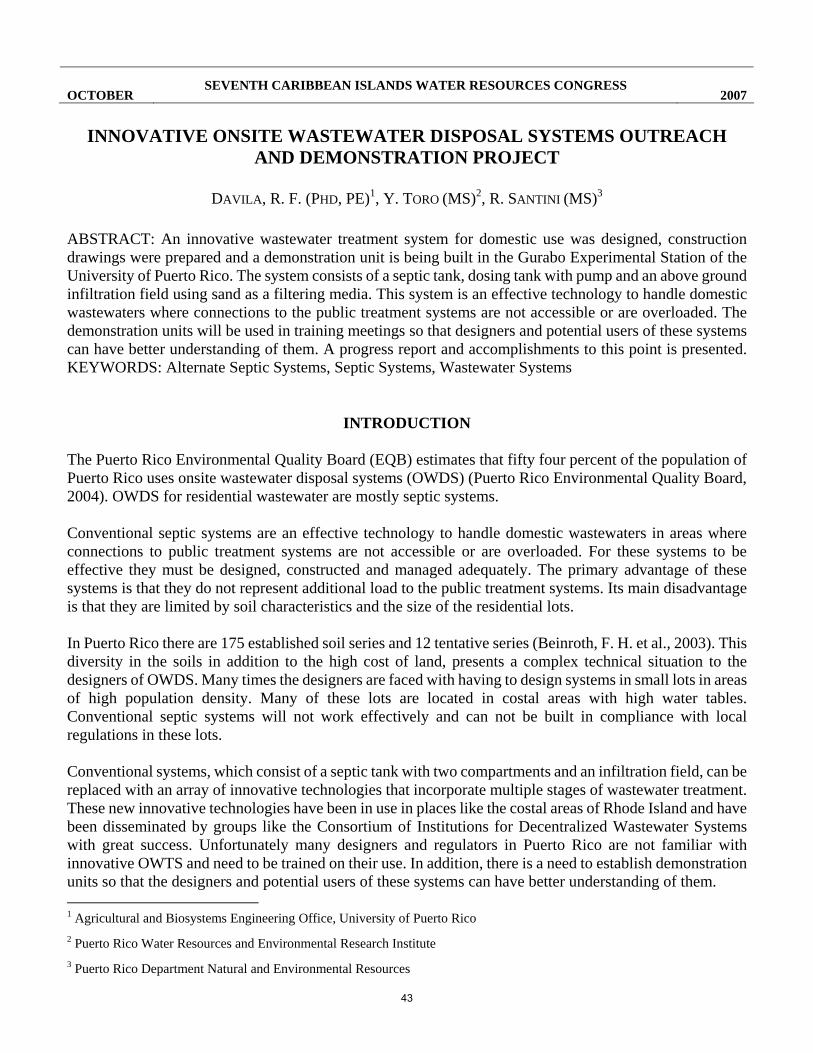
OCTOBER SEVENTH CARIBBEAN ISLANDS WATER RESOURCES CONGRESS
2007
INNOVATIVE ONSITE WASTEWATER DISPOSAL SYSTEMS OUTREACH AND DEMONSTRATION PROJECT
DAVILA, R. F. (PHD, PE)1, Y. TORO (MS)2, R. SANTINI (MS)3
ABSTRACT: An innovative wastewater treatment system for domestic use was designed, construction drawings were prepared and a demonstration unit is being built in the Gurabo Experimental Station of the University of Puerto Rico. The system consists of a septic tank, dosing tank with pump and an above ground infiltration field using sand as a filtering media. This system is an effective technology to handle domestic wastewaters where connections to the public treatment systems are not accessible or are overloaded. The demonstration units will be used in training meetings so that designers and potential users of these systems can have better understanding of them. A progress report and accomplishments to this point is presented. KEYWORDS: Alternate Septic Systems, Septic Systems, Wastewater Systems
INTRODUCTION
The Puerto Rico Environmental Quality Board (EQB) estimates that fifty four percent of the population of Puerto Rico uses onsite wastewater disposal systems (OWDS) (Puerto Rico Environmental Quality Board, 2004). OWDS for residential wastewater are mostly septic systems.
Conventional septic systems are an effective technology to handle domestic wastewaters in areas where connections to public treatment systems are not accessible or are overloaded. For these systems to be effective they must be designed, constructed and managed adequately. The primary advantage of these systems is that they do not represent additional load to the public treatment systems. Its main disadvantage is that they are limited by soil characteristics and the size of the residential lots.
In Puerto Rico there are 175 established soil series and 12 tentative series (Beinroth, F. H. et al., 2003). This diversity in the soils in addition to the high cost of land, presents a complex technical situation to the designers of OWDS. Many times the designers are faced with having to design systems in small lots in areas of high population density. Many of these lots are located in costal areas with high water tables. Conventional septic systems will not work effectively and can not be built in compliance with local regulations in these lots.
Conventional systems, which consist of a septic tank with two compartments and an infiltration field, can be replaced with an array of innovative technologies that incorporate multiple stages of wastewater treatment. These new innovative technologies have been in use in places like the costal areas of Rhode Island and have been disseminated by groups like the Consortium of Institutions for Decentralized Wastewater Systems with great success. Unfortunately many designers and regulators in Puerto Rico are not familiar with innovative OWTS and need to be trained on their use. In addition, there is a need to establish demonstration units so that the designers and potential users of these systems can have better understanding of them. 1 Agricultural and Biosystems Engineering Office, University of Puerto Rico 2 Puerto Rico Water Resources and Environmental Research Institute 3 Puerto Rico Department Natural and Environmental Resources
43

CONSTRUCTION DRAWINGS
The construction drawings for the demonstration alternate septic system are illustrated bellow. In areas where the groundwater level is high, the septic tank and the infiltration field can be put above ground, as illustrated in Figure 1. The wastewater is collected in the pumping chamber and transported to the septic tank. The pumping chamber is in Figure 2. In this arrangement, the effluent from the septic tank flows by gravity to the drainage field in Figure 3. A float switch has been installed in the pumping chamber so that the system operates automatically.
The effluent from the septic tank is distributed in the drainage field by means of a manifold of PVC pipe and diffusers as seen in Figures 3 and 4. The drainage field consists of a sand bed with a minimum depth of 30 inches. Perforated plastic pipe is laid on the bottom of the sand bed so that air can be injected to clean the sand. The lay out of the air injection system is shown in Figure 5.
Figure 1. Alternative septic system.
44
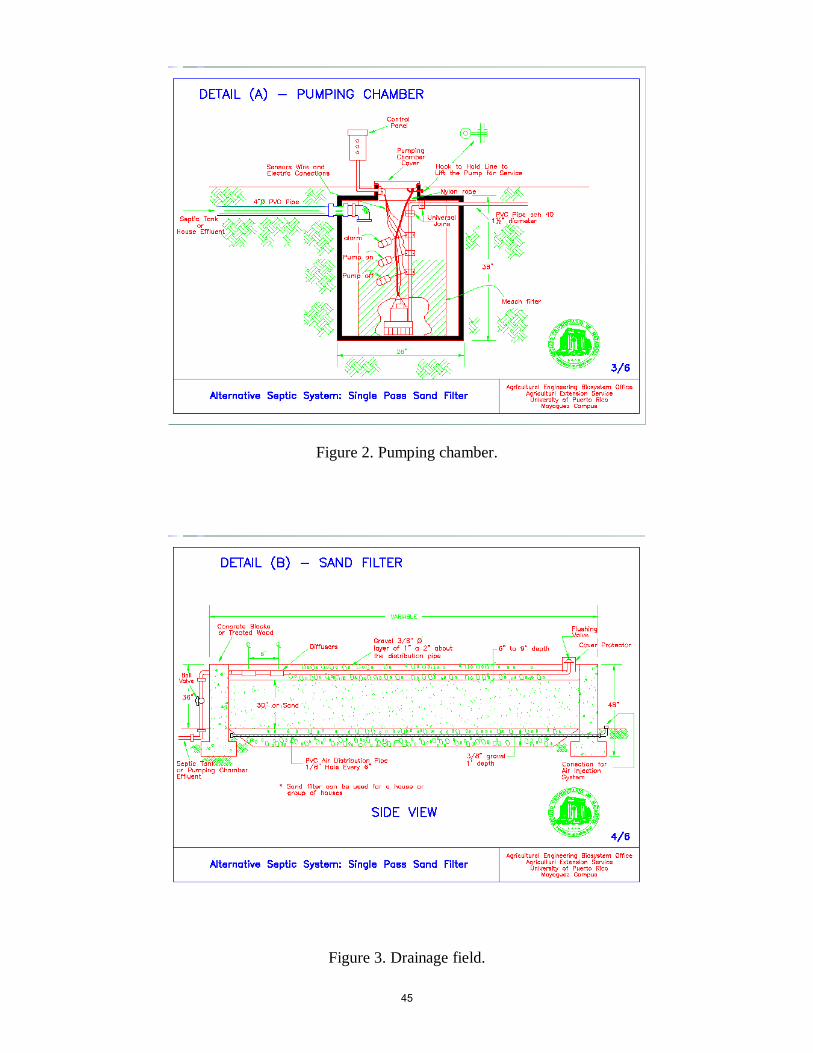
Figure 2. Pumping chamber.
Figure 3. Drainage field.
45
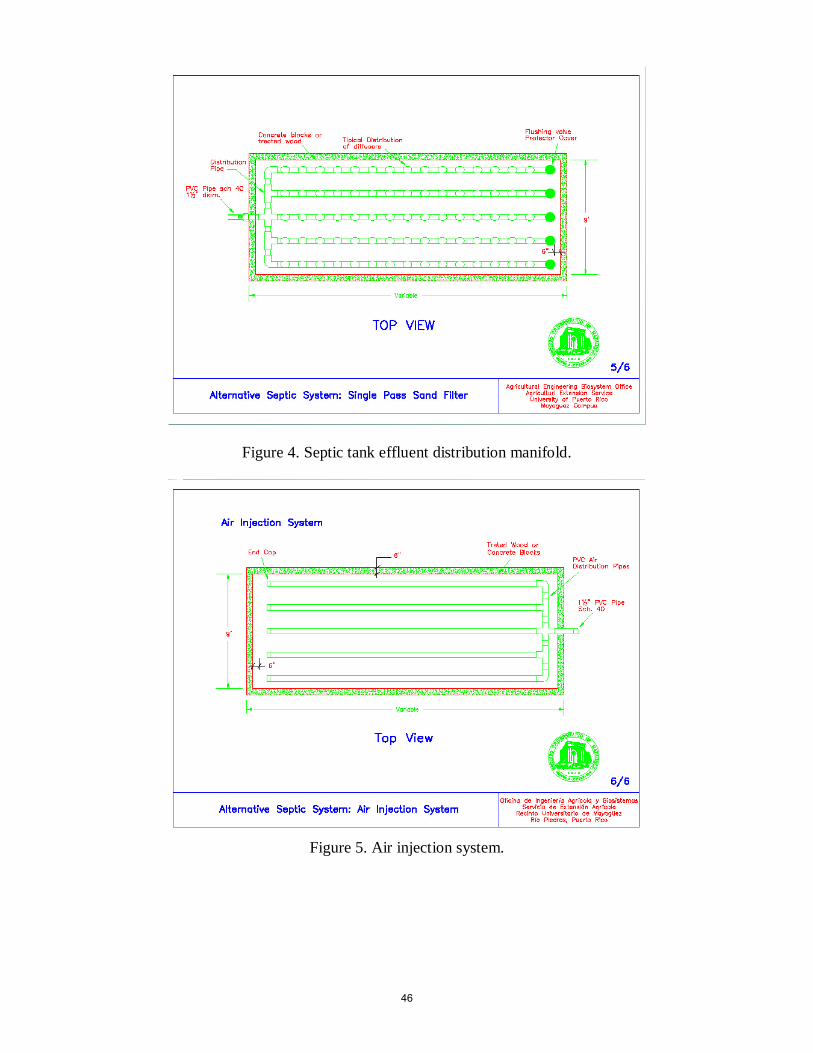
Figure 4. Septic tank effluent distribution manifold.
Figure 5. Air injection system.
46

REFERENCES
Beinroth, F. H., R. J. Engel, J. L. Lugo, C. L. Santiago, S. Ríos and G. Brannon, Updated Taxonomic Classification of the Soils of Puerto Rico, 2002, Bulletin 303, Agricultural Experiment Station, University of Puerto Rico, February 2003.
Puerto Rico Environmental Quality Board. Underground Injection Control Program (UIC) Water Quality Division. Presentation in the Workshop: Decentralized Wastewater Systems for Puerto Rico, Río Piedras, Puerto Rico, December 2, 2004.
47
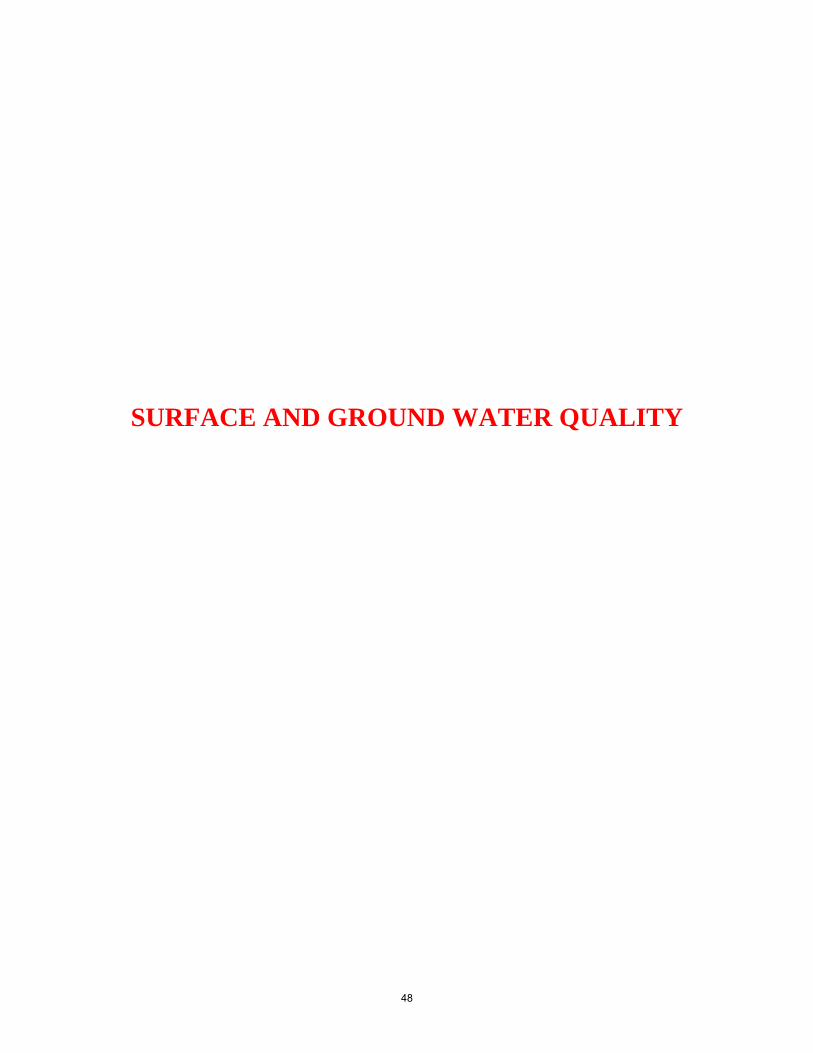
SURFACE AND GROUND WATER QUALITY
48

OCTOBER SEVENTH CARIBBEAN ISLANDS WATER RESOURCES CONGRESS
2007
GROUND-WATER LEVELS IN PUERTO RICO, 1987-2006
Ronald T. Richards1
ABSTRACT
A monthly index of ground-water levels in Puerto Rico from 1987 to 2006 was prepared. The data was collected by the U.S. Geological Survey (USGS). The criteria for the data selection were that the ground-water station had more than 150 water levels and was visited in 2006. The index shows ten years of falling ground-water levels followed by ten years of rising ground-water levels. The most important recharge events were Hurricane Hortense in 1996, Hurricane Georges in 1998, and the November 2003 rain event. Low levels of the index are associated with droughts and consequently water rationing. The index rises rapidly during intense rainfall events. High levels of the index are associated with floods and landslides. Indices were also prepared for the two most important aquifers on the island—the North Coast Limestone Aquifer System and the South Coastal Plain Alluvial Aquifer. The index for the South Coastal Plain Alluvial Aquifer is flashier than for the North Coast Limestone Aquifer System. The South Coastal Plain Alluvial Aquifer index rises rapidly during recharge events but then also falls rapidly. The greatest divergence between the indices for the two aquifers occurred in the first few months of 2003 when ground-water levels were falling rapidly in the south while they were holding steady in the north. It is important to note that while overall ground-water levels in Puerto Rico have risen from 1987 to 2006 there are some areas where ground-water levels have declined in this period. Water levels in Cruce Davila NC-5 Well which is open to the lower unit of the North Coast Limestone Aquifer System have fallen more than 90 feet in 20 years. KEYWORDS: ground water, Puerto Rico, water levels
INTRODUCTION
The goal of any environmental index is to create a single number that is more representative of the regional conditions that any single data point. This index is part of a campaign to make the ground-water data collected by the USGS more useful and available to the public. Today ground-water data is routinely in the National Water Information System (NWIS) and on the Internet within one month of its collection. Currently only two of the 26 stations used to generate this index have real-time data on the Internet. In the future, real-time ground-water data is expected to be a larger part of the USGS data collection effort. It is planned that the generation of this ground-water index will be automated and that the index will be updated and published on the Internet. The goal is to make ground-water data available to the public in a timely manner so that the decision makers can use it as part of their decision-making process. The purpose of this paper is to describe the ground-water index that was developed with data from 1987 to 2006 from observation wells located throughout the island of Puerto Rico. This index applies only to the main island of Puerto Rico and does not apply to Vieques, Culebra, or other offshore islands.
1 U.S. Geological Survey, Caribbean Water Science Center, 651 Federal Dr., Suite 400-15, Guaynabo, PR 00965 ([email protected]) 787-548-0737
49

METHODS
Observation wells in NWIS were chosen for this index if they had 150 or more water levels and were visited in 2006. The data was collected throughout the main island of Puerto Rico and the locations are shown in figure 1. No data from Vieques, Culebra, or other offshore islands was used in the making of this index. All the raw data for this study is in NWIS and is available on the Internet. In Puerto Rico, the USGS generally collects ground-water levels at a rate of about 10 visits per year. The 26 wells used in this study have a total of 5,567 water-level measurements. If a station had more than one water level in a month then the data were averaged. The lowest water level on record was assigned a zero and the highest 100 as the score for each measurement. A water level that was one fourth of the distance from the lowest to highest was given a score of 25. The index is the average of the stations that had scores for the month. This index is designed so that each observation well has equal weight. For instance a one foot rise in the water level of a well that has a three foot range in stage will result in the same change to the index as a five foot rise in a well with a 15 foot range in stage. The index was only defined for months that had three or more ground-water levels. Between 1987 and 2006, the only months were the index was not defined were August 1994 and August 1998. Aquifer specific indices were also prepared for the two most important aquifers in Puerto Rico—the North Coast Limestone Aquifer System and the South Coastal Plain Alluvial Aquifer. In this study, there are 13 observation wells in the North Coast Limestone Aquifer System and six in the South Coastal Plain Alluvial Aquifer. There are seven wells that were used in the overall index that are in other, smaller aquifers.
RESULTS The index of ground-water levels in Puerto Rico from 1987 to 2006 is shown in figure 2. In Puerto Rico ground-water levels fell from 1987 until Hurricane Hortense in 1996. The index has its minimum of 27.7 in September 1994. The most important recharge events were Hurricane Hortense in 1996, Hurricane Georges in 1998, and the November 2003 rain event. The index has its maximum of 80.1 in November 2005. Periods of water rationing in either Lago Carraizo or Lago La Plata correlate closely with the minima in the index. The regional indices for the North Coast Limestone Aquifer System and the South Coastal Alluvial Aquifer are shown in figure 3. The index for the South Coastal Plain Alluvial Aquifer is flashier than for the North Coast Limestone Aquifer System. It rises rapidly during recharge events but then also falls rapidly. The index for the South Coastal Alluvial Aquifer rises only doing massive floods. The index for the North Coast Limestone Aquifer System rises during floods but it can also rise from many small rain events that are close together in time. In this case, no single event is a destructive flood but the cumulative effect is that ground-water levels and the index are rising. The greatest divergence between the indices for the two aquifers occurred in the first few months of 2003 when ground-water levels were falling rapidly in the south while they were holding steady in the north. For the last ten years most ground-water levels throughout Puerto Rico have been rising but that does not mean that all stations have seen rising ground-water levels. The station with the largest decline in ground-water levels over the last 20 years is Cruce Davila NC-5 in Barceloneta, Puerto Rico. Cruce Davila NC-5 is open to the lower unit of the North Coast Limestone Aquifer System and the water level in this well has fallen more than 90 feet in 20 years (see fig. 4).
50

Figure 1. Locations of observation wells used in this study. The wells are located in the major aquifers
throughout Puerto Rico.
GROUND-WATER INDEX IN PUERTO RICO, 1987 to 2006
0
20
40
60
80
100
IND
EX V
ALU
E
1987 1990 1995 2000 2005 2006
Low Point Sep 94 Index is 27.7
High Point Nov 05 Index is 80.1
Water rationing in Lago Carraizo or in Lago La Plata
Hurricane Hortense
Hurricane GeorgesNov 03 Rain Event
Trendline from 1987 to 1996y=-0.196x+448r2=0.52
Trendline from 1997 to 2006y=0.227x-415r2=0.40
TIME, IN YEARS
Figure 2. Ground-water index in Puerto Rico from 1987 to 2006. Trend lines from 1987 to 1996 and from
1997 to 2006 are shown. The three most important recharge events and three periods of water rationing are identified.
51
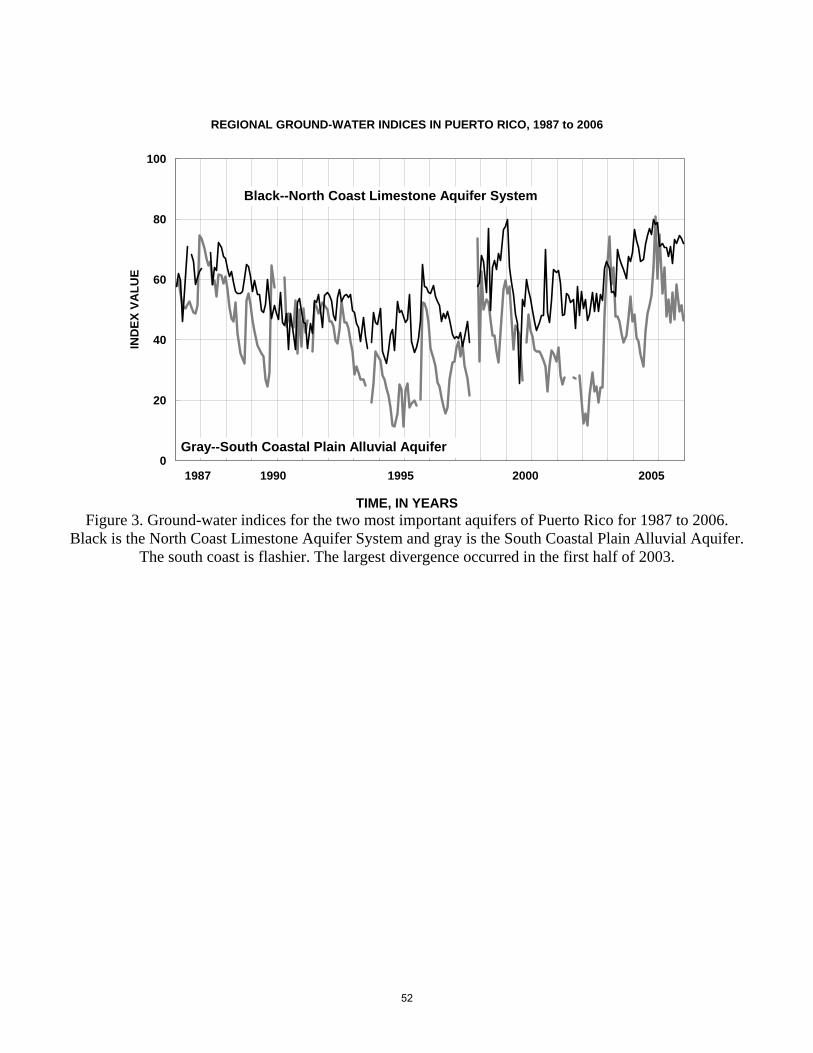
REGIONAL GROUND-WATER INDICES IN PUERTO RICO, 1987 to 2006
0
20
40
60
80
100
IND
EX V
ALU
E
1987 1990 1995 2000 2005
Gray--South Coastal Plain Alluvial Aquifer
Black--North Coast Limestone Aquifer System
TIME, IN YEARS
Figure 3. Ground-water indices for the two most important aquifers of Puerto Rico for 1987 to 2006. Black is the North Coast Limestone Aquifer System and gray is the South Coastal Plain Alluvial Aquifer.
The south coast is flashier. The largest divergence occurred in the first half of 2003.
52
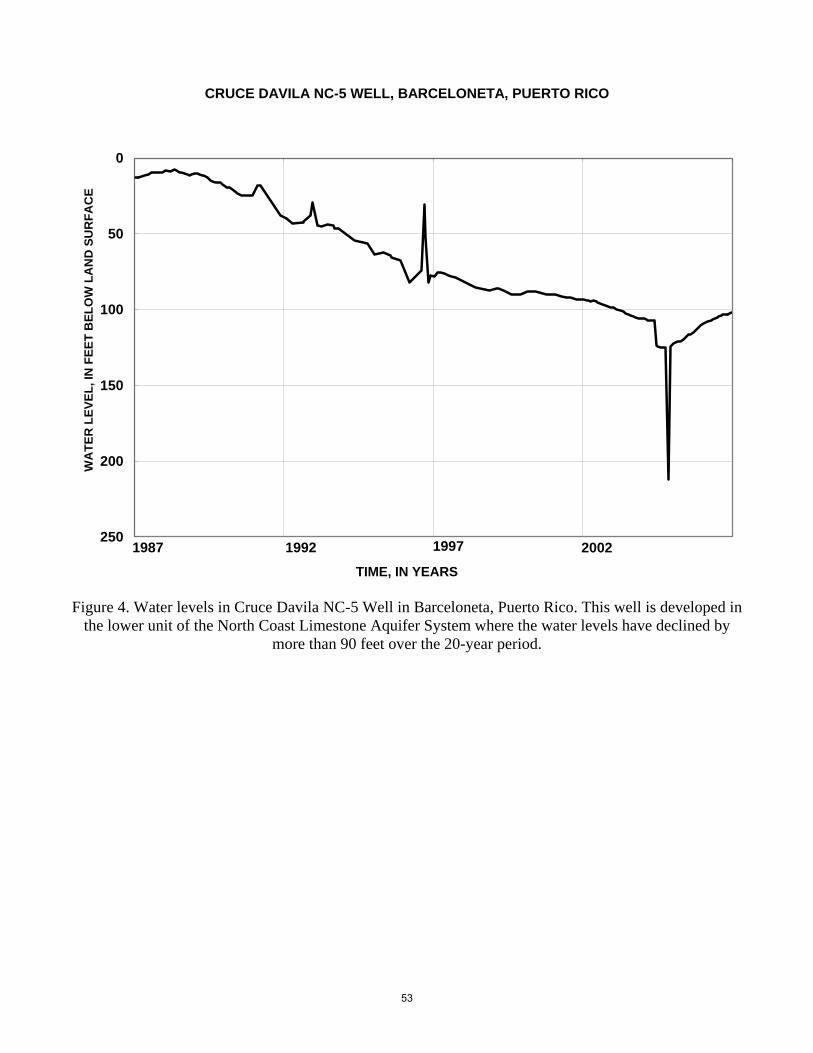
CRUCE DAVILA NC-5 WELL, BARCELONETA, PUERTO RICO
0
50
100
150
200
250
WA
TER
LEV
EL, I
N F
EET
BEL
OW
LA
ND
SU
RFA
CE
1987 1992 1997 2002
TIME, IN YEARS
Figure 4. Water levels in Cruce Davila NC-5 Well in Barceloneta, Puerto Rico. This well is developed in the lower unit of the North Coast Limestone Aquifer System where the water levels have declined by
more than 90 feet over the 20-year period.
53
OCTOBER SEVENTH CARIBBEAN ISLANDS WATER RESOURCES CONGRESS 2007
THE EFFECTS OF AQUIFER DEVELOPMENT AND CHANGES IN
IRRIGATION PRACTICES ON THE GROUND-WATER DISCHARGE TO THE JOBOS BAY NATIONAL ESTUARINE RESEARCH RESERVE,
SOUTH-CENTRAL, PUERTO RICO
Jesús Rodríguez-Martínez1,∗, and José M. Rodríguez2
ABSTRACT
A ground-water modeling study was conducted by the United States Geological survey and the Puerto Rico Department of Natural and Environmental Resources to determine the effects of changes in agricultural practices and aquifer development on the ground-water flow to the mangrove forest in the Jobos Bay National Research Reserve in Salinas and Guayama, Puerto Rico. The results of the study indicated that the decrease by as much as 30 percent of the recharge to the Salinas fan-delta aquifer after furrow irrigation was completely switched to drip irrigation methods in 1993 and the aquifer development caused a decrease in ground-water flow to the mangrove forest from about 2.5 MGD in 1986 to about 0.2 MGD in 2002. KEYWORDS: ground-water flow, mangrove, JBNERR, sea-water intrusion
INTRODUCTION The death of about 75 acres of black mangroves in the Jobos Bay National Estuarine Research Reserve (JBNERR), occurred since 1990, had been related to changes in agricultural practices in the farms within the municipio of Salinas contiguous to JBNERR. The most significant change in agricultural practices was the replacement of sugarcane as the main crop in the 1980’s by crops such as corn and truck farms crops such as tomatoes. This change in agricultural practice was accompanied by a switch from furrow- irrigation to more efficient irrigation techniques such as micro-drip irrigation in truck-farm products and center-pivot overhead sprinklers in crops such as corn. Micro-drip irrigation methods are more efficient in applying water to the root zone of the plants, however, none or very little of the applied water with these methods recharges the aquifer. This is in contrast with the furrow irrigation method in which as much as 30 percent of the water applied is estimated to recharge the aquifer (Kuniansky and others, 2004). The U.S. Geological Survey in cooperation with the Puerto Rico Department of Natural and Environmental Resources (PRDNER conducted a ground-water modeling study to determine how the aquifer development and changes in irrigation practices have impacted the ground-water flow to the JBNERR, particularly the mangrove forest. The ground-water modeling study was conducted within an area of about 36 square miles of the Southern Coastal Plain Aquifer System of Puerto Rico delimited on the west by the Río Jueyes in Salinas and on the east by the Río Guamaní in Guayama, but emphasizing the Salinas fan-delta aquifer (figure 1).
1* U.S. Geological Survey (*: corresponding author) Caribbean Water Science Center, Guaynabo PR, 00965, Tel. 787-749-4346 E-mail: Jesus Rodriguez/WRD/USGS/DOI@USGS 2 U.S. Geological Survey Caribbean Water Science Center Guaynabo, PR, 00965 Tel. 787-749-4346 E-mail: Jose M. Rodriguez/WRD/USGS/DOI/USGS
54

55
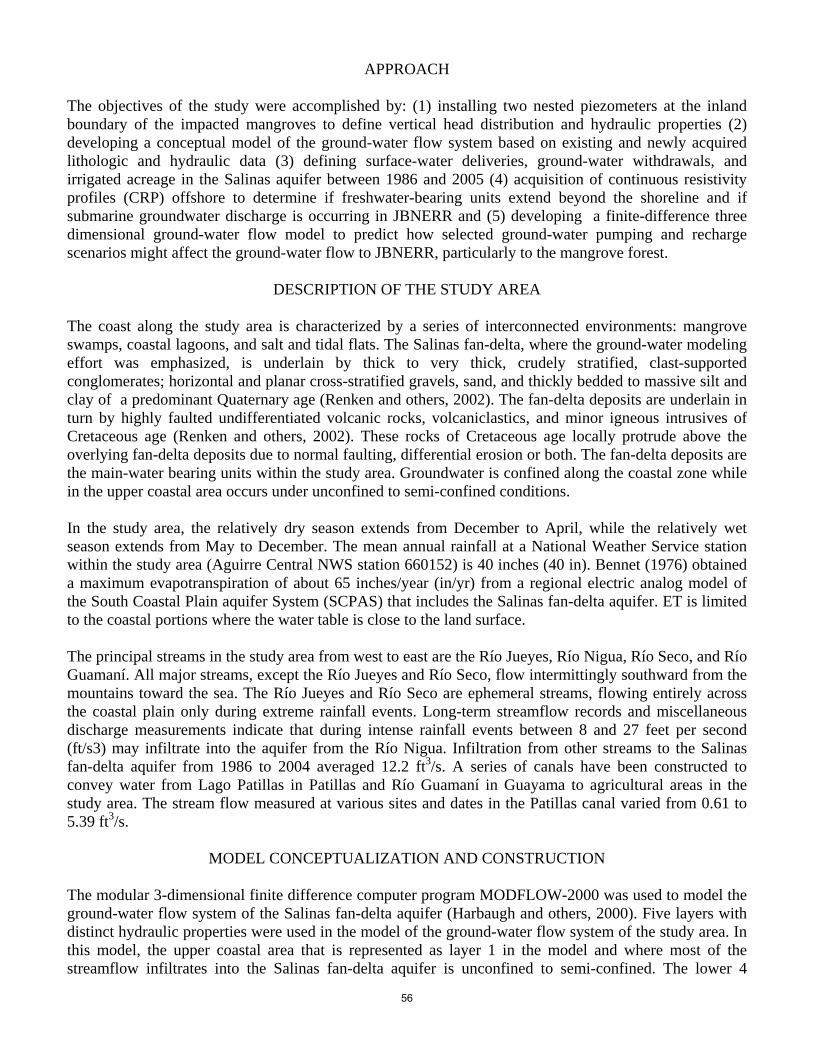
APPROACH The objectives of the study were accomplished by: (1) installing two nested piezometers at the inland boundary of the impacted mangroves to define vertical head distribution and hydraulic properties (2) developing a conceptual model of the ground-water flow system based on existing and newly acquired lithologic and hydraulic data (3) defining surface-water deliveries, ground-water withdrawals, and irrigated acreage in the Salinas aquifer between 1986 and 2005 (4) acquisition of continuous resistivity profiles (CRP) offshore to determine if freshwater-bearing units extend beyond the shoreline and if submarine groundwater discharge is occurring in JBNERR and (5) developing a finite-difference three dimensional ground-water flow model to predict how selected ground-water pumping and recharge scenarios might affect the ground-water flow to JBNERR, particularly to the mangrove forest.
DESCRIPTION OF THE STUDY AREA
The coast along the study area is characterized by a series of interconnected environments: mangrove swamps, coastal lagoons, and salt and tidal flats. The Salinas fan-delta, where the ground-water modeling effort was emphasized, is underlain by thick to very thick, crudely stratified, clast-supported conglomerates; horizontal and planar cross-stratified gravels, sand, and thickly bedded to massive silt and clay of a predominant Quaternary age (Renken and others, 2002). The fan-delta deposits are underlain in turn by highly faulted undifferentiated volcanic rocks, volcaniclastics, and minor igneous intrusives of Cretaceous age (Renken and others, 2002). These rocks of Cretaceous age locally protrude above the overlying fan-delta deposits due to normal faulting, differential erosion or both. The fan-delta deposits are the main-water bearing units within the study area. Groundwater is confined along the coastal zone while in the upper coastal area occurs under unconfined to semi-confined conditions. In the study area, the relatively dry season extends from December to April, while the relatively wet season extends from May to December. The mean annual rainfall at a National Weather Service station within the study area (Aguirre Central NWS station 660152) is 40 inches (40 in). Bennet (1976) obtained a maximum evapotranspiration of about 65 inches/year (in/yr) from a regional electric analog model of the South Coastal Plain aquifer System (SCPAS) that includes the Salinas fan-delta aquifer. ET is limited to the coastal portions where the water table is close to the land surface. The principal streams in the study area from west to east are the Río Jueyes, Río Nigua, Río Seco, and Río Guamaní. All major streams, except the Río Jueyes and Río Seco, flow intermittingly southward from the mountains toward the sea. The Río Jueyes and Río Seco are ephemeral streams, flowing entirely across the coastal plain only during extreme rainfall events. Long-term streamflow records and miscellaneous discharge measurements indicate that during intense rainfall events between 8 and 27 feet per second (ft/s3) may infiltrate into the aquifer from the Río Nigua. Infiltration from other streams to the Salinas fan-delta aquifer from 1986 to 2004 averaged 12.2 ft3/s. A series of canals have been constructed to convey water from Lago Patillas in Patillas and Río Guamaní in Guayama to agricultural areas in the study area. The stream flow measured at various sites and dates in the Patillas canal varied from 0.61 to 5.39 ft3/s.
MODEL CONCEPTUALIZATION AND CONSTRUCTION
The modular 3-dimensional finite difference computer program MODFLOW-2000 was used to model the ground-water flow system of the Salinas fan-delta aquifer (Harbaugh and others, 2000). Five layers with distinct hydraulic properties were used in the model of the ground-water flow system of the study area. In this model, the upper coastal area that is represented as layer 1 in the model and where most of the streamflow infiltrates into the Salinas fan-delta aquifer is unconfined to semi-confined. The lower 4
56

model layers are semi-confined to confined by clayey/silty material. The active areas and boundary conditions for layers 1 and 2 are shown in figure 2. The model grid varies spatially with grid sizes of 802.25 ft near the coast and 1640.5 ft elsewhere in the study area. The following boundary conditions were incorporated on the top of the model (layers 1 and 2); net recharge, the Patillas and Guamaní canals that were simulated using the River package of MODFLOW 2000 (Harbaugh and others, 2000), and streamflow infiltration rates as previously estimated were simulated by injection wells. General head boundary conditions (GHB) were applied to the top of the model in layer 2 along the mangrove swamps and the coastline to indicate either the occurrence of fresh groundwater discharge into the seafloor or the infiltration of seawater into the aquifer. GHB conditions were applied to the top of layers 2 and 3 in order to indicate fresh water discharge to the bay according to CRP data.
MODEL CALIBRATION The process of model calibration was accomplished by a steady-state simulation based on the1986 data acquired by Torres-González and Gómez-Gómez (1987) that in turn was used as an initial condition for the transient simulation of the 1986 to 2004 period. Annual stress periods were set up from 1986 to 2004 for the transient calibration. The data of 2002 and 2004 by Rodríguez (2005) were used as calibration targets for the transient simulation. The calibration criterion, a statistical parameter of how good is the fit between simulated and observed head values in a simulation run, is defined as the residual standard deviation divided by the range in observed data and ideally should be equal or less than 0.11. This statistical parameter was 0.09 for the steady-state simulation which was considered satisfactory. The calibration criterion for the 2002 of 0.13 was worse than that for the1986 data, but close to the ideal value of 0.11. The value of this statistical parameter for the 2004 data was 0.11 which is considered satisfactory. The steady-state simulation was most sensitive to changes in horizontal hydraulic conductivity of the lower permeability sediments between the higher permeability fan-delta deposits. The transient simulation was most sensitive to reductions in the storage of layer 2 and to reductions below and increases above 1.4 times the calibration value of infiltration from the Río Nigua.
SIMULATED CHANGES IN FLOW TO THE MANGROVE ZONE The main effect of the change in irrigation practices in the study area was the reduction in freshwater discharge to the estuary, in particular to the mangrove area (figure 3). The simulated average discharge from the aquifer to the mangrove area, with pumping, in the 1986 to 1993 period (with furrow irrigation), was 2 millions gallons per day (MGD). The simulated average discharge to the mangrove area for the 1994 to 2002 period (no furrow irrigation), with pumping, was 0.2 MGD; while the average flow into the aquifer from the estuary was 0.1 MGD. If all pumping is removed, the simulated average flow to the mangrove area for the 1994 to 2004 period is 2.5 MGD. The model also indicated that during a year with slightly below normal rainfall the reduction in flow from the aquifer to the mangrove area will be sufficient to induce seawater into the aquifer and thus into the mangrove root zone. The increase in ground-water flux to the mangroves in 2003 and 2004 was due to above normal rainfall. .
57
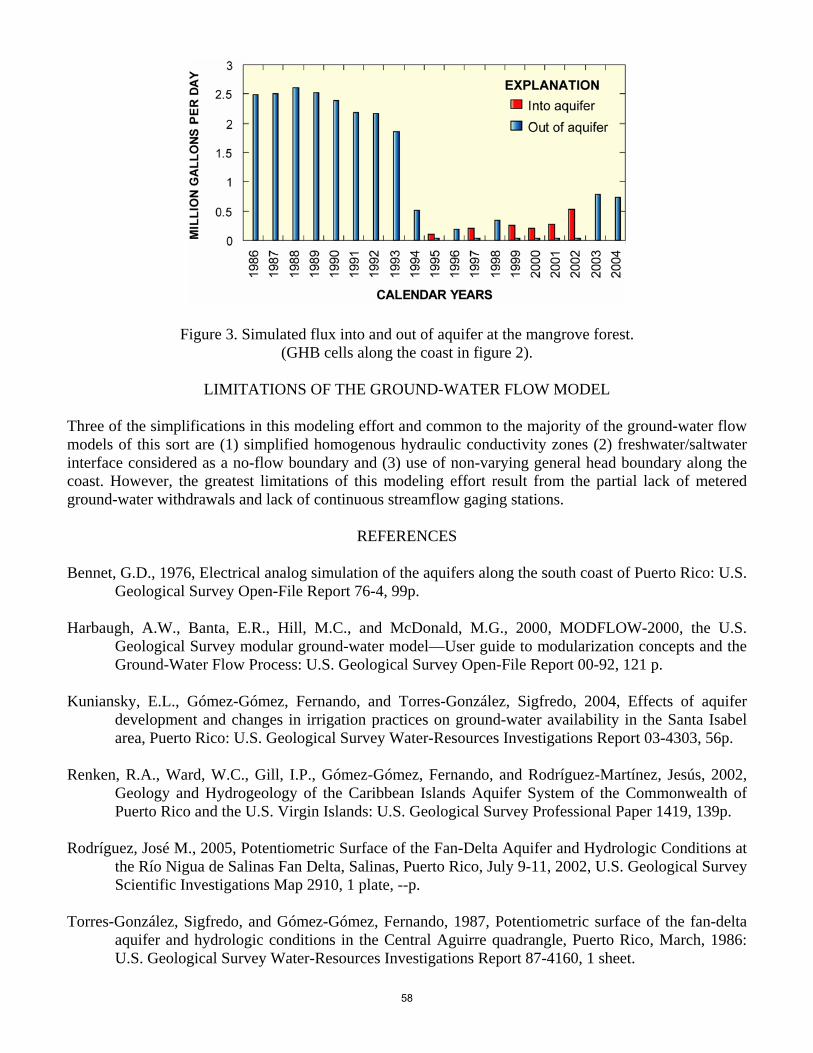
Figure 3. Simulated flux into and out of aquifer at the mangrove forest. (GHB cells along the coast in figure 2).
LIMITATIONS OF THE GROUND-WATER FLOW MODEL
Three of the simplifications in this modeling effort and common to the majority of the ground-water flow models of this sort are (1) simplified homogenous hydraulic conductivity zones (2) freshwater/saltwater interface considered as a no-flow boundary and (3) use of non-varying general head boundary along the coast. However, the greatest limitations of this modeling effort result from the partial lack of metered ground-water withdrawals and lack of continuous streamflow gaging stations.
REFERENCES Bennet, G.D., 1976, Electrical analog simulation of the aquifers along the south coast of Puerto Rico: U.S.
Geological Survey Open-File Report 76-4, 99p.
Harbaugh, A.W., Banta, E.R., Hill, M.C., and McDonald, M.G., 2000, MODFLOW-2000, the U.S. Geological Survey modular ground-water model—User guide to modularization concepts and the Ground-Water Flow Process: U.S. Geological Survey Open-File Report 00-92, 121 p.
Kuniansky, E.L., Gómez-Gómez, Fernando, and Torres-González, Sigfredo, 2004, Effects of aquifer
development and changes in irrigation practices on ground-water availability in the Santa Isabel area, Puerto Rico: U.S. Geological Survey Water-Resources Investigations Report 03-4303, 56p.
Renken, R.A., Ward, W.C., Gill, I.P., Gómez-Gómez, Fernando, and Rodríguez-Martínez, Jesús, 2002,
Geology and Hydrogeology of the Caribbean Islands Aquifer System of the Commonwealth of Puerto Rico and the U.S. Virgin Islands: U.S. Geological Survey Professional Paper 1419, 139p.
Rodríguez, José M., 2005, Potentiometric Surface of the Fan-Delta Aquifer and Hydrologic Conditions at
the Río Nigua de Salinas Fan Delta, Salinas, Puerto Rico, July 9-11, 2002, U.S. Geological Survey Scientific Investigations Map 2910, 1 plate, --p.
Torres-González, Sigfredo, and Gómez-Gómez, Fernando, 1987, Potentiometric surface of the fan-delta
aquifer and hydrologic conditions in the Central Aguirre quadrangle, Puerto Rico, March, 1986: U.S. Geological Survey Water-Resources Investigations Report 87-4160, 1 sheet.
58
OCTOBER SEVENTH CARIBBEAN ISLANDS WATER RESOURCES CONGRESS
2007
NUTRIENT LOAD ESTIMATION AT LAGO DOS BOCAS,
PUERTO RICO
Villalta-Calderón Christian A.1, Bernal, Álvaro A.2 and Pérez-Alegría Luis R3
ABSTRACT Puerto Rico is in the process of developing total maximum daily loads for lakes and rivers
listed as impaired waters by the United States Environmental Protection Agency and the local Puerto Rico Environmental Quality Board. At this time, only two projects are approved by the United States Environmental Protection Agency, both of them recomend to treat fecal coliforms as the solution to the impairment.
This investigation quantifies the nutrient loading to Río Grande de Arecibo watershed, in north-central Puerto Rico. At the Lago Dos Bocas dam site, the watershed has a catchment area of 43,713 ha and covers parts of the municipalities of Utuado, Jayuya, Adjuntas, and Ciales. The watershed encompasses the catchment area of four reservoirs: Lago Dos Bocas, Lago Caonillas, Lago Adjuntas and Lago Garzas. These first two reservoirs supply over 70 MGD of potable water to the metropolitan area of San Juan, Puerto Rico.
Previous work in the watershed describes the effect of soil erosion and sediment load to Lago Dos Bocas using the Hydrological Simulation Program FORTRAN. This investigation focuses on nitrogen and phosphorus simulation, and total nutrient loading into Lago Dos Bocas. Continuous-time simulation of nutrients between 1995 and 2002 reports specific loadings of 6.7 Kg/ha-yr of total nitrogen and 0.63 Kg/ha-yr of total phosphorus. The percent mean absolute error fluctuates between 25.6 percent and 35.7 percent in the water quality stations evaluated, meaning a good to fair calibration results.
KEYWORDS. Total nutrient loads, total nitrogen, total phosphorus, hydrologic and water quality simulation.
INTRODUCTION Surface-water contamination by point and nonpoint sources is a major concern for public
and government agencies in the United States and Puerto Rico. In the United States nonpoint source inputs are the major cause of water pollution. Nonpoint source inputs of phosphorus may cause eutrophication of lakes, ponds and reservoirs (USEPA, 1996). This problem is also observed in Puerto Rico reservoirs (PREQB, 2002).
The 2002 water-quality inventory of Puerto Rico reported approximately 70% of the river miles being monitored as impaired due to either high sediment loads or bacterial counts
1 University of Puerto Rico at Mayagüez, [email protected] 2 University of Puerto Rico at Mayagüez, [email protected] 3 University of Puerto Rico at Mayagüez, [email protected]
59

(PREQB, 2002). Rivers are the main transport mechanism of nutrients, specially nitrogen and phosphorus, to reservoirs and coastal waters (Castillo et al., 2000).
In the same context, the list of impaired waters of Puerto Rico (305(b)-303(d)) states that all of our reservoirs fail to meet existing aquatic life criteria for dissolved oxygen resulting in eutrophication and characterized by an elevated nutritional status (Martínez et al, 2005).
Study Area The study area is the Rio Grande de Arecibo watershed located in the north central part
of Puerto Rico, confined within latitudes 18°11’ and 18°20’N and longitudes 66°32’ and 66°46’W. It has a catchment area of 43,713 ha at Lago Dos Bocas and covers parts of the Utuado, Jayuya, Adjuntas, and Ciales municipalities, an average basin slope of 36%, and average annual precipitation of 2,235 mm (88 in). Present land use distribution in the watershed is 76.3% forest land, 13% rangeland, 6.9% agricultural land, 3.1% urban land and 0.7% water area. Figure 1 shows the Río Grande de Arecibo watershed above Lago Dos Bocas.
67°5'0"W
67°5'0"W
66°40'0"W
66°40'0"W
66°15'0"W
66°15'0"W
65°50'0"W
65°50'0"W
65°25'0"W
65°25'0"W
0'0"N17°
5'0"N17°
0'0"N18°
5'0"N18°
LegendWatershed Border
Puerto Rico
Río Limón sub watershed
Río Grande de Arecibo sub watershed
Río Caonillas sub watershed
·
Figure1. Location of the study area.
Methodology
HSPF water quality simulation Nutrients (Nitrogen and Phosphorus) and sediments were simulated using the Hydrologic
Simulation Program FORTRAN (HSPF). Required data for the continuous water-quality simulation using HSPF are divided in two groups, first the geospatial data generated by a Geographical Information System (GIS), and second the hydro-meteorological data. Geospatial data are based on different covers including watersheds boundaries, rivers, outlet points, land use, and soil maps for hydrological condition. Hydro-meteorological input data, necessary for the study, included precipitation, evaporation, solar radiation, air and dew point temperature, cloud cover and wind velocity, all of them collected hourly for HSPF requirements.
For model calibration and validation, flow data, suspended sediment concentrations, water temperature, orthophosphate, nitrates and total ammonia concentrations are required inputs, for the stations indicated in Table 1.
60

Table1. Location of water-quality stations Coordinates*
(ddmmss) Watershed Name USGS
Station Number
Drainage Area (km2) Latitude Longitude
Río Grande de Arecibo near Adjuntas 50020500 32.9 18º10’54” 66º44’12” Río Grande de Arecibo near Utuado 50025000 170.9 18º18’11” 66º41’59” Río Caonillas above Lago Caonillas 50026050 104.6 18º14’25” 66º38’22” Río Limón above Lago Dos Bocas 50027000 85.9 18º19’32” 66º37’24”
*Geographical Coordinates System, North American Datum 1927
Figure 2 shows the four USGS water-quality stations located in the Río Grande de Arecibo watershed.
Figure2. USGS water-quality stations in the Río Grande de Arecibo watershed.
This simulation exercise in the Río Grande de Arecibo watershed generates estimates of nitrogen and phosphorus loads to Lago Dos Bocas as a first step in the development of a Total Maximum Daily Loads (TMDL) of dissolved oxygen in the reservoir. Total nitrogen was estimated by summation of all nitrogen species.
A follow-up study will use this calibrated and validated model to pin point nutrient loads based on several scenarios already documented by local, and federal regulatory agencies.
Results The total ammonia and total nitrate concentrations were simulated to determine the total
annual nitrogen load. The simulation used perland (PQUAL) and imperland (IQUAL) sub-modules from HSPF for the first two species of total nitrogen. Total nitrogen is defined as the sum of total ammonia, total nitrates and the organic nitrogen. Total phosphorus loads are also computed.
61
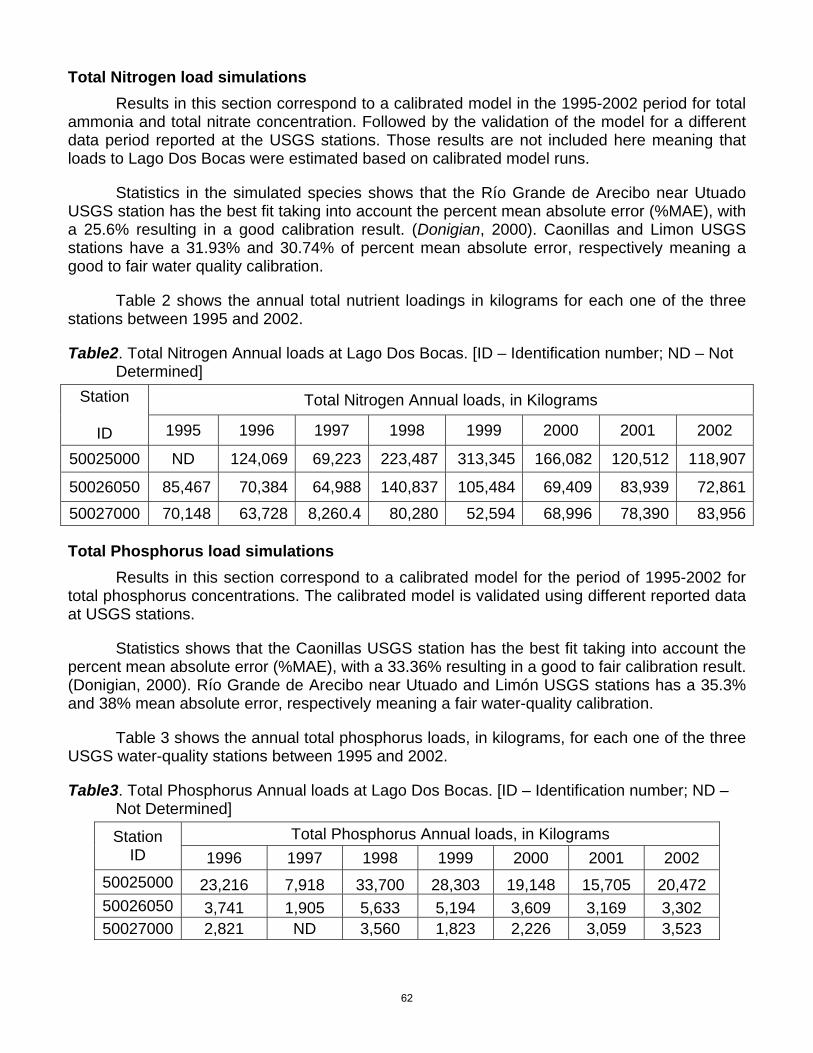
Total Nitrogen load simulations Results in this section correspond to a calibrated model in the 1995-2002 period for total
ammonia and total nitrate concentration. Followed by the validation of the model for a different data period reported at the USGS stations. Those results are not included here meaning that loads to Lago Dos Bocas were estimated based on calibrated model runs.
Statistics in the simulated species shows that the Río Grande de Arecibo near Utuado USGS station has the best fit taking into account the percent mean absolute error (%MAE), with a 25.6% resulting in a good calibration result. (Donigian, 2000). Caonillas and Limon USGS stations have a 31.93% and 30.74% of percent mean absolute error, respectively meaning a good to fair water quality calibration.
Table 2 shows the annual total nutrient loadings in kilograms for each one of the three stations between 1995 and 2002.
Table2. Total Nitrogen Annual loads at Lago Dos Bocas. [ID – Identification number; ND – Not Determined]
Total Nitrogen Annual loads, in Kilograms Station
ID 1995 1996 1997 1998 1999 2000 2001 2002
50025000 ND 124,069 69,223 223,487 313,345 166,082 120,512 118,907
50026050 85,467 70,384 64,988 140,837 105,484 69,409 83,939 72,86150027000 70,148 63,728 8,260.4 80,280 52,594 68,996 78,390 83,956
Total Phosphorus load simulations Results in this section correspond to a calibrated model for the period of 1995-2002 for
total phosphorus concentrations. The calibrated model is validated using different reported data at USGS stations.
Statistics shows that the Caonillas USGS station has the best fit taking into account the percent mean absolute error (%MAE), with a 33.36% resulting in a good to fair calibration result. (Donigian, 2000). Río Grande de Arecibo near Utuado and Limón USGS stations has a 35.3% and 38% mean absolute error, respectively meaning a fair water-quality calibration.
Table 3 shows the annual total phosphorus loads, in kilograms, for each one of the three USGS water-quality stations between 1995 and 2002.
Table3. Total Phosphorus Annual loads at Lago Dos Bocas. [ID – Identification number; ND – Not Determined]
Total Phosphorus Annual loads, in Kilograms Station ID 1996 1997 1998 1999 2000 2001 2002
50025000 23,216 7,918 33,700 28,303 19,148 15,705 20,472 50026050 3,741 1,905 5,633 5,194 3,609 3,169 3,302 50027000 2,821 ND 3,560 1,823 2,226 3,059 3,523
62
CONCLUSIONS The water-quality simulation of the Río Grande de Arecibo watershed range from
acceptable to a good estimate, based mainly in percent mean absolute error (%MAE) criteria. The model produces a realistic prediction of the nutrient loads to Lago Dos Bocas between 1995 to 2002.
At present, the model is being validated for a different data period (2004-2005). The validated process will allow in a comparison of the fit and observed data.
This investigation is part of a comprehensive plan in the Río Grande de Arecibo watershed, including several years of investigation in the field of hydrology and water-quality monitoring, including HSPF simulations. This is the first effort using HSPF to simulate nutrient loads and it may well represent the starting point in the TMDL estimation in Puerto Rico process.
REFERENCES Bicknell, B. R., Imhoff, J.C., Kittle, J.L., Donigian, A.S., and Jobes, T. H., 2001. Hydrological Simulation
Program – Fortran (HSPF), version 12, User’s Manual. Prepared for AQUA TERRA Consultants Mountain View, California, in cooperation with Water Resources Discipline U.S. Geological Survey Reston, Virginia, and U.S. Environmental Protection Agency Athens, Georgia. 873 pp.
Castillo, M.J., Allan, J.D., and Brunzell S., 2000. Nutrient concentrations and discharges in a midwestern agricultural catchment. Journal of Environmental Quality. 29: 1142-1151.
Donigian, A.S., 2000. Watershed model calibration and validation: The HSPF experience. AQUATERRA Consultants, Mountain View, CA.
Martínez G., Sotomayor, D., and Pérez-Alegría, L.R., 2005. Determination of Numeric Nutrient Target Criteria in Lakes and Reservoirs of Puerto Rico. Final progress report. University of Puerto Rico at Mayagüez.
Puerto Rico Environmental Quality Board. 2002. Lista de aguas impactadas. Estrategia de monitoría, metodología de evaluación y criterios para la lista. Estado Libre Asociado de Puerto Rico.
U.S Environmental Protection Agency.1996. “Water Quality Criteria for Water”; Rep. 440/5-86-001; Washington D.C., USA.
U.S Census Bureau. 2000. Census 2000 Data for Puerto Rico. U.S Census Bureau.
U.S Geological Service. 1995-2006. Water Resources Data Puerto Rico and the U.S. Virgin Islands Water Year 1995-2006
63
OCTOBER SEVENTH CARIBBEAN ISLANDS WATER RESOURCES CONGRESS
2007
USE OF STABLE ISOTOPES TO DETERMINE POTENTIAL SOURCES OF NITRATE IN THE SALINAS AREA, SOUTH COASTAL PLAIN ALLUVIAL
AQUIFER, PUERTO RICO
José M. Rodríguez1,∗ ABSTRACT: A ground-water quality assessment to define the potential sources and concentration of nitrate in the Río Nigua de Salinas alluvial fan aquifer was conducted between January 2002 and March 2003 (figure 1). The study area covers approximately 3,600 hectares of the coastal plain within the municipality of Salinas in southern Puerto Rico, extending from the Cordillera Central foothills to the Caribbean Sea. Agriculture has historically been the principal land use in the area. Throughout most of the 20th century and until about 1980, sugarcane monoculture prevailed. Since then, agricultural enterprises are more diverse and include truck-farm crops, turf grass, bio-engineered crops for seed production, and commercial poultry farms. Nitrate concentrations, in an area that covers approximately 405 hectares near the center of the Salinas alluvial fan, have increased from a range of 0.9 to 6.7 milligrams per liter as nitrogen in 1986 to a range of 8 to 15 milligrams per liter as nitrogen in 2002. Principal sources of nitrate in the study area are fertilizers, used in the cultivated farmlands, and poultry farm wastes. The highest nitrogen concentrations were found in the foothills area where poultry farms are located. In the area where poultry farm wastes are disposed, nitrate concentrations in ground water were found in the range from 25 to 77 milligrams per liter as nitrogen. Analyses for the stable isotope ratios of nitrogen-15/nitrogen-14 in nitrate were used to distinguish the source of nitrate in the coastal plain alluvial aquifer. Results obtained from the analyses of the stable isotope ratios of nitrogen-15/nitrogen-14 in nitrate samples indicate that near the foothills the high nitrate concentrations is from poultry wastes while in the central part of the alluvial fan artificial fertilizers were estimated to contribute between 39 to 97 percent of the total nitrate.
KEYWORDS: (Puerto Rico; Ground water; Nitrate, Stable isotopes)
INTRODUCTION Since 1998, increased nitrate concentrations in ground water in the Río Nigua de Salinas alluvial fan aquifer and the foothills north of the fan at Salinas, Puerto Rico (fig. 1), have been reported. Baseline nitrate concentrations in ground water throughout most of the alluvial fan were generally less than 5 mg/L as nitrogen in samples obtained in 1986-87 (F. Gómez-Gómez, U.S. Geological Survey, written commun., 2002). The increase in nitrate concentrations has been of concern to local government agencies because of the potential impact to public-supply water wells and to the Jobos Bay National Estuarine Research Reserve (fig. 1). The source of drinking water in the Salinas area is the Salinas alluvial fan aquifer, which supplies about 18,200 cubic meters per day to public supply wells. The purpose of this paper is to present the results of water-quality data collected from wells in the Río Nigua de Salinas alluvial fan and the Hucar area foothills. The water-quality data that were collected for analysis include nitrate and the stable isotope ratios of nitrogen-15/14. As part of the study, data also were obtained to define ground-water withdrawals by major use categories, the potentiometric surface of the aquifer, land use, and estimates of nitrate loads to the aquifer from fertilizer application, land disposal of poultry wastes, and domestic septic-wastes from unsewered communities. 1U.S. Geological Survey, GSA Center, 651 Federal Drive, Suite 400-15, Guaynabo, PR 00965; email: [email protected]
64
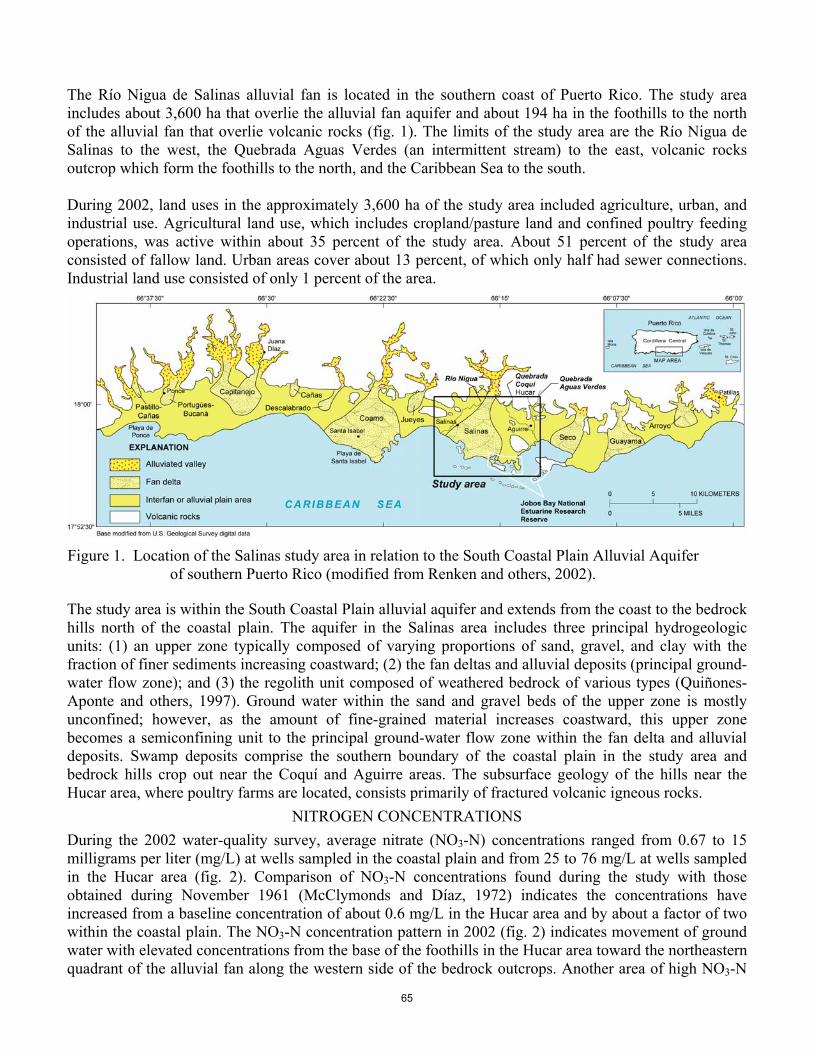
The Río Nigua de Salinas alluvial fan is located in the southern coast of Puerto Rico. The study area includes about 3,600 ha that overlie the alluvial fan aquifer and about 194 ha in the foothills to the north of the alluvial fan that overlie volcanic rocks (fig. 1). The limits of the study area are the Río Nigua de Salinas to the west, the Quebrada Aguas Verdes (an intermittent stream) to the east, volcanic rocks outcrop which form the foothills to the north, and the Caribbean Sea to the south. During 2002, land uses in the approximately 3,600 ha of the study area included agriculture, urban, and industrial use. Agricultural land use, which includes cropland/pasture land and confined poultry feeding operations, was active within about 35 percent of the study area. About 51 percent of the study area consisted of fallow land. Urban areas cover about 13 percent, of which only half had sewer connections. Industrial land use consisted of only 1 percent of the area.
Figure 1. Location of the Salinas study area in relation to the South Coastal Plain Alluvial Aquifer
of southern Puerto Rico (modified from Renken and others, 2002).
The study area is within the South Coastal Plain alluvial aquifer and extends from the coast to the bedrock hills north of the coastal plain. The aquifer in the Salinas area includes three principal hydrogeologic units: (1) an upper zone typically composed of varying proportions of sand, gravel, and clay with the fraction of finer sediments increasing coastward; (2) the fan deltas and alluvial deposits (principal ground-water flow zone); and (3) the regolith unit composed of weathered bedrock of various types (Quiñones-Aponte and others, 1997). Ground water within the sand and gravel beds of the upper zone is mostly unconfined; however, as the amount of fine-grained material increases coastward, this upper zone becomes a semiconfining unit to the principal ground-water flow zone within the fan delta and alluvial deposits. Swamp deposits comprise the southern boundary of the coastal plain in the study area and bedrock hills crop out near the Coquí and Aguirre areas. The subsurface geology of the hills near the Hucar area, where poultry farms are located, consists primarily of fractured volcanic igneous rocks.
NITROGEN CONCENTRATIONS During the 2002 water-quality survey, average nitrate (NO3-N) concentrations ranged from 0.67 to 15 milligrams per liter (mg/L) at wells sampled in the coastal plain and from 25 to 76 mg/L at wells sampled in the Hucar area (fig. 2). Comparison of NO3-N concentrations found during the study with those obtained during November 1961 (McClymonds and Díaz, 1972) indicates the concentrations have increased from a baseline concentration of about 0.6 mg/L in the Hucar area and by about a factor of two within the coastal plain. The NO3-N concentration pattern in 2002 (fig. 2) indicates movement of ground water with elevated concentrations from the base of the foothills in the Hucar area toward the northeastern quadrant of the alluvial fan along the western side of the bedrock outcrops. Another area of high NO3-N
65

concentrations was detected at the center of the fan, extending toward the ground-water pumping centers that produced a major cone of depression.
Figure 2. Nitrate concentrations in the Río Nigua de Salinas alluvial fan, Salinas, Puerto Rico, 2002.
NITROGEN ISOTOPIC CHARACTERIZATION OF NITRATE SOURCES Ground-water samples collected in the study area were analyzed for nitrogen stable isotope in nitrate, delta nitrogen-15 of nitrate (δ15N-NO3), and the results are presented in figure 3. The δ15N-NO3 is used to infer the source of nitrate in the ground water. Typical δ15N-NO3 values in ground water are derived from various sources and include: (1) artificial fertilizers ranging from +2 to +6 permil (‰), and (2) animal or human organic waste greater than +8 ‰ (Katz and others, 1999; Bohlke, 2003). Data from a number of sites indicate there may be a tendency for nitrate in seepage from septic systems to be near the lower end of the range (+8 to +11 ‰), and nitrate in leachate from manure spreading to range toward higher values with more variability (+10 to +25 ‰) (Bohlke, 2003).
Figure 3. Delta nitrogen-15 of nitrate and estimated percent of total nitrate concentration derived from
agricultural activities in the Río Nigua de Salinas alluvial fan, Salinas, Puerto Rico, 2002. Ground-water samples were collected from selected sites to determine the relation of δ15N-NO3 to nitrate concentration as nitrogen (NO3-N) in the study area (fig. 4). Results indicated that NO3-N concentrations
66
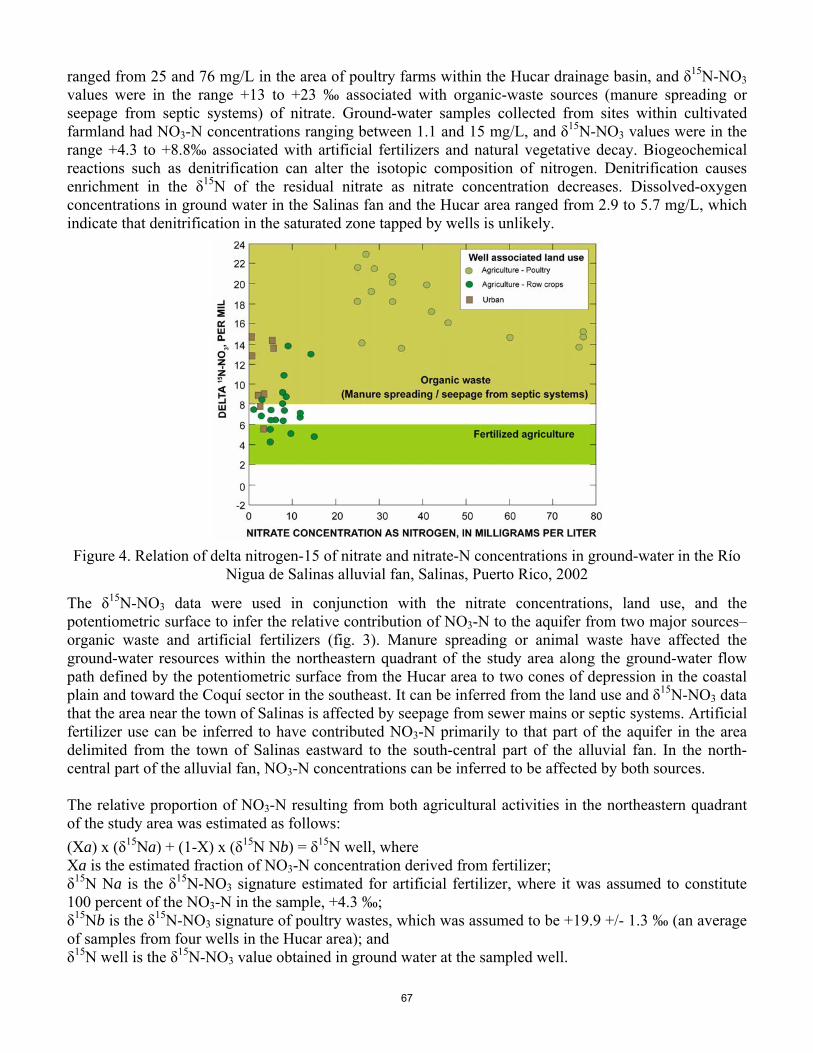
ranged from 25 and 76 mg/L in the area of poultry farms within the Hucar drainage basin, and δ15N-NO3 values were in the range +13 to +23 ‰ associated with organic-waste sources (manure spreading or seepage from septic systems) of nitrate. Ground-water samples collected from sites within cultivated farmland had NO3-N concentrations ranging between 1.1 and 15 mg/L, and δ15N-NO3 values were in the range +4.3 to +8.8‰ associated with artificial fertilizers and natural vegetative decay. Biogeochemical reactions such as denitrification can alter the isotopic composition of nitrogen. Denitrification causes enrichment in the δ15N of the residual nitrate as nitrate concentration decreases. Dissolved-oxygen concentrations in ground water in the Salinas fan and the Hucar area ranged from 2.9 to 5.7 mg/L, which indicate that denitrification in the saturated zone tapped by wells is unlikely.
Figure 4. Relation of delta nitrogen-15 of nitrate and nitrate-N concentrations in ground-water in the Río
Nigua de Salinas alluvial fan, Salinas, Puerto Rico, 2002
The δ15N-NO3 data were used in conjunction with the nitrate concentrations, land use, and the potentiometric surface to infer the relative contribution of NO3-N to the aquifer from two major sources– organic waste and artificial fertilizers (fig. 3). Manure spreading or animal waste have affected the ground-water resources within the northeastern quadrant of the study area along the ground-water flow path defined by the potentiometric surface from the Hucar area to two cones of depression in the coastal plain and toward the Coquí sector in the southeast. It can be inferred from the land use and δ15N-NO3 data that the area near the town of Salinas is affected by seepage from sewer mains or septic systems. Artificial fertilizer use can be inferred to have contributed NO3-N primarily to that part of the aquifer in the area delimited from the town of Salinas eastward to the south-central part of the alluvial fan. In the north-central part of the alluvial fan, NO3-N concentrations can be inferred to be affected by both sources. The relative proportion of NO3-N resulting from both agricultural activities in the northeastern quadrant of the study area was estimated as follows: (Xa) x (δ15Na) + (1-X) x (δ15N Nb) = δ15N well, where Xa is the estimated fraction of NO3-N concentration derived from fertilizer; δ15N Na is the δ15N-NO3 signature estimated for artificial fertilizer, where it was assumed to constitute 100 percent of the NO3-N in the sample, +4.3 ‰; δ15Nb is the δ15N-NO3 signature of poultry wastes, which was assumed to be +19.9 +/- 1.3 ‰ (an average of samples from four wells in the Hucar area); and δ15N well is the δ15N-NO3 value obtained in ground water at the sampled well.
67
Results obtained by using the above method indicate that fertilizer-derived NO3-N is most pervasive throughout the central part of the Río Nigua de Salinas alluvial fan. Animal-waste-derived NO3-N is the major source along a south-southeast trending plume in the direction of the Coquí community.
SUMMARY AND CONCLUSIONS A study was conducted in the Río Nigua de Salinas alluvial fan and in the Hucar area, a semi-enclosed basin in the foothills north of the alluvial fan in southern Puerto Rico, with the purpose of defining the spatial distribution and sources of nitrate concentrations in the local aquifer. Agriculture land uses are predominant and include cropland, confined poultry feeding operations, and pasture. Nitrate concentrations ranging from 0.67 to 76 mg/L were detected in wells in the alluvial fan and in the foothills. Principal sources of nitrate in the study area are fertilizers used in the cultivated farm lands and broiler litter disposal at the poultry farms. Ground-water samples analyzed for the stable isotope ratios of 15N/14N (δ 15N) in nitrate indicated that organic sources (animal waste) from poultry farms are the source of high nitrate concentrations in the foothills. Values of δ15N in samples from wells located in the alluvial fan were in the range associated with artificial fertilizers and natural vegetative decay. Based on the predominant land use in the alluvial fan and the potential migration of ground water with elevated nitrate concentration from the foothills, the percentage of nitrate derived from fertilizer application was compared to nitrate derived from poultry-waste sources. The fertilizer-derived NO3-N is most pervasive throughout the central part of the Río Nigua de Salinas alluvial fan, with animal-waste-derived NO3-N being the major source in the northeastern quadrant of the study area along a south- to southeast- trending plume in the direction of the Coquí community. Fertilizer-management practices in the farms located in the alluvial fan may need to be reviewed to achieve the crop production goals as well as to minimize the nitrogen movement to the aquifer. Fertilizer-management practices include the application methods, amount, timing, and sources. Fertilizer management in the farms in the alluvial fan should likely account for the amount of NO3-N present in ground water used for crop irrigation, which in the eastern part of the study area ranges from 8 to 15 mg/L. An evaluation of the practice of poultry litter application in the farms located within the foothills of the Hucar area may help minimize further nitrate infiltration to ground water. During the study, poultry litter was applied to limited acreage in the Hucar area. The repeated applications on fields in the immediate areas surrounding the poultry farms result in a buildup of nitrogen in the soil, which increases the potential for leaching to the aquifer during rainfall and as runoff to the alluvial plain where infiltration is further enhanced.
REFERENCES Böhlke, J.K., 2003, Sources, transport and reaction of nitrate, in Lindsey, B.D., Phillips, S.W., Donnelly,
C.A., Speiran, G.K., Plummer, L.N., Böhlke, J.K., Focazio, M.J., Burton, W.C., and Busenberg, Eurybiades, Residence times and nitrate transport in ground water discharging to streams in the Chesapeake Bay Watershed: U.S. Geological Survey Water-Resources Investigations Report 03-4035, p. 25-39.
Katz, B.G., Hornsby, David, Bohlke, J.F., and Mokray, M.F., 1999, Sources and chronology of nitrate contamination in spring waters, Suwannee River Basin, Florida: U.S. Geological Survey Water-Resources Investigations Report 99-4252, 54 p.
McClymonds, N.E., and Díaz, J.R., 1972, Water resources of the Jobos area, Puerto Rico - A preliminary appraisal, 1962: U.S. Geological Survey Water-Resources Bulletin 13, 32 p.
Quiñones-Aponte, Vicente, Gómez-Gómez, Fernando, and Renken, R.A., 1997, Geohydrology and simulation of ground-water flow in the Salinas to Patillas area, Puerto Rico: U.S. Geological Survey Water-Resources Investigations Report 95-4063, 37 p.
68
MANAGEMENT OF FRESHWATER RESOURCES
69

SEVENTH CARIBBEAN ISLANDS WATER RESOURCES CONGRESS OCTOBER 2007
IMPACT OF WATERSHED DEVELOPMENT ON DIVERSITY OF
FRESHWATER FISH AND CRUSTACEANS ON ST. THOMAS, U.S. VIRGIN ISLANDS
Donna Nemeth1,*, Renata Platenberg2, Rifca Mathurin1, Duvané Hodge1
ABSTRACT: In the US Virgin Islands there has been considerable effort in surveying and mapping watersheds and riparian corridors. However, there has been little previous effort in documenting the freshwater systems, namely, the stormwater drainage guts. These guts form a vital connection between terrestrial habitats and upland activities and the downstream marine environment. The current research emphasis on the problems of non-point source pollution has largely overlooked the watershed habitat through which these pollutants are transported. The majority of the guts carry water only seasonally with flows varying according to rainfall. Ephemeral pools forms in the guts that provide temporary habitat for a wide variety of fauna. Upland activities affect the levels of contaminants that flow through these habitats. We conducted a study to assess the impacts of levels of watershed development on the diversity of freshwater fauna. Freshwater habitats in highly developed watersheds contained more non-native species than those with low to moderate levels of development, and the least impacted systems had higher native faunal diversity. KEYWORDS: Bioindicators, water quality, riparian corridors, Decapoda
INTRODUCTION Situated near the eastern terminus of the Greater Antillean chain of islands in the northern Caribbean Sea, the United States Virgin Islands (USVI) comprise four major inhabited islands and more than 50 smaller offshore cays. St. Thomas, St. John, and Water Island are the three main northern islands, located on the Puerto Rican Bank to the east of Puerto Rico, while St. Croix is to the south. The demands for space by a rapidly growing human population of over 100,000 in the USVI have resulted in extensive loss and degradation of natural ecosystems, especially on densely populated St. Thomas. There has been considerable effort in the USVI to document and map watersheds and wetlands (e.g., Knowles and Amrani, 1991; Stengel, 1998; Island Resources Foundation, 2004; Platenberg, 2006). St. Thomas has limited natural freshwater resources, represented by man-made agricultural ponds and a small number of riparian stormwater corridors known locally as “guts”. The terrain of the USVI is characterized by steep hillsides with thin soils and a low permeability of underlying rock. As such, rainfall tends to run down hillsides over the surface through gut channels (Jarecki and Walkey, 2006). Native plant communities along these guts are more mesic than the surrounding upland vegetation, despite that the majority of these guts carry water only seasonally, and flows change dramatically with rainfall. Several species of freshwater fishes and shrimps have been observed to persist in these habitats (Loftus, 2003; pers. obs.). Non-native species of invertebrates, fish, and amphibians are also prevalent.
_________________________________
1 University of the Virgin Islands, # 2 John Brewer’s Bay, St. Thomas, VI 00802 2 Division of Fish and Wildlife, 6291 Estate Nazareth, St. Thomas, VI 00802
70
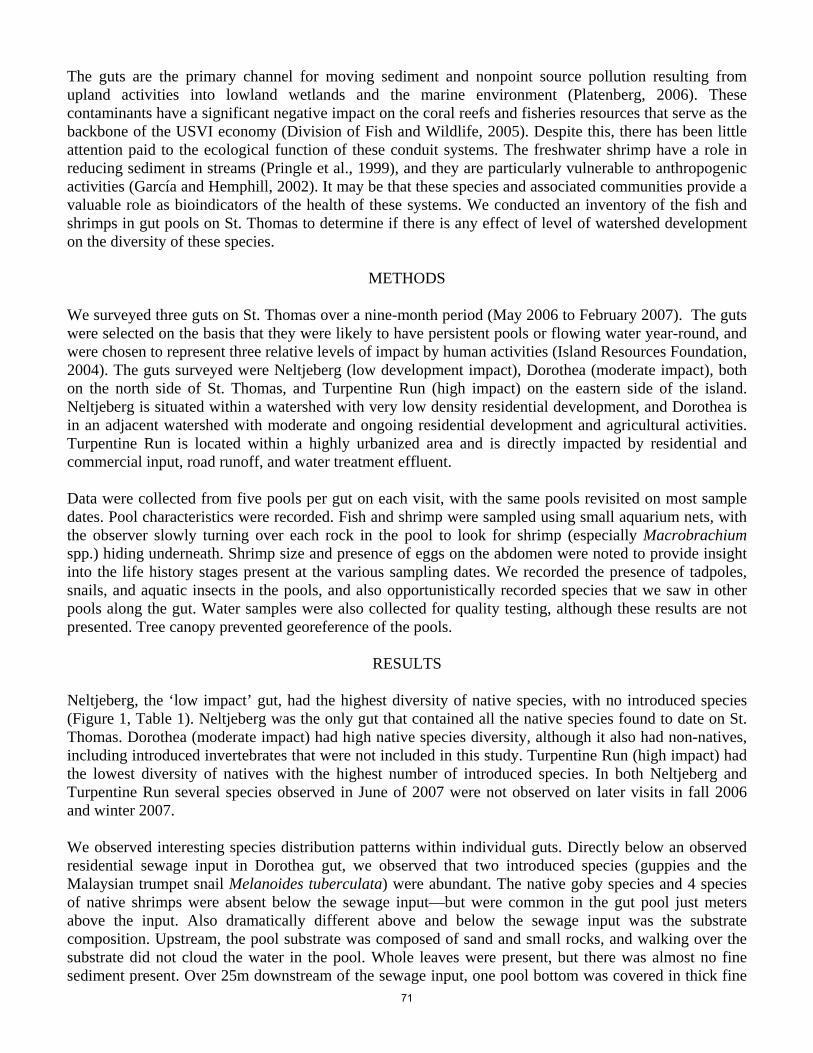
The guts are the primary channel for moving sediment and nonpoint source pollution resulting from upland activities into lowland wetlands and the marine environment (Platenberg, 2006). These contaminants have a significant negative impact on the coral reefs and fisheries resources that serve as the backbone of the USVI economy (Division of Fish and Wildlife, 2005). Despite this, there has been little attention paid to the ecological function of these conduit systems. The freshwater shrimp have a role in reducing sediment in streams (Pringle et al., 1999), and they are particularly vulnerable to anthropogenic activities (García and Hemphill, 2002). It may be that these species and associated communities provide a valuable role as bioindicators of the health of these systems. We conducted an inventory of the fish and shrimps in gut pools on St. Thomas to determine if there is any effect of level of watershed development on the diversity of these species.
METHODS We surveyed three guts on St. Thomas over a nine-month period (May 2006 to February 2007). The guts were selected on the basis that they were likely to have persistent pools or flowing water year-round, and were chosen to represent three relative levels of impact by human activities (Island Resources Foundation, 2004). The guts surveyed were Neltjeberg (low development impact), Dorothea (moderate impact), both on the north side of St. Thomas, and Turpentine Run (high impact) on the eastern side of the island. Neltjeberg is situated within a watershed with very low density residential development, and Dorothea is in an adjacent watershed with moderate and ongoing residential development and agricultural activities. Turpentine Run is located within a highly urbanized area and is directly impacted by residential and commercial input, road runoff, and water treatment effluent. Data were collected from five pools per gut on each visit, with the same pools revisited on most sample dates. Pool characteristics were recorded. Fish and shrimp were sampled using small aquarium nets, with the observer slowly turning over each rock in the pool to look for shrimp (especially Macrobrachium spp.) hiding underneath. Shrimp size and presence of eggs on the abdomen were noted to provide insight into the life history stages present at the various sampling dates. We recorded the presence of tadpoles, snails, and aquatic insects in the pools, and also opportunistically recorded species that we saw in other pools along the gut. Water samples were also collected for quality testing, although these results are not presented. Tree canopy prevented georeference of the pools.
RESULTS Neltjeberg, the ‘low impact’ gut, had the highest diversity of native species, with no introduced species (Figure 1, Table 1). Neltjeberg was the only gut that contained all the native species found to date on St. Thomas. Dorothea (moderate impact) had high native species diversity, although it also had non-natives, including introduced invertebrates that were not included in this study. Turpentine Run (high impact) had the lowest diversity of natives with the highest number of introduced species. In both Neltjeberg and Turpentine Run several species observed in June of 2007 were not observed on later visits in fall 2006 and winter 2007. We observed interesting species distribution patterns within individual guts. Directly below an observed residential sewage input in Dorothea gut, we observed that two introduced species (guppies and the Malaysian trumpet snail Melanoides tuberculata) were abundant. The native goby species and 4 species of native shrimps were absent below the sewage input—but were common in the gut pool just meters above the input. Also dramatically different above and below the sewage input was the substrate composition. Upstream, the pool substrate was composed of sand and small rocks, and walking over the substrate did not cloud the water in the pool. Whole leaves were present, but there was almost no fine sediment present. Over 25m downstream of the sewage input, one pool bottom was covered in thick fine
71
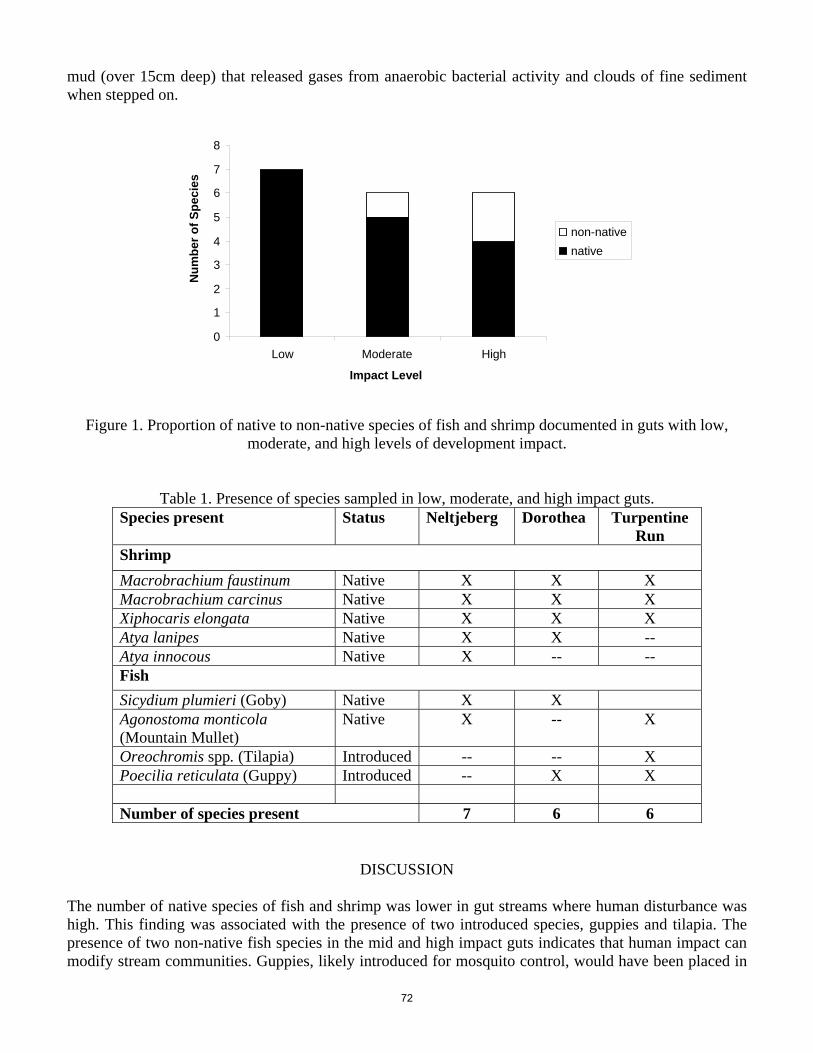
mud (over 15cm deep) that released gases from anaerobic bacterial activity and clouds of fine sediment when stepped on.
Figure 1. Proportion of native to non-native species of fish and shrimp documented in guts with low, moderate, and high levels of development impact.
Table 1. Presence of species sampled in low, moderate, and high impact guts. Species present Status Neltjeberg Dorothea Turpentine
Run Shrimp Macrobrachium faustinum Native X X X Macrobrachium carcinus Native X X X Xiphocaris elongata Native X X X Atya lanipes Native X X -- Atya innocous Native X -- -- Fish Sicydium plumieri (Goby) Native X X Agonostoma monticola (Mountain Mullet)
Native X -- X
Oreochromis spp. (Tilapia) Introduced -- -- X Poecilia reticulata (Guppy) Introduced -- X X Number of species present 7 6 6
DISCUSSION The number of native species of fish and shrimp was lower in gut streams where human disturbance was high. This finding was associated with the presence of two introduced species, guppies and tilapia. The presence of two non-native fish species in the mid and high impact guts indicates that human impact can modify stream communities. Guppies, likely introduced for mosquito control, would have been placed in
0 1 2 3 4 5 6 7 8
Low Moderate High
Impact Level
non-native native
Num
ber o
f Spe
cies
72

streams near where humans would encounter heavy mosquito populations. Tilapia have been brought to the USVI for aquaculture, and may have been accidentally or intentionally released in some streams and ponds. Both fish species have the potential to prey on other native species and their larvae, or to compete with them for food resources. The impact of these species on the diversity of native species is unknown; they may be changing the trophic interactions with respect to predation or competition. The non-native species may be more tolerant of poor water-quality and able to persist in habitats that are suboptimal or uninhabitable by native species. Our observations in habitat downstream of a residential sewage leak provided the clearest support for the potential impact of nutrient loading. Pools immediately downstream had heavy sediment accumulation, and lacked native species. The only species present in those areas were guppies, and an introduced trumpet snail that feeds on dead and decaying organic matter. Additional support is evidenced that the least impacted gut had the highest diversity of native species without introduced species. Atyid shrimps (Atya and Xiphocaris) are known to significantly reduce the accumulation of benthic sediments, which affects community structure through allowing higher biomass of algae and benthic insects (Pringle et al., 1993). Thus, the absence of such species can have a major impact on the entire community food-web structure. Atya spp. was not observed in Turpentine Run; further investigation is needed to determine if its absence is a consequence of high contaminant levels or predation/competition from introduced tilapia. There is likely some random component as to what species may be found in a given watershed because all the native fish and shrimp species are amphidromous, with a marine larval phase. Thus, there is likely to be high natural variability in terms of a given species finding a particular stream at the correct time in its larval development. Because of the high variability in rainfall and water flow throughout the year, the guts do not always maintain access to the sea for larval shrimp or fish to enter. Thirdly, there are other physical characteristics of the stream that we did not measure (flow, dissolved oxygen, suspended solids, benthic habitat, and the temporal variability of all of these) that could influence the distribution of species. Further research is needed to determine the impacts of non-native species, sediment loading, and contaminants on native shrimp and fish, and to determine if these species can be used to predict water quality.
ACKNOWLEDGEMENTS
This work was funded by the Water Resources Research Institute Project 2006Vi73B through the University of the Virgin Islands. Additional support was provided through a US Fish and Wildlife Service Habitat Restoration Grant (W-22) for wetlands conservation in the USVI through the Virgin Islands Division of Fish and Wildlife.
REFERENCES Division of Fish and Wildlife, 2005. United States Virgin Islands marine resources and fisheries strategic
and comprehensive conservation plan. Department of Planning and Natural Resources, St. Thomas.
García, E.R., Hemphill, N., 2002. Factors influencing the conservation of freshwater decapod crustaceans in Puerto Rico. Proceedings of the International Association of Theoretical and Applied Limnology 28, 807-810.
Island Resources Foundation, 2004. Inventory of wetlands and riparian areas in the U.S. Virgin Islands. Final report. Division of Environmental Protection, Department of Planning and Natural Resources, St. Thomas.
73
Jarecki, L., Walkey, M., 2006. Variable hydrology and salinity of salt ponds in the British Virgin Islands. Saline Systems 2: 15 pp. Available online at: http://www.salinesystems.org/content/2/1/2 .
Knowles, W.C., Amrani, C., 1991. Wildlife use of the Virgin Islands’ wetlands. Final report FW-12-D. Division of Fish and Wildlife, Department of Planning and Natural Resources, St. Thomas.
Loftus, W.F., 2003. Inventory of fishes in inland fresh- and brackish-water habitats of Virgin Islands National Park. Final report. U.S. National Park Service Inventory and Monitoring Program, Southeast Region, Atlanta, GA.
Platenberg, R.J., 2006. Wetlands conservation plan for St. Thomas and St. John, U.S. Virgin Islands. Division of Fish and Wildlife, Department of Planning and Natural Resources, St. Thomas.
Pringle, C.M., Blake, G.A., Covich, A.P., Buzby, K.M., Finley, A., 1993. Effects of omnivorous shrimp in a montane tropical stream: Sediment removal, disturbance of sessile invertebrates and enhancement of understory algal biomass. Oecologia 93, 1-11.
Pringle, C.M., Hemphill, N.H., McDowell, W., Bednarek, A., March. J., 1999. Linking species and ecosystems: Different biotic assemblages cause interstream differences in organic matter. Ecology 80, 1860-1872.
Stengel, C.A., 1998. The survey of the salt ponds of the U.S. Virgin Islands. Final report EPA Wetlands Protection C-21. Division of Fish and Wildlife, Department of Planning and Natural Resources, St. Thomas.
74
OCTOBER SEVENTH CARIBBEAN ISLANDS WATER RESOURCES CONGRESS
2007
Effectiveness of Mandatory Law of Cistern Construction for Rainwater Harvesting on Supply and Demand of Public Water in U.S. Virgin Islands
Hossana Solomon1 and Henry H. Smith2
ABSTRACT: United States Virgin Islands government instituted a law that required mandatory building of cistern for all dwellings and businesses. The law made United States Virgin Islands the only place in the modern world where citizens are required by law to be directly responsible for their own domestic water supply, unlike many places where the major responsibility of providing public water rest under the local or national governments, municipalities or private or public utility companies. The building code on the United States Virgin Islands amended and reenacted in 1964 and revised in 1996 has a clause setting a mandatory cistern construction or well for all dwellings except those units that have connection to public pipe water supply. The study indicates only 20 percent of dwellings and less than 15 percent of businesses in United States Virgin Islands depend on public water supply. The majority households and businesses depend on cistern water harvested from their rooftops and use the public source as insurance or emergency purpose whenever they run out of water from their cistern. Households can order water delivery to refill their cistern from a number of water delivery businesses operating in the islands. Delivery cost adds to the price of water by 300 percent.
KEYWORDS: USVI Mandatory Building Code, Rainwater Harvesting, Demand and Supply , Standpipe Public Water
INTRODUCTION
In the small islands of the United State Virgin Islands (USVI), potable water is a very scarce resource. Historically, rainwater provided the only major sources of fresh water caught on the roofs and stored on cistern. However, due to the irregularity of the rainfall, and high runoff associated with the hilly topography of the islands, there was a constant necessity for establishing a larger and more satisfactory supply since early 1920s including barging water from neighboring island of Puerto Rico. Major population growth in the 1960s and ‘70s due to tourism and increased standard of living, out stripped the local sources. As water demand increased, USVI government instituted a law that required mandatory building of cistern for all dwellings and businesses (1 McElroy, 1976). The law made USVI the only place in the modern world where citizens are required by law to be directly responsible for their own domestic water supply, unlike several other places where the major responsibility of water left to governments or municipalities and private or public utility companies. Building code on the USVI amended and reenacted in 1964 and revised in 1996 has a clause setting a mandatory cistern construction or well for all dwellings except those units that have connection to public pipe water supply. The USVI government also took drastic measures to supply water to the territory from Seawater. The first distillation plant was installed in 1962 by the government by establishing a public corporation USVI Water and Power Authority (WAPA) to provide electrical power and water from same facility. Since then distillation, provides almost all the public potable water supply to the islands. 1 Humanities and Social Sciences Devision, University of the Virgin Islands, #2 John Brewers Bay, St. Thomas, USVI 00802 ([email protected]) 2 Director of Water Resources, University of the Virgin Islands, #2 John Brewers Bay, St. Thomas, USVI 00802 ([email protected])
75
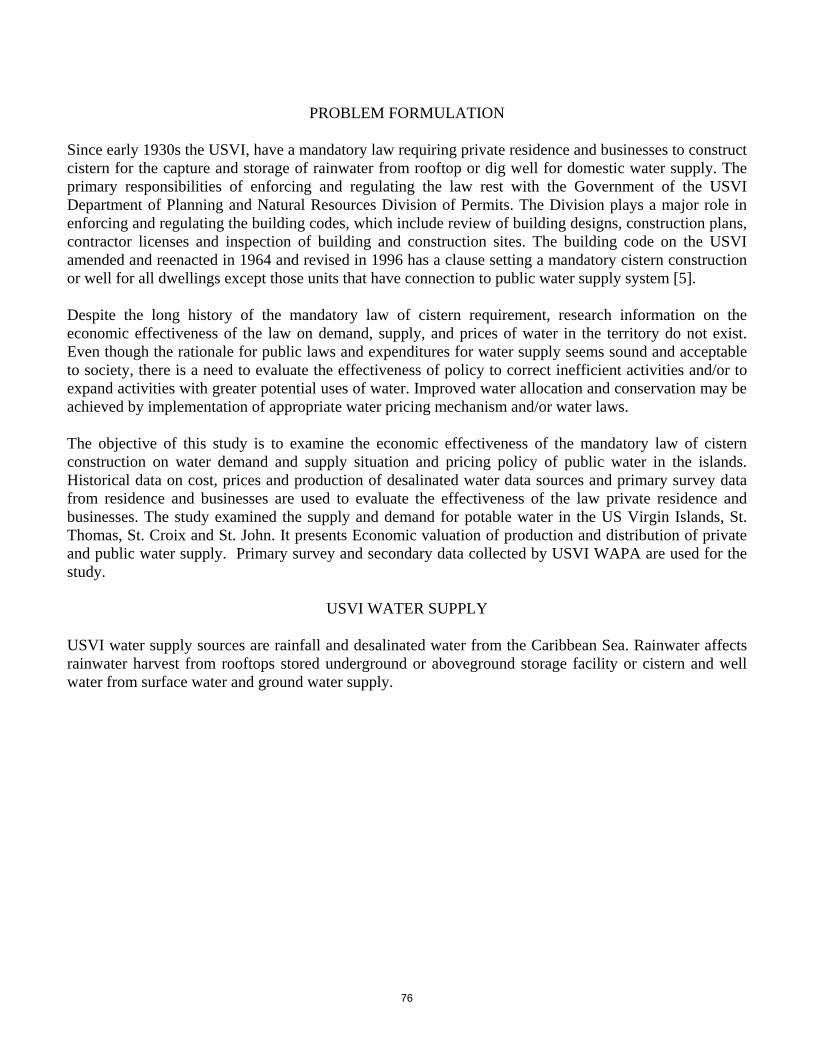
PROBLEM FORMULATION Since early 1930s the USVI, have a mandatory law requiring private residence and businesses to construct cistern for the capture and storage of rainwater from rooftop or dig well for domestic water supply. The primary responsibilities of enforcing and regulating the law rest with the Government of the USVI Department of Planning and Natural Resources Division of Permits. The Division plays a major role in enforcing and regulating the building codes, which include review of building designs, construction plans, contractor licenses and inspection of building and construction sites. The building code on the USVI amended and reenacted in 1964 and revised in 1996 has a clause setting a mandatory cistern construction or well for all dwellings except those units that have connection to public water supply system [5]. Despite the long history of the mandatory law of cistern requirement, research information on the economic effectiveness of the law on demand, supply, and prices of water in the territory do not exist. Even though the rationale for public laws and expenditures for water supply seems sound and acceptable to society, there is a need to evaluate the effectiveness of policy to correct inefficient activities and/or to expand activities with greater potential uses of water. Improved water allocation and conservation may be achieved by implementation of appropriate water pricing mechanism and/or water laws. The objective of this study is to examine the economic effectiveness of the mandatory law of cistern construction on water demand and supply situation and pricing policy of public water in the islands. Historical data on cost, prices and production of desalinated water data sources and primary survey data from residence and businesses are used to evaluate the effectiveness of the law private residence and businesses. The study examined the supply and demand for potable water in the US Virgin Islands, St. Thomas, St. Croix and St. John. It presents Economic valuation of production and distribution of private and public water supply. Primary survey and secondary data collected by USVI WAPA are used for the study.
USVI WATER SUPPLY
USVI water supply sources are rainfall and desalinated water from the Caribbean Sea. Rainwater affects rainwater harvest from rooftops stored underground or aboveground storage facility or cistern and well water from surface water and ground water supply.
76
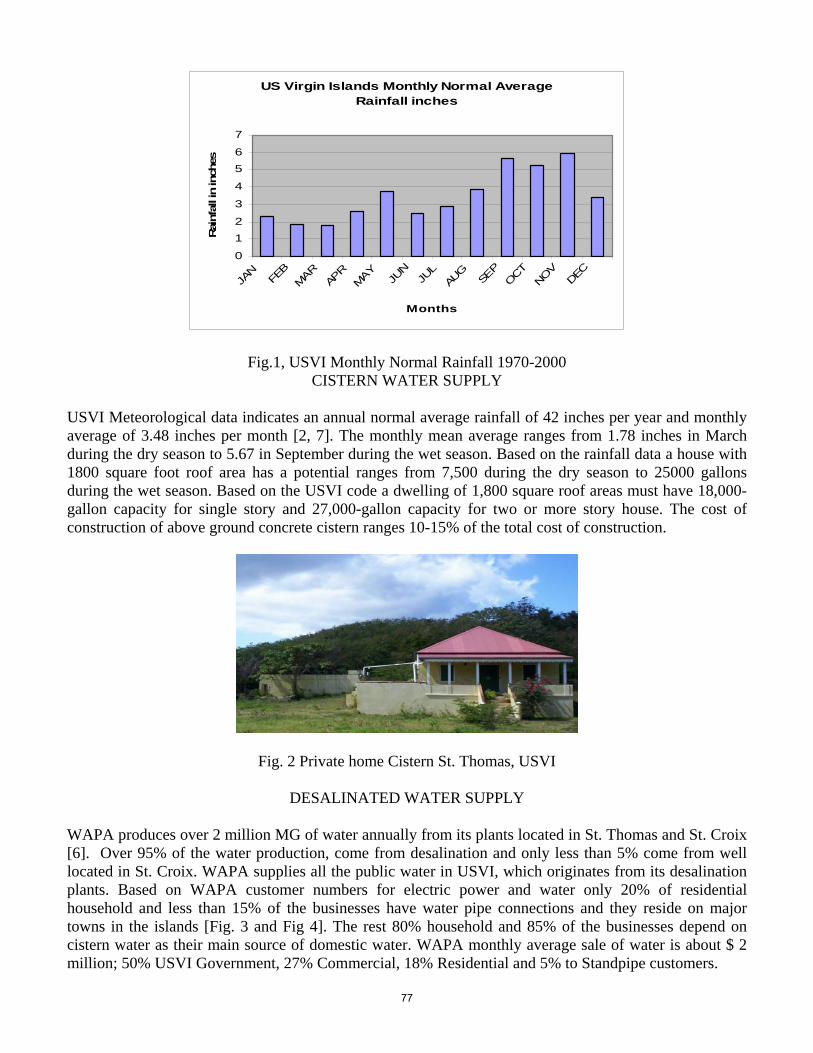
US Virgin Islands Monthly Normal Average Rainfall inches
0
12
3
4
56
7
JAN
FEB
MAR
APR
MAY
JUN
JUL
AUG
SEP
OCT
NOV
DEC
Months
Rai
nfal
l in
inch
es
Fig.1, USVI Monthly Normal Rainfall 1970-2000 CISTERN WATER SUPPLY
USVI Meteorological data indicates an annual normal average rainfall of 42 inches per year and monthly average of 3.48 inches per month [2, 7]. The monthly mean average ranges from 1.78 inches in March during the dry season to 5.67 in September during the wet season. Based on the rainfall data a house with 1800 square foot roof area has a potential ranges from 7,500 during the dry season to 25000 gallons during the wet season. Based on the USVI code a dwelling of 1,800 square roof areas must have 18,000-gallon capacity for single story and 27,000-gallon capacity for two or more story house. The cost of construction of above ground concrete cistern ranges 10-15% of the total cost of construction.
Fig. 2 Private home Cistern St. Thomas, USVI
DESALINATED WATER SUPPLY WAPA produces over 2 million MG of water annually from its plants located in St. Thomas and St. Croix [6]. Over 95% of the water production, come from desalination and only less than 5% come from well located in St. Croix. WAPA supplies all the public water in USVI, which originates from its desalination plants. Based on WAPA customer numbers for electric power and water only 20% of residential household and less than 15% of the businesses have water pipe connections and they reside on major towns in the islands [Fig. 3 and Fig 4]. The rest 80% household and 85% of the businesses depend on cistern water as their main source of domestic water. WAPA monthly average sale of water is about $ 2 million; 50% USVI Government, 27% Commercial, 18% Residential and 5% to Standpipe customers.
77
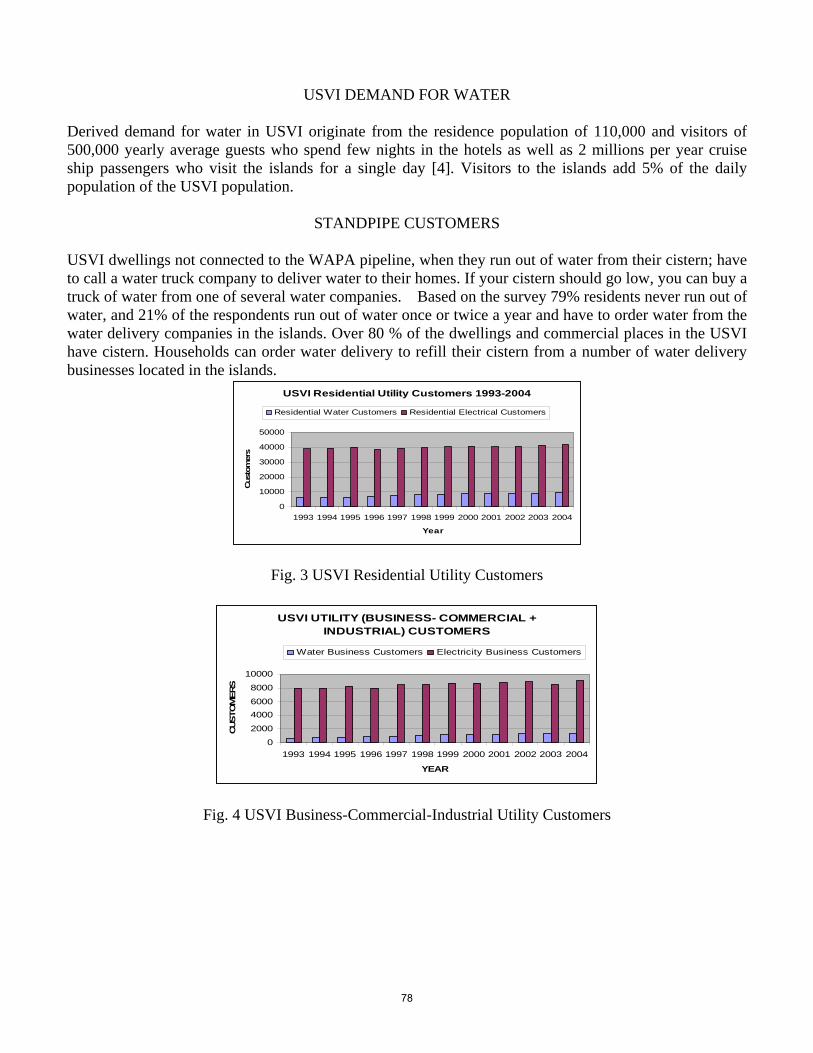
USVI DEMAND FOR WATER
Derived demand for water in USVI originate from the residence population of 110,000 and visitors of 500,000 yearly average guests who spend few nights in the hotels as well as 2 millions per year cruise ship passengers who visit the islands for a single day [4]. Visitors to the islands add 5% of the daily population of the USVI population.
STANDPIPE CUSTOMERS
USVI dwellings not connected to the WAPA pipeline, when they run out of water from their cistern; have to call a water truck company to deliver water to their homes. If your cistern should go low, you can buy a truck of water from one of several water companies. Based on the survey 79% residents never run out of water, and 21% of the respondents run out of water once or twice a year and have to order water from the water delivery companies in the islands. Over 80 % of the dwellings and commercial places in the USVI have cistern. Households can order water delivery to refill their cistern from a number of water delivery businesses located in the islands.
USVI Residential Utility Customers 1993-2004
0
10000
20000
30000
40000
50000
1993 1994 1995 1996 1997 1998 1999 2000 2001 2002 2003 2004
Year
Cus
tom
ers
Residential Water Customers Residential Electrical Customers
Fig. 3 USVI Residential Utility Customers
USVI UTILITY (BUSINESS- COMMERCIAL + INDUSTRIAL) CUSTOMERS
0
2000
40006000
8000
10000
1993 1994 1995 1996 1997 1998 1999 2000 2001 2002 2003 2004
YEAR
CUSTO
MERS
Water Business Customers Electricity Business Customers
Fig. 4 USVI Business-Commercial-Industrial Utility Customers
78

1993 1994 1995 1996 1997 1998 1999 2000 2001 2002 2003 2004 2005 2006
40
50
60
70
80
90
100 STANDPIPE DEMAND FOR PUBLIC WATER 1000 MG
Fig.5 Standpipe public water demand 1993-2004
Fig. 5, Standpipe Water Delivery St. Thomas
CONCLUSION
After experiencing chronic water shortages for decades, the USVI instituted policies aimed at exploiting all available water resources from rainwater collection from rooftops, building surface-water collection reservoirs, digging wells and barging water with boats from neighboring island. In early 1960’s the territory embarked on desalinating the seawater as dependable fresh water resource by building a joint production system of generating electric power and fresh water from the same facility. USVI government also instituted a law that required mandatory building of cistern for all dwellings. The law made USVI the only place in the modern world where citizens are required by law to be directly responsible for their own domestic water supply [3], unlike other places where the major responsibility of providing rest under the local or national governments, municipalities or private or public utility companies. The building code on the USVI amended and reenacted in 1964 and revised in 1996 has a clause setting a mandatory cistern construction or well for all dwellings except those units that have connection to public pipe water supply connections. The study indicates only 20 % of dwellings in USVI and less than 15 % of businesses depend on public water supply. The majority residents depend on cistern water and use the public source as insurance whenever they run out of their cistern. The USVI experience in managing and exploiting its scarce water resource has an important valuable lesson to the rest of the world with chronic shortage of clean potable water supply. Despite increase in population and a growing economic development by empowering its residents to be responsible for their own water supply, the USVI law of mandatory cistern construction has freed them to be less dependent on government bureaucrats as is the case of our modern world. Citizens of USVI with adequate cistern
79
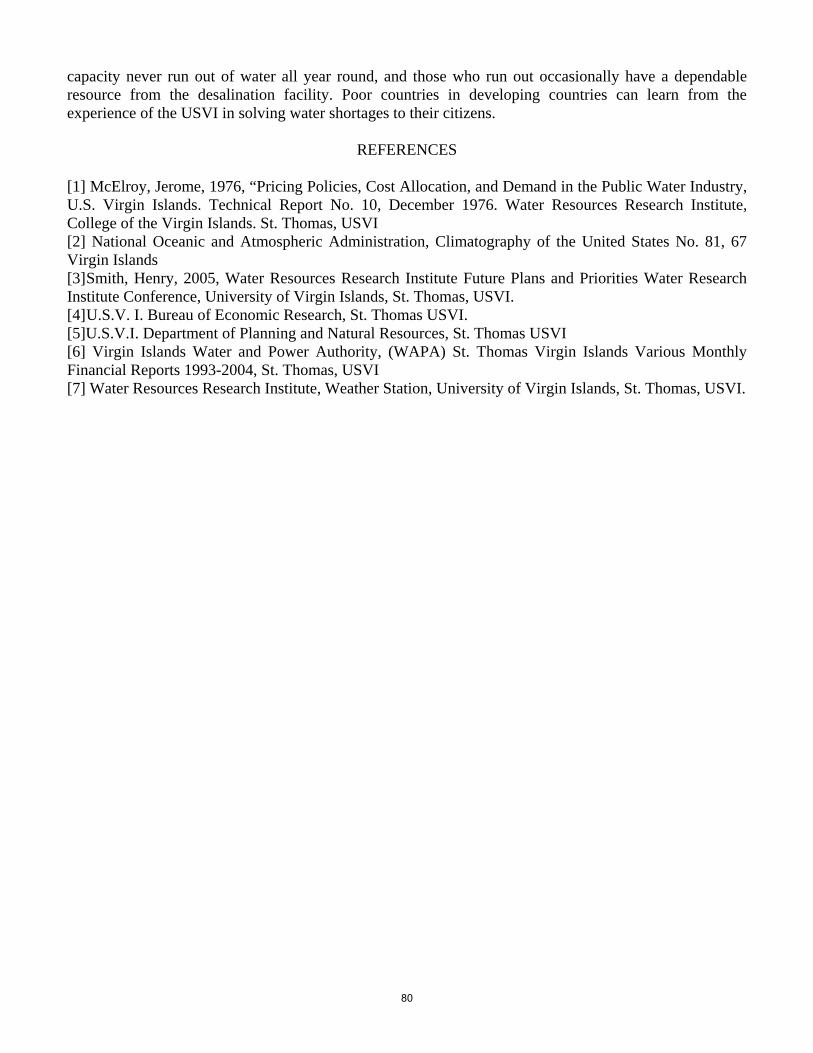
capacity never run out of water all year round, and those who run out occasionally have a dependable resource from the desalination facility. Poor countries in developing countries can learn from the experience of the USVI in solving water shortages to their citizens.
REFERENCES
[1] McElroy, Jerome, 1976, “Pricing Policies, Cost Allocation, and Demand in the Public Water Industry, U.S. Virgin Islands. Technical Report No. 10, December 1976. Water Resources Research Institute, College of the Virgin Islands. St. Thomas, USVI [2] National Oceanic and Atmospheric Administration, Climatography of the United States No. 81, 67 Virgin Islands [3] Smith, Henry, 2005, Water Resources Research Institute Future Plans and Priorities Water Research Institute Conference, University of Virgin Islands, St. Thomas, USVI. [4] U.S.V. I. Bureau of Economic Research, St. Thomas USVI. [5]U.S.V.I. Department of Planning and Natural Resources, St. Thomas USVI [6] Virgin Islands Water and Power Authority, (WAPA) St. Thomas Virgin Islands Various Monthly Financial Reports 1993-2004, St. Thomas, USVI [7] Water Resources Research Institute, Weather Station, University of Virgin Islands, St. Thomas, USVI.
80

OCTOBER SEVENTH CARIBBEAN ISLANDS WATER RESOURCES CONGRESS
2007
HYDROLOGIC STUDIES USING VFLO IN WESTERN PUERTO RICO*
Alejandra Rojas1 and Eric W. Harmsen2 ABSTRACT: Real-time prediction of flash flooding can save money and save lives. The goal of this project is to develop real-time flash flood prediction capabilities within the Collaborative Adaptive Sensing of the Atmosphere (CASA) Testbed located in western Puerto Rico. Project objectives include: configuration and calibration of a hydrologic simulation model capable of accepting real-time radar data from the CASA distributed collaborative adaptive radar network as input, augmentation of the current river stage and flow monitoring network on the Añasco, Yagüez and Guanajibo rivers; evaluation of the small-scale variation of rainfall within the study area; validation of the rainfall estimates from the CASA distributed collaborative adaptive radar network; and development and testing of a real-time flood forecasting system for western Puerto Rico. An initial step in developing an Alarm Prediction System is to enhance forecasting skill, to understand the dynamics of the system and how the system response is affected by the spatial resolution and input uncertainty in complex topography and tropical environments. This paper provides some preliminary results related to the configuration and calibration of the hydrologic simulation model. KEYWORDS: Distributed models, Vflo, runoff, rainfall interpolation methods.
INTRODUCTION In this study we will use the distributed hydrological model Vflo (Vieux and Associates, Inc., 2004) to simulate flash flooding in western Puerto Rico (Figure 1). The region of study includes the Río Guanajibo, Río Grande de Añasco and Río Yagüez basins which compass approximately 800 km2 and include the Guayo, Yahuecas and Prieto reservoirs as boundary condition on the east and the Mayagüez Bay on the west. The flood plain associated with the Río Grande de Añasco is characterized by an alluvial fan having an area of 41.5 km2 and 0.08% average slope. Most of the input data for the Vflo model was prepared in ArcGIS 9.2, using the USGS 30 m x 30 m digital elevation model (DEM). Overland slope, flow direction, and stream locations were determined from the DEM and resized to 200 meters spatial resolution. During this step the streams were “burned” into the model grid using a multi-step process in ArcGIS, in which the flow direction is forced to follow to rivers. This step is necessary because the flow direction calculation tends not to be accurate in low slope areas (e.g., Río Grande de Añasco and Río Guanajibo floodplains). The final resized digital elevation model has a correct flow direction according to the hydrological maps of the topographic quadrangles (Figure 1). The flow direction and the rivers delineated were calculated with Arc Hydro Tools and ArcGIS. With the flow direction information, it was possible to create the stream network. First, the flow accumulation was calculated, which counts the number of cells which contribute flow to each cell. A cell located at a watershed outlet would have a flow accumulation from the total cells in the watershed. Next, a stream definition was made assuming that flow accumulation from 90 cells will produce a river.
1 Ph.D. Graduate Research Assistant, University of Puerto Rico, Mayagüez, Civil Engineering Department. [email protected] 2 Professor, University of Puerto Rico, Mayagüez, Agriculture and Biosystems Engineering Department. [email protected] * Funding for this research was provided by NSF-CASA.
81
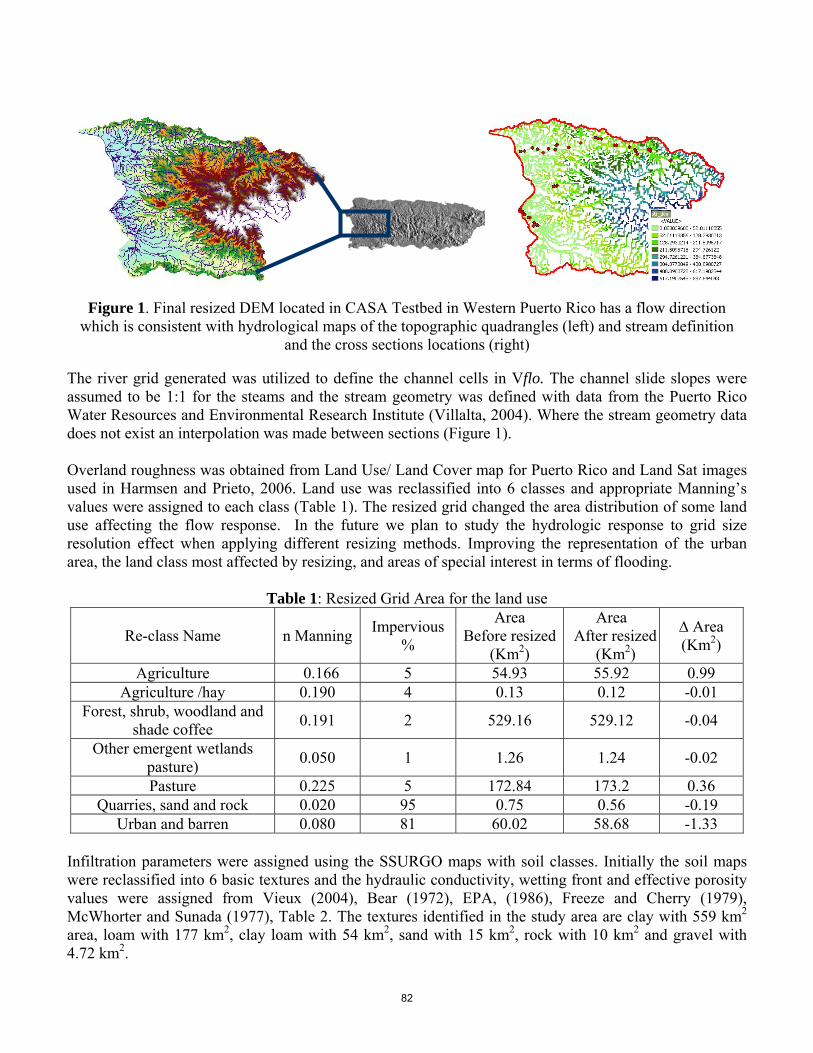
Figure 1. Final resized DEM located in CASA Testbed in Western Puerto Rico has a flow direction
which is consistent with hydrological maps of the topographic quadrangles (left) and stream definition and the cross sections locations (right)
The river grid generated was utilized to define the channel cells in Vflo. The channel slide slopes were assumed to be 1:1 for the steams and the stream geometry was defined with data from the Puerto Rico Water Resources and Environmental Research Institute (Villalta, 2004). Where the stream geometry data does not exist an interpolation was made between sections (Figure 1). Overland roughness was obtained from Land Use/ Land Cover map for Puerto Rico and Land Sat images used in Harmsen and Prieto, 2006. Land use was reclassified into 6 classes and appropriate Manning’s values were assigned to each class (Table 1). The resized grid changed the area distribution of some land use affecting the flow response. In the future we plan to study the hydrologic response to grid size resolution effect when applying different resizing methods. Improving the representation of the urban area, the land class most affected by resizing, and areas of special interest in terms of flooding.
Table 1: Resized Grid Area for the land use
Re-class Name n Manning Impervious %
Area Before resized
(Km2)
Area After resized
(Km2)
∆ Area (Km2)
Agriculture 0.166 5 54.93 55.92 0.99 Agriculture /hay 0.190 4 0.13 0.12 -0.01
Forest, shrub, woodland and shade coffee 0.191 2 529.16 529.12 -0.04
Other emergent wetlands pasture) 0.050 1 1.26 1.24 -0.02
Pasture 0.225 5 172.84 173.2 0.36 Quarries, sand and rock 0.020 95 0.75 0.56 -0.19
Urban and barren 0.080 81 60.02 58.68 -1.33 Infiltration parameters were assigned using the SSURGO maps with soil classes. Initially the soil maps were reclassified into 6 basic textures and the hydraulic conductivity, wetting front and effective porosity values were assigned from Vieux (2004), Bear (1972), EPA, (1986), Freeze and Cherry (1979), McWhorter and Sunada (1977), Table 2. The textures identified in the study area are clay with 559 km2 area, loam with 177 km2, clay loam with 54 km2, sand with 15 km2, rock with 10 km2 and gravel with 4.72 km2.
82

Puerto Rico is characterized by complex terrain and tropical systems that are very irregular and affect the rainfall distribution, and to assume a uniform distribution over a watershed would be erroneous. On the other hand, we can distribute the rainfall using different interpolation methods or using radar rainfall. Radar rainfall accumulations, however, need to be adjusted with rain gauges data. In May 2001, a flooding event in Puerto Rico caused over $150 million in damage, the Storm Total Precipitation Estimates from Doppler Radar data underestimated the rainfall by up to 66% in some areas. The first simulation was performed over the period from the 11th of Nov. to the 13th of Nov., 2003. During this period a severe tropical storm occurred over Puerto Rico (mainly in the east), which caused significant flash flooding over urban and agricultural areas. During this period, only six USGS rainfall gauges and three stream flow gauges were in operation within the study area (Table 3).
Table 2: Infiltration values
Texture Effective Porosity
Wetting Point (cm)
Hydraulic Conductivity
(cm/h) Sand 0.42 4.95 11.78 Loam 0.43 8.89 0.34
Clay Loam 0.31 20.88 0.10 Clay 0.39 31.63 0.03
Gravel 0.24 1.5 2.27 Rock 0.17 1 0.036
Preliminarily, a simulation was made using a distributed hydrologic model (Vflo) to evaluate how the flow prediction is affected by the rainfall interpolation method. The rainfall was spatially distributed using the traditional and widely used Thiessen polygons and two interpolation methods, the inverse distance weighted and the exponential weighted interpolations. Additionally a local sensitivity analysis was made with some parameters (e.g., hydraulic conductivity, roughness, effective porosity and initial soil moisture), variations of multiplicative factors of 0.25, 0.5, 1.5 and 2 were made using 4 storm events (Georges Hurricane, September 1998; Storm Jeanne, September 2004, November 11th to 16th 2004, and May 18 to June 27th, 2007). Before developing a long-term calibration it is desirable to know the response of the watershed to different rainfall distributions. We made sure that the calibrated parameters were varied within an reasonable range.
Table 3. USGS Stations in Study area and total rainfall measure for November 11 to 13 2003 USGS Stations USGS ID Altitude
(m) Rainfall
(mm) RIO GRANDE DE ANASCO AT BO. GUACIO 50143930 70.0 88.6 RIO GRANDE DE ANASCO NR SAN SEBASTIAN
50144000 40.0 72.9
RIO CASEI ABV HACIENDA CASEI 50145395 85.0 81.5 RIO GUANAJIBO AT HWY 119 AT SAN GERMAN
50131990 43.3
264.4
RIO GUANAJIBO NEAR HORMIGUEROS 50138000 4.0 101.6 RIO ROSARIO NR HORMIGUEROS 50136400 70.0 139.2
The flow analysis focused on three locations where USGS stream flow gauges are located, Río Grande de Añasco near San Sebastian; Río Guanajibo near Hormigueros and Río Rosario at Guanajibo basin. Large differences were founded using the 3 quantification rainfall methods. Table 4 presents the total average
83
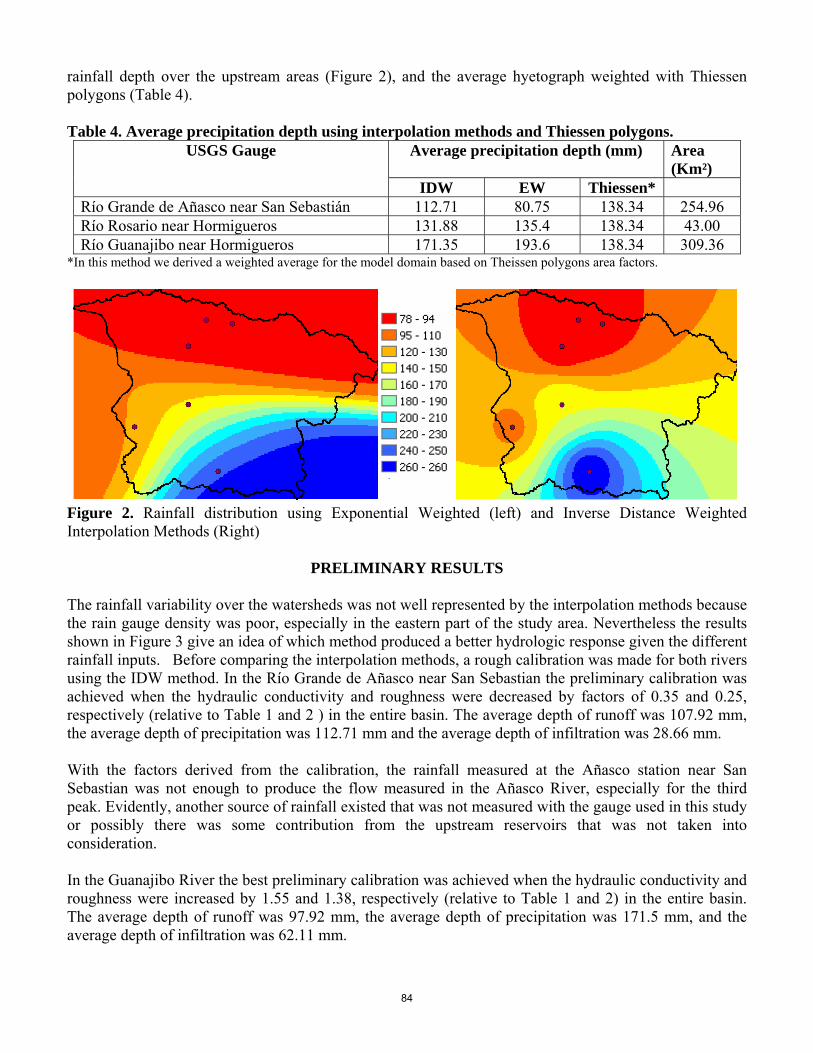
rainfall depth over the upstream areas (Figure 2), and the average hyetograph weighted with Thiessen polygons (Table 4). Table 4. Average precipitation depth using interpolation methods and Thiessen polygons.
Average precipitation depth (mm) Area (Km²)
USGS Gauge
IDW EW Thiessen* Río Grande de Añasco near San Sebastián 112.71 80.75 138.34 254.96 Río Rosario near Hormigueros 131.88 135.4 138.34 43.00 Río Guanajibo near Hormigueros 171.35 193.6 138.34 309.36
*In this method we derived a weighted average for the model domain based on Theissen polygons area factors.
Figure 2. Rainfall distribution using Exponential Weighted (left) and Inverse Distance Weighted Interpolation Methods (Right)
PRELIMINARY RESULTS The rainfall variability over the watersheds was not well represented by the interpolation methods because the rain gauge density was poor, especially in the eastern part of the study area. Nevertheless the results shown in Figure 3 give an idea of which method produced a better hydrologic response given the different rainfall inputs. Before comparing the interpolation methods, a rough calibration was made for both rivers using the IDW method. In the Río Grande de Añasco near San Sebastian the preliminary calibration was achieved when the hydraulic conductivity and roughness were decreased by factors of 0.35 and 0.25, respectively (relative to Table 1 and 2 ) in the entire basin. The average depth of runoff was 107.92 mm, the average depth of precipitation was 112.71 mm and the average depth of infiltration was 28.66 mm. With the factors derived from the calibration, the rainfall measured at the Añasco station near San Sebastian was not enough to produce the flow measured in the Añasco River, especially for the third peak. Evidently, another source of rainfall existed that was not measured with the gauge used in this study or possibly there was some contribution from the upstream reservoirs that was not taken into consideration. In the Guanajibo River the best preliminary calibration was achieved when the hydraulic conductivity and roughness were increased by 1.55 and 1.38, respectively (relative to Table 1 and 2) in the entire basin. The average depth of runoff was 97.92 mm, the average depth of precipitation was 171.5 mm, and the average depth of infiltration was 62.11 mm.
84

Río Grande de Añasco near San Sebastián
0
100
200
300
400
500
600
700
800
11/10/200312:00
11/11/20030:00
11/11/200312:00
11/12/20030:00
11/12/200312:00
11/13/20030:00
11/13/200312:00
11/14/20030:00
11/14/200312:00
11/15/20030:00
11/15/200312:00
Flow
(m^3
/s)
Thiessen AverageEW InterpolationIDW InterpolationObserved
Figure 3. Watershed response to different interpolation methods The analysis revealed that overland flow was most sensitive to the initial saturation, soil depth, and hydraulic conductivity. Simulated storm volumes compared reasonably well with observed storm volumes for Nov. 2003, Sep. 2004 and May/Jun 2007. However, the model could not reproduce the observed storm volume for Hurricane George during Sep. 1998. This was probably due to the fact that a large volume was contributed by the upstream reservoir, which was not accounted for in the model.
REFERENCES Bear, J., 1972. Dynamics of Fluids in Porous Materials, American Elsevier. Curtis, D., Ford, D., 2002. Real-time Flood Forecasting on the Lower Colorado River using radar rainfall.
22th Annual Conference Floodplain Management Planning. April 7-10, 2002 Freeze R. A., Cherry, J. A., 1979. Groundwater, Prentice Hall Publishers. Harmsen, E. W. and M. G. Prieto, 2006. Climate change impacts on the hydrology of a tropical drainage
basin: GIS analysis and numerical model development. Proceedings of the Caribbean Climate Symposium, University of Puerto Rico – Mayagüez Campus, April 24 – 25.
McWhorter, D. B., Sunada, D. K., 1977. Ground-Water Hydrology and Hydraulics. Water Resources Publications.
Prieto, M., Harmsen, E. W., 2006. Climate Change Impacts on the Hydrology of Tropical Drainage Basin: Progress Report. NOAA-CREST Symposium 2006, Feb. 23-25, University of Puerto Rico – Mayagüez Campus.
Vieux, B.E., 2004. Distributed Hydrologic Modeling using GIS. Water Science and Technology Library. Volume 48. Second Edition.
Vieux, B.E., 2004. VfloTM 3.0 Desktop User Manual. www.vieuxinc.com 28 pp. Vieux, B.E., Bedient, P.B and Mazroi, E., 2005. Real-time urban runoff simulation using radar rainfall
and physics-based distributed modeling for site-specific forecasts. 10th International Conference on Urban Drainage, Copenhagen, Denmark.
Villalta, C., 2004. Selección de Funciones de Transporte de Sedimentos para los Ríos de la Bahía de Mayagüez usando SAM. Master of Science Thesis, University of Puerto Rico, Mayagüez campus.
Warner, T. et al., 2000. Prediction of a flash flood in complex terrain. Part I: A comparition of rainfall estimates from radar, and very short range rainfall simulations from a dynamic model and an automated algorithmic system. American Meteorological Society, June, 2000.
Whiteaker, T., Robayo, O., Maidment, D. and Obenour, D., 2006. From a NexRAD rainfall map to a flood inundation map. Journal of Hydrologic Engineering, Vol. 11, No. 1, January 1, 2006.
Río Guanajibo near Hormigüeros
0
50
100
150
200
250
300
350
11/10/20030:00
11/11/20030:00
11/12/20030:00
11/13/20030:00
11/14/20030:00
11/15/20030:00
11/16/20030:00
11/17/20030:00
11/18/20030:00
Flow
(m^3
/s)
IDW InterpolationEW InterpolationThiessen AverageObserved
85

POSTER SESSION
86

OCTOBER SEVENTH CARIBBEAN ISLANDS WATER RESOURCES CONGRESS
2007
EVALUATION OF THE ADSORPTION BEHAVIOR OF TETRACYCLINE ONTO CRUMB RUBBER IN AQUEOUS SOLUTION
J. López-Morales1*, S. Nieto-Zambrano2, F. Román-Velázquez2 , and O-Perales-Pérez3
ABSTRACT
The adsorption behavior of the antibiotic tetracycline, onto a waste tire crumb rubber of mesh size ranging from 14 to 20 square millimeters in aqueous medium at neutral pH was evaluated. Kinetics experiments using waste tire crumb rubber as a sorbent material in contact with a 30 parts per million tetracycline aqueous solution showed that in 72 hours of contact time, the removal efficiency ranged from 36.35-68.17 percent depending on the waste tire crumb rubber concentration (2 to 10 grams per liter). Although at 72 hours of contact time total equilibrium could not be observed, kinetic experiments demonstrate the crumb rubber’s sorption capacity to remove tetracycline from aqueous solutions. In previous experiments at pH 3.80 and 10 parts per million of tetracycline, when placed in contact with 10 grams per liter of waste tire crumb rubber showed a removal efficiency of 48.22 percent for waste tire crumb rubber 14-20 square millimeters mesh size and 58.90 percent for waste tire crumb rubber of approximately 30 square millimeters mesh size. Our work has the potential to contribute to expand the tires recycling options using waste tire crumb rubber to remove tetracycline and other antimicrobials, as well as other contaminants from aqueous medium. KEYWORDS: Tetracycline, Antimicrobials, Waste Tire Crumb Rubber, Sorption.
INTRODUCTION
In recent years, great attention has been given to human and veterinary drugs residues in the environment (e.g. antimicrobials) due to their occurrence, fate and possible threat to affect the water quality and soils (Heberer, 2002). Numerous compounds of pharmaceuticals origin, including TC, have been identified and quantified at trace levels (Kolpin et al, 2002). Questions have been raised over the potential impacts of veterinary medicines in the environment (Aga et al, 2005), on human and animal health, such as the promotion of the spread of antibiotic resistance or the triggering of adverse immunological reactions (Witte, 1998). Liquid chromatography combined with tandem mass spectrometry (LC/MS/MS), has been widely used in the detection of TC as well as other antimicrobials in surface and groundwater (Lindsey et al., 2001; Aga and Batt, 2005), and as well in wastewaters from treatment plants (Metcalfe et al, 2005). Still, there are no regulations for antibiotics in water; However the United States Geological Survey (USGS) investigations may lead in this direction (Erickson, 2002). Conversely, throughout the world the disposal of discarded tires has emerged over the years as a major environmental concern, because stockpiled becomes breeding sites for mosquitoes that could spread diseases and also represent fire hazards (Jang et al., 1998). In order to minimize the environmental impact resulting from waste rubber, especially discarded automobile tires, it is highly desirable to find ways to recycle this material. According with the Environmental Protection Agency (EPA) waste management, in
1 Department of Chemistry, Analytical Laboratory of Food, Soil & Environmental Chemistry (ALFSEC), University of Puerto Rico, Mayagüez, PR 00680. *. 2 Department of Chemistry, Analytical Laboratory of Food, Soil & Environmental Chemistry (ALFSEC), University of Puerto Rico, Mayagüez, PR 00680. 3 Department of General Engineering, The Nanomaterials Processing Laboratory, University of Puerto Rico, Mayagüez, PR 00680.
87
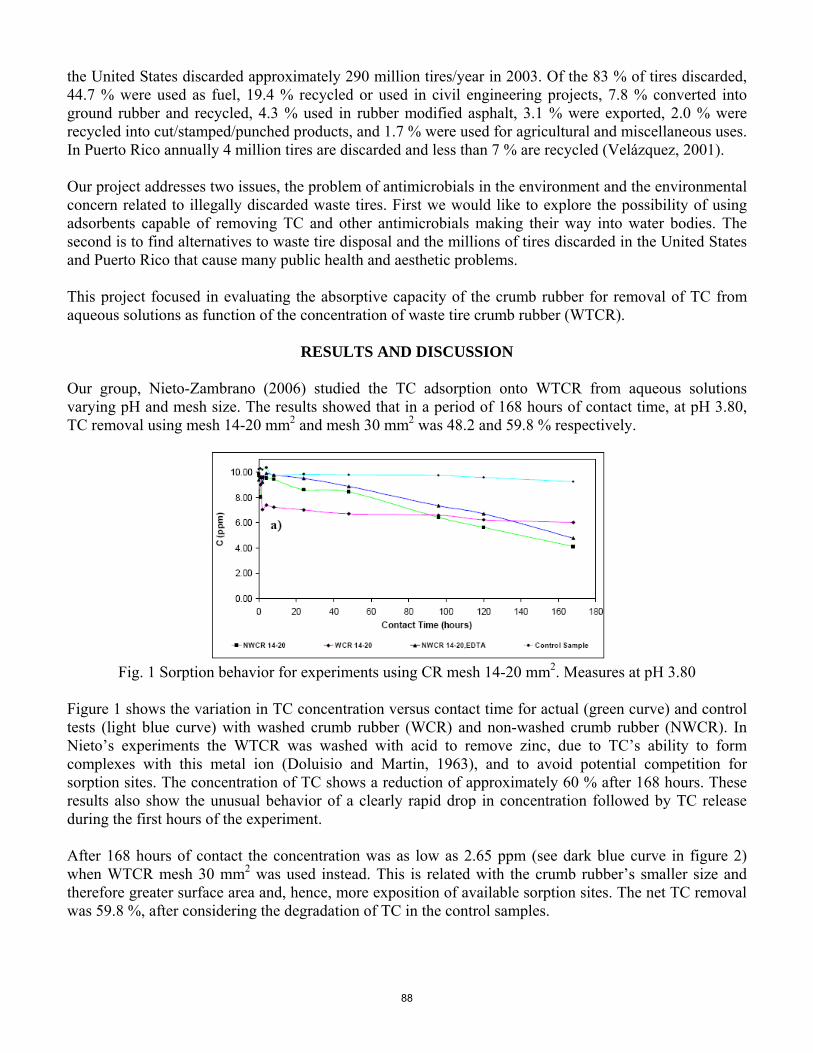
the United States discarded approximately 290 million tires/year in 2003. Of the 83 % of tires discarded, 44.7 % were used as fuel, 19.4 % recycled or used in civil engineering projects, 7.8 % converted into ground rubber and recycled, 4.3 % used in rubber modified asphalt, 3.1 % were exported, 2.0 % were recycled into cut/stamped/punched products, and 1.7 % were used for agricultural and miscellaneous uses. In Puerto Rico annually 4 million tires are discarded and less than 7 % are recycled (Velázquez, 2001). Our project addresses two issues, the problem of antimicrobials in the environment and the environmental concern related to illegally discarded waste tires. First we would like to explore the possibility of using adsorbents capable of removing TC and other antimicrobials making their way into water bodies. The second is to find alternatives to waste tire disposal and the millions of tires discarded in the United States and Puerto Rico that cause many public health and aesthetic problems. This project focused in evaluating the absorptive capacity of the crumb rubber for removal of TC from aqueous solutions as function of the concentration of waste tire crumb rubber (WTCR).
RESULTS AND DISCUSSION
Our group, Nieto-Zambrano (2006) studied the TC adsorption onto WTCR from aqueous solutions varying pH and mesh size. The results showed that in a period of 168 hours of contact time, at pH 3.80, TC removal using mesh 14-20 mm2 and mesh 30 mm2 was 48.2 and 59.8 % respectively.
Fig. 1 Sorption behavior for experiments using CR mesh 14-20 mm2. Measures at pH 3.80
Figure 1 shows the variation in TC concentration versus contact time for actual (green curve) and control tests (light blue curve) with washed crumb rubber (WCR) and non-washed crumb rubber (NWCR). In Nieto’s experiments the WTCR was washed with acid to remove zinc, due to TC’s ability to form complexes with this metal ion (Doluisio and Martin, 1963), and to avoid potential competition for sorption sites. The concentration of TC shows a reduction of approximately 60 % after 168 hours. These results also show the unusual behavior of a clearly rapid drop in concentration followed by TC release during the first hours of the experiment. After 168 hours of contact the concentration was as low as 2.65 ppm (see dark blue curve in figure 2) when WTCR mesh 30 mm2 was used instead. This is related with the crumb rubber’s smaller size and therefore greater surface area and, hence, more exposition of available sorption sites. The net TC removal was 59.8 %, after considering the degradation of TC in the control samples.
88

Fig. 2 Sorption behavior for experiments using washed and non washed crumb rubber. (Measure at pH
3.80).
0.00
1.00
2.00
3.00
4.00
5.00
6.00
0 10 20 30 40 50 60 70 80Contact Time (Hours)
Am
ount
Ads
orbe
d (m
g/g)
TC 30ppm/0.8 g CR A TC 30ppm/0.6 g CR A TC 30ppm/0.4 g CR ATC 30ppm/0.2 g CR A TC 30ppm/1.0 g CR A
Fig. 3 Uptake capacity of WTCR (in mg adsorbate/g WTCR) using different amounts of WTCR mesh 14-
20 mm2. (Contact time was 72 hours).
Figure 3 shows the amounts of TC adsorbed varying the amounts of WTCR 14-20 ranging from 1.0-0.2 g (10 to 2 g/L WTCR) and with a contact time of 72 hours. Although equilibrium was not reached, it clearly shows the sorption capability of the WTCR when place in contact with TC solution. Experiments were carried at neutral pH. The WTCR was washed with deionized water. The methodology used for the analysis was Liquid Chromatography equipped with Ultraviolet and Visible Absorption Spectroscopy and Mass Spectrometry detectors.
Table 1. Removal Efficiency Data Varying the Amounts of Crumb Rubber in Contact with a 30 ppm Tetracycline Solution (contact time was 72 hours).
Concentration of Crumb Rubber Mesh
14-20 (g/0.100mL) Removal Efficiency
(%) 1.01 68.2 0.80 52.3 0.60 47.4 0.41 46.4 0.21 36.4
89
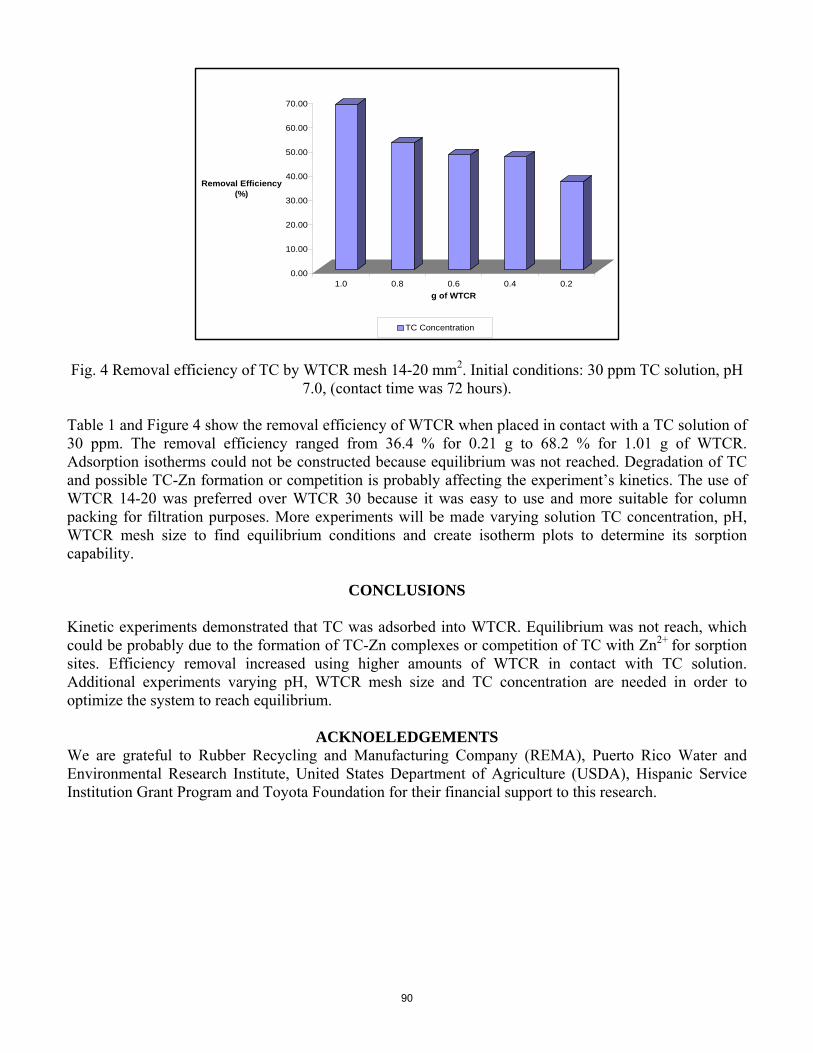
0.00
10.00
20.00
30.00
40.00
50.00
60.00
70.00
Removal Efficiency (%)
1.0 0.8 0.6 0.4 0.2g of WTCR
TC Concentration
Fig. 4 Removal efficiency of TC by WTCR mesh 14-20 mm2. Initial conditions: 30 ppm TC solution, pH
7.0, (contact time was 72 hours).
Table 1 and Figure 4 show the removal efficiency of WTCR when placed in contact with a TC solution of 30 ppm. The removal efficiency ranged from 36.4 % for 0.21 g to 68.2 % for 1.01 g of WTCR. Adsorption isotherms could not be constructed because equilibrium was not reached. Degradation of TC and possible TC-Zn formation or competition is probably affecting the experiment’s kinetics. The use of WTCR 14-20 was preferred over WTCR 30 because it was easy to use and more suitable for column packing for filtration purposes. More experiments will be made varying solution TC concentration, pH, WTCR mesh size to find equilibrium conditions and create isotherm plots to determine its sorption capability.
CONCLUSIONS
Kinetic experiments demonstrated that TC was adsorbed into WTCR. Equilibrium was not reach, which could be probably due to the formation of TC-Zn complexes or competition of TC with Zn2+ for sorption sites. Efficiency removal increased using higher amounts of WTCR in contact with TC solution. Additional experiments varying pH, WTCR mesh size and TC concentration are needed in order to optimize the system to reach equilibrium.
ACKNOELEDGEMENTS
We are grateful to Rubber Recycling and Manufacturing Company (REMA), Puerto Rico Water and Environmental Research Institute, United States Department of Agriculture (USDA), Hispanic Service Institution Grant Program and Toyota Foundation for their financial support to this research.
90
REFERENCES
Aga, Diana S, Batt, Angela L, 2005. Simultaneous Analysis of Multiple Classes of Antibiotics by Ion Trap LC/MS/MS for Assessing Surface Water and Groundwater Contamination Anal. Chem.2005, (77), 2940-2947. Aga, Diana S, O’Connor, Seamus O, Ensley, Steve, Payero, Josea O., Snow, Daniel, Tarkalson, David, 2005. Determination of the Persistence of Tetracycline Antibiotics and Their Degradates in Manure-Amended Soil Using Enzyme-Linked Immunosorbent Assay and Liquid Chromatography /Mass Spectrometry J. Agric. Food Chem. 2005, (53), 7165-7171. Boxall, A, Alistar, B, Jhonson, Paul; Smith, Edward J., Sinclair, Chris J., Stutt, Edward, Levy, Len S., 2006. Uptake of Veterinary Medicines from Soils into Plants J. Agric. Food Chem. 2006, (54), 22882297. Doluisio, James T, Martin, Alfred N, 1963. Metal Complexation of the Tetracycline Hydrochlorides. J.American Chemical Society. January, 16-20. Environmental Protection Agency, 2003. Management of Scrap Tires. www.epa.gov/epaeswer/non-hw/muncpl/tires/basic.htm. Erickson, Britte, 2002. Analyzing the Ignored Environmental Contaminants. Environmental Science & Technology. 140-145. Heberer. T, 2002. Ocurrence, fate and removal of pharmaceutical residues in the aquatic environment: a review of recent research data. Toxicology Letters. (131), 517. Jang Won, Ji, Soo Yoo, Taek, Hyun Oh, Jae, Iwasaki, Iwao, 1998. Discarded tire recycling practices in the United States, Japan and Korea. Resources, Conservation and Recycling (22) 1–14. Kolpin. D.W., Furlong. E.T., Meyer. M.T., Thurman. E.M., Zaugg. S.D., Barber. L.B. Burton. H.T., 2002. Pharmaceuticals, Hormones, and Others Organic Wastewater Contaminants in U.S.Streams, A National Reconnaissance. Environ. Sci. Technol. (36)1202-1211. Lindsay. M.E., Meyer. M., Thurman. E.M, 2002. Analysis of trace levels of sulfonamides and tetracycline antimicrobials in groundwater and surface water using solid phase extraction and liquid chromatography/mass spectrometry. Anal. Chem. (73), 4640-4646. Metcalfe, Chris D, Faridabishay, Meichen, Shengmiao-Xiu, 2004. Occurrence of Antimicrobials in the Final Effluents of Wastewater Treatment Plants in Canada Environ. Sci. Technol., (38), 3533-3541. Nieto Zambrano, Sorelis, 2006. Tetracycline adsorption from aqueous solutions (MS thesis, University of Puerto Rico, Mayagüez campus). http://grad.uprm.edu/tesis/nietozambrano.pdf. Velasquez. E., 2001. Revista del Colegio de Ingenieros y Agrimensores de Puerto Rico. (15); 4-16. Witte, W. 1998. Medical consequences of antibiotic use in agriculture. Science, (279) 996–997.
91
OCTOBER SEVENTH CARIBBEAN ISLANDS WATER RESOURCES CONGRESS
2007
USE OF RECYCLED TIRES CRUMB RUBBER TO REMOVE ETHYLBENZENE, TOLUENE AND XYLENE IN SINGLE COMPONENT, MULTI-COMPONENT
AND GASOLINE FROM AQUEOUS SOLUTIONS
L. Alamo-Nole1,*, F. Roman2, and O. Perales-Perez3 ABSTRACT: Samples of waste tires crumb rubber mesh 14-20 were submerged in 30 ppm aqueous solutions of ethylbenzene, toluene and xylene to evaluate the corresponding sorption capability. In a different series of tests, the removal of gasoline, 10 ppm aqueous solution, was also evaluated. The concentration of the sorbent ranged from 0.1 to 10 grams per liter. Samples were withdrawn at different times and analyzed by Gas Chromatography-Mass Spectrometer to monitor the progress of the sorption process. Results confirmed the capability of crumb rubber to remove ethylbenzene, toluene and xylene from aqueous solutions. The removal efficiency was dependent on solution pH and crumb rubber concentration. The sorption process was quite rapid; in single-component systems, 99% of xylene was removed from the aqueous phase in the first 30 minutes of contact when 10 grams per litter of crumb rubber were used. The removal efficiency of ethylbenzene and xylene, in single- and multi-component system, dropped around 5 percent at pH 1.5. All volatile organic compounds, including ethylbenzene, toluene and xylene, were partially removed when 5 and 10 grams per litter of crumb rubber were used. The sorption efficiency of crumb rubber was greater in xylene, then ethylbenzene, and smaller in toluene. Ethylbenzene, toluene and xylene contained in the gasoline were efficiently removed when 5 and 10 grams per litter of crumb rubber were used. KEYWORDS: waste tire, crumb rubber, sorption, recycling, water treatment
INTRODUCTION Despite of existent environmental protection policies, severe pollution events are still frequent not only in Puerto Rico but also in the rest of the world. One of the most common pollution sources is represented by oil derivatives generated by refining, transport, uses, and residues treatment activities. Among oil derivatives, high concentrations of aromatic compounds such as ethylbenzene, toluene and xylene (ETX) have been detected in oil and gasoline (EPA, 2005). These compounds can also get mobilized into the aqueous phase, which would make the contamination problem even worse. Exposure to ETX solvents can cause disturbances in the central nervous system, and damage to kidney and liver (Wilbur and Bosch, 2004). In turn, gasoline is a complex mixture of organic compounds that is the result of partial oil distillation process. On an environmental protection basis, the most important constituents of gasoline are grouped under the nomination of Volatile Organic Compounds (VOCs), which includes the above mentioned ETX species. Several approaches to remove ETX compounds from water have been reported in the technical literature. Granular activated charcoal (GAC) is the most common adsorbent. Other approaches consider zeolites and surfactant-modified zeolites (Ranck et al., 2005); however, the prohibitive costs involved with the sorbent fabrication limit their applicability to treat large volumes of polluted effluents. Evidently, the 1 Department of Chemistry, University of Puerto Rico, Mayagüez, [email protected] 2 Department of Chemistry, University of Puerto Rico, Mayagüez, [email protected] 3 Department of Engineering Science & Materials, University of Puerto Rico, Mayagüez, [email protected]
92

ideal sorbent should exhibit removal capacities comparable to commercial products under cost-effective conditions. On the other hand, there are at least 275 million waste tires in stockpiles in the U.S. Although markets now exist for 76% of these waste tires, up from 17% in 1990, the remaining is still stockpiled or land filled (ISRI, 2001). Crumb rubber is composed of a complex mixture of elastomers like polyisoprene, polybutadiene and styrene-butadiene, stearic acid, zinc oxide, extender oil, and carbon black (Amari et al., 1999). Carbon black should exhibit similar adsorbing characteristics as activated charcoal, a well known agent used to remove organic and inorganic compounds from aqueous and gaseous effluents, a fact that makes viable the removal of target species through sorption/adsorption mechanisms (Arocha et al. 1997; Knocke and Hemphill, 1981; Rowley et al., 1984; Sameer and Fawzi, 2000; Zarraa, 1998). Moreover, non-polar organic pollutants are expected to interact with the rubber matrix via van der Waals interactions (Stom and Morgan, 1996). Under these premises, the present work addresses the evaluation of waste tires crumb rubber as potential sorbent for ETX pollutants from aqueous solutions.
MATERIALS AND METHODS Materials Waste tires crumb rubber was provided by REMA Inc., a tire rubber recycling company located in Caguas, Puerto Rico. The crumb rubber mesh 14 -20 (the average diameter was 2.45 mm and the superficial area was 18.86 mm2) (Figure 1), was washed with deionized water for 24 hours and dried at room temperature. Ethylbenzene, toluene and o-xylene were ACS certified grade. Gasoline was Shell Brand and regular grade, no other analysis were done.
a)
b)
Figure 1. a) Crumb rubber mesh 14–20 as provided by REMA, Inc; b) Typical SEM image of crumb rubber. Although the surface exhibits significant roughness, no mesopores were observed.
Crumb Rubber Chemical Stability Test In order to evaluate the possibility to release metals from crumb rubber, one gram of the sorbent was submerged in 100 mL of distilled water at pH 1.5, 3.0, 6.0 and 9.0 for 24 hours. Solution samples were analyzed using a Inductively Coupled Plasma Optical Emission Spectroscopy (ICP-OES) following EPA 200.7 rev 5.0 method. Sorption Experiments Single-component sorption tests at pH 1.5 and 6.0 and multi-component test at pH 6.0 were evaluated using different weights of crumb rubber. The gasoline sorption test at pH 6.0 was conducted with 5 and
93
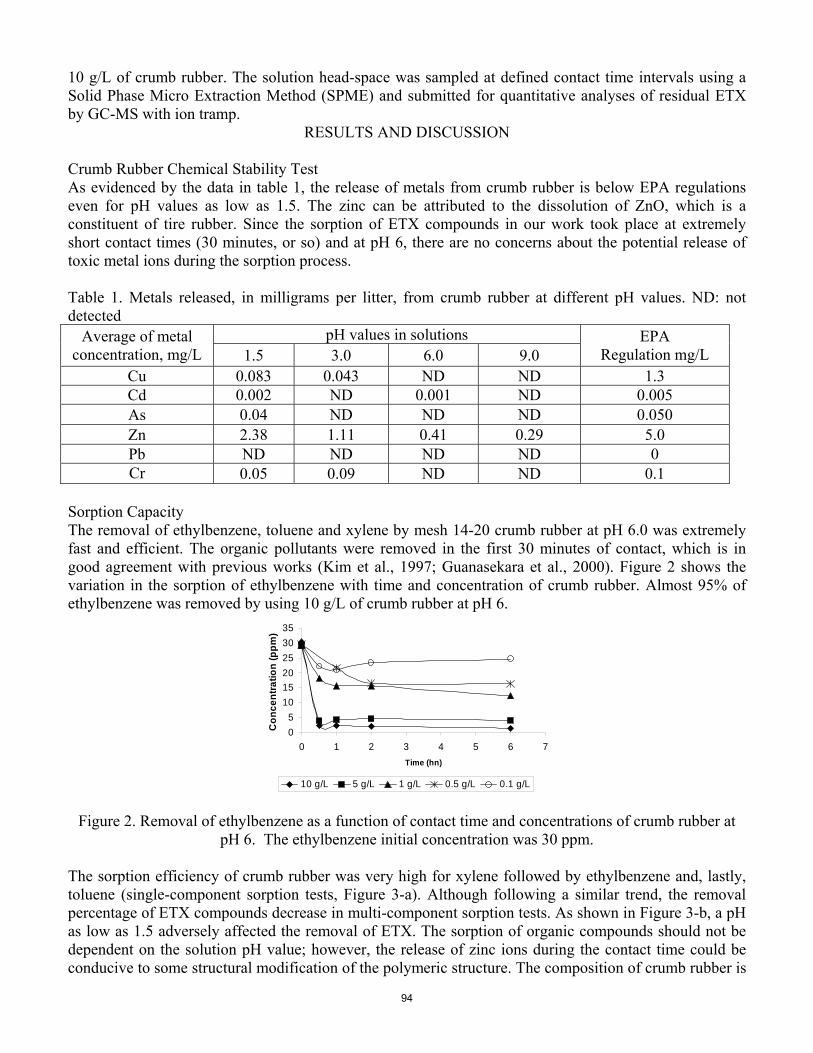
10 g/L of crumb rubber. The solution head-space was sampled at defined contact time intervals using a Solid Phase Micro Extraction Method (SPME) and submitted for quantitative analyses of residual ETX by GC-MS with ion tramp.
RESULTS AND DISCUSSION Crumb Rubber Chemical Stability Test As evidenced by the data in table 1, the release of metals from crumb rubber is below EPA regulations even for pH values as low as 1.5. The zinc can be attributed to the dissolution of ZnO, which is a constituent of tire rubber. Since the sorption of ETX compounds in our work took place at extremely short contact times (30 minutes, or so) and at pH 6, there are no concerns about the potential release of toxic metal ions during the sorption process. Table 1. Metals released, in milligrams per litter, from crumb rubber at different pH values. ND: not detected
pH values in solutions Average of metal concentration, mg/L 1.5 3.0 6.0 9.0
EPA Regulation mg/L
Cu 0.083 0.043 ND ND 1.3 Cd 0.002 ND 0.001 ND 0.005 As 0.04 ND ND ND 0.050 Zn 2.38 1.11 0.41 0.29 5.0 Pb ND ND ND ND 0 Cr 0.05 0.09 ND ND 0.1
Sorption Capacity The removal of ethylbenzene, toluene and xylene by mesh 14-20 crumb rubber at pH 6.0 was extremely fast and efficient. The organic pollutants were removed in the first 30 minutes of contact, which is in good agreement with previous works (Kim et al., 1997; Guanasekara et al., 2000). Figure 2 shows the variation in the sorption of ethylbenzene with time and concentration of crumb rubber. Almost 95% of ethylbenzene was removed by using 10 g/L of crumb rubber at pH 6.
05
101520253035
0 1 2 3 4 5 6 7Time (hn)
Con
cent
ratio
n (p
pm)
10 g/L 5 g/L 1 g/L 0.5 g/L 0.1 g/L
Figure 2. Removal of ethylbenzene as a function of contact time and concentrations of crumb rubber at
pH 6. The ethylbenzene initial concentration was 30 ppm. The sorption efficiency of crumb rubber was very high for xylene followed by ethylbenzene and, lastly, toluene (single-component sorption tests, Figure 3-a). Although following a similar trend, the removal percentage of ETX compounds decrease in multi-component sorption tests. As shown in Figure 3-b, a pH as low as 1.5 adversely affected the removal of ETX. The sorption of organic compounds should not be dependent on the solution pH value; however, the release of zinc ions during the contact time could be conducive to some structural modification of the polymeric structure. The composition of crumb rubber is
94
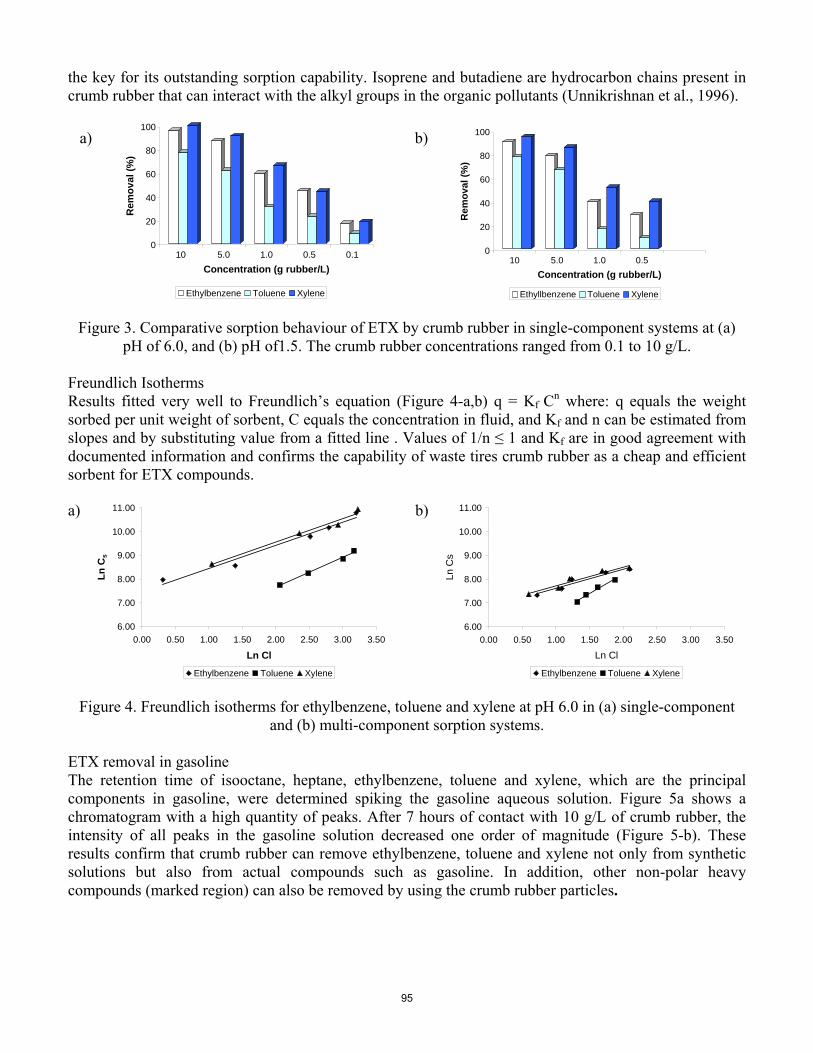
the key for its outstanding sorption capability. Isoprene and butadiene are hydrocarbon chains present in crumb rubber that can interact with the alkyl groups in the organic pollutants (Unnikrishnan et al., 1996).
a)
0
20
40
60
80
100R
emov
al (%
)
10 5.0 1.0 0.5 0.1Concentration (g rubber/L)
Ethylbenzene Toluene Xylene
b)
0
20
40
60
80
100
Rem
oval
(%)
10 5.0 1.0 0.5Concentration (g rubber/L)
Ethyllbenzene Toluene Xylene
Figure 3. Comparative sorption behaviour of ETX by crumb rubber in single-component systems at (a) pH of 6.0, and (b) pH of1.5. The crumb rubber concentrations ranged from 0.1 to 10 g/L.
Freundlich Isotherms Results fitted very well to Freundlich’s equation (Figure 4-a,b) q = Kf Cn where: q equals the weight sorbed per unit weight of sorbent, C equals the concentration in fluid, and Kf and n can be estimated from slopes and by substituting value from a fitted line . Values of 1/n ≤ 1 and Kf are in good agreement with documented information and confirms the capability of waste tires crumb rubber as a cheap and efficient sorbent for ETX compounds.
a)
6.00
7.00
8.00
9.00
10.00
11.00
0.00 0.50 1.00 1.50 2.00 2.50 3.00 3.50
Ln Cl
Ln C
s
Ethylbenzene Toluene Xylene
b)
6.00
7.00
8.00
9.00
10.00
11.00
0.00 0.50 1.00 1.50 2.00 2.50 3.00 3.50
Ln Cl
Ln C
s
Ethylbenzene Toluene Xylene
Figure 4. Freundlich isotherms for ethylbenzene, toluene and xylene at pH 6.0 in (a) single-component and (b) multi-component sorption systems.
ETX removal in gasoline The retention time of isooctane, heptane, ethylbenzene, toluene and xylene, which are the principal components in gasoline, were determined spiking the gasoline aqueous solution. Figure 5a shows a chromatogram with a high quantity of peaks. After 7 hours of contact with 10 g/L of crumb rubber, the intensity of all peaks in the gasoline solution decreased one order of magnitude (Figure 5-b). These results confirm that crumb rubber can remove ethylbenzene, toluene and xylene not only from synthetic solutions but also from actual compounds such as gasoline. In addition, other non-polar heavy compounds (marked region) can also be removed by using the crumb rubber particles.
95
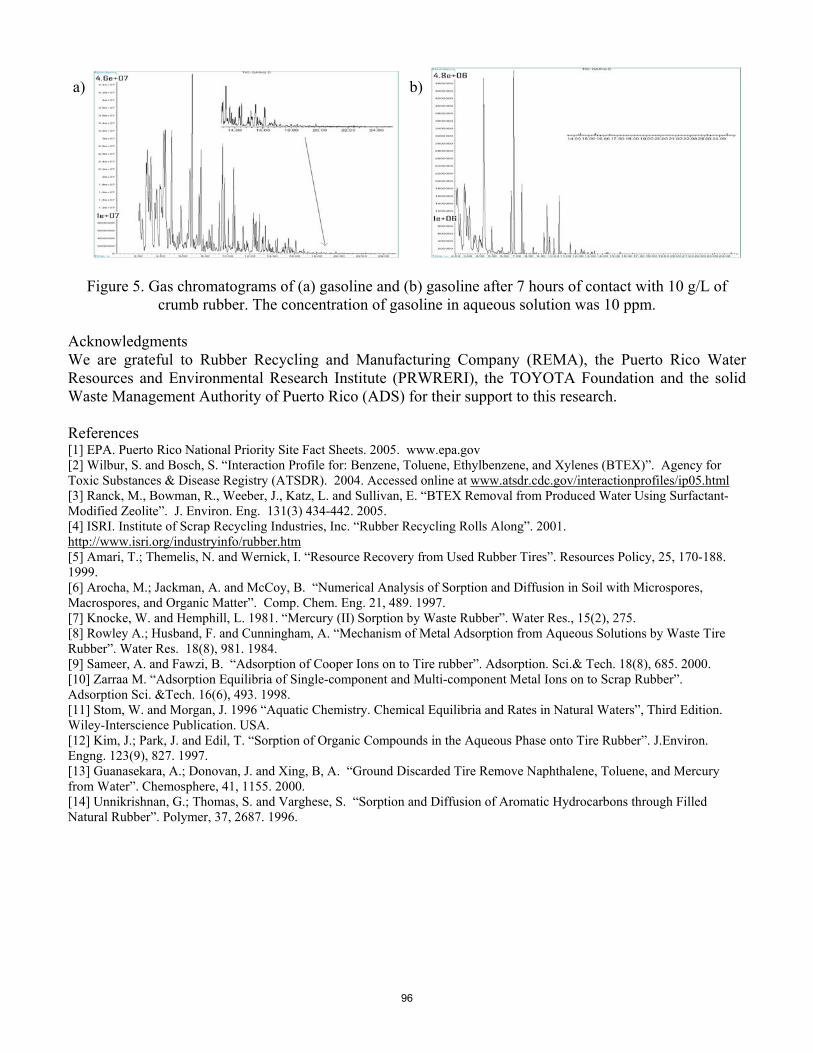
a)
b)
Figure 5. Gas chromatograms of (a) gasoline and (b) gasoline after 7 hours of contact with 10 g/L of crumb rubber. The concentration of gasoline in aqueous solution was 10 ppm.
Acknowledgments We are grateful to Rubber Recycling and Manufacturing Company (REMA), the Puerto Rico Water Resources and Environmental Research Institute (PRWRERI), the TOYOTA Foundation and the solid Waste Management Authority of Puerto Rico (ADS) for their support to this research. References [1] EPA. Puerto Rico National Priority Site Fact Sheets. 2005. www.epa.gov [2] Wilbur, S. and Bosch, S. “Interaction Profile for: Benzene, Toluene, Ethylbenzene, and Xylenes (BTEX)”. Agency for Toxic Substances & Disease Registry (ATSDR). 2004. Accessed online at www.atsdr.cdc.gov/interactionprofiles/ip05.html [3] Ranck, M., Bowman, R., Weeber, J., Katz, L. and Sullivan, E. “BTEX Removal from Produced Water Using Surfactant-Modified Zeolite”. J. Environ. Eng. 131(3) 434-442. 2005. [4] ISRI. Institute of Scrap Recycling Industries, Inc. “Rubber Recycling Rolls Along”. 2001. http://www.isri.org/industryinfo/rubber.htm [5] Amari, T.; Themelis, N. and Wernick, I. “Resource Recovery from Used Rubber Tires”. Resources Policy, 25, 170-188. 1999. [6] Arocha, M.; Jackman, A. and McCoy, B. “Numerical Analysis of Sorption and Diffusion in Soil with Microspores, Macrospores, and Organic Matter”. Comp. Chem. Eng. 21, 489. 1997. [7] Knocke, W. and Hemphill, L. 1981. “Mercury (II) Sorption by Waste Rubber”. Water Res., 15(2), 275. [8] Rowley A.; Husband, F. and Cunningham, A. “Mechanism of Metal Adsorption from Aqueous Solutions by Waste Tire Rubber”. Water Res. 18(8), 981. 1984. [9] Sameer, A. and Fawzi, B. “Adsorption of Cooper Ions on to Tire rubber”. Adsorption. Sci.& Tech. 18(8), 685. 2000. [10] Zarraa M. “Adsorption Equilibria of Single-component and Multi-component Metal Ions on to Scrap Rubber”. Adsorption Sci. &Tech. 16(6), 493. 1998. [11] Stom, W. and Morgan, J. 1996 “Aquatic Chemistry. Chemical Equilibria and Rates in Natural Waters”, Third Edition. Wiley-Interscience Publication. USA. [12] Kim, J.; Park, J. and Edil, T. “Sorption of Organic Compounds in the Aqueous Phase onto Tire Rubber”. J.Environ. Engng. 123(9), 827. 1997. [13] Guanasekara, A.; Donovan, J. and Xing, B, A. “Ground Discarded Tire Remove Naphthalene, Toluene, and Mercury from Water”. Chemosphere, 41, 1155. 2000. [14] Unnikrishnan, G.; Thomas, S. and Varghese, S. “Sorption and Diffusion of Aromatic Hydrocarbons through Filled Natural Rubber”. Polymer, 37, 2687. 1996.
96
OCTOBER SEVENTH CARIBBEAN ISLANDS WATER RESOURCES CONGRESS 2007
REMOVAL OF LEAD, COPPER AND CADMIUM IONS FROM AQUEOUS
SOLUTIONS USING WASTE TIRE CRUMB RUBBER
D. Sánchez-Rivera1,*, L. Alamo1, A. del Valle2, F. Román1, and O. Perales-Pérez3
ABSTRACT: The removal of toxic heavy metals ions from aqueous solutions using low-cost waste tire crumb rubber was investigated. The removal of aqueous pollutants at trace levels by conventional alkaline precipitation processes are quite inefficient, therefore, adsorption-based approaches become the most promising alternative. However, for adsorption to be cost-effective, the candidate sorbent should be inexpensive and capable to remove different types of contaminants species in a single-step operation. Waste tire can be considered a candidate sorbent material because of the contents of carbon black. Obtained results show that tire crumb rubber can remove efficiently cadmium, copper, and lead ions from diluted aqueous solutions. The removal efficiency can be improved when the solution pH is around 6 and small rubber particle size is used. Langmuir isotherms were constructed for each single-metal system. The removal efficiencies for copper and lead species were higher than for cadmium ions. The sorption capability of the tire rubber can be attributed to ionic exchange with zinc oxide and also through surface interactions with carbon black particles embedded in the rubber matrix. Keywords: tire rubber, cadmium, sorption, lead, copper
1. INTRODUCTION
The environmental problem of water pollution by heavy metals is of great concern. Aqueous effluents from electroplating industries, mining activities, and metal finishing plants are good examples of pollution in particular streams bearing toxic metal ions. A variety of methods for metal ions removal exists, e. g. chemical precipitation, ionic exchange, electrochemical deposition and solvent extraction. Most of the available techniques are expensive or do not remove the metals at trace levels as required by drinking water regulations. As an alternative approach different materials have been proposed as inexpensive alternative sorbents for metal ions. The use of fly ash, yeast biomass, clay, agricultural byproducts, sawdust, siderite, [1-2] and tire rubber [3, 5-14] has been reported in the literature. Annually, approximated 6.5 millions tons of waste tire are generated around the world aggravating the solid waste disposal problem because the non-biodegradable nature of this material [3]. Some recycling options for waste tires are currently employed including their use in road pavement, rubber roofs, floor mats, drainage systems, playground surfaces, and as solid fuels; however an appreciate quantity are still discarded improperly [4, 6]. From a compositional viewpoint, waste tires can be considered a nanocomposite material consisting of: natural rubber, synthetic rubber (styrene-butadiene, polybutadiene), and carbon black (22-31% weigth / weigth). Other materials also present in the tires are silicon oxide, zinc
1 Department of Chemistry, University of Puerto Rico, Mayagüez, 00680 (*: corresponding author email: [email protected]) 2 Department of Chemical Engineering, University of Puerto Rico, Mayagüez, 00680 3 Department of Materials Science & Engineering, University of Puerto Rico, Mayagüez, 00680
97

oxide, stearic acid, sulfur, and extender oils [3-6]. The capability of tire rubber to remove metals from aqueous solutions such as inorganic mercury, [5-7, 11-12] lead [8], cadmium [8, 9], and chromium [10], has been reported in the literature. It has been proposed that the enhancement of the tires surface area and porosity will increase the removal efficiency of the contaminants. The present study addresses the systematic study on the removal of cadmium (Cd), copper (Cu), and lead (Pb) ions by using waste tire crumb rubber (WTCR). Crumb rubber at different particle sizes are produced by REMA Inc., a Puerto Rican recycling factory located in Caguas. Batch sorption tests were carried out at different pH, initial concentration of metal ions and different mesh sizes of the crumb rubber. Specifically, the present research aimed at diminishing the level of contaminants below 1.3, 0.015, and 0.005 ppm of copper, lead, and cadmium respectively, as demanded by the U.S. Environmental Protection Agency regulations for drinking water [13].
2. EXPERIMENTAL PROCEDURE
2.1 Treatment of WTCR Prior to use, WTCR was sumerged in distilled-deionized water for 24 hours and then dried at 298 K. Crumb rubber mesh 14-20 (1.5-4.0 mm) and mesh 30 (0.5-0.7mm), were used in the presented study. 2.2 Sorption Tests The sorption experiments for lead and copper species were carried out at a WTCR concentration of 10g WTCR /L of solution. The cadmium sorption tests were run using 15g WTCR/L. Salts of CuSO4.5H2O, Pb(NO3)2 and Cd(NO3)2.4H2O (from Fisher Scientific) were used to prepare the synthetic solutions. In the sorption tests, WTCR was contacted with Cu, Pb or Cd aqueous solutions at concentrations, ranging from 1 to 20 ppm, and pH values between 1.5 and 9. The solution pH was adjusted with nitric acid trace metal grade or sodium hydroxide lab grade purity. One-hundred mL of the metal ion solution were placed in a shaker bath at 200 strokes/minute and 298 K. Samples were withdrawn at different contact times, acidified with HNO3 and analyzed by Inductively Coupled Plasma Optical Emission Spectrophotometer (ICP-OES) or Inductive Couple Plasma Mass Spectrometer (ICP-MS) following the EPA 200.7 Rev.5.0 and EPA 200.8 Rev. 5.4 methods. All experiments were run in duplicate, including suitable blanks. 2.3 Desorption Experiments At the end of the sorption stage, WTCR particles were filtrated and dried at ambient temperature. Dried WTCR was contacted with a 10% v/v (volume/volume) solution of nitric acid trace metal grade for 72 hours to desorb the metal ions. Aliquot samples were taken from the aqueous portion, diluted to 2%v/v acid with deionized water and analyzed by ICP-OES or ICP-MS.
3. RESULTS 3.1 Effect of pH The pH-dependence of the adsorption efficiency of Cd, Cu, and Pb species using WTCR was evaluated. Figure 1 shows the variation of the ratio actual concentration/initial concentration, C/Ci, for Cu ions (1 ppm) as a function of time. As seen, the best results were obtained at pH 6.0. This pH value is typical of most natural waters. On the other hand, the precipitation of metal hydroxides could have also contributed to the observed drop in the corresponding C/Ci ratio at pH 9. Experimental results are also evidence of the poor sorption of metals under acidic conditions; hydrogen ions should have competed with metal species for active sorption sites. Similar trends were observed in the sorption tests for Cd and Pb species.
98
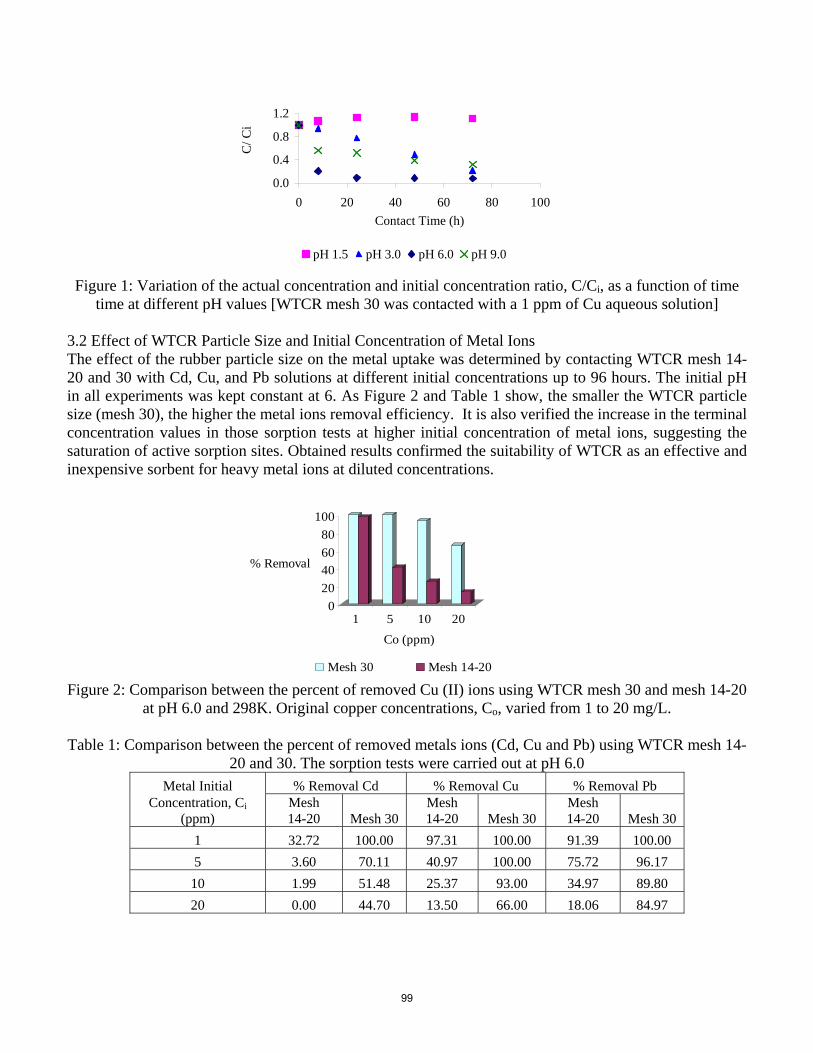
0.0
0.4
0.8
1.2
0 20 40 60 80 100Contact Time (h)
C/ C
i pH 1.5 pH 3.0 pH 6.0 pH 9.0
Figure 1: Variation of the actual concentration and initial concentration ratio, C/Ci, as a function of time
time at different pH values [WTCR mesh 30 was contacted with a 1 ppm of Cu aqueous solution] 3.2 Effect of WTCR Particle Size and Initial Concentration of Metal Ions The effect of the rubber particle size on the metal uptake was determined by contacting WTCR mesh 14-20 and 30 with Cd, Cu, and Pb solutions at different initial concentrations up to 96 hours. The initial pH in all experiments was kept constant at 6. As Figure 2 and Table 1 show, the smaller the WTCR particle size (mesh 30), the higher the metal ions removal efficiency. It is also verified the increase in the terminal concentration values in those sorption tests at higher initial concentration of metal ions, suggesting the saturation of active sorption sites. Obtained results confirmed the suitability of WTCR as an effective and inexpensive sorbent for heavy metal ions at diluted concentrations.
020406080
100
% Removal
1 5 10 20 Co (ppm)
Mesh 30 Mesh 14-20 Figure 2: Comparison between the percent of removed Cu (II) ions using WTCR mesh 30 and mesh 14-20
at pH 6.0 and 298K. Original copper concentrations, Co, varied from 1 to 20 mg/L.
Table 1: Comparison between the percent of removed metals ions (Cd, Cu and Pb) using WTCR mesh 14-20 and 30. The sorption tests were carried out at pH 6.0
Metal Initial % Removal Cd % Removal Cu % Removal Pb Concentration, Ci
(ppm) Mesh 14-20 Mesh 30
Mesh 14-20 Mesh 30
Mesh 14-20 Mesh 30
1 32.72 100.00 97.31 100.00 91.39 100.00 5 3.60 70.11 40.97 100.00 75.72 96.17
10 1.99 51.48 25.37 93.00 34.97 89.80 20 0.00 44.70 13.50 66.00 18.06 84.97
99
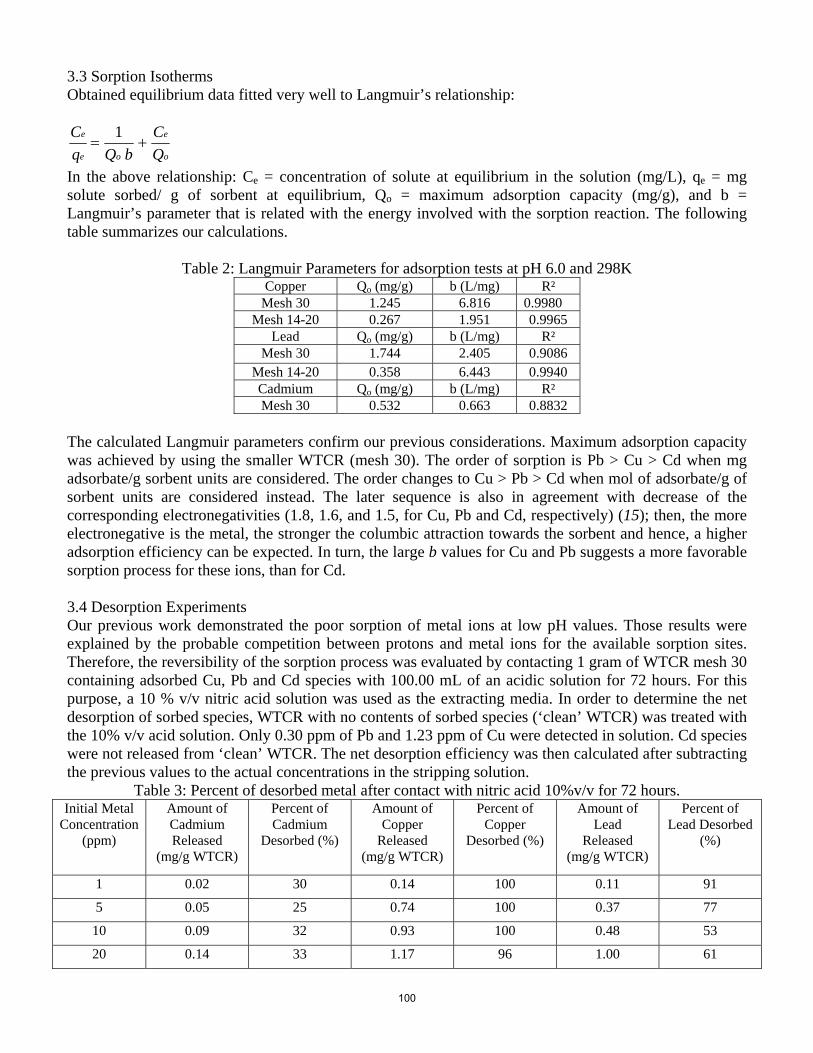
3.3 Sorption Isotherms Obtained equilibrium data fitted very well to Langmuir’s relationship:
o
e
oe
e
QC
bQqC
+=1
In the above relationship: Ce = concentration of solute at equilibrium in the solution (mg/L), qe = mg solute sorbed/ g of sorbent at equilibrium, Qo = maximum adsorption capacity (mg/g), and b = Langmuir’s parameter that is related with the energy involved with the sorption reaction. The following table summarizes our calculations.
Table 2: Langmuir Parameters for adsorption tests at pH 6.0 and 298K Copper Qo (mg/g) b (L/mg) R²
Mesh 30 1.245 6.816 0.9980 Mesh 14-20 0.267 1.951 0.9965
Lead Qo (mg/g) b (L/mg) R² Mesh 30 1.744 2.405 0.9086
Mesh 14-20 0.358 6.443 0.9940 Cadmium Qo (mg/g) b (L/mg) R² Mesh 30 0.532 0.663 0.8832
The calculated Langmuir parameters confirm our previous considerations. Maximum adsorption capacity was achieved by using the smaller WTCR (mesh 30). The order of sorption is Pb > Cu > Cd when mg adsorbate/g sorbent units are considered. The order changes to Cu > Pb > Cd when mol of adsorbate/g of sorbent units are considered instead. The later sequence is also in agreement with decrease of the corresponding electronegativities (1.8, 1.6, and 1.5, for Cu, Pb and Cd, respectively) (15); then, the more electronegative is the metal, the stronger the columbic attraction towards the sorbent and hence, a higher adsorption efficiency can be expected. In turn, the large b values for Cu and Pb suggests a more favorable sorption process for these ions, than for Cd. 3.4 Desorption Experiments Our previous work demonstrated the poor sorption of metal ions at low pH values. Those results were explained by the probable competition between protons and metal ions for the available sorption sites. Therefore, the reversibility of the sorption process was evaluated by contacting 1 gram of WTCR mesh 30 containing adsorbed Cu, Pb and Cd species with 100.00 mL of an acidic solution for 72 hours. For this purpose, a 10 % v/v nitric acid solution was used as the extracting media. In order to determine the net desorption of sorbed species, WTCR with no contents of sorbed species (‘clean’ WTCR) was treated with the 10% v/v acid solution. Only 0.30 ppm of Pb and 1.23 ppm of Cu were detected in solution. Cd species were not released from ‘clean’ WTCR. The net desorption efficiency was then calculated after subtracting the previous values to the actual concentrations in the stripping solution.
Table 3: Percent of desorbed metal after contact with nitric acid 10%v/v for 72 hours. Initial Metal
Concentration (ppm)
Amount of Cadmium Released
(mg/g WTCR)
Percent of Cadmium
Desorbed (%)
Amount of Copper
Released (mg/g WTCR)
Percent of Copper
Desorbed (%)
Amount of Lead
Released (mg/g WTCR)
Percent of Lead Desorbed
(%)
1 0.02 30 0.14 100 0.11 91
5 0.05 25 0.74 100 0.37 77
10 0.09 32 0.93 100 0.48 53
20 0.14 33 1.17 96 1.00 61
100
Where: ppm= parts per million, mg/g = milligrams of metal per gram of WTCR The data in table 3 evidences the complete desorption of Cu species from WTCR. The desorption of Pb was also observed although in minor proportion. As seen, the desorption of cadmium is the less favored.
4. CONCLUSIONS
WTCR can be considered an excellent and inexpensive sorbent for the removal of metals ions like copper, lead, and cadmium at low concentrations. Crumb rubber mesh 30 could remove the metal contents to levels below EPA regulation for drinking water. The mechanism of sorption is possibly due to cation exchange with zinc, and/or by interfacial interaction of metal species with functional groups of carbon black. Furthermore, Cu and Pb species can be desorbed from WTCR by treating the rubber under acidic conditions.
5. ACKNOWLEDGMENTS
We are grateful to Rubber Recycling and Manufacturing Company (REMA), Puerto Rico Water and Environmental Research Institute, Toyota Foundation, Waste Solid Management Authority of Puerto Rico, and the United States Department of Agriculture (USDA) Hispanic Serving Institutions Grant Program for their financial support to this research.
6. REFERENCES
(1) Reddad, Z.; Gerente, C.; Andres, I.; Le Cloirec, P. Environ. Sci. Technol. 2002, 36, 2067-2073. (2) Xue-jiang, W.; Si-qing, X.; Ling, C.; Jian-fu, Z.; Jean-marc, Z.; Jaffrezic-renault, N. J. Environ. Sci. 2006, 18, 840-844. (3) Alvarez, R.; Callén, M. S.; Clemente, C.; Díaz-Bautista, M..; López, J. M.; Mastral, A. M.; Murillo, R. Ind. Eng. Chem. Res. 2004, 43, 7762-7767. (4) Monchón-Vizuete, E.; Marcías-García, A.; Nadal Gisbert, A.; Fernández-González, C.; Gómez- Serrano, V. Microporous and Mesoporous Materials 2004, 67, 35-41. (5) Lehmann, C.M.B.; Rostman-Abadi, M.; Rood, M. J.; Sun, J. Reprocessing Energy & Fuels 1998, 12, 1095-1099. (6) Monchón-Vizuete, E.; Marcías-García, A.; Nadal Gisbert, A.; Fernández-González, C.; Gómez- Serrano, V. J. of Hazardous Mat. 2005, B 119, 231-238. (7) Knocke, W. R.; Hemphill, L. H. Water Res. 1981, 15, 275-282. (8) Rowley, A. G.; Husband, F. M.; Cunningham, A. B. Water Res. 1984, 18, 981-984. (9) Entezari, M. H.; Ghows, N.; Chamsaz, M. J. of Hazardous Mat. 2006, B131, 84-89. (10) Entezari, M. H.; Ghows, N.; Chamsaz, M. J. Phys. Chem. A 2005, 109, 4638-4642. (11) Gunasekara, A. S.; Donovan, J. A.; Xing, B. Chemosphere 2000, 41, 1155-1160. (12) Meng, X.; Hua, Z.; Dermatas, D. J. of Hazardous Mat. 1998, 57, 231-241. (13) Environmental Protection Agency. www.epa.gov (accessed on March 2007). (14) San Miguel, G.; Fowler, G.D.; Sollars, C.J. Water Res. 2002, 36, 1939-1946. (15) Christphi, C.; Axe, P. J. Environ. Eng. 2000, 1, 66-74.
101
Paper Title Index
Page Caribbean Water Management Implications of Potential Climate Change -------------------------- 2
Effects of Aquifer Development and Changes in Irrigation Practices on the Groundwater
Discharge to the Jobos Bay National Estuarine Research Reserve, South-Central, Puerto Rico ------------------------------------------------------------------------------------------------ 54
Effect of Spatial and Temporal Resolution Uncertainty on Predicted Best Management Practice (BMP) Efficiency ----------------------------------------------------------------------------------------- 21 Effectiveness of Mandatory Law of Cistern Construction for Rainwater Harvesting on Supply
and Demand of Public Water in U.S. Virgin Islands ---------------------------------------- 75 Evaluation of the Adsorption Behavior of Tetracycline onto Crumb Rubber in Aqueous Solution ---------------------------------------------------------------------------------------------------------------- 87 Groundwater Levels in Puerto Rico, 1987-2006 ------------------------------------------------------ 49 Hydraulic and Biochemical Characteristics of Coal Combustion Byproducts Aggregates as
alternative daily cover for landfills ------------------------------------------------------------ 34 Hydrologic Studies using Vflo in Western Puerto Rico ---------------------------------------------- 81 Impacts of Watershed Development on Diversity of Freshwater Fish and Crustaceans on St.
Thomas, U.S. Virgin Islands -------------------------------------------------------------------- 69 Innovative on site Wastewater Disposal Systems Outreach and Demonstration Project -------- 43 Numerical Simulation of Rivers in Floodplains ------------------------------------------------------- 11 Nutrient Load Estimation at Lago Dos Bocas, Puerto Rico ----------------------------------------- 59 Removal of Lead, Copper, and Cadmium Ions from Aqueous Solutions using Waste Tire Crumb
Rubber --------------------------------------------------------------------------------------------- 97 Sediment Production from Natural and Disturbed Surfaces in Dry Tropical Areas of La Parguera,
PR, 2003 - 2005 ---------------------------------------------------------------------------------- 26 Telemetry Monitoring of Small Water Supply -------------------------------------------------------- 39 The Caribbean Water Initiative (CARIWIN) ---------------------------------------------------------- 30
102

The Role of a Community-based Nongovernmental Organization in Promoting Active Research and Stewardship of Water and Other Environmental Resources in the US Virgin Islands --------------------------------------------------------------------------------------------------------16
Use of Recycled Tires Crumb Rubber to Remove Ethylbenzene, Toluene and Xylene in Single
Component, Multi-Components Systems and Gasoline from Aqueous Solutions ------- 92 Use of Stable Isotopes to Determine Potential Sources of Nitrate and Contribution of Surface
Water to Aquifer Recharge in the Salinas Area, South Coastal Plain Alluvial Aquifer, Puerto Rico ---------------------------------------------------------------------------------------- 64
103

Author Index
Page Alamo-Nole, L. -------------------------- 3, 97 Bernal Bernal, Alvaro --------------------- 59 Buckley, Katie ------------------------------ 21 Cashman, Adrian ----------------------------- 2 Charlery, John -------------------------------- 2 Coldren, Sharon L. ------------------------- 16 Concepcion, Daniel ------------------------ 39 Davila, Rafael F. --------------------------- 43 del Valle, A. --------------------------------- 97 Escobar, Zalleris ---------------------------- 34 Fonseca Arelys ----------------------------- 34 Harmsen, Eric ------------------------------- 81 Hodge, Duvane ----------------------------- 70 Hwang, Sangchul ----------------------- 34, 39 Kardos, Josef -------------------------------- 21 Lopez-Morales, J. -------------------------- 87 Madamootoo, Chandra -------------------- 30 Mathurin, Rifca ----------------------------- 70 Miskewitz, Robert -------------------------- 21 Nemeth, Donna ----------------------------- 70 Nieto-Zambrano, S. ------------------------ 87 Nurse, Leonardo -------------------------------2 Obropta, Christopher ----------------------- 21 Perales-Perez, O. ------------------ 87, 92, 97 Perez-Alegria, Luis R. --------------------- 59 Platenberg, Renata ------------------------- 70 Ramos-Scharron, Carlos E. --------------- 26 Richards, Ronald T. ------------------------ 49
Page Rodriguez-Martinez, Jesús ---------------- 54 Rodriguez, Jose M. --------------------- 54, 64 Rojas, Alejandra ------------------------ 11, 81 Roman-Velazquez, F. ------------- 82, 92, 97 Sanchez, D. ---------------------------------- 97 Sanchez, Sacha ------------------------------ 39 Santini R. ------------------------------------ 43 Senecal, Catherine -------------------------- 30 Silva-Araya, Walter F. --------------------- 11 Smith, Henry S. ----------------------------- 75 Solomon, Hosanna --------------------------75 Suchorski, Alicia ----------------------------30 Villata Calderon, Christian A. -------------59
104