setting: a structural equation modeling analysis of
TRANSCRIPT
Page 1/18
Construct Validity of The Braden Scale forPredicting Pressure Sore Risk in the Long-term CareSetting: A Structural Equation Modeling Analysis ofSecondary DataPetra Schumacher ( [email protected] )
IMC University of Applied Sciences KremsGerhard Mueller
UMIT - Private University for Health Sciences, Medical Informatics and Technology
Research Article
Keywords: Braden Scale, construct validity, structural equation model, PLS, formative-formative model
Posted Date: January 4th, 2021
DOI: https://doi.org/10.21203/rs.3.rs-134197/v1
License: This work is licensed under a Creative Commons Attribution 4.0 International License. Read Full License

Page 2/18
AbstractBackground: The Braden Scale for Predicting Pressure Sore Risk (Braden Scale) is based on theconceptual model by Braden and Bergstrom. The scale’s psychometric properties have been tested withdifferent methods of classical test theory; however, there is limited research on the construct validity ofthe scale. Therefore, this study aimed to test the construct validity of the Braden Scale with structuralequation modeling (SEM) in the long-term care setting in Austria.
Methods: Secondary analysis of 311 residents’ medical records were completed with SmartPLS. Aformative-formative model was derived to evaluate the relationships between the measurement andlatent variables of the Braden Scale. For checking the prerequisite tests for the SEM, a standard PartialLeast Squares algorithm and a bootstrap procedure were used to estimate the signi�cance of the modelestimates. After calculating composite reliability of the total Braden Scale score, the overall formative-formative model was assessed for convergent and discriminant validity with the average varianceextracted index (AVE) and Fornell-Larcker-Crtiterion (FLC) as well as Standardized Root Mean SquareResidual �t index (SRMR).
Results: The outer weights revealed a middle positive effect for the subscale friction and shear (β =0.600); for all other subscale items, a weak positive effect (β = 0.261 – 0.430) on the two latentconstructs Pressure and Tissue Tolerance. The inner weights showed a weak effect for the constructTissue Tolerance (β = 0.423) and a middle effect for Pressure (β = 0.655) to the second order constructPressure Sore Development. The latent construct was satisfactory reliable. The Braden Scale model wasconvergent (AVE = 0.579) and discriminant valid (FLC Pressure = 0.954; FLC Tissue Tolerance = 0.886).The model itself had a �t of SRMR = 0.146.
Conclusions: The overall assessment of the Braden Scale show that both constructs (Pressure andTissue Tolerance) are valid in themselves and describe the overall construct Pressure Sore Developmentequally valid. The separation of the items into the two latent constructs Pressure and Tissue Tolerance,might be reasonable and should be focus of further nursing research.
BackgroundPressure sores or pressure ulcers (PU) are a major health concern in both acute and long-term carefacilities causing pain and discomfort to the affected person. A PU is a localized damage to the skin andunderlying tissue typically over bony prominences, such as sacrum, coccyx, heels, and hips regions due topressure with or without shear (1). Risk factors include advanced age, immobility, malnutrition, vasculardiseases, incontinence, and other skin conditions (2).
The prevalence varies depending on the risk population and tested setting. A hospital survey in UnitedStates acute care setting (n = 216,626) reported pressure injuries prevalence of 9.2 % (n = 19,893). Thereported prevalence for the German long-term care setting was 2 % to 5 % and in hospitals 2 % to 4 %(starting at category 2). Routine surveys in the hospital sector provided heterogeneous data with

Page 3/18
prevalence of 0.07 % to 4.37 % from category 1 and 1.6 % from category 2 (3). In Austria, the hospital-acquired pressure ulcer prevalence was 0.6 % (n = 3,648) in hospitals and 3.5 % (n = 696) in nursinghomes for the year 2012 (4). Between 2008 and 2012, the reported prevalence in long-term care facilitiesin Germany were between 4.8 % and 73.3 % (n = 14,798) depending on additional health conditions suchas urinary incontinence and malnutrition (5).
Nurses play a key role in recognizing patients at risk for developing PU through their regular assessmentand continuity of patient care. Standardized screening instruments, such as the Braden Scale forPredicting Pressure Sore Risk (Braden Scale) (6), may assist nurses in identifying PU risk in order toinitiate preventive interventions or treat existing wounds (7).
The Braden Scale is based on the conceptual model by Braden and Bergstrom (8). Determinants andfactors contributing to PU development are pressure intensity, pressure duration as well as tolerance ofthe skin and underlying tissues for pressure. The conceptual model underlying PU development isdisplayed in �gure 1.
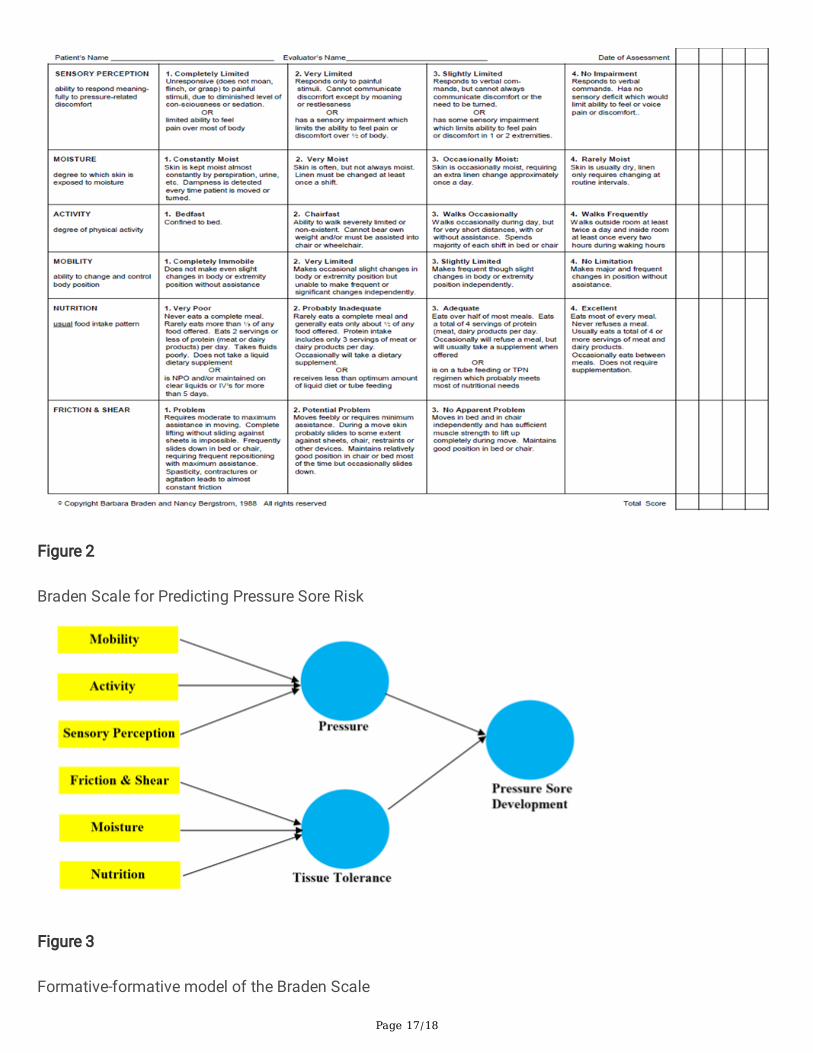
The factors mobility, activity, and sensory perception may contribute to prolonged Pressure exposure. Thefactors moisture, friction and shear are extrinsic factors, while the factor nutrition is an intrinsic factor.The extrinsic and intrinsic factors in�uence Tissue Tolerance (8). Mobility refers to the diminished abilityof a person to alternate or control their body position. Activity describes a person’s ability to moveindependently and thus, avoid prolonged pressure over bony prominences (e.g. sitting in a wheelchair orbeing bedridden). Sensory perception refers to a person’s reduced ability to perceive an uncomfortableposition and change their position accordingly. The extrinsic factor friction and shear forces aredemonstrated by a person’s inability to lift their body during a position change. The component of theextrinsic factor moisture refers to a person’s exposure to moisture (e.g. urinary and/or fecal incontinence,perspiration). The component of the intrinsic factor nutrition comprises the intake of food in order tonourish the body and support the quality and integrity of soft tissue (8).
The Braden Scale, as displayed in �gure 2, consists of six subscales to evaluate sensory perception,activity level, mobility, nutrition status, skin moisture, and friction and shear forces to assess the risk ofPU. The subscales are rated independently according to the observed severity from 1 to 4 points exceptfor the subscale friction and shear, which is ranked from 1 to 3 points (9). Hence, the total score canrange from 6 to 23 points (19 to 23 points, not at risk). The lower the score, the higher the PU risk for apatient (6). Several different cut-off points have been reported. Frequently, a score of 9 or lower indicatesvery high risk, 10 to 12 points high risk, 13 to 14 points moderate risk, and 15 to 18 mild risk to develop aPU (7).
The Braden Scale’s psychometric properties have been tested with different methods of classical testtheory. The literature review revealed evidence that the Braden Scale is valid, reliable, feasible, andapplicable for different populations and settings (5-7, 10).
Page 4/18
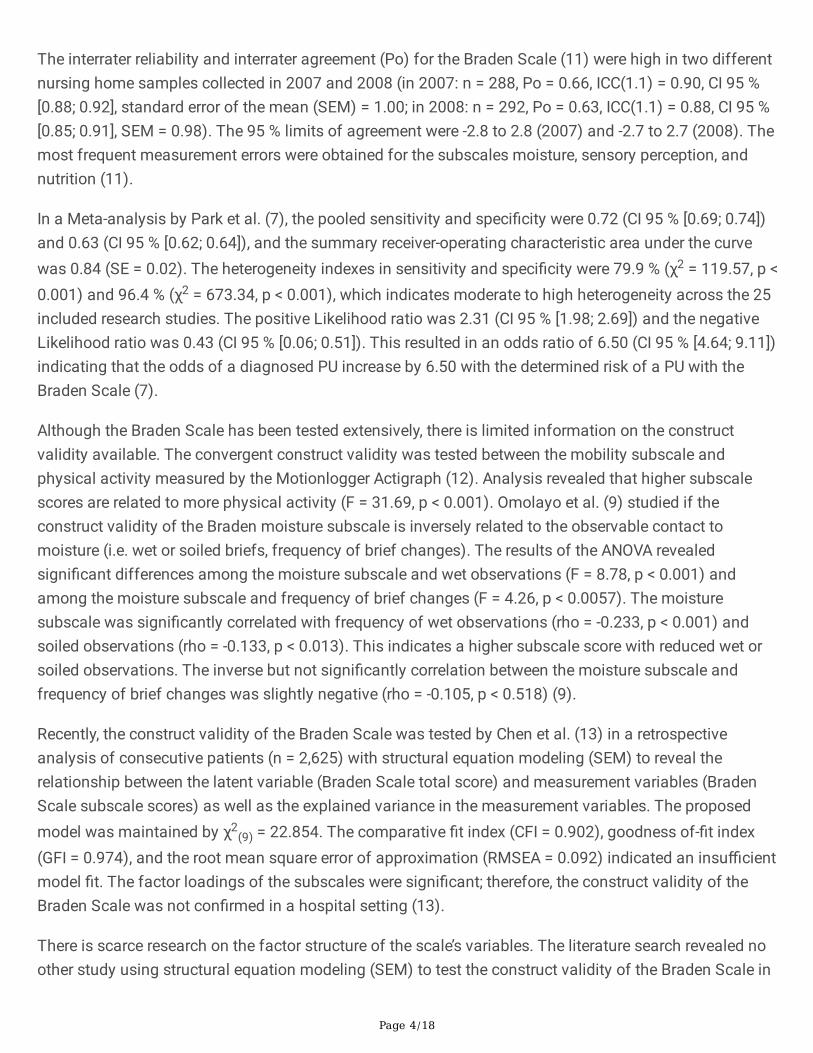
The interrater reliability and interrater agreement (Po) for the Braden Scale (11) were high in two differentnursing home samples collected in 2007 and 2008 (in 2007: n = 288, Po = 0.66, ICC(1.1) = 0.90, CI 95 %[0.88; 0.92], standard error of the mean (SEM) = 1.00; in 2008: n = 292, Po = 0.63, ICC(1.1) = 0.88, CI 95 %[0.85; 0.91], SEM = 0.98). The 95 % limits of agreement were -2.8 to 2.8 (2007) and -2.7 to 2.7 (2008). Themost frequent measurement errors were obtained for the subscales moisture, sensory perception, andnutrition (11).
In a Meta-analysis by Park et al. (7), the pooled sensitivity and speci�city were 0.72 (CI 95 % [0.69; 0.74])and 0.63 (CI 95 % [0.62; 0.64]), and the summary receiver-operating characteristic area under the curvewas 0.84 (SE = 0.02). The heterogeneity indexes in sensitivity and speci�city were 79.9 % (χ2 = 119.57, p <0.001) and 96.4 % (χ2 = 673.34, p < 0.001), which indicates moderate to high heterogeneity across the 25included research studies. The positive Likelihood ratio was 2.31 (CI 95 % [1.98; 2.69]) and the negativeLikelihood ratio was 0.43 (CI 95 % [0.06; 0.51]). This resulted in an odds ratio of 6.50 (CI 95 % [4.64; 9.11])indicating that the odds of a diagnosed PU increase by 6.50 with the determined risk of a PU with theBraden Scale (7).
Although the Braden Scale has been tested extensively, there is limited information on the constructvalidity available. The convergent construct validity was tested between the mobility subscale andphysical activity measured by the Motionlogger Actigraph (12). Analysis revealed that higher subscalescores are related to more physical activity (F = 31.69, p < 0.001). Omolayo et al. (9) studied if theconstruct validity of the Braden moisture subscale is inversely related to the observable contact tomoisture (i.e. wet or soiled briefs, frequency of brief changes). The results of the ANOVA revealedsigni�cant differences among the moisture subscale and wet observations (F = 8.78, p < 0.001) andamong the moisture subscale and frequency of brief changes (F = 4.26, p < 0.0057). The moisturesubscale was signi�cantly correlated with frequency of wet observations (rho = -0.233, p < 0.001) andsoiled observations (rho = -0.133, p < 0.013). This indicates a higher subscale score with reduced wet orsoiled observations. The inverse but not signi�cantly correlation between the moisture subscale andfrequency of brief changes was slightly negative (rho = -0.105, p < 0.518) (9).
Recently, the construct validity of the Braden Scale was tested by Chen et al. (13) in a retrospectiveanalysis of consecutive patients (n = 2,625) with structural equation modeling (SEM) to reveal therelationship between the latent variable (Braden Scale total score) and measurement variables (BradenScale subscale scores) as well as the explained variance in the measurement variables. The proposedmodel was maintained by χ2
(9) = 22.854. The comparative �t index (CFI = 0.902), goodness of-�t index(GFI = 0.974), and the root mean square error of approximation (RMSEA = 0.092) indicated an insu�cientmodel �t. The factor loadings of the subscales were signi�cant; therefore, the construct validity of theBraden Scale was not con�rmed in a hospital setting (13).
There is scarce research on the factor structure of the scale’s variables. The literature search revealed noother study using structural equation modeling (SEM) to test the construct validity of the Braden Scale in

Page 5/18
the long-term care setting in Austria. Therefore, this study aimed to test the construct validity of theBraden Scale with SEM in the long-term care setting in Austria.
MethodsStudy Design
The study design was a quantitative multicenter secondary analysis of data from the long-term caresetting. We followed the Standardized Reporting of Secondary Data Analyses (STROSA) statement forreporting (14).
Sample and Setting
Medical records of residents with previously recorded Braden Scale total and subscale scores wereincluded from eight long-term care facilities of the Innsbrucker Soziale Dienste (permission for accessgranted) in Tyrol, Austria. Residents with missing Braden Scale total and subscale scores were excluded.The sample size determination for SEM can be determined by power analysis for multiple regressionmodels (15). Since the maximum number of independent variables (Braden subscale items) is six, thesample should include at least 130 residents to achieve a statistical power of 80% (with error probabilityless or equal than 5%) to detect a coe�cient of determination (R2) of at least 0.10. R2 value is used toevaluate the structural model. The sample size decreases with higher R2 values (15, 16).
Data Collection Procedure and Materials
Data collection started in April 2018. Medical records of the nursing home residents were checked forsocio-demographic data (resident’s year of birth, gender, Braden Scale total and subscale scores),extracted, and entered into a provided SPSS version 26.0 matrix solely by the procurator of qualitymanagement of the nursing homes (Innsbrucker Soziale Dienste).
The socio-demographic data of the registered nurse administrating the Braden scale at the time of theassessment (gender, year of birth, years of work experience (in categories 0-5, 6-10 years, a.s.o.) wasgathered by the procurator as well.
Statistical Analysis
The socio-demographic data was analyzed in SPSS descriptively on an exploratory level, depending onthe level of measurement. In addition, percentage and absolute frequencies were calculated. TheKolmogorov-Smirnov test was used to check the normal distribution of metric variables.
For the SEM, the data analyses were completed with SmartPLS (v3.3.2). Based on the conceptualschema for the study of the etiology of pressure ulcers (8), a formative-formative model was derived toevaluate the relationships between measurement and latent variables of the Braden Scale. A formativemeasurement model is based on the hypothesis that the latent construct (Pressure Sore Development) is

Page 6/18
fully formed by the composite indicators (Braden subscale items). Hypothetical constructs thus representa linear combination of the composite indicators, which corresponds to the regression analysis approach(16, 17). Hereby, the latent construct Pressure Sore Development (Braden Scale total score) wasunderstood as a second order construct or formative-formative model (18), since the Braden subscaleitems of the latent construct Pressure Sore Development are composed of two other �rst-order latentconstructs, namely Pressure and Tissue Tolerance. Figure 3 displays the formative-formative modelderived from the conceptual schema for the study of the etiology of pressure ulcers (8).
In a �rst step, the prerequisite tests for the SEM, the internal consistency (n = 6 items; n = 311 sample)and an exploratory factor analysis (EFA), were calculated in SPSS to check the one-dimensionality of theconstructs (17). In the present formative-formative model, the calculation of Cronbach’s alpha values isstatistically not necessary and only possible for Pressure Sore Development due to the second ordermodel, since the other two constructs are of formative nature and do not necessarily covary (16). Thethreshold for Cronbach’s alpha values is 0.5, indicating a low internal consistency (with a possible valuerange of 0 to 1) (19). The EFA was calculated by using principal factor analysis. Data adequacy wasanalyzed with the Kaiser-Meyer-Olkin coe�cient (KMO) and veri�ed the existence of a moderatecorrelation for Pressure (KMO = 0.6932) and a weak correlation for Tissue Tolerance (KMO = 0.5626).The relations between the Braden subscale items to the two latent constructs Pressure and TissueTolerance were represented by factor loadings (λ). Loadings indicate how strongly a factor explains acertain item with a possible range between -1 and 1. The higher the factor loading, the closer therelationship between the subscale item and the factor (20).
A standard PLS algorithm and a bootstrap procedure was used to estimate the signi�cance of the modelestimates. The Partial Least Squares (PLS) technique was used to analyze the formative-formativemodel. The measurement (outer) model describes the path coe�cients (outer weights, β) between theBraden subscales to the two latent constructs Pressure and Tissue Tolerance. The effect of the structural(inner) model describes the path coe�cients (inner weights, β) from the two latent constructs to thesecond order construct Pressure Sore Development. The signi�cance of the path coe�cients and theloadings were tested with the bootstrapping method (N = 5,000) (16). Then, the composite reliability ofPressure Sore Development was directly calculated in SmartPLS. The reliability increases the moredissimilar the items of the factor charges on a latent construct (16, 21). Composite reliability considersthe different loadings of the items on a construct. In terms of content, values between 0.6 and 0.7 areregarded as acceptable and values between 0.7 and 0.9 as satisfactory (16).
The next step involved the assessment of the overall formative-formative model for convergent anddiscriminant validity. Convergent validity is the correlation of a construct with the alternativemeasurement of the same construct. The index calculated is the average variance extracted (AVE), whichshould be greater than 0.5 to be considered valid (16). Discriminant validity refers to the fact that a latentconstruct really differs from other latent constructs in the model. The �rst way to check this was toevaluate the cross loadings between the latent factors. Overall, the cross loading of an item on its latentfactor should be greater than all other cross loadings of the item on all other latent constructs together

Page 7/18
and thus, should belong to the latent factor to which it is theoretically assigned. Another criterion used tocheck discriminant validity is the Fornell-Larcker-Criterion (FLC), which compares the square root of theAVE of a latent construct, which “should be greater than its highest correlation with any other constructs”(16).
In a last step, the quality measure of the overall structural model was calculated with the StandardizedRoot Mean Square Residual (SRMSR) �t index, which requires a limit value of under 0.080 (22, 23).
Ethical Consideration
The study was approved by the local Research Committee for Scienti�c and Ethical Questions of theUMIT - Private University for Health Sciences, Medical Informatics and Technology. Residents’ andregistered nurses’ informed consent was waived by the ethics committee due to the nature of secondaryanalysis of previously recorded data. Data from the residents’ medical records and registered nurses werecollected and anonymized solely by the procurator of quality management of the nursing homes. Thetransfer of anonymized data from the long-term care facility was for statistical purposes only. Theauthors and the statistician only received anonymized data and were blinded to residents’ and registerednurses’ names. Names of residents and registered nurses were also not mentioned in any scienti�cpublications. The authors con�rm that all methods were carried out in accordance with relevantguidelines and regulations. The regulations of the Data Protection Act in the current version was ful�lledby all involved study persons. These persons were subject to a statutory con�dentiality obligation.
ResultsSocio-demographic Characteristics
In total, 311 medical records of nursing home residents had recorded Braden Scale total and subscalescores and were extracted. The socio-demographic characteristics of the residents is summarized in table1.
Table 1: Socio-demographic characteristics of nursing home residents (n = 311)
Gender n (%) Min Max MD IQR Mean SD±
Years in age Female
Male
235(75.6)
76(24.4)
50
39
100
100
89.00
83.50
81.00;94.00
74.25;90.00
87.01
82.24
9.765
11.651
Braden Scale totalscore
Female
Male
235(75.6)
76(24.4)
6
7
23
23
18.00
17.00
14.00;21.00
13.00;20.00
17.03
16.51
4.313
4.310
Page 8/18
Legend: n = number, % = percent, Min = minimum, Max = maximum, MD = median, IQR = interquartilerange, SD = standard deviation.
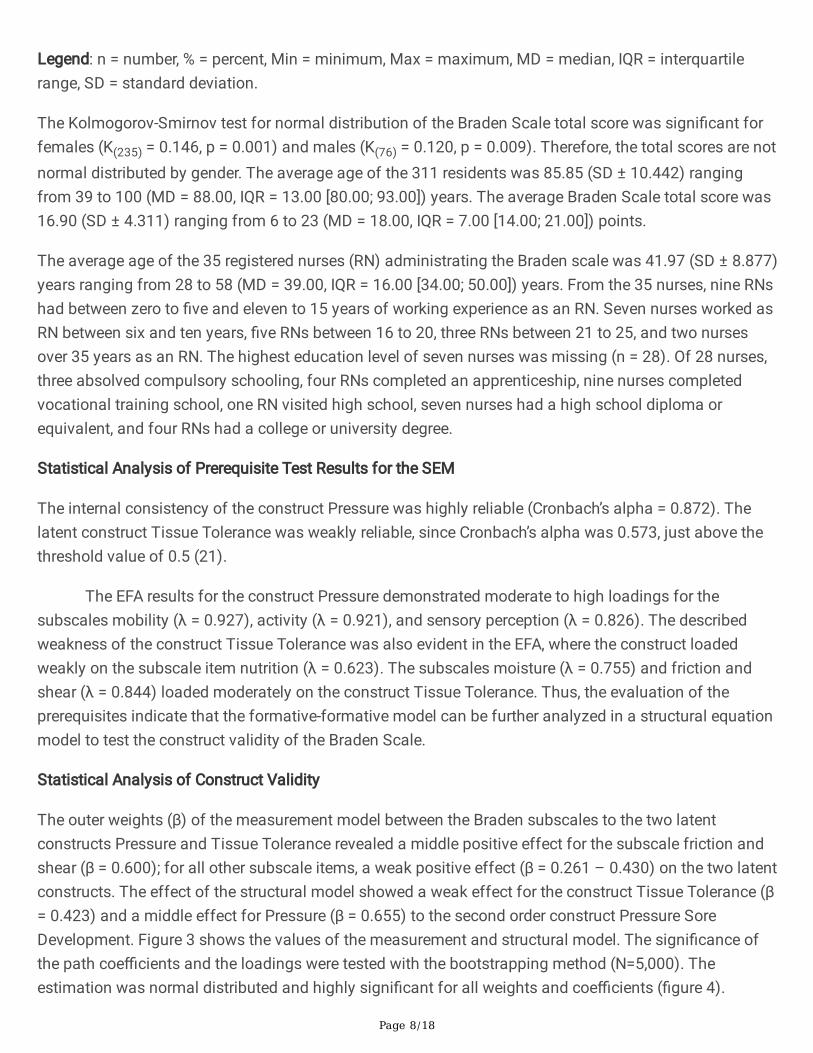
The Kolmogorov-Smirnov test for normal distribution of the Braden Scale total score was signi�cant forfemales (K(235) = 0.146, p = 0.001) and males (K(76) = 0.120, p = 0.009). Therefore, the total scores are notnormal distributed by gender. The average age of the 311 residents was 85.85 (SD ± 10.442) rangingfrom 39 to 100 (MD = 88.00, IQR = 13.00 [80.00; 93.00]) years. The average Braden Scale total score was16.90 (SD ± 4.311) ranging from 6 to 23 (MD = 18.00, IQR = 7.00 [14.00; 21.00]) points.
The average age of the 35 registered nurses (RN) administrating the Braden scale was 41.97 (SD ± 8.877)years ranging from 28 to 58 (MD = 39.00, IQR = 16.00 [34.00; 50.00]) years. From the 35 nurses, nine RNshad between zero to �ve and eleven to 15 years of working experience as an RN. Seven nurses worked asRN between six and ten years, �ve RNs between 16 to 20, three RNs between 21 to 25, and two nursesover 35 years as an RN. The highest education level of seven nurses was missing (n = 28). Of 28 nurses,three absolved compulsory schooling, four RNs completed an apprenticeship, nine nurses completedvocational training school, one RN visited high school, seven nurses had a high school diploma orequivalent, and four RNs had a college or university degree.
Statistical Analysis of Prerequisite Test Results for the SEM
The internal consistency of the construct Pressure was highly reliable (Cronbach’s alpha = 0.872). Thelatent construct Tissue Tolerance was weakly reliable, since Cronbach’s alpha was 0.573, just above thethreshold value of 0.5 (21).
The EFA results for the construct Pressure demonstrated moderate to high loadings for thesubscales mobility (λ = 0.927), activity (λ = 0.921), and sensory perception (λ = 0.826). The describedweakness of the construct Tissue Tolerance was also evident in the EFA, where the construct loadedweakly on the subscale item nutrition (λ = 0.623). The subscales moisture (λ = 0.755) and friction andshear (λ = 0.844) loaded moderately on the construct Tissue Tolerance. Thus, the evaluation of theprerequisites indicate that the formative-formative model can be further analyzed in a structural equationmodel to test the construct validity of the Braden Scale.
Statistical Analysis of Construct Validity
The outer weights (β) of the measurement model between the Braden subscales to the two latentconstructs Pressure and Tissue Tolerance revealed a middle positive effect for the subscale friction andshear (β = 0.600); for all other subscale items, a weak positive effect (β = 0.261 – 0.430) on the two latentconstructs. The effect of the structural model showed a weak effect for the construct Tissue Tolerance (β= 0.423) and a middle effect for Pressure (β = 0.655) to the second order construct Pressure SoreDevelopment. Figure 3 shows the values of the measurement and structural model. The signi�cance ofthe path coe�cients and the loadings were tested with the bootstrapping method (N=5,000). Theestimation was normal distributed and highly signi�cant for all weights and coe�cients (�gure 4).

Page 9/18
Overall Assessment of the Model
The composite reliability (CR) of the construct Pressure Sore Development demonstrated that the latentconstruct was satisfactory reliable (Cronbach’s α = 0.845; CR = 0.888).
The tested structural model of the Braden Scale was convergent valid since the average extractedvariance (AVE) was calculated in this model with 0.579 and thus exceeds the required limit of 0.500. Thediscriminant validity was �rst checked with the cross loadings between the latent factors. Since thesecond order construct Pressure Sore Development consists of all items, it was included in the table ofcross loadings (table 2).
Table 2: Cross loadings of latent factors
Pressure Pressure Sore Development Tissue Tolerance
Mobility 0.921 0.878 0.644
Activity 0.923 0.880 0.654
Sensory Perception 0.831 0.792 0.591
Moisture 0.530 0.671 0.757
Friction & Shear 0.644 0.788 0.890
Nutrition 0.355 0.477 0.539
The cross loadings were assigned to the highest constructs, where they are theoretically located (table 2).Next the Fornell-Larcker-Criterion was used and showed that both latent constructs (FLC Pressure = 0.954,FLC Tissue Tolerance = 0.886) had a very high variance elucidation regarding the target constructPressure Sore Development, which again con�rms the separation into the two constructs Pressure andTissue Tolerance.
The model itself had a �t of SRMR = 0.146, which is above the required limit value (< 0.080) and cantherefore be considered unacceptable, but still su�cient for random sampling.
DiscussionThe Braden Scale has been extensively tested for its test-theoretic properties; however, there is scarceresearch on the factor structure of the scale’s variables. Therefore, this study aimed to test the constructvalidity of the Braden Scale with structural equation modeling in the long-term care setting in Austria.
A formative-formative model (18) was derived based on the conceptual schema for the study of theetiology of pressure ulcers (8). Evaluation of the outer weights of the measurement model between theBraden subscales to the two �rst order latent constructs Pressure and Tissue Tolerance revealed a middlepositive effect for the subscale friction and shear. For all other Braden subscale items, the outer weights

Page 10/18
demonstrated a weak positive effect on the two latent �rst order constructs. The effect of the structuralmodel produced a weak effect for the construct Tissue Tolerance and a middle effect for the constructPressure to the second order construct Pressure Sore Development. The model estimation was normaldistributed and highly signi�cant for all weights and coe�cients. The overall assessment of the BradenScale model estimation revealed that the latent second order construct Pressure Sore Development wassatisfactory reliable. The tested measurement model of the Braden Scale was convergent valid and forthe discriminant validity, the cross loadings were assigned to the highest constructs, where they aretheoretically located. The FLC showed that both latent �rst order constructs had a very high varianceelucidation regarding the target construct Pressure Sore Development and thus, con�rms the separationinto the two constructs Pressure and Tissue Tolerance.
No other study was identi�ed that derived a formative-formative model to assess relationships betweenthe latent and measurement variables of the Braden Scale. In addition, no other nursing study could beidenti�ed that speci�ed a formative model when describing the nature of a construct. In contrast toformative models, the re�ective model is characterized by the fact that the manifestations of themeasurement variables are causally caused by the latent variable. This is accompanied by theassumption that changes in the latent variable lead to an effect in all the observed variablessimultaneously (neglecting measurement errors) (16). Chen et al. (13) derived a non-hierarchical re�ectivemodel to map the relationships between the latent variable (pressure sore risk denoted by the Bradenscale total score) and measurement variables (Braden scale subscale scores) as well as the explainedvariance in the measurement variables. The secondary data analysis of consecutive hospital patients (n= 2,625) indicated an insu�cient model �t and that the Braden subscales nutrition, activity, and frictionand shear were not independent risk factors for Pressure Sore Development (13). The nature of are�ective model is based on classical test theory (16). So, by adopting a re�ective model for the BradenScale, the subscale items are a representation of all possible risk factors within the conceptual schema ofPressure Sore Development, and thus, correlate with each other. This indicates that the Braden subscaleitems should be interchangeable, and a single subscale item can be deleted without altering the constructmeaning (16).
Since our study assumed a formative-formative model based on the one hand on the conceptual schemafor the study of the etiology of pressure ulcers (8) and on the other hand, published formative modelselection criteria (24), our results cannot be compared with those by Chen et al. (13). The adoptedformative-formative nature of our model assumes that the main factors for Pressure Sore Developmentand thus, the cause of pressure sores, are the latent constructs Intensity and Duration of Pressure andTissue Tolerance for Pressure (8). Contributing factors for the Intensity and Duration of Pressure are theBraden subscale items mobility, activity, and sensory perception. Contributing factors for TissueTolerance are the extrinsic factors and subscale items moisture and friction and shear as well as theintrinsic factor nutrition (8). Other intrinsic factors displayed in the conceptual schema are not items ofthe Braden scale and were as such not included in the formative-formative model for this study. Tofurther evaluate the nature of the relationship between the latent constructs and the measurementvariables and thus guide the selection of a formative model, four speci�c selection criteria were applied

Page 11/18
(24). (1) […] changes in the measures would produce changes in the latent construct” (25); (2) eachmeasurement item depicts a unique facet of the latent construct; (3) measurement items may or may notcovary; and (4) since measurement items represent a unique facet of the latent construct, they are notlikely to all have the same antecedents and effects (25). Since all four formative model selection criteriaapply in our opinion to the Braden Scale and the conceptual schema (8) indicates a second orderformative model, the authors agreed to evaluate a formative-formative model instead of replicating theresearch method by Chen et al. (13).
Several possible limitations may have in�uenced the results. The authors chose to evaluate the BradenScale based on the assumption of a formative-formative model. Other researchers may have a differentapproach or understanding of the conceptual schema of the Braden Scale. A selection bias is possiblesince only the procurator of quality management collected data due to privacy policies of the nursinghomes and chose, which records to include to reach the required number of at least 300 residents.Therefore, transcription errors cannot be ruled out. The results of this study are based on secondary dataanalysis of data from eight nursing homes in a single state in Austria and are thus, not representative forthe long-term care setting.
ConclusionsThe separation of the items of the Braden Scale into two latent constructs is strongly supported by theempirical results. The individual analyses of the EFA, the SEM, and the overall assessment show thatboth constructs (Pressure and Tissue Tolerance) are valid in themselves and describe the overallconstruct equally valid. Only the Braden subscale item nutrition seems to occupy a special position,which theoretically has its cause in the distinction between extrinsic and intrinsic factors of the latentconstruct Tissue Tolerance as displayed in the conceptual model for the study of the etiology of pressureulcers. Overall, all coe�cients were positive, indicating that an increase in a Braden subscale item causesan increase of the �rst and second order latent constructs. The Braden subscale item friction and shearshowed a medium strength relationship with the second order latent construct Pressure SoreDevelopment, all other coe�cients had weak correlations.
In nursing practice, the Braden Scale consists of six subscales. The subscales are rated independentlyaccording to the observed severity for a total score indicating a possible risk for PU. Regarding thepresented results, a separation into two total scores, one for the subscales measuring Pressure and onefor Tissue Tolerance, might be reasonable and should be focus of further nursing research.
AbbreviationsAVE Average Variance Extracted index
CFI Comparative Fit Index
CI 95 % Con�dence Interval 95 %

Page 12/18
CR Composite Reliability
EFA Exploratory Factor Analysis
FLC Fornell-Larcker-Crtiterion
IQR Interquartile Range
KMO Kaiser-Meyer-Olkin Coe�cient
Max Maximum
MD Median
Min Minimum
n Number
% Percent
p Probability
PLS Partial Least Squares
PO Interrater Agreement
PU Pressure Ulcer
R2 Coe�cient of Determination
RHO Spearman's Rank Correlation
RMSEA Root Mean Square Error of Approximation
RN Registered Nurse
SD Standard Deviation
SEM Structural Equation Modeling
SRMR Standardized Root Mean Square Residual �r index
DeclarationsEthics approval and consent to participate. The study was approved by the local Research Committee forScienti�c and Ethical Questions of the UMIT - Private University for Health Sciences, Medical Informaticsand Technology. Residents’ and registered nurses’ informed consent was waived by the ethics committee

Page 13/18
due to the nature of secondary analysis of previously recorded data. Data from the residents’ medicalrecords and registered nurses were collected and anonymized solely by the procurator of qualitymanagement. The transfer of anonymized data from the long-term care facility was for statisticalpurposes only. The authors and the statistician only received anonymized data and were blinded toresidents’ and registered nurses’ names. Names of residents and registered nurses were also notmentioned in any scienti�c publications. The authors con�rm that all methods were carried out inaccordance with relevant guidelines and regulations. The regulations of the Data Protection Act in thecurrent version was ful�lled by all involved study persons. These persons were subject to a statutorycon�dentiality obligation.
Availability of data and materials. The datasets used and/or analyzed during the current study areavailable from the corresponding author on reasonable request. For having this data,
please contact PS. [email protected]
Competing interest. None to declare.
Funding. Tiroler Wissenschaftsfonds (TWF). Contract number: GZ: UNI-0404-2156
Authors’ contributions. Both authors designed the study; PS wrote the manuscript and GM doublechecked the manuscript. Data collection and anonymization was carried out solely by the procurator ofquality management of the nursing homes (Innsbrucker Soziale Dienste). Statistical analysis was carriedout by STATWORX®. Both authors read and approved the �nal manuscript.
Acknowledgments. We thank the participating nursing homes and especially the procurator of qualitymanagement of the Innsbrucker Soziale Dienste who supported us during data collection.
Authors’ Information. Author 1. Petra Schumacher, BScN, MScN
IMC University of Applied Sciences Krems
Department Health Sciences
Address: Piaristengasse 1, A-3500 Krems, Austria
Telephone: +43(0) 2732 802 – 223
Email: [email protected]
Author 2. Gerhard Mueller, Univ.-Prof., Dr., MSc
UMIT - Private University for Health Sciences, Medical Informatics and Technology
Department of Nursing Science and Gerontology, Institute of Nursing Science

Page 14/18
Address: Eduard Wallnoefer-Zentrum 1, A-6060 Hall in Tyrol, Austria
Telephone: +43(0) 508 648 – 3891
Email: [email protected]
Corresponding author. Petra Schumacher, BScN, MScN
Email: [email protected]
References1. Panel NPUA, Panel EPUA, Alliance PPPI. Prevention and Treatment of Pressure Ulcers: Quick
Reference Guide. Osborne Park, Australia: Cambridge Media; 2014.
2. Reddy M. Pressure ulcers. BMJ clinical evidence. 2011;2011.
3. Tomova-Simitchieva T, Akdeniz M, Blume-Peytavi U, Lahmann N, Kottner J. Die Epidemiologie desDekubitus in Deutschland: eine systematische Übersicht. Das Gesundheitswesen. 2019;81(06):505-12.
4. Halfens RJ, Meesterberends E, van Nie-Visser NC, Lohrmann C, Schönherr S, Meijers JM, et al.International prevalence measurement of care problems: results. J Adv Nurs. 2013;69(9):e5-17.
5. Lahmann NA, Tannen A, Kuntz S, Raeder K, Schmitz G, Dassen T, et al. Mobility is the key! Trends andassociations of common care problems in German long-term care facilities from 2008 to 2012. Int JNurs Stud. 2015;52(1):167-74.
�. Bergstrom N, Demuth PJ, Braden BJ. A clinical trial of the Braden Scale for Predicting Pressure SoreRisk. Nurs Clin North Am. 1987;22(2):417-28.
7. Park SH, Lee YS, Kwon YM. Predictive Validity of Pressure Ulcer Risk Assessment Tools for Elderly: AMeta-Analysis. West J Nurs Res. 2016;38(4):459-83.
�. Braden B, Bergstrom N. A conceptual schema for the study of the etiology of pressure sores. RehabilNurs. 1987;12(1):8-12.
9. Omolayo T, Brown K, Rapp MP, Li J, Barrett R, Horn S, et al. Construct validity of the moisturesubscale of the Braden Scale for Predicting Pressure Sore Risk. Adv Skin Wound Care.2013;26(3):122-7.
10. Bergstrom N. The Braden Scale for predicting pressure sore risk. Nurs res. 1987;36(4):205-10.
11. Kottner J, Halfens R, Dassen T. An interrater reliability study of the assessment of pressure ulcer riskusing the Braden scale and the classi�cation of pressure ulcers in a home care setting. Int J NursStud. 2009;46(10):1307-12.
12. Powers GC, Zentner T, Nelson F, Bergstrom N. Validation of the mobility subscale of the Braden Scalefor predicting pressure sore risk. Nursing Research. 2004;53(5):340-6.
Page 15/18
13. Chen HL, Cao YJ, Shen WQ, Zhu B. Construct Validity of the Braden Scale for Pressure UlcerAssessment in Acute Care: A Structural Equation Modeling Approach. Ostomy Wound Manage.2017;63(2):38-41.
14. Swart E, Schmitt J. STandardized Reporting Of Secondary data Analyses (STROSA)-Vorschlag fürein Berichtsformat für Sekundärdatenanalysen. Zeitschrift für Evidenz, Fortbildung und Qualität imGesundheitswesen. 2014;108(8-9):511-6.
15. Cohen J. A power primer. Psychological bulletin. 1992;112(1):155.
1�. Hair Jr JF, Hult GTM, Ringle C, Sarstedt M. A primer on partial least squares structural equationmodeling (PLS-SEM): Sage publications; 2016.
17. Weiber R, Mühlhaus D. Strukturgleichungsmodellierung: Eine anwendungsorientierte Einführung indie Kausalanalyse mit Hilfe von AMOS, SmartPLS und SPSS: Springer-Verlag; 2014.
1�. Becker J-M, Klein K, Wetzels M. Hierarchical latent variable models in PLS-SEM: guidelines for usingre�ective-formative type models. Long range planning. 2012;45(5-6):359-94.
19. Blanz M. Forschungsmethoden und Statistik für die Soziale Arbeit: Grundlagen und Anwendungen:Kohlhammer Verlag; 2015.
20. Bühner M. Einführung in die Test-und Fragebogenkonstruktion: Pearson Deutschland GmbH; 2011.
21. Raykov T. Scale Reliability, Cronbach's Coe�cient Alpha, and Violations of Essential Tau-Equivalencewith Fixed Congeneric Components. Multivariate Behav Res. 1997;32(4):329-53.
22. Hu Lt, Bentler PM. Cutoff criteria for �t indexes in covariance structure analysis: Conventional criteriaversus new alternatives. Structural equation modeling: a multidisciplinary journal. 1999;6(1):1-55.
23. Sivo SA, Fan X, Witta EL, Willse JT. The search for" optimal" cutoff properties: Fit index criteria instructural equation modeling. The Journal of Experimental Education. 2006;74(3):267-88.
24. Ford LA. Selection issues of formative models. Journal of Management Development. 2017.
25. MacKenzie SB, Podsakoff PM, Jarvis CB. The problem of measurement model misspeci�cation inbehavioral and organizational research and some recommended solutions. Journal of appliedpsychology. 2005;90(4):710.
Figures

Page 16/18
Figure 1
Conceptual model for the study of the etiology of pressure ulcers (8)
Page 17/18
Figure 2
Braden Scale for Predicting Pressure Sore Risk
Figure 3
Formative-formative model of the Braden Scale

Page 18/18
Figure 4
Path coe�cients (β) of the measurement and structural model