setting a college-readiness cut score for the crmt crmt working group august 19, 2009 1:30-3:30 ...
TRANSCRIPT

Setting a college-readiness cut score for the CRMT
CRMT Working GroupAugust 19, 20091:30-3:30
Background
Pilot test summary
Current MPT-I placement cut scores
Contrasting groups
Group discussion

CRMT Background
http://apps.leg.wa.gov/documents/billdocs/2007-08/Pdf/Bills/House%20Passed%20Legislature/1906-S2.PL.pdf
System Agreements around Using CRMT
•Provosts’ agreement http://www.washington.edu/oea/services/testing_center/crmt/ProvostsAgreement.pdf
• CTC agreement
Purpose
2008-2009 CRMT Pilot Study 1
To relate MPT test scores to subsequent course grades to assist in setting CRMT college readiness cut score
Research Questions How does student performance on the MPT-G
compare to performance on the MPT-I?
How well do student test scores predict student grades?
1 McGhee D., N. Lowell, J. Gillmore, and J. Peterson (2009) 2009 General Mathematics Placement Test (MPT-G) Pilot , OEA Report 09-03 [http://www.washington.edu/oea/pdfs/reports/OEAReport0903.pdf]

Method
2008-2009 CRMT Pilot Study
Students at four-year universities took the MPT-G (n = 557) or the MPT-I (n = 692) for placement into courses
Students at other campuses were offered the opportunity to use test scores for placement at four-year universities
Tests administered between October 2008 and June 2009
Edmonds CC (n = 89)
Spokane Falls CC (n = 137)
TESC (n = 34)
21 high schools (n = 2220)

Results
2008-2009 CRMT Pilot Study
Test Reliability
Both the MPT-G and MPT-I showed excellent internal consistency ( = .84 and .85, respectively)
Test Difficulty
The MPT-G was more difficult than the MPT-I (Mns = 18.4 and 20.4, respectively; percentage equivalents = 52.6% and 58.3%)

2008-2009 CRMT Pilot Study
Test Difficulty (continued)
The difference in test difficulty was observed for all three educational sectors, but was most pronounced at four-year institutions
Average total score by test type and institution type
Results

2008-2009 CRMT Pilot Study
Test Difficulty (continued)
Students enrolled or enrolling in college level courses scored 6 points higher than students taking courses below college level
Average total score by test type and course level
Results

2008-2009 CRMT Pilot Study
Course Grades
MPT-G and MPT-I scores were significantly correlated with subsequent math course grades both at high schools and four-year schools (r .4)
Results

2008-2009 CRMT Pilot Study
Course Grades (continued)
Students who passed their math course (grade 2.0) tended to have scored significantly higher on the MPT than did students who did not pass
Results
Average total score by course level and grade (four-year schools)

2008-2009 CRMT Pilot Study
Course Grades (continued)
The probability of passing a course generally increased with total test score
Results
Observed rates of success in non-precalculus/calculus college level courses as a function of total test score (four-year schools)

Conclusions
2008-2009 CRMT Pilot Study
Both tests show good discriminant validity in the superior performance of students taking college level math courses over those in pre-college level courses
Both tests show good predictive validity by the significant correlations between total test scores and mathematics course grades
Both the MPT-G and MPT-I show excellent reliability

Current Intermediate Math Placement Test (MPT-I) Placement Cutoffs (July 2009)Placement Cut Score Central Eastern UW-S Wash St Western
30 206202
Calculus for Arch.Business Calculus
25 118 Accel precalc
23 211200105
Elem teachers Finite mathPrecalculus
107 Elem functions
21 120 Precalculus
20 251201
Elem teachersFinite math
381156114
K-12 teachersAlg for businessPrecalculus
19 154 Precalculus 2
18 153 Precalculus 1
17 115 Liberal arts 111107
Business Liberal arts
240 Stats intro
15 114 Alg concepts 212210205
Stats introMath introStat’l thinking
112107101
Alg functionsMath reasoningElem teachers
12 104 Intermed alg
4 103 Alg intro
0 100.1 Algebra 100 Comb 103/104 98 Intermed alg 101 Elem alg review 10699
Quant reasoningAlg intro

DefinitionContrasting Groups
A family of methods to use actual performance data of known groups to set cut scores
Process1. Define two groups (“Masters” and “Non-Masters”)
2. Analyze data to find score(s) that best differentiate(s) between groupsa. Select the point of intersection of two frequency distributions
(visual inspection)
b. Find the midpoint between average scores (computation)
c. Find score at which probability of group membership is .50 (using logistic regression)

Defining the Groups
Contrasting Groups
You want the groups to be meaningful, defensible, and clearly distinct
Not distinct enough
High school Algebra 1 students vs.
Post-secondary Calculus students
(All) high school students vs.
(All) post-secondary students
More extreme than necessary

Possible Groups
Contrasting Groups
1. any non-college, < 2.0 vs. any college, 2.0
2. any non-college, < 2.0 vs. post-secondary, college, 2.0
3. post-secondary, non-college vs. post-secondary, college
4. post-secondary, non-college, < 2.0 vs. post-secondary, college, 2.0
5. high school, non-college vs. post-secondary, college
6. high school, non-college , < 2.0 vs. post-secondary, college, 2.0

Comparison 1
Any non-college class,
<2.0
Any college-level class,
2.0+MID-
POINTMPT-G Median 13 23 18.0
Mean 13.56 22.71 18.1SD 4.84 6.04Valid N 162 370
MPT-I Median 15.5 25 20.3Mean 15.92 24.49 20.2SD 5.17 5.8Valid N 182 528
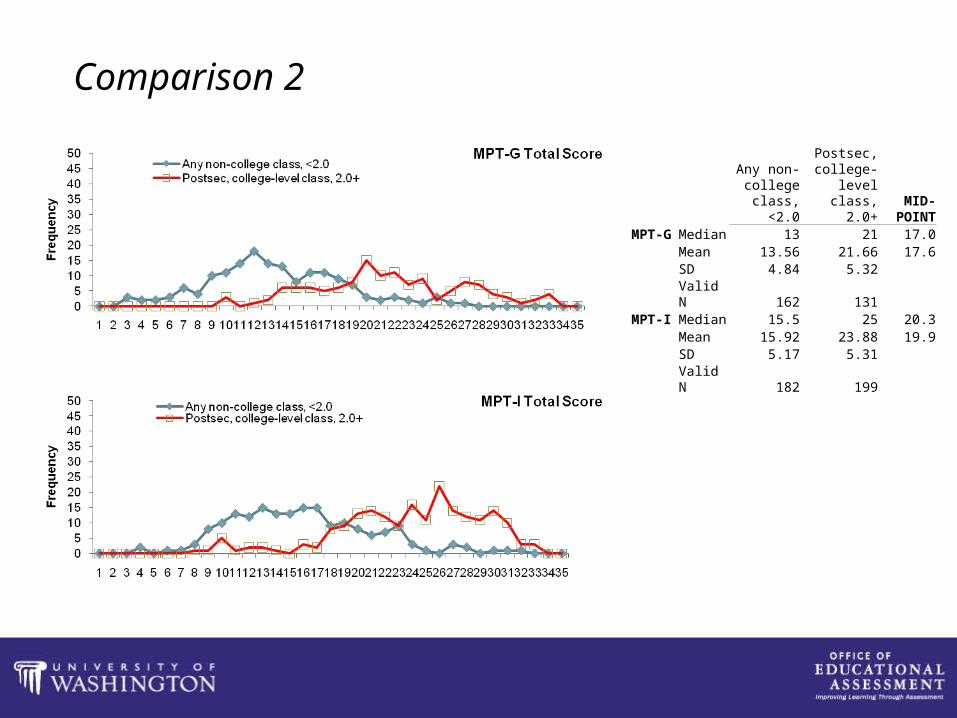
Comparison 2
Any non-college class,
<2.0
Postsec, college-level
class, 2.0+MID-
POINTMPT-G Median 13 21 17.0
Mean 13.56 21.66 17.6SD 4.84 5.32Valid N 162 131
MPT-I Median 15.5 25 20.3Mean 15.92 23.88 19.9SD 5.17 5.31Valid N 182 199

Comparison 3
Postsec, non-college class
Postsec, college-level
classMID-
POINTMPT-G Median 12 21 16.5
Mean 12.28 20.98 16.6SD 3.9 5.29Valid N 60 190
MPT-I Median 14 23 18.5Mean 14.51 22.89 18.7SD 4.92 5.29Valid N 68 293

Comparison 4
Postsec, non-college class,
<2.0
Postsec, college-level
class, 2.0+MID-
POINTMPT-G Median 12 21 16.5
Mean 11.7 21.66 16.7SD 3.86 5.32Valid N 27 131
MPT-I Median 14 25 19.5Mean 13.82 23.88 18.9SD 4.18 5.31Valid N 33 199
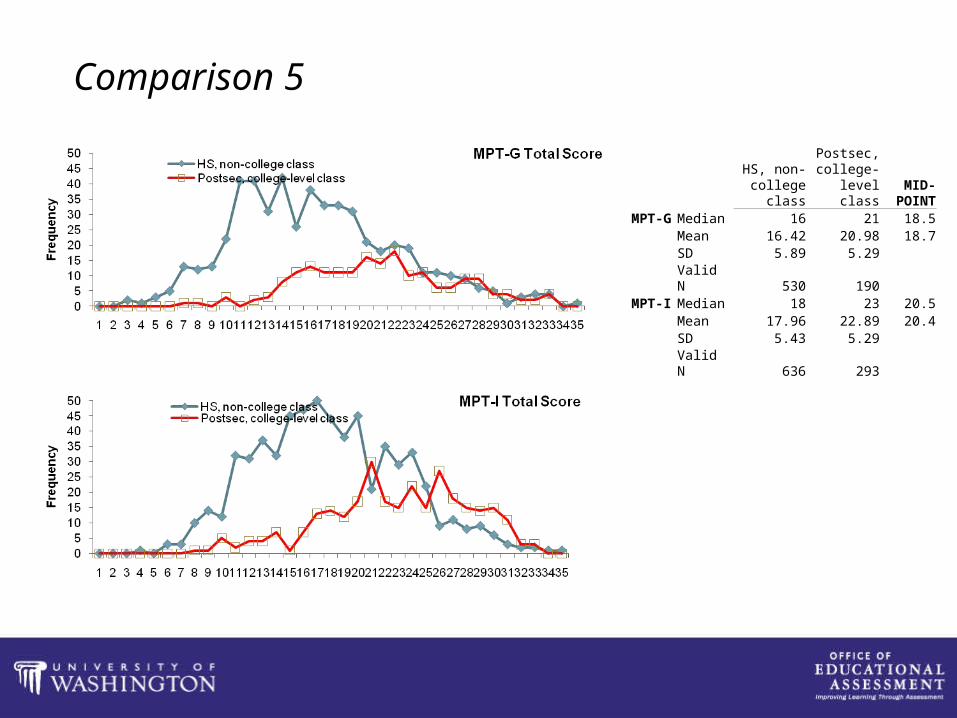
Comparison 5
HS, non-college class
Postsec, college-level
classMID-
POINTMPT-G Median 16 21 18.5
Mean 16.42 20.98 18.7SD 5.89 5.29Valid N 530 190
MPT-I Median 18 23 20.5Mean 17.96 22.89 20.4SD 5.43 5.29Valid N 636 293

Comparison 6
HS, non-college class,
<2.0
Postsec, college-level
class, 2.0+MID-
POINTMPT-G Median 13 21 17.0
Mean 13.93 21.66 17.8SD 4.94 5.32Valid N 135 131
MPT-I Median 16 25 20.5Mean 16.38 23.88 20.1SD 5.27 5.31Valid N 149 199