set yourself free –use ods report writing technology in
TRANSCRIPT
Paper 013-2015
Set Yourself Free
–Use ODS Report Writing Technology in SAS Enterprise Guide Instead of Dynamic Data Exchange in PC SAS
Part II SAS Code Revealed
Robert Richard Springborn, Healthcare Outcomes Center, Office of Statewide Health Planning & Development,
Sacramento, California
ABSTRACT
The ability to prepare custom designed reports and convey your message in a clear and concise manner is very important in today’s sophisticated business environment. Easy to read clearly designed reports can enhance your organization’s credibility and reputation. Traditional use of Dynamic Data Exchange (DDE) in PC SAS® to produce custom designed reports is the result of widespread and popular use of Microsoft Excel. However with most business organizations transitioning to SAS® Enterprise Business Intelligence (EBI), where DDE does not function, ODS Report Writing technology is a powerful alternative to create custom designed reports in SAS® Enterprise Guide. The driving force for this topic was the need to create hospital level data discrepancy reports which compare California CABG Outcome Reporting Program (CCORP) clinical data, to OSHPD’s hospital administrative data, to verify risk factors used in a risk-adjusted operative mortality model. This model provides hospital and surgeon performance scores for coronary artery bypass graft surgery (CABG) in California. Although this title is similar to a previous paper by this author, this paper contains SAS® program code not previously presented.
INTRODUCTION
TELL ME ABOUT THE PROBLEM
The usual scenario is that a manager wants new data to be featured in an Microsoft Excel report that was created using Dynamic Data Exchange (DDE). But why use DDE to create an Microsoft Excel report? The answer is comfort. Most people have a greater comfort level when they receive a report in Microsoft Excel because this format has been available for a very long time and most of us have used Microsoft Excel to view data, plot trends, and perform data analyses. So once we see a report in Microsoft Excel we feel like a kid again with “instant playtime.” This comfort factor also carries into the SAS world where many years ago, when SAS graphics software was still in its infancy, most SAS users would export their data directly into Microsoft Excel for easy viewing, graphing trends, and simple data analysis. Then the user would return the data to SAS to use more sophisticated statistical tools to complete the analysis. Today this is no longer the case because SAS has many excellent tools to display and analyze your data.
The second reason this topic is important is that many organizations are transitioning from PC SAS to SAS Enterprise Business Intelligence (SAS EBI) (which contains SAS Enterprise Guide) where DDE will not function. OSHPD is the leader in collecting data and disseminating information about California's healthcare infrastructure, promoting an equitably distributed healthcare workforce, and publishing valuable information about healthcare outcomes. Data which is reported to OSHPD is submitted in different formats and, once received, siloed in various repositories including SQL servers, a SAS Integration Technologies server, local databases, and an Oracle enterprise data warehouse. Microsoft Office Suite, SAP Business Objects (BO), and SAS are used as query/reporting tools to access the data. For some time, OSHPD has needed a more streamlined and powerful system for data storage and utilization. The new approach had to support more complex queries, integrate data sources, eliminate duplication, provide up-to-date reporting via web tools, consolidate and maximize resources, leverage current investments, and integrate IT solutions with considerable flexibility. To this end, OSHPD decided to upgrade the existing data environment with SAS EBI. SAS EBI is a comprehensive, easy-to-use business intelligence software solution that integrates the power of SAS Analytics and SAS Data Integration to provide insights that power better decisions.
The focus of this paper was to build a custom designed report using a SAS programming language compatible with SAS EBI. The solution was to use ODS Report Writing technology which provides a programming language more powerful than DDE to easily position custom tables, headers, footers and note descriptions on the printed page. Before I show how this technology was used to create my custom designed report let’s take a brief tour of Dynamic Data Exchange and compare its features to ODS Report Writing technology.
1
Set Yourself Free –Use ODS Report Writing Technology in SAS Enterprise Guide, continued
DYNAMIC DATA EXCHANGE
Let’s learn the basics of Dynamic Data Exchange and compare its features to ODS Report Writing Technology.
Dynamic Data Exchange (DDE) is a powerful tool that PC SAS programmers can use to send data stored in SAS data sets directly into formatted Microsoft Excel tables. Several primary papers on Dynamic Data Exchange (DDE) include Beal (2004); Kilburn (2009); Smith (2010); Vyverman (2001); and Vyverman (2002). Additional papers can be found by searching http://www.sas.com or http://www.lexjansen.com.
Beal (2004) gives a great summary of DDE features as “Dynamic data exchange (DDE) is a powerful tool within SAS® that programmers can use to send data stored in SAS data sets directly into formatted Microsoft Excel tables. This process both reduces human error because the data are not hand entered into Excel where numerical precision can be lost and saves time since the user need not format the table manually. DDE features SAS code and macros for advanced SAS users that can be used to open Excel from SAS; center table titles across specified cells; bold, superscript, underline or italicize specific characters within individual cells; present numerical data in multiple formats such as scientific notation, commas or rounded to a specific precision; insert ‘page x of y’ and date into the footer of the table; put borders around any column or row; dynamically assign rows and columns to insert data headings into the body of the table; load both numeric and character data into the same Excel column; specify font size and type; specify page setup options such as portrait, landscape and margins; autofit specific columns; and create multiple worksheets within a single Excel file in a specified order with sheet names specified by the user” (Beale 2004, p. 1).
Beale (2004) also gives a great description of DDE platform. He states “DDE is a communication protocol available on Windows and OS/2 that enables some applications on these platforms (e.g., Microsoft Access, Excel, Word, FoxPro and others) to communicate with each other in a client/server fashion. The client application initiates a conversation with the server application and asks the server to perform a specific task. SAS (version 6.08 and later) can act as a DDE-client but not as a server. Most things that can be done manually in Excel can be automated from within a base SAS program using DDE. DDE enables a SAS session to take control of the Excel application and tell it precisely what to do. More information about the general idea of using DDE between SAS and DDE-compliant applications is found in the SAS Institute’s Technical Support document TS325 (SAS Institute, 1999)” (Beale 2004, p. 1). Also don’t forget you can use DDE with the DATA step, the SAS macro facility, SAS/AF applications, or any other portion of SAS that requests and generates data.
Smith (2010) shows us how to find the macros for DDE. “A search of the Microsoft web page for ‘macrofun’ will reward you with the MS-Windows ‘HLP’ file ‘macrofun.hlp’ that will provide all of the wonderful Excel macro commands that you can use within the DDE statements. Although these macros are older technology, for use with DDE they get the job done” (Smith 2010, p.1). There are several limitations to Dynamic Data Exchange. First DDE requires a template which defines the desired presentation or “style” for the report. This template contains a series of instructions to apply format properties, such as font size, font type, color, line width, etc., to each item in the report such as a data value, text label, table, header, or footer. The DDE program code reads the SAS data set, applies the template instructions, and places the result at a specific worksheet cell or other defined region. However it can be very time consuming to write DDE code. The effort to calculate the specific position or worksheet cell of each item in the report is very time consuming and laborious. The reward for your labor is that you get the desired look or “style” you wanted for the report. However these instructions are not easily edited when changes are needed. The position of each item on the page is relative which means each item position is related to the position of all other items on the page. Deleting a row or column, or moving one of the report items will alter the position of remaining items on that page. Also constructing a table consisting of a specific number of rows and columns limits the size of surrounding tables to the same dimension. As we shall see ODS Report Writing technology is a much better alternative which does not require a template and gives you the ability to position custom designed tables, headers and footers of various sizes on the same page with ease.
Second, when you use DDE to create a report containing multiple worksheets, it is necessary to activate the next worksheet tab to view and print the next page of the report. Therefore printing all pages of the report requires manually changing the size of the printed region on each “worksheet” containing the next page of the report. ODS Report Writing technology creates a single “pdf” file from which all pages of the report can be printed without altering print region size.
Third, each page of a DDE report can only be viewed by activating each worksheet tab that contains the next page of the report. ODS Report Writing technology creates bookmarks which the user can use to quickly access each page of the report.
Finally it may not be desirable to distribute a DDE based report for management and staff review because the contents of a Microsoft Excel file can easily be changed. Reports may contain confidential or sensitive information
2
Set Yourself Free –Use ODS Report Writing Technology in SAS Enterprise Guide, continued which should not be changed. Again as we shall see, ODS Report Writing technology will create a ‘write protected’ PDF file. In this way the manager and staff will view the report without any danger of changing report contents.
The next section gives more details about ODS Report Writing technology.
ODS REPORT WRITING TECHNOLOGY
ODS Report Writing technology is a programming language more powerful and easier to use than Dynamic Data Exchange. Recommended primary papers include O’Connor (2003); O’Connor (2008); O’Connor (2009a); O’Connor (2009b); Dorinski (2008); Herbison (2010); and Li (2010). O’Connor (2009b) contains many examples which were the basis of a step-by-step process to build the custom designed report featured in this paper. This step-by-step process is presented in a later section below. Additional papers may be found at http://www.sas.com or http://www.lexjansen.com by searching on this topic.
A great introduction to the topic is from O’Connor (2009b) “The ability to prepare complex reports and convey your message in a clear and concise manner is an absolute imperative in today’s sophisticated business environment. Clearly designed reports can enhance your organization’s credibility and reputation. DATA _NULL_ report writing has long been an integral part of the custom report writing offered by SAS®, but with this newly updated ODS Report Writing technology in SAS®
9.2, you will have the ability to produce reports that you have only dreamed about. These new features will allow you to build custom data-centric reports in an easy-to-use object-oriented manner that is fully integrated with the ODS System. This technology is perfectly suited for creating custom invoices, inserting narrative descriptions in a table or document, creating form letters and non-rectangular reports, inserting custom subtotals, and it will address a variety of custom reporting needs” (O’Connor 2009b, p.1) O’Connor (2009b) also gives us a tour of the features “The DATA step is an essential concept in SAS. The DATA step serves many purposes like creating SAS® data sets, custom report writing, file management, and information retrieval. The ODS Report Writing Interface will exclusively focus on the custom report writing capabilities. The custom report writing capabilities are also more commonly referred to as DATA _NULL_ report writing which has long been an integral part of the SAS® reporting solution. The ODS Report Writing Interface is intended to fully embrace ODS features such as proportional fonts, traffic lighting, using colors, images, Unicode characters, while at the same time providing pixel perfect placement capabilities. This interface is not only fully integrated with all the capabilities of the ODS System, but also takes advantage of the rich programming features that the DATA step offers such as conditional logic, formatting capabilities, by-group processing, arrays, and a wealth of other features. The ODS Report Writing Interface is an object-oriented language that provides you with flexibility and control so that even the most rigid reporting requirements can be met with ease” (O’Connor 2009b, p.1). Before presenting the details of how I used ODS Report Writing technology to build my custom designed report we need to take a tour of the data problem that gave rise to the report.
METHODS
DATA SOURCE FOR THE REPORT
The California Coronary Artery Bypass Graft (CABG) Outcome Reporting Program (CCORP) is the largest public reporting program on CABG surgery outcomes in the United States. Each year OSHPD releases the California Report on Coronary Artery Bypass Graft Surgery which presents findings from analyses of data collected from California-licensed hospitals where surgeons performed adult isolated CABG surgery. This report features risk-adjusted operative mortality used to evaluate hospital and surgeon performance. The California Report on Coronary Artery Bypass Graft Surgery, 2009 Hospital Data California CABG Outcomes Reporting Program can be found at (http://www.oshpd.ca.gov/HID/Products/Clinical_data/CABG/2009/CABG2009.pdf).
CCORP reviews data submitted by each hospital for completeness and errors. The data discrepancy report compares the CCORP clinical data to OSHPD’s hospital administrative data source, the Patient Discharge Data (PDD). Hospitals are asked to review and account for discrepancies between the two data sources via patient medical chart review to verify that coding for the following ten data variables (risk factors) are consistent. Data variables include: 1) all CABG surgeries; 2) Status of Isolated and Non-Isolated CABG surgery; 3) Resuscitation Prior to CABG Procedure; 4) CABG surgery deaths; 5) Post-Operative Stroke; 6) Dialysis Requirement; 7) Prolonged Ventilation; 8) Reoperation for Bleed; 9) Deep Sternal Wound Infection; and 10) Graft Occlusion.
It is important to verify that both data sources reported the same risk factor value because these risk factors will determine hospital and surgeon performance published in the public report. To make fair comparisons of care delivered by different healthcare providers, it is necessary to adjust for differences in severity of illness (case mix) of patients across providers. CCORP “levels the playing field” by considering the pre-operative condition of each patient. Providers that handle more complex cases receive a larger risk-adjustment weight in the risk model, and providers that handle less complex cases receive a smaller weight. Thus, hospitals and surgeons treating sicker patients are not at a disadvantage when their performance is compared with other surgeons and hospitals.
3
Set Yourself Free –Use ODS Report Writing Technology in SAS Enterprise Guide, continued This paper will show how to create a hospital specific data discrepancy report for each of 122 California-licensed hospitals.
ORGANIZE YOUR SAS CODE
Before we start building SAS code we need to be organized. A project of this complexity requires designing a series of successive steps or functional groups. Each functional group is a collection of SAS program statements that create a product or series of similar products. A product is usually a SAS data set but also can be compiled SAS macros, or parts of a report such as text notes, tables or other information. These steps are linear and sequential, so changes to any functional group which creates a new product will have consequences for subsequent functional groups that use that product. Given this complexity we must carefully design each functional group so that the final product or data discrepancy report meets the needs of our organization. This is where peer-review is important but more importantly “orderly” and “low stress” peer-review. Management and staff will want to provide input and direction so we must include in report development “bus stops” or places where we can stop, review what we have done, evaluate enhancements, make any changes, and then proceed onward. See Springborn (2012) for a description of functional groups and peer review.
Now let’s look at an example of a hospital level report that was created using this approach.
RESULTS
EXAMPLE DATA DISCREPANCY REPORT
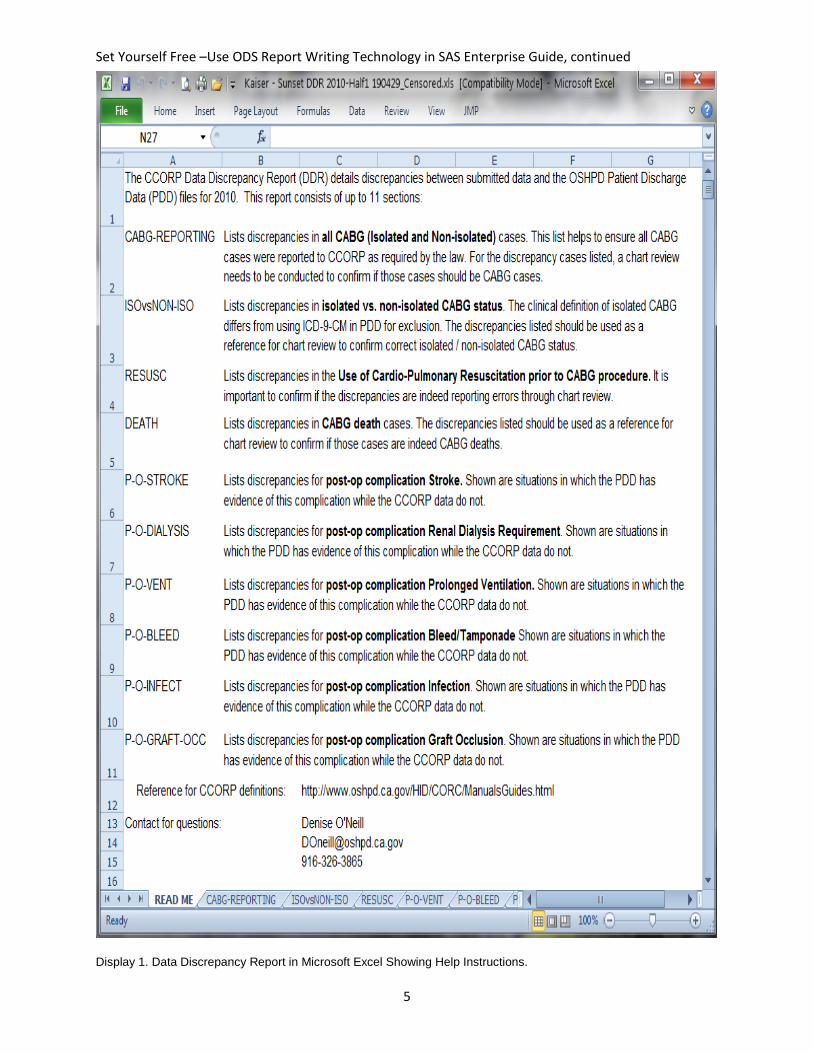
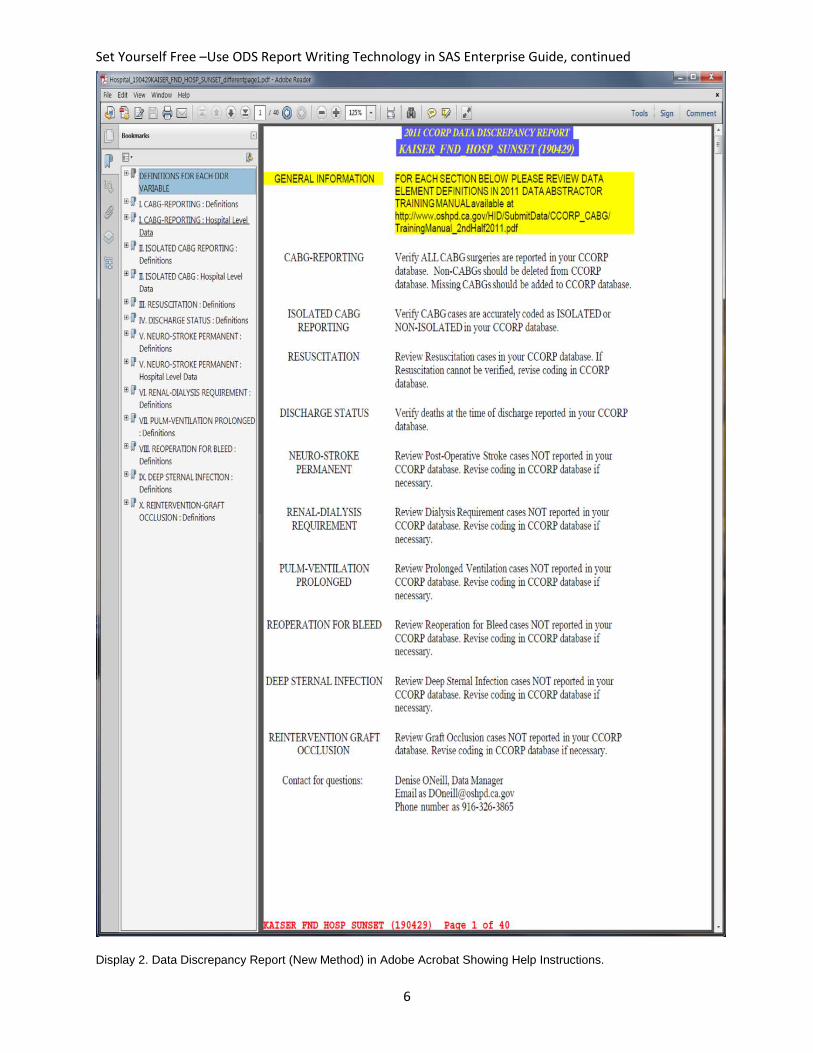
Let’s take a look at a Data Discrepancy Report for Kaiser Foundation Hospital Sunset and compare the old method of Dynamic Data Exchange and the new method of ODS Report Writing Technology. Remember the first page of the report using both methods contains a list of data variable discrepancy help instructions. Next, the old method of DDE created a single worksheet for each of ten data variable discrepancies (sections). Each worksheet contains both a summary of patient cases displayed and the patient records themselves. Whereas the new method using ODS Report Writing Technology creates for each data variable discrepancy (section) one page for a summary of the patient cases displayed and subsequent pages for each patient record.
The first page of the report using DDE is given in Display 1. The first page of the report using ODS Report Writing Technology is given in Display 2. Note the use of Microsoft Excel worksheet tabs in the former and Adobe bookmarks in the latter to note each data variable discrepancy.
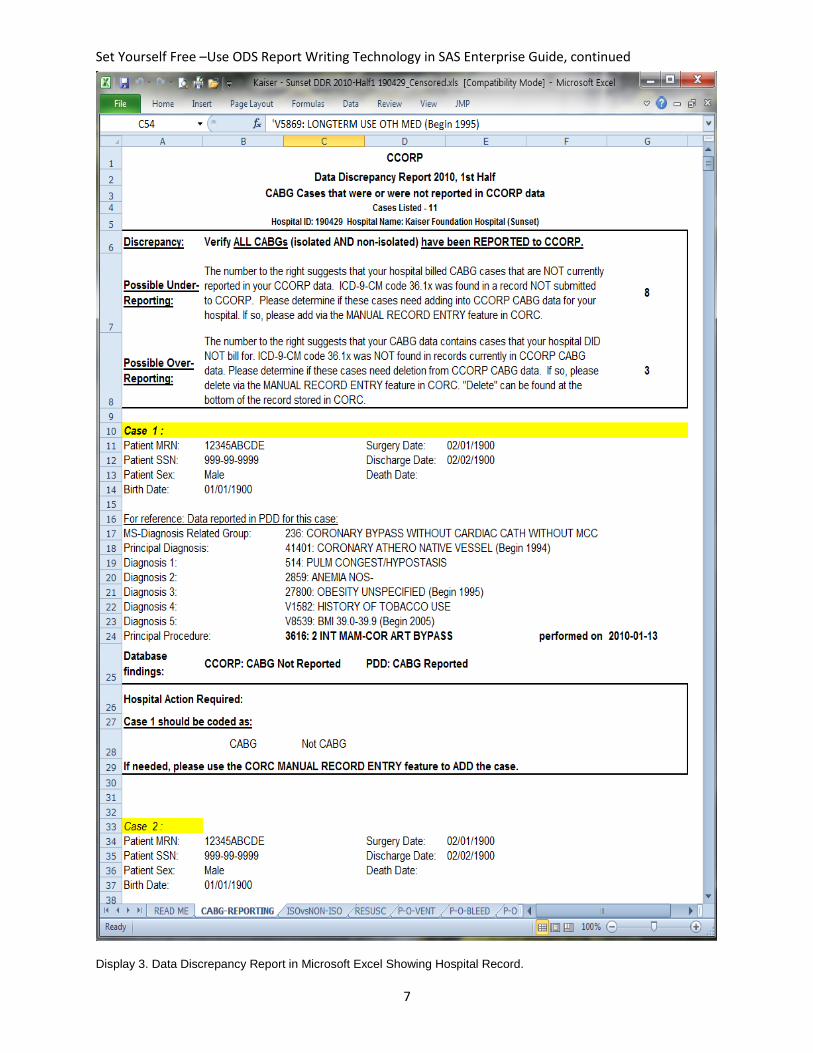
Each of the next ten sections contain both summary information and patient records needing review. The summary information contains the data variable discrepancy definition; under-reporting definition, and cases; and over-reporting definition and cases. Under-reporting means the risk factor was found in OSHPD’s administrative data source (PDD) but not in CCORP clinical data. The reverse is true for over-reporting.
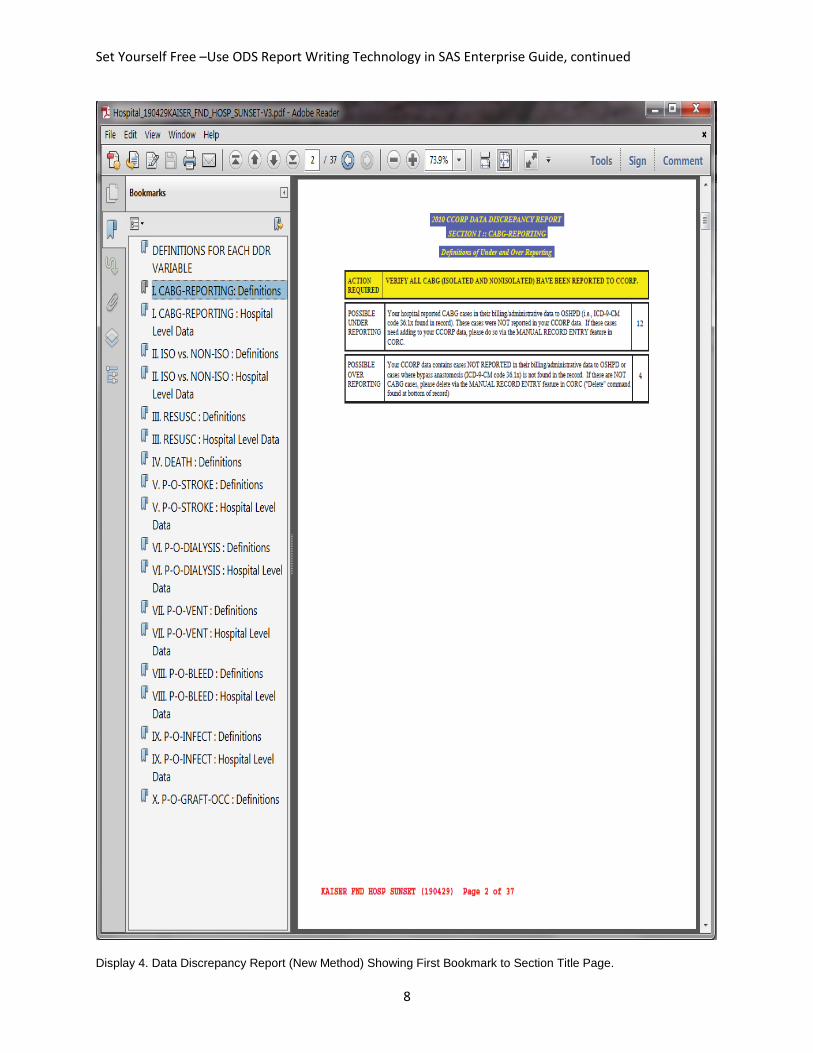
Using DDE, summary information and the first patient record is given in Display 3. Using ODS Report Writing Technology the summary information is given in Display 4 and the first patient record is given in Display 5.
The presentation of patient identification information, diagnoses, and procedures using DDE is confusing and difficult to follow. The presentation using DDE is confusing because you must spend time looking for directions on why you as a hospital received this report; and spend more time looking for the patient hospitalization record that you are supposed to verify. The presentation using the new method with traffic lighting is simpler because all of the necessary information is easier to locate.
4
Set Yourself Free –Use ODS Report Writing Technology in SAS Enterprise Guide, continued
Display 1. Data Discrepancy Report in Microsoft Excel Showing Help Instructions.
5
Set Yourself Free –Use ODS Report Writing Technology in SAS Enterprise Guide, continued
Display 2. Data Discrepancy Report (New Method) in Adobe Acrobat Showing Help Instructions.
6
Set Yourself Free –Use ODS Report Writing Technology in SAS Enterprise Guide, continued
Display 3. Data Discrepancy Report in Microsoft Excel Showing Hospital Record.
7
Set Yourself Free –Use ODS Report Writing Technology in SAS Enterprise Guide, continued
Display 4. Data Discrepancy Report (New Method) Showing First Bookmark to Section Title Page.
8
Set Yourself Free –Use ODS Report Writing Technology in SAS Enterprise Guide, continued
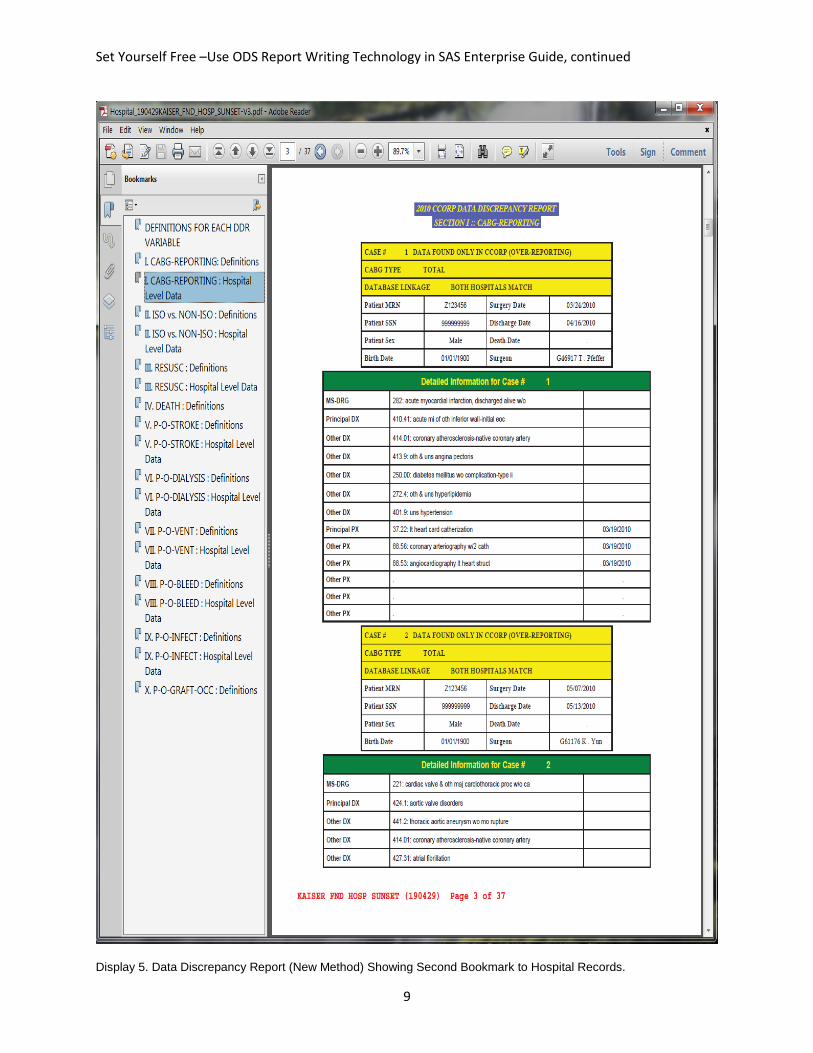
Display 5. Data Discrepancy Report (New Method) Showing Second Bookmark to Hospital Records.
9
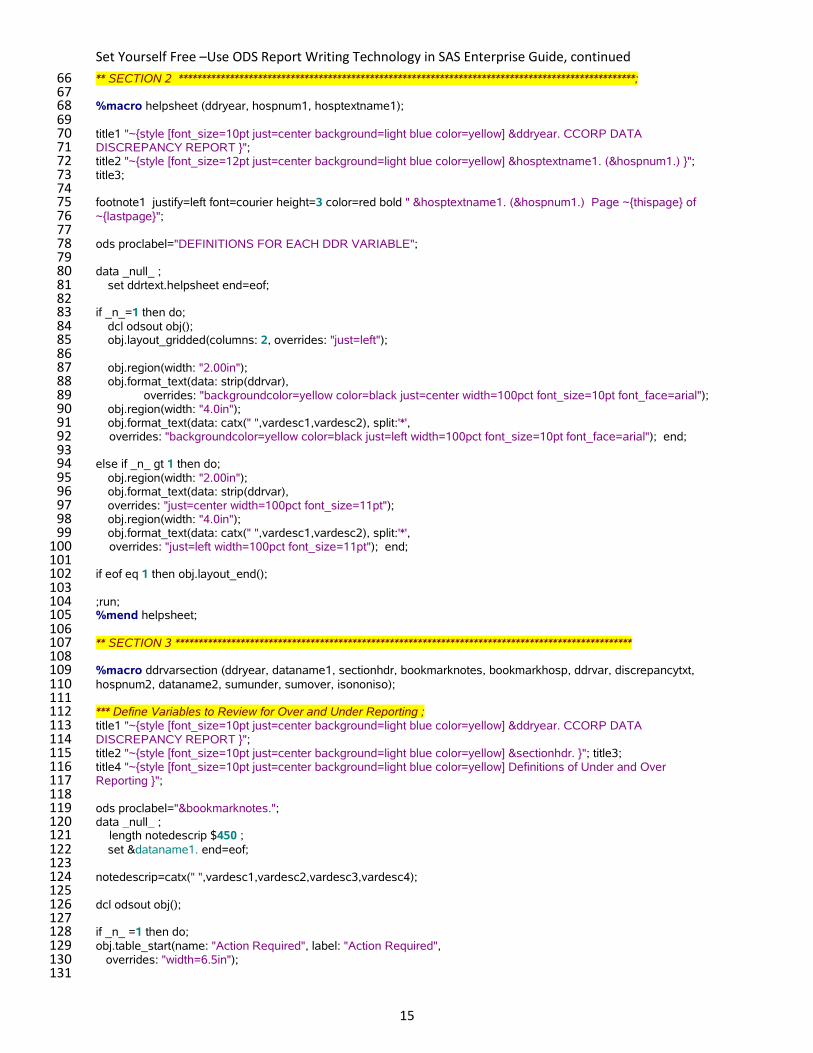
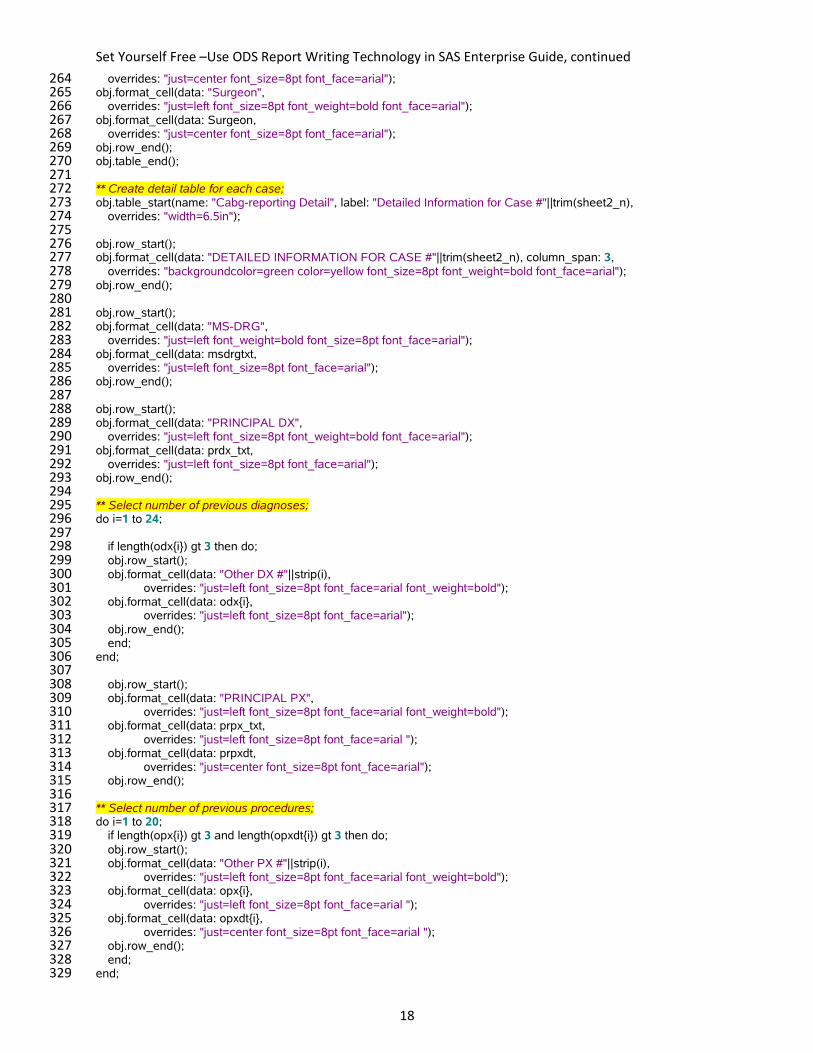
Set Yourself Free –Use ODS Report Writing Technology in SAS Enterprise Guide, continued PROGRAM CODE FOR DISCREPANCY REPORT
The full SAS program for this custom report contains 2,300 lines of SAS program code with more than 200 different “segments” with each segment generating a different result or calculation. These “results” are then woven together into four functional groups using a defined recipe which creates the custom report. As an example, an orchestra is only as good as each individual instrument. With programs of this complexity it is a great idea to develop additional SAS program code to verify the accuracy of each “result.” Even though the SAS output gives you results and the SAS Log is free from errors and warning messages, this does not mean your calculations are correct!
Since the fourth functional group contains the ODS object oriented programming code using the DATA _NULL_ step, which is the flagship of this paper, we will examine the fourth functional group in detail.
Overview of Program Code
The custom report contains two major components: Hospital help instructions for ten data discrepancy variables; and a summary page and a list of hospital records for each of the ten sections. One SAS macro creates the first page of help instructions. Another SAS macro is executed ten times for each data discrepancy variable section. Additional SAS macros create a unique list of hospital names and license numbers. Finally all the macros work together to generate a data discrepancy report for each hospital. The discussion below describes the details of the SAS program code starting on page 13 of this paper.
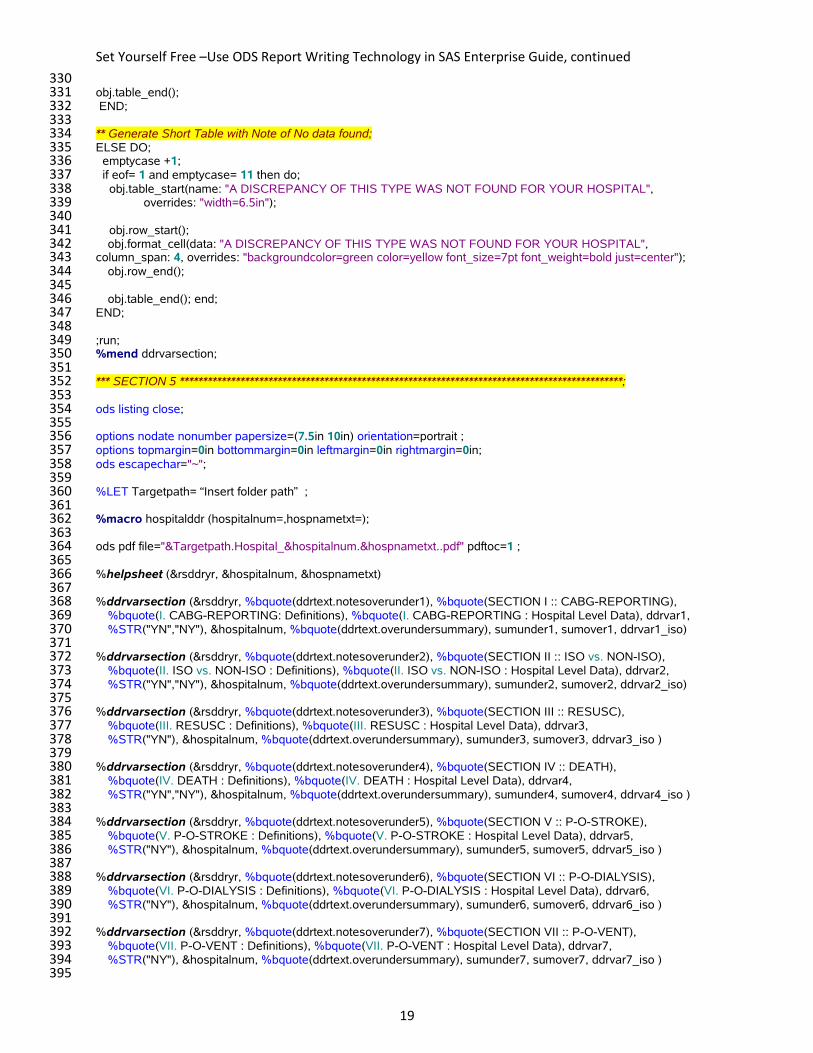
Section 1. Define File Management and Create Print Log
Lines 1 to 65 completes various file management tasks including: creation of a file that will contain an edited version of the SAS job log; path locations of SAS libraries; removal of special characters from hospital names; a switch to run only three hospital reports during report development and testing; and creation of two macros which build a list of hospital names and license numbers featured in the report.
I have discovered that the compiler for this ODS Report Writing Technology is still “pre-production” so the unedited SAS Job Log will contain several thousand copies of the text "WARNING: DATA step interface is preproduction in this release." Lines 11-16 open a file named “ddr_log” that will contain the un-edited version of SAS Job Log. At the very end of my program another segment of SAS program code removes all occurrences of this text and generates the revised SAS Job Log.
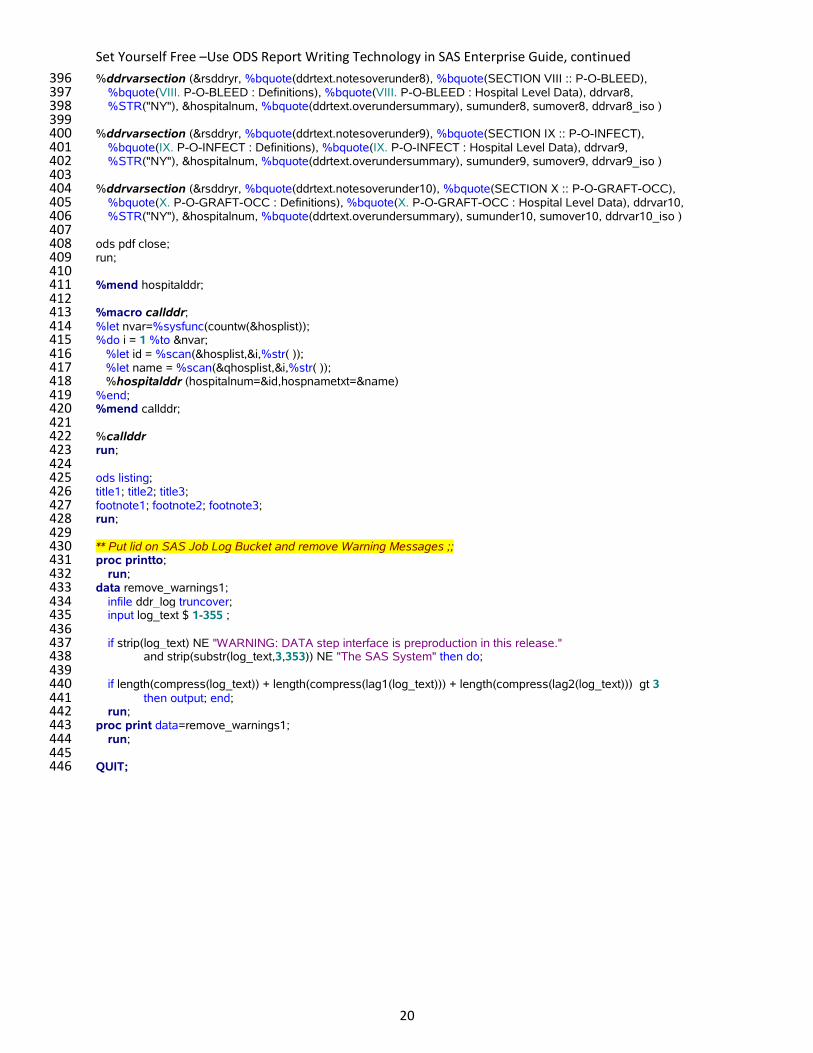
Section 2. Compile Macro %Helpsheet to Create Data Discrepancy Variable Help Instructions
Let’s look at how the macro %helpsheet creates data discrepancy variable help instructions given on the first page of the report (See Display 2 above). Lines 70-73 generates two titles contained in the report header, namely a title for the report name “2010 CCORP Data Discrepancy Report”, and a second title for hospital name and license number. Lines 75-76 generate a report footer which contains hospital name and license number, and the text “Page x of y”. Line 78 generates a PDF bookmark with the label “DEFINTIONS FOR EACH DDR VARIABLE” which allows the user to go directly to this page of the report. Note the bookmark labels in Display 2. Lines 80-81 is the first example of using a DATA _NULL_ step with object oriented code to create tables on the printed page of the report. SAS data set ddrtext.helpsheet contains the text which will become the help instructions on this page. Lines 83-92 prints the first line of text namely “General Information” with background color of yellow. Lines 94-100 prints the remaining lines of text without highlighting. Lines 85, 87, and 90 define two columns on the printed page (left column 2 inches, and right column 4 inches). Lines 89 and 92 provides additional text format properties such as background color, foreground color, justification, width, font size, and font name. Note Adobe Acrobat recognizes that the first line of text contains an hyper link to a document of instructions and the last line of text contains an email address!
Section 3. Create Macro %ddrvarsection to Create Summary Page
This section will examine how SAS Macro %ddrvarsection (Lines 109-350) creates the summary page (Display 4) and the next section will examine how this macro also creates the list of hospital records (Display 5). Remember that this macro will be executed ten times, once for each of ten data variable discrepancies in the report.
We begin with three titles included in the report header (lines 113-117). Ten calls to SAS macro %ddrvarsection will build ten different values for the PDF label contained in macro parameter &bookmarknotes (line 119).
10
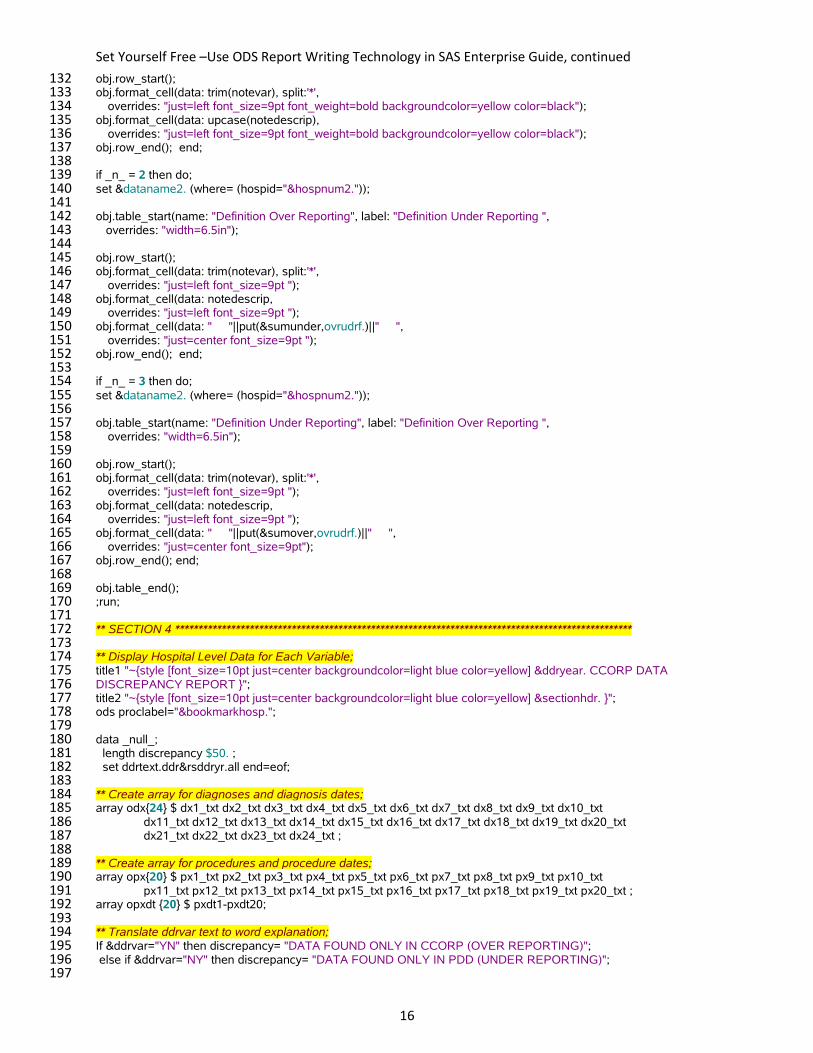
Set Yourself Free –Use ODS Report Writing Technology in SAS Enterprise Guide, continued In lines 120-170 a DATA _NULL_ creates the summary page, using a DO LOOP which controls how data is read from two different SAS data sets (&dataname1.; &dataname2.) and four variables (notevar, notedescrip, &sumunder. and &sumover.).
Each of these three rows contain information printed from different SAS data sets and different SAS variables hence the need to control data flow. The variables “notevar,” and “notedescrip,” contain the text printed in the first two columns of each row. The macro variables “&sumunder.” and “&sumover.” contains the number of cases printed in the third column of the second and third row respectively. The DO LOOP is needed to control the flow of data because of the different variables used to print the count of under-reported (“&sumunder.”) and over-reported cases (“&sumover.”).
Again note the use of statements obj.table_start(), obj.row_start(), obj.format_cell(), overrides, obj.row_end(), and obj.table_end() to define each column of each row of the summary table.
Section 4. Finish Creating Macro %ddrvarsection to Include List of Hospital Records
Let’s return to the patient level data in Display 5. First we update the titles that will appear in the report header for this section (Lines 175-178) including a new PDF bookmark label read from macro parameter &bookmarkhosp. When we are done with the custom report we will have 21 bookmarks in our pdf file, one for the data discrepancy variable help instructions on page 1, followed by the summary page section, and the list of hospital records section for each of ten data variable discrepancies (Display 5). Note in Display 5 that the section II: ISO vs. NON-ISO has two bookmarks for the summary page labeled “Definitions” and for the hospital level data labeled “Hospital Level Data.” If no data variable discrepancies were found for this section then there is only the first bookmark.
Remember the data discrepancy report compares CCORP clinical data with the Patient Discharge Data (PDD) administrative data. The former records presence or absence of hospital procedures as a distinct data element such as “isolated cabg surgery” recorded as “Yes” or “No.” The PDD uses ICD9-CM codes to record hospital diagnoses and procedures. Therefore a complex recipe of ICD9-CM codes is used to determine if a patient had “isolated cabg surgery.” To help hospitals with their data discrepancy report all ICD9-CM codes for diagnoses, and procedures have been translated into the corresponding word definition.
Hospitals need information to track down the patient medical record in question. This information is displayed in three parts (Lines 194-225). First “Data Found Only in PDD (Under-Reporting),” or “Data Found Only in CCORP (Over-Reporting).” Second “Isolated CABG Surgery,” “Non-Isolated CABG Surgery,” or “Total.” Third “Both Hospitals Match” if there was a complete patient record (both CCORP data and PDD data was present for same hospitalization), “Only CCORP Hospital” (CCORP orphan), or “Only PDD Hospital” (PDD orphan).
Let’s see how this information is displayed in the report in Display 5. Since the patient medical record is displayed in “Section I : CABG-Reporting” the hospital recognizes a discrepancy has been found related to the identification of this patient as having CABG surgery or not having CABG surgery. The information in row one “DATA FOUND ONLY IN CCORP (OVER-REPORTING)” points out that the hospital has reported this patient as having CABG surgery to the CCORP database but reported this patient as not having CABG surgery to the PDD database. The information in row two “TOTAL” points out that for this data discrepancy we are not concerned with Isolated CABG or Non-Isolated CABG only total CABG surgeries. The information in row three “BOTH HOSPITALS MATCH” points out that the patient medical record in the CCORP database was successfully linked to the corresponding patient medical record in the PDD database.
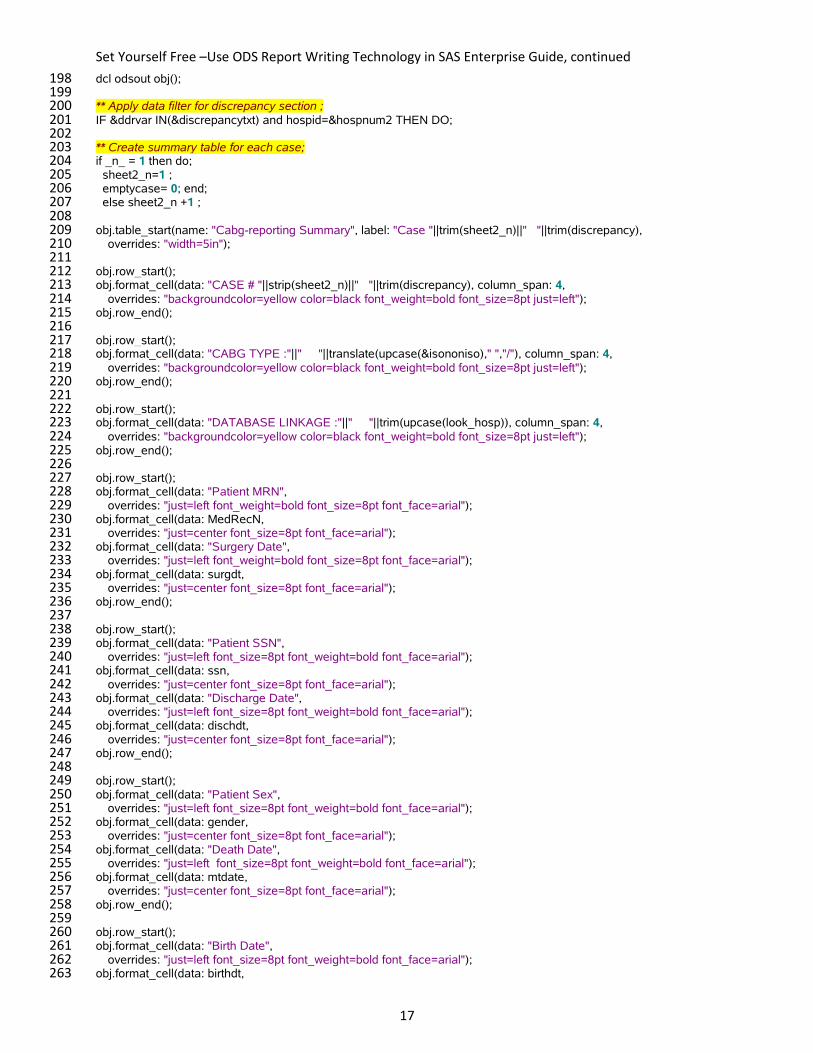
Now let’s take a look closer at the SAS program code (Lines 209-225) which begins with a statement that defines the beginning of a new table “obj.table_start()” followed by three sections of code that will create the first three rows of that table. Note that each row begins with the statement “obj.row_start()” and ends with the statement “obj.row_end().” Lines 213, 218, and 223 defines that each row will contain a text string that will “span” or merge across all four columns. Lines 227-270 provides the remaining rows of that table. Note the statement obj.table_end() at line 270 that completes the table definition. Note the data filter at lines 200-201 which ensures that the patient medical records in each section will correspond to the correct data discrepancy and the correct hospital.
Next, a new table is printed for diagnoses, procedures, and procedure dates contained in that patient medical record (Lines 272-332). Again the table definition begins with the statement “obj.table_start()” in lines 273-274, with the text for the first row green highlighted and spanning across all three columns (Lines 276-279). Note 25 diagnoses (one principal and 24 others) are printed by lines 288-306. Similarly a 21 procedures (one principal procedure and 20
11
Set Yourself Free –Use ODS Report Writing Technology in SAS Enterprise Guide, continued others) are printed by lines 308-332. Note the date of the procedure is also printed. The table definition concludes with the statement “obj.table_end() at line 331.
Section 5. Create the Data Discrepancy Report for Each Hospital
First we define a macro named %hospitalddr that will contain one call to macro %helpsheet, and ten calls to macro %ddrvarsection for each of the ten data discrepancy variables. Remember each call to macro %ddrvarsection will create both a summary page section and a list of patient medical records section. Second we identify a list of hospitals that will receive the data discrepancy report. Third we execute the macro %hospitalddr for each of these hospitals. Now let’s look closer at the SAS program code.
First we have various “book-keeping tasks” including closing the ODS listing destination, opening the ODS pdf file destination, defining various SAS OPTIONS , and selecting a location for the 121 hospital level data discrepancy reports (lines 354-364).
Next we compile macro %hospitalddr (lines 362-411). Note we have a global macro variable named &hospitalnum that is shared between macro %hospitalddr (line 362), macro %helpsheet (line 366), and the first occurrence of macro %ddrvarsection (368-370). Also the text that is passed as keyword parameters to each of ten calls to macro %ddrvarsection clearly notes the creation of ten data discrepancy variable sections.
Next we create another macro %callddr which will build our list of hospitals and execute the macro %hospitalddr for each hospital on that list (lines 413-423). Remember the list of hospital numbers and hospital names were created as macros &hosplist, and &qhosplist in lines 44-64 of this SAS program. The macro function %scan reads each list and selects both the hospital number and name which is then passed to the macro %hospitalddr . When all the reports have been created we return the ODS destination to listing, and clear titles and footnotes used in this report (lines 425-428).
Finally we saved the best for last. Now we can close the original SAS Job Log (filename ddr_log), remove all occurrences of the text string “WARNING: DATA step interface is preproduction in this release,” and create a revised SAS Job Log for our viewing pleasure (lines 430-444).
If you would like a copy of the SAS program code described above please contact me. In addition I suggest you first begin with the examples described by Daniel O’Connor (O’Connor 2009b). These examples will give you a “primer” and make it easier to understand the structure of the SAS programming code described in this paper.
CONCLUSION
In today’s sophisticated business environment where the ability to prepare custom designed reports and convey your message in a clear and concise manner is an absolute imperative; and many organizations are transitioning to SAS Enterprise Guide for their data collection, analytics, and data reporting needs; ODS Report Writing technology using SAS Enterprise Guide is an powerful alternative to Dynamic Data Exchange (DDE) using PC SAS.
TRADEMARK CITATION
SAS and all other SAS Institute Inc. product or service names are registered trademarks or trademarks of SAS Institute Inc. in the USA and other countries. ® indicates USA registration. Other brand and product names are trademarks of their respective companies.
ACKNOWLEDGEMENTS
The author would like to thank Daniel O’Connor at SAS Institute for sharing the paper O’Connor (2009b) and responding to my questions during report testing and development. In addition I could not have completed this project without my mentor Art Carpenter who was kind enough to share a “glimmer” of his great knowledge of SAS macros in his two workshops “Introduction to SAS Macros,” and “Advanced SAS Macros.” Completion of this project would not have been possible without the use of nested SAS macros to “bundle” the ODS Report Writing technology. Also for Art Carpenter sharing a clever “snip-it” of SAS code which creates a list of hospital license numbers and names and executes this report for each hospital.
12
Set Yourself Free –Use ODS Report Writing Technology in SAS Enterprise Guide, continued
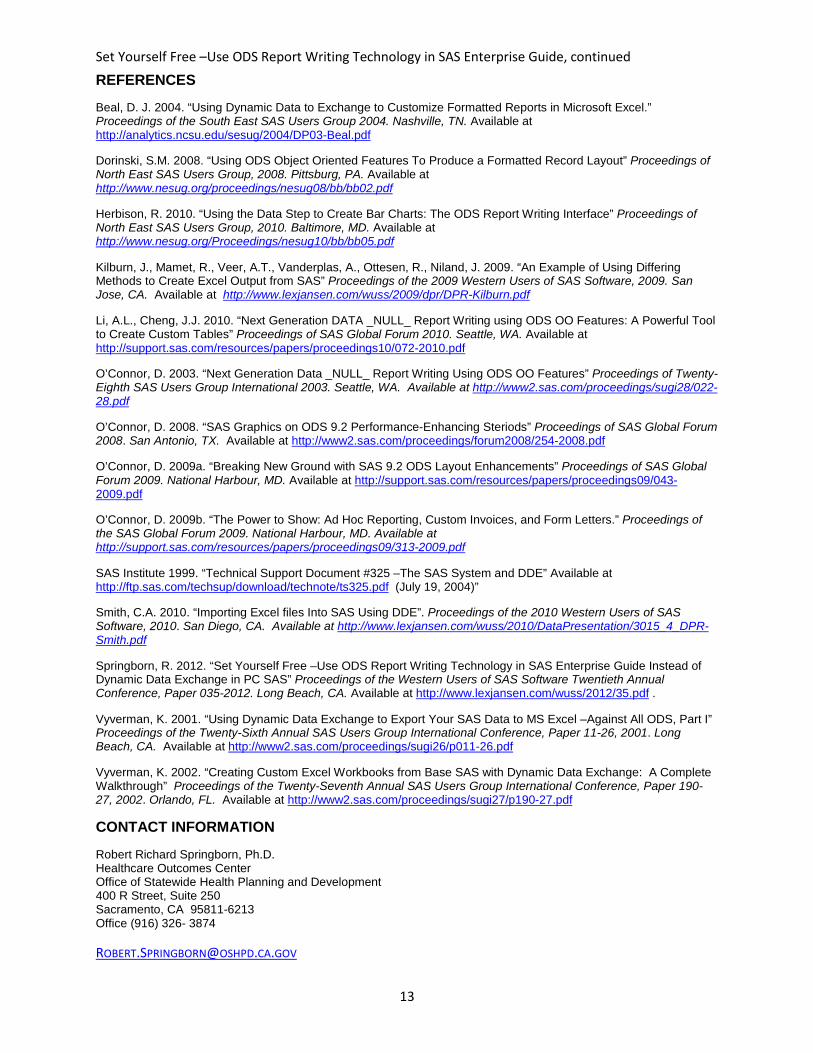
REFERENCES
Beal, D. J. 2004. “Using Dynamic Data to Exchange to Customize Formatted Reports in Microsoft Excel.” Proceedings of the South East SAS Users Group 2004. Nashville, TN. Available at http://analytics.ncsu.edu/sesug/2004/DP03-Beal.pdf
Dorinski, S.M. 2008. “Using ODS Object Oriented Features To Produce a Formatted Record Layout” Proceedings of North East SAS Users Group, 2008. Pittsburg, PA. Available at http://www.nesug.org/proceedings/nesug08/bb/bb02.pdf
Herbison, R. 2010. “Using the Data Step to Create Bar Charts: The ODS Report Writing Interface” Proceedings of North East SAS Users Group, 2010. Baltimore, MD. Available at http://www.nesug.org/Proceedings/nesug10/bb/bb05.pdf
Kilburn, J., Mamet, R., Veer, A.T., Vanderplas, A., Ottesen, R., Niland, J. 2009. “An Example of Using Differing Methods to Create Excel Output from SAS” Proceedings of the 2009 Western Users of SAS Software, 2009. San Jose, CA. Available at http://www.lexjansen.com/wuss/2009/dpr/DPR-Kilburn.pdf
Li, A.L., Cheng, J.J. 2010. “Next Generation DATA _NULL_ Report Writing using ODS OO Features: A Powerful Tool to Create Custom Tables” Proceedings of SAS Global Forum 2010. Seattle, WA. Available at http://support.sas.com/resources/papers/proceedings10/072-2010.pdf
O’Connor, D. 2003. “Next Generation Data _NULL_ Report Writing Using ODS OO Features” Proceedings of Twenty-Eighth SAS Users Group International 2003. Seattle, WA. Available at http://www2.sas.com/proceedings/sugi28/022-28.pdf
O’Connor, D. 2008. “SAS Graphics on ODS 9.2 Performance-Enhancing Steriods” Proceedings of SAS Global Forum 2008. San Antonio, TX. Available at http://www2.sas.com/proceedings/forum2008/254-2008.pdf
O’Connor, D. 2009a. “Breaking New Ground with SAS 9.2 ODS Layout Enhancements” Proceedings of SAS Global Forum 2009. National Harbour, MD. Available at http://support.sas.com/resources/papers/proceedings09/043-2009.pdf
O’Connor, D. 2009b. “The Power to Show: Ad Hoc Reporting, Custom Invoices, and Form Letters.” Proceedings of the SAS Global Forum 2009. National Harbour, MD. Available at http://support.sas.com/resources/papers/proceedings09/313-2009.pdf
SAS Institute 1999. “Technical Support Document #325 –The SAS System and DDE” Available at http://ftp.sas.com/techsup/download/technote/ts325.pdf (July 19, 2004)”
Smith, C.A. 2010. “Importing Excel files Into SAS Using DDE”. Proceedings of the 2010 Western Users of SAS Software, 2010. San Diego, CA. Available at http://www.lexjansen.com/wuss/2010/DataPresentation/3015_4_DPR-Smith.pdf
Springborn, R. 2012. “Set Yourself Free –Use ODS Report Writing Technology in SAS Enterprise Guide Instead of Dynamic Data Exchange in PC SAS” Proceedings of the Western Users of SAS Software Twentieth Annual Conference, Paper 035-2012. Long Beach, CA. Available at http://www.lexjansen.com/wuss/2012/35.pdf .
Vyverman, K. 2001. “Using Dynamic Data Exchange to Export Your SAS Data to MS Excel –Against All ODS, Part I” Proceedings of the Twenty-Sixth Annual SAS Users Group International Conference, Paper 11-26, 2001. Long Beach, CA. Available at http://www2.sas.com/proceedings/sugi26/p011-26.pdf
Vyverman, K. 2002. “Creating Custom Excel Workbooks from Base SAS with Dynamic Data Exchange: A Complete Walkthrough” Proceedings of the Twenty-Seventh Annual SAS Users Group International Conference, Paper 190-27, 2002. Orlando, FL. Available at http://www2.sas.com/proceedings/sugi27/p190-27.pdf
CONTACT INFORMATION
Robert Richard Springborn, Ph.D. Healthcare Outcomes Center Office of Statewide Health Planning and Development 400 R Street, Suite 250 Sacramento, CA 95811-6213 Office (916) 326- 3874 [email protected]
13

Set Yourself Free –Use ODS Report Writing Technology In SAS Enterprise Guide, continued
** SECTION 1 ****************************************************************************** ; 1 options nodate nonumber ; 2 3 *** Format for under-reporting, over-reporting; 4 proc format; 5 value ovrudrf 6 9999="NOT COUNTED"; 7 run; 8 9 *** Create Bucket for SAS Job Log; 10 ods _all_ close; 11 ods listing; 12 %let folder1= \\server_name\folder_path_name\; 13 filename ddr_log “&folder1.2011\programs\ddrlog.dat"; 14 proc printto log=ddr_log new; 15 run; 16 17 ** Location of data sets created; 18 libname ddrtext "&folder1.2011\programs\2011Cycle2RobertPrototype\Pgm_Macros_Input\"; 19 20 ** Update Year macro; 21 %let rsddryr= 2011; 22 23 data hospnames (keep= hospid hospname hospitaltext); 24 set ddrtext.ddr&rsddryr.all; 25 26 ** Remove special characters from hospital names; 27 hospitaltext= translate(substr(hospitalfull,8,50)," ","-"); 28 hospitaltext= translate(hospitaltext," ","&"); 29 hospitaltext= translate(hospitaltext," ","9"); 30 hospitaltext= translate(hospitaltext," ","+"); 31 hospitaltext= translate(hospitaltext," ","'"); 32 hospitaltext= translate(hospitaltext," ","."); 33 hospitaltext= translate(hospitaltext," ",","); 34 hospitaltext= translate(strip(compbl(hospitaltext)),"_"," "); 35 36 ** Full Execution of all hospitals; 37 if length(hospid)= 6; 38 39 ** Select a sample of hospitals to debug ***********************************************; 40 /*if length(hospid)= 6 then do; 41 if hospid= "010937" or hospid= "071018" or hospid="190429" ; end; */ 42 run; 43 proc sort data=hospnames nodupkey out=hosp_unique; 44 by hospid; 45 run; 46 47 **Extract hosipital ID; 48 proc sql noprint; 49 select hospid 50 into :hosplist separated by ' ' 51 from hosp_unique; 52 %let nhosp=&sqlobs; 53 quit; 54 %put &hosplist; 55 56 ** Extract hospital name; 57 proc sql noprint; 58 select hospitaltext 59 into :qhosplist separated by ' ' 60 from hosp_unique; 61 %let nhosp=&sqlobs; 62 quit; 63 %put &qhosplist; 64 65
14
Set Yourself Free –Use ODS Report Writing Technology in SAS Enterprise Guide, continued ** SECTION 2 **************************************************************************************************; 66 67 %macro helpsheet (ddryear, hospnum1, hosptextname1); 68 69 title1 "~{style [font_size=10pt just=center background=light blue color=yellow] &ddryear. CCORP DATA 70 DISCREPANCY REPORT }"; 71 title2 "~{style [font_size=12pt just=center background=light blue color=yellow] &hosptextname1. (&hospnum1.) }"; 72 title3; 73 74 footnote1 justify=left font=courier height=3 color=red bold " &hosptextname1. (&hospnum1.) Page ~{thispage} of 75 ~{lastpage}"; 76 77 ods proclabel="DEFINITIONS FOR EACH DDR VARIABLE"; 78 79 data _null_ ; 80 set ddrtext.helpsheet end=eof; 81 82 if _n_=1 then do; 83 dcl odsout obj(); 84 obj.layout_gridded(columns: 2, overrides: "just=left"); 85 86 obj.region(width: "2.00in"); 87 obj.format_text(data: strip(ddrvar), 88 overrides: "backgroundcolor=yellow color=black just=center width=100pct font_size=10pt font_face=arial"); 89 obj.region(width: "4.0in"); 90 obj.format_text(data: catx(" ",vardesc1,vardesc2), split:'*', 91 overrides: "backgroundcolor=yellow color=black just=left width=100pct font_size=10pt font_face=arial"); end; 92 93 else if _n_ gt 1 then do; 94 obj.region(width: "2.00in"); 95 obj.format_text(data: strip(ddrvar), 96 overrides: "just=center width=100pct font_size=11pt"); 97 obj.region(width: "4.0in"); 98 obj.format_text(data: catx(" ",vardesc1,vardesc2), split:'*', 99 overrides: "just=left width=100pct font_size=11pt"); end; 100 101 if eof eq 1 then obj.layout_end(); 102 103 ;run; 104 %mend helpsheet; 105 106 ** SECTION 3 ************************************************************************************************** 107 108 %macro ddrvarsection (ddryear, dataname1, sectionhdr, bookmarknotes, bookmarkhosp, ddrvar, discrepancytxt, 109 hospnum2, dataname2, sumunder, sumover, isononiso); 110 111 *** Define Variables to Review for Over and Under Reporting ; 112 title1 "~{style [font_size=10pt just=center background=light blue color=yellow] &ddryear. CCORP DATA 113 DISCREPANCY REPORT }"; 114 title2 "~{style [font_size=10pt just=center background=light blue color=yellow] §ionhdr. }"; title3; 115 title4 "~{style [font_size=10pt just=center background=light blue color=yellow] Definitions of Under and Over 116 Reporting }"; 117 118 ods proclabel="&bookmarknotes."; 119 data _null_ ; 120 length notedescrip $450 ; 121 set &dataname1. end=eof; 122 123 notedescrip=catx(" ",vardesc1,vardesc2,vardesc3,vardesc4); 124 125 dcl odsout obj(); 126 127 if _n_ =1 then do; 128 obj.table_start(name: "Action Required", label: "Action Required", 129 overrides: "width=6.5in"); 130 131
15
Set Yourself Free –Use ODS Report Writing Technology in SAS Enterprise Guide, continued obj.row_start(); 132 obj.format_cell(data: trim(notevar), split:'*', 133 overrides: "just=left font_size=9pt font_weight=bold backgroundcolor=yellow color=black"); 134 obj.format_cell(data: upcase(notedescrip), 135 overrides: "just=left font_size=9pt font_weight=bold backgroundcolor=yellow color=black"); 136 obj.row_end(); end; 137 138 if _n_ = 2 then do; 139 set &dataname2. (where= (hospid="&hospnum2.")); 140 141 obj.table_start(name: "Definition Over Reporting", label: "Definition Under Reporting ", 142 overrides: "width=6.5in"); 143 144 obj.row_start(); 145 obj.format_cell(data: trim(notevar), split:'*', 146 overrides: "just=left font_size=9pt "); 147 obj.format_cell(data: notedescrip, 148 overrides: "just=left font_size=9pt "); 149 obj.format_cell(data: " "||put(&sumunder,ovrudrf.)||" ", 150 overrides: "just=center font_size=9pt "); 151 obj.row_end(); end; 152 153 if _n_ = 3 then do; 154 set &dataname2. (where= (hospid="&hospnum2.")); 155 156 obj.table_start(name: "Definition Under Reporting", label: "Definition Over Reporting ", 157 overrides: "width=6.5in"); 158 159 obj.row_start(); 160 obj.format_cell(data: trim(notevar), split:'*', 161 overrides: "just=left font_size=9pt "); 162 obj.format_cell(data: notedescrip, 163 overrides: "just=left font_size=9pt "); 164 obj.format_cell(data: " "||put(&sumover,ovrudrf.)||" ", 165 overrides: "just=center font_size=9pt"); 166 obj.row_end(); end; 167 168 obj.table_end(); 169 ;run; 170 171 ** SECTION 4 ************************************************************************************************** 172 173 ** Display Hospital Level Data for Each Variable; 174 title1 "~{style [font_size=10pt just=center backgroundcolor=light blue color=yellow] &ddryear. CCORP DATA 175 DISCREPANCY REPORT }"; 176 title2 "~{style [font_size=10pt just=center backgroundcolor=light blue color=yellow] §ionhdr. }"; 177 ods proclabel="&bookmarkhosp."; 178 179 data _null_; 180 length discrepancy $50. ; 181 set ddrtext.ddr&rsddryr.all end=eof; 182 183 ** Create array for diagnoses and diagnosis dates; 184 array odx{24} $ dx1_txt dx2_txt dx3_txt dx4_txt dx5_txt dx6_txt dx7_txt dx8_txt dx9_txt dx10_txt 185 dx11_txt dx12_txt dx13_txt dx14_txt dx15_txt dx16_txt dx17_txt dx18_txt dx19_txt dx20_txt 186 dx21_txt dx22_txt dx23_txt dx24_txt ; 187 188 ** Create array for procedures and procedure dates; 189 array opx{20} $ px1_txt px2_txt px3_txt px4_txt px5_txt px6_txt px7_txt px8_txt px9_txt px10_txt 190 px11_txt px12_txt px13_txt px14_txt px15_txt px16_txt px17_txt px18_txt px19_txt px20_txt ; 191 array opxdt {20} $ pxdt1-pxdt20; 192 193 ** Translate ddrvar text to word explanation; 194 If &ddrvar="YN" then discrepancy= "DATA FOUND ONLY IN CCORP (OVER REPORTING)"; 195 else if &ddrvar="NY" then discrepancy= "DATA FOUND ONLY IN PDD (UNDER REPORTING)"; 196 197
16
Set Yourself Free –Use ODS Report Writing Technology in SAS Enterprise Guide, continued dcl odsout obj(); 198 199 ** Apply data filter for discrepancy section ; 200 IF &ddrvar IN(&discrepancytxt) and hospid=&hospnum2 THEN DO; 201 202 ** Create summary table for each case; 203 if _n_ = 1 then do; 204 sheet2_n=1 ; 205 emptycase= 0; end; 206 else sheet2_n +1 ; 207 208 obj.table_start(name: "Cabg-reporting Summary", label: "Case "||trim(sheet2_n)||" "||trim(discrepancy), 209 overrides: "width=5in"); 210 211 obj.row_start(); 212 obj.format_cell(data: "CASE # "||strip(sheet2_n)||" "||trim(discrepancy), column_span: 4, 213 overrides: "backgroundcolor=yellow color=black font_weight=bold font_size=8pt just=left"); 214 obj.row_end(); 215 216 obj.row_start(); 217 obj.format_cell(data: "CABG TYPE :"||" "||translate(upcase(&isononiso)," ","/"), column_span: 4, 218 overrides: "backgroundcolor=yellow color=black font_weight=bold font_size=8pt just=left"); 219 obj.row_end(); 220 221 obj.row_start(); 222 obj.format_cell(data: "DATABASE LINKAGE :"||" "||trim(upcase(look_hosp)), column_span: 4, 223 overrides: "backgroundcolor=yellow color=black font_weight=bold font_size=8pt just=left"); 224 obj.row_end(); 225 226 obj.row_start(); 227 obj.format_cell(data: "Patient MRN", 228 overrides: "just=left font_weight=bold font_size=8pt font_face=arial"); 229 obj.format_cell(data: MedRecN, 230 overrides: "just=center font_size=8pt font_face=arial"); 231 obj.format_cell(data: "Surgery Date", 232 overrides: "just=left font_weight=bold font_size=8pt font_face=arial"); 233 obj.format_cell(data: surgdt, 234 overrides: "just=center font_size=8pt font_face=arial"); 235 obj.row_end(); 236 237 obj.row_start(); 238 obj.format_cell(data: "Patient SSN", 239 overrides: "just=left font_size=8pt font_weight=bold font_face=arial"); 240 obj.format_cell(data: ssn, 241 overrides: "just=center font_size=8pt font_face=arial"); 242 obj.format_cell(data: "Discharge Date", 243 overrides: "just=left font_size=8pt font_weight=bold font_face=arial"); 244 obj.format_cell(data: dischdt, 245 overrides: "just=center font_size=8pt font_face=arial"); 246 obj.row_end(); 247 248 obj.row_start(); 249 obj.format_cell(data: "Patient Sex", 250 overrides: "just=left font_size=8pt font_weight=bold font_face=arial"); 251 obj.format_cell(data: gender, 252 overrides: "just=center font_size=8pt font_face=arial"); 253 obj.format_cell(data: "Death Date", 254 overrides: "just=left font_size=8pt font_weight=bold font_face=arial"); 255 obj.format_cell(data: mtdate, 256 overrides: "just=center font_size=8pt font_face=arial"); 257 obj.row_end(); 258 259 obj.row_start(); 260 obj.format_cell(data: "Birth Date", 261 overrides: "just=left font_size=8pt font_weight=bold font_face=arial"); 262 obj.format_cell(data: birthdt, 263
17
Set Yourself Free –Use ODS Report Writing Technology in SAS Enterprise Guide, continued overrides: "just=center font_size=8pt font_face=arial"); 264 obj.format_cell(data: "Surgeon", 265 overrides: "just=left font_size=8pt font_weight=bold font_face=arial"); 266 obj.format_cell(data: Surgeon, 267 overrides: "just=center font_size=8pt font_face=arial"); 268 obj.row_end(); 269 obj.table_end(); 270 271 ** Create detail table for each case; 272 obj.table_start(name: "Cabg-reporting Detail", label: "Detailed Information for Case #"||trim(sheet2_n), 273 overrides: "width=6.5in"); 274 275 obj.row_start(); 276 obj.format_cell(data: "DETAILED INFORMATION FOR CASE #"||trim(sheet2_n), column_span: 3, 277 overrides: "backgroundcolor=green color=yellow font_size=8pt font_weight=bold font_face=arial"); 278 obj.row_end(); 279 280 obj.row_start(); 281 obj.format_cell(data: "MS-DRG", 282 overrides: "just=left font_weight=bold font_size=8pt font_face=arial"); 283 obj.format_cell(data: msdrgtxt, 284 overrides: "just=left font_size=8pt font_face=arial"); 285 obj.row_end(); 286 287 obj.row_start(); 288 obj.format_cell(data: "PRINCIPAL DX", 289 overrides: "just=left font_size=8pt font_weight=bold font_face=arial"); 290 obj.format_cell(data: prdx_txt, 291 overrides: "just=left font_size=8pt font_face=arial"); 292 obj.row_end(); 293 294 ** Select number of previous diagnoses; 295 do i=1 to 24; 296 297 if length(odx{i}) gt 3 then do; 298 obj.row_start(); 299 obj.format_cell(data: "Other DX #"||strip(i), 300 overrides: "just=left font_size=8pt font_face=arial font_weight=bold"); 301 obj.format_cell(data: odx{i}, 302 overrides: "just=left font_size=8pt font_face=arial"); 303 obj.row_end(); 304 end; 305 end; 306 307 obj.row_start(); 308 obj.format_cell(data: "PRINCIPAL PX", 309 overrides: "just=left font_size=8pt font_face=arial font_weight=bold"); 310 obj.format_cell(data: prpx_txt, 311 overrides: "just=left font_size=8pt font_face=arial "); 312 obj.format_cell(data: prpxdt, 313 overrides: "just=center font_size=8pt font_face=arial"); 314 obj.row_end(); 315 316 ** Select number of previous procedures; 317 do i=1 to 20; 318 if length(opx{i}) gt 3 and length(opxdt{i}) gt 3 then do; 319 obj.row_start(); 320 obj.format_cell(data: "Other PX #"||strip(i), 321 overrides: "just=left font_size=8pt font_face=arial font_weight=bold"); 322 obj.format_cell(data: opx{i}, 323 overrides: "just=left font_size=8pt font_face=arial "); 324 obj.format_cell(data: opxdt{i}, 325 overrides: "just=center font_size=8pt font_face=arial "); 326 obj.row_end(); 327 end; 328 end; 329
18
Set Yourself Free –Use ODS Report Writing Technology in SAS Enterprise Guide, continued 330 obj.table_end(); 331 END; 332 333 ** Generate Short Table with Note of No data found; 334 ELSE DO; 335 emptycase +1; 336 if eof= 1 and emptycase= 11 then do; 337 obj.table_start(name: "A DISCREPANCY OF THIS TYPE WAS NOT FOUND FOR YOUR HOSPITAL", 338 overrides: "width=6.5in"); 339 340 obj.row_start(); 341 obj.format_cell(data: "A DISCREPANCY OF THIS TYPE WAS NOT FOUND FOR YOUR HOSPITAL", 342 column_span: 4, overrides: "backgroundcolor=green color=yellow font_size=7pt font_weight=bold just=center"); 343 obj.row_end(); 344 345 obj.table_end(); end; 346 END; 347 348 ;run; 349 %mend ddrvarsection; 350 351 *** SECTION 5 ***********************************************************************************************; 352 353 ods listing close; 354 355 options nodate nonumber papersize=(7.5in 10in) orientation=portrait ; 356 options topmargin=0in bottommargin=0in leftmargin=0in rightmargin=0in; 357 ods escapechar="~"; 358 359 %LET Targetpath= “Insert folder path” ; 360 361 %macro hospitalddr (hospitalnum=,hospnametxt=); 362 363 ods pdf file="&Targetpath.Hospital_&hospitalnum.&hospnametxt..pdf" pdftoc=1 ; 364 365 %helpsheet (&rsddryr, &hospitalnum, &hospnametxt) 366 367 %ddrvarsection (&rsddryr, %bquote(ddrtext.notesoverunder1), %bquote(SECTION I :: CABG-REPORTING), 368
%bquote(I. CABG-REPORTING: Definitions), %bquote(I. CABG-REPORTING : Hospital Level Data), ddrvar1, 369 %STR("YN","NY"), &hospitalnum, %bquote(ddrtext.overundersummary), sumunder1, sumover1, ddrvar1_iso) 370
371 %ddrvarsection (&rsddryr, %bquote(ddrtext.notesoverunder2), %bquote(SECTION II :: ISO vs. NON-ISO), 372
%bquote(II. ISO vs. NON-ISO : Definitions), %bquote(II. ISO vs. NON-ISO : Hospital Level Data), ddrvar2, 373 %STR("YN","NY"), &hospitalnum, %bquote(ddrtext.overundersummary), sumunder2, sumover2, ddrvar2_iso) 374
375 %ddrvarsection (&rsddryr, %bquote(ddrtext.notesoverunder3), %bquote(SECTION III :: RESUSC), 376 %bquote(III. RESUSC : Definitions), %bquote(III. RESUSC : Hospital Level Data), ddrvar3, 377 %STR("YN"), &hospitalnum, %bquote(ddrtext.overundersummary), sumunder3, sumover3, ddrvar3_iso ) 378 379 %ddrvarsection (&rsddryr, %bquote(ddrtext.notesoverunder4), %bquote(SECTION IV :: DEATH), 380 %bquote(IV. DEATH : Definitions), %bquote(IV. DEATH : Hospital Level Data), ddrvar4, 381 %STR("YN","NY"), &hospitalnum, %bquote(ddrtext.overundersummary), sumunder4, sumover4, ddrvar4_iso ) 382 383 %ddrvarsection (&rsddryr, %bquote(ddrtext.notesoverunder5), %bquote(SECTION V :: P-O-STROKE), 384 %bquote(V. P-O-STROKE : Definitions), %bquote(V. P-O-STROKE : Hospital Level Data), ddrvar5, 385 %STR("NY"), &hospitalnum, %bquote(ddrtext.overundersummary), sumunder5, sumover5, ddrvar5_iso ) 386 387 %ddrvarsection (&rsddryr, %bquote(ddrtext.notesoverunder6), %bquote(SECTION VI :: P-O-DIALYSIS), 388 %bquote(VI. P-O-DIALYSIS : Definitions), %bquote(VI. P-O-DIALYSIS : Hospital Level Data), ddrvar6, 389 %STR("NY"), &hospitalnum, %bquote(ddrtext.overundersummary), sumunder6, sumover6, ddrvar6_iso ) 390 391 %ddrvarsection (&rsddryr, %bquote(ddrtext.notesoverunder7), %bquote(SECTION VII :: P-O-VENT), 392 %bquote(VII. P-O-VENT : Definitions), %bquote(VII. P-O-VENT : Hospital Level Data), ddrvar7, 393 %STR("NY"), &hospitalnum, %bquote(ddrtext.overundersummary), sumunder7, sumover7, ddrvar7_iso ) 394 395
19
Set Yourself Free –Use ODS Report Writing Technology in SAS Enterprise Guide, continued %ddrvarsection (&rsddryr, %bquote(ddrtext.notesoverunder8), %bquote(SECTION VIII :: P-O-BLEED), 396 %bquote(VIII. P-O-BLEED : Definitions), %bquote(VIII. P-O-BLEED : Hospital Level Data), ddrvar8, 397 %STR("NY"), &hospitalnum, %bquote(ddrtext.overundersummary), sumunder8, sumover8, ddrvar8_iso ) 398 399 %ddrvarsection (&rsddryr, %bquote(ddrtext.notesoverunder9), %bquote(SECTION IX :: P-O-INFECT), 400 %bquote(IX. P-O-INFECT : Definitions), %bquote(IX. P-O-INFECT : Hospital Level Data), ddrvar9, 401 %STR("NY"), &hospitalnum, %bquote(ddrtext.overundersummary), sumunder9, sumover9, ddrvar9_iso ) 402 403 %ddrvarsection (&rsddryr, %bquote(ddrtext.notesoverunder10), %bquote(SECTION X :: P-O-GRAFT-OCC), 404 %bquote(X. P-O-GRAFT-OCC : Definitions), %bquote(X. P-O-GRAFT-OCC : Hospital Level Data), ddrvar10, 405 %STR("NY"), &hospitalnum, %bquote(ddrtext.overundersummary), sumunder10, sumover10, ddrvar10_iso ) 406 407 ods pdf close; 408 run; 409 410 %mend hospitalddr; 411 412 %macro callddr; 413 %let nvar=%sysfunc(countw(&hosplist)); 414 %do i = 1 %to &nvar; 415 %let id = %scan(&hosplist,&i,%str( )); 416 %let name = %scan(&qhosplist,&i,%str( )); 417 %hospitalddr (hospitalnum=&id,hospnametxt=&name) 418 %end; 419 %mend callddr; 420 421 %callddr 422 run; 423 424 ods listing; 425 title1; title2; title3; 426 footnote1; footnote2; footnote3; 427 run; 428 429 ** Put lid on SAS Job Log Bucket and remove Warning Messages ;; 430 proc printto; 431 run; 432 data remove_warnings1; 433 infile ddr_log truncover; 434 input log_text $ 1-355 ; 435 436 if strip(log_text) NE "WARNING: DATA step interface is preproduction in this release." 437 and strip(substr(log_text,3,353)) NE "The SAS System" then do; 438 439 if length(compress(log_text)) + length(compress(lag1(log_text))) + length(compress(lag2(log_text))) gt 3 440 then output; end; 441 run; 442 proc print data=remove_warnings1; 443 run; 444 445 QUIT; 446
20