session 7 introduction to important statistical techniques
TRANSCRIPT

1Asia‐Pacific Research and Training Network on Trade
www.artnetontrade.org
ARTNeT Greater Mekong Sub-region (GMS) initiative
Session 7
Introduction to important statistical techniques for competitiveness analysis – example and interpretations
ARTNeT ConsultantWitada Anukoonwattaka, PhDThammasat University, [email protected]
2Asia‐Pacific Research and Training Network on Trade
www.artnetontrade.org
Outline• Concepts of data analysis• Basic data analysis:
– Interpreting quantitative and qualitative data
• Technical tools – Statistic analysis– Regression
• Concepts and interpretation of basic regression analysis
3Asia‐Pacific Research and Training Network on Trade
www.artnetontrade.org
What is data analysis?1. Describing what is going on in the dataset
E.g. You explore the sample to find out– the level and changes in relative price
competitiveness of the observed garment producers on average.
– differences in the cost competitiveness among firm groups, such as
• purely-national firms vs. foreign joint-ventures• small vs. large firms
4Asia‐Pacific Research and Training Network on Trade
www.artnetontrade.org
2. Testing hypothesisE.g. You may want to know
– Whether the changes in relative cost of Chinese garments to that of the GMS group systematically related to tariff reductions?
– Does the changes in relative costs differ systematically between countries in the group?
– Are the trends of competitiveness similar between exports to the US and Japanese markets?
5Asia‐Pacific Research and Training Network on Trade
www.artnetontrade.org
3. Forecasting• Can exchange rate depreciation increase export
competitiveness of GMS countries to China? By how much?
• Can tariff reductions enhance export competitiveness of GMS countries? To what extent?

6Asia‐Pacific Research and Training Network on Trade
www.artnetontrade.org
Describing what is going on in the data

7Asia‐Pacific Research and Training Network on Trade
www.artnetontrade.org
Interpreting Quantitative Data (1)1. Overall Average Scores - high or low? Very high or very low
scores might mean that the question is poorly worded.
2. Standard Deviations - A low standard deviation means respondents generally had a common response. A high standard deviations mean they had different responses.
3. The frequency distribution will help you get a better idea of what is happening.
• Is there any bi-modal distribution where there are two different groups who had very different responses?
• Bi-modal distribution might show up as having a normal average score, but high standard deviations.

8Asia‐Pacific Research and Training Network on Trade
www.artnetontrade.org
Interpreting Quantitative Data (2)4. Compare the results between the different
demographic subgroups.– Especially focusing on the items where you had
interesting things happening in the frequency distributions.
5. If you are serious about understanding your numeric data, you should also perform some statistical analyses.
9Asia‐Pacific Research and Training Network on Trade
www.artnetontrade.org
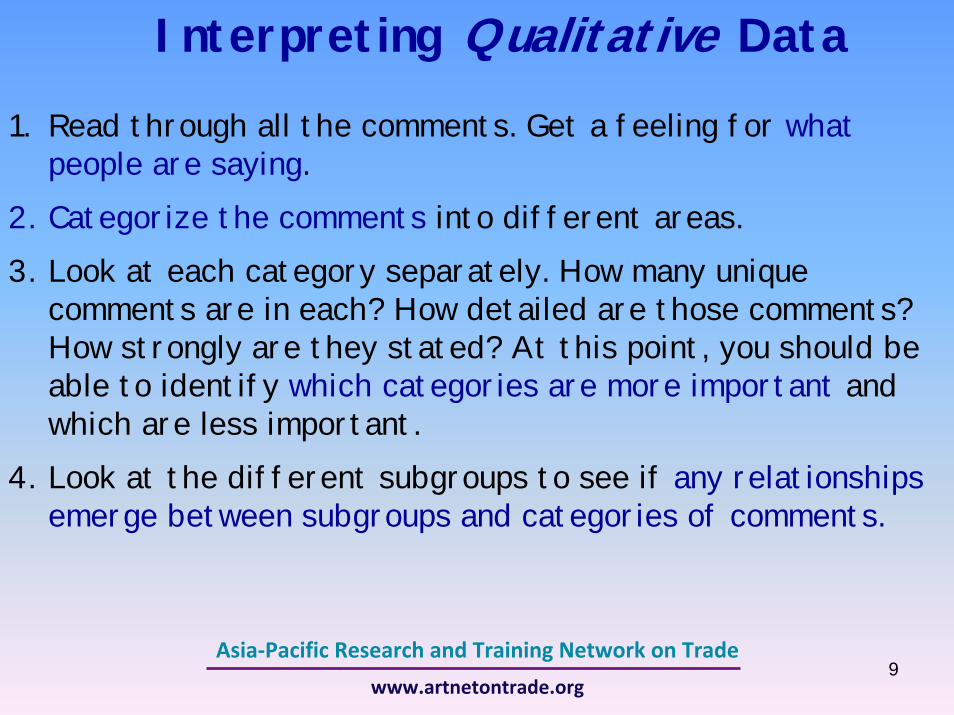
Interpreting Qualitative Data
1. Read through all the comments. Get a feeling for what people are saying.
2. Categorize the comments into different areas. 3. Look at each category separately. How many unique
comments are in each? How detailed are those comments? How strongly are they stated? At this point, you should be able to identify which categories are more important and which are less important.
4. Look at the different subgroups to see if any relationships emerge between subgroups and categories of comments.
10Asia‐Pacific Research and Training Network on Trade
www.artnetontrade.org
Technical Data Analysis:
• Statistic analysis • Hypothesis testing • Forecasting

11Asia‐Pacific Research and Training Network on Trade
www.artnetontrade.org
Statistic Analysis 1. Analysis of individual variables
– Look at the “central tendency”, “distribution”and “dispersion” of responses to each data variable.
2. Analysis of relationships between variables– Look at “possible interdependence” between
data variables. 3. Analysis of difference characteristics between
subgroups.– Look at “characteristic differences” between
subgroups.
12Asia‐Pacific Research and Training Network on Trade
www.artnetontrade.org
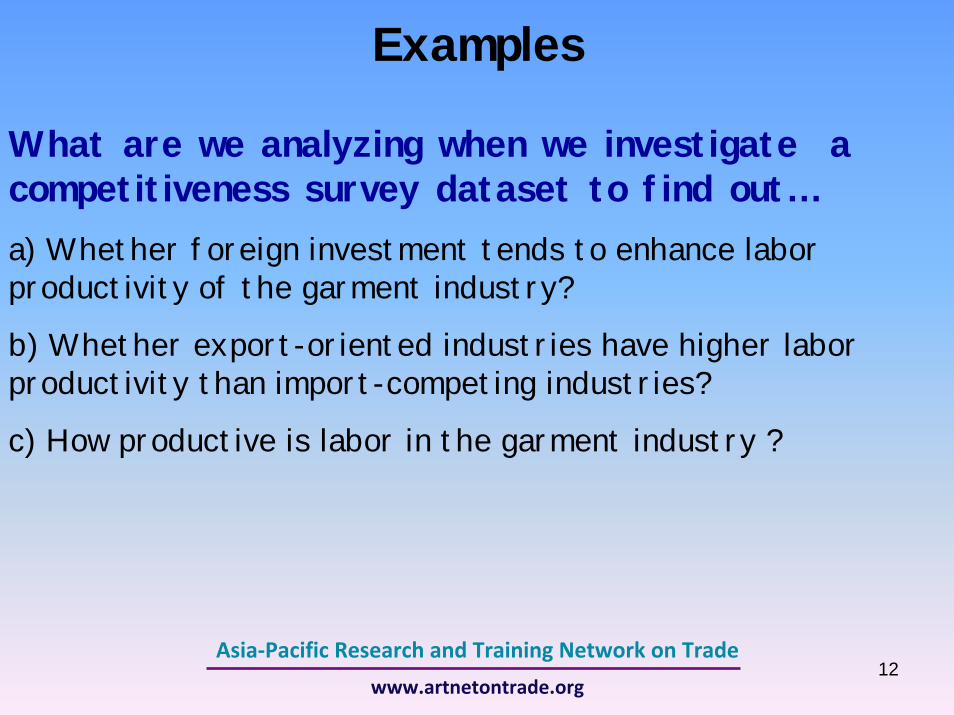
What are we analyzing when we investigate a competitiveness survey dataset to find out…a) Whether foreign investment tends to enhance labor productivity of the garment industry?
b) Whether export-oriented industries have higher labor productivity than import-competing industries?
c) How productive is labor in the garment industry ?
Examples
13Asia‐Pacific Research and Training Network on Trade
www.artnetontrade.org
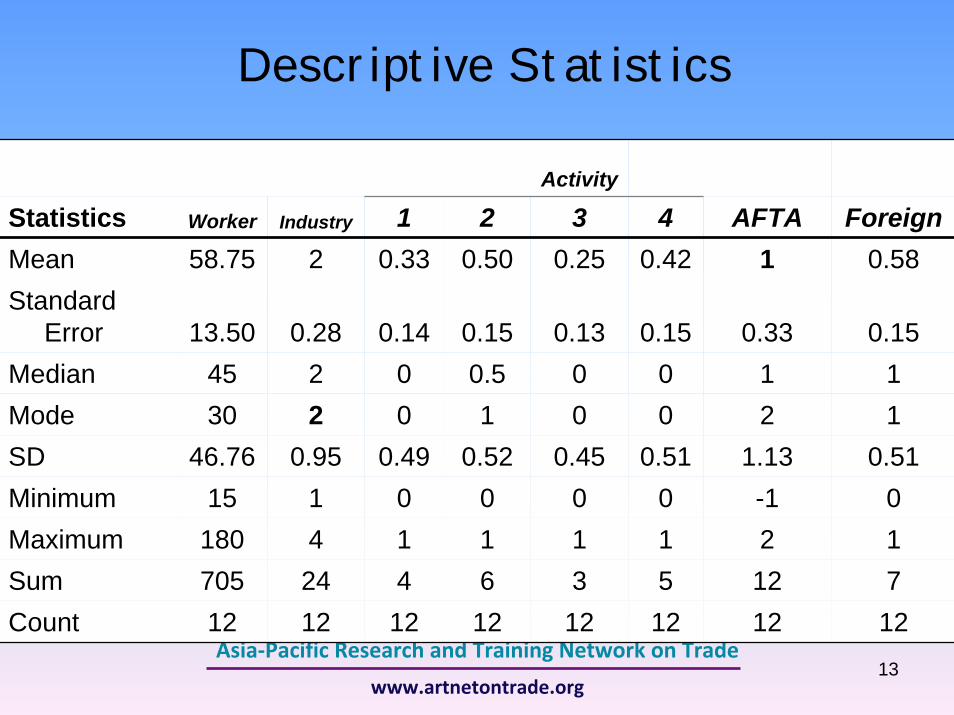
Descriptive Statistics
Activity
Statistics Worker Industry 1 2 3 4 AFTA ForeignMean 58.75 2 0.33 0.50 0.25 0.42 1 0.58Standard
Error 13.50 0.28 0.14 0.15 0.13 0.15 0.33 0.15Median 45 2 0 0.5 0 0 1 1Mode 30 2 0 1 0 0 2 1SD 46.76 0.95 0.49 0.52 0.45 0.51 1.13 0.51Minimum 15 1 0 0 0 0 -1 0Maximum 180 4 1 1 1 1 2 1Sum 705 24 4 6 3 5 12 7Count 12 12 12 12 12 12 12 12
14Asia‐Pacific Research and Training Network on Trade
www.artnetontrade.org
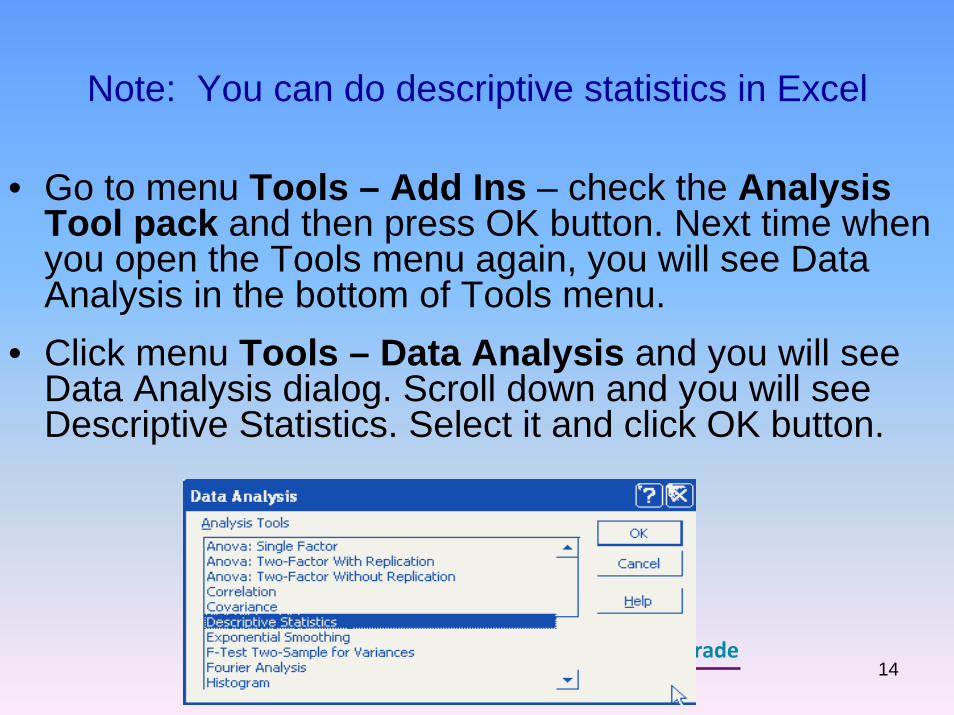
Note: You can do descriptive statistics in Excel
• Go to menu Tools – Add Ins – check the Analysis Tool pack and then press OK button. Next time when you open the Tools menu again, you will see Data Analysis in the bottom of Tools menu.
• Click menu Tools – Data Analysis and you will see Data Analysis dialog. Scroll down and you will see Descriptive Statistics. Select it and click OK button.
15Asia‐Pacific Research and Training Network on Trade
www.artnetontrade.org
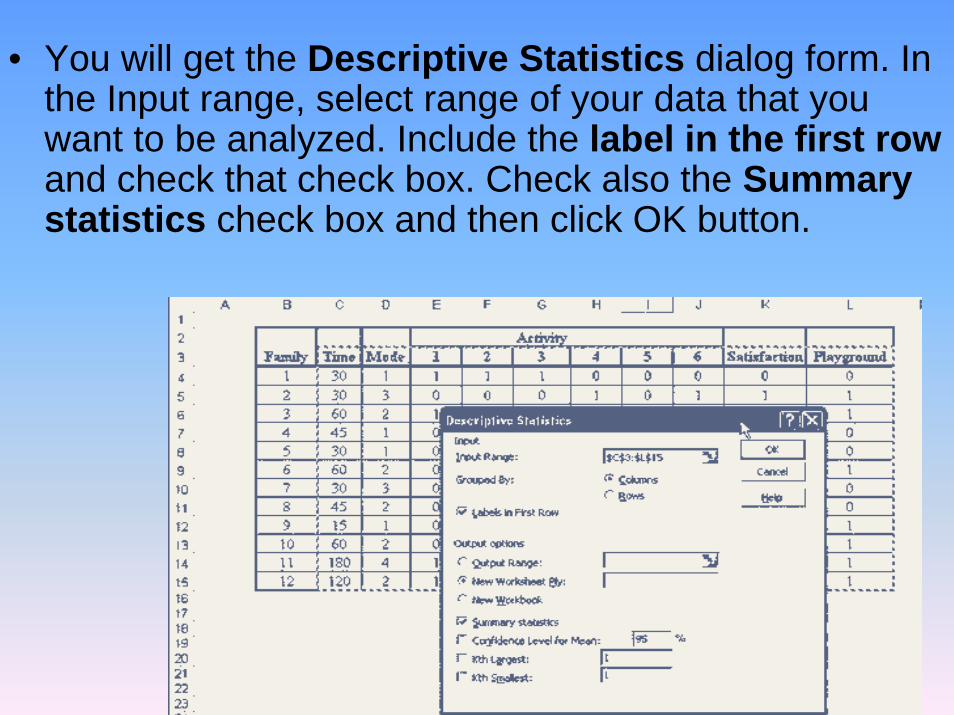
• You will get the Descriptive Statistics dialog form. In the Input range, select range of your data that you want to be analyzed. Include the label in the first rowand check that check box. Check also the Summary statistics check box and then click OK button.
16Asia‐Pacific Research and Training Network on Trade
www.artnetontrade.org
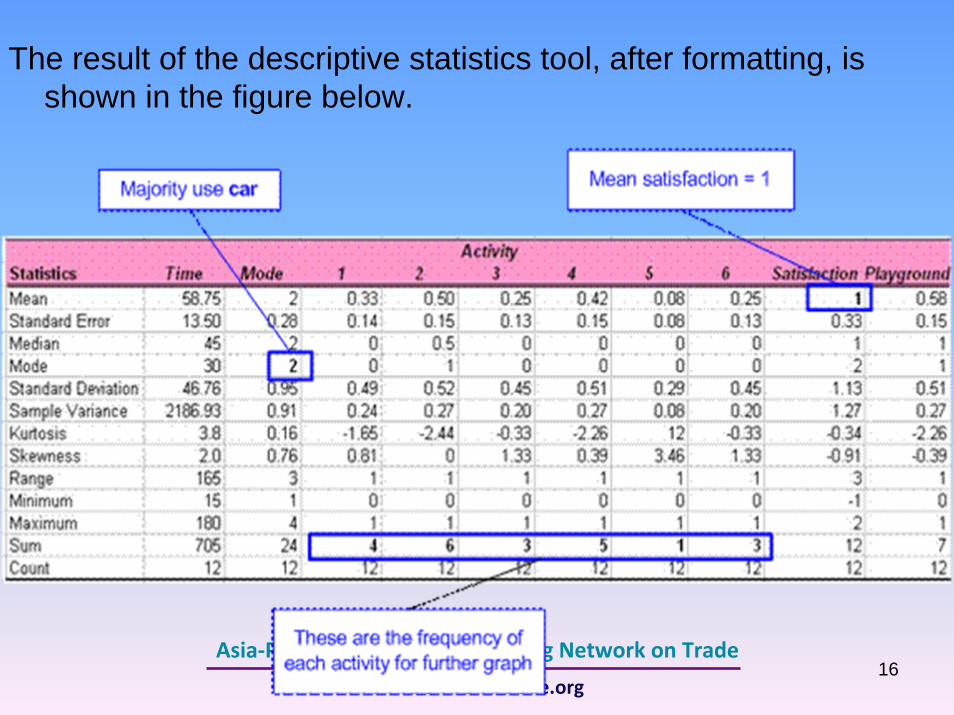
The result of the descriptive statistics tool, after formatting, is shown in the figure below.
17Asia‐Pacific Research and Training Network on Trade
www.artnetontrade.org
Analyzing Individual Variables
• Central tendency of the data• Distribution of the data• Dispersion of the data
18Asia‐Pacific Research and Training Network on Trade
www.artnetontrade.org
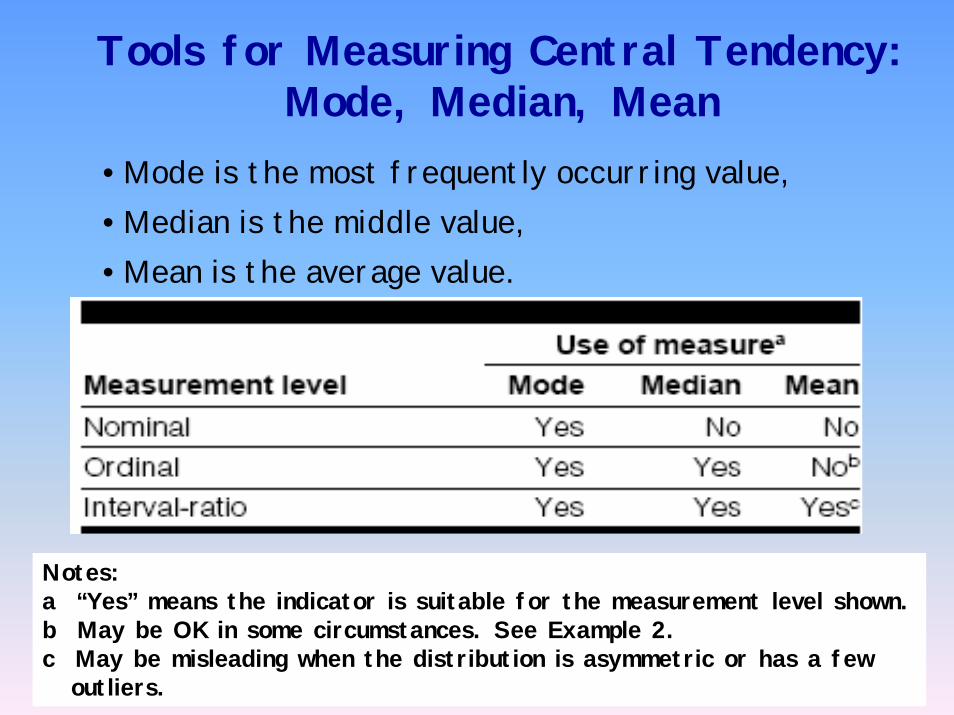
Tools for Measuring Central Tendency: Mode, Median, Mean
• Mode is the most frequently occurring value, • Median is the middle value,• Mean is the average value.
Notes:a “Yes” means the indicator is suitable for the measurement level shown.b May be OK in some circumstances. See Example 2.c May be misleading when the distribution is asymmetric or has a few
outliers.
19Asia‐Pacific Research and Training Network on Trade
www.artnetontrade.org
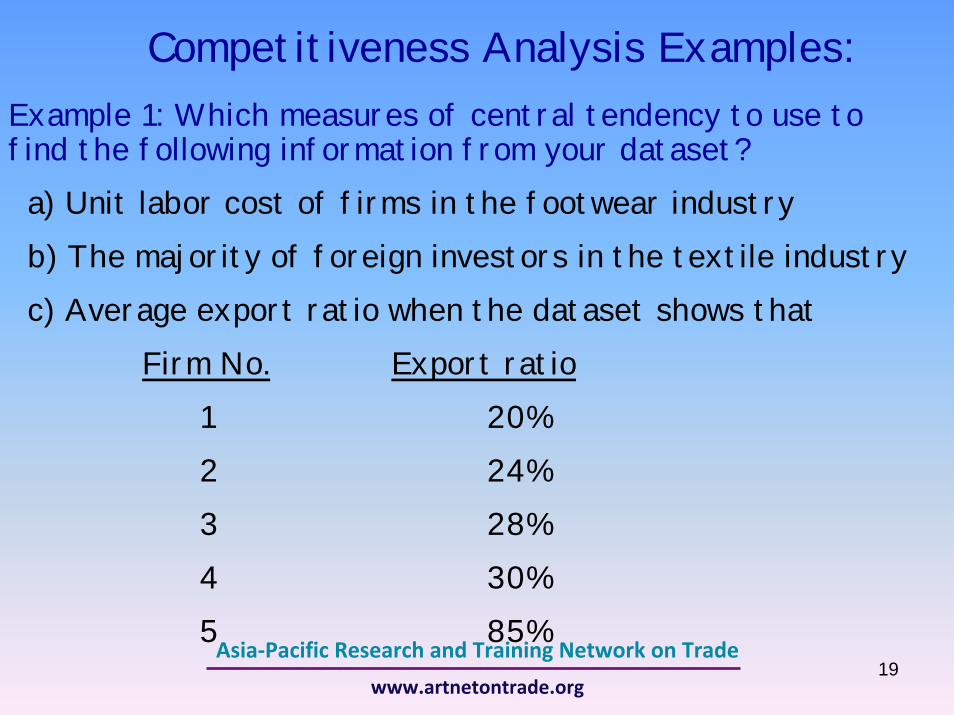
Competitiveness Analysis Examples:Example 1: Which measures of central tendency to use to find the following information from your dataset?
a) Unit labor cost of firms in the footwear industryb) The majority of foreign investors in the textile industryc) Average export ratio when the dataset shows that
Firm No. Export ratio1 20%2 24%3 28%4 30%5 85%
20Asia‐Pacific Research and Training Network on Trade
www.artnetontrade.org
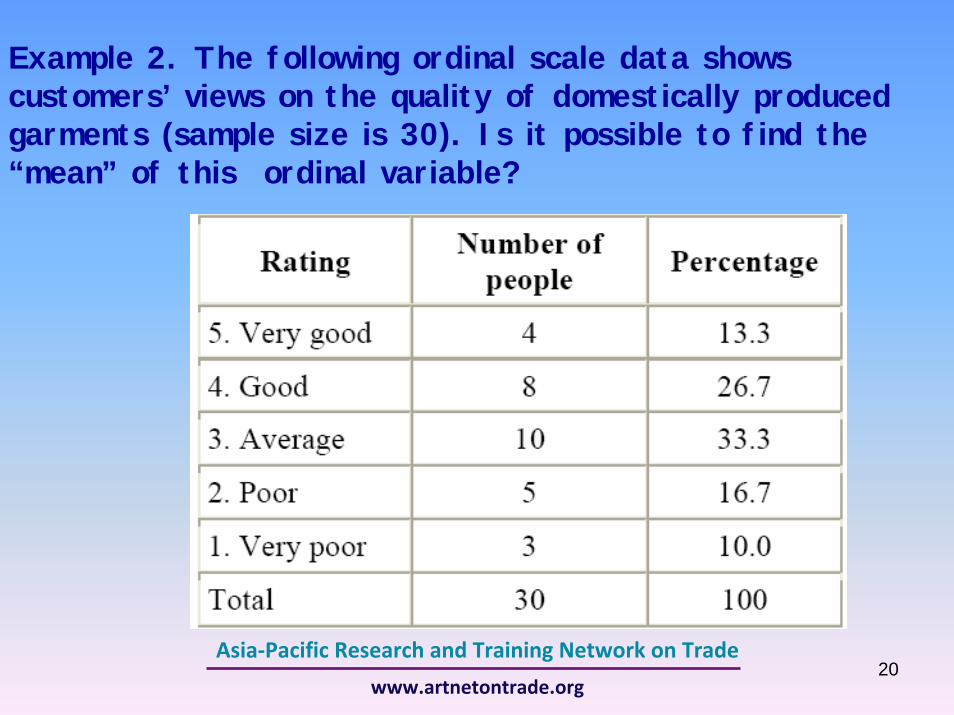
Example 2. The following ordinal scale data shows customers’ views on the quality of domestically produced garments (sample size is 30). Is it possible to find the “mean” of this ordinal variable?
21Asia‐Pacific Research and Training Network on Trade
www.artnetontrade.org
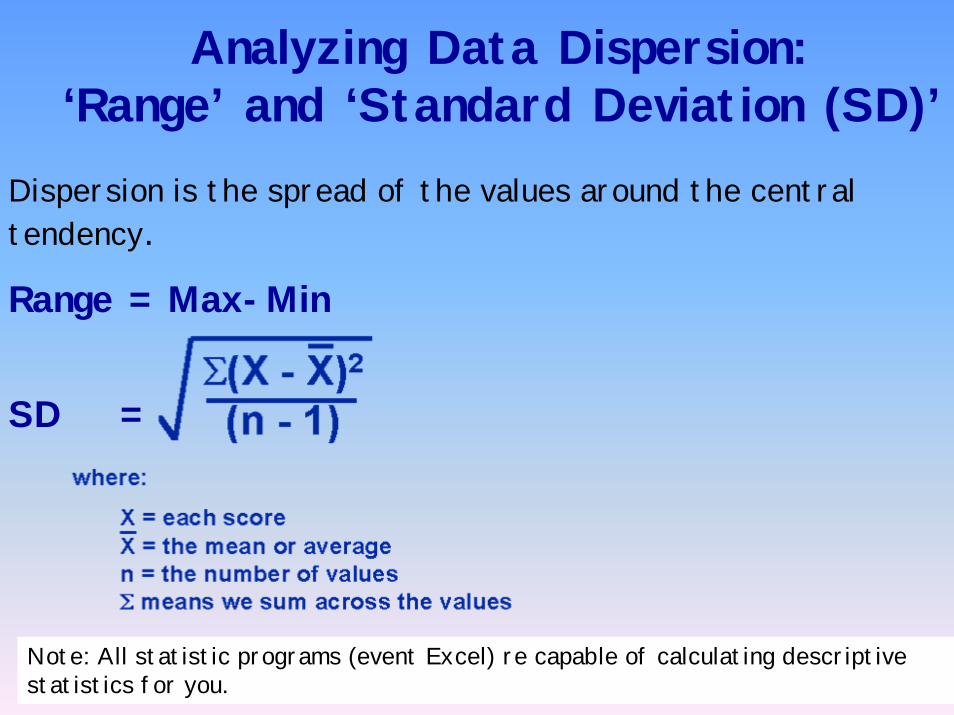
Analyzing Data Dispersion: ‘Range’ and ‘Standard Deviation (SD)’
Dispersion is the spread of the values around the central tendency.
Range = Max-Min
SD =
Note: All statistic programs (event Excel) re capable of calculating descriptive statistics for you.
22Asia‐Pacific Research and Training Network on Trade
www.artnetontrade.org
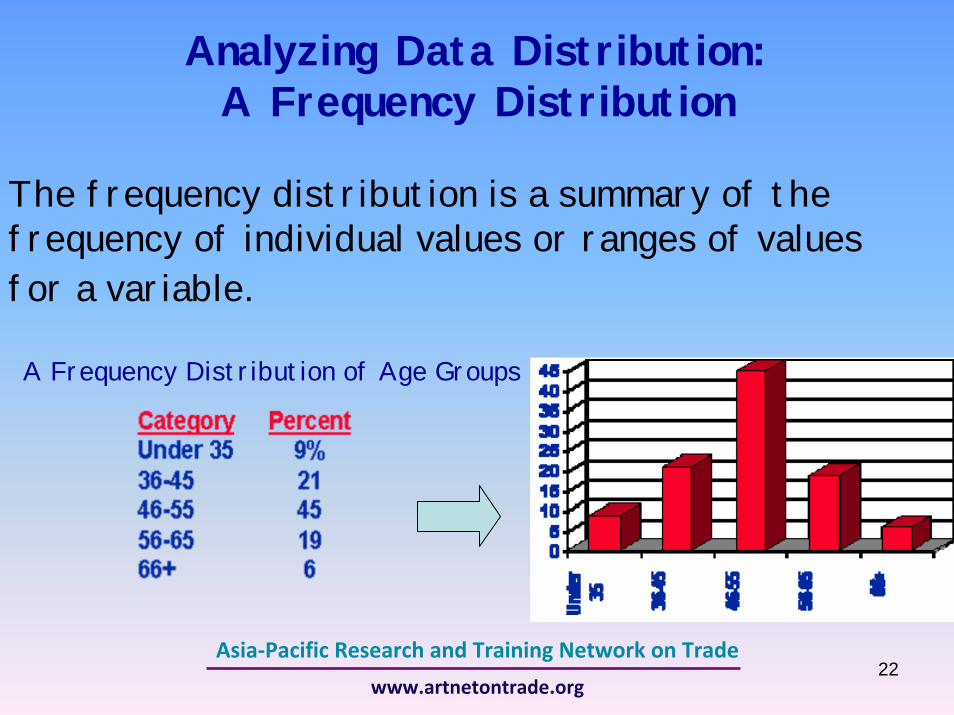
Analyzing Data Distribution: A Frequency Distribution
The frequency distribution is a summary of the frequency of individual values or ranges of values for a variable.
A Frequency Distribution of Age Groups

23Asia‐Pacific Research and Training Network on Trade
www.artnetontrade.org
Normal DistributionWe usually expect normal distribution of the data observations if we performed random sampling.
Normal Distribution
If the mean of our example is 20.5 and the standard deviation is 7.5, we can estimate that approximately 95% of the scores will fall in the range of 20.5-(2*7.5) to 20.5+(2*7.5) or between 4.5 and 35.5
1 SD-1 SD
2 SD-2 SD

24Asia‐Pacific Research and Training Network on Trade
www.artnetontrade.org
Analyzing Relationships between Variables
• Scattered-plot diagram• Cross tabulation (Pivot Table)• Regression analysis
25Asia‐Pacific Research and Training Network on Trade
www.artnetontrade.org
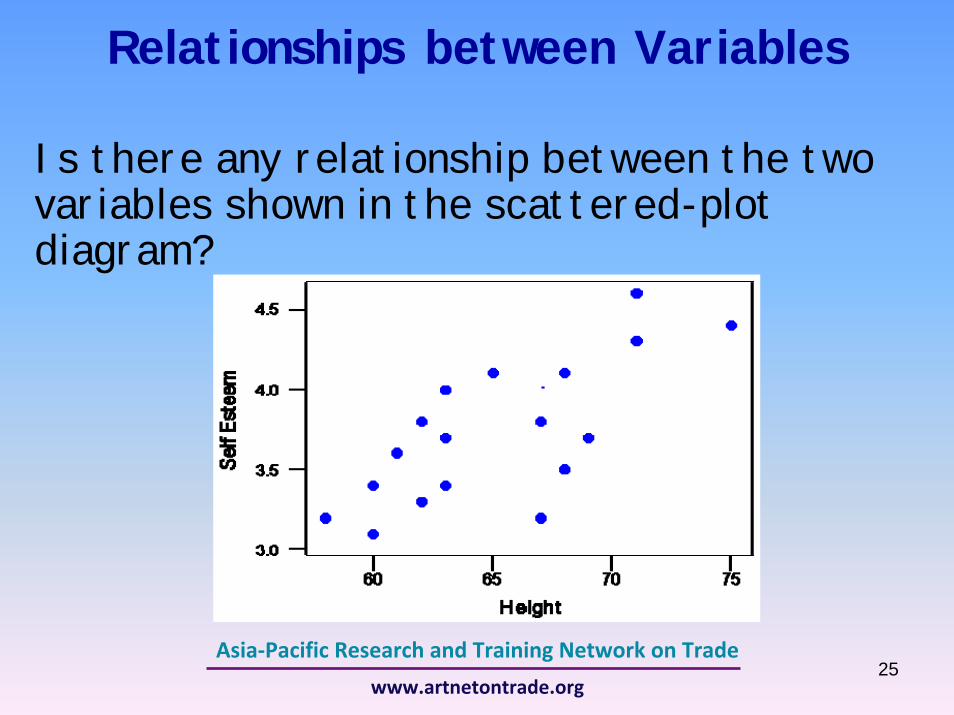
Relationships between Variables
Is there any relationship between the two variables shown in the scattered-plot diagram?
26Asia‐Pacific Research and Training Network on Trade
www.artnetontrade.org
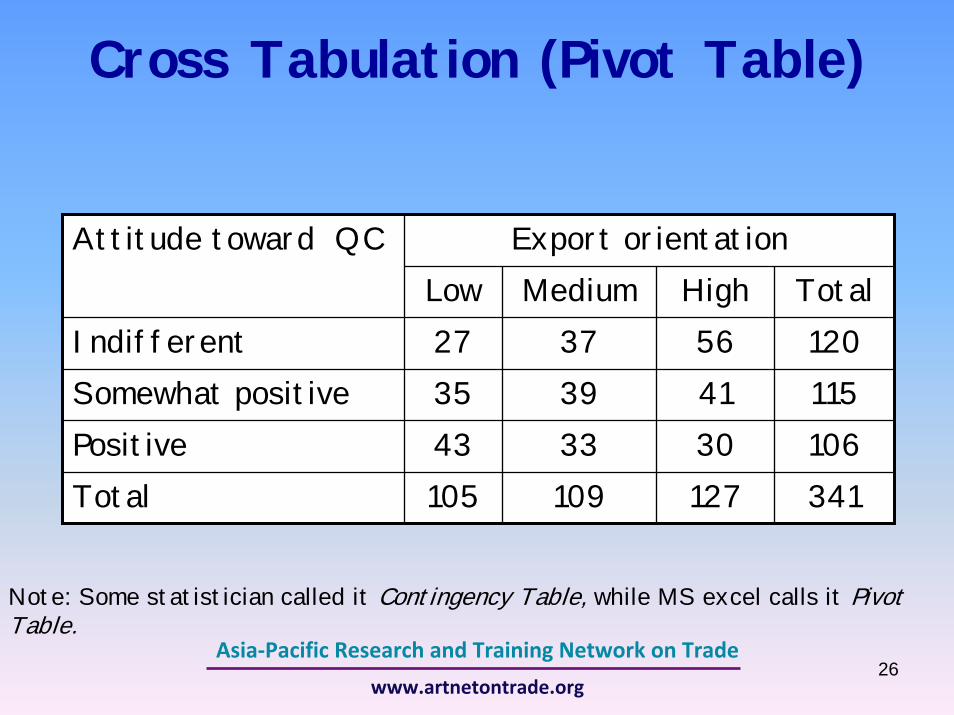
Cross Tabulation (Pivot Table)
Export orientationAttitude toward QCLow Medium High Total
Indifferent 27 37 56 120Somewhat positive 35 39 41 115Positive 43 33 30 106Total 105 109 127 341
Note: Some statistician called it Contingency Table, while MS excel calls it Pivot Table.

27Asia‐Pacific Research and Training Network on Trade
www.artnetontrade.org
Interpretation (1)
Distribution of attitude variable.
Export orientationAttitude toward QCLow Medium High Total
Indifferent 120Somewhat positive 115Positive 106Total 105 109 127 341
Distribution of export-orientation variable.
35%34%31%
100%
100%
Does the sample bias toward particular attitude?
Does the sample bias toward particular firm types?

28Asia‐Pacific Research and Training Network on Trade
www.artnetontrade.org
Interpretation (2)
Distribution of attitudes forhigh export firms.
Export orientationAttitude toward QC Low Medium High TotalIndifferent 56Somewhat positive 41Positive 43 33 30 106Total 127
Distribution of export-orientation for positive attitude toward QC.
• Is attitude toward QC associated with export orientation of the firms?
• Do the firms with a positive attitude toward QC tend to be low or high export-orientation firms?
• Do the firms with high export-orientation tend to be positive or indifferent toward QC?
29Asia‐Pacific Research and Training Network on Trade
www.artnetontrade.org
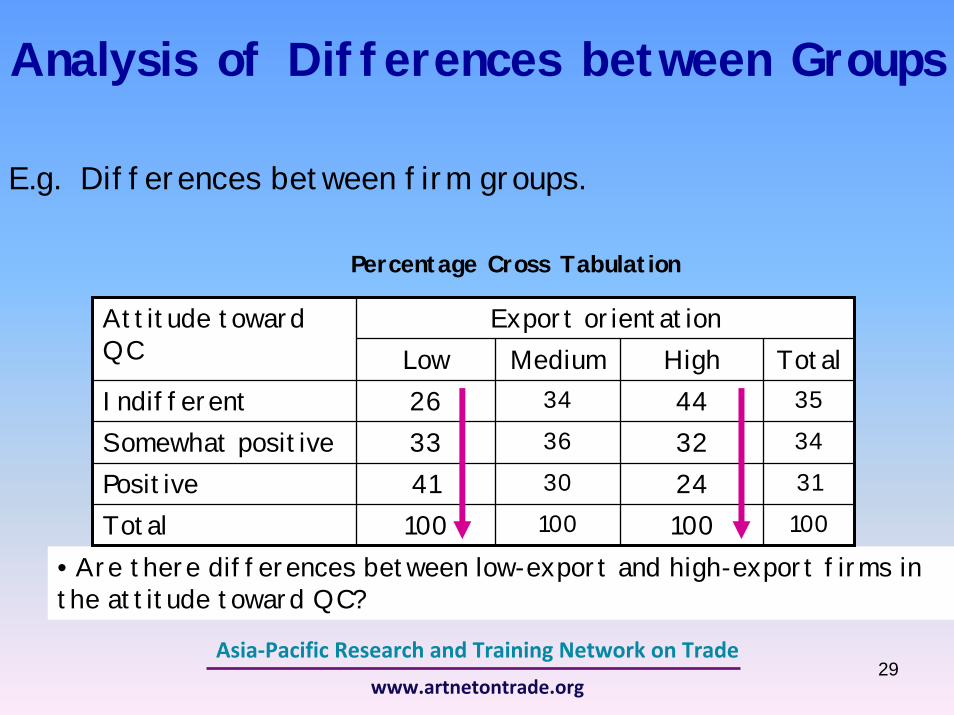
Analysis of Differences between Groups
• Are there differences between low-export and high-export firms in the attitude toward QC?
Export orientationAttitude toward QC Low Medium High TotalIndifferent 26 34 44 35
Somewhat positive 33 36 32 34
Positive 41 30 24 31
Total 100 100 100 100
E.g. Differences between firm groups.
Percentage Cross Tabulation
30Asia‐Pacific Research and Training Network on Trade
www.artnetontrade.org
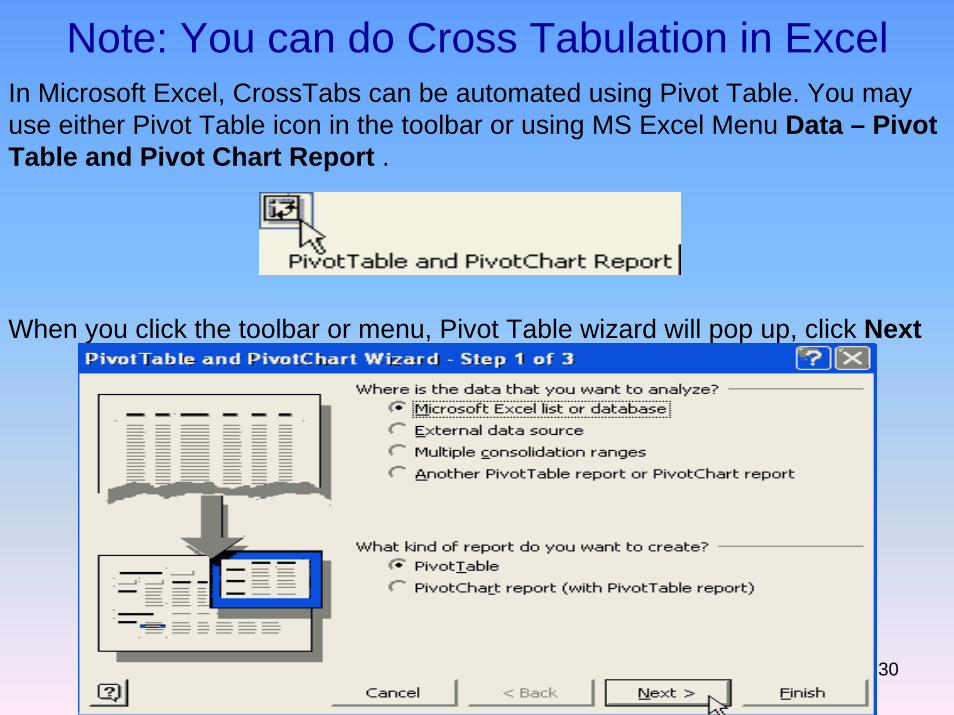
Note: You can do Cross Tabulation in ExcelIn Microsoft Excel, CrossTabs can be automated using Pivot Table. You may use either Pivot Table icon in the toolbar or using MS Excel Menu Data – Pivot Table and Pivot Chart Report .
When you click the toolbar or menu, Pivot Table wizard will pop up, click Next
31Asia‐Pacific Research and Training Network on Trade
www.artnetontrade.org
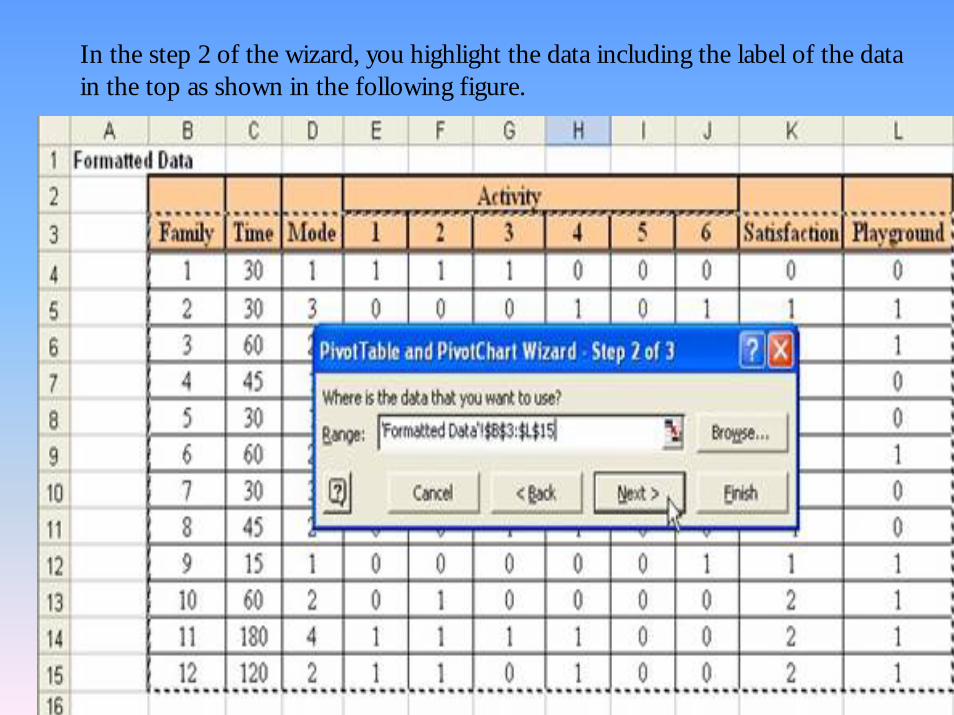
In the step 2 of the wizard, you highlight the data including the label of the data in the top as shown in the following figure.

32Asia‐Pacific Research and Training Network on Trade
www.artnetontrade.org
In step 3 of the Pivot Table Wizard, select Layout button.
33Asia‐Pacific Research and Training Network on Trade
www.artnetontrade.org
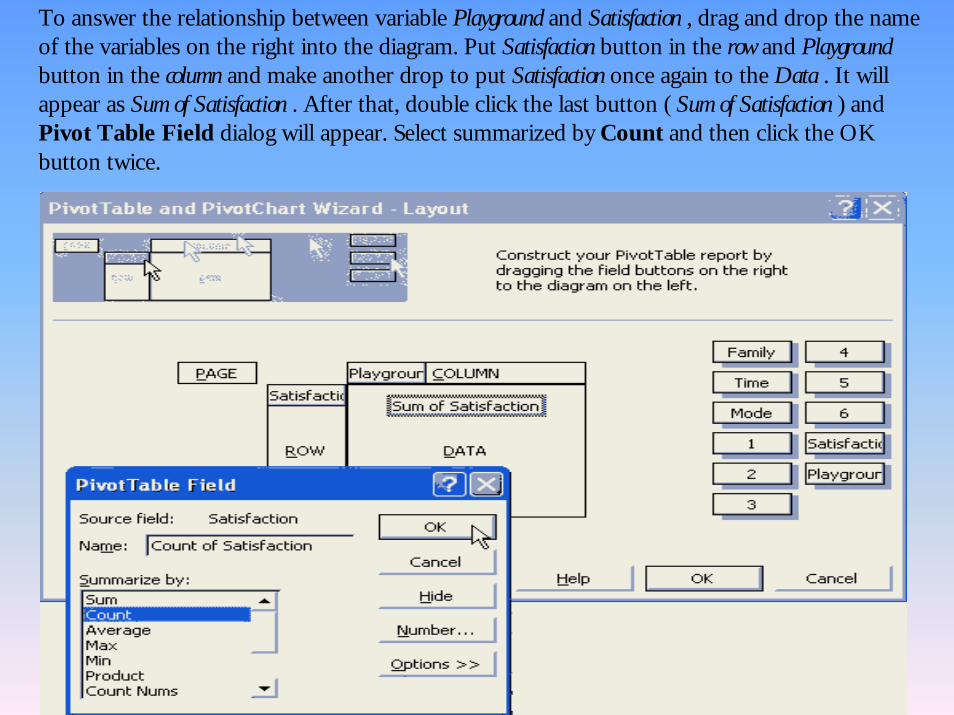
To answer the relationship between variable Playground and Satisfaction , drag and drop the name of the variables on the right into the diagram. Put Satisfaction button in the row and Playground button in the column and make another drop to put Satisfaction once again to the Data . It will appear as Sum of Satisfaction . After that, double click the last button ( Sum of Satisfaction ) and Pivot Table Field dialog will appear. Select summarized by Count and then click the OK button twice.
34Asia‐Pacific Research and Training Network on Trade
www.artnetontrade.org
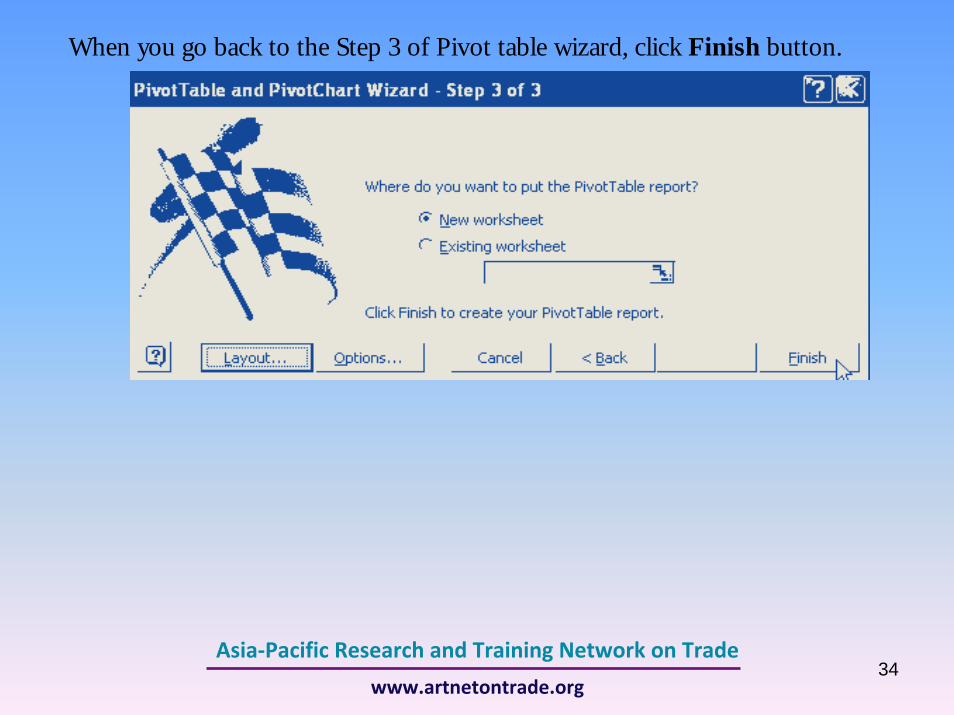
When you go back to the Step 3 of Pivot table wizard, click Finish button.
35Asia‐Pacific Research and Training Network on Trade
www.artnetontrade.org
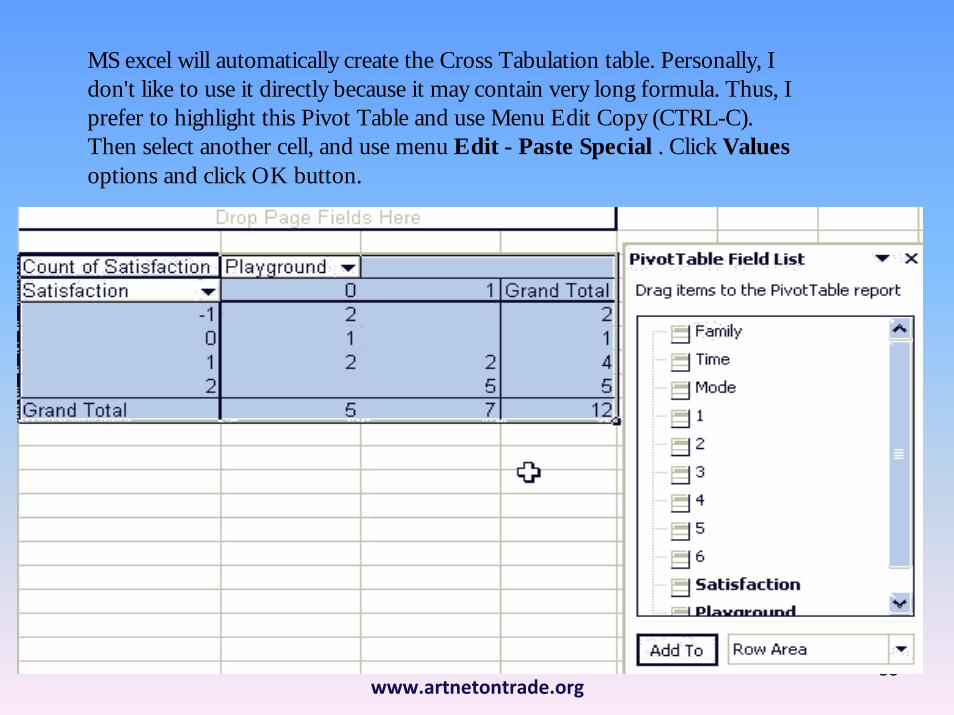
MS excel will automatically create the Cross Tabulation table. Personally, I don't like to use it directly because it may contain very long formula. Thus, I prefer to highlight this Pivot Table and use Menu Edit Copy (CTRL-C). Then select another cell, and use menu Edit - Paste Special . Click Values options and click OK button.

36Asia‐Pacific Research and Training Network on Trade
www.artnetontrade.org
Key Considerations• Watch the "n" (number of observations)- Be wary
of small samples.– If there are few respondents in a particular category,
you should NOT trust the data, or at least, you should look for much stronger trends before trusting the results.
For example, can we make a conclusion if we found that…
Case A) 38% of sample (8 observations) said they have not had a problem competing with imports from China.
Case B) 88% of sample (8 observations) said they have not had a problem competing with imports from China.

37Asia‐Pacific Research and Training Network on Trade
www.artnetontrade.org
• Knowing whether a relationship is strong enough or not strong enough with smaller respondent numbers takes some practice and experience.
• What you really want to know is whether the relationship is "statistically significant". – This type of analysis is rather technical.
38Asia‐Pacific Research and Training Network on Trade
www.artnetontrade.org
Introduction to Regression Analysis• Regression Analysis
A technique for using data to identify relationships among variables and use these relationships to make predictions.
39Asia‐Pacific Research and Training Network on Trade
www.artnetontrade.org
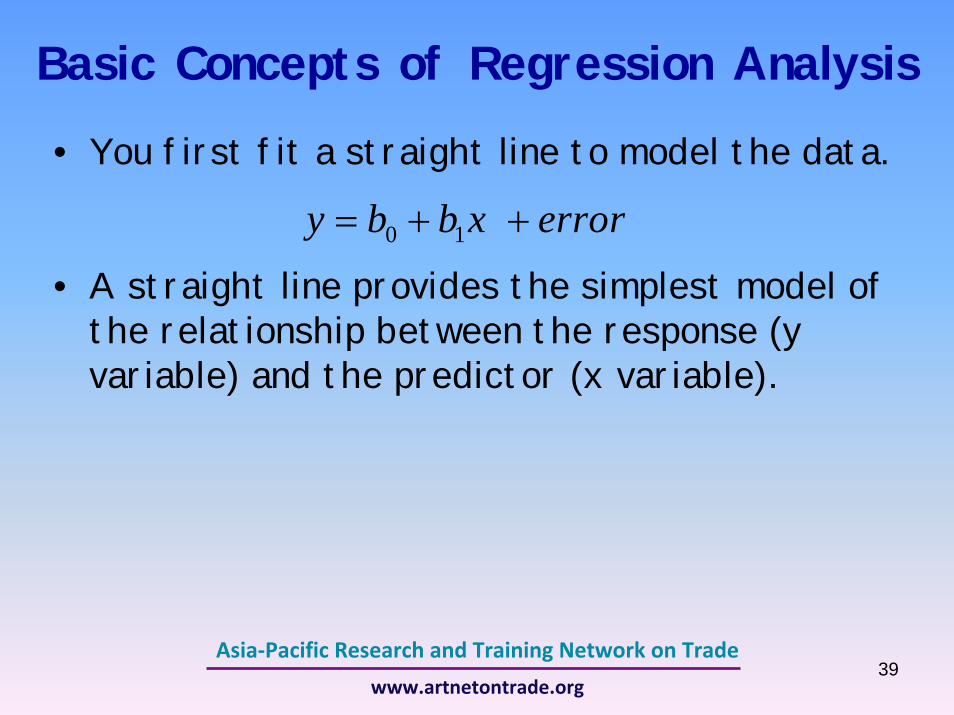
Basic Concepts of Regression Analysis
• You first fit a straight line to model the data.
• A straight line provides the simplest model of the relationship between the response (y variable) and the predictor (x variable).
0 1y b b x error= + +
40Asia‐Pacific Research and Training Network on Trade
www.artnetontrade.org
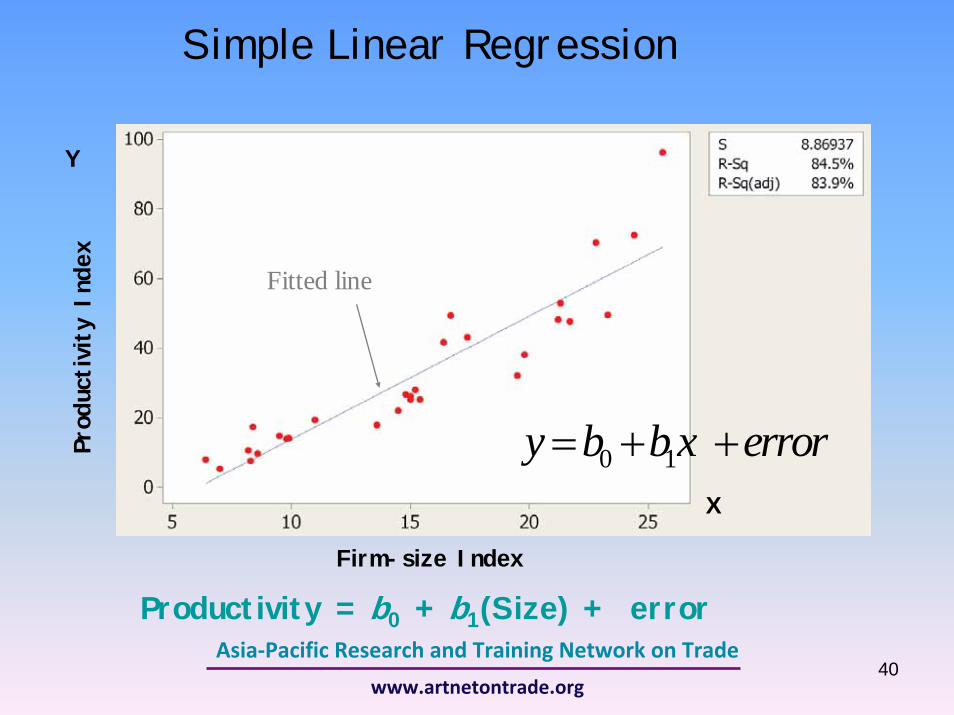
Simple Linear RegressionPr
oduc
tivity
Ind
ex
Firm-size Index
Productivity = b0 + b1(Size) + error
0 1y b bx error= + +X
Y
Fitted line

41Asia‐Pacific Research and Training Network on Trade
www.artnetontrade.org
0 1y b b x error= + +
coefficientsDependent variable
Independent variable
How far is the fitted line from the data.
• The size of the coefficient gives you the size of the effect that variable is having on your dependent variable.
• The sign on the coefficient (positive or negative) gives you the direction of the effect.
42Asia‐Pacific Research and Training Network on Trade
www.artnetontrade.org
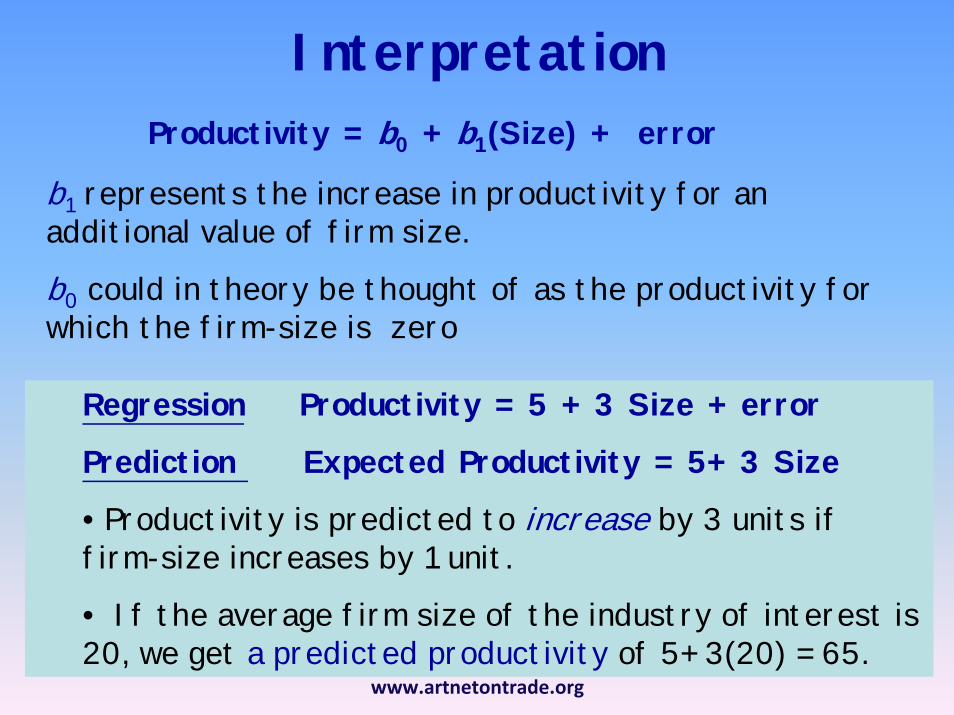
Productivity = b0 + b1(Size) + error
Regression Productivity = 5 + 3 Size + error
Prediction Expected Productivity = 5+ 3 Size
• Productivity is predicted to increase by 3 units if firm-size increases by 1 unit.
• If the average firm size of the industry of interest is 20, we get a predicted productivity of 5+ 3(20) = 65.
b1 represents the increase in productivity for an additional value of firm size.
b0 could in theory be thought of as the productivity for which the firm-size is zero
Interpretation
43Asia‐Pacific Research and Training Network on Trade
www.artnetontrade.org
Your turn!
What is the following regression telling? Market share = 100 – 0.2 (labor cost) + error
44Asia‐Pacific Research and Training Network on Trade
www.artnetontrade.org
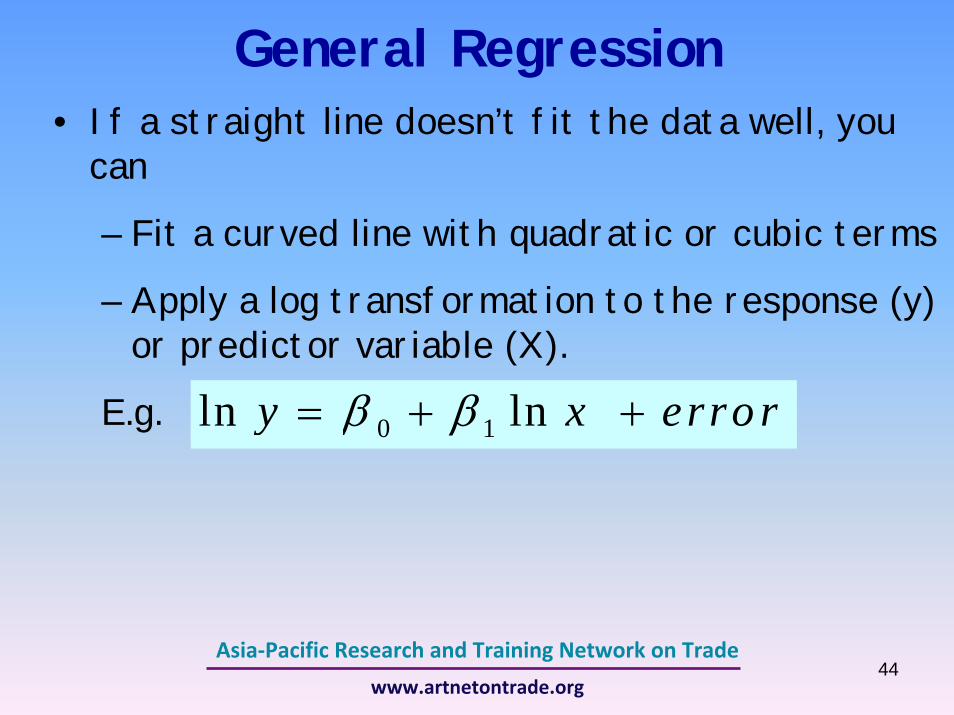
General Regression• If a straight line doesn’t fit the data well, you
can
– Fit a curved line with quadratic or cubic terms
– Apply a log transformation to the response (y) or predictor variable (X).
E.g. 0 1ln lny x erro rβ β= + +

45Asia‐Pacific Research and Training Network on Trade
www.artnetontrade.org
A regression model may need more than one dependent variable to adequately describe the response (Y variable).
This is called “Multiple Regression”.
• The coefficient tells you how much the response is expected to increase when that independent variable increases by one, holding all the other independent variables constant.
0 1 1 2 2 3 3y b b x b x b x error= + + + +
46Asia‐Pacific Research and Training Network on Trade
www.artnetontrade.org
E.g. What is the regression telling?
export price = 120 -3 (exchange rate) + 1.7 (wage) + e

47Asia‐Pacific Research and Training Network on Trade
www.artnetontrade.org
Regression Output
Estimated Coefficient
SE t statistic P value
constant 41.36 37.82 1.094 0.280
Real wage -15.85*** 2.88 5.500 0.000
Investment 0.64 0.27 0.236 0.814
Labor Productivity
2.42*** 0.81 2.992 0.004
Note: Statistical significance at the 1 percent, 5 percent and 10 percent levels is indicated by ***, **, and *.
0 1 2 3Export share = b +b ( ) b ( ) b ( . .)realwage investment L prod e+ + +R square = 0.646
Adjusted R square = 0.613Prob>F =0.000

48Asia‐Pacific Research and Training Network on Trade
www.artnetontrade.org
Interpretation of a regression output (1)1) Are the independent (X) variables having a
genuine effect on the response (Y) ?
1.1 Look for a small “P value” in a regression output. – “P value” tells you how confident you can be that each
individual variable has some correlation with the dependent variable. It is also called significant level.
– “P < 0.05" is the most common standard threshold for statistical significance.
• It says there is a 95% probability of being correct that the variable is having some effect, assuming your model is specified correctly.
49Asia‐Pacific Research and Training Network on Trade
www.artnetontrade.org
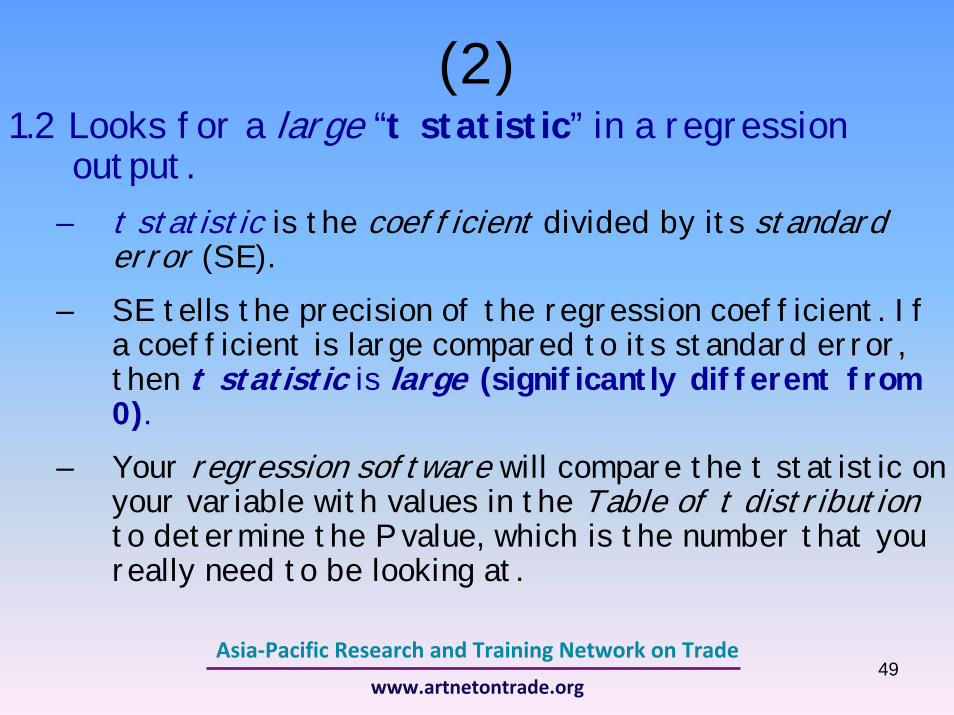
(2)1.2 Looks for a large “t statistic” in a regression
output. – t statistic is the coefficient divided by its standard
error (SE). – SE tells the precision of the regression coefficient. If
a coefficient is large compared to its standard error, then t statistic is large (significantly different from 0).
– Your regression software will compare the t statistic on your variable with values in the Table of t distributionto determine the P value, which is the number that you really need to be looking at.
50Asia‐Pacific Research and Training Network on Trade
www.artnetontrade.org
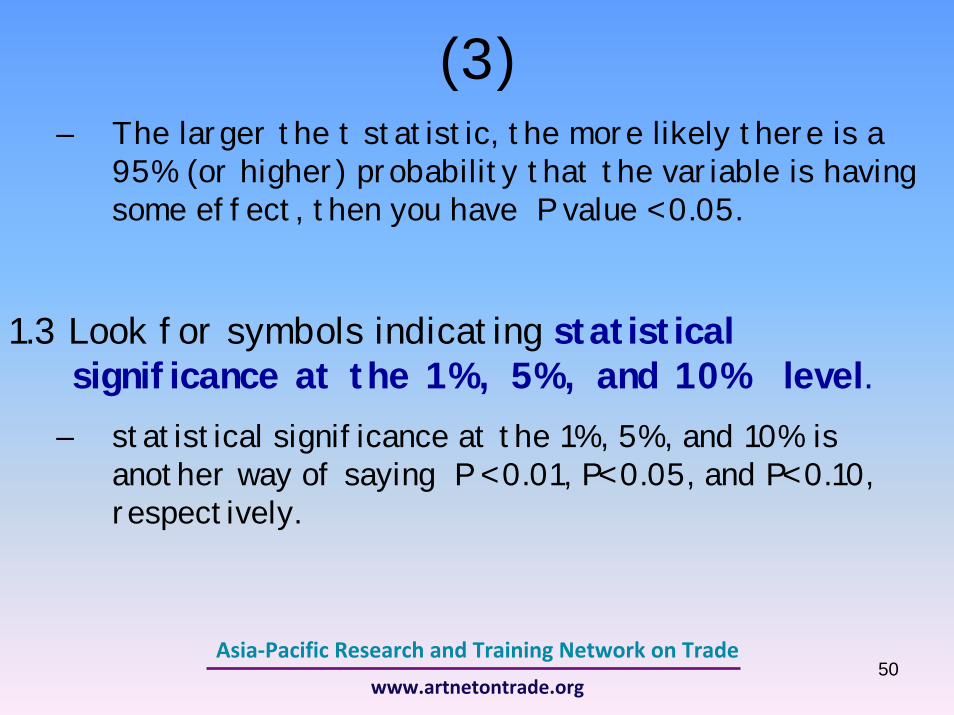
– The larger the t statistic, the more likely there is a 95% (or higher) probability that the variable is having some effect, then you have P value < 0.05.
1.3 Look for symbols indicating statistical significance at the 1%, 5%, and 10% level.
– statistical significance at the 1%, 5%, and 10% is another way of saying P < 0.01, P< 0.05, and P< 0.10, respectively.
(3)

51Asia‐Pacific Research and Training Network on Trade
www.artnetontrade.org
2) Whether your regression model is making accurate predictions?
- Look for “R-squared (R2) ” close to 100%. - It says how much of dependent variable (Y) has been
explained by the regression model.Ex. What is meant by R2 = 100% ?
3) Is there any explanatory variable missing from the model?
- See whether “Adjusted R square ( )” is significantly lower than R2.
- It usually says that there are some explanatory variables missing from the model
2R
(4)
52Asia‐Pacific Research and Training Network on Trade
www.artnetontrade.org
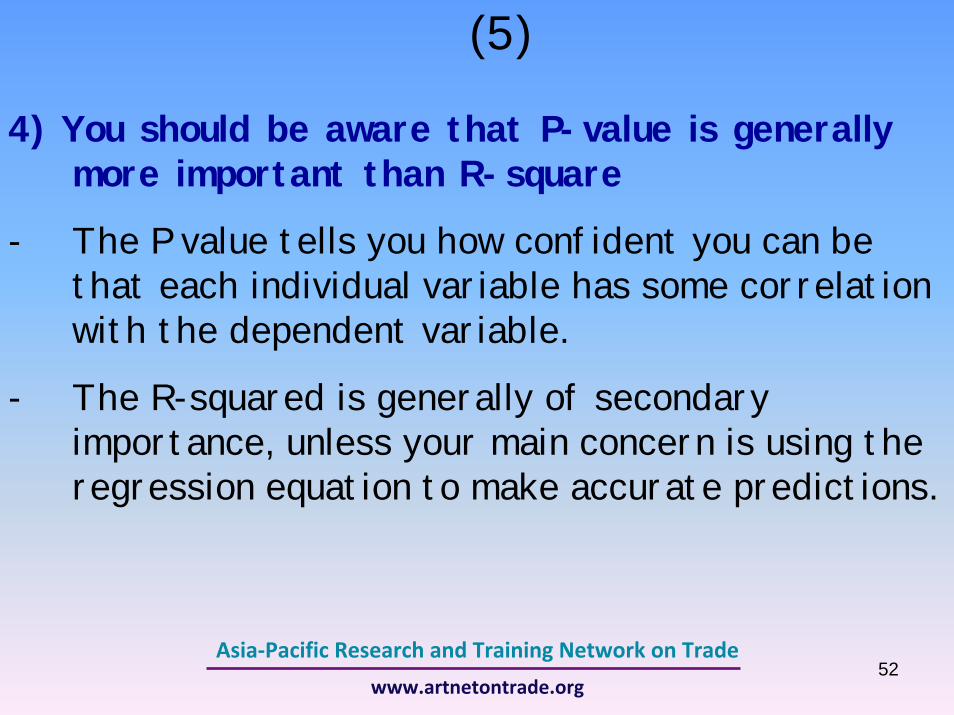
4) You should be aware that P-value is generally more important than R-square
- The P value tells you how confident you can be that each individual variable has some correlation with the dependent variable.
- The R-squared is generally of secondary importance, unless your main concern is using the regression equation to make accurate predictions.
(5)
53Asia‐Pacific Research and Training Network on Trade
www.artnetontrade.org
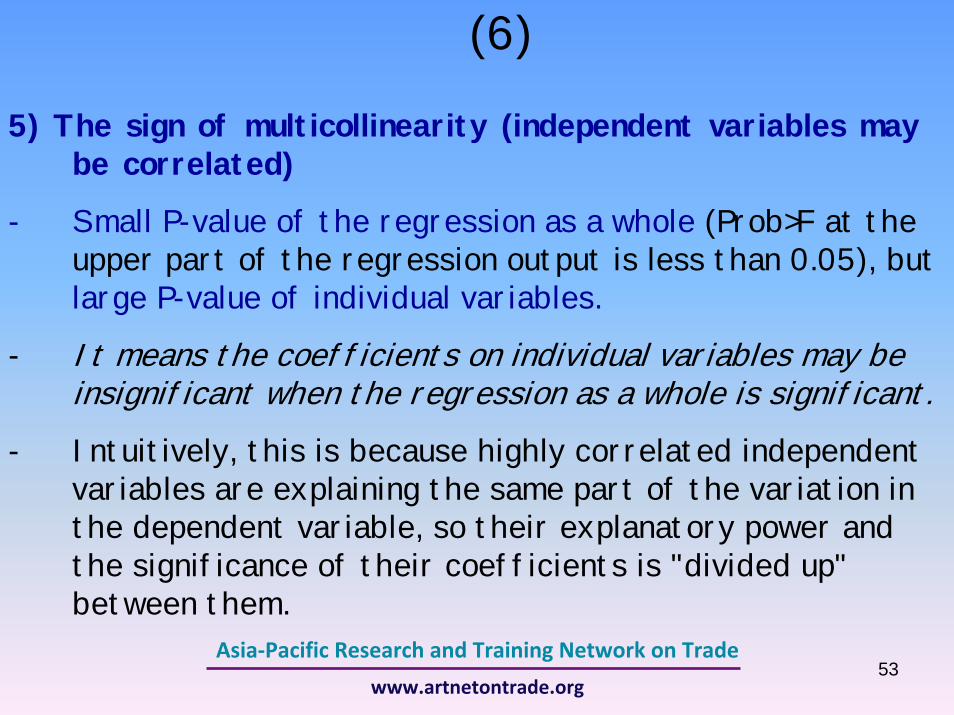
5) The sign of multicollinearity (independent variables may be correlated)
- Small P-value of the regression as a whole (Prob>F at the upper part of the regression output is less than 0.05), but large P-value of individual variables.
- It means the coefficients on individual variables may be insignificant when the regression as a whole is significant.
- Intuitively, this is because highly correlated independent variables are explaining the same part of the variation in the dependent variable, so their explanatory power and the significance of their coefficients is "divided up" between them.
(6)

54Asia‐Pacific Research and Training Network on Trade
www.artnetontrade.org
Regression Methods and Choosing Criteria
55Asia‐Pacific Research and Training Network on Trade
www.artnetontrade.org
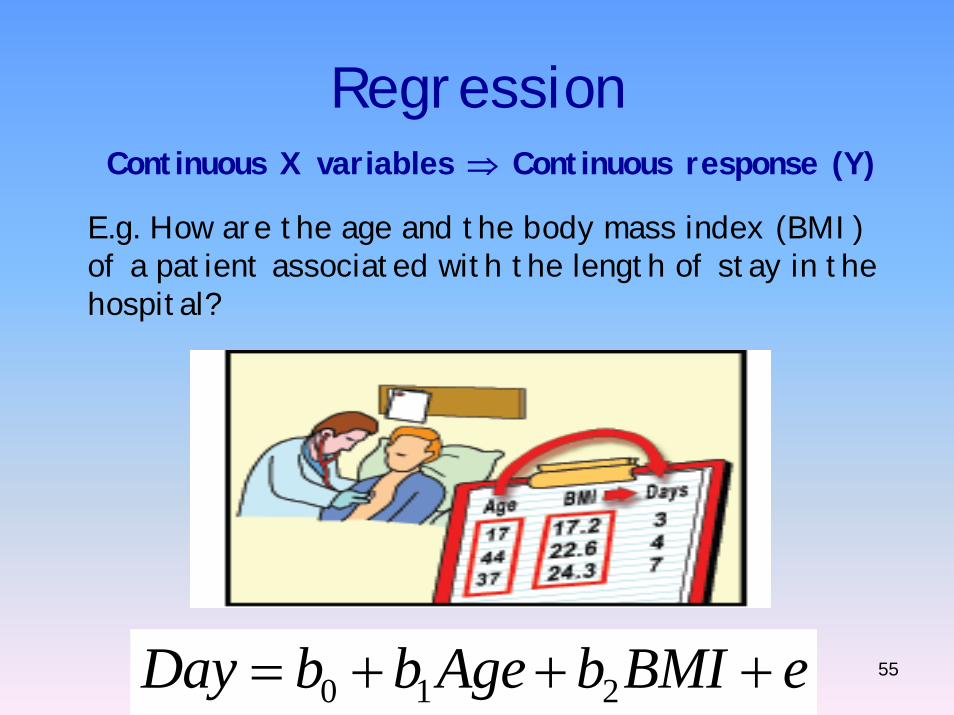
RegressionContinuous X variables ⇒ Continuous response (Y)
E.g. How are the age and the body mass index (BMI) of a patient associated with the length of stay in the hospital?
0 1 2Day b b Age b BMI e= + + +

56Asia‐Pacific Research and Training Network on Trade
www.artnetontrade.org
General Linear ModelCategorical X variables ⇒ Continuous response (Y)
How is the payment method and the day of the week associated with the cost of a transaction?

57Asia‐Pacific Research and Training Network on Trade
www.artnetontrade.org
0 1 2Cost b b DayDummy b MethodDummy e= + + +
Day (x1) Dummy Value
Mon 0,1
Tue 0,1
Wed 0,1
Method(x2) Dummy Value
Credit 0,1
Cash 0,1
Check 0,1
58Asia‐Pacific Research and Training Network on Trade
www.artnetontrade.org
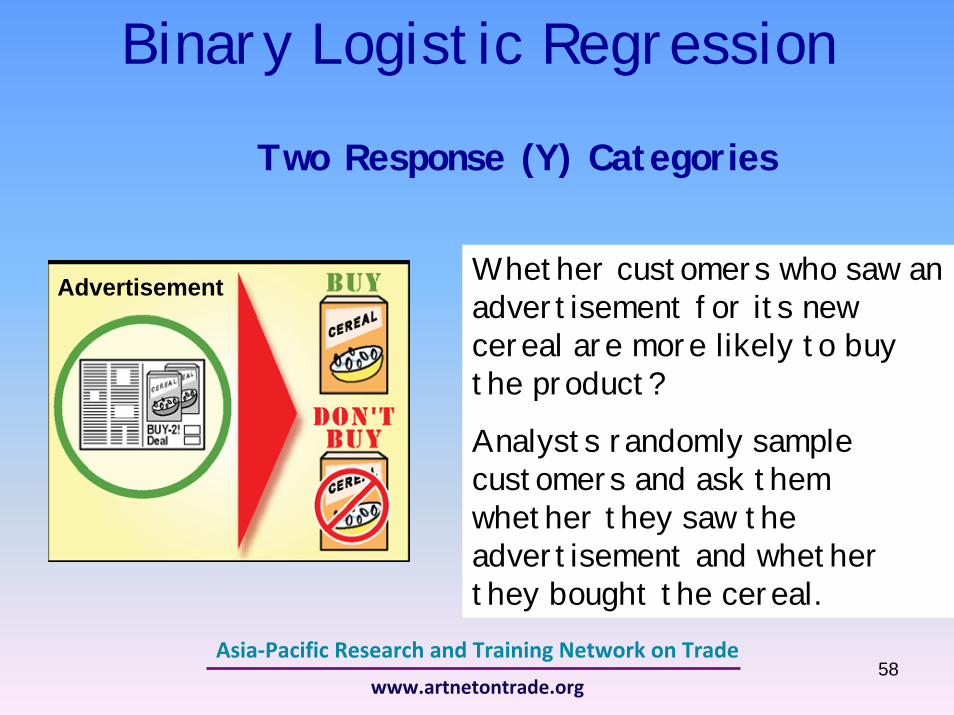
Binary Logistic Regression
Two Response (Y) Categories
Whether customers who saw an advertisement for its new cereal are more likely to buy the product?
Analysts randomly sample customers and ask them whether they saw the advertisement and whether they bought the cereal.
Advertisement

59Asia‐Pacific Research and Training Network on Trade
www.artnetontrade.org
Decision (y) Coding
Buy 1
Don’t buy 0
( )Pr( ) .Decision f Ad Dummy e= +
Binary Logistic Regression
Two Response (Y) Categories
Advertisement

60Asia‐Pacific Research and Training Network on Trade
www.artnetontrade.org
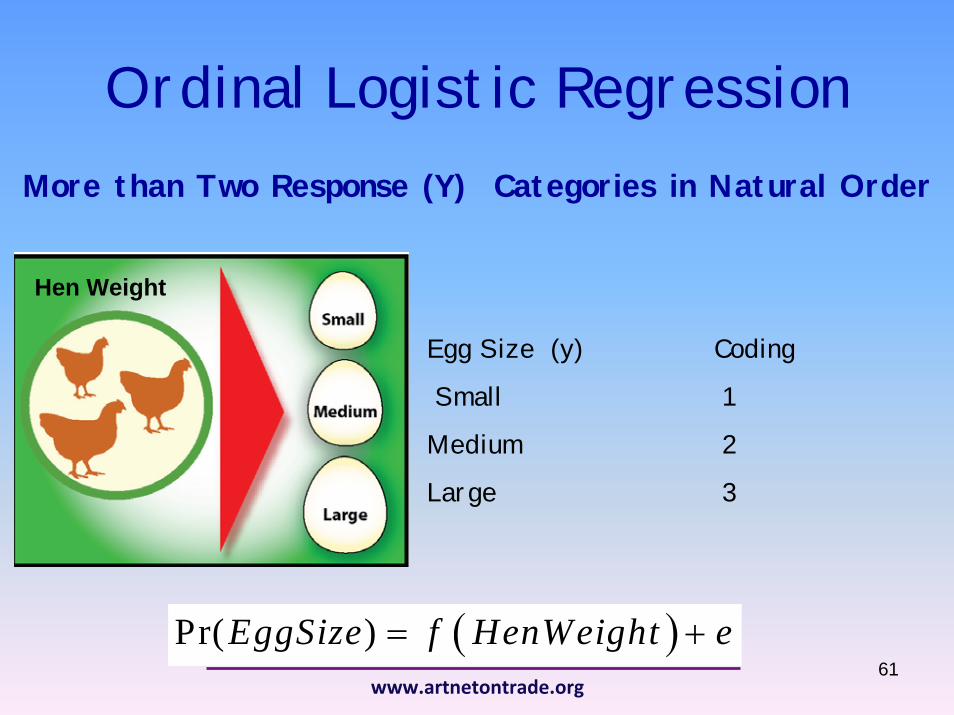
Ordinal Logistic RegressionMore than Two Response (Y) Categories in Natural Order
Whether the weight of a hen is related to the size of its eggs?
They randomly sample hens, record the weight of each hen, and classify the size of its eggs as small, medium, or large.
Hen Weight
61Asia‐Pacific Research and Training Network on Trade
www.artnetontrade.org
Ordinal Logistic RegressionMore than Two Response (Y) Categories in Natural Order
Egg Size (y) Coding
Small 1
Medium 2
Large 3
( )Pr( )EggSize f HenWeight e= +
Hen Weight
62Asia‐Pacific Research and Training Network on Trade
www.artnetontrade.org
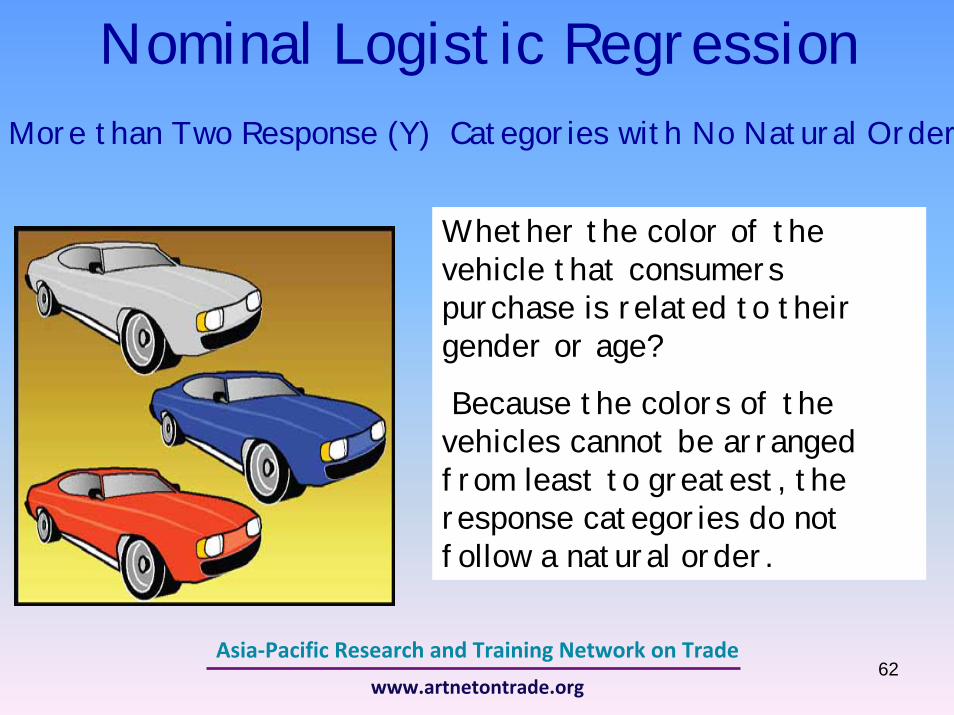
Nominal Logistic RegressionMore than Two Response (Y) Categories with No Natural Order
Whether the color of the vehicle that consumers purchase is related to their gender or age?
Because the colors of the vehicles cannot be arranged from least to greatest, the response categories do not follow a natural order.

63Asia‐Pacific Research and Training Network on Trade
www.artnetontrade.org
Nominal Logistic RegressionMore than Two Response (Y) Categories with No Natural Order
Color (y) Dummy Value
Silver 0,1
Blue 0,1
Red 0,1
( )P r( )C olor f Age e= +
64Asia‐Pacific Research and Training Network on Trade
www.artnetontrade.org
Potential Misuses of Statistics
• Manipulating the scale to change the appearance of the distribution of data
• Eliminating high/low scores for more coherent presentation
• Inappropriately focusing on certain variables to the exclusion of other variables
• Presenting correlation as causation
65Asia‐Pacific Research and Training Network on Trade
www.artnetontrade.org
Conclusion• Statistical analysis is just one way of
working with observable information.• It consists of tests used to analyze data.
These tests provide an analytical framework within which researchers can pursue their research questions.
• However, statistical tests may be misused, resulting in potential misinterpretation and misrepresentation.

66Asia‐Pacific Research and Training Network on Trade
www.artnetontrade.org
Reading• Sykes, A. An Introduction to Regression Analysis.
Inaugural Coase Lecture. Chicago Working Paper in Law & Economics.
• US General Accounting Office (1992), Quantitative Data Analysis: An Introduction. Report to Program Evaluation and Methodology Division.
• Colorado State University. Introduction to Statistics.http://writing.colostate.edu/guides/research/stats/index.cfm.
• William M.K. Trochim (2006). Research Methods Knowledge Base. http://www.socialresearchmethods.net/kb/index.php