servqual-ahp - chow and look
TRANSCRIPT
A strategic service quality approachusing analytic hierarchy process
Clare Chua Chow and Peter LukRyerson University, Toronto, Canada
Abstract
Purpose – The paper aims to develop a technique that considers competition using the analytichierarchy process (AHP) framework to measure service quality.
Design/methodology/approach – The present study adapted the AHP methodology to themeasurement of service quality, involving five steps – referred to as “analytical hierarchy process forservice quality” (“AHP-SQ”). Subsequently, the authors demonstrate how the technique can be appliedto the fast-food restaurants.
Findings – The AHP-SQ approach described in this study thus assists management to devise andmaintain a relevant, competitive plan for ongoing improvements in service quality. Specifically, suchanalysis enables the following questions to be addressed: “How does the firm perform in terms ofservice quality in relation to its competitors?”; “Given the firm’s resources, which service initiativeswill enhance its service competitiveness?”; “Which service areas require immediate improvement?”;“How should the firm’s service improvement be prioritized?”, and “What opportunities exist for serviceimprovement in relation to the competition?”
Research limitations/implications – It would be important to consider the “right” dimensions ofservice quality that are relevant to the respective industry. It would also be essential to collectresponses from customers who have utilized the services of the focal firm as well as its competitors inorder to have an accurate opinion.
Practical implications – The framework proposed here allows management to address two mainissues pertaining to its competitive advantage: establishing its performance ranking in themarketplace; and identifying the service elements that most require improvement.
Originality/value – The paper develops a cohesive approach to help managers identify whichreliability, assurance, tangibles, empathy, responsiveness (RATER) service dimensions require attentionto create a sustainable competitive advantage. It offers a “bigger picture” in service-quality management.
Keywords SERVQUAL, Analytical hierarchy process, Gap analysis, Customer satisfaction,Competitive strategy, Service quality assurance
Paper type Research paper
IntroductionIn the presence of fierce competition, service firms strive to stay in the forefront oftoday’s marketplace by offering quality service. Research has shown that servicequality is an essential strategy for winning and retaining customers (Ghobadian et al.,1994; Buzzell and Gale, 1987, Zeithaml, 2000). Indeed, the quality of service is moreimportant than price in differentiating a service firm from its competitors and infostering customer loyalty (Kandampully and Suhartanto, 2000, 2003). Delivering
The Emerald Research Register for this journal is available at The current issue and full text archive of this journal is available at
www.emeraldinsight.com/researchregister www.emeraldinsight.com/0960-4529.htm
The authors would like to thank the editor and all the reviewers of this article for their valuablecomments. Also they wish to thank Professor Martin Evans and Professor Dan Remenyi forreviewing this article prior to submission to the journal. The authors gratefully acknowledgeDr Ross Gilham for his assistance. The authors propose that collected data from fast foodrestaurants to help them illustrate that service quality can be managed with their proposedapproach.
MSQ15,3
278
Managing Service QualityVol. 15 No. 3, 2005pp. 278-289q Emerald Group Publishing Limited0960-4529DOI 10.1108/09604520510597827

quality service is thus vital if firms are to increase market share and profitability.However, in attempting to increase market share, most assessments of service qualitydo not consider the strategies of competitors. Parasuraman et al. (1990) noted that it isessential for a service firm to compare its strengths and weaknesses against those of itscompetitors when developing priorities for service improvement. The present paperdevelops an approach that will assist managers in prioritizing aspects of serviceimprovement – while taking account of the service priorities of competitors.
The approach advocated here assists management in addressing the followingquestions:
. How does the firm perform in terms of service quality in relation to itscompetitors?
. Given the firm’s resources, which service initiatives will enhance its servicecompetitiveness?
. Which service areas require immediate improvement?
. How should the firm’s service improvement be prioritized?
. What opportunities exist for service improvement in relation to the competition?
Literature reviewMeasuring service quality is a challenging task because the concept of service qualityis inherently intangible in nature and difficult to define (Kandampully, 1997).Measuring improvements in service quality is even more challenging (Parasuramanet al., 1990). Commonly used techniques for measuring service quality include customerservice audits (Takeuchi and Quelch, 1983), gap analysis (Zeithaml et al., 1988),SERVQUAL (Parasuraman et al., 1988), SERVPERF (Cronin and Taylor, 1994), criticalincident technique (Bitner et al., 1990), and sequential incident technique (Stauss andWeinlich, 1997). A common feature of all these methods is that they all focus onmeasuring internal service quality without considering the strategies of competitors.As Min and Min (1997, p. 582) pointed out with respect to SERVQUAL: “[It] alone maynot help evaluate the firm’s comparative service performance”.
Such consideration of competitors is important. Indeed, Parasuraman et al. (1990)provided five guidelines for conducting service-quality research – one of which wasmeasuring service performance in relation to competition. In response to this need, afew instruments have been developed that include an assessment of the competition inmeasuring service quality. Parasuraman et al. (1988), Min and Min (1996, 1997), andMin et al. (2002) all attempted to measure competitive service quality. Moreover,Parasuraman et al. (1990) suggested adapting the SERVQUAL instrument to measureservice quality in relation to competition. SERVQUAL is a well-established“gap-assessment” methodology that can be used to develop service-improvementinitiatives by examining the “gap” between expectations and perceptions. The adaptedSERVQUAL instrument (Parasuraman et al., 1991) uses a non-comparative evaluationmodel – that is, customers of firm A are asked to state their perception or theirexpectation of firm A’s services and another group of customers are asked to state theirperception or their expectation of firm B’s services. After obtaining the perceptions andexpectations, the SERVQUAL scores are calculated and gaps between the two firmsare assessed.
In addition to this adaptation, Johns and Tyas (1996) have extended the use ofSERVQUAL to include competitors. Moreover, Fick and Ritchie (1991) have employed
A strategicservice quality
approach
279
the SERVQUAL instrument to compare services provided by various types oforganizations within the travel and tourism industry.
The difficulty with these approaches is that SERVQUAL requires the collection ofseveral sets of data to do a competitive analysis. For example, if SERVQUAL is used toconduct a comparative analysis of three firms, three sets of questionnaires are required;each with 44 statements – assuming the original 22 items of Parasuraman et al. (1988).Authors have questioned the value and purpose of the separate data sets (Johns andTyas, 1996).
The present study takes a different perspective. Rather than use a non-comparativemodel, the approach advocated here uses a comparative evaluation model – that is, thecustomers are asked to compare firm A and firm B with regard to a service dimension,and then rate their satisfaction level for either firm A or B. The paper develops acohesive approach using analytic hierarchy process (AHP) to help managers identifywhich reliability, assurance, tangibles, empathy, responsiveness (RATER) servicedimensions require attention to create a sustainable competitive advantage. AHP isused as a comparative service-improvement technique for two reasons. First, the AHPtechnique allows pairwise comparisons to be made among the alternatives with respectto the service dimensions. This provides a more meaningful analysis for developing acompetitive set of service attributes that will satisfy customers and assist the serviceprovider in outperforming its competitors. Second, to determine comparative serviceperformances, AHP requires the collection of only one set of data – as opposed toseveral sets with the adapted SERVQUAL instrument.
Conceptual framework for the studyThe AHP technique, which was developed by Saaty (1980, 1990, 1994), uses a processof pairwise comparisons to determine the relative importance (and thus the priority) ofalternatives in a multi-criteria decision-making problem. AHP involves decomposing acomplex and unstructured problem into a set of variables that are organized into ahierarchy (as shown in Figure 1). It enables decision-makers to make choices among anumber of alternatives and criteria by formulating priorities and making a series oftradeoffs. Although the AHP technique was originally developed for solvingmulti-criteria decision-making problems, its practicality and versatility has allowedAHP to be widely applied in many different areas – including marketing (Wind andSaaty, 1980) and accounting/auditing (Arrington et al., 1984). Zahedi (1989) hasprovided a comprehensive survey of the application of AHP.
The present study adapted the AHP methodology to the measurement of servicequality. The industry chosen for the study was the “fast-food” restaurant industry. Theservice quality problem was structured into a two-level hierarchical form (as shown inFigure 1). The first level – the “service-dimension level” – addressed the relativeimportance of various service dimensions in defining service quality. Customers wereasked to compare pairs of service dimensions (for example, “tangibles” versus“reliability”) and to indicate whether they felt that one dimension was “equal to”, “moreimportant than” or “less important than” another dimension. The second level of thehierarchy – the “choice level” – compared the performance of service providers (in thiscase, fast-food restaurants) with respect to the service dimensions. The customers wereasked to state their preference for the restaurants in a pairwise manner on a nine-pointrelational satisfaction scale.
MSQ15,3
280
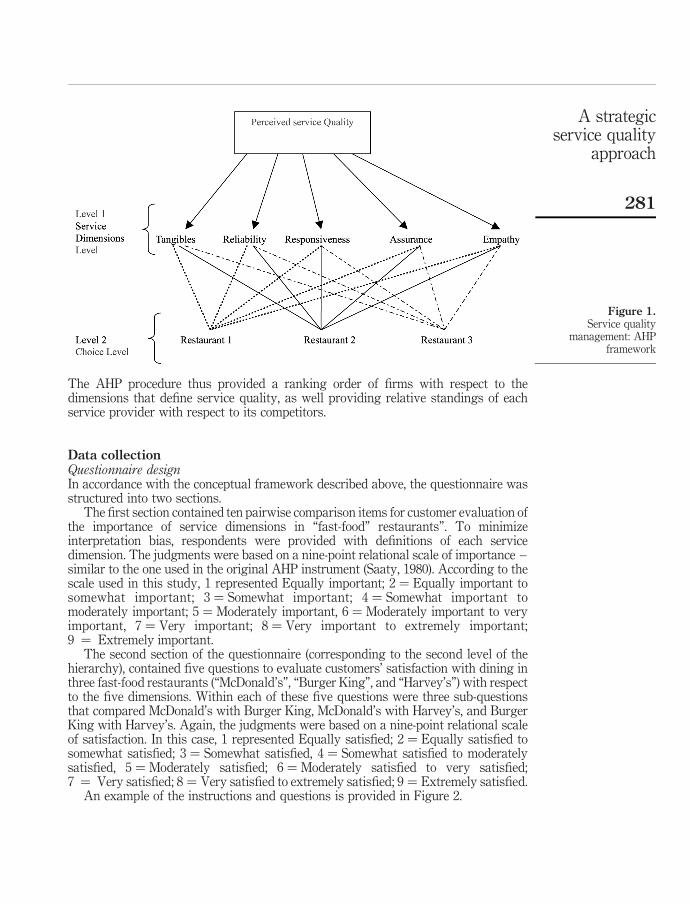
The AHP procedure thus provided a ranking order of firms with respect to thedimensions that define service quality, as well providing relative standings of eachservice provider with respect to its competitors.
Data collectionQuestionnaire designIn accordance with the conceptual framework described above, the questionnaire wasstructured into two sections.
The first section contained ten pairwise comparison items for customer evaluation ofthe importance of service dimensions in “fast-food” restaurants”. To minimizeinterpretation bias, respondents were provided with definitions of each servicedimension. The judgments were based on a nine-point relational scale of importance –similar to the one used in the original AHP instrument (Saaty, 1980). According to thescale used in this study, 1 represented Equally important; 2 ¼ Equally important tosomewhat important; 3 ¼ Somewhat important; 4 ¼ Somewhat important tomoderately important; 5 ¼ Moderately important, 6 ¼ Moderately important to veryimportant, 7 ¼ Very important; 8 ¼ Very important to extremely important;9 ¼ Extremely important.
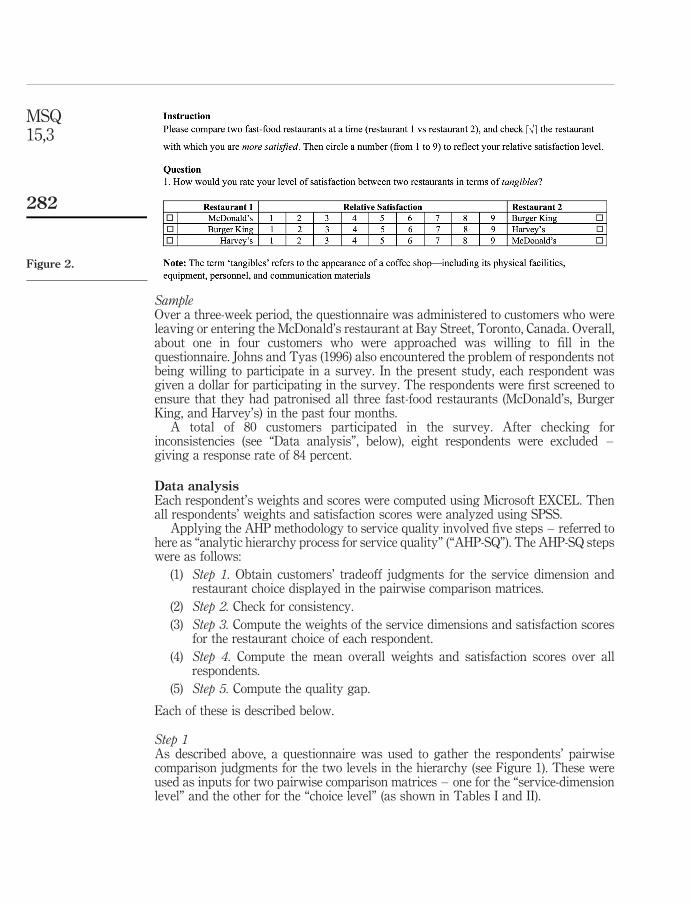
The second section of the questionnaire (corresponding to the second level of thehierarchy), contained five questions to evaluate customers’ satisfaction with dining inthree fast-food restaurants (“McDonald’s”, “Burger King”, and “Harvey’s”) with respectto the five dimensions. Within each of these five questions were three sub-questionsthat compared McDonald’s with Burger King, McDonald’s with Harvey’s, and BurgerKing with Harvey’s. Again, the judgments were based on a nine-point relational scaleof satisfaction. In this case, 1 represented Equally satisfied; 2 ¼ Equally satisfied tosomewhat satisfied; 3 ¼ Somewhat satisfied, 4 ¼ Somewhat satisfied to moderatelysatisfied, 5 ¼ Moderately satisfied; 6 ¼ Moderately satisfied to very satisfied;7 ¼ Very satisfied; 8 ¼ Very satisfied to extremely satisfied; 9 ¼ Extremely satisfied.
An example of the instructions and questions is provided in Figure 2.
Figure 1.Service quality
management: AHPframework
A strategicservice quality
approach
281
SampleOver a three-week period, the questionnaire was administered to customers who wereleaving or entering the McDonald’s restaurant at Bay Street, Toronto, Canada. Overall,about one in four customers who were approached was willing to fill in thequestionnaire. Johns and Tyas (1996) also encountered the problem of respondents notbeing willing to participate in a survey. In the present study, each respondent wasgiven a dollar for participating in the survey. The respondents were first screened toensure that they had patronised all three fast-food restaurants (McDonald’s, BurgerKing, and Harvey’s) in the past four months.
A total of 80 customers participated in the survey. After checking forinconsistencies (see “Data analysis”, below), eight respondents were excluded –giving a response rate of 84 percent.
Data analysisEach respondent’s weights and scores were computed using Microsoft EXCEL. Thenall respondents’ weights and satisfaction scores were analyzed using SPSS.
Applying the AHP methodology to service quality involved five steps – referred tohere as “analytic hierarchy process for service quality” (“AHP-SQ”). The AHP-SQ stepswere as follows:
(1) Step 1. Obtain customers’ tradeoff judgments for the service dimension andrestaurant choice displayed in the pairwise comparison matrices.
(2) Step 2. Check for consistency.
(3) Step 3. Compute the weights of the service dimensions and satisfaction scoresfor the restaurant choice of each respondent.
(4) Step 4. Compute the mean overall weights and satisfaction scores over allrespondents.
(5) Step 5. Compute the quality gap.
Each of these is described below.
Step 1As described above, a questionnaire was used to gather the respondents’ pairwisecomparison judgments for the two levels in the hierarchy (see Figure 1). These wereused as inputs for two pairwise comparison matrices – one for the “service-dimensionlevel” and the other for the “choice level” (as shown in Tables I and II).
Figure 2.
MSQ15,3
282
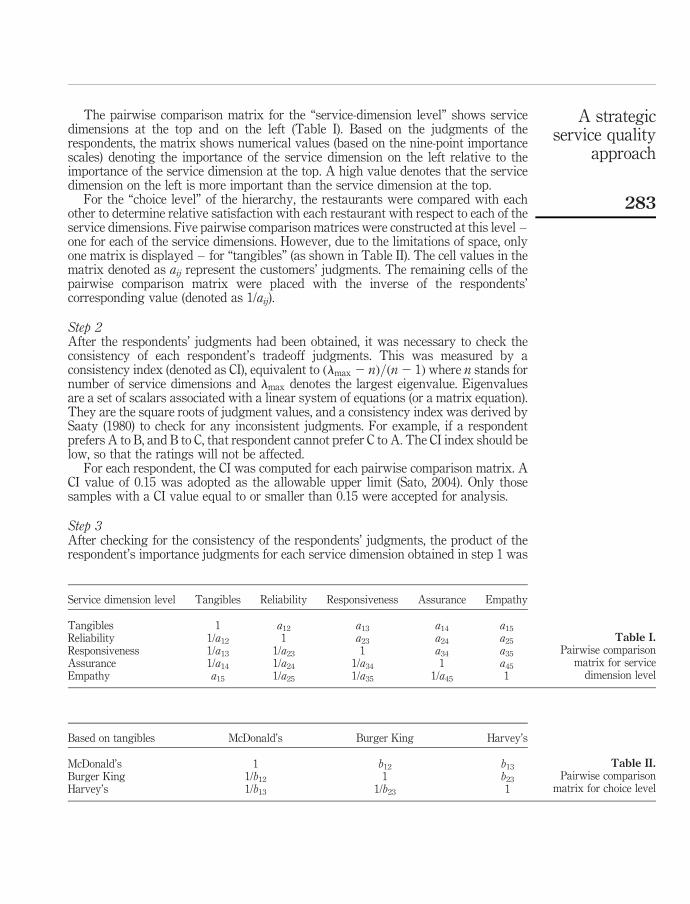
The pairwise comparison matrix for the “service-dimension level” shows servicedimensions at the top and on the left (Table I). Based on the judgments of therespondents, the matrix shows numerical values (based on the nine-point importancescales) denoting the importance of the service dimension on the left relative to theimportance of the service dimension at the top. A high value denotes that the servicedimension on the left is more important than the service dimension at the top.
For the “choice level” of the hierarchy, the restaurants were compared with eachother to determine relative satisfaction with each restaurant with respect to each of theservice dimensions. Five pairwise comparison matrices were constructed at this level –one for each of the service dimensions. However, due to the limitations of space, onlyone matrix is displayed – for “tangibles” (as shown in Table II). The cell values in thematrix denoted as aij represent the customers’ judgments. The remaining cells of thepairwise comparison matrix were placed with the inverse of the respondents’corresponding value (denoted as 1/aij).
Step 2After the respondents’ judgments had been obtained, it was necessary to check theconsistency of each respondent’s tradeoff judgments. This was measured by aconsistency index (denoted as CI), equivalent to ðlmax 2 nÞ=ðn2 1Þ where n stands fornumber of service dimensions and lmax denotes the largest eigenvalue. Eigenvaluesare a set of scalars associated with a linear system of equations (or a matrix equation).They are the square roots of judgment values, and a consistency index was derived bySaaty (1980) to check for any inconsistent judgments. For example, if a respondentprefers A to B, and B to C, that respondent cannot prefer C to A. The CI index should below, so that the ratings will not be affected.
For each respondent, the CI was computed for each pairwise comparison matrix. ACI value of 0.15 was adopted as the allowable upper limit (Sato, 2004). Only thosesamples with a CI value equal to or smaller than 0.15 were accepted for analysis.
Step 3After checking for the consistency of the respondents’ judgments, the product of therespondent’s importance judgments for each service dimension obtained in step 1 was
Service dimension level Tangibles Reliability Responsiveness Assurance Empathy
Tangibles 1 a12 a13 a14 a15
Reliability 1/a12 1 a23 a24 a25
Responsiveness 1/a13 1/a23 1 a34 a35
Assurance 1/a14 1/a24 1/a34 1 a45
Empathy a15 1/a25 1/a35 1/a45 1
Table I.Pairwise comparison
matrix for servicedimension level
Based on tangibles McDonald’s Burger King Harvey’s
McDonald’s 1 b12 b13
Burger King 1/b12 1 b23
Harvey’s 1/b13 1/b23 1
Table II.Pairwise comparison
matrix for choice level
A strategicservice quality
approach
283

noted, and the fifth root of the product was then calculated to obtain the relativeweights. The rows in the pairwise comparison matrix were then added together. Theweights were then normalized by computing the sum of each row and then dividingeach row by the corresponding sum.
The same computation procedure was performed for the respondent’s satisfactionratings of the fast-food restaurants. These were then converted into satisfaction scores(or priorities).
Step 4The results obtained in step 3 were then synthesized. The overall satisfaction scorewas obtained by multiplying the weights with the satisfaction scores. All therespondents’ overall satisfaction scores were then averaged to obtain a mean overallsatisfaction score for each restaurant. The mean overall satisfaction score was used torank the restaurants. The restaurant with the highest score was regarded as the“market leader”.
Step 5The quality gap (QGapi) of each service dimension was derived from the discrepancybetween the satisfaction scores of the focal firm (McDonald’s) and that of the bestperformer (referred to as the “market leader” in step 4). The mathematical form of thequality gap was defined as follows:
QGapi ¼ SiF 2 SiM ;i
where:
QGapi ¼ quality gap for dimension i;
i ¼ service dimension (tangibles, reliability, responsiveness, assurance,empathy);
SiF ¼ satisfaction scores for dimension i of the focal restaurant; and
SiM ¼ satisfaction scores for dimension i of the market leader.
A positive value for QGapi indicates that the focal firm outperformed the market leaderon the dimension i. A negative gap indicates that the focal firm underperformedrelative to the market leader. A QGapi value of zero means that the focal firmperformed well on the dimension i compared with the market leader.
Findings and discussionThe findings are summarized in Tables III and IV. As previously noted, McDonald’swas selected as the focal firm in this study for illustrative purposes. In other words,McDonald’s could use this study to establish which service dimensions should beimproved to achieve a competitive advantage.
Table III shows the mean importance ranking of the service dimensions. The resultsshow that the customers regarded “empathy” as the highest priority in assessingservice quality of a “fast-food” restaurant. It is apparent that it is important for arestaurant to provide a caring and personalized service to customers. Customersregarded “tangibles” (the appearance of the restaurant’s physical facilities, equipment,personnel, and communication materials) as the second most important dimension ofservice quality. “Assurance”, defined as the knowledge and courtesy of a restaurant’s
MSQ15,3
284
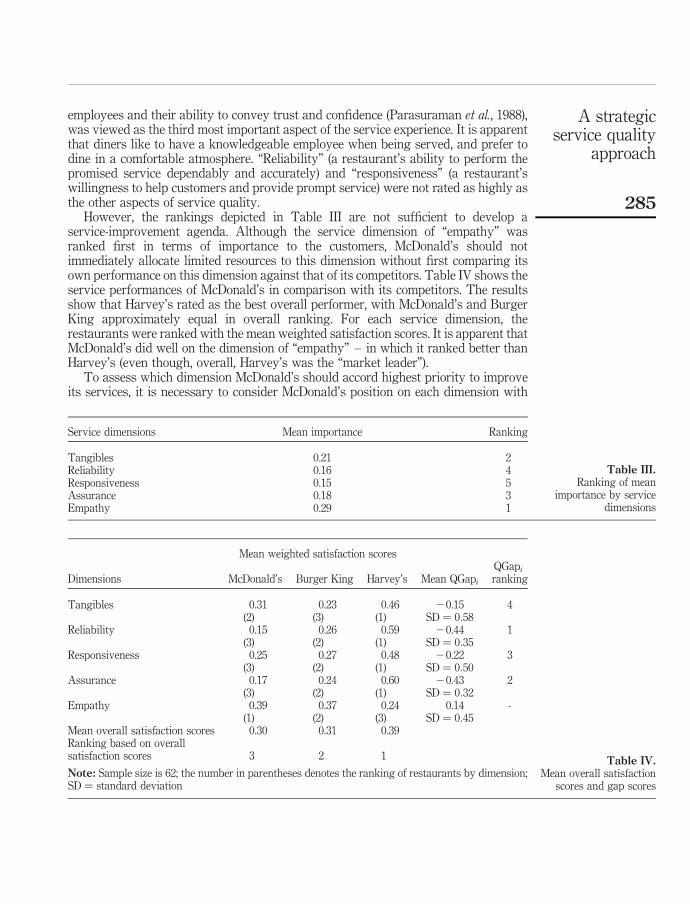
employees and their ability to convey trust and confidence (Parasuraman et al., 1988),was viewed as the third most important aspect of the service experience. It is apparentthat diners like to have a knowledgeable employee when being served, and prefer todine in a comfortable atmosphere. “Reliability” (a restaurant’s ability to perform thepromised service dependably and accurately) and “responsiveness” (a restaurant’swillingness to help customers and provide prompt service) were not rated as highly asthe other aspects of service quality.
However, the rankings depicted in Table III are not sufficient to develop aservice-improvement agenda. Although the service dimension of “empathy” wasranked first in terms of importance to the customers, McDonald’s should notimmediately allocate limited resources to this dimension without first comparing itsown performance on this dimension against that of its competitors. Table IV shows theservice performances of McDonald’s in comparison with its competitors. The resultsshow that Harvey’s rated as the best overall performer, with McDonald’s and BurgerKing approximately equal in overall ranking. For each service dimension, therestaurants were ranked with the mean weighted satisfaction scores. It is apparent thatMcDonald’s did well on the dimension of “empathy” – in which it ranked better thanHarvey’s (even though, overall, Harvey’s was the “market leader”).
To assess which dimension McDonald’s should accord highest priority to improveits services, it is necessary to consider McDonald’s position on each dimension with
Service dimensions Mean importance Ranking
Tangibles 0.21 2Reliability 0.16 4Responsiveness 0.15 5Assurance 0.18 3Empathy 0.29 1
Table III.Ranking of mean
importance by servicedimensions
Mean weighted satisfaction scores
Dimensions McDonald’s Burger King Harvey’s Mean QGapi
QGapiranking
Tangibles 0.31 0.23 0.46 20.15 4(2) (3) (1) SD ¼ 0:58
Reliability 0.15 0.26 0.59 20.44 1(3) (2) (1) SD ¼ 0:35
Responsiveness 0.25 0.27 0.48 20.22 3(3) (2) (1) SD ¼ 0:50
Assurance 0.17 0.24 0.60 20.43 2(3) (2) (1) SD ¼ 0:32
Empathy 0.39 0.37 0.24 0.14 -(1) (2) (3) SD ¼ 0:45
Mean overall satisfaction scores 0.30 0.31 0.39Ranking based on overallsatisfaction scores 3 2 1
Note: Sample size is 62; the number in parentheses denotes the ranking of restaurants by dimension;SD ¼ standard deviation
Table IV.Mean overall satisfaction
scores and gap scores
A strategicservice quality
approach
285

respect to its competitors. Having established Harvey’s as the market leader, the meanQGapi for McDonald’s was calculated for each dimension. Four out of the fivedimensions had negative QGapi values. This implies that McDonald’s under-performsin the dimensions of “tangibles”, “reliability”, “responsiveness”, and “assurance” whencompared with Harvey’s. To develop a strategy of service improvement, it is necessaryto prioritize these services. The largest QGapi negative value implies that a largesatisfaction discrepancy exists between the focal firm and the market leader.McDonald’s “reliability” dimension ranked first in this respect – which implies that itneeds to improve its ability to perform its services dependably and accurately.“Assurance” ranked second on the “gap” (only slightly below “reliability”) – and thisshould therefore be the second priority. McDonald’s should then focus on“responsiveness”, followed by “tangibles”. The customers rated McDonald’s highlyon the “empathy” dimension relative to Harvey’s and Burger King.
Managerial implications and recommendationsMany restaurants utilize “customer feedback” cards to obtain information on customerperceptions of the quality of service. Such cards typically pose questions about thevarious dimensions of customer service – including questions on the knowledge of theserver, the timeliness of the service, and the physical appearance of the restaurant. It isimportant to note that such customer-satisfaction surveys seek feedback only fromcustomers who attend the restaurant responsible for the survey; and the surveys askquestions only about the service at that particular restaurant. Whether theserespondents are (or have been) customers of competitors is ignored, and their opinionson competitors are also ignored. Data collected from such survey methods are clearlyinsufficient for devising an adequate competitive strategy. The approach presented inthis paper addresses this issue. When applied correctly, the comparative knowledgethat can be obtained from the methods described in this study can drastically improveimportant business outcomes.
Adapting the AHP methodology in the manner proposed in this paper allowsmanagers to prioritize service dimensions and to compute a gap analysis in a way thatprovides a competitive perspective in managing service quality. Applying thisapproach, managers are able to address the following questions:
. What is the firm’s competitive position, and how does the firm’s overallperformance compare with its competitors?
. Which service dimensions can be improved to enhance competitiveness?
. Constrained by limited resources, which service dimensions should be given toppriority?
The framework proposed here allows management to address two main issuespertaining to its competitive advantage:
(1) establishing its performance ranking in the marketplace; and
(2) identifying the service elements that most require improvement.
In particular, the satisfaction disparity indicates which dimension the firm shouldconcentrate on to enhance its competitive position.
Creating a competitive advantage does give a firm an edge over its competitors.However, customers have many alternatives, and a competitive advantage might notnecessarily be sustained. Even if customers are satisfied with the services of a given
MSQ15,3
286

firm at the present time, they might find that they are even more satisfied with acompetitors’ improved services. All strategies that strive for a competitive advantagemust be constantly market-driven and market-aware. This can be achieved only if theopinions of customers about competitors are known. The AHP-SQ approach describedin the present study thus assists management to devise and maintain a relevant,competitive plan for ongoing improvements in service quality. It offers a “biggerpicture” in service-quality management.
Limitations and research directionsAlthough the customers in the present study had visited all three “fast-food”restaurants during the preceding four months, a limitation of the present study is thatit did not investigate switching behavior among the respondents. Future researchcould address this question.
A further limitation in the present approach is that it does not provide guidance onaction to be taken. Although it identifies which service dimensions requireimprovement, the present framework does not provide guidance on an appropriateaction plan to address deficiencies. Future studies could extend the framework in thisrespect.
A third limitation is that the framework adopted only the SERVQUAL servicedimensions. Future studies could consider incorporating other dimensions inextending the framework proposed here.
With respect to generalizability, although the model was applied in the presentstudy to “fast-food” restaurants, the authors believe that it could be used by a varietyof service industries to evaluate service performance against that of competitors.
References
Arrington, C.E., Hillison, W. and Jensen, R. (1984), “An application of analytical hierarchyprocess to model expert judgments on analytical review procedures”, Journal ofAccounting Research, Vol. 22 No. 1, pp. 298-312.
Bitner, M.J., Booms, B.H. and Tetreault, M.S. (1990), “The service encounter diagnosingfavourable and unfavourable incidents”, Journal of Marketing, Vol. 54 No. 1, pp. 71-84.
Buzzell, R.D. and Gale, B.T. (1987), The PIMS Principles: Linking Strategy to Performance, FreePress, New York, NY.
Cronin, J. Jr and Taylor, S. (1994), “SERVPERF versus SERVQUAL: reconcilingperformance-based and perception-minus-expectations measurement of service quality”,Journal of Marketing, Vol. 58, pp. 125-31.
Fick, G.R. and Ritchie, J.R.B. (1991), “Measuring service quality in the travel and tourismindustry”, Journal of Travel Research, Vol. 30 No. 2, pp. 55-68.
Ghobadian, A., Speller, S. and Jones, M. (1994), “Service quality concepts and models”,International Journal of Quality & Reliability Management, Vol. 11 No. 9, pp. 43-66.
Johns, N. and Tyas, P. (1996), “Use of service quality gap theory to differentiate betweenfood-service outlets”, The Service Industries Journal, Vol. 16 No. 3, pp. 321-46.
Kandampully, J. (1997), “Firms should give loyalty before they can expect it from customers”,Managing Service Quality, Vol. 7 No. 2, pp. 92-4.
Kandampully, J. and Suhartanto, D. (2000), “Customer loyalty in the hotel industry: the role ofcustomer satisfaction and image”, International Journal of Hospitality Management, Vol. 12No. 6, pp. 346-51.
A strategicservice quality
approach
287
Kandampully, J. and Suhartanto, D. (2003), “The role of customer satisfaction and image ingaining customer loyalty in the hotel industry”, Journal of Hospitality and LeisureMarketing, Vol. 10 No. 1/2, pp. 3-25.
Min, H. and Min, H. (1996), “Competitive benchmarking of Korean luxury hotels using theanalytical hierarchy process and competitive gap analysis”, Journal of Services Marketing,Vol. 10 No. 3, pp. 58-72.
Min, H. and Min, H. (1997), “Benchmarking the quality of hotel services: managerialperspectives”, International Journal of Quality & Reliability Management, Vol. 14 No. 6,pp. 582-97.
Min, H., Min, H. and Chung, K. (2002), “Dynamic benchmarking of hotel service quality”, Journalof Services Marketing, Vol. 16 No. 4, pp. 302-31.
Parasuraman, A., Berry, L.L. and Zeithaml, V.A. (1990), “Guidelines for conducting servicequality research”, Marketing Research, December, pp. 34-44.
Parasuraman, A., Berry, L.L. and Zeithaml, V.A. (1991), “Refinement and reassessment of theSERVQUAL scale”, Journal of Retailing, Vol. 67 No. 4, pp. 420-50.
Parasuraman, A., Zeithaml, V.A. and Berry, L.L. (1988), “SERVQUAL: a multiple-item scale formeasuring consumer perceptions of service quality”, Journal of Retailing, Vol. 64 No. 1,pp. 12-37.
Saaty, T.L. (1980), The Analytical Hierarchy Process, McGraw-Hill, New York, NY.
Saaty, T.L. (1990), Multicriteria Decision Making: The Analytic Hierarchy Process, RWSPublications, Pittsburgh, PA.
Saaty, T.L. (1994), Fundamentals of Decision Making and Priority Theory with the AnalyticHierarchy Process, RWS Publications, Pittsburgh, PA.
Sato, J. (2004), “Comparison between multiple-choice and analytic hierarchy process: measuringhuman perception”, International Transactions in Operational Research, Vol. 11 No. 1,pp. 77-86.
Stauss, B. and Weinlich, B. (1997), “Process-oriented measurement of service quality: applyingthe sequential incident technique”, European Journal of Marketing, Vol. 31 No. 1, pp. 33-55.
Takeuchi, H. and Quelch, J. (1983), “Quality is more than making a good product”, HarvardBusiness Review, July-August, pp. 139-45.
Wind, Y. and Saaty, T.L. (1980), “Marketing applications of the analytic hierarchy process”,Management Science, Vol. 26 No. 7, pp. 641-58.
Zahedi, F. (1989), “The analytic hierarchy process – a survey of the method and its application”,Interfaces, Vol. 16 No. 4, pp. 96-108.
Zeithaml, V.A. (2000), “Service quality, profitability, and the economic worth of customers: whatwe know and what we need to learn”, Journal of the Academy of Marketing Science, Vol. 28No. 1, pp. 67-85.
Zeithaml, V.A., Berry, L.L. and Parasuraman, A. (1988), “Communication and control process inthe delivery of service quality”, Journal of Marketing, Vol. 52, pp. 35-48.
Further reading
Ahmed, P.K. and Rafiq, M. (1998), “Integrated benchmarking: a holistic examination of selecttechniques for benchmarking analysis”, Benchmarking: An International Journal, Vol. 5No. 3, pp. 225-42.
Asubonteng, P., McCleary, K.J. and Swan, J.E. (1996), “SERVQUAL revisited: a critical review ofservice quality”, The Journal of Services Marketing, Vol. 10 No. 6, pp. 62-81.
Babakus, E. and Boller, G.W. (1992), “An empirical assessment of the SERVQUAL scale”, Journalof Business Research, Vol. 24 No. 3, pp. 253-68.
MSQ15,3
288
Babakus, E. and Mangold, W.G. (1992), “Adapting the SERVQUAL scale to hospital services:an empirical investigation”, Health Services Research, Vol. 26 No. 6, pp. 767-86.
Barsky, J.D. (1992), “Customer satisfaction in the hotel industry: meaning and measurement”,Hospitality Research Journal, Vol. 16 No. 1, pp. 51-73.
Brown, T.J., Churchill, G.A. Jr and Peter, J.P. (1993), “Improving the measurement of servicequality”, Journal of Retailing, Vol. 69 No. 1, pp. 127-39.
Brysland, A. and Curry, A. (2001), “Service improvements in public services using SERVQUAL”,Managing Service Quality, Vol. 11 No. 6, pp. 389-401.
Buttle, F. (1996), “SERVQUAL: review, critique, research agenda”, European Journal ofMarketing, Vol. 30 No. 1, pp. 8-32.
Carman, J.M. (1990), “Consumer perceptions of service quality: an assessment of the SERVQUALdimensions”, Journal of Retailing, Vol. 66 No. 1, pp. 33-55.
Forman, E.H. and Saaty, T.L. (1986), Expert Choice, The Decision Support Software Co.,Pittsburg, PA.
Johnston, L.L., Dotson, M.J. and Dunlap, B.J. (1988), “Service quality determinants andeffectiveness in the real estate brokerage industry”, The Journal of Real Estate Research,Vol. 3 No. 1, pp. 21-36.
Kandampully, J. and Menguc, B. (2000), “Managerial practices to sustain service quality:an empirical investigation of New Zealand service firms”, Marketing Intelligence &Planning, Vol. 18 No. 4, pp. 175-84.
Kanji, G.K. (1996), “Improving the discrimination of SERVQUAL by using magnitude scaling”,Total Quality Management in Action, 1st ed., Chapman & Hall, London, pp. 267-70.
Knutson, B., Stevens, P., Wullaert, C. and Patton, M. (1991), “LODGSERV: a service quality indexfor the lodging industry”, Hospitality Research Journal, Vol. 14 No. 2, pp. 277-84.
Parasuraman, A., Zeithaml, V.A. and Berry, L.L. (1985), “A conceptual model of service qualityand its implications for future research”, Journal of Marketing, Vol. 49 Fall, pp. 41-50.
Saleh, F. and Ryan, C. (1991), “Analysing services quality in the hospitality industry using theSERVQUAL model”, Services Industries Journal, Vol. 11 No. 3, pp. 324-45.
Spreng, R.A. and Mackoy, R.D. (1996), “An empirical examination of a model of perceived servicequality and satisfaction”, Journal of Retailing, Vol. 72 No. 2, pp. 201-14.
Wong, A. and Sohal, A. (2002), “Customers’ perspectives on service quality and relationshipquality in retail encounters”, Managing Service Quality, Vol. 12 No. 6, pp. 424-33.
Zeithaml, V.A., Berry, L.L. and Parasuraman, A. (1993), “The nature and determinants ofcustomer satisfaction of service”, Journal of the Academy of Marketing Research, Vol. 21No. 1, pp. 1-12.
Zeithaml, V.A., Berry, L.L. and Parasuraman, A. (1996), “The behavioral consequences of servicequality”, Journal of Marketing, Vol. 60, April, pp. 31-46.
A strategicservice quality
approach
289