service improvement toolbox: bus crowding · service improvement toolbox: bus crowding march 27,...
TRANSCRIPT
SERVICE IMPROVEMENT
TOOLBOX: Bus CrowdingMarch 27, 2017
Office of Performance Management & Innovation
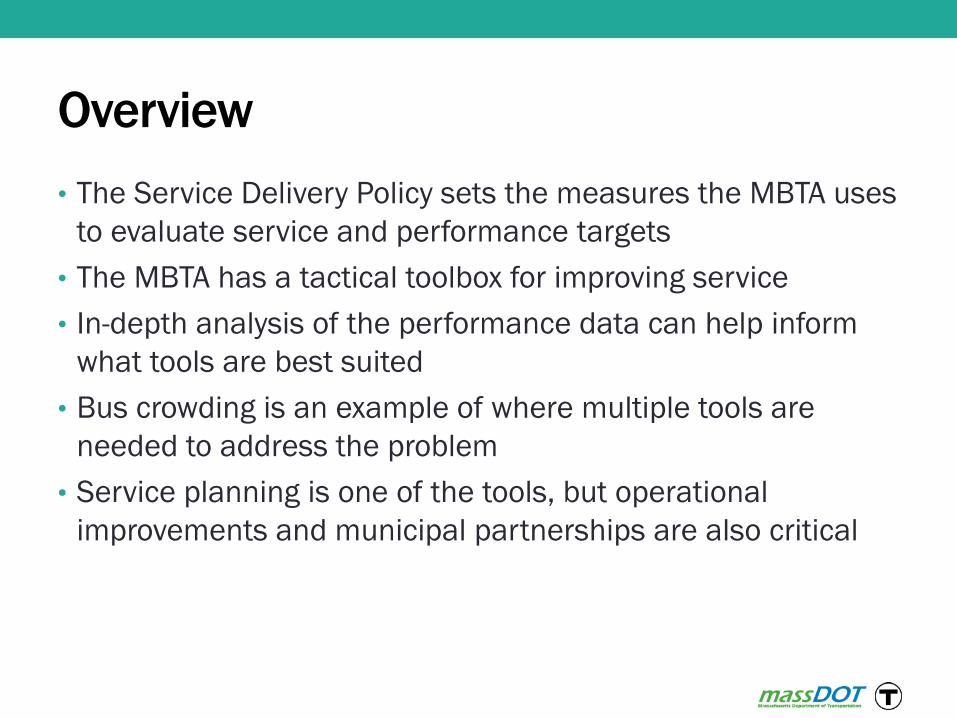
Overview
• The Service Delivery Policy sets the measures the MBTA uses
to evaluate service and performance targets
• The MBTA has a tactical toolbox for improving service
• In-depth analysis of the performance data can help inform
what tools are best suited
• Bus crowding is an example of where multiple tools are
needed to address the problem
• Service planning is one of the tools, but operational
improvements and municipal partnerships are also critical

Tactical toolbox for bus service improvements
Operational Changes
• All door boarding and faster fare collection
• Improved dispatching tools and procedures
Partnerships with municipalities
• Bus lanes
• Signal priority and queue jumps
Private sector partnerships
Capital Projects
• Fleet facilities
• Additional buses
3
Service Changes
• Route alignment and
stop spacing
• Frequency and span
changes
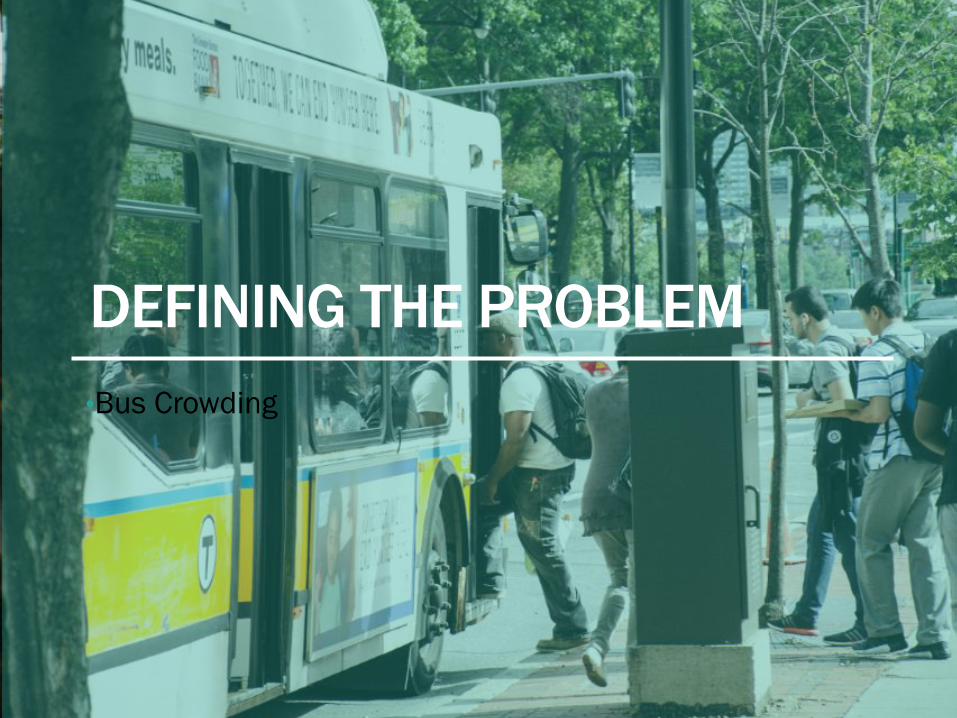
DEFINING THE PROBLEM
•Bus Crowding

“I normally take the 111 bus seven days a week and it is usually
very full. Sometimes it is so full that I have to wait for two
or three buses to pass, and will have to wait up to 10-20
minutes for another bus.
-Edwin , 111 Rider
"Yo uso este bus normalmente todos los días, siete días a la
semana. Si me vengo en el bus de las 5 PM o por la mañana, a
veces tengo que esperar 2-3 buses que pasen e
esperar unos 10-12 minutos para poder entrar a otro bus. Durante
la mañana normalmente hay mucha gente, en un bus con capacidad
de 40 personas, esto se llena entre 60-90 personas.
-Rosa Maria, 111 Rider
Customer ExperienceInterviews
5
111
OPMI interviewed riders on the 7, 111, 66 and 57 bus routes with high crowding, this is what they said...

7
"I usually take this
bus to get to work
every week day.
Usually it is very
crowded. Usually the
buses will be back
to back, and
sometimes there will
be a bus loading
people here and
around the corner
you would have
another bus loading
more people up,
when they are not
already full. So
earlier, at like 8:45,
usually the bus
would be really
crowded and there
would be a line
around the corner."
- Sean, 7 Rider
"I usually ride the 7 bus every day to go to work. I am left behind every day because the buses are too
crowded. I often take other forms of transportation, Yesterday I took Uber, because I didn’t feel like waiting for
3 buses until I could get on. - Kate, 7 Rider
Customer Experience Interviews
6

How do we define crowded?
7
PEAKAll passengers
considered
uncomfortable above
140% of seated
capacity
From 125% to 140% of
seated capacity
standees considered
uncomfortable, above
140% all passengers
considered
uncomfortable
OFF- PEAK
MAGNITUDEMeasure amount of
passenger time that is
uncomfortable.
PROPORTIONPercent of passenger
time that is comfortable
The target is for bus routes to have over 96% of
passenger minutes in comfortable conditions.

1117
154% of seated capacity150% of seated capacity
What does crowded look like?
8
Above 140% of seated capacity, all passengers are considered uncomfortable

Current Performance by Route
Note: this diagram represents most (not all) bus routes with average
weekday crowding, 9/1/2015 – 12/14/2015.
Acceptable
performance
Other routes
Key bus routes
Current average performance

Current Performance by Route
Note: this diagram represents most (not all) bus routes with average
weekday crowding, 9/1/2015 – 12/14/2015.
Acceptable
performance
Other routes
Key bus routes
Current average performance

CROWDING ANALYSIS
11

Multiple types of analysis
Temporal
When is crowding occurring by route
Spatial
Where is crowding occurring by route
Where is crowding occurring by street segment (for municipal
partners)
Causes of crowding
By route by time of day
Research conducted in partnership with the MIT Transit Lab
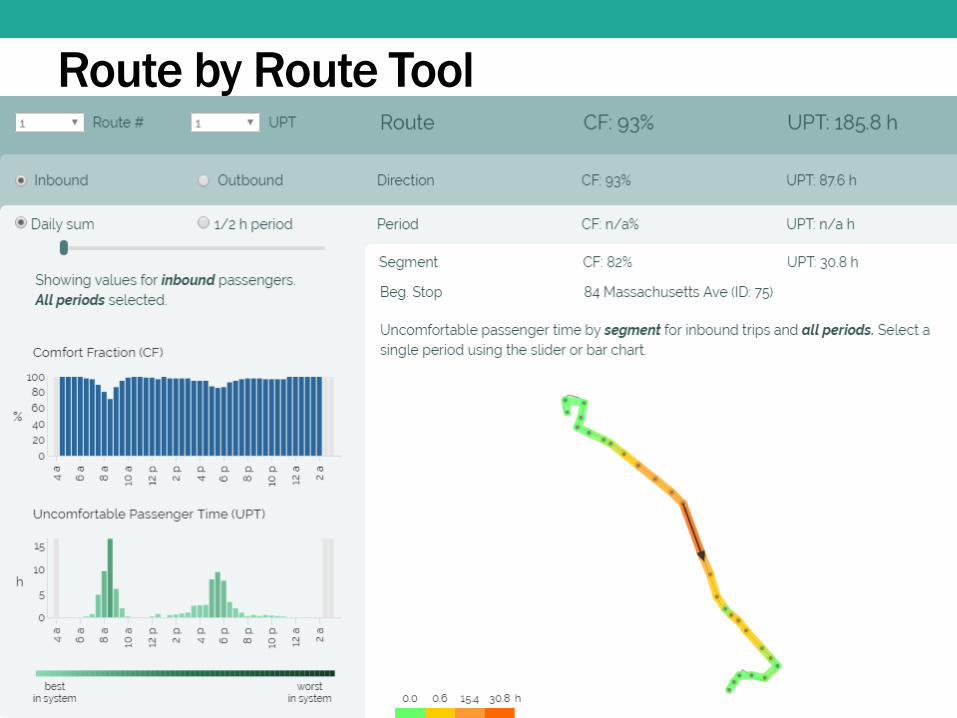
Route by Route Tool
13

Temporal Patterns
Peaks
14
ConstantPeaks and constant
111669
Outbound
Inbound
Un
co
mfo
rta
ble
Pa
sse
nge
r H
ou
rs
Data reflects an average weekday in Fall 2015.

Most crowded street segments
Data reflects an average
weekday in Fall 2015.
Routes SL1, SL2, SLW, 71,
and some Limited Service
routes are excluded due to
insufficient data.
15
This map shows how
many passengers
experience crowding on
inbound trips, totaled
across all bus routes
that use each street.
Long straight lines
represent express
buses that use
highways without
stopping.

Causes of bus crowding
16
Crowding caused by:
• Headway Variability
• Demand variability within a day (uneven demand within 30 min periods)
• Dropped trips
• Demand variability between days
• Planned frequency (not enough service if demand uniform)
19

Increase Buses on the
Street
Reallocate
Existing
Service
Decrease On-Street
Delays
Decrease Bus Bunching
Decrease Dwell Time
Service Planning Dispatching
Tools
Capital Investment,
Private Sector Partnerships
Municipal
Partnerships
AFC 2.0 And Proof of Payment
What tools can we use to address crowding?
17

QUESTIONS
18