serum lipoproteins of normal and cholesterol-fed rats · serum lipoproteins of normal and...
TRANSCRIPT
Serum lipoproteins of normal and cholesterol-fed rats
Norman L. Lasser,l Paul S. Roheim, Diane Edelstein, and Howard A. Eder Departments of Medicine and Physiology, Albert Einstein College of Medicine, Bronx, New York 10461
Abstract The density distribution of lipoproteins in rats fed chow or chow containing 1% cholesterol and 10% olive oil was studied. Lipoprotein fractions were prepared in the ultra- centrifuge between narrow density bands within the density range of 1.006-1.21 and were analyzed by chemical, electro- phoretic, and immunological methods. In serum from normal rats there were three major lipoprotein fractions, with densi- ties less than 1.006, 1.030-1.063, and 1.063-1.21. Almost no lipoprotein was found between d 1.006 and 1.030. Most of the low density lipoprotein appeared between a density of 1.04 and 1.05. In the density range 1.05-1.07, small amounts of both low density and high density lipoprotein were found.
Feeding a diet high in cholesterol resulted in a marked in- crease in the concentration of lipoproteins of density less than 1.006, and a new lipoprotein fraction appeared between d 1.006 and 1.030; this fraction contained immunologically demonstrable low density and high density lipoproteins. In addition, there was a decrease in the high density lipoprotein fraction between d 1.070 and 1.21.
Supplementary key words quantitative immunoelectro- phoresis preparative ultracentrifugation - paper electro- phoresis atherogenic diet
A L T H O U G H the rat is frequently used for experimental studies of the metabolism of the serum lipoproteins, adequate characterization of these lipoproteins has not been reported (1-6). In previous studies, rat serum lipoproteins have been isolated using the conditions established for separation of the lipoproteins of human serum (7, 8); recent studies (1-3, 9) have suggested
Abbreviations: VLDL, very low density lipoproteins; LDL, low density lipoproteins; HDL, high density lipoproteins.
1 Present address: Departments of Medicine and Biochemistry, College of Medicine and Dentistry of New Jersey, New Jersey Medical School, Newark, N.J. 07103.
that different densities may be more suitable for isolation of the various classes of serum lipoproteins in the rat.
I t is the purpose of this paper to define the conditions for separation of lipoproteins from normal and hyper- lipidemic rat serum and to characterize the isolated lipoproteins by chemical, electrophoretic, and immuno- logical methods.
MATERIALS AND METHODS
Animals Sprague-Dawley male rats weighing 400-500 g were
obtained from Holtzman Laboratories (Madison, Wis.) and were fed mouse pellets (Rockland chow) containing 0.05% cholesterol and 3.65% total lipid (10). In addi- tion, a high cholesterol diet containing 1% cholesterol and 10% olive oil by weight was prepared by addition of cholesterol and olive oil to mouse pellets. Rats were maintained on this diet for at least 2 wk to produce hyperlipidemia. They were allowed free access to food, and blood was drawn by cardiac puncture between 10 AM and noon.
Chemical methods Triglycerides were analyzed by a modification of the
method of Van Handel and Zilversmit (11, 12), choles- terol was determined by the method of Abell et al. (13), and phospholipids were analyzed by a modification of the method of Beveridge and Johnson (14, 15). Protein was measured by the method of Lowry et al. (16) after extraction of the lipoproteins with lipid solvents (17). Paper electrophoresis was done by the method of Lees and Hatch (18), except that the duration of the electro- phoresis was 7 hr.
Lipoprotein separations Lipoprotein fractions were isolated in the Beckman
model L ultracentrifuge according to the method of
Journal of Lipid Research Volume 14, 1973 1
by guest, on June 11, 2018w
ww
.jlr.orgD
ownloaded from
Havel, Eder, and Bragdon (7). For separation of LDL and VLDL, ultracentrifugation was carried out at 114,000 g and at 15°C for 20 hr in the 40.3 rotor; for the separation of HDL, ultracentrifugation was carried out for 40 hr. Separated lipoprotein fractions were re- suspended in solutions a t the density used for the initial separation and ultracentrifuged a second time. In the separations performed at d 1.006, serum was layered under an equal volume of Ringer’s solution or 0.85% sodium chloride and centrifuged at various speeds and times. These conditions are reported as g-min (19), the product of relative centrifugal force and time. These fractions contained both VLDL and chylomicrons. Centrifugation was also carried out at intermediate densities between 1.006 and 1.063 for 20 hr. For inter- mediate densities between 1.063 and 1.21, centrifugation was carried out for 40 hr.
- E
Immunological methods
Antisera were prepared by intramuscular and intra- dermal injection of mixtures of equal volumes of antigen (1-5 mg of protein) and complete Freund’s adjuvant (Difco Laboratories) into rabbits. In some cases, 0.5 ml of pertussis vaccine (Eli Lilly & Co.) was also admin- istered subcutaneously. When this was done, only one injection of antigen was given; otherwise, two were given at 10-14-day intervals. Anti-LDL antisera were prepared by injection of a d 1.030-1.050 fraction from normal rats. Anti-HDL antisera were prepared by in- jection of a d 1.080-1.21 fraction from either normal or cholesterol-fed rats. All the anti-HDL antisera had some cross-reactivity with LDL. Antisera to HDL prepared from cholesterol-fed rats had much less or no reactivity to LDL. To eliminate cross-reactivity, the antisera were adsorbed with LDL.
Quantitative immunoelectrophoresis was performed by the method of Laurel1 (20) in which electrophoresis is carried out in 1% agarose containing the appropriate antiserum. Migration of the sample results in the forma- tion of a precipitin line in the shape of a peak or rocket, and the peak height is proportional to the amount of antigen in the sample. For measurement of LDL, the antiserum was present in the agarose at a concentration of 0.2-0.5 m1/100 ml agarose; for measurement of HDL, 4-6 ml of anti-HDL serum was added to 100 ml of agarose. The barbital buffer used to suspend the agarose was 0.025 M, and that in the cell was 0.05 M and contained no calcium lactate. Electrophoresis was carried out in 200 X 90 X 3 mm agarose gels a t 120- 180 v for 16-20 hr ; the plates were cooled with running tap water.
Since lipoproteins in whole serum were found to have different electrophoretic mobilities from isolated lipo- proteins, it was necessary to use different standards de-
TRIGLYCERIDE
pending on the lipoprotein preparation. With isolated lipoproteins, the standards consisted of normal d 1.030- 1.055 (LDL) and d 1.070-1.21 (HDL) fractions. The protein concentration of each standard was determined, dilutions of the standards were made, electrophoresis was carried out, and the heights of the peaks were measured. When these were plotted against the protein concentrations, a linear relationship was found. For measurements on serum and other fractions containing nonisolated lipoproteins, a d > 1.006 fraction was used as the standard. Dilutions of this standard were sub- jected to electrophoresis in the presence of antiserum to HDL or LDL, and the heights of the resulting peaks were measured. Again, a linear relationship was ob- served. The LDL and HDL contents of the standard (d > 1.006) were determined by protein measurements on the d 1.030-1.055 and d 1.070-1.21 fractions isolated from the standard; these values were plotted against the appropriate peak heights.
Double immunodiffusion was carried out as described by Ouchterlony (21).
RESULTS
Density distribution of lipoproteins
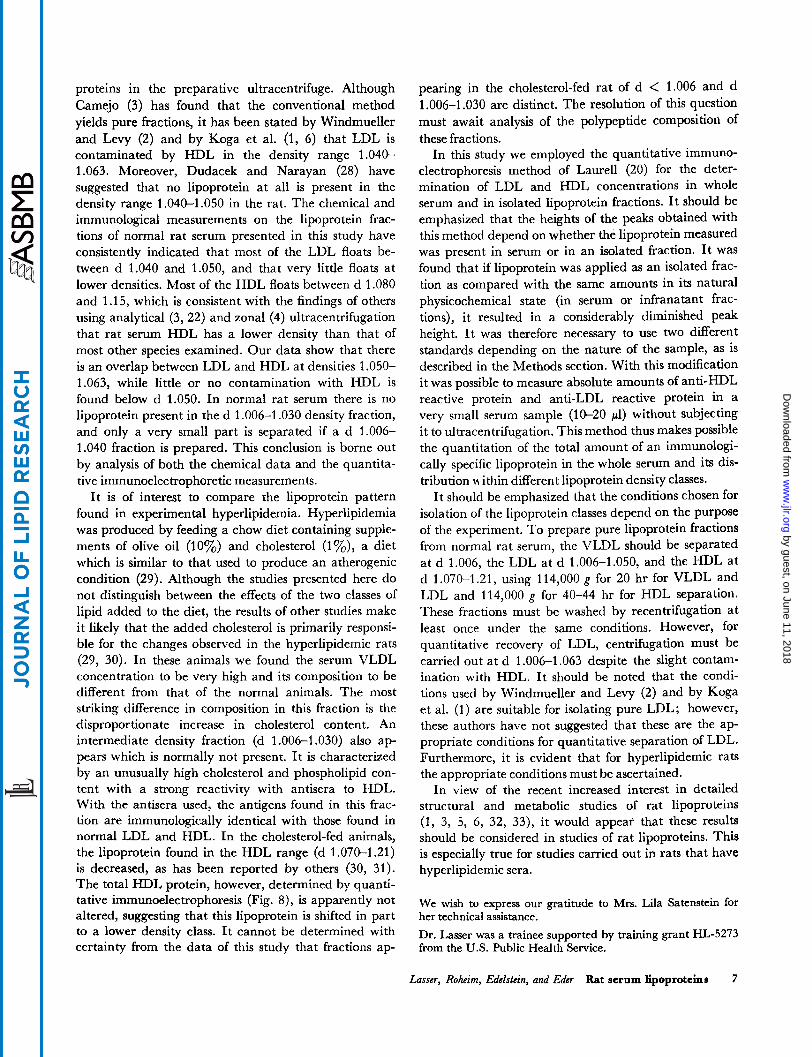
Pooled serum samples from normal ruts were centrifuged at d 1.006 for various g-min. The triglyceride and cho- lesterol content of the lipoprotein in the top of the tube after centrifugation was measured. From Fig. 1 it can be seen that after 200 X lo6 g-min the amount of triglyc- eride in the top fraction remained constant. This indi- cated complete separation of VLDL under these condi- tions.
Lipoprotein fractions were separated by flotation at progressively increasing densities by taking aliquots of the serum and adjusting their salt concentrations to ob- tain progressively increasing densities from the native density 1.006 to 1.21. Each lipoprotein fraction therefore contained all lipoproteins floating at that density, and
0 L CHOL €STEROL J
7 T T I 1 10 20 40 EO 200 1000
0
G-minutes x I O - ~
FIG. 1. Cumulative concentrations of lipid in lipoprotein frac- tions separated at d 1.006 with increasingg-min (relative centrifugal force X minutes of centrifugation). The data are for normal rats. Concentrations in this and in the following figures are expressed in terms of 100 ml of serum from which the lipoprotein fractions had been separated.
2 Journal of Lipid Research Volume 14, 1973
by guest, on June 11, 2018w
ww
.jlr.orgD
ownloaded from

thus recovery of lipoprotein in each fraction is cumula- tive for that density. The fractions separated at each solvent density were washed once at the density a t which they had been isolated. Four such experiments were done in order to demonstrate the reproducibility of the find- ings and to provide sufficient material for characteriza- tion. The concentrations of cholesterol, phospholipid, and protein in these lipoprotein fractions are shown in Figs. 2 and 3 for two similar experiments using different pools. (The concentration is cumulative with increasing solvent density.) Between d 1.006 and 1.030 (Fig. 2) essentially no lipoprotein was found. The concentrations of lipid and protein began to increase at d 1.040 and continued to increase to d 1.060. There was a further slight increase to d 1.08 where a large increase occurred. The major change of the cholesterol-protein ratio did
CHOLESTEML
I I I 1 I I I I .
""r C / P 1.-
0
0 - 4
- 3
-2
- 1
DENSITY
FIG. 2. Cumulative concentrations of cholesterol and phospho- lipid in the lipoprotein fractions separated from pooled serum from rats fed chow diets by ultracentrifugation at solvent densities in- creasing from 1.020 to 1.21. C/P is the cholesterol-phospholipid ratio at each density. Each point is the mean of two values for each density.
not occur until d 1.10 (Fig. 3). The fraction separated at d 1.040-1.063 corresponds to LDL, and the fraction removed at 1.08 corresponds to HDL.
The separation of VLDL from cholesterol-fed hyper- lipidemic rats is shown in Fig. 4. As in Fig. 1, cumulative lipid in the lipoprotein fractions is plotted against g-min. The concentration of lipids in the d < 1.006 fraction was much higher than in the VLDL from normal rats. Up to 25 X lo5 g-min the lipoprotein fractions isolated con- tained mainly triglycerides as in the normal VLDL, while the fractions appearing from 25-1000 X l o6 g- min contained a greatly increased proportion of choles- terol. More than one-third of the total serum cholesterol was found in the d < 1.006 fraction in these rats.
The lipoprotein distribution in the serum fractions from hyperlipidemic rats was examined by the procedure previously described for normal rats. LDL was isolated at different densities from d 1.006 to d 1.063 and the cumulative cholesterol was determined. Fig. 5 shows re- sults from two pooled sera with different degrees of hy- perlipidemia and a pool of serum from normal rats. In the serum of rats fed the normal diet, less than one-third of the cholesterol was found at d < 1.063, whereas in the serum from hyperlipidemic rats, two-thirds of the cholesterol was in this fraction. Moreover, LDL choles- terol in these hyperlipidemic rats appeared largely be- tween d 1.006 and 1.030, with only a small proportion present in the fraction d 1.030-1.063; in the normal rat the latter fraction contained most of the LDL cholesterol. The experiment shown in Fig. 6 from a third pool demon- strates that the cholesterol-protein ratio in LDL is far higher in the cholesterol-fed rats than in the chow-fed rats (cf. Fig. 3). Since values are cumulative, the large amount of cholesterol in LDL makes the ratio appear
TRIGLYCERIDE / 1'*
10061020 1040 1060 I080 110 112 114 116 118 120121
DENSITY
FIG. 3. Cumulative concentrations of protein and cholesterol in the lipoprotein fractions separated after ultracentrifugation of pooled Serum at solvent densities increasing from 1.006 to 1.21. A different pool of serum from chow-fed rats was used in this ex- periment.
G-minuter I ios5
FIG. 4. Similar to Fig. 1 except that serum was obtained from rats fed a high cholesterol diet. C/T is the cholesterol-triglyceride ratio.
Lasser, Roheim, Edelstein, and Eder Rat serum lipoproteins 3
by guest, on June 11, 2018w
ww
.jlr.orgD
ownloaded from

2 150-
0 0 \
0 E J 100- 0 [L W I- v) W -I 0 I v 50-
T C 2 0 7 /
-MAL J A' T C 95
. 01 I I I I I I I
1010 1020 1030 1040 1050 io60 1.070 DENSITY
FIG. 5. Cumulative concentrations of cholesterol in the isolated lipoprotein fractions separated from serum from cholesterol-fed rats by ultracentrifugation at densities from 1.006 to 1.063. The two upper curves are from separate pools of serum from cholesterol- fed rats. The serum cholesterol concentrations in these pools were 207 and 107 m g / l O O ml, respectively. Some of the points for the latter pool were obtained from separations carried out in qua- druplicate: +-+ represents one series and A-A the other. For comparison, a curve obtained using serum from normal, chow-fed rats is included.
higher a t the density where HDL is found than it is in isolated HDL (cf. Table 1).
Determination of immunologically specific protein
Quantitative immunoelectrophoresis (20) was per- formed on isolated lipoprotein fractions of normal and cholesterol-fed rats. A plot of the cumulative appearance of immunologically specific LDL protein in the lipo- protein fractions is shown in Fig. 7. In the normal animal,
150 140
I20 110 100
0 90
10061020 1040 1060 1080 110 112 114 116 118 120121
DENSITY
FIG. 6. Cumulative concentrations of cholesterol and protein in the isolated lipoprotein fractions after ultracentrifugation of serum from cholesterol-fed rats a t densities from 1.006 to 1.21 as described in Fig. 3.
3s -
CHOLESTEROL- FED
I- O
N O R M A L
1006 1020 1040 1060 IO80 110 112 114 116 118 120 121
DENSITY
FIG. 7. Cumulative concentrations of LDL protein, measured by quantitative immunoelectrophoresis (20) of supernatant frac- tions after ultracentrifugation of serum from normal and choles- terol-fed rats. The data were obtained from pooled sera from two groups of 30 rats each. 15-pl samples were applied to agarose plates containing 0.2 ml of anti-LDL/lOO ml of agarose. The standard for determination of LDL protein was the d 1.030-1.055 fraction from normal rats.
about 2 mg of LDL protein appeared in the d < 1.006 fraction. The LDL protein concentration did not change between d 1.006 and 1.030; most of the LDL protein was isolated between d 1.040 and 1.060. A small further increment in LDL protein was found between d 1.060 and 1.080, but at d 1.080 all the LDL protein, approxi- mately 10 mg, had been separated. The shape of the curve is compatible with the density distribution of lipids shown in Fig. 2.
The LDL protein curve for cholesterol-fed rats is also consistent with the lipid data shown in Figs. 5 and 6. In the hyperlipidemic rats the d < 1.006 fraction con- tained about 15 mg/100 ml of LDL protein. This curve clearly demonstrates that there is a continuous rapid rate of increase in LDL protein concentration between d 1.006 and 1.050, with a rise to a concentration of 27 mg/l00 ml at the latter density. The increment in LDL protein is more gradual above d 1.050, with an increase to a maximum of about 30 mg/100 ml.
Quantitative immunoelectrophoresis was also utilized to study the distribution of HDL protein in the same isolated lipoprotein fractions as had been used for the study of LDL protein from the normal animals. No measurable HDL reactivity was observed until d 1.070, where a faint reaction was present. Beginning at d 1.080 there was a rapid increase in HDL protein, which reached a plateau above d 1.12.
Additional experiments were performed in order to permit direct comparison of the amounts of HDL pro- tein present in serum from normal and cholesterol-fed rats. Several lipoprotein fractions of identical density range were isolated from both groups of animals and they were analyzed by quantitative immunoelectro- phoresis on the same plate (Fig. 8). When the HDL
4 Journal of Lipid Research Volume 14, 1973
by guest, on June 11, 2018w
ww
.jlr.orgD
ownloaded from

FIQ. 8. Quantitative immunoelectrophoretic measurenient (20) of HDL in rat scruin and lipoprotein fractions from normal (,V) and cholesterol-fed (C) rats. Electrophorcsis was performed in agarose containing 5 ml of anti-HDI, scrum/100 nil of agarose. &/l, whole seruni and d > 1.006 fraction, both diluted 4:l ; rigltf, d 1.070-1.21 and d 1.006-1.21 fractions, diluted 2:l.
content of serum from normal and cholesterol-fed rats was measured, no difference was observed (Fiq. 8, k f i ) . When VLDL was removed and the HDL content of the d > 1.006 fraction was measured, the peak heiqhts were also similar. However, both d > 1.006 samplcs con- tained less HDL than whole serum, indicatinq that the VLDL fraction which had been removed must have contained an HDL component. Similar amounts of HDL were found in the d 1.006-1.21 fraction from normal and cholesterol-fed rats (Fig. 8, right). However, the d 1.070- 1.21 fraction from cholesterol-fed rats contained less HDL than that from normal animals, sugqesting that a considerable amount of HDL must have been present in the d 1.006-1.070 fraction from cholesterol-fed rats.
Double immunodiffusion studies All the fractions examined by quantitative immuno-
electrophoresis were also examined by double immuno- diffusion (21). In Fiq. 9, the first faint LDL precipitin line appeared in the d 1.006-1.040 fraction of the normal rat and the first strong reaction was observed with the d 1.006-1.050 fraction, confirming the previous finding that the largest increase in LDL occurred between d 1.040 and 1.050. The first readily demonstrable HDL reactivity was seen in the d 1.006-1.070 fraction, with a trace in the d 1.006-1.060 fraction.
Similar studies were pcrformecl with lipoprotein fractions obtained from cholesterol-fed rats (Fiq. 10) ; they show that a strong precipitin line for LDL already appears in the cl 1.0061.020 fraction and also appears in all subsequent fractions. The disappearance of LDL reactivity in the correspondina infranatant fractions is seen abovc d 1.050. It can also he seen that thc tl 1.006-
FIG. 9. Double itnniunodiffusion (21) of lipoprotein and in- franatant fractions from normal rats. In each slide, the uppcr row of wells contains scruni (S) and cumulative lipoprotein fractions separated betwccn d 1.006 and tho density indicated. l h e cor- responding infranatant fractions in the bottom rows contain pro- teins of dcnsitv greater than that shown. Thc center row contains antiserum to HDI, in the upprr slide and to 1.111. in the lower slide. All lipoprotcin fractions liavc the same concentration as in thc startinq scruiii.
FIG. 10. Double immunodiffusion (21) of lipoprotein and in- franatant fractions froin cholesterol-fed rats. In each slide, the upper row of wells contains serum (S) and cumulative lipoprotcin fractions separated between d 1.006 and the density indicated. The corresponding infranatant fractions in the bottom rows con- tain proteins of density grcatcr than that shown. The center row contains antiserum to HDL in thr uppcr slide and to LDI. in the lower slide. .\I1 lipoprotein fractions have the same concrntration as in the starting seriini.
1.030 fraction and all the subsequent lipoprotein frac- tions contain HDL rcactivity.
I t was of interest to dctertnine whether the new lipo- protein fraction which appeared in the cholesterol-fed animals had immunological reactions similar to those of normal HDL and LDL. It can be seen in Fig;. 11 that both the LDL and HDL founcl in this d 1.006-1.030 fraction were immunoloqically identical with LDL and HDL of normal scruin.
Paper electrophoresis The lipoprotein fractions isolated at progressively in-
Losscr, Rohn”, Edelstcin, and Edcr Rat serum lipoproteins 5
by guest, on June 11, 2018w
ww
.jlr.orgD
ownloaded from

Fro. 11. t i i i i n ~ i i i ~ ~ [ . . i r t i \ i ~ ~ o f t l 1.006 1.030 fraction from cho- lesterol-fed rats (centcr wcll). \Vcll I ront,iitis tl 1.063-1.21 frac- tion prepared from scrum of chow-fed rats; 2 contains anti-HDI. serum; 3 contains d < 1.006 fraction prepared from seruni of cholesterol-fcd rats; 4 contains d < 1.006 fraction preparcd from serum of chow-fed rats; 5 contains anti-LD1, serum; 6 contains d 1.030-1.063 prepared from serum of rhow-frd rats.
creasing densities were also analyzed by paper elcctro- phoresis, and the results indicated the same distributions of lipoproteins as shown in Figs. 2, 3, 5, and 6; Le., the @-lipoprotein corresponds to LD1, and the cy-lipoprotein to HDL. In fractions from normal rats, very little B- lipoprotein was seen in the top of the tube until d 1.050 was reached, while in fractions from cholesterol-fed rats significant &migrating lipoprotein appeared in the top of the d 1.020 tube and this increased in intensity as the density was raised. The mobility of the d 1.006-1.030 lipoprotein appeared to be the same as that of thc higher density /3-lipoprotein found in normal rats. For both types of rats, significant amounts of a-lipopmtein first appeared a t d 1.070, although it was sometimes faintly visible below this density. For serum samples from nor- mal rats the a-lipoprotein stained much more intensely than did the 8, but for the cholesterol-fed rat the cy- and &lipoproteins stained approximately equally. The d < 1.006 fractions from both groups of animals contained material remaining a t the oriqin, with much more in the
VLDL from cholesterol-fed rats. The latter also con- tained material with pre-8 mobility.
Composition
Lipoprotein fractions were separated from pooled sera of normal rats and rats fed the diet high in cholesterol, and their chemical compositions were determined (Table 1). The differences between the normal and cholesterol-fed rats are readily apparent. Both cholesterol and triglyceride were considerably higher in the serum of cholesterol-fed rats, and most of the excess trialyceride was found in the d < 1.006 fraction, but about 30% of the cholesterol was carried in the d 1.006-1.055 fraction. The increase in lower density lipoproteins was accom- panied by a decrease in HDL. The LDL was also sub- divided into d 1.006-1.030 and d 1.030-1.055 fractions. I t can be seen that in the d 1.006-1.030 fraction of the normal animal practically no lipoprotein was present. In this density range in the cholesterol-fed animals, a lipoprotein fraction appeared which was not found in the normal animals, and it had a composition which was different from that of all the other lipoprotein fractions.
DISCUSSION
Although the distribution between the high density and low density lipoproteins is known to vary among different species (7, 22, 23), similar density classes of plasma lipoproteins are found in most higher animals. Conventionally, the density distribution established by DeLalla and Gofinan (8) and by Have1 et al. (7) for humans has been used as the basis for isolation of lipo- protein classes in other animals, including the rat (3, 9, 24-27). Despite the frequent use of this animal for metabolic studies, it has not been established that these density limits are valid for isolation of rat plasma l i p
TABLE 1. Lipid distribution in rat lipoproteins
Phospholipid Protein -- - Trig1 yceride -- Cholesterol ~- __- Fraction N O CF N CF N CF N CF
mg/lm ml mu& d < 1.006 5.0 83.8 26.0 53 10.9 13.9 3.7 19.4
d 1.006-1.055 5.2 45.5 1 . 2 3.4 5.0 24.1 4.1 14.9
d 1.070-1.21 22.0 18.9 4.2 1.6 27.7 9.7 25.9 12.5
d 1.006-1.030 0.6 28.9 0 2.1 0 19.4 0.2 7.5
d 1.030-1 .OS5 6 .0 3.9 1.2 2.6 6 .6 4.1 3 . 9 1.3
\\'hole m u i n 49 160 49 77 52 117
(11.0)d (49.2) (57.0) (31.1) (23.9) (8.2) (8.1) (11.4)
(34.0) (51.7) (7.7) (3.9) (32.1) (27.4) (26.3) (16.9)
(27.6) (44.3) (5 .3) (3.7) (34.7) (22.7) (32.5) (29.3)
(49.9) (3.6) (33.5) (13.0)
(33.9) (32.8) (6.8) (21.8) (37.3) (34.5) (22.0) (10.9)
0 Control rats fed a chow diet. * Kats fed a chow diet containing 1"; cholesterol and 10% olive oil. e I<nults of duplicate determinations on samples from pooled serum from 30 rats. d Figura in parentheses represent percentage composition by weight.
6 Journal of Lipid Research Volume 14, 1973
by guest, on June 11, 2018w
ww
.jlr.orgD
ownloaded from
proteins in the preparative ultracentrifuge. Although Camejo (3) has found that the conventional method yields pure fractions, it has been stated by Windmueller and Levy (2) and by Koga et al. (1, 6) that LDL is contaminated by HDL in the density range 1.040- 1.063. Moreover, Dudacek and Narayan (28) have suggested that no lipoprotein at all is present in the density range 1.040-1.050 in the rat. The chemical and immunological measurements on the lipoprotein frac- tions of normal rat serum presented in this study have consistently indicated that most of the LDL floats be- tween d 1.040 and 1.050, and that very little floats at lower densities. Most of the HDL floats between d 1.080 and 1.15, which is consistent with the findings of others using analytical (3, 22) and zonal (4) ultracentrifugation that rat serum HDL has a lower density than that of most other species examined. Our data show that there is an overlap between LDL and HDL at densities 1.050- 1.063, while little or no contamination with HDL is found below d 1.050. In normal rat serum there is no lipoprotein present in the d 1.006-1.030 density fraction, and only a very small part is separated if a d 1.006- 1.040 fraction is prepared. This conclusion is borne out by analysis of both the chemical data and the quantita- tive immunoelectrophoretic measurements.
I t is of interest to compare the lipoprotein pattern found in experimental hyperlipidemia. Hyperlipidemia was produced by feeding a chow diet containing supple- ments of olive oil (10%) and cholesterol (l%), a diet which is similar to that used to produce an atherogenic condition (29). Although the studies presented here do not distinguish between the effects of the two classes of lipid added to the diet, the results of other studies make it likely that the added cholesterol is primarily responsi- ble for the changes observed in the hyperlipidemic rats (29, 30). In these animals we found the serum VLDL concentration to be very high and its composition to be different from that of the normal animals. The most striking difference in composition in this fraction is the disproportionate increase in cholesterol content. An intermediate density fraction (d 1.006-1.030) also ap- pears which is normally not present. It is characterized by an unusually high cholesterol and phospholipid con- tent with a strong reactivity with antisera to HDL. With the antisera used, the antigens found in this frac- tion are immunologically identical with those found in normal LDL and HDL. In the cholesterol-fed animals, the lipoprotein found in the HDL range (d 1.070-1.21) is decreased, as has been reported by others (30, 31). The total HDL protein, however, determined by quanti- tative immunoelectrophoresis (Fig. 8), is apparently not altered, suggesting that this lipoprotein is shifted in part to a lower density class. It cannot be determined with certainty from the data of this study that fractions ap-
pearing in the cholesterol-fed rat of d < 1.006 and d 1.006-1.030 are distinct. The resolution of this question must await analysis of the polypeptide composition of these fractions.
In this study we employed the quantitative immuno- electrophoresis method of Laurel1 (20) for the deter- mination of LDL and HDL concentrations in whole serum and in isolated lipoprotein fractions. It should be emphasized that the heights of the peaks obtained with this method depend on whether the lipoprotein measured was present in serum or in an isolated fraction. It was found that if lipoprotein was applied as an isolated frac- tion as compared with the same amounts in its natural physicochemical state (in serum or infranatant frac- tions), it resulted in a considerably diminished peak height. I t was therefore necessary to use two different standards depending on the nature of the sample, as is described in the Methods section. With this modification it was possible to measure absolute amounts of anti-HDL reactive protein and anti-LDL reactive protein in a very small serum sample (10-20 pl) without subjecting it to ultracentrifugation. This method thus makes possible the quantitation of the total amount of an immunologi- cally specific lipoprotein in the whole serum and its dis- tribution M itliin different lipoprotein density classes.
I t should be emphasized that the conditions chosen for isolation of the lipoprotein classes depend on the purpose of the experiment. To prepare pure lipoprotein fractions from normal rat serum, the VLDL should be separated at d 1.006, the LDL at d 1,006-1.050, and the HDL at d 1.070-1.21, using 114,000 g for 20 hr for VLDL and LDL and 114,000 g for 40-44 hr for HDL separation. These fractions must be washed by recentrifugation at least once under the same conditions. However, for quantitative recovery of LDL, centrifugation must be carried out at d 1.006-1.063 despite the slight contam- ination with HDL. I t should be noted that the condi- tions used by Windmueller and Levy (2) and by Koga et al. (1) are suitable for isolating pure LDL; however, these authors have not suggested that these are the ap- propriate conditions for quantitative separation of LDL. Furthermore, it is evident that for hyperlipidemic rats the appropriate conditions must be ascertained.
In view of the recent increased interest in detailed structural and metabolic studies of rat lipoproteins (1, 3, 5 , 6, 32, 33), it would appear that these results should be considered in studies of rat lipoproteins. This is especially true for studies carried out in rats that have hyperlipidemic sera.
We wish to express our gratitude to Mrs. Lila Satenstein for her technical assistance. Dr. Lasser was a trainee supported by training grant HL-5273 from the US. Public Health Service.
Lasser, Rohim, Edelstcin, and E& Rat serum lipoproteins 7
by guest, on June 11, 2018w
ww
.jlr.orgD
ownloaded from

Dr. Roheim is a Career Scientist of the Health Research Council of the City of New York. This work was supported by research grants HL-02965 and HL-13394 from the U.S. Public Health Service. Manuscript received 27 April 7972; accepted 6 September 7972.
REFERENCES
1. Koga, S., D. L. Horwitz, and A. M. Scanu. 1969. Iso- lation and properties of lipoproteins from normal rat serum. J. Lipid Res. 10: 577-588.
2. Windmueller, H. G., and R. I. Levy. 1967. Total inhi- bition of hepatic /3-lipoprotein production in the rat by orotic acid. J. Biol. Chm. 242: 2246-2254.
3. Camejo, G. 1967. Structural studies of rat plasma lipo- proteins. Biochemistry. 6: 3228-3241.
4. Wilcox, H. G., and M. Heimberg. 1970. Isolation of plasma lipoproteins by zonal ultracentrifugation in the B14 and B15 titanium rotors. J . Lipid Res. 11: 7-22.
5. Bersot, T. P., W. V. Brown, R. I. Levy, H. G. Windmueller, D. S. Fredrickson, and V. S. LeQuire. 1970. Further char- acterization of the apolipoproteins of rat plasma lipopro- teins. Biochemistry. 9: 3427-3433.
6. Koga, S., L. Bolis, and A. M. Scanu. 1971. Isolation and characterization of subunit polypeptides from apoproteins of rat serum lipoprotein. Biochim. Biophys. Acta. 236: 416-430.
7. Have], R. J., H. A. Eder, and J. H. Bragdon. 1955. The distribution and chemical composition of ultracentrifugally separated lipoproteins in human serum. J. Clin. Invest. 34:
8. DeLalla, 0. F., and J. W. Gofman. 1954. Methods Bio- chem. Anal. 1: 459-478.
9. Bowden, J. A., and M. Fried. 1970. Separation and char- acterization of rat plasma lipoproteins by molecular sieve chromatography. Comp. Biochem. Physiol. 32 : 391-400.
IO. Gidez, L. I., P. S. Roheim, and H. A. Eder. 1965. Effect of diet on the cholesterol ester composition of liver and of plasma lipoproteins in the rat. J. Lipid Res. 6: 377-382.
11. Van Handel, E., and D. B. Zilversmit. 1957. Micromethod for the direct determination of serum triglycerides. J. Lab. Clin. Med. 50: 152-157.
12. Van Handel, E. 1961. Suggested modifications of the micro determination of triglycerides. Clin. Chem. 7: 249-251.
13. Abell, L. L., B. B. Levy, B. B. Brodie, and F. E. Kendall. 1952. A simplified method for the estimation of total cholesterol in serum and demonstration of its specificity. J. Biol. Chem. 195: 357-366.
14. Beveridge, J. M. R., and S. E. Johnson. 1949. The deter- mination of phospholipid phosphorus. Can. J. Res. Sect. E. 27: 159-163.
15. Switzer, S., and H. A. Eder. 1965. Transport of lysoleci- thin by albumin in human and rat plasma. J. Lipid Res.
16. Lowry, 0. H., N. J. Rosebrough, A. L. Farr, and R. J. Randall. 1951. Protein measurement with the Folin phenol reagent. J. Biol. Chem. 193: 265-275.
1345-1353.
6: 506-51 1.
17. Radding, C. M., and D. Steinberg. 1960. Studies on the synthesis and secretion of serum lipoproteins by rat liver slices. J . Clin. Invest. 39: 1560-1569.
18. Lees, R. S., and F. T. Hatch. 1963. Sharper separation of lipoprotein species by paper electrophoresis in albumin- containing buffer. J. Lab. Clin. Med. 61: 518-528.
19. Dole, V. P., and J. T. Hamlin, 111. 1962. Particulate fat in lymph and blood. Physiol. Rev. 42: 674-701.
20. Laurell, C.-B. 1966. Quantitative estimation of proteins by electrophoresis in agarose gel containing antibodies. Anal. Biochem. 15: 45-52.
21. Ouchterlony, 0. 1968. Handbook of Immunodiffusion and Immunoelectrophoresis. Ann Arbor Science Publishers, Ann Arbor, Mich.
22. Lewis, L. A , A. A. Green, and I. H. Page. 1952. Ultra- centrifuge lipoprotein pattern of serum of normal, hyper- tensive and hypothyroid animals. Amer. J . Physiol. 171:
23. Hillyard, L. A., C. Entenman, H. Feinberg, and I. L. Chaikoff. 1955. Lipide and protein composition of four fractions accounting for total serum lipoproteins. J. Biol. Chem. 214: 79-90.
24. Fried, M., H. G. Wilcox, G. R. Faloona, S. P. Eoff, M. S. Hoffman, and D. Zimmerman. 1968. The biosyn- thesis of plasma lipoproteins in higher animals. Comp. Biochem. Physiol. 25: 651-661.
25. Ugazio, G., and B. Lombardi. 1965. Serum lipoproteins in rats with ethionine-induced fatty liver. Lab. Invest. 14: 71 1-71 9.
26. Hill, P., and D. Dvornik. 1969. Agents affecting lipid metabolism. XXXVII. Separation of rat serum lipo- proteins with dextran sulfate. Can. J . Biochm. 47: 1043- 1047.
27. Chalvardjian, A. 1971. Agarose-starch gel electrophoresis of rat serum lipoproteins. J. Lipid Res. 12: 265-269.
28. Dudacek, W. E., and K. A. Narayan. 1966. Subfractiona- tion of rat serum low density lipoprotein. Biochim. Biophys. Acta. 125: 604-607.
29. Tawde, S., and B. R. Das. 1962. Studies in experimental hypercholesterolemia in rats. IV. Effect of dietary cho- lesterol on plasma and hepatic protein of adult rats main- tained on high fat diets. J. Lab. Clin. Med. 60: 284-290.
30. Reiser, R., D. A. Clark, M. F. Sorrels, B. S. Gibson, M. C. Williams, and F. H. Wilson. 1966. Tissue cholesterol trans- port as modified by diet cholesterol and the nature of diet fat. J . Atheroscb. Res. 6: 565-579.
31. Narayan, K. A. 1971. Lowered serum concentration of high density lipoproteins in cholesterol-fed rats. Athero- sclerosis. 13: 205-215.
32. Roheim, P. S., D. Rachmilewitz, 0. Stein, and Y. Stein. 1971. Metabolism of iodinated high density lipoproteins in the rat. I. Half-life in the circulation and uptake by organs. Biochim. Biophys. Acta. 248: 315-329.
33. Bersot, T. P., W. V. Brown, R. I. Levy, H. G. Wind- mueller, D. s. Fredrickson, and V. s. LeQuire. 1970. Further characterization of rat plasma lipoprotein apopro- teins. Circulation. 42(Suppl): 111-12.
391-400.
8 Journal of Lipid Research Volume 14, 1973
by guest, on June 11, 2018w
ww
.jlr.orgD
ownloaded from