serious or fatal driver injury rate versus car mass in head-on crashes between cars of similar mass
TRANSCRIPT

Accid. Anal. & Prev. Vol. 19. No. 2, pp. 119-131, 1987 cm-4575187 13Jxl+ Jxl
Printed in Great Britain. 0 1987 Pergamon Journals Ltd.
SERIOUS OR FATAL DRIVER INJURY RATE VERSUS CAR MASS IN HEAD-ON CRASHES
BETWEEN CARS OF SIMILAR MASS
LEONARD EVANS and PAUL WASIELEWSKI General Motors Research Laboratories, Warren, MI 48090, U.S.A.
(Received 5 November 1985; in revised form 11 April 1986)
Abstract-This work was performed to determine relations between car mass and driver injuries (serious or fatal) when cars of similar mass crash into each other head-on. This type of crash is examined because it is considered similar in some respects to a barrier crash. Data from the United States Fatal Accident Reporting System (FARS) are used to examine driver fatality likelihood as a function of car mass when cars of similar mass crash into each other. Pedestrian fatalities involving cars of the same mass are used to estimate exposure. Two additional sources of data (State data from North Carolina and New York) are used to generate information on the number of drivers seriously injured or killed per police reported crash when cars of similar mass crash into each other. The present study finds that the likelihood of driver injury (fatal or serious) when cars of similar mass crash into each other increases with decreasing car mass, both for head- on crashes and for crashes in all directions. The study does not address possible mechanisms that might lead to such relations. All the data analyzed reveal a fairly consistent picture-a driver in a 900 kg car crashing head-on into another 900 kg car is about 2.0 times as likely to be seriously injured or killed as is a driver of a 1800 kg car crashing head-on into another 1800 kg car.
INTRODUCTION
An ongoing issue in car crash safety research has been the relation between barrier crash test results and field data. This issue arises because of the wide variety of types of crashes that occur in the field. Very few crashes are even approximately comparable to a car running at a right angle into a very hard vertical immovable plane surface. One type of crash that is considered a reasonable approximation of a barrier crash is a head-on crash between two identical cars traveling at the same speed. In this idealized case, the dy- namical forces acting on each car are the same as would result if the plane of symmetry between them were replaced by an infinitely hard immovable barrier.
This study examines how driver injuries (serious or fatal) are related to car mass for crashes similar in some respects to the above idealized case. As in prior work (Evans, 1984) comparing the relative crashworthiness of small and large cars, relations between driver injury and car mass do not imply that mass, as such, is the causative factor. The major contribution of this paper involves the application of data in the Fatal Accident Reporting System (FARS) (U.S. Department of Transportation, 1981) to explore how fatality rate depends on car mass when cars of similar mass crash head-on into each other.
As an estimate of exposure for the FARS data, we use the approach introduced by Evans (1984), . m which the number of pedestrians killed in crashes with cars in a given category is interpreted to reflect the exposure of cars in that category to crashes in general. In addition to using the FARS data, the problem is also addressed by analyzing data for the states of New York and North Carolina that are available in published reports (Negri and Riley, 1974; Campbell and Reinfurt, 1973; O’Neill, Joksch and Haddon, 1974). For these data, exposure is estimated by the number of reported accidents.
All three data sources give information for “head-on” crashes as well as for crashes in all directions. However, somewhat different definitions of head-on are used in each case. For the FARS data, head-on means that the principal impact point of damage was at the 12 o’clock position for both cars. Less restrictive criteria are used for the State data; for New York (NY), “full front, left front, right front” for both cars, and for North Carolina (NC) “front into front.”
In both sets of State data, “serious injury” means an “A” category injury. Such injuries include severe lacerations, broken or distorted limbs, skull fractures, crushed
119

120 L. EVANS and P. WASIELEWSKI
chest, internal injuries, unconscious when taken from the accident scene, unable to leave accident scene without assistance or estimated incapacity for more than 24 hours. The judgment of injury severity is made by the police officer reporting the crash.
The numbers of serious injuries and the numbers of fatalities are given lumped together in the State data. However, in general, serious injuries in car crashes exceed fatalities by much more than ten to one (see, e.g. p. 47 of Campbell and Reinfurt, 1973). Thus, little error arises if the findings for “serious injuries plus fatalities” are interpreted to apply to serious injuries.
In this work we seek relations between driver injury (serious or fatal) and car mass when cars of similar mass crash into each other. As in earlier work (Evans, 1982; Evans, 1984) it should be borne in mind that a relationship between car mass and driver injuries does not imply that car mass as such is the causative factor. Clearly, a wide variety of vehicular characteristics are strongly correlated with car mass (e.g. wheelbase, track, “size” in general, hood length, trunk size, engine displacement, etc.).
For the idealized case of identical cars crashing head-on into each other at the same speed, mass as such would appear to be of little direct relevance, and any relations found are more likely indicative of influences due to vehicular characteristics associated with car mass. It is the purpose of the present work to seek empirical relations between car mass and driver injury, and not to address mechanisms that might lead to such relations.
RESULTS
Fatal Accident Reporting System (FARS) Data Here we use FARS data for 19751980 combined to determine the number of drivers
killed in cars of mass mi in crashes with cars of mass mj. The subscripts refer to the same six mass categories as introduced in Evans (1982)) in which two car crashes for 1978 were examined without regard to impact direction. Here we examine two car crashes for both the “head-on” and “all directions” cases. The focus of this work is on crashes involving cars of similar mass; that is, the case i = j. However, as a matter of interest, data are given for the full matrix of values of mi and mj. These data provide a useful supplement to the work of Evans (1982). For ease of comparison, the data are resealed and tabulated in the same manner as in Evans (1982).
The head-on data are based on the variable “principal impact point,” the position on the vehicle of the impact that produced the greatest personal injury or property damage. This variable is coded in 12 “clock points.” Direction of impact force as such is not coded in the FARS data. For the FARS data we define a “head-on” crash as one in which both cars are coded as having principle point of damage at the 12 o’clock position. That is, if either car is coded as, for example, left front (clock point ll), this crash is not included. Hence the data come as close as possible to representing “head-on” crashes, based on FARS data.
Table 1. Number of driver fatalities in cars of mass m, in collisions with cars of mass m,, principal impact point “12 o’clock” for both cars
car i
Mass, kg ‘1 m2 m3 % ‘5 m6 Total
500- 900 q . 14 38 68 136 218 207 681
900-l 100 m2 13 43 68 la6 264 274 048
cm i 1100-1300 m3 17 34 65 168 253 268 805
1300-1500 In& 17 29 92 252 407 445 1242
1500-1800 m5
10 44 73 222 450 573 1372
1800-2400 m6
10 31 50 152 326 367 936
Total a1 219 416 1116 1918 2134 5884

Driver injury rate versus car mass 121
Table 2. Number of driver fatalities in cars of mass mi in collisions with cars of mass m,, all impact points
COG j
Mess, kg ml Y m3 m4 %l m6
Total
500- 900 ml 34 79 156 352 562 578 1781
900-1100 m2 33 86 165 396 679 693 2052
cam i flOO-1300 m3 36 74 171 443 604 698 2106
1300-I500 "4 47 79 226 604 1088 1132 3176
1500-1800 m, 34 95 189 558 1071 1253 3200
The numbers of two car crashes involving cars in the six mass categories are shown in Table 1 for the head-on case and in Table 2 for the all directions case. From these tables we see that about 40% of all fatal two car crashes are head-on crashes. Head-on crashes compose a much smaller percentage of two car crashes with less severe injuries.
In order to convert the fatality data in Tables 1 and 2 into relative fatality likelihoods, we use pedestrians killed to estimate exposure. That is, the exposure of cars in the ith mass category, Ei, is given by the number of pedestrians killed in crashes involving cars in the mi mass category, which are displayed in Table 3. The rationale and justification for this is explained in detail in Evans (1984). The average masses shown in Table 3 are identical to those in Evans (1982), which are based on 86 million car registrations as of July 1, 1978, as compiled by the R. L. Polk Company. The average masses of the cars involved in the pedestrian fatalities, the head-on crashes and the all directions crashes, differ from these and from each other by amounts too small to be of any consequence to the present study. So, for simplicity and consistency with prior work (Evans, 1982), the average masses in Table 3 are based on the Polk data for both the head-on and the all directions case. Note that the average mass for the lightest category reflects that the cars in this category tend to concentrate towards the upper value of the mass range. For the data used here, the lightest car involved in a fatal two-car crash had a mass of 726 kg.
The relative Iikelihood of a driver fatality, R,, is given by the number of drivers killed divided by the exposure of each involved car, or
where the &j’s are from Table 1 or Table 2 and the Els and E,‘s are from Table 3. Note that this approach to determine relative fatality likelihoods is quite different from that of Evans (1982) in which no exposure information was used. Instead, it was assumed that when cars of the same mass crash, the relative fatality likelihood is the same as that found
Table 3. Number of pedestrian fatalities by mass of involved car
Mesa, kg Number of Pedestrian Range Average Patalitiea I
500- 900 cl26 ml
1152
900-1100 991 % 1554
1100-1300 1209
m3
2455 1300-1500 1403 m, 5231 I
1500-1800 1654 "5
8233
1800-2400 1992 m6 8346
Total 26971

122 L. EVANS and P. WASI~EWSKI
Table 4. Relative liketihood of driver fatality in car mass m, involved in a two car crash with car mass m,, principal impact point “12 o’clock” for both cars
C*‘C j
for non-two car crashes. Hence the earlier analysis could not provide any information on relative fatality likelihood for crashes between cars of similar mass.
In order to produce relative fatality likelihood matrices in the same form as in Evans (1982), values of Rij computed by eqn (1) are resealed so that the nomially most extreme case, that of the heaviest car (vQ,) crashing into the lighest (ml), has the value one. The results are shown in Table 4 for the head-on case and in Table 5 for the all directions case.
The focus of this work is on cars of similar mass crashing into each other; that is, the case i = j, represented by the diagonal elements of the 6 x 6 matrices in Tables 4 and 5, which are highlighted in these tables. The data generating these diagonal elements are, for convenience, given again later in Table 6. The same six relative driver fatality likelihoods highlighted in Tables 5 and 6, which will be designated by y(mJ, may be directly calculated to within a scaling factor from the data in Table 6 as
In order to investigate relations between car mass and relative driver fatality rate, the six values of y for the head-on and the all directions cases are fitted to the exponential function
y = a exp(bM)
by a weighted least squares regression of log(y) on M. The variable M represents the masses of both cars involved in the two car crash, each of which is in the same mass category. In the analysis, the average mass for the category (see Table 3) is used as the numerical value of M.
The weighting function for each data point is taken throughout this report to be the reciprocal of the variance of the estimate of log(y). The variance of y is assumed to
Table 5. Relative likelihood of driver fataiity in car mass m, involved in a two car crash with car mass m,, all impact points
car j

Driver injury rate versus car mass 123
Table 6. Relative likelihood of a driver fatality when cars in the same mass category crash into each other using FARS data given in Tables l-3; the relative fatality likelihoods are resealed so that a 1800 kg car crashing into a 1800 kg car is assigned the value one, as determined by fitting eqn (3) to the data
as explained in the text
I- nars, kg Interval Average
500- 900 826
900-1100 991
1100-1300 1209
1300-1500 1403
1500-1800 1654
1800-2400 1992
All Impact Directions
34 1.71 1.72
86 2.89 2.39
171 1.75 1.90
604 1.50 1.48
1071 1.08 1.06
878 0.86 0.85
I All Impact Head-on Directions
consist of two components. The first, a:, reflects variance due to unknown sources, such as for example, the possibility that y is a function of model year or car make, and that cars of different makes and model years are placed in different categories.
Based on the data in the present study, and prior similar data (Evans, 1984) we assume or = 0.1 y; that is, even for large sample sizes, adjacent cells still vary by about 10%.
The second, of, arises from the random variation in the numbers that define the ratio y. In the case ‘of the FARS data, the quantities d and E are assumed to arise from independent Poisson processes. Hence
and
crf(Y) = (l/d + 4/E)y2 (4)
1 Y2 1
lV = &(log y) C-Z
u; + 4 l/d + 4/E + u:ly2 ’
Later we show that the results are robust with respect to different choices of weighting procedures.
From the weighted fit of the data to eqn (3) we obtain 6 = - 0.000 980 kg-’ for the head-on case and 6 = -0.000 912 kg-’ for the all directions case (the parameter a is merely a scaling constant which will not be further discussed, especially as the data are resealed as discussed below).
Based on these fits to the data, the six values of relative fatality likelihood are divided by the value for M = 1800 kg. That is, all are expressed relative to a value one for a 1800 kg car crashing into another 1800 kg car. We choose this value, rather than, say, selecting the largest mass category as the basis of comparison as is shown in Tables 4 and 5, so that other results, from data divided into different mass categories, may be easily compared.
It is convenient to characterize the relationship between likelihood of driver injury (fatal or serious) and car mass when cars of similar mass crash by an illustrative example. We choose to compare a 900 kg car crashing into a 900 kg car to a 1800 kg car crashing into a 1800 kg car. Using the above values of b we obtain for the all directions case
y(M = 900 kg)ly(M = 1800 kg) = 2.27 (6)
and
y(900 kg)ly(1800 kg) = 2.42 (7)
for the head-on case.

124 L. EVANS and P. WASIELEWSKI
Table 7. Relative likelihood of a driver serious injury or fatality when cars in the same mass category crash head-on into each other using data from New York State; the relative fatality likelihoods are resealed so that a 1800 kg car crashing, into a 1800 kg car is assigned the value one, as determined by
- fitting n (3) to the data as explainedin the text
Average No. of Nass, kg Crashes
52
Drivers Injured
or Killed
8
P, Percent &scaled
New York State (NY) Data Negri and Riley (1974) give 186 cross tabulations of data on accidents occurring in
New York State in 1971 and 1972. Ten of these are used as data for the present study. For the head-on case we use four tables on pages 54-57 inclusive, together with four
tables on pages 60-63 inclusive of Negri and Riley (1974). Each of these eight tables gives a count of either accidents or drivers seriously injured or killed (denoted in the source as S + E) by direction of impact, mass of each involved car, and whether each driver was belted or unbelted. Data with the same variables, but irrespective of indicated belt use (that is, including the much larger quantity of data for which no information was coded for this variable), are not given. Clearly, there are insufficient data to investigate indicated belt use as a factor in this study. Summing the data in these tables over the four combinations of each driver belted or unbelted gives the data shown in Table 7.
The average masses of the first and last categories were estimated using a mass distribution for the U.S. car fleet based on R. L. Polk registration data for 1978 (Evans, 1982). The average masses of the three central categories are taken to be the center of their categories.
The variable used to characterize relative driver injury is P, the proportion of drivers involved in two car crashes who are seriously injured or killed; P is defined by
P = Al(2N) (8)
where A is the number of drivers seriously injured or killed and N is the number of two- car crashes. The factor 2 arises because each two-car crash has two involved drivers. The statistical variance of P, 4(P), is given by the usual result for the variance of an estimated proportion,
u;;(P) = P(l - P)l(2N). (9)
Plans of each CBT, lb.
Estimated Average Interval Average Mass, kg
I I
1000-1999 1830 830 870 37 1 ( 2.29 2.13
2000-2499 2250 1021 1 238 49 1.98 2.13
2500-3249 2075 1304 21 238 655 1.54 1.66
3250-3999 3625 1644 59 256 1283 1.08 1.16
4000-5499 4420 2005 13 902 ( 208 I 0.75 I 0.80
Table 8. Relative likelihood of a driver serious injury or fatality when cars in the same mass category crash into each other (all directions) using data from New York State; the relative fatality likelihoods are resealed so that a 1800 kg car crashing into a 1800 kg car is assigned the value one, as determined
by fitting eqn (3) to the data as explained in the text
I I

Driver injury rate versus car mass 125
It is assumed that the variable P reflects the physical properties of the car, essentially independent of driver behavior, in the same way as previously discussed (Evans, 1984) for driver fatalities per pedestrian fatality. If a car is driven, for example, longer distances or more recklessly then it is reasonable to presume that both injuries and crashes increase in similar proportions.
The variable P was fitted to eqn (3), to give b = -0.000 578 kg-l. Using this fit the P values are shown resealed in Table 7 relative to a value one for a 1800 kg car crashing into a 1800 kg car.
Using the above values of b we obtain for the head-on case
y(900 kg)ly(1800 kg) = 1.68. (10)
The indicated belt use in the sample used above (41% for involved drivers and 27% for seriously injured or killed drivers) probably reflects large biases that arise from con- sidering only cases for which use or non-use is specifically coded. Repeating the above analysis using only the subset of the previous data where drivers are coded as unbelted gives b = -0.000 616 kg-’ and y(900 kg)ly(1800 kg) = 1.74, essentially the same as reported above.
For the all directions case we use the data given in the tables on page 27 and 19 of Negri and Riley (1976). These data, which are disaggregated into two categories by vehicle model year, include cases with belt use unknown-only data for cars (obviously few in number) of unknown model year are excluded, leading to much larger sample sizes than were available for the head-on case. The data, summed over all model years, are given in Table 8. Fitting eqn (3) to the values of P gives b = -0.000 947 kg-‘, which, as before, is used to express all values relative to a value one for a 1800 kg car crashing head-on into another 1800 kg car. From this fit we obtain
y(900 kg)ly(1800 kg) = 2.35 (11)
for the all directions case.
North Carolina (NC) Data The starting point for the North Carolina analysis of head-on crashes is the 6 X 6
matrix reproduced from Campbell and Reinfurt (1973) in Table 9. Each cell of this matrix contains three numbers. The integer in the lower left corner of each cell is the number of head-on crashes between cars in the indicated pair of mass categories (the mass category definitions are shown in Table 10) through Al6 for mass category definitions. The two other numbers in each cell of represent an estimate of the percent of drivers seriously injured or killed in one of the cars when it is in collision with the other. Note that this is an estimate and not the actual number, which is not given. Campbell and Reinfurt (1973) wrote:
“Since the percentages using the raw frequences are especially subject to random fluctuations, the percentages are calculated using a statistical model. With those mod- eled percentages removing much of the random fluctuations, the resulting table is “smoother” and trends are easier to interpret.”
From the percents in Table 9, the estimated numbers of drivers seriously injured or killed for the diagonal elements of Table 9 are readily calculated and are displayed in Table 10. For example, for the case of cars in the lightest category we have 80 X 0.0956 + 80 X 0.0893 = 14.8. The two percents in the diagonal elements in Table 9 are nominally identical, because for the head-on case it is arbitrary which is car i and which is car j.
The estimated average masses are the mid-points of the ranges, except for the case of the first and last categories. The average masses for these were estimated using a mass distribution for the U.S. car fleet based on R. L. Polk registration data for 1978 (Evans, 1982).

126 L. EVANS and P. WASIELEWSKI
Table 9. Expected percentages, based on a linear smoothing calculation, of seriously and fatally injured drivers in front-to-front crashes by vehicle weight (reproduction of Table 6, page 29, of Campbell and
Reinfurt (1973)
* Relative &ire md dir.ctios of the .ttm corrapoad to veiaht of vehicle d direction of iwrct.
The numerator in the proportion P is an estimated value rather than a count, as would be required, in principle, for the application of eqn (9). We apply eqn (9) none- theless as an approximation in computing the weighting factor for the regression, expecting that it provides a reasonable estimate of at least the relative variance of the individual vahtes of P.
Fitting eqn (3) to the data in Table 10 gives b = - 0.000 785 kg-‘, which, as before, is used to express all values relative to a value one for a 1800 kg car crashing head-on into another 1800 kg car.
Table 10. Relative likelihood of a driver serious injury or fatality when cars in the same mass category crash head-on into each other using data from North Carolina; the relative injury like~ih~ds are resealed so that a 1800 kg car crashing head-on into a 1800 kg car is assigned the value one, as determined by
fitting ean (3’1 to the data as exulained in the text
&We of each COT, lb.
Estinatcd Interval Average
~2700 2190
2700-3099 2900
3100-3299 3200
3300-3699 3500
3700-4099 3900
+oo 4484
Average Mass, kg
993 80
1315 152
1451 174
1588 236
1769 249
2034 87
1.74
1.35
1.65
1.18
0.86
0.92

Driver injury rate versus car mass 127
Table 11. Relative likelihood of a driver serious injury or fatality when cars in the same mass category crash into each other (all directions) using data from North Carolina; the relative injury likelihoods are resealed so that a 1800 kg car crashing into a 1800 kg car is assigned the value one, as determined by
-fitting eqn (3) to the data & explainedin the text
Mass of each c~lr, lb. Drivers Injured
Estimated Average No. of P, Interval Average Uaasa, kg Crashes KilTid Percent Resealed
<2700 2I90 993 358 43 6.01 2.21
2700-3099 2900 1315 563 31 2.75 1.01
3100-3299 3200 1451 763 67 4.39 1.62
3300-3699 3500 1588 848 59 3.48 1.28
3700-4099 3900 I769 1097 51 2.32 0.86
24100 4484 2034 441 23 2.61 0.96
Using this value of b gives, for the head-on case,
y(900 kg)ly(1800 kg) = 2.03.
For the all directions case we use data in Table I, Table II and Table III of O’Neill, Joksch and Haddon (1974), which present raw data in similar format to Table 9 for front- front, front-side and front-rear crashes. The front-front data are clearly the raw data from which Table 9 was derived. An analysis similar to that above using these raw data rather than the smoothed values in Table 9 led to a very noisy relationship, presumably due to random fluctuations associated with the small sample sizes. The slope of the exponential regression based on these noisy data is not statistically significantly different from zero at even the 10% level (the slope however has the same sign as the other regressions reported -the nominal value of ~(900 kg)ly(1800 kg) is 1.6).
The numbers of drivers killed or injured, and the number of accidents, for the all directions case were obtained by summing values over all three directions. This was done by multiplying the number of accidents by the given percent of drivers injured or killed and dividing by 100. This process revealed a number of small errors in the three source tables as implied by a few indications of nonintegral numbers of drivers seriously injured or killed. This, together with many cases of inconsistent rounding suggests that these data were produced by hand from some other source. However, these errors are considered to have little influence on the diagonal elements of interest here, which are given in Ta- ble 11.
Fitting the values of P to Equation 1 gives b = -0.000 854 kg-l. Using this fit, the values are shown resealed in Table 11 relative to a value one for a 1800 kg car crashing into a 1800 kg car.
Using this value of b in eqn (1) we obtain for the all directions case
~(900 kg)ly(1800 kg) = 2.16. (11)
SUMMARY OF RESULTS
The likelihood, y, of driver injury (fatal or serious) when cars of similar mass crash into each other relative to a value one for the case of two 1800 kg cars crashing into each other is shown plotted versus M, the common mass, in Fig. 1 (head-on) and Fig. 2 (all directions). The values of all the points plotted are from the earlier tables.
The previously reported ratios of the likelihood of driver injury (serious or fatal) when two 900 kg cars crash into each other relative to that when two 1800 kg cars crash into each other are summarized in Table 12 for the head-on case and in Table 13 for the all directions case.
The results in Tables 12 and 13 and Figs. 1 and 2 are all based on a weighted
128 L. EVANS and P. WASIELEWSKI
3.0
2.5
2.0
Y
1.5
1.0
L
0
ALL DIRECTION CRASHES
0 ” 1000 1500 2000
Mass of each car (M), kg
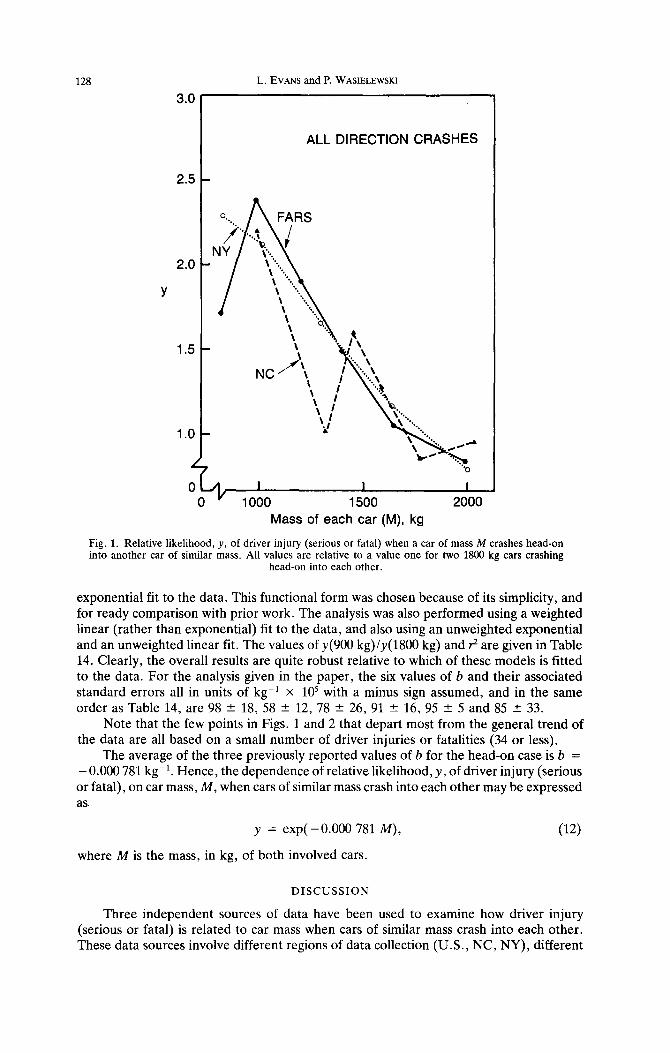
Fig. 1. Relative likelihood, y, of driver injury (serious or fatal) when a car of mass M crashes head-on into another car of similar mass. All values are relative to a value one for two 1800 kg cars crashing
head-on into each other.
exponential fit to the data. This functional form was chosen because of its simplicity, and for ready comparison with prior work. The analysis was also performed using a weighted linear (rather than exponential) fit to the data, and also using an unweighted exponential and an unweighted linear fit. The values of ~(900 kg)ly(lSOO kg) and ? are given in Table 14. Clearly, the overall results are quite robust relative to which of these models is fitted to the data. For the analysis given in the paper, the six values of b and their associated standard errors all in units of kg-’ x lo5 with a minus sign assumed, and in the same order as Table 14, are 98 2 18, 58 ? 12, 78 ? 26, 91 + 16, 95 + 5 and 85 2 33.
Note that the few points in Figs. 1 and 2 that depart most from the general trend of the data are all based on a small number of driver injuries or fatalities (34 or less).
The average of the three previously reported values of b for the head-on case is b = - 0.000 781 kg-‘. Hence, the dependence of relative likelihood, y, of driver injury (serious or fatal), on car mass, M, when cars of similar mass crash into each other may be expressed as.
y = exp( -0.000 781 M),
where M is the mass, in kg, of both involved cars.
(12)
DISCUSSION
Three independent sources of data have been used to examine how driver injury (serious or fatal) is related to car mass when cars of similar mass crash into each other. These data sources involve different regions of data collection (U.S., NC, NY), different

Driver injury rate versus car mass 129
3.0
2.5
2.0
Y
1.5
1.0
; 0 v 1000 1500 2000
Mass of each car (M), kg
Fig. 2. Relative likelihood, y. of driver injury (serious or fatal) when a car of mass M crashes into another car of similar mass (all directions). All values are relative to a value one for two 1800 kg cars
crashing into each other.
times of data collection (1975-1980 for U.S.; 1966, 1968-71 for NC; and 1971-72 for NY), different measures of driver injury (fatalities or serious injuries plus fatalities), different measures of exposure (pedestrian fatality or police reported accident) and dif- ferent directions of impact (all directions or head-on only). Despite these differences, a fairly consistent picture emerges.
The data in Tables 12 and 13 and Figs. 1 and 2 are compatible with the interpretation that the effects are similar for driver fatality per pedestrian fatality and for drivers injured or killed per police reported two car crash. Note that the measure injuries per police reported two car crash may be more reflective of physical attributes of the car, than the same measure for the case of single car crashes. The distinction arises because of a presumed lower probability of reporting a single car crash that does not immobil~e the
Table 12. Summary of the ratios of driver injury (serious or fatal) when two 900 kg cars crash head-on into each other to that when two 1800 kg cars crash into each other
I ytH = 900 ksf Driver Injury yfM - 1800 kg)
fetal 2.62
serious or fatal 1.68
serious or fatal 2.02
mea" 2.04
standard deviation 0.37

130 L. EVANS and P. WASIELEWSKI
Table 13. Summarv of the ratios of driver iniurv (serious or fatal) when two 900 kg cars crash into each other (all direction s) 1 to that \;lhin ‘two 1800 kg ca;s crash into eackother
Data
FARS
NY
NC
y(M - 900 kg) Driver Injury y(M = 1800 kg)
fatal 2.27
serious or fatal 2.35
serious or fatal 2.16
mean 2.26
standard deviation 0.10
vehicle. The results further suggest that fatalities are approximately proportional to in- juries, and that the mass relations for the head-on case are not too different from those for the all directions case.
A related study of the effect of car mass on two vehicle head-on crashes has been carried out by Grime and Hutchinson (1979) using British crash data. These authors give the percentage of driver injuries of various severities as a function of car mass for crashes between vehicles of similar mass with at least one driver injury. They find these per- centages to be independent of vehicle mass. Their results suggest that the distribution of injury severities in injury producing two-vehicle crashes is not related to vehicle mass, but they do not provide direct information in the likelihood of an injury occurrence given a crash and thus their results are not directly comparable with the results of the present study.
Because the data represent different accident years, with consequently different mixes of model year cars, the effects obtained cannot be attributed to confounding effects of model year.
The results suggest that the relations between car mass and injury likelihood are similar for the head-on and all directions cases.
This work offers further support that the likelihood of driver injury or fatality in crashes between cars of similar mass increases as the masses of the cars involved decrease. The relationship may be illustrated by the example that a driver in a 900 kg car in a head- on crash with another 900 kg car is about 2.0 times as likely to be killed or injured as is a driver of a 1800 kg car in a head-on crash with another 1800 kg car.
Table 14. Values of ~(900 kg)/y(1800 kg) and 9 based on fitting the data in different ways to different functions
Direction of Impact
t

Driver injury rate versus car mass 131
REFERENCES
Campbell B. J. and Reinfurt D. W. Relationship between driver crash injury and passenger car weight, Univ. North Carolina Highway Safety Research Center, Chapel Hill, NC, November 1973.
Evans L. Car mass and likelihood of occupant fatality, Sot. Automotive Eng. Paper #820807, Troy, MI, 1982. Evans L. Driver fatalities versus car mass using a new exposure approach, Accid. Anal. Prev. 16:19-36, 1984. Grime G. and Hutchinson T. P. Vehicle mass and driver injury, Ergonomics 293-104, 1979. Negri D. D. and Riley R. K. Two car collision study II, Report No. DOT-HS-245-2-478-4, State of New York
Department of Motor Vehicles, June 1974. O’Neill B., Joksch H. and Haddon W. Relationship between car size, car weight and crash injuries in car-to-
car crashes, Proc. 3rd ht. Congress on Automotive Safety, July 15-17, 1974, pp. 2-l-2-27. U.S. Department of Transportation, National Highway Traffic Safety Admin., Fatal Accident Reporting System,
1981 (issued annually).