september acquire | discover | finance | …€¢ rcf for an aggregate of $500 m (can be increased...
TRANSCRIPT

SEPTEMBER
2017
ACQUIRE | DISCOVER | FINANCE | BUILD | OPERATE
ONE OF THE WORLD’S FASTEST-GROWING GOLD PRODUCERS
CAUTIONARY STATEMENT
This presentation includes certain “forward-looking information” and “forward-looking statements” (collectively “forward-looking statements”) within the meaning of applicable securities legislation, including projections of future financial and operational performance; statements with
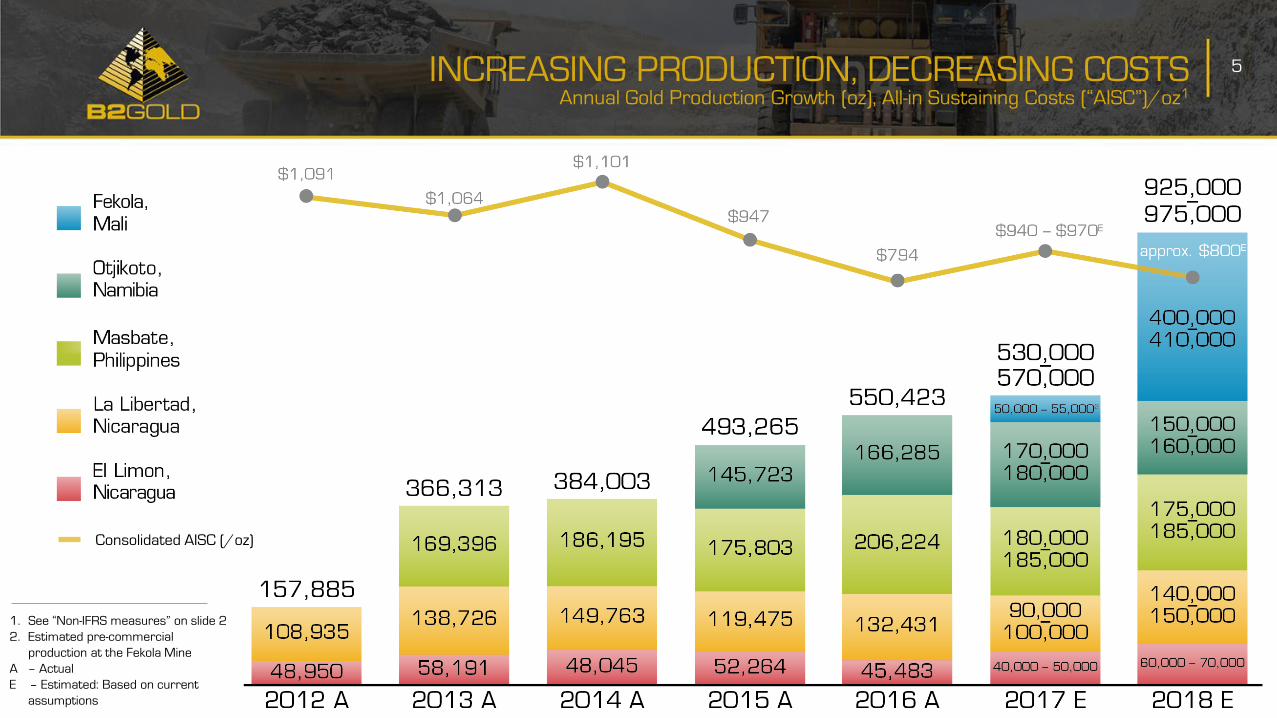
respect to future events or future performance; production estimates and guidance, including the Company’s projected gold production of between 530,000 to 570,000 ounces in 2017 and projected gold production of between 925,000 and 975,000 ounces in 2018; projected
operating and production costs and guidance; estimates of capital expenditures and planned investments and budgets, including exploration budgets; and statements regarding anticipated exploration, development, construction, production, permitting and other activities of the
Company, including: the Fekola Project being approximately 3 months ahead of schedule and beginning production in October 2017; Fekola achieving commercial production before the end of 2017, on budget and being fully funded; Fekola being a low-cost mine and anticipated stockpiling
there; the State of Mali exercising its option to acquire an additional 10% interest in the Fekola Project, for an aggregate 20% interest; timing and completion of the Fekola mill expansion and the resulting potential production increase and throughput of up to 5 Mtpa in the initial years of
production, and the potential to increase estimated production at Fekola; the potential to extend the current Fekola Life of Mine by 3 years and 900,000 ounces if the known Fekola Mine resource for Fekola is included; potential for Fekola Project to host additional large Fekola-style gold
deposits; Kiwi zone increasing the initial Fekola Mine life and potentially increasing the size of the Fekola open pit; potential for underground mining at Fekola Deeps; completion of geotechnical, hydrogeological and design studies for the Wolfshag zone and life of mine production plans for
the Otjikoto Mine; completion of an initial mineral resource for the Toega zone by the end of 2017 and the potential for additional mineralization there; the audit by the DENR in relation to the Masbate Mine and the final outcome thereof and operations at Masbate continuing
uninterrupted; the production estimates for Masbate which are prepared on such basis initiating an enhanced mill expansion study at Masbate; the completion of a new resource for the new zone gold discovery near the El Limon mill; the completion of a Mining Tailing Study at El Limon;
deliveries of ounces under the Prepaid Sales arrangements; optimizing production at existing mines; exploration plans; exploration and development upside; future cash flows; planned updates to studies and models; availability of financings; expectations of future growth and profitability;
maintenance of a strong cash position; continued minimization of share dilution; pursuit of accretive acquisitions; and the adequacy of capital for continued operations. Estimates of mineral resources and reserves are also forward-looking statements because they constitute projections,
based on certain estimates and assumptions, regarding the amount of minerals that may be encountered in the future and/or the anticipated economics of production, should a production decision be made. All statements in this presentation that address events or developments that
we expect to occur in the future are forward-looking statements. Forward-looking statements are statements that are not historical facts and are generally, although not always, identified by words such as “expect”, “plan”, “anticipate”, “project”, “target”, “potential”, “schedule”, “forecast”,
“budget”, “estimate”, “intend” or “believe” and similar expressions or their negative connotations, or that events or conditions “will”, “would”, “may”, “could”, “should” or “might” occur.
Forward-looking statements necessarily involve assumptions, risks and uncertainties, certain of which are beyond B2Gold’s control, including risks associated with the volatility of metal prices and the Company’s common shares; risks and dangers inherent in exploration, development
and mining activities; uncertainty of reserve and resource estimates; risk of not achieving production, cost or other estimates; risk that actual production, development plans and costs differ materially from the estimates in the Company’s feasibility studies; risks related to ore purchase
commitments; the ability to obtain and maintain any necessary permits, consents or authorizations required for mining activities; risks related to environmental regulations or hazards and compliance with complex regulations associated with mining activities; the ability to replace mineral
reserves and identify acquisition opportunities; availability of financing and financing risks; risks related to operations in foreign and developing countries and compliance with foreign laws; risks related to remote operations and the availability adequate infrastructure, fluctuations in price
and availability of energy and other inputs necessary for mining operations; regulatory, political and country risks; the final outcome of the DENR audit; as well as other factors identified and as described in more detail under the heading “Risk Factors” in B2Gold’s most recent Annual
Information Form and B2Gold’s other filings with Canadian securities regulators and the U.S. Securities and Exchange Commission (the “SEC”), which may be viewed at www.sedar.com and www.sec.gov, respectively. The list is not exhaustive of the factors that may affect the Company’s
forward-looking statements. There can be no assurance that such statements will prove to be accurate, and actual results, performance or achievements could differ materially from those expressed in, or implied by, these forward-looking statements. Accordingly, no assurance can be
given that any events anticipated by the forward-looking statements will transpire or occur. The Company’s forward-looking statements reflect current expectations regarding future events and operating performance and speak only as of the date hereof and the Company does not
assume any obligation to update forward-looking statements if circumstances or management's beliefs, expectations or opinions should change other than as required by applicable law. For the reasons set forth above, undue reliance should not be placed on forward-looking statements.
Non-IFRS Measures :
This presentation includes certain terms or performance measures commonly used in the mining industry that are not defined under International Financial Reporting Standards (“IFRS”), including “cash operating costs” and “all-in sustaining costs” (or “AISC”). Non-IFRS measures do not
have any standardized meaning prescribed under IFRS, and therefore they may not be comparable to similar measures employed by other companies. The data presented is intended to provide additional information and should not be considered in isolation or as a substitute for
measures of performance prepared in accordance with IFRS and should be read in conjunction with B2Gold’s consolidated financial statements. Readers should refer to B2Gold’s management discussion and analysis, available under B2Gold’s corporate profile at www.sedar.com and at
www.sec.gov or on its website at www.b2gold.com, under the heading “Non-IFRS Measures” for a more detailed discussion of how B2Gold calculates such measures and a reconciliation of certain measures to IFRS terms.
National Instrument 43-101:
Tom Garagan, Senior Vice President of Exploration, a Qualified Person as defined by National Instrument 43-101, has approved the scientific and technical information concerning B2Gold Corp. discussed herein.
Cautionary Note to United States Investors:
As a Canadian issuer that is eligible to use the U.S./Canada Multijurisdictional Disclosure System (MJDS), the Company is permitted to prepare its public disclosures and this presentation in accordance with Canadian securities laws, which differ in certain respects from U.S. securities
laws. In particular, this presentation uses the terms “mineral resource”, “measured mineral resource”, “indicated mineral resource” and “inferred mineral resource”. While these terms are recognized and required by Canadian securities laws, they are not recognized by the United
States Securities and Exchange Commission (“SEC”) and are not normally permitted to be disclosed in SEC filings by U.S. companies. U.S. investors are cautioned not to assume that any part of a “mineral resource”, “measured mineral resource”, “indicated mineral resource” or an
“inferred mineral resource” will ever be converted into a “reserve.” In addition, “reserves” reported by the Company under Canadian standards may not qualify as reserves under SEC standards. Under SEC standards, mineralization may not be classified as a “reserve” unless the
mineralization can be economically and legally extracted or produced at the time the “reserve” determination is made. Accordingly, information contained or referenced in this presentation containing descriptions of the Company’s mineral deposits may not be compatible to similar
information made public by U.S. companies subject to the reporting and disclosure requirements of U.S. federal securities laws, rules and regulations. “Inferred mineral resources” have a great amount of uncertainty as to their existence and great uncertainty as to their economic and
legal feasibility. It cannot be assumed that all or any part of an inferred mineral resource will ever be upgraded to a higher category. Historical results or feasibility models presented herein are not guarantees or expectations of future performance.
Currency: All amounts in this presentation are expressed in United States dollars, unless otherwise stated. THIS PRESENTATION IS NOT INTENDED AS, AND DOES NOT CONSTITUTE, AN OFFER TO SELL SECURITIES OF THE COMPANY.
The Toronto Stock Exchange and the NYSE MKT LLC have not reviewed and do not accept responsibility for the accuracy or adequacy of this presentation, which has been prepared by the Company.
2

Corporate Strategy: To continue growing a profitable and responsible gold producer through
accretive acquisitions, exploration and execution, irrespective of the gold price
3
ONE OF THE
WORLD’S FASTEST-
GROWING GOLD
PRODUCERS
Proven Management and Technical Teams
• Former management and technical teams of Bema Gold Corporation
• Highly experienced in-house technical and on-site operational teams
• In-house project due diligence, development and construction teams
• Proven history of acquiring, discovering, financing, building and operating profitable gold mines
around the world
• Track record of building shareholder value
Growing, Profitable, Low-Cost Gold Producer
• 5 operating gold mines: 2 in Nicaragua, 1 in the Philippines, 1 in Namibia and 1 in pre-production in Mali
• Unparalleled production growth
• Mill construction is complete at the Fekola Mine in Mali, more than 3 months ahead of schedule. Gold is
in the circuit and the first gold pour is anticipated by mid-October 2017
• The Fekola Mine is projected to achieve commercial production by year-end 2017
• Solid financial and cash position
• Proven financing history and capability
• Significant organic growth potential through exploration and development upside
CORPORATE OVERVIEW
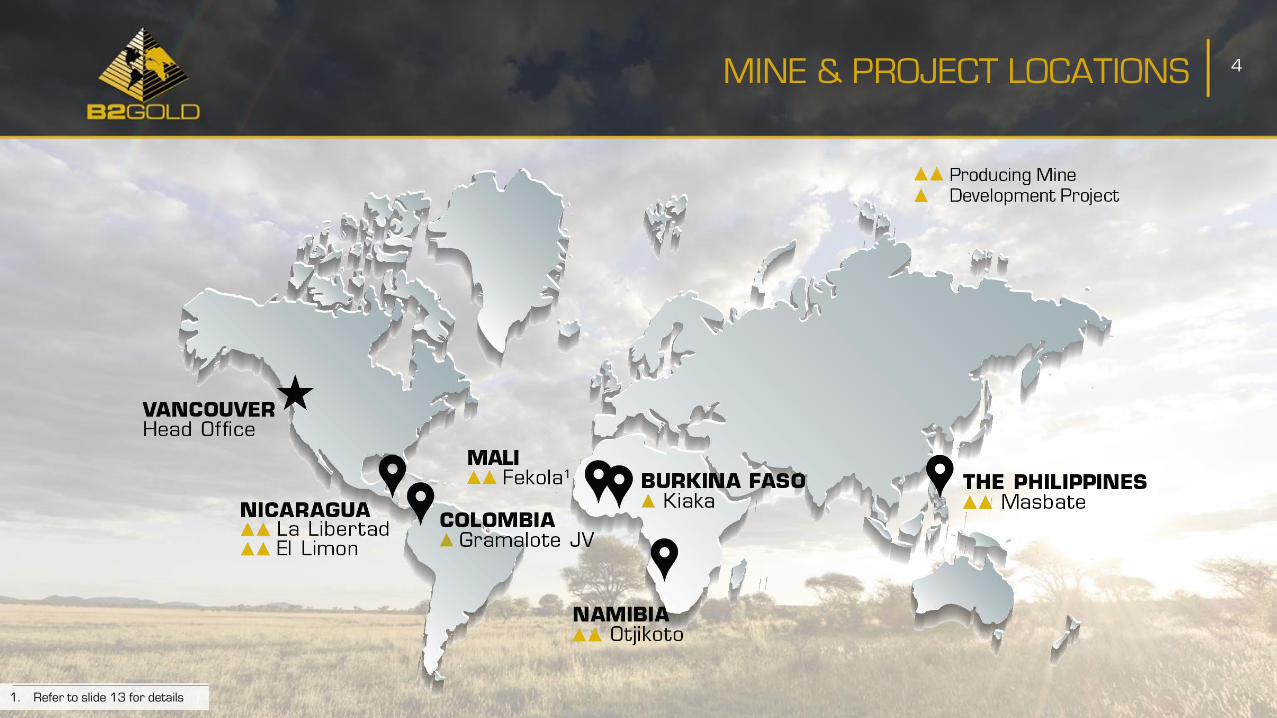
1. Refer to slide 13 for details
4MINE & PROJECT LOCATIONS
5
Consolidated AISC (/oz)
INCREASING PRODUCTION, DECREASING COSTSAnnual Gold Production Growth (oz), All-in Sustaining Costs (“AISC”)/oz1
1. See “Non-IFRS measures” on slide 2
2. Estimated pre-commercial
production at the Fekola Mine
A – Actual
E – Estimated: Based on current
assumptions
6
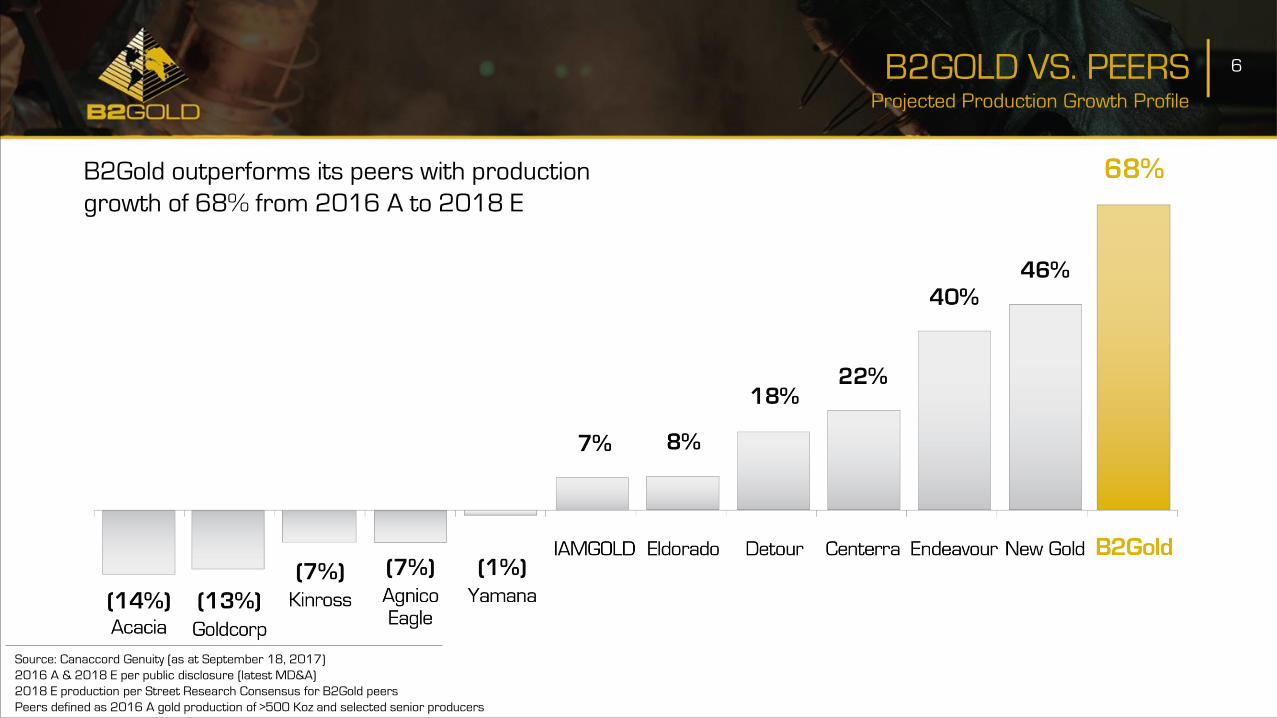
Source: Canaccord Genuity (as at September 18, 2017)
2016 A & 2018 E per public disclosure (latest MD&A)
2018 E production per Street Research Consensus for B2Gold peers
Peers defined as 2016 A gold production of >500 Koz and selected senior producers
B2Gold outperforms its peers with production
growth of 68% from 2016 A to 2018 E
B2GOLD VS. PEERSProjected Production Growth Profile

1. Source: Canaccord Genuity (as at September 7,
2017, and indexed to September 15, 2015)
Prices shown are closing prices in Canadian
dollars
BTO PERFORMANCE VS. S&P TSXGold Index & Gold Price (2 Year)
7
GDXJ Rebalancing
(March – June 2017)
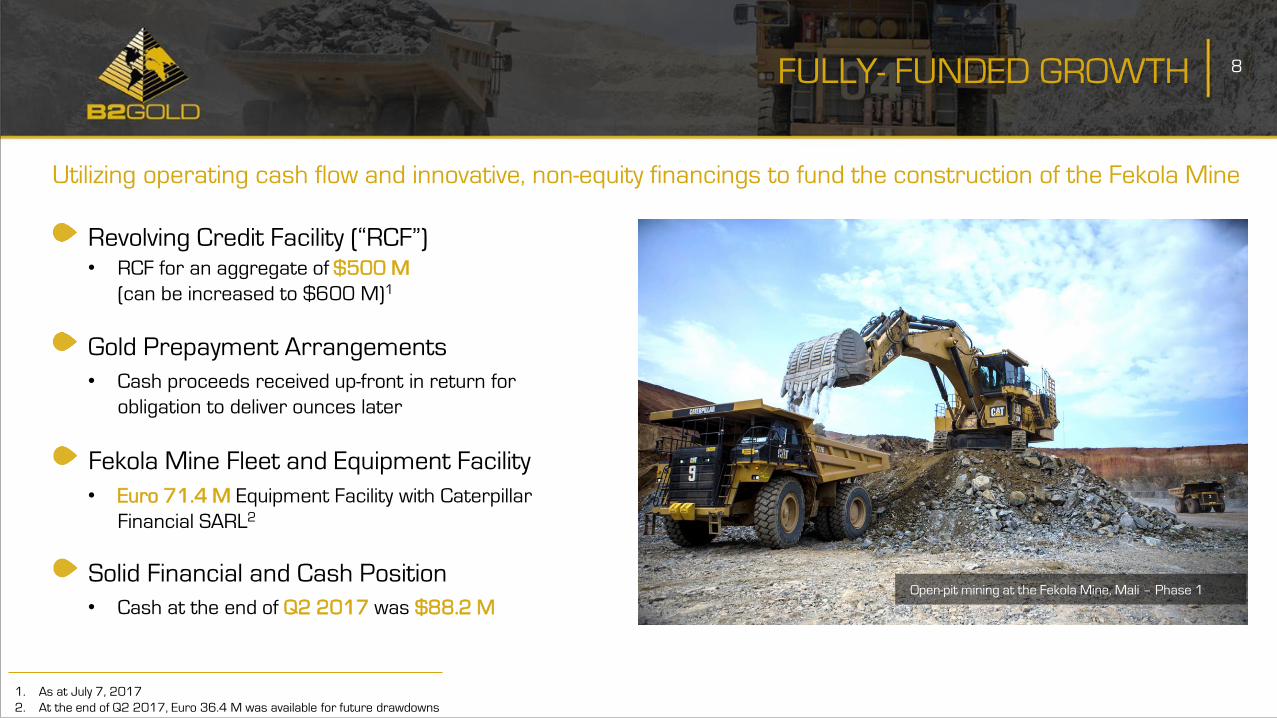
• RCF for an aggregate of $500 M
(can be increased to $600 M)1
8
Utilizing operating cash flow and innovative, non-equity financings to fund the construction of the Fekola Mine
• Cash proceeds received up-front in return for
obligation to deliver ounces later
Revolving Credit Facility (“RCF”)
Gold Prepayment Arrangements
FULLY- FUNDED GROWTH
Open-pit mining at the Fekola Mine, Mali – Phase 1
1. As at July 7, 2017
2. At the end of Q2 2017, Euro 36.4 M was available for future drawdowns
• Euro 71.4 M Equipment Facility with Caterpillar
Financial SARL2
• Cash at the end of Q2 2017 was $88.2 M
Fekola Mine Fleet and Equipment Facility
Solid Financial and Cash Position
9
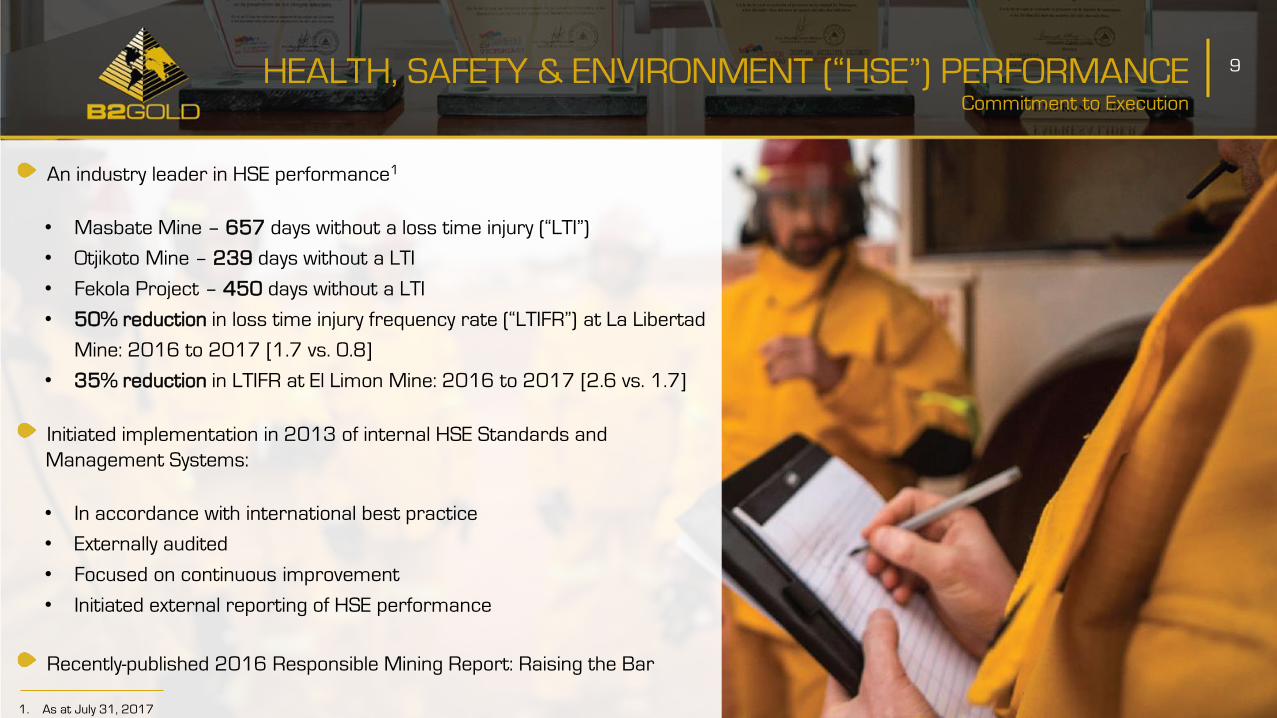
Commitment to Execution
HEALTH, SAFETY & ENVIRONMENT (“HSE”) PERFORMANCE
An industry leader in HSE performance1
• Masbate Mine – 657 days without a loss time injury (“LTI”)
• Otjikoto Mine – 239 days without a LTI
• Fekola Project – 450 days without a LTI
• 50% reduction in loss time injury frequency rate (“LTIFR”) at La Libertad
Mine: 2016 to 2017 [1.7 vs. 0.8]
• 35% reduction in LTIFR at El Limon Mine: 2016 to 2017 [2.6 vs. 1.7]
Initiated implementation in 2013 of internal HSE Standards and
Management Systems:
• In accordance with international best practice
• Externally audited
• Focused on continuous improvement
• Initiated external reporting of HSE performance
Recently-published 2016 Responsible Mining Report: Raising the Bar
1. As at July 31, 2017
10
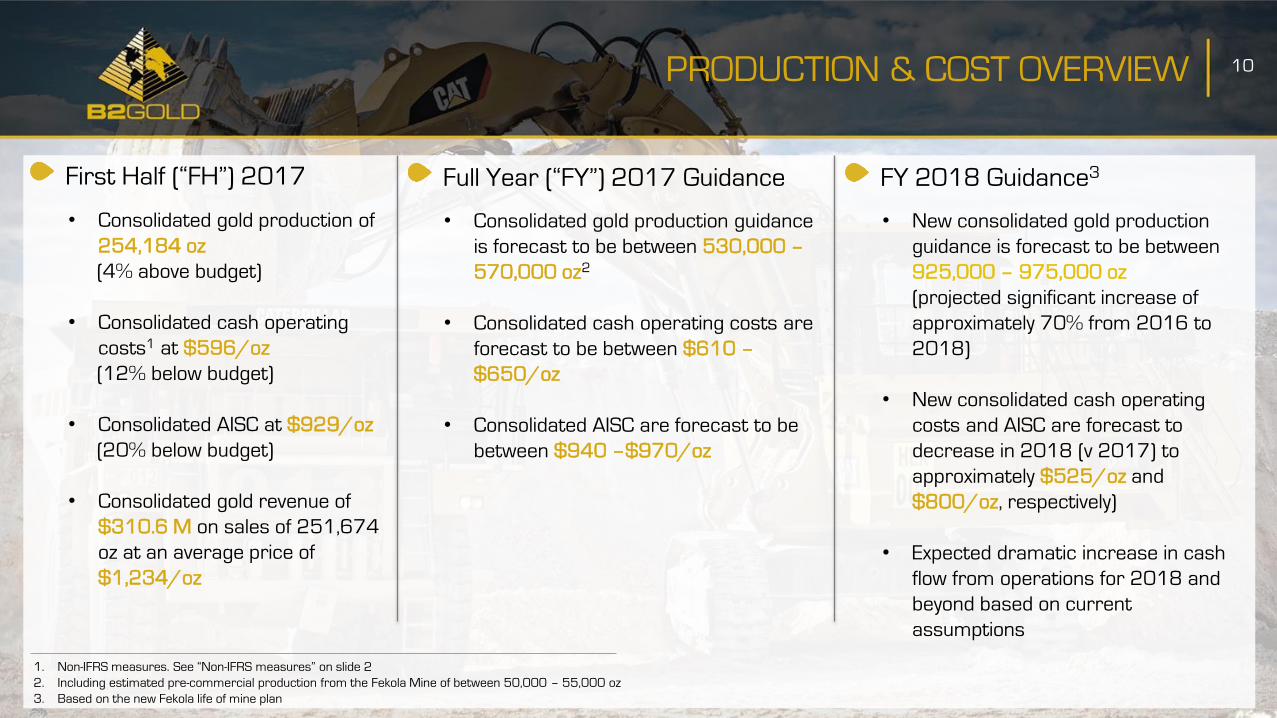
• Consolidated gold production of
254,184 oz
(4% above budget)
• Consolidated cash operating
costs1 at $596/oz
(12% below budget)
• Consolidated AISC at $929/oz
(20% below budget)
• Consolidated gold revenue of
$310.6 M on sales of 251,674
oz at an average price of
$1,234/oz
First Half (“FH”) 2017
1. Non-IFRS measures. See “Non-IFRS measures” on slide 2
2. Including estimated pre-commercial production from the Fekola Mine of between 50,000 – 55,000 oz
3. Based on the new Fekola life of mine plan
• Consolidated gold production guidance
is forecast to be between 530,000 –
570,000 oz2
• Consolidated cash operating costs are
forecast to be between $610 –
$650/oz
• Consolidated AISC are forecast to be
between $940 –$970/oz
Full Year (“FY”) 2017 Guidance
• New consolidated gold production
guidance is forecast to be between
925,000 – 975,000 oz
(projected significant increase of
approximately 70% from 2016 to
2018)
• New consolidated cash operating
costs and AISC are forecast to
decrease in 2018 (v 2017) to
approximately $525/oz and
$800/oz, respectively)
• Expected dramatic increase in cash
flow from operations for 2018 and
beyond based on current
assumptions
FY 2018 Guidance3
PRODUCTION & COST OVERVIEW

11PROVEN CONSTRUCTION TEAMSuccessfully Constructed 5 Mines for Bema Gold & B2Gold on Schedule & Budget
2001
Julietta Mine,
Russia(Bema Gold)
2007
Kupol Mine,
Russia(Bema Gold)
2010
La Libertad Mine,
Nicaragua(B2Gold)
2014
Otjikoto Mine,
Namibia(B2Gold)
2017
Fekola Mine,
Mali(B2Gold)
12
Mali,
West Africa
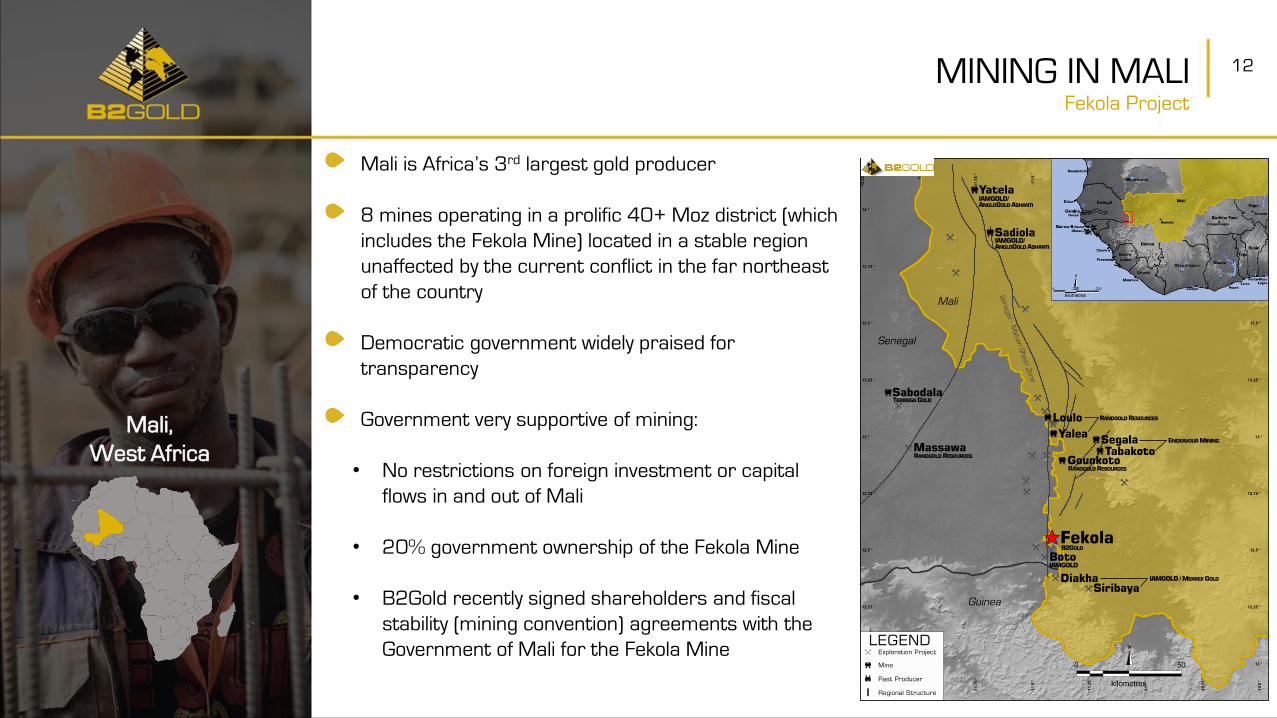
MINING IN MALIFekola Project
Mali is Africa’s 3rd largest gold producer
8 mines operating in a prolific 40+ Moz district (which
includes the Fekola Mine) located in a stable region
unaffected by the current conflict in the far northeast
of the country
Democratic government widely praised for
transparency
Government very supportive of mining:
• No restrictions on foreign investment or capital
flows in and out of Mali
• 20% government ownership of the Fekola Mine
• B2Gold recently signed shareholders and fiscal
stability (mining convention) agreements with the
Government of Mali for the Fekola Mine
13FEKOLA MINE UPDATE
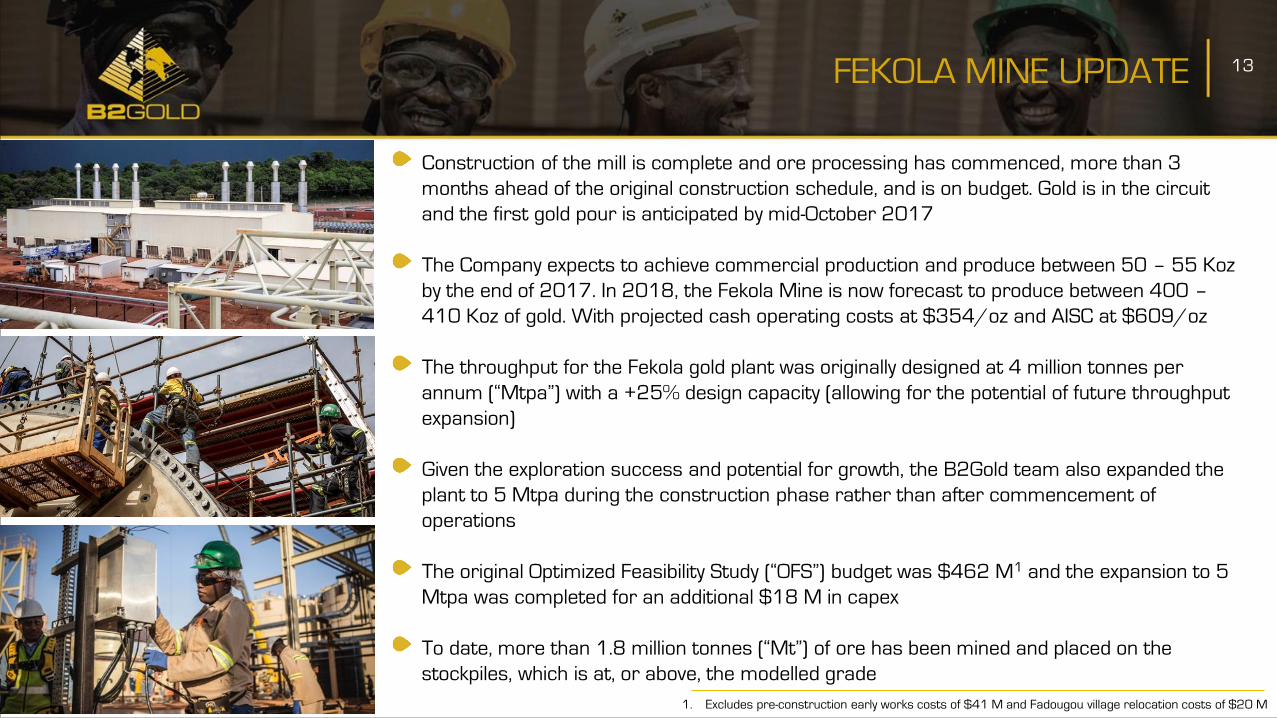
Construction of the mill is complete and ore processing has commenced, more than 3
months ahead of the original construction schedule, and is on budget. Gold is in the circuit
and the first gold pour is anticipated by mid-October 2017
The Company expects to achieve commercial production and produce between 50 – 55 Koz
by the end of 2017. In 2018, the Fekola Mine is now forecast to produce between 400 –
410 Koz of gold. With projected cash operating costs at $354/oz and AISC at $609/oz
The throughput for the Fekola gold plant was originally designed at 4 million tonnes per
annum (“Mtpa”) with a +25% design capacity (allowing for the potential of future throughput
expansion)
Given the exploration success and potential for growth, the B2Gold team also expanded the
plant to 5 Mtpa during the construction phase rather than after commencement of
operations
The original Optimized Feasibility Study (“OFS”) budget was $462 M1 and the expansion to 5
Mtpa was completed for an additional $18 M in capex
To date, more than 1.8 million tonnes (“Mt”) of ore has been mined and placed on the
stockpiles, which is at, or above, the modelled grade
1. Excludes pre-construction early works costs of $41 M and Fadougou village relocation costs of $20 M
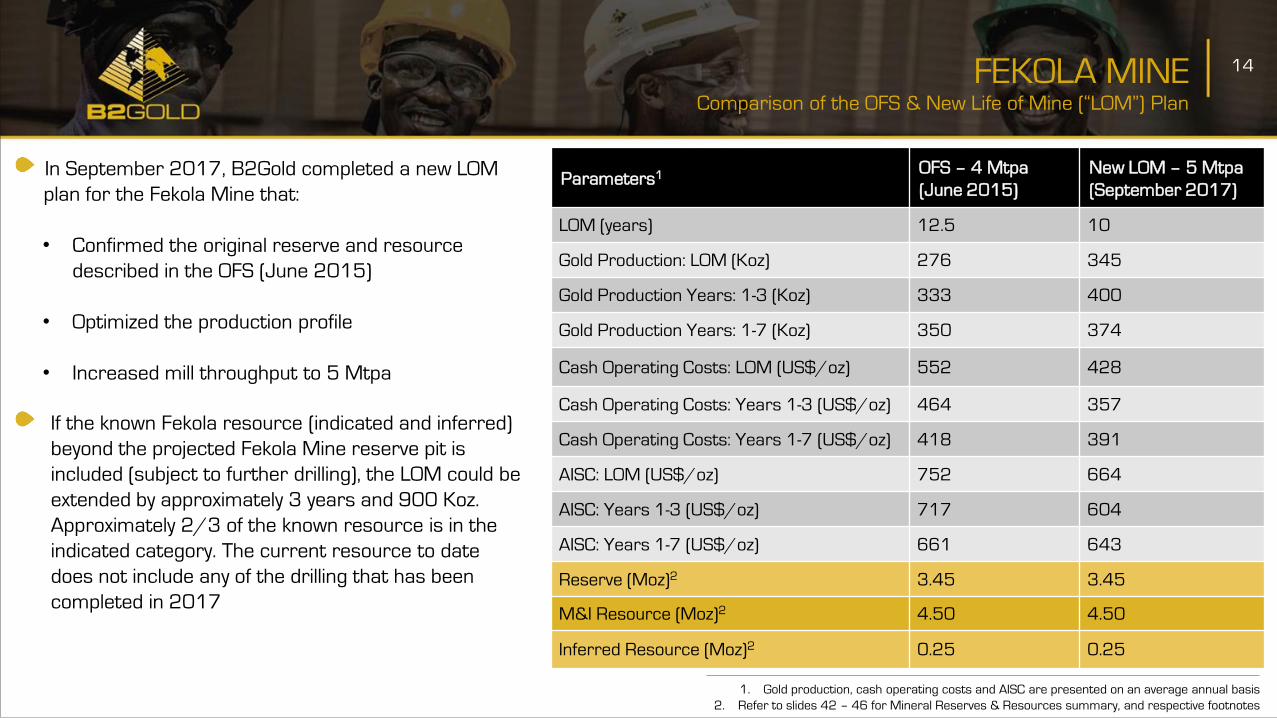
In September 2017, B2Gold completed a new LOM
plan for the Fekola Mine that:
• Confirmed the original reserve and resource
described in the OFS (June 2015)
• Optimized the production profile
• Increased mill throughput to 5 Mtpa
14FEKOLA MINEComparison of the OFS & New Life of Mine (“LOM”) Plan
Parameters1OFS – 4 Mtpa
(June 2015)
New LOM – 5 Mtpa
(September 2017)
LOM (years) 12.5 10
Gold Production: LOM (Koz) 276 345
Gold Production Years: 1-3 (Koz) 333 400
Gold Production Years: 1-7 (Koz) 350 374
Cash Operating Costs: LOM (US$/oz) 552 428
Cash Operating Costs: Years 1-3 (US$/oz) 464 357
Cash Operating Costs: Years 1-7 (US$/oz) 418 391
AISC: LOM (US$/oz) 752 664
AISC: Years 1-3 (US$/oz) 717 604
AISC: Years 1-7 (US$/oz) 661 643
Reserve (Moz)2 3.45 3.45
M&I Resource (Moz)2 4.50 4.50
Inferred Resource (Moz)2 0.25 0.25
If the known Fekola resource (indicated and inferred)
beyond the projected Fekola Mine reserve pit is
included (subject to further drilling), the LOM could be
extended by approximately 3 years and 900 Koz.
Approximately 2/3 of the known resource is in the
indicated category. The current resource to date
does not include any of the drilling that has been
completed in 2017
1. Gold production, cash operating costs and AISC are presented on an average annual basis
2. Refer to slides 42 – 46 for Mineral Reserves & Resources summary, and respective footnotes
15FEKOLA PROPERTY EXPLORATIONUpside Potential
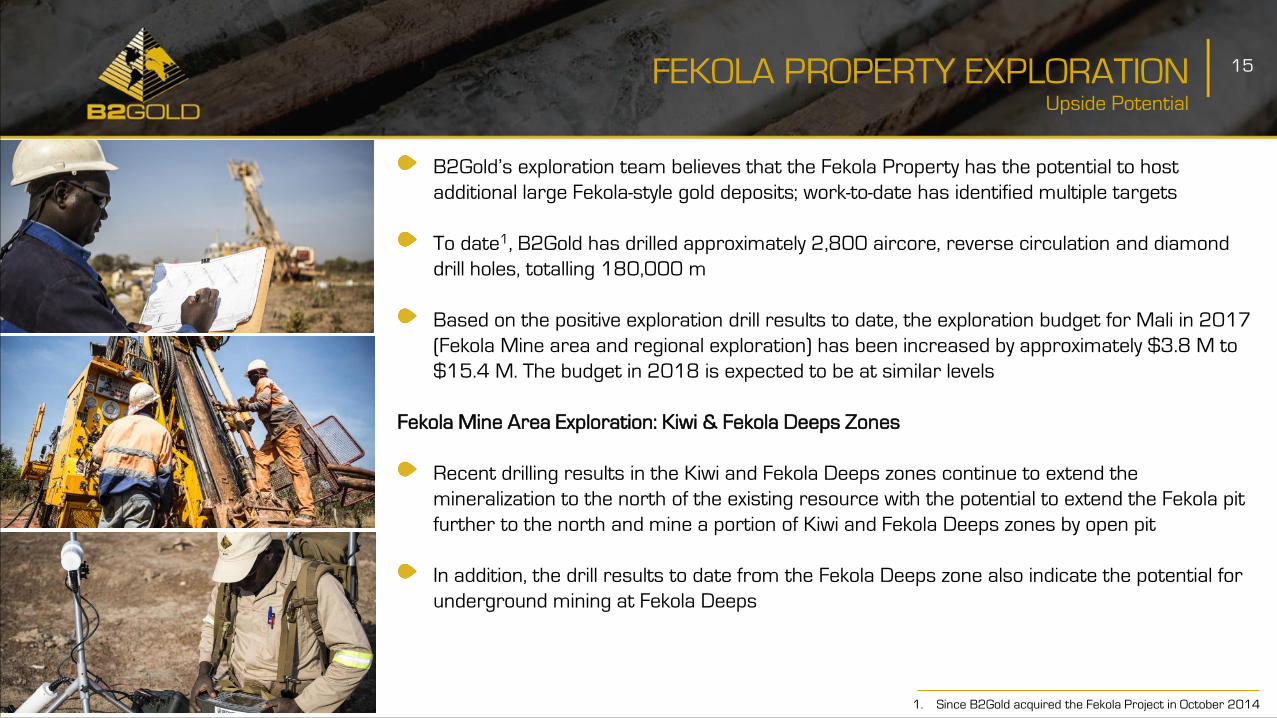
B2Gold’s exploration team believes that the Fekola Property has the potential to host
additional large Fekola-style gold deposits; work-to-date has identified multiple targets
To date1, B2Gold has drilled approximately 2,800 aircore, reverse circulation and diamond
drill holes, totalling 180,000 m
Based on the positive exploration drill results to date, the exploration budget for Mali in 2017
(Fekola Mine area and regional exploration) has been increased by approximately $3.8 M to
$15.4 M. The budget in 2018 is expected to be at similar levels
Fekola Mine Area Exploration: Kiwi & Fekola Deeps Zones
Recent drilling results in the Kiwi and Fekola Deeps zones continue to extend the
mineralization to the north of the existing resource with the potential to extend the Fekola pit
further to the north and mine a portion of Kiwi and Fekola Deeps zones by open pit
In addition, the drill results to date from the Fekola Deeps zone also indicate the potential for
underground mining at Fekola Deeps
1. Since B2Gold acquired the Fekola Project in October 2014

16FEKOLA MINE EXPLORATION UPSIDEKiwi & Fekola Deeps Zones: Schematic Long Section
17
Upside Potential
FEKOLA REGIONAL EXPLORATION
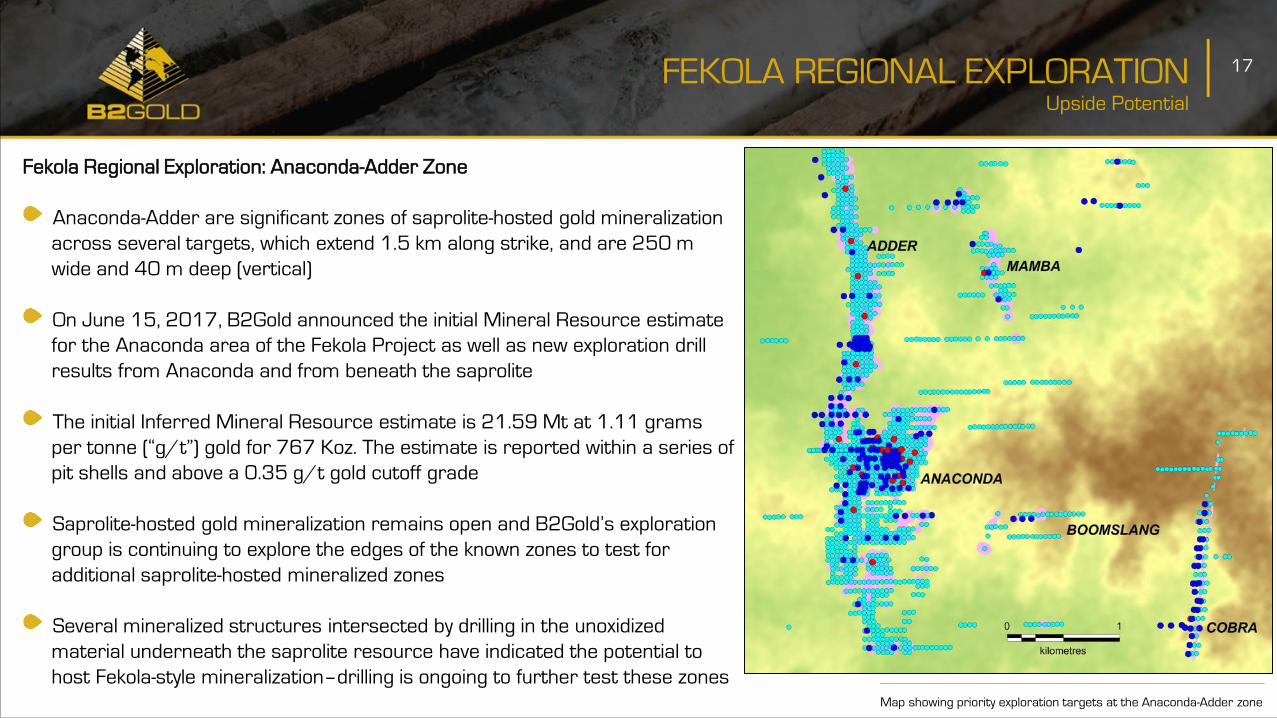
Fekola Regional Exploration: Anaconda-Adder Zone
Anaconda-Adder are significant zones of saprolite-hosted gold mineralization
across several targets, which extend 1.5 km along strike, and are 250 m
wide and 40 m deep (vertical)
On June 15, 2017, B2Gold announced the initial Mineral Resource estimate
for the Anaconda area of the Fekola Project as well as new exploration drill
results from Anaconda and from beneath the saprolite
The initial Inferred Mineral Resource estimate is 21.59 Mt at 1.11 grams
per tonne (“g/t”) gold for 767 Koz. The estimate is reported within a series of
pit shells and above a 0.35 g/t gold cutoff grade
Saprolite-hosted gold mineralization remains open and B2Gold’s exploration
group is continuing to explore the edges of the known zones to test for
additional saprolite-hosted mineralized zones
Several mineralized structures intersected by drilling in the unoxidized
material underneath the saprolite resource have indicated the potential to
host Fekola-style mineralization–drilling is ongoing to further test these zonesMap showing priority exploration targets at the Anaconda-Adder zone
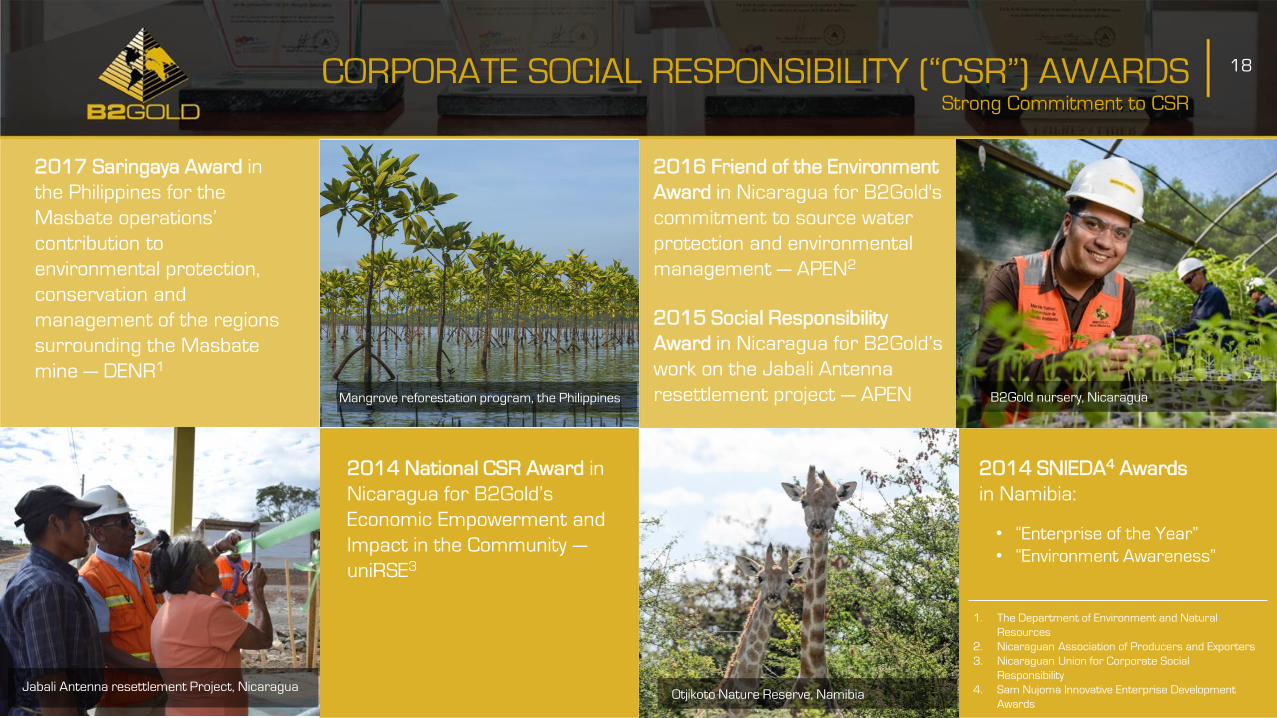
Jabali Antenna resettlement Project, Nicaragua
2017 Saringaya Award in
the Philippines for the
Masbate operations’
contribution to
environmental protection,
conservation and
management of the regions
surrounding the Masbate
mine — DENR1
2015 Social Responsibility
Award in Nicaragua for B2Gold’s
work on the Jabali Antenna
resettlement project — APEN
2014 National CSR Award in
Nicaragua for B2Gold’s
Economic Empowerment and
Impact in the Community —
uniRSE3
2014 SNIEDA4 Awards
in Namibia:
• “Enterprise of the Year”
• “Environment Awareness”
1. The Department of Environment and Natural
Resources
2. Nicaraguan Association of Producers and Exporters
3. Nicaraguan Union for Corporate Social
Responsibility
4. Sam Nujoma Innovative Enterprise Development
Awards
18
Strong Commitment to CSR
B2Gold nursery, Nicaragua
Otjikoto Nature Reserve, Namibia
CORPORATE SOCIAL RESPONSIBILITY (“CSR”) AWARDS
2016 Friend of the Environment
Award in Nicaragua for B2Gold's
commitment to source water
protection and environmental
management — APEN2
Mangrove reforestation program, the Philippines
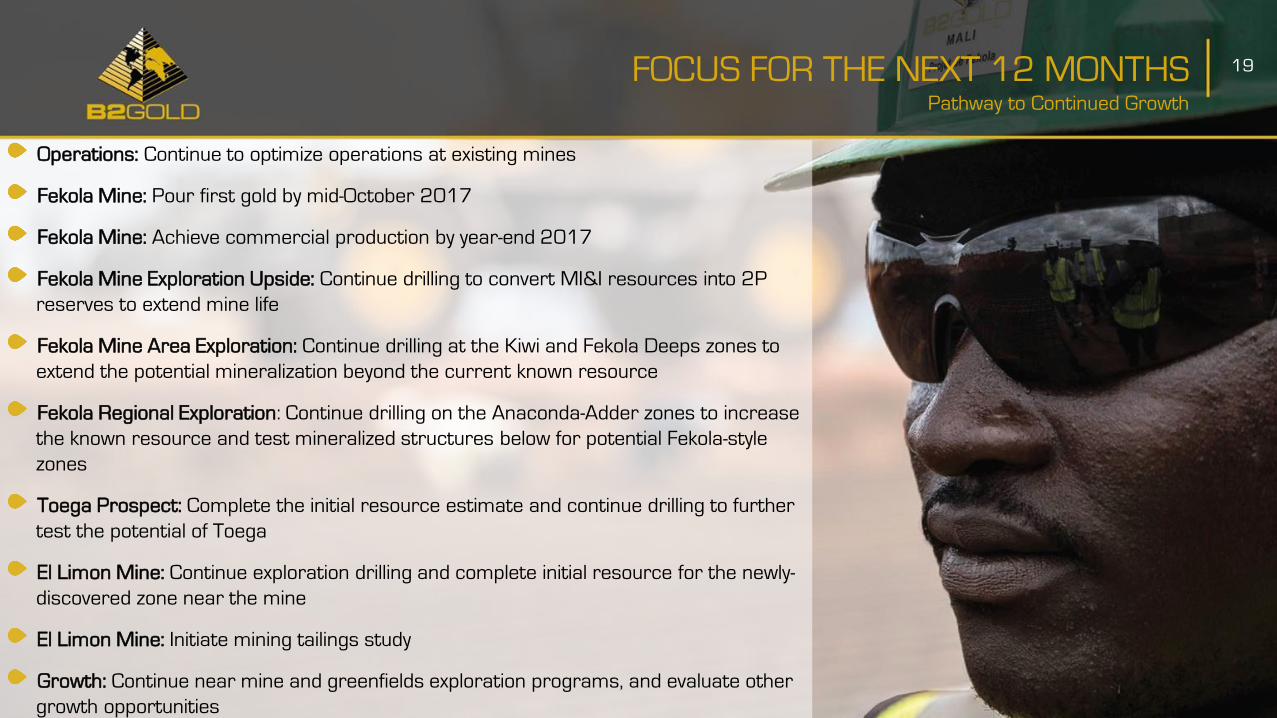
Operations: Continue to optimize operations at existing mines
Fekola Mine: Pour first gold by mid-October 2017
Fekola Mine: Achieve commercial production by year-end 2017
Fekola Mine Exploration Upside: Continue drilling to convert MI&I resources into 2P
reserves to extend mine life
Fekola Mine Area Exploration: Continue drilling at the Kiwi and Fekola Deeps zones to
extend the potential mineralization beyond the current known resource
Fekola Regional Exploration: Continue drilling on the Anaconda-Adder zones to increase
the known resource and test mineralized structures below for potential Fekola-style
zones
Toega Prospect: Complete the initial resource estimate and continue drilling to further
test the potential of Toega
El Limon Mine: Continue exploration drilling and complete initial resource for the newly-
discovered zone near the mine
El Limon Mine: Initiate mining tailings study
Growth: Continue near mine and greenfields exploration programs, and evaluate other
growth opportunities
19FOCUS FOR THE NEXT 12 MONTHSPathway to Continued Growth

APPENDIX
20
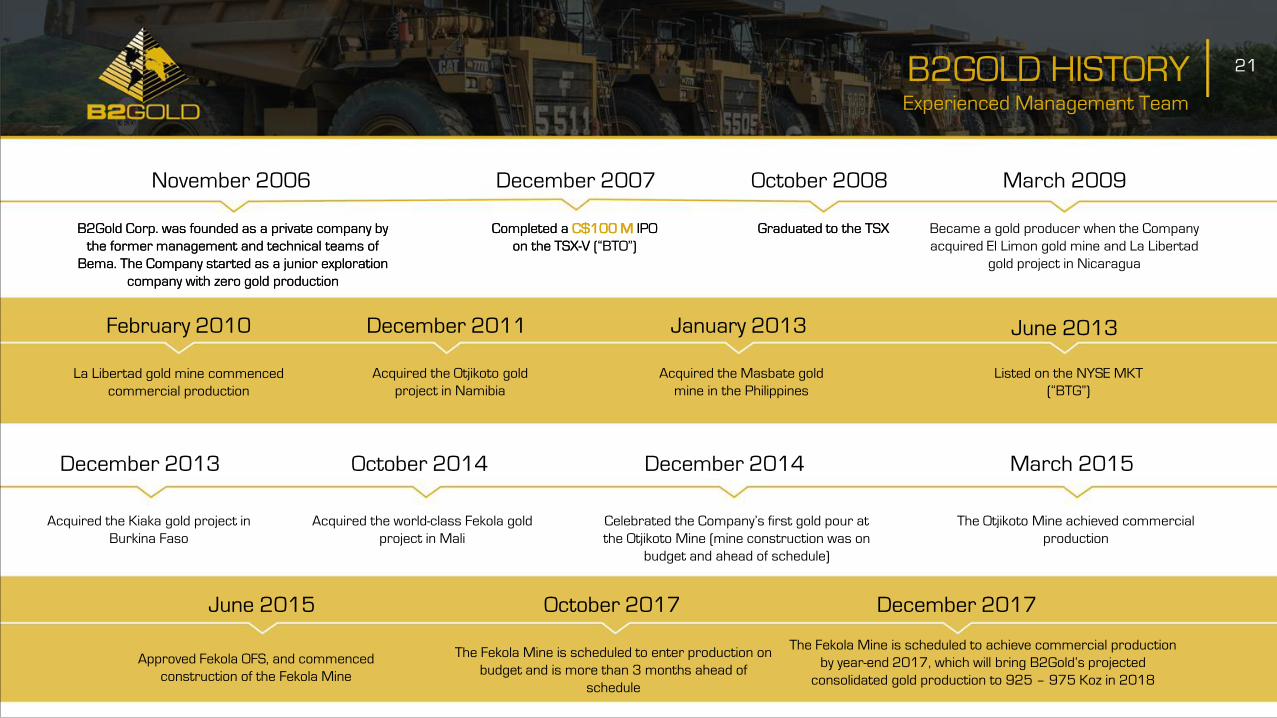
November 2006 December 2007 October 2008 March 2009
B2Gold Corp. was founded as a private company by
the former management and technical teams of
Bema. The Company started as a junior exploration
company with zero gold production
Completed a C$100 M IPO
on the TSX-V (“BTO”)
Graduated to the TSX Became a gold producer when the Company
acquired El Limon gold mine and La Libertad
gold project in Nicaragua
February 2010
La Libertad gold mine commenced
commercial production
Acquired the Otjikoto gold
project in Namibia
December 2011 January 2013
Acquired the Masbate gold
mine in the Philippines
June 2013
Listed on the NYSE MKT
(“BTG”)
December 2013
Acquired the Kiaka gold project in
Burkina Faso
October 2014
Acquired the world-class Fekola gold
project in Mali
December 2014
Celebrated the Company’s first gold pour at
the Otjikoto Mine (mine construction was on
budget and ahead of schedule)
March 2015
The Otjikoto Mine achieved commercial
production
June 2015
Approved Fekola OFS, and commenced
construction of the Fekola Mine
October 2017
The Fekola Mine is scheduled to enter production on
budget and is more than 3 months ahead of
schedule
December 2017
The Fekola Mine is scheduled to achieve commercial production
by year-end 2017, which will bring B2Gold’s projected
consolidated gold production to 925 – 975 Koz in 2018
B2GOLD HISTORYExperienced Management Team
B2Gold Corp. was founded as a private company by
the former management and technical teams of
Bema. The Company started as a junior exploration
company with zero gold production
Completed a C$100 M IPO
on the TSX-V (“BTO”)
Graduated to the TSX
21

Nicaragua:
• Reforestation
• Water Treatment
• Anti-epidemic Prevention
• La Libertad & Santo Domingo
Dairy Chilling Centre
• Alfa & Omega Sewing Shop
The Philippines:
• Mangrove Reforestation
• Health: TB focus
• Education
• Capsay Egg Producers
Association (“CEPA”)
Namibia:
• SMEs Compete
• LifeLine/ChildLine
• Little Shop of Physics
• Otjikoto Nature Reserve &
the Namibian Chamber of
Environment
Mali:
• Relocation of Fadougou
Village
• Adéquation Formation-
Emploi dans le Cèrcle de
Keniéba (“AFECK”) Project
22
Responsible Mining: Raising the Bar
Dairy Chilling Centre, Nicaragua
Otjikoto Nature Reserve, Namibia Skills for employment initiative, Mali
KEY CSR INITIATIVES
CEPA, the Philippines

23
Mali,
West Africa
MINING IN MALIFekola Project: Further Details

24FEKOLA MINEFlowchart

25
Photo Cation Here
FEKOLA MINE
Fekola Plant has a design throughput of
5 Mtpa (607 tonnes per hour)
Overall plant recovery designed to be
92.5%
Includes:
• Primary single stage gyratory
crusher
• SABC grinding circuit
• Residence time for leaching is 24
hours
Design Details (i)
Recently-taken photograph looking southwest at the Fekola gold plant
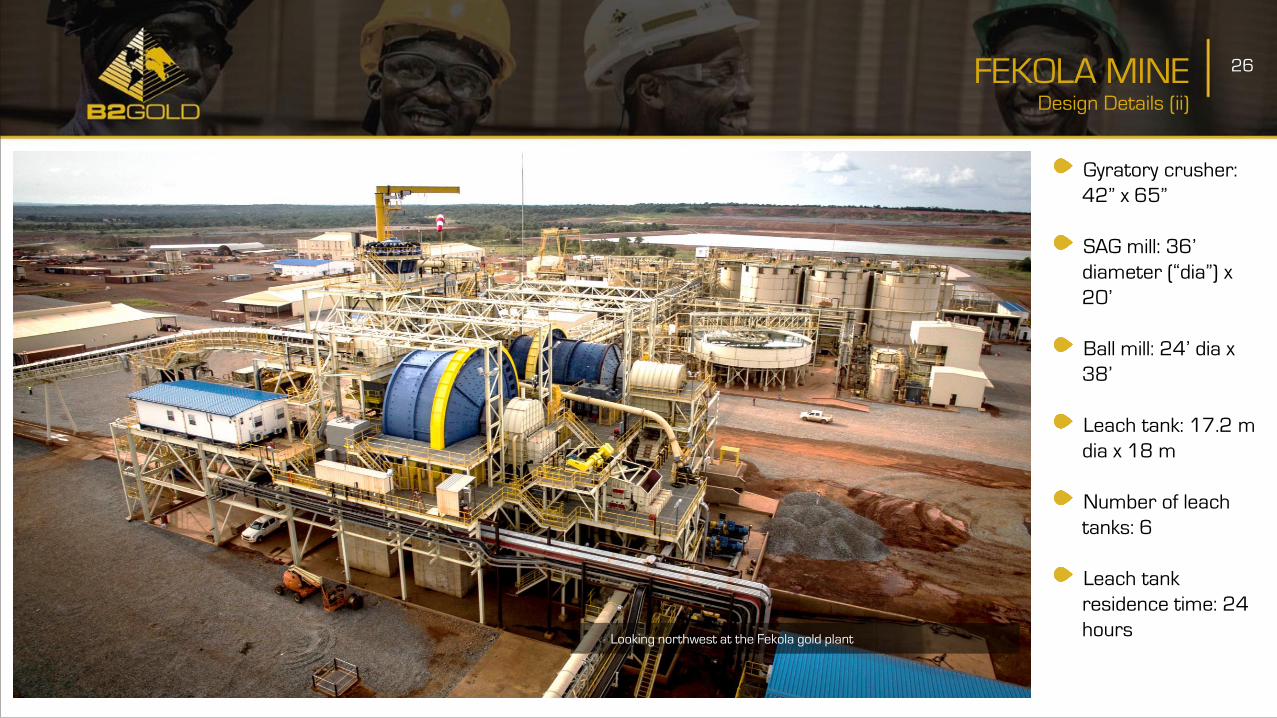
26FEKOLA MINE
Gyratory crusher:
42” x 65”
SAG mill: 36’
diameter (“dia”) x
20’
Ball mill: 24’ dia x
38’
Leach tank: 17.2 m
dia x 18 m
Number of leach
tanks: 6
Leach tank
residence time: 24
hours
Design Details (ii)
Looking northwest at the Fekola gold plant

The mill was constructed by B2Gold’s world-class construction team with the same
attention to detail and safety as all of its other projects:
• More than 1,300 employees during peak construction
• More than 1,100 Malians (the remaining employees are from 23 different countries)
Earthworks:
• Almost 5 M cubic metres (“m3“) of material has been moved and placed to construct
the project
• Completion of a fully-lined (670,000 square metres of lining) tailings facility (1,230,000
m3 of material placed for dam embankment)
27FEKOLA MINE CONSTRUCTIONConstruction Details: By Numbers1
1. All data through August 2017

28FEKOLA PLANT CONSTRUCTION
The mill construction was completed more than 3 months ahead of schedule
(including the expansion) and the plant is expected to produce gold in mid-
October 2017
The mill is expected to ramp up to commercial production by year-end 2017
Key successes include:
• 43,000 tonnes (“t”) of material shipped to site via Senegal (2 border
crossings)
• Amount of concrete poured: 35,000 m3
• Amount of steel constructed: 2,600 t
• Amount of piping installed: 58 km
• Platework constructed: 573 t
• Fabricated tanks: 1.3 t
1. All data through August 2017
Construction Details: By Numbers1
Fekola mill with power plant in the background, Fekola Mine
SAG mill, Fekola Mine
The Philippines,
Southeast Asia
29MINING IN THE PHILIPPINESMasbate Mine
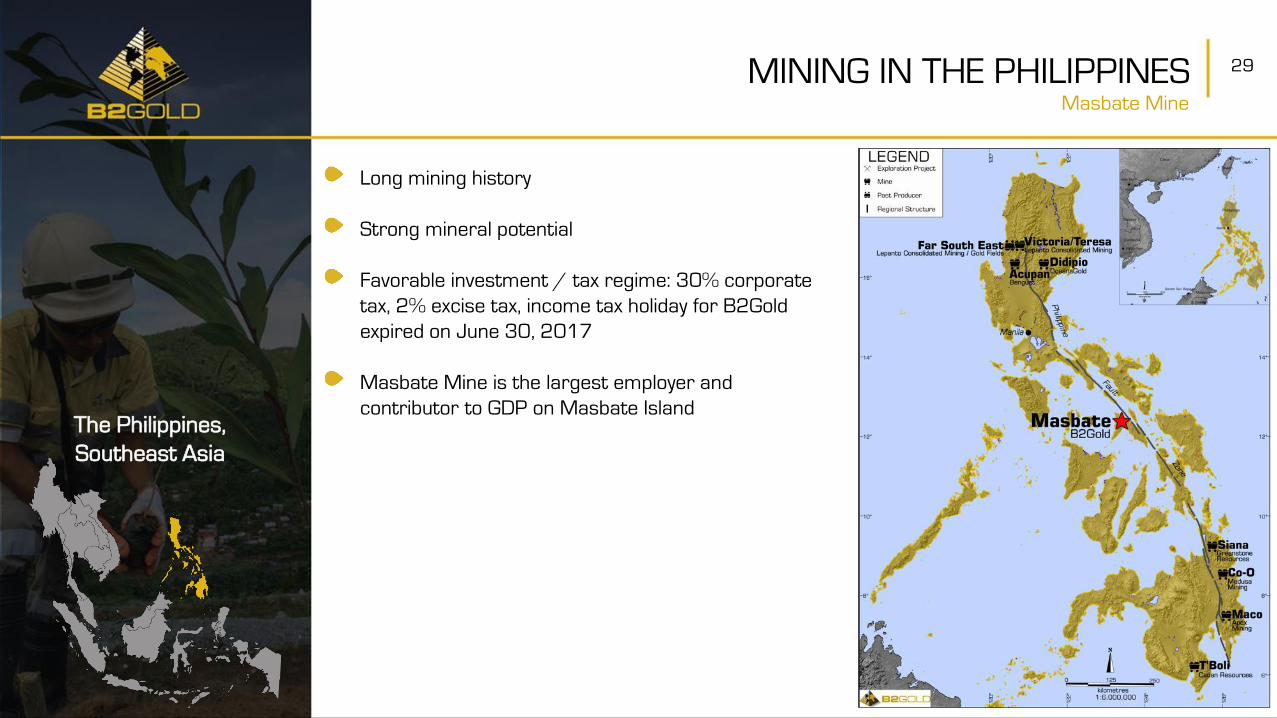
Long mining history
Strong mineral potential
Favorable investment / tax regime: 30% corporate
tax, 2% excise tax, income tax holiday for B2Gold
expired on June 30, 2017
Masbate Mine is the largest employer and
contributor to GDP on Masbate Island
30REGULATORY UPDATE
1. The Department of Environment and Natural Resources
B2Gold is recognized as one of the most responsible mining companies in the Philippines. The company believes it is in compliance
with the laws and regulations in the Philippines and will continue to operate responsibly and work closely with local communities and
all levels of government
In 2016, the DENR1 announced preliminary audit results based on environmental, health and safety and social criteria for open-pit
mining companies, including the Masbate Mine
B2Gold provided a comprehensive response to the findings and recommendations from the Masbate Mine audit and believes that all
points have been appropriately addressed with no material environmental or social issues raised
In February 2017, the DENR announced further results of its mining audit and the Masbate Mine was not among the mines
announced to be suspended or closed. Operations at the Masbate Mine continued uninterrupted throughout the period and the
Company continues to work closely with the DENR
While there has been controversy surrounding open-pit mining in the Philippines, the President has recently stated publicly that he
supports lawful, responsible mining and that compliant companies should be given permits
31MASBATE MINEProfile1
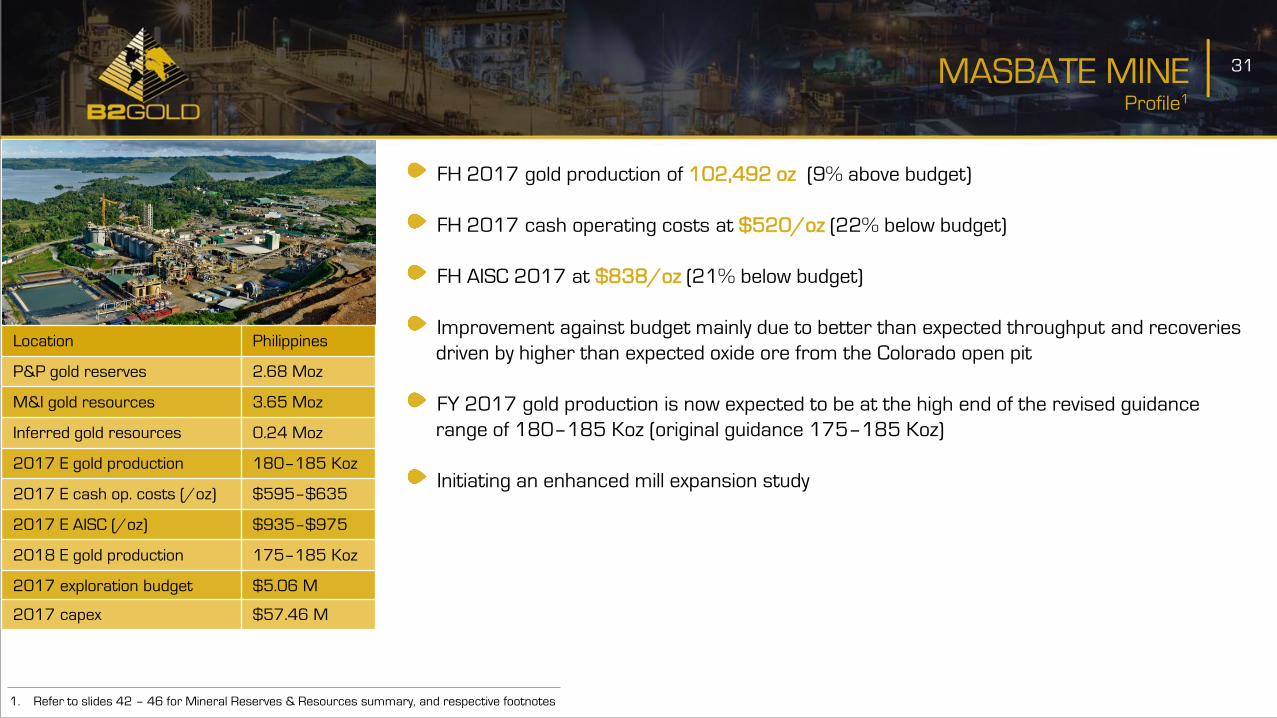
FH 2017 gold production of 102,492 oz (9% above budget)
FH 2017 cash operating costs at $520/oz (22% below budget)
FH AISC 2017 at $838/oz (21% below budget)
Improvement against budget mainly due to better than expected throughput and recoveries
driven by higher than expected oxide ore from the Colorado open pit
FY 2017 gold production is now expected to be at the high end of the revised guidance
range of 180–185 Koz (original guidance 175–185 Koz)
Initiating an enhanced mill expansion study
Location Philippines
P&P gold reserves 2.68 Moz
M&I gold resources 3.65 Moz
Inferred gold resources 0.24 Moz
2017 E gold production 180–185 Koz
2017 E cash op. costs (/oz) $595–$635
2017 E AISC (/oz) $935–$975
2018 E gold production 175–185 Koz
2017 exploration budget $5.06 M
2017 capex $57.46 M
1. Refer to slides 42 – 46 for Mineral Reserves & Resources summary, and respective footnotes
32
Namibia,
Southwestern Africa
MINING IN NAMIBIA
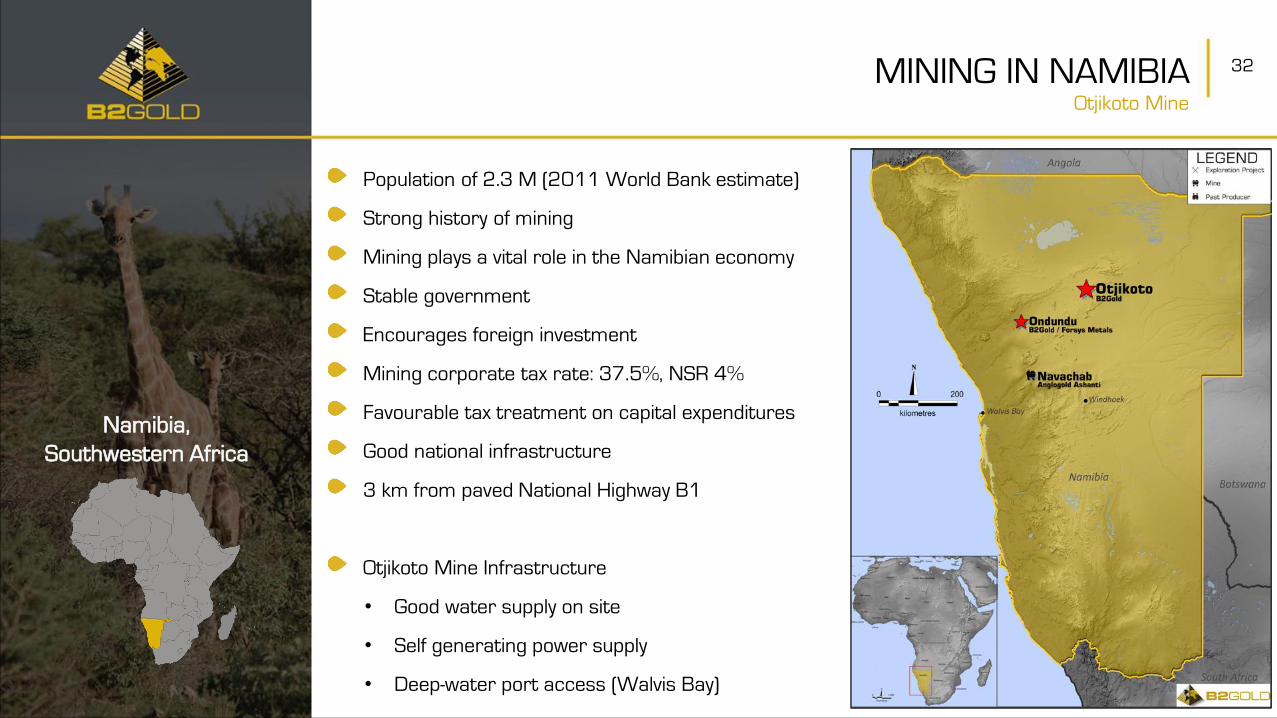
Population of 2.3 M (2011 World Bank estimate)
Strong history of mining
Mining plays a vital role in the Namibian economy
Stable government
Encourages foreign investment
Mining corporate tax rate: 37.5%, NSR 4%
Favourable tax treatment on capital expenditures
Good national infrastructure
3 km from paved National Highway B1
Otjikoto Mine Infrastructure
• Good water supply on site
• Self generating power supply
• Deep-water port access (Walvis Bay)
Otjikoto Mine

33OTJIKOTO MINEProfile1
Ownership 90%
Location Namibia
P&P gold reserves 0.99 Moz
M&I gold resources 1.23 Moz
Inferred gold resources 0.30 Moz
2017 E gold production 170–180 Koz
2017 E cash op. costs (/oz) $480–$520
2017 E AISC (/oz) $725–$765
2018 E gold production 150–160 Koz
2017 exploration budget $5.07 M
2017 capex $49.74 M
FH 2017 gold production of 83,937 oz (17% above budget)
FH 2017 cash operating costs at $467/oz (26% below budget)
FH 2017 AISC at $721/oz (41% below budget)
Positive results are due to better than expected grade and ore tonnage from the Wolfshag
open pit and higher than expected mill throughput
Forecast gold production is weighted towards the second half of the year
2017 gold production is expected to be at the high end of the revised guidance range of
170 –180 Koz (original guidance 165–175 Koz)
Evaluating the open pit and underground interface to determine the optimal mine plan and
project economics for the Wolfshag open pit expansion
1. Refer to slides 42 – 46 for Mineral Reserves & Resources summary, and respective footnotes
34
Nicaragua,
Central America
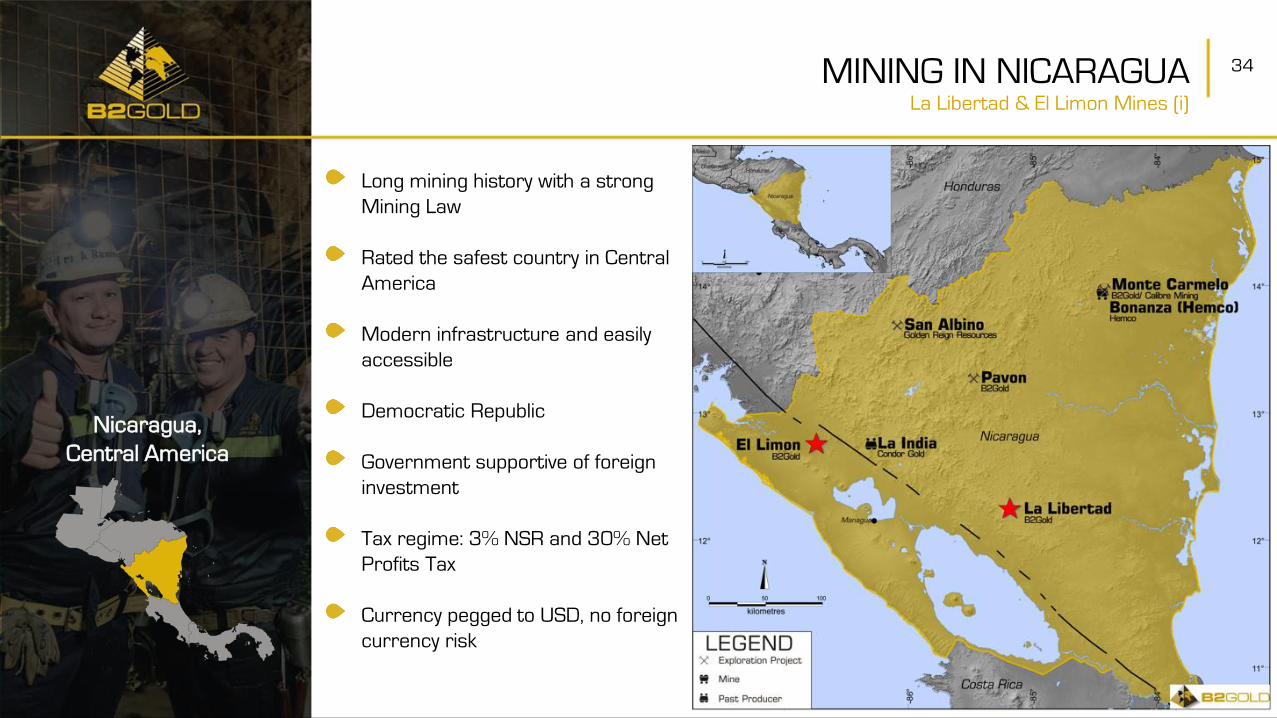
MINING IN NICARAGUA
Long mining history with a strong
Mining Law
Rated the safest country in Central
America
Modern infrastructure and easily
accessible
Democratic Republic
Government supportive of foreign
investment
Tax regime: 3% NSR and 30% Net
Profits Tax
Currency pegged to USD, no foreign
currency risk
La Libertad & El Limon Mines (i)

35MINING IN NICARAGUA
B2Gold is one of the major
employers in Nicaragua with more
than 3,000 employees and
contractors
B2Gold is the largest exporter of
gold in the country and the largest
individual exporting company in the
country
Major contributor to local and
national economy, one of the largest
tax payers
Strong commitment to social
programs
Nicaragua,
Central America
La Libertad & El Limon Mines (ii)

36LA LIBERTAD MINEProfile1
Ownership 100%
Location Nicaragua
P&P gold reserves 0.12 Moz
M&I gold resources 0.21 Moz
Inferred gold resources 0.46 Moz
2017 E gold production 90–100 Koz
2017 E cash op. costs (/oz) $795–$835
2017 E AISC (/oz) $1.075–$1,115
2018 E gold production 140–150 Koz
2017 exploration budget $7.16 M
2017 capex $26.52 M
FH 2017 gold production of 51,154 oz (7% below budget)
FH 2017 cash operating costs at $778/oz (9% above budget)
FH 2017 AISC at $965/oz (4% above budget)
Looking forward, focus is on:
• Accelerated development of the new San Juan and Mojon open pits
• Accelerated development of the Jabali open pit and underground
Continue infill and exploration drilling
1. Refer to slides 42 – 46 for Mineral Reserves & Resources summary, and respective footnotes
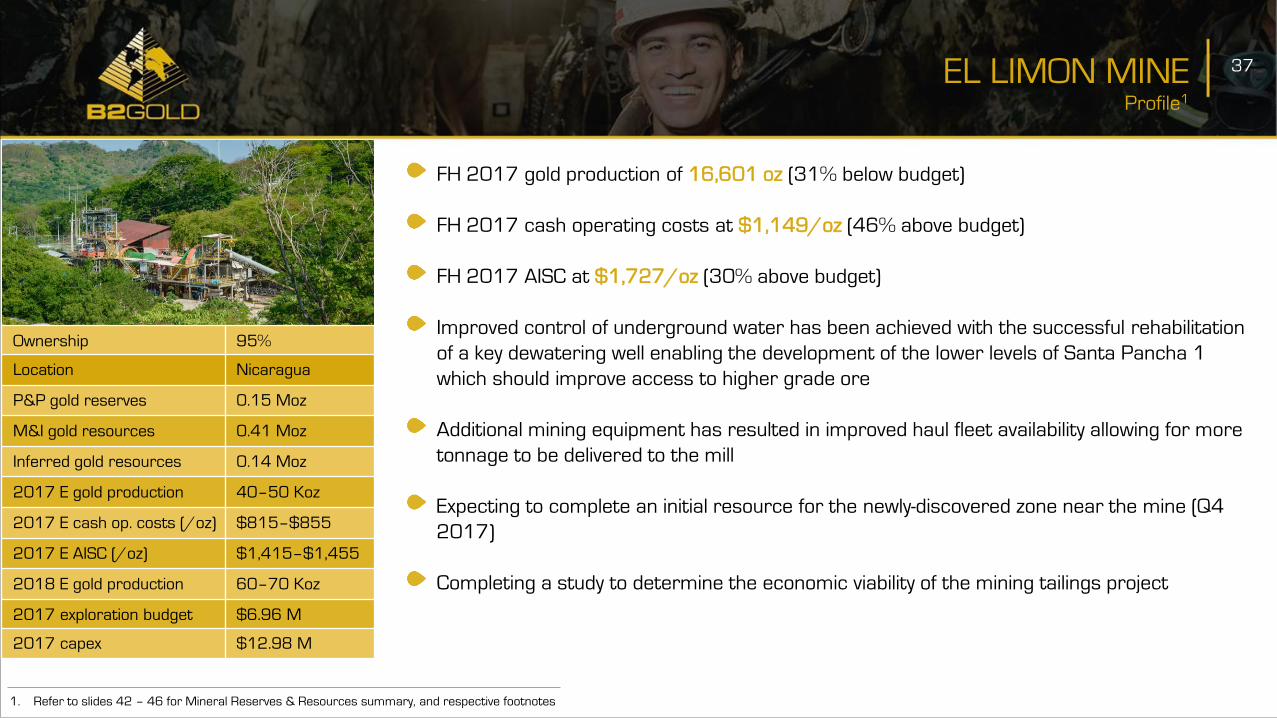
37EL LIMON MINEProfile1
FH 2017 gold production of 16,601 oz (31% below budget)
FH 2017 cash operating costs at $1,149/oz (46% above budget)
FH 2017 AISC at $1,727/oz (30% above budget)
Improved control of underground water has been achieved with the successful rehabilitation
of a key dewatering well enabling the development of the lower levels of Santa Pancha 1
which should improve access to higher grade ore
Additional mining equipment has resulted in improved haul fleet availability allowing for more
tonnage to be delivered to the mill
Expecting to complete an initial resource for the newly-discovered zone near the mine (Q4
2017)
Completing a study to determine the economic viability of the mining tailings project
Ownership 95%
Location Nicaragua
P&P gold reserves 0.15 Moz
M&I gold resources 0.41 Moz
Inferred gold resources 0.14 Moz
2017 E gold production 40–50 Koz
2017 E cash op. costs (/oz) $815–$855
2017 E AISC (/oz) $1,415–$1,455
2018 E gold production 60–70 Koz
2017 exploration budget $6.96 M
2017 capex $12.98 M
1. Refer to slides 42 – 46 for Mineral Reserves & Resources summary, and respective footnotes
38
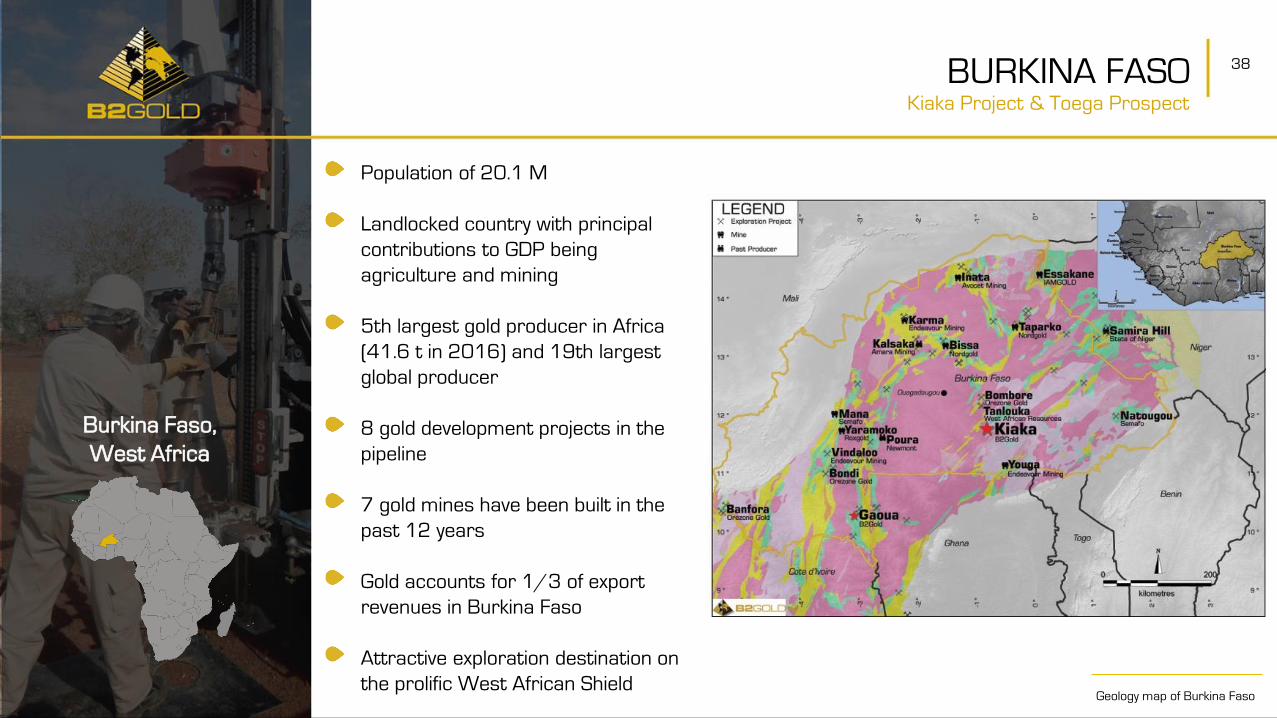
Population of 20.1 M
Landlocked country with principal
contributions to GDP being
agriculture and mining
5th largest gold producer in Africa
(41.6 t in 2016) and 19th largest
global producer
8 gold development projects in the
pipeline
7 gold mines have been built in the
past 12 years
Gold accounts for 1/3 of export
revenues in Burkina Faso
Attractive exploration destination on
the prolific West African ShieldGeology map of Burkina Faso
BURKINA FASOKiaka Project & Toega Prospect
Burkina Faso,
West Africa

39
Profile1
KIAKA PROJECT
One of the largest undeveloped gold resources in West Africa
Prior to the Kiaka acquisition in December 2013, B2Gold determined that the Kiaka
deposit would require higher gold prices or nearby exploration success to become
economically viable
Low acquisition cost of approximately $48 M in B2Gold shares
Optionality on gold price and exploration upside
Mining permit received in Q4 2015
Decree formalizing the Kiaka exploitation permit issued in July 2016
Ownership 81%
Location Burkina Faso
P&P gold reserves n/a
M&I gold resources 3.94 Moz
Inferred gold resources 0.82 Moz
2017 E exploration budget $10.16 M2
1. Refer to slides 42 – 46 for Mineral Reserves & Resources summary, and respective footnotes
2. The majority of the Burkina Faso exploration budget is for the Toega Prospect
40
Kiaka Regional Exploration
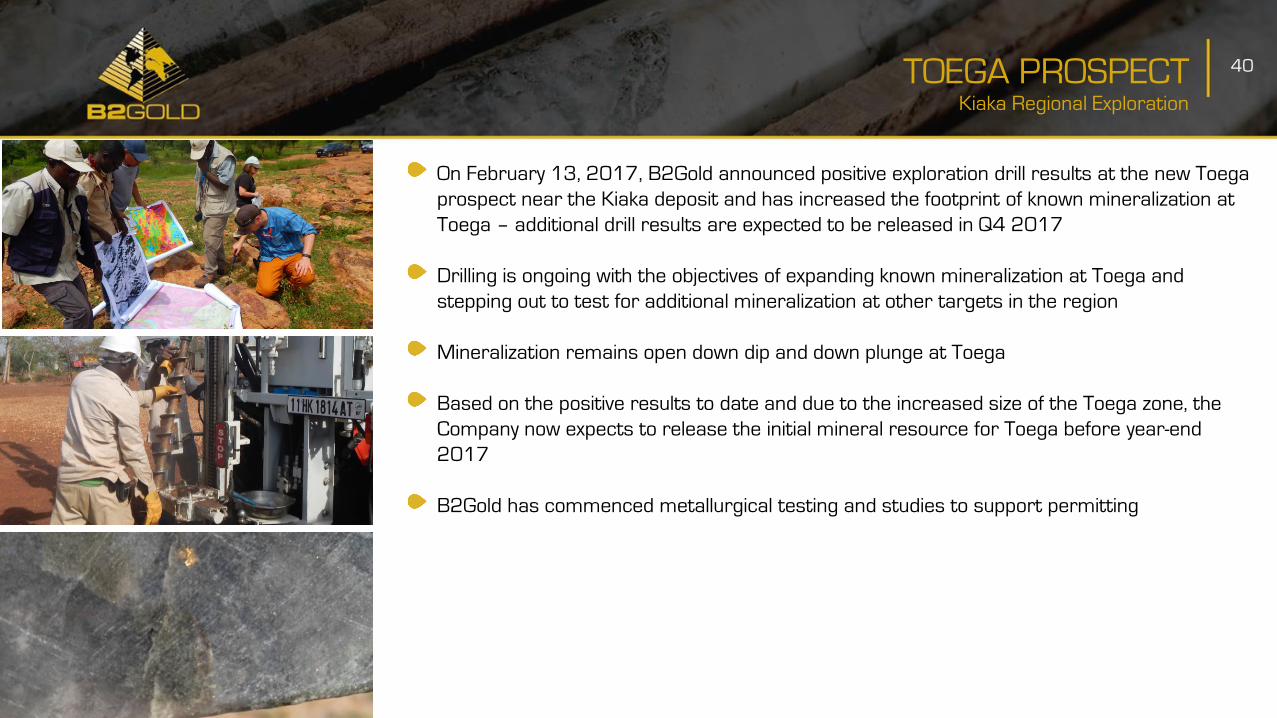
TOEGA PROSPECT
On February 13, 2017, B2Gold announced positive exploration drill results at the new Toega
prospect near the Kiaka deposit and has increased the footprint of known mineralization at
Toega – additional drill results are expected to be released in Q4 2017
Drilling is ongoing with the objectives of expanding known mineralization at Toega and
stepping out to test for additional mineralization at other targets in the region
Mineralization remains open down dip and down plunge at Toega
Based on the positive results to date and due to the increased size of the Toega zone, the
Company now expects to release the initial mineral resource for Toega before year-end
2017
B2Gold has commenced metallurgical testing and studies to support permitting

Country Project Totals %
Mali Fekola/Regional $15,355,296 29.2%
Burkina Faso Kiaka/Regional $10,157,392 19.3%
Nicaragua La Libertad $7,161,165 12.7%
Namibia Otjikoto $5,071,581 9.6%
The Philippines Masbate $5,055,463 9.6%
Nicaragua El Limon $6,964,254 9.4%
Finland Various $2,622,047 5.0%
Ghana Bui $1,045,717 2.0%
USA Rockland $874,307 1.7%
Colombia AGA $398,700 0.8%
Nicaragua Nica Regional $374,631 0.7%
Total $55,080,553 100.0%
2017 Summary
41EXPLORATION BUDGET
1. Refer to following slide for Footnotes
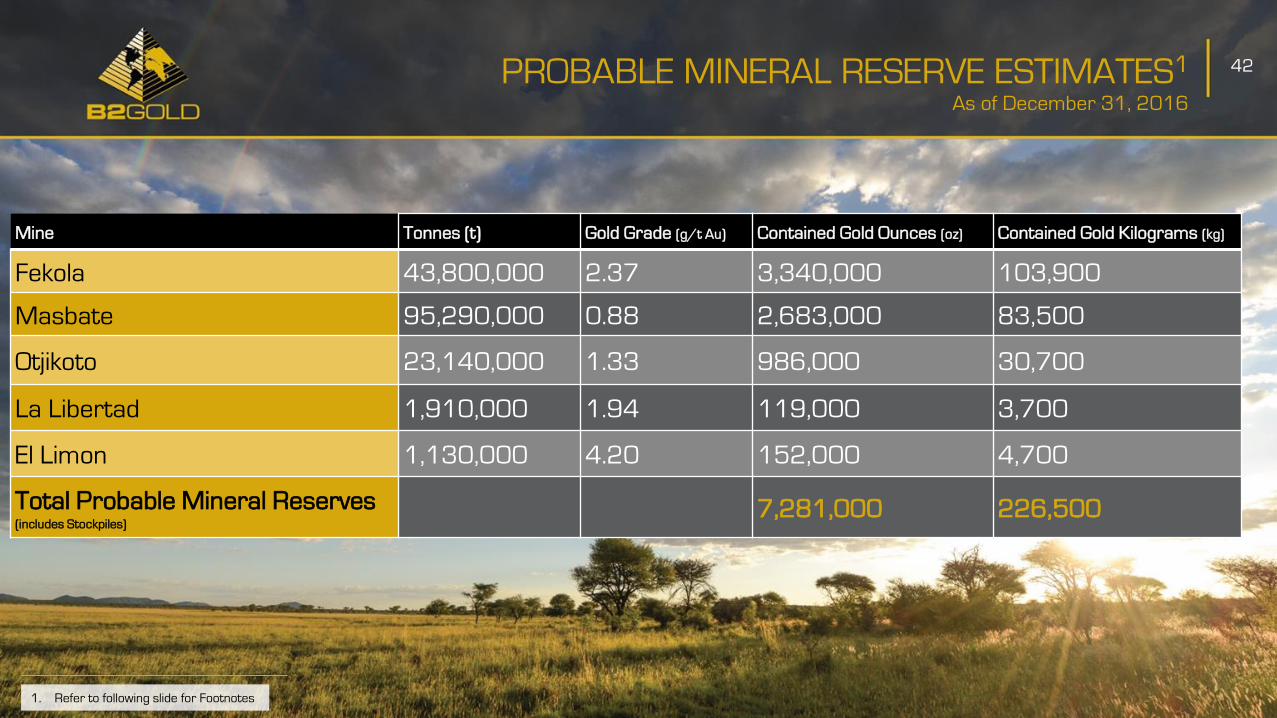
As of December 31, 2016
42
Mine Tonnes (t) Gold Grade (g/t Au) Contained Gold Ounces (oz) Contained Gold Kilograms (kg)
Fekola 43,800,000 2.37 3,340,000 103,900
Masbate 95,290,000 0.88 2,683,000 83,500
Otjikoto 23,140,000 1.33 986,000 30,700
La Libertad 1,910,000 1.94 119,000 3,700
El Limon 1,130,000 4.20 152,000 4,700
Total Probable Mineral Reserves (includes Stockpiles)
7,281,000 226,500
PROBABLE MINERAL RESERVE ESTIMATES1
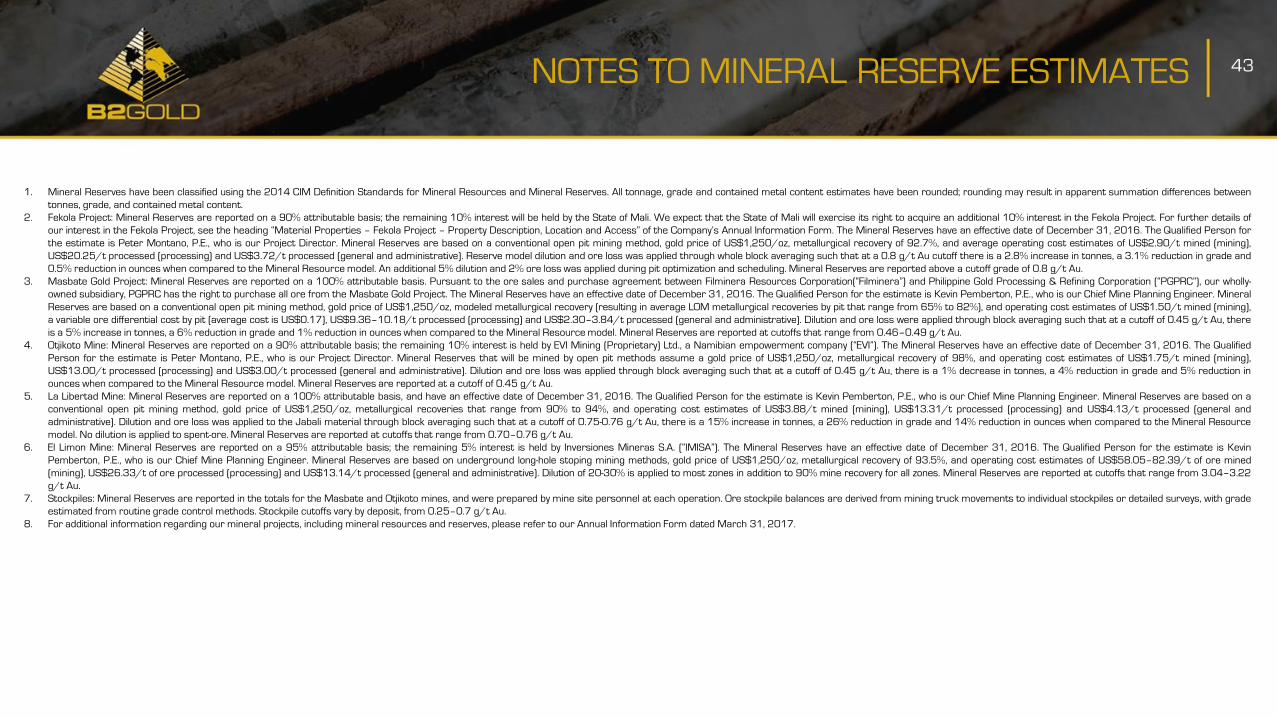
1. Mineral Reserves have been classified using the 2014 CIM Definition Standards for Mineral Resources and Mineral Reserves. All tonnage, grade and contained metal content estimates have been rounded; rounding may result in apparent summation differences between
tonnes, grade, and contained metal content.
2. Fekola Project: Mineral Reserves are reported on a 90% attributable basis; the remaining 10% interest will be held by the State of Mali. We expect that the State of Mali will exercise its right to acquire an additional 10% interest in the Fekola Project. For further details of
our interest in the Fekola Project, see the heading “Material Properties – Fekola Project – Property Description, Location and Access” of the Company’s Annual Information Form. The Mineral Reserves have an effective date of December 31, 2016. The Qualified Person for
the estimate is Peter Montano, P.E., who is our Project Director. Mineral Reserves are based on a conventional open pit mining method, gold price of US$1,250/oz, metallurgical recovery of 92.7%, and average operating cost estimates of US$2.90/t mined (mining),
US$20.25/t processed (processing) and US$3.72/t processed (general and administrative). Reserve model dilution and ore loss was applied through whole block averaging such that at a 0.8 g/t Au cutoff there is a 2.8% increase in tonnes, a 3.1% reduction in grade and
0.5% reduction in ounces when compared to the Mineral Resource model. An additional 5% dilution and 2% ore loss was applied during pit optimization and scheduling. Mineral Reserves are reported above a cutoff grade of 0.8 g/t Au.
3. Masbate Gold Project: Mineral Reserves are reported on a 100% attributable basis. Pursuant to the ore sales and purchase agreement between Filminera Resources Corporation(“Filminera”) and Philippine Gold Processing & Refining Corporation (“PGPRC”), our wholly-
owned subsidiary, PGPRC has the right to purchase all ore from the Masbate Gold Project. The Mineral Reserves have an effective date of December 31, 2016. The Qualified Person for the estimate is Kevin Pemberton, P.E., who is our Chief Mine Planning Engineer. Mineral
Reserves are based on a conventional open pit mining method, gold price of US$1,250/oz, modeled metallurgical recovery (resulting in average LOM metallurgical recoveries by pit that range from 65% to 82%), and operating cost estimates of US$1.50/t mined (mining),
a variable ore differential cost by pit (average cost is US$0.17), US$9.36–10.18/t processed (processing) and US$2.30–3.84/t processed (general and administrative). Dilution and ore loss were applied through block averaging such that at a cutoff of 0.45 g/t Au, there
is a 5% increase in tonnes, a 6% reduction in grade and 1% reduction in ounces when compared to the Mineral Resource model. Mineral Reserves are reported at cutoffs that range from 0.46–0.49 g/t Au.
4. Otjikoto Mine: Mineral Reserves are reported on a 90% attributable basis; the remaining 10% interest is held by EVI Mining (Proprietary) Ltd., a Namibian empowerment company (“EVI”). The Mineral Reserves have an effective date of December 31, 2016. The Qualified
Person for the estimate is Peter Montano, P.E., who is our Project Director. Mineral Reserves that will be mined by open pit methods assume a gold price of US$1,250/oz, metallurgical recovery of 98%, and operating cost estimates of US$1.75/t mined (mining),
US$13.00/t processed (processing) and US$3.00/t processed (general and administrative). Dilution and ore loss was applied through block averaging such that at a cutoff of 0.45 g/t Au, there is a 1% decrease in tonnes, a 4% reduction in grade and 5% reduction in
ounces when compared to the Mineral Resource model. Mineral Reserves are reported at a cutoff of 0.45 g/t Au.
5. La Libertad Mine: Mineral Reserves are reported on a 100% attributable basis, and have an effective date of December 31, 2016. The Qualified Person for the estimate is Kevin Pemberton, P.E., who is our Chief Mine Planning Engineer. Mineral Reserves are based on a
conventional open pit mining method, gold price of US$1,250/oz, metallurgical recoveries that range from 90% to 94%, and operating cost estimates of US$3.88/t mined (mining), US$13.31/t processed (processing) and US$4.13/t processed (general and
administrative). Dilution and ore loss was applied to the Jabali material through block averaging such that at a cutoff of 0.75-0.76 g/t Au, there is a 15% increase in tonnes, a 26% reduction in grade and 14% reduction in ounces when compared to the Mineral Resource
model. No dilution is applied to spent-ore. Mineral Reserves are reported at cutoffs that range from 0.70–0.76 g/t Au.
6. El Limon Mine: Mineral Reserves are reported on a 95% attributable basis; the remaining 5% interest is held by Inversiones Mineras S.A. (“IMISA”). The Mineral Reserves have an effective date of December 31, 2016. The Qualified Person for the estimate is Kevin
Pemberton, P.E., who is our Chief Mine Planning Engineer. Mineral Reserves are based on underground long-hole stoping mining methods, gold price of US$1,250/oz, metallurgical recovery of 93.5%, and operating cost estimates of US$58.05–82.39/t of ore mined
(mining), US$26.33/t of ore processed (processing) and US$13.14/t processed (general and administrative). Dilution of 20-30% is applied to most zones in addition to 90% mine recovery for all zones. Mineral Reserves are reported at cutoffs that range from 3.04–3.22
g/t Au.
7. Stockpiles: Mineral Reserves are reported in the totals for the Masbate and Otjikoto mines, and were prepared by mine site personnel at each operation. Ore stockpile balances are derived from mining truck movements to individual stockpiles or detailed surveys, with grade
estimated from routine grade control methods. Stockpile cutoffs vary by deposit, from 0.25–0.7 g/t Au.
8. For additional information regarding our mineral projects, including mineral resources and reserves, please refer to our Annual Information Form dated March 31, 2017.
43NOTES TO MINERAL RESERVE ESTIMATES
1. Refer to slide 46 for footnotes
As of December 31, 2016
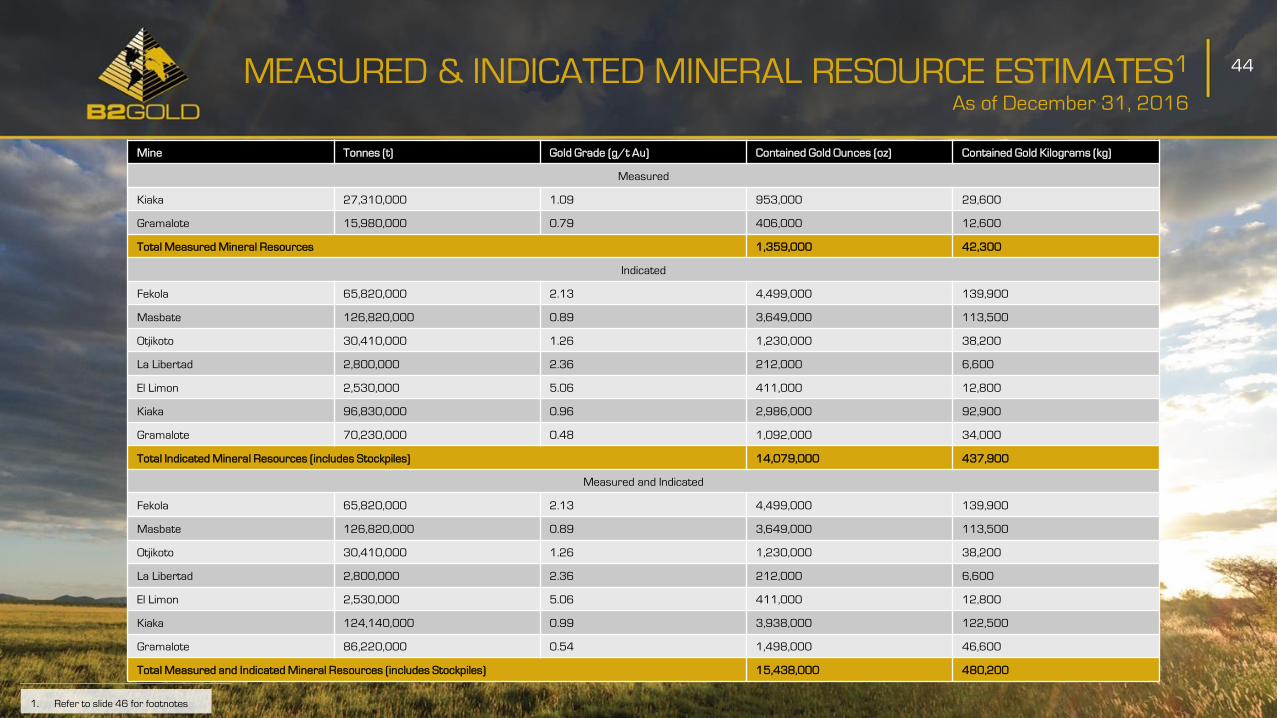
44MEASURED & INDICATED MINERAL RESOURCE ESTIMATES1
Mine Tonnes (t) Gold Grade (g/t Au) Contained Gold Ounces (oz) Contained Gold Kilograms (kg)
Measured
Kiaka 27,310,000 1.09 953,000 29,600
Gramalote 15,980,000 0.79 406,000 12,600
Total Measured Mineral Resources 1,359,000 42,300
Indicated
Fekola 65,820,000 2.13 4,499,000 139,900
Masbate 126,820,000 0.89 3,649,000 113,500
Otjikoto 30,410,000 1.26 1,230,000 38,200
La Libertad 2,800,000 2.36 212,000 6,600
El Limon 2,530,000 5.06 411,000 12,800
Kiaka 96,830,000 0.96 2,986,000 92,900
Gramalote 70,230,000 0.48 1,092,000 34,000
Total Indicated Mineral Resources (includes Stockpiles) 14,079,000 437,900
Measured and Indicated
Fekola 65,820,000 2.13 4,499,000 139,900
Masbate 126,820,000 0.89 3,649,000 113,500
Otjikoto 30,410,000 1.26 1,230,000 38,200
La Libertad 2,800,000 2.36 212,000 6,600
El Limon 2,530,000 5.06 411,000 12,800
Kiaka 124,140,000 0.99 3,938,000 122,500
Gramalote 86,220,000 0.54 1,498,000 46,600
Total Measured and Indicated Mineral Resources (includes Stockpiles) 15,438,000 480,200
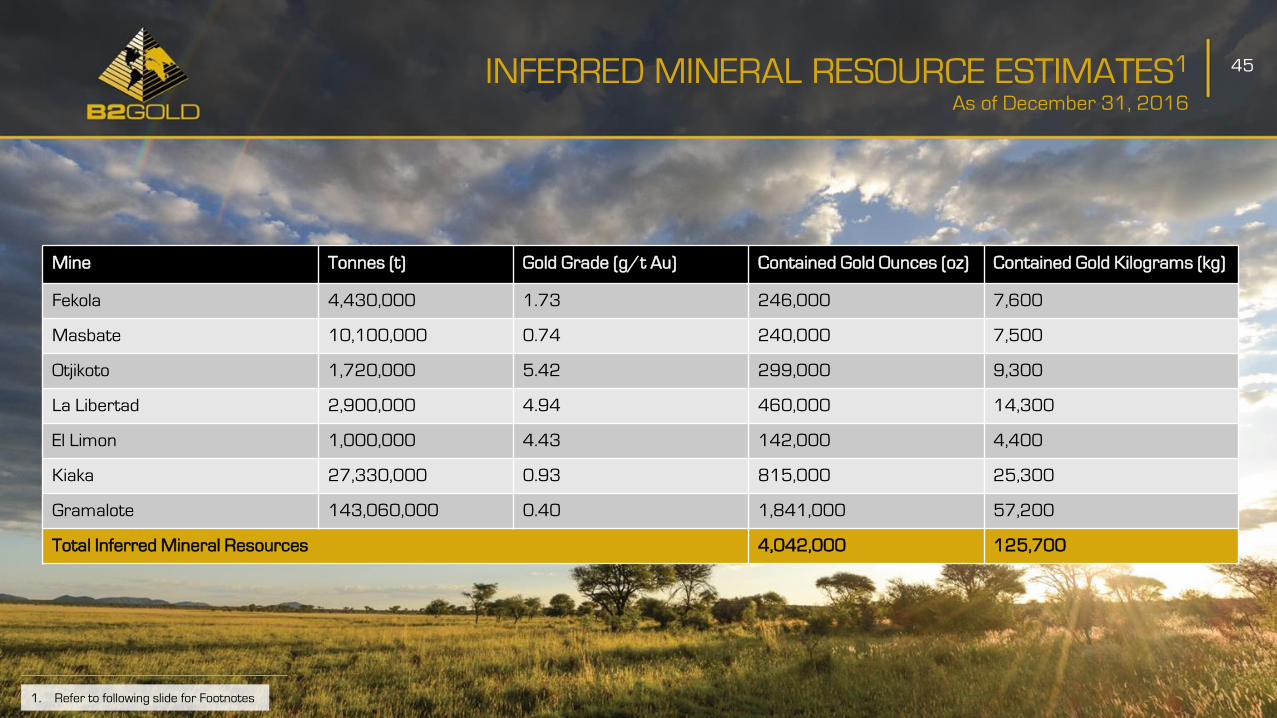
As of December 31, 2016
45INFERRED MINERAL RESOURCE ESTIMATES1
Mine Tonnes (t) Gold Grade (g/t Au) Contained Gold Ounces (oz) Contained Gold Kilograms (kg)
Fekola 4,430,000 1.73 246,000 7,600
Masbate 10,100,000 0.74 240,000 7,500
Otjikoto 1,720,000 5.42 299,000 9,300
La Libertad 2,900,000 4.94 460,000 14,300
El Limon 1,000,000 4.43 142,000 4,400
Kiaka 27,330,000 0.93 815,000 25,300
Gramalote 143,060,000 0.40 1,841,000 57,200
Total Inferred Mineral Resources 4,042,000 125,700
1. Refer to following slide for Footnotes

46
1. Mineral Resources have been classified using the 2014 CIM Definition Standards for Mineral Resources and Mineral Reserves. Mineral Resources are reported inclusive of those Mineral Resources that have been modified to Mineral Reserves. Mineral Resources that are
not Mineral Reserves do not have demonstrated economic viability. All tonnage, grade and contained metal content estimates have been rounded; rounding may result in apparent summation differences between tonnes, grade, and contained metal content.
2. Fekola Project: Mineral Resources are reported on a 90% attributable basis; the remaining 10% interest will be held by the State of Mali. We expect that the State of Mali will exercise its right to acquire an additional 10% interest in the Fekola Project. For further details of
our interest in the Fekola Project, see the heading “Material Properties – Fekola Project – Property Description, Location and Access” of the Company’s Annual Information Form. The Mineral Resources have an effective date of December 31, 2016. The Qualified Person
for the estimate is Tom Garagan, P.Geo., who is our Senior Vice President, Exploration. Mineral Resource estimates assume an open pit mining method, gold price of US$1,400/oz, metallurgical recovery of 92.7%, and average operating cost estimates of US$2.90/t
mined (mining), US$20.25/t processed (processing) and US$3.72/t processed (general and administrative). Mineral Resources are reported at a cutoff of 0.6g/t Au.
3. Masbate Gold Project: Mineral Resources are reported on a 100% attributable basis. Pursuant to the ore sales and purchase agreement between Filminera and PGPRC, our wholly-owned subsidiary, PGPRC has the right to purchase all ore from the Masbate Gold Project.
The Mineral Resources have an effective date of December 31, 2016. The Qualified Person for the estimate is Tom Garagan, P.Geo., who is our Senior Vice President, Exploration. Mineral Resource estimates assume an open pit mining method, gold price of US$1,400/oz,
modeled metallurgical recovery (resulting in average LOM metallurgical recoveries by pit that range from 65% to 82%), and operating cost estimates of US$1.50/t mined (mining), a variable ore differential cost by pit (average cost is US$0.17), US$9.36–10.18/t
processed (processing) and US$2.30–3.84/t processed (general and administrative). Mineral Resources are reported at an average cutoff of 0.42 g/t Au.
4. Otjikoto Mine: Mineral Resources are reported on a 90% attributable basis; the remaining 10% interest is held by EVI. The Mineral Resources have an effective date of December 31, 2016. The Qualified Person for the estimate is Tom Garagan, P.Geo., who is our Senior
Vice President, Exploration. Mineral Resource estimates that are amenable to open pit mining methods assume a gold price of US$1,400/oz, metallurgical recovery of 98%, and operating cost estimates of US$1.75/t mined (mining), US$13.00/t processed (processing)
and US$3.00/t processed (general and administrative). Mineral Resources that are amenable to open pit mining are reported at a cutoff of 0.40 g/t Au. Mineral Resources that are amenable to underground mining are reported at cutoff of 3.00 g/t Au.
5. La Libertad Mine: Mineral Resources are reported on a 100% attributable basis, and have an effective date of December 31, 2016. The Qualified Person for the estimate is Brian Scott, P.Geo., who is our Vice President, Geology and Technical Services. Mineral Resource
estimates assume an open pit mining method, gold price of US$1,400/oz, metallurgical recoveries that range from 90% to 94%, and operating cost estimates of US$3.88/t mined (mining), US$13.31/t processed (processing) and US$4.13/t processed (general and
administrative). Mineral Resources are reported at cutoffs that range from 0.61–2.85 g/t Au.
6. El Limon Mine: Mineral Resources are reported on a 95% attributable basis; the remaining 5% interest is held by IMISA. Mineral Resources have an effective date of December 31, 2016. The Qualified Person for the estimate is Brian Scott, P.Geo., who is our Vice
President, Geology and Technical Services. Mineral Resource estimates assume underground long-hole stoping mining methods, a gold price of US$1,400/oz, metallurgical recovery of 93.5%, and operating cost estimates of US$58.05–82.39/t of ore mined (mining),
US$26.33/t of ore processed (processing) and US$13.14/t processed (general and administrative). Mineral Resources are reported at cutoffs that range from 2.7–2.9 g/t Au.
7. Kiaka Project: Mineral Resources are reported on an 81% attributable basis; the remaining interest is held by GAMS-Mining F&I Ltd (9%) a Cypriot company, and the Government of Burkina Faso (10%). The Mineral Resource estimate has an effective date of January 8,
2013. The Qualified Person for the estimate is Ben Parsons, MSc, MAusIMM (CP), Principal Consultant for SRK Consulting. Mineral Resources assume an open pit mining method, gold price of US$1,400/oz, metallurgical recovery of 89.8%, and operating cost estimates
of US$1.58/t mined (mining), US$11.89/t processed (processing, and general and administrative). Mineral Resources are reported at a cutoff of 0.4 g/t Au.
8. Gramalote Project: Mineral Resources are reported on a 49% attributable basis; the remaining 51% interest is held by AngloGold Ashanti Limited. Mineral Resources have an effective date of October 6, 2015. The Qualified Person for the estimate is Vaughan Chamberlain,
FAusIMM, Senior Vice President, Geology and Metallurgy for AngloGold. Mineral Resources assume an open pit mining method, gold price of US$1,400, metallurgical recovery of 95%, and operating cost estimates of US$5.40/t processed (processing) and US$1.19 /t
processed (general and administrative). Mineral Resources are reported at a cutoff of 0.1 g/t Au.
9. Stockpiles: Mineral Resources are reported in the totals for the Masbate and Otjikoto mines, and were prepared by mine site personnel at each operation. Ore stockpile balances are derived from mining truck movements to individual stockpiles or detailed surveys, with
grade estimated from routine grade control methods. Stockpile cutoffs vary by deposit, from 0.25–0.7 g/t Au.
10. For additional information regarding our mineral projects, including mineral resources and reserves, please refer to our Annual Information Form dated March 31, 2017.
NOTES TO MINERAL RESOURCE ESTIMATES

47
CONTACT DETAILS
B2Gold CorpSuite 3100, 595 Burrard Street
P.O. Box 49143
Vancouver, BC,
Canada, V7X 1J1
Tel: +1 604 681 8371
Toll Free: +1 800 316 8855
Fax: +1 604 681 6209
Email: [email protected]
Website: www.b2gold.com
Clive JohnsonPresident, CEO & Director
+1 604 681 8371
Ian MacLeanVice President, Investor Relations
+1 604 681 8371
Katie BromleyManager, Investor Relations &
Public Relations
+1 604 681 8371