separating the spatial and environmental variation of...
TRANSCRIPT

Proceedings of the 62nd Gulf and Caribbean Fisheries Institute November 2 - 6, 2009 Cumana, Venezuela
Separating the Spatial and Environmental Variation of Reef Fish Communities:
PCNM and Partitioning Analyses
ENRIQUE NÚÑEZ LARA1, SANDRA M. LAFFON LEAL1, and PIERRE LEGENDRE2 1 Dependencia de Educación Superior de Ciencias Naturales y Exactas, Universidad Autónoma del Carmen,
Calle 56 No. 4, Col. Benito Juárez, C.P. 24180, Ciudad del Carmen, Campeche, México 2 Université de Montréal, Département des Sciencies Biologiques, C. P. 6128, Centre-Ville, Montréal,
Québec, Canadá. H3C3J7
ABSTRACT Modern ecology research has sought to explicitly integrate spatial organization as critical functioning aspects of communities
and ecosystems. Objectives of this study were to establish the spatial scales of variation of reef fish communiies and environmental
characteristics, and quantify the isolated effect of environmental and spatial variales on fish community composition. By using a spatial survey consisting of 472 line transects on four reef habitat and 12 sites of the Caribbean coast of Mexico we collected fish
abundance, environmental characteristics and geographic coordinates data. In order to epitomize the spatial structure of the data we
used Principal Coordinates of Neighbor Matrices (PCNM) technique. Partitioning analysis was used to quantify and test the partial effect of environmental and spatial variables on fish community composition. Results showed that significant PCNM´s variables (p
< 0.05) described mainly fine to intermediate scale variation (< 30 km). Total explained variation on reef fish communities
fluctuated between 60 and 71% respect to the surveyed habitat. The highest fraction of variation was environmental (30 - 40%).
Spatial variation varied from 10 - 15%, depending on the scale of analysis. These fractions were associated with structural
components of the environment, ecological processes, and external causes. Methods and hypotheses proposed were consistent with
the existing theory of reef fish communities and provide new evidence about fish-habitat relationships over explicit spatial scales -useful information for the design of MPA and coral reef ecosystem management.
KEY WORDS: Environmental variation, spatial variation, reef-fish communities
Separando la Variación Espacial y Ambiental de las Comunidades de Peces Affecifales:
Análisis PCNM y de Partición
La investigación ecológica moderna demanda incluir la organización espacial como un componente crítico en el funcionamien-to de sistemas biológicos y de los ecosistemas. Los objetivos de esta investigación fueron: definir las escalas espaciales de variación
en la composición de la comunidad de peces y las características del ambiente, y cuantificar el efecto independiente de las variables
del ambiente y las espaciales en las comunidades de peces. Sobre un diseño espacial que incluyó 472 transectos lineales en cuatro hábitat arrecifales de 12 sitios de la costa del Mar Caribe en México, se tomaron datos de abundancia de peces, características del
hábitat y posiciones geográficas. Para evidenciar la estructura espacial en los datos se utilizó Análisis de Coordenadas Principales
de Matrices Cercanas (PCNM). Se empleó análisis de partición para cuantificar y probar el efecto independiente de las variables
ambientales y de las espaciales en la composición de la comunidad de peces. Los resultados indicaron que las variables espaciales
(PCNM´s) significativas (p < 0.05) representaron principalmente variación de los datos a pequeña y mediana escala (< 30 km). La
variación total en la composición de la comunidad fue entre 60 y 71% dependiendo del hábitat analizado, la fracción mayor correspondió a variación ambiental (30 - 40%). La variación espacial fluctuó entre 10 - 15%, dependiendo de la escala de análisis.
Estas fracciones de variación pudieron asociarse a componentes estructurales del ambiente, procesos ecológicos y causas externas.
Los métodos e hipótesis propuestas fueron consistentes con la teoríaa ecológica existente de comunidades de peces y aportaron nueva evidencia sobre las relaciones peces-ambiente a escalas espaciales definidas –información útil en el diseño y manejo integral
de ecosistemas arrecifales.
PALABRAS CLAVES: Ecología de comunidades de peces, variación espacio-ambiental, partición de la variación
La Séparation de la Variation Spatiale et de L’environnement de Communautés de
Poissons de Récf: PCNM et Analyses de Partition
La recherche moderne écologique a cherché à intégrer explicitement l'organisation spatiale comme un aspect critique du fonctionne-
ment des communautés et des écosystèmes. Les objectifs de cette étude étaient d'établir les échelles spatiales de la variation des communautés de poissons de récif et les caractéristiques environnementales, et de quantifier l'effet isolé des variables environne-
mentales et spatiales sur la composition des communautés de poissons. En utilisant une enquête spatiale composés de 472 transects
linéaires sur quatre habitat de récif et 12 sites de la côte caribéenne du Mexique, nous avons recueilli une abondance de poisson, des caractéristiques environnementales et des données coordonnées géographiques. Afin de personnaliser la structure spatiale des
données, nous avons utilisé la technique de Principal Coordinates of Neighbour Matrices (PCNM). Une analyse de partition a été
utilisée pour quantifier et tester l'effet partielle des variables de l'environnement et du territoire sur la composition des communautés de poissons. Les résultats ont montré que d'importantes variables PCNMs (p < 0,05) décrivent principalement des variations de
niveau intermédiaire et subtile (<3 0 km). Le total a expliqué une variation sur les communautés de poissons de récifs qui ont
fluctué entre 60 et 71%, quant à l'habitat de l'enquête. La plus forte proportion de variation est environnementale (30 - 40%). La variation spatiale a varié de 10 à 15%, selon l'échelle d'analyse. Ces fractions ont été associées à des éléments structurels de
l'environnement, des processus écologiques et des causes externes. Les méthodes et hypothèses proposées étaient conformes à la
Núñez-Lara, E. et al. GCFI:62 (2010) Page 225
INTRODUCTION
Patterns of variation in reef fish community composi-
tion have been recognized to be a result of the effect of
habitat structure (Syms and Jones 2000), biotic interactions
among species (Hixon 1991), larval recruitment (Doherty
1981), external factors, both natural and anthropogenic
(Hawkins et al. 2003), the geographic position of the reef
along the shoreline (Gust et al. 2001), connectivity
between reefs (Ault and Johnson 1998), among other
origins. According to Jones (1991), generally, the hypothe-
ses concerning coral reef fish community structure fit into
one of four basic models: the competition model, the
lottery model, the predation model, and the recruitment-
limitation model. However, from diverse studies and
intuitive knowledge we now know that field observations
are more likely the result from a combination of models
differing in the spatial scale of expression. Evidence
suggests that on a scale of metres, reef-fish species are
affected by environmental factors such as depth (Beukers
and Jones 1997), topographic complexity (Nuñez-Lara and
Arias-González 1998), and the biotic and abiotic compo-
nents of the reef substratum (Chabanet et al. 1998).
Recognisable patterns of variation in the community
composition at scales from tens of metres to kilometres
could be associated with biotic interactions such as
predation or competition (Hixon and Beets 1993, Jones and
McCormick 2002), while broad scale variation is generally
associated with the recruitment process (Doherty 1991) and
the effect of biophysical components of the environment,
which exhibit a spatial arrangement in the system revealing
a classical hierarchical organization (Casseles and Warner
1996).
Given that multiple theories may be appealed about the
factors and processes causing variation in reef fish
community structure and those depend strictly of the scale
of analysis, we intended to cut out multiplicity by using
partition examination over a multi-scale design. The study
was designed threefold:
i) To quantify the effect of environmental and
spatial variables on reef fish community composi-
tion at different spatial scales;
ii) To model the fraction of variation, which is not
directly explained for the analysed variables, with
regard to the ecological theories proposed on reef-
fish ecology. We anticipate that the PCNM
variable combined with partitioning of variance
may lead us to resolve what significant is the fish-
habitat interaction according to the scale: fine (102
-103 m), intermediate (104 - 105m) or broad
(>105m), respect to other sources of variation
acting on fish species.
iii) Central question to rejoin were: which of the
evaluate variables are significant to explain
patterns of variation in community composition?
At which scale(s) are these variables operating?
METHODS
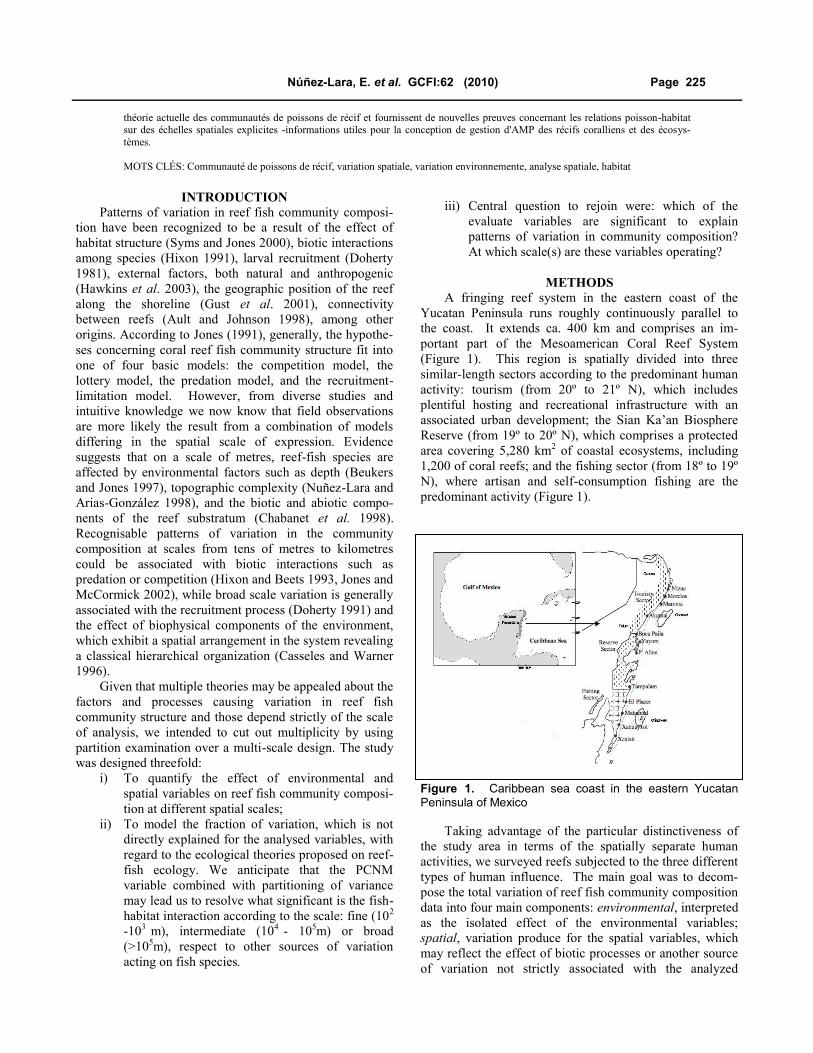
A fringing reef system in the eastern coast of the
Yucatan Peninsula runs roughly continuously parallel to
the coast. It extends ca. 400 km and comprises an im-
portant part of the Mesoamerican Coral Reef System
(Figure 1). This region is spatially divided into three
similar-length sectors according to the predominant human
activity: tourism (from 20º to 21º N), which includes
plentiful hosting and recreational infrastructure with an
associated urban development; the Sian Ka’an Biosphere
Reserve (from 19º to 20º N), which comprises a protected
area covering 5,280 km2 of coastal ecosystems, including
1,200 of coral reefs; and the fishing sector (from 18º to 19º
N), where artisan and self-consumption fishing are the
predominant activity (Figure 1).
théorie actuelle des communautés de poissons de récif et fournissent de nouvelles preuves concernant les relations poisson-habitat sur des échelles spatiales explicites -informations utiles pour la conception de gestion d'AMP des récifs coralliens et des écosys-
tèmes.
MOTS CLÉS: Communauté de poissons de récif, variation spatiale, variation environnemente, analyse spatiale, habitat
Figure 1. Caribbean sea coast in the eastern Yucatan Peninsula of Mexico
Taking advantage of the particular distinctiveness of
the study area in terms of the spatially separate human
activities, we surveyed reefs subjected to the three different
types of human influence. The main goal was to decom-
pose the total variation of reef fish community composition
data into four main components: environmental, interpreted
as the isolated effect of the environmental variables;
spatial, variation produce for the spatial variables, which
may reflect the effect of biotic processes or another source
of variation not strictly associated with the analyzed

Page 226 62nd Gulf and Caribbean Fisheries Institute
variables; environmental spatially structured, the variation
that is explained by the redundant portion of environmental
and spatial data sets, which could be understood as the
effect of environmental variables, which themselves
exhibit a structure in the space at large scale and, unex-
plained variation, which may be attributable to survey
error, implicit biological variation or variables omitted
from the analysis (Legendre and Legendre 1998).
Given the multi-scalar nature of reef fish communities
and of the forces acting on them, we adopted a hierarchical
spatially multi-scale design to estimate the components of
variance bearing in mind the spatial scales suggested for
studies on reef-fish ecology (Sale 1998). The whole region
extent represented the largest scale of analysis and the
three human sectors the primary sampling division in the
hierarchy. Within each sector four nested sites were
selected for survey with a distance of 20 to 70 km between
each other (Figure 1). Four geomorphologic zones of the
reef profile differing significantly in fish community
composition (Núñez-Lara et al. 2005) and considered as
latitudinal continuous habitats, were examined: reef lagoon
(1 - 4 m depth, 100 - 500 m from the coastline), reef front
(6 - 8 m depth, 500 - 600 m from the coastline), reef inner
slope (11 - 14 m depth, 700 - 1000 m from the coastline)
and reef outer slope (20 - 25 m depth, 800 - 1200 m from
coastline). Twelve transects per habitat were placed at each
one of the surveyed sites, representing the sampling units
or replicates.
Survey Techniques and Data Collection
Belt transects 50 m long by 2 m wide were placed over
the reef formations maintaining a continuous direction and
leaving an approximate distance of 50 m between transects.
Geographical coordinates were estimated for each transect
by a global positioning system (GPS). All fish species
observed along transects were identified and the individu-
als counted by underwater visual census technique.
Underwater video of the reef substratum was recorded for
another diver at each transect. A continuous video of the
50 m transect resulted in approximately 40 video squares
of 1 m2 each. Data of substratum variables were obtained
during laboratory analysis of the videos on a high-
resolution screen. The percentages of substratum cover for
eleven benthic components were calculated according to
the categories proposed by Garza-Perez (2003) for each
one of the transects:
i) Spherical and semi-spherical coral (e. g. Diploria,
Colpophillya, Montastrea),
ii) Branching and finger coral (e. g. Acropora,
Millepora, Porites),
iii) Leafy and plate coral (e. g. Agaricia, Scollimia,
Mycetophillia),
iv) Encrusting and sub-massive coral (e. g. Mon-
tastrea, Siderastrea, Porites),
v) Soft coral (e. g. Gorgonia, Plexaura, Muricea),
vi) Calcareous and macro-algae (e. g. Halimeda,
Dyctiota, Padina),
vii) Sea-grass (e. g. Thalassia, Syringodium),
viii) Rock and rubble,
ix) Calcareous floor, and
x) Sand.
Complementarily, the mean depth and topographical
complexity, measured using the chain method, were
estimated along each transect ad up to thirteen environmen-
tal variables per transect.
Data Processing and Numerical Analysis
Fish species abundance data were subjected to
Hellinger transformation, which converts the relative
abundance values of the species registered in each transect
by taking their square root. This method helps to preserve
the Euclidean distances making data suitable for PCA/
RDA (Legendre and Gallagher 2001). In order to epito-
mize the spatial structure of the data over the three
different scales included in the survey design, we used
Principal Coordinates of Neighbour Matrices (PCNM)
technique (Borcard and Legendre 2002). Principal
eigenvectors (PCNM variables) were obtained by principal
coordinates analysis of a truncated matrix, which in turns
came out from a euclidean distance matrix composed for
the geographic coordinates of the transects. Results with
empirical and real data (including a prior analysis with the
present data comparing PCNM and polynomial terms
variables) proved that this method conducts to a good
reconstruction of spatial structures from small to large
scales (Borcard et al. 2004).
The thirteen environmental variables and the resulting
PCNM variables were submitted to forward selection
process (Dray et al. 2006) with the purpose to reduce
inflation of the explain variation attributable to pure
chance. So, three sets of data were involved in the
subsequent analyses: matrices X and W composed with the
forward selected independent variables, environmental and
spatial, respectively, and the matrix of dependent variables
Y composed with the Hellinger transformed abundance
values of the fish species.
Numerical analyses were carried out using the method
proposed by Borcard et al. (1992), to fractionate the
variation of reef fish community composition data. This
approach gives a comprehensive result of the proportional
importance of the explanatory variables on the species
data. Canonical redundancy analysis was used as ordina-
tion base method, presuming a lineal response of the fish
species to environmental gradients across the study region.
Routines of analyses were made using library “vegan” vrs.
1.15-2 (Oksanen et al. 2009), and packages “packfor” vrs
0.0-7 (Dray et al. 2009); “PCNM” (Legendre et al. 2009);
and “varpart” (Legendre 2009), all them for R version 2.9.0
(Development Core Team 2009). Analyses were per-
formed separately for each habitat at three different spatial
scales:
Núñez-Lara, E. et al. GCFI:62 (2010) Page 227
i) Small-scale (< 3 km), including separately the
data of each one of the twelve surveyed sites,
ii) Intermediate-scale (90-120 km), including the
data of the four sites belonging to each one of the
sectors, and
iii) Large-scale (ca 400 km), including all together the
data of the twelve sites of study area.
For each analysis, the statistical significance of the
constraint axes was estimated using ANOVA with 1000
random permutations under the direct model. In addition,
environmental variables were tested one by one in order to
determine how significant was their effect to explain fish
community composition variation. This procedure was run
in R project following routines exampled in Legendre
(2005). Ordination biplots were produced in order to
represent the relationship between the surveyed samples
and the environmental variables. We illustrate these
relationships intending to identify a trend in the array of the
data as a function of the human influence and to offer a
more detailed visual interpretation of the fish-habitat
relationships.
RESULTS
A gradient in species richness was observed across the
four habitats surveyed, with the lowest number of fish
species in the reef lagoon (98) close to the shore, and the
highest in the reef terrace (140), the most distant habitat. A
total of 182 reef-fish species were identified in 480
transects along the approximate 400 km of the fringing
coral reef system in the eastern Yucatan Peninsula, most of
them rare species restricted in their distribution to one or
two contiguous habitats. Among the sectors, the highest
number of species per transect was recorded in the fishing
sector (14.9) followed by the reserve sector (13.5) and the
tourism sector (11.4). Relative abundance showed a
similar trend with the highest mean value in the fishing
sector (53 individuals/transect), followed by the protected
area (49 individuals/transect) and the tourism sector (45
individuals/transect).
Partitioning Variation
A considerable amount of explained variation was
observed at all the spatial scales investigated, despite the
highly random distribution and abundance of the reef-fish
species in the sampled site of the Caribbean reefs. This
indicated an accurate selection of variables and the
application of a correct spatial and causal approach.
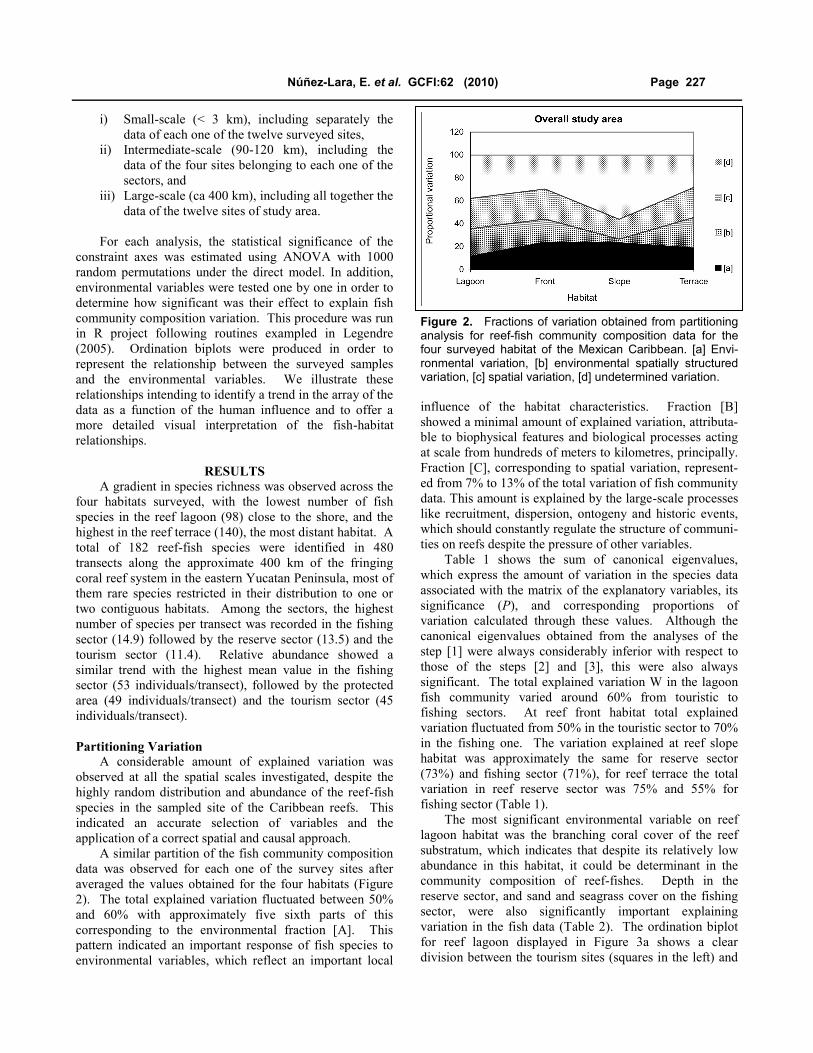
A similar partition of the fish community composition
data was observed for each one of the survey sites after
averaged the values obtained for the four habitats (Figure
2). The total explained variation fluctuated between 50%
and 60% with approximately five sixth parts of this
corresponding to the environmental fraction [A]. This
pattern indicated an important response of fish species to
environmental variables, which reflect an important local
influence of the habitat characteristics. Fraction [B]
showed a minimal amount of explained variation, attributa-
ble to biophysical features and biological processes acting
at scale from hundreds of meters to kilometres, principally.
Fraction [C], corresponding to spatial variation, represent-
ed from 7% to 13% of the total variation of fish community
data. This amount is explained by the large-scale processes
like recruitment, dispersion, ontogeny and historic events,
which should constantly regulate the structure of communi-
ties on reefs despite the pressure of other variables.
Table 1 shows the sum of canonical eigenvalues,
which express the amount of variation in the species data
associated with the matrix of the explanatory variables, its
significance (P), and corresponding proportions of
variation calculated through these values. Although the
canonical eigenvalues obtained from the analyses of the
step [1] were always considerably inferior with respect to
those of the steps [2] and [3], this were also always
significant. The total explained variation W in the lagoon
fish community varied around 60% from touristic to
fishing sectors. At reef front habitat total explained
variation fluctuated from 50% in the touristic sector to 70%
in the fishing one. The variation explained at reef slope
habitat was approximately the same for reserve sector
(73%) and fishing sector (71%), for reef terrace the total
variation in reef reserve sector was 75% and 55% for
fishing sector (Table 1).
The most significant environmental variable on reef
lagoon habitat was the branching coral cover of the reef
substratum, which indicates that despite its relatively low
abundance in this habitat, it could be determinant in the
community composition of reef-fishes. Depth in the
reserve sector, and sand and seagrass cover on the fishing
sector, were also significantly important explaining
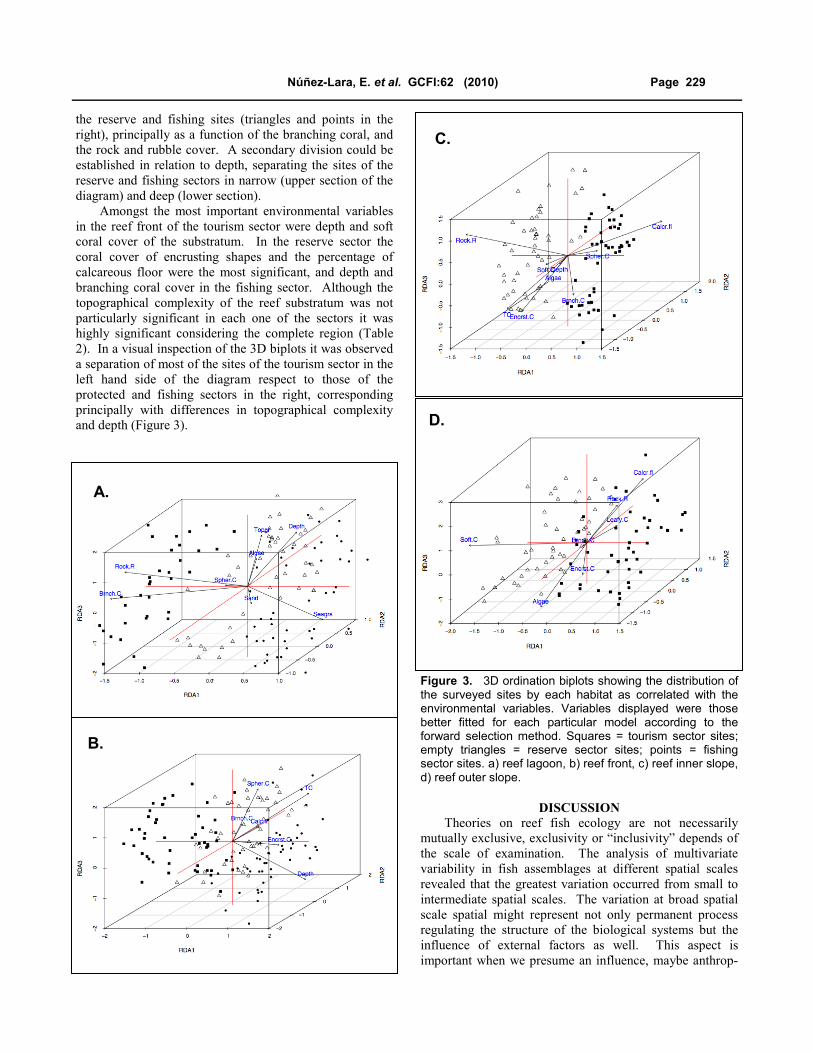
variation in the fish data (Table 2). The ordination biplot
for reef lagoon displayed in Figure 3a shows a clear
division between the tourism sites (squares in the left) and
Figure 2. Fractions of variation obtained from partitioning analysis for reef-fish community composition data for the four surveyed habitat of the Mexican Caribbean. [a] Envi-ronmental variation, [b] environmental spatially structured variation, [c] spatial variation, [d] undetermined variation.

Page 228 62nd Gulf and Caribbean Fisheries Institute
Table 1. Summary of results obtained by partitioning analysis for each combination of habitat and sector and habitats overall of the Mexican Caribbean reef fish communities. The total explained variation (W), as well as four fractions of variation: [A] = environmental, [B] = environmental spatially structured, [C] = spatial and [D] = non-explained are presented. Habitats: L = lagoon, F = front, S = Slope, T = Terrace.
[0] [1] (P) [2] (P) [3] (P) W (%) [A] % [B] % [C] % [D] %
L Tourism
1.326 0.449 (***) 0.692
(***) 0.791 (***) 59.6 7.5 26.3 25.8 40.4
L Reserve 1.934 0.549 (***)
0.737 (***)
1.020 (***) 52.7 14.6 13.7 24.4 47.3
L Fishing 2.100 0.258 ( * )
1.167 ( ***)
1.263 (***) 60.1 4.6 8.2 47.9 39.9
L Overall 10.815 3.881 (***)
5.485 (***)
6.759 (***) 62.3 11.7 24.0 26.6 37.7
F Tourism
1.802 0.612 (***) 0.679
(***) 0.900 (***) 49.9 12.3 21.6 16.0 50.1
F Reserve 1.810 1.055 (***)
0.874 (***)
1.196 (***) 66.0 17.8 40.4 7.8 34.0
F Fishing 1.853 0.551 (***)
1.215 (***)
1.293 (***) 69.7 4.2 25.5 40.0 30.3
F Overall 12.559 5.558 (***)
5.849 (***)
8.843 (***) 70.4 23.9 20.3 26.2 29.6
S Reserve
1.807 1.220 (***) 1.082
(***) 1.324 (***) 73.2 13.4 54.1 5.7 26.8
S Fishing 1.767 1.034 (***)
0.680 (***)
1.265 (***) 71.5 33.1 25.4 13.0 28.5
S Overall 5.873 1.565 (***)
1.212 (***)
2.594 (***) 44.1 23.5 3.1 17.5 55.9
T Reserve
1.867 1.216 (***) 1.205
(***) 1.417 (***) 75.8 11.3 53.8 10.7 24.2
T Fishing 1.776 0.458 (***)
0.700 (***)
0.988 (***) 55.6 16.2 9.4 29.9 44.4
T Overall 5.867 2.680 (***)
3.101 (***)
4.218 (***) 71.8 19.0 26.6 26.2 28.2
Table 2. Results of significance tests of the environmental variables involved on RDA analyses after forward selection. The effect of the environmental variables was tested for reef fish communities of the four habitats in general: reef lagoon (L), reef front (F), reef slope (S) and reef terrace (T) and for the three sectors: t = tourism, r = reserve and f = fishing. P values were obtained using 1000 permutations: 0 ‘***’ 0.001 ‘**’ 0.01 ‘*’ 0.05 ‘.’ 0.1.
L L/t L/r L/f F F/t F/r F/f S S/r S/f T T/r T/f
Depth . . n.s *** * *** n.s n.s n.s n.s
T.Complexity n.s *** n.s n.s * **
Algae ** *** n.s n.s n.s ** * n.s *
Soft C *** * n.s *** *** *** n.s * n.s
Spheric C n.s n.s n.s *
Branching C ** *** n.s * n.s *** n.s . n.s
Leafy C . . .
Encrusting C * * n.s * * n.s n.s
Calcareous floor ** n.s n.s . n.s n.s
Rock & rubbles *** . * n.s *** *** ** n.s n.s
Sand ** n.s n.s
Seagrass * n.s
Núñez-Lara, E. et al. GCFI:62 (2010) Page 229
the reserve and fishing sites (triangles and points in the
right), principally as a function of the branching coral, and
the rock and rubble cover. A secondary division could be
established in relation to depth, separating the sites of the
reserve and fishing sectors in narrow (upper section of the
diagram) and deep (lower section).
Amongst the most important environmental variables
in the reef front of the tourism sector were depth and soft
coral cover of the substratum. In the reserve sector the
coral cover of encrusting shapes and the percentage of
calcareous floor were the most significant, and depth and
branching coral cover in the fishing sector. Although the
topographical complexity of the reef substratum was not
particularly significant in each one of the sectors it was
highly significant considering the complete region (Table
2). In a visual inspection of the 3D biplots it was observed
a separation of most of the sites of the tourism sector in the
left hand side of the diagram respect to those of the
protected and fishing sectors in the right, corresponding
principally with differences in topographical complexity
and depth (Figure 3).
DISCUSSION
Theories on reef fish ecology are not necessarily
mutually exclusive, exclusivity or “inclusivity” depends of
the scale of examination. The analysis of multivariate
variability in fish assemblages at different spatial scales
revealed that the greatest variation occurred from small to
intermediate spatial scales. The variation at broad spatial
scale spatial might represent not only permanent process
regulating the structure of the biological systems but the
influence of external factors as well. This aspect is
important when we presume an influence, maybe anthrop-
Figure 3. 3D ordination biplots showing the distribution of the surveyed sites by each habitat as correlated with the environmental variables. Variables displayed were those better fitted for each particular model according to the forward selection method. Squares = tourism sector sites; empty triangles = reserve sector sites; points = fishing sector sites. a) reef lagoon, b) reef front, c) reef inner slope, d) reef outer slope.
A.
B.
C.
D.

Page 230 62nd Gulf and Caribbean Fisheries Institute
ic, on communities or their habitats. A great compromise
will be to generate a proportional equilibrium index. A
numerical value calculated through well-delimitated
proportions of variation of the community composition.
This index will reflect a particular dynamic and structural
functioning of the community and further than the
condition of the coral reef. We stated that an index based
on ranges of variation explained by the different types of
variables is more complete and informative than an
analysis of single variables.
Chittaro (2004) found that habitat variables explained
31 – 81% (at scales of 1 – 200 m2) of the variation in the
number of individuals and species. Similar analyses were
also performed on the abundances of the nine most
common species, and whether their specific habitat
associations were independent of scale. Results indicated
that habitat variables explained 19 – 73% (at scales of 1–
200 m2) of the variation in abundances of each species.
Unique fish-habitat relationships were observed for each
species, and most such relationships were consistent across
spatial scales. No generalization can made across large
areas, although there is an intrinsic liaison of the pattern of
community structure across spatial scales, it does not
necessarily imply that those patterns observed at local or
small scale can be extrapolated to larger or regional scales.
If we had been studying the importance of the habitat
variables on reef fish species on each one of the sectors of
the Caribbean by using only the data of one site in that
sector the results had showed a high proportion of variation
in composition of the community explained for environ-
mental variables, which was not true in the multi-scale
inspection. From our point of view, for a comprehensive
full description of a multi-scale ecological systems, a multi
-scale approaches should be preferred. In a similar study
Bounchon-Navaro, et al. (2005) found through partitioning
analysis that a significant proportion of variation was
explained by habitat classes (15%), geographic gradients
described by the Caribbean arch, latitude (8.4%) and depth
(3.9%) for reef-fish species of the Caribbean West Islands.
We anticipated that separation would occur according to
the type of habitat. We therefore, focused on the variation
explained by environmental variables per se, and spatial
variables that could be hypothetically reflecting an
ecological process like competition or predation generating
patterns in space, detectable for the analysis. Given that
reef-fishes express relatively short ranges of motion on the
reef there is a temptation to think that they are mostly
sedentary and depend strictly on the substratum characte-
ristics of the neighborhood. According to Munday (2002)
habitat availability measured at tens of meters explained 47
-65% of the variation in the abundance of habitat-specialist
reef fish species among locations spanning over 2,000 km.
Therefore, local-scale patterns of habitat use appear to
determine much larger-scale patterns of abundance. Either
geographic variation in local-scale processes that was not
measured, or additional processes acting at very large
spatial scales influence species. Intermediate scale
variation can be only hypothethise caused by processes like
predation, recruitment and competition because there were
not time scales implied in the study (Jones and McCormick
2002), so clear conclusions can not be achieved.
Large-scale statistical patterns are helpful in predicting
some properties of local assemblages. Relative certainty
and simplicity of large-scale patterns is balanced by the
uncertainty and complexity of their explanations. The
greatest achievement of macroecology is the recognition of
the influence of the large-scale constraints on small-scale
patterns and processes, whereas its greatest challenge is to
understand how these large-scale regularities emerge, and
moreover, how they are connected to each other (Storch
and Gaston 2003). The relationship between local and
regional species richness appear to indicate that local
processes (predation, competition and habitat selection) are
relatively unimportant in comparison to the role of the
regional species pool (Caley and Schluter 1997); however,
Leps (2001) has shown evidence that the reverse effect
could be possible. The spatial dependence model implies
that the response variable is spatially structured because it
depends upon explanatory (e.g. physical) variables that are
themselves spatially structured by their own generating
processes (Legendre et al. 2002). This is an extension of
the environmental control model developed by Wittaker
(1956), Hutchinson (1957), and Bray and Curtis (1957).
The spatial autocorrelation model implies that the response
variable results from some dynamic process within the
variable itself. Spatial autocorrelation actually refers to the
lack of independence among the error components of field
data, as a function of the geographic distances among sites.
Despite that comparatively clear separation of the
coast in the Mexican eastern Yucatan Peninsula in terms of
the human activities, a quantitative reciprocity is not such
as clear. Results indicated that intermediate scale spatial
patterns could be associated with natural causes like
heterogeneity composition of the reef. What is clear is that
without an understanding of the quantitative aspects of the
patterns found we will not be able to resolve different
theories concerning the causes (Storch and Gaston 2003).
The approach employed was useful to separate the
variation in reef fish community composition data into
different components. Numerical methods as that proposed
by Borcard et al. (1992) to separate the variation into
different components facilitates the analysis of complex
data and the understanding of the functioning of multi-
species systems. “It is evident that identifying and
understanding scale-dependent changes in pattern and
process must be a prerequisite for predicting the conse-
quences of changes in ecological systems induced by
natural disturbances and human alterations of the environ-
ment” (Avois-Jacket 2008).
Although nowadays a number of papers adduce the
use and virtues of a spatially multi-scale approach in the
understanding of scale-dependent ecological processes the
Núñez-Lara, E. et al. GCFI:62 (2010) Page 231
number of studies that have been applied this and obtained
conclusive results is not comparative. After an exhaustive
data collection over an explicitly spatial sampling design
we analyzed the data according to the contemporary
numerical methods attaining categorical outcomes.
Accomplishment results for the present investigation may
be used in further studies aimed to design marine protected
areas on coral reefs from an explicitly spatial perspective,
and to model community dynamics, discriminating
essential from non-suitable habitat.
ACKNOWLEDGEMENTS Centro de Investigación y de Estudios Avanzados-Mérida. Consejo
Nacional de Ciencia y Tecnología.
LITERATURE CITED Borcard, D. and P. Legendre. 1994. Environmental control and spatial
structure in ecological communities: an example using oribatid mites
(Acari, Oribatei). Environmental and Ecological Statistics 1:37-53. Borcard, D. and P. Legendre. 2002. All-scale spatial analysis of ecological
data by means of principal coordinates of neighbour matrices.
Ecological Modelling 153:51-68. Borcard, D., P. Legendre, C. Avois-Jacquet, and H. Tuomisto. 2004.
Dissecting the spatial structure of ecological data at multiple scales.
Ecology 85:1826-1832 Borcard, D., P. Legendre, and P. Drapeau. 1992. Partialling out the spatial
component of ecological variation. Ecology 73:1045-1055.
Dray, S., P. Legendre, and P. R. Peres-Neto. 2006. Spatial modelling: a comprehensive framework for principal coordinate analysis of
neighbour matrices (PCNM). Ecological Modelling196: 483-493.
Hurlbert, S.H. 1984. Pseudoreplication and the design of ecological field experiments. Ecological Monographs 54:187-211.
Legendre, P. 1993. Spatial autocorrelation: trouble or new paradigm?
Ecology 74:1659-1673. Legendre, P., D. Borcard, and P.R. Peres-Neto. 2005. Analyzing beta
diversity: partitioning the spatial variation of community composi-
tion data. Ecological Monographs 75: 435-450. Legendre, P. and E.D. Gallagher. 2001. Ecologically meaningful
transformations for ordination of species data. Oecologia 129:271-
280. Legendre, P. and L. Legendre. 1998. Numerical ecology, 2nd English
Edition. Elsevier Science BV, Amsterdam.
Oksanen, J., R. Kindt, P. Legendre, and R.B. O'Hara. 2006. Vegan: Community Ecology Package version 1.8-2. URL http://cran.r-
project.org/.
R Development Core Team. 2006. R: A Language and Environment for Statistical Computing. R Foundation for Statistical Computing,
Vienna, Austria. URL http://www.R-project.org. Rao, C.R. 1964. The use and interpretation of principal component
analysis in applied research. Sankhyaá, Ser. A 26:329-358.