sensitivity of the modelled deposition of caesium-137 from the fukushima dai-ichi nuclear power...
TRANSCRIPT
lable at ScienceDirect
Journal of Environmental Radioactivity xxx (2014) 1e12
Contents lists avai
Journal of Environmental Radioactivity
journal homepage: www.elsevier .com/locate/ jenvrad
Sensitivity of the modelled deposition of Caesium-137 from theFukushima Dai-ichi nuclear power plant to the wet depositionparameterisation in NAME
Susan J. Leadbetter a,*, Matthew C. Hort a, Andrew R. Jones a, Helen N. Webster a,Roland R. Draxler b
aMet Office, Exeter, United KingdombNational Oceanic and Atmospheric Administration, College Park, MD, USA
a r t i c l e i n f o
Article history:Received 14 October 2013Received in revised form11 March 2014Accepted 26 March 2014Available online xxx
Keywords:Wet depositionAtmospheric dispersion modellingFukushima Dai-ichi nuclear power plant
* Corresponding author. Tel.: þ44 1392885221.E-mail address: [email protected]
http://dx.doi.org/10.1016/j.jenvrad.2014.03.0180265-931X/Crown Copyright � 2014 Published by Els
Please cite this article in press as: Leadbettenuclear power plant to the wet depositio10.1016/j.jenvrad.2014.03.018
a b s t r a c t
This paper describes an investigation into the impact of different meteorological data sets and differentwet scavenging coefficients on the model predictions of radionuclide deposits following the accident atthe Fukushima Dai-ichi nuclear power plant in March 2011. Three separate operational meteorologicaldata sets, the UK Met Office global meteorology, the ECMWF global meteorology and the Japan Mete-orological Agency (JMA) mesoscale meteorology as well as radar rainfall analyses from JMAwere all usedas inputs to the UK Met Office’s dispersion model NAME (the Numerical Atmospheric-dispersionModelling Environment). The model predictions of Caesium-137 deposits based on these meteorolog-ical models all showed good agreement with observations of deposits made in eastern Japan with cor-relation coefficients ranging from 0.44 to 0.80. Unexpectedly the NAME run using radar rainfall data hada lower correlation coefficient (R ¼ 0.66), when compared to observations, than the run using the JMAmesoscale model rainfall (R ¼ 0.76) or the run using ECMWF met data (R ¼ 0.80). Additionally the impactof modifying the wet scavenging coefficients used in the parameterisation of wet deposition wasinvestigated. The results showed that modifying the scavenging parameters had a similar impact tomodifying the driving meteorology on the rank calculated from comparing the modelled and observeddeposition.
Crown Copyright � 2014 Published by Elsevier Ltd. All rights reserved.
1. Introduction
On 11 March 2011 a large earthquake occurred in the PacificOcean about 70 km to the east of Japan. The quake and the subse-quent tsunami damaged the Fukushima Dai-ichi nuclear powerplant (NPP) leading to the release of radioactive material into theatmosphere. Although much of the radioactive material was trans-portedeastwards over thePacificOcean therewereanumberof dayswhen material was transported inland over Honshu resulting insignificant deposits in Fukushima and neighbouring prefectures.
Radionuclides deposited on the ground following a nuclear ac-cident are an important contribution to the radioactive dosereceived by people in the area (Clark and Smith, 1988). Thereforeany dispersion model which is to be used to provide activity fieldsfor dose estimates must be able to provide a reasonable estimate of
(S.J. Leadbetter).
evier Ltd. All rights reserved.
r, S.J., et al., Sensitivity of thn parameterisation in NAME
the amount and location of material deposited on the ground. Airconcentration output from dispersion models has been validated ina number of field experiments (e.g. Van Dop et al., 1998; Moscaet al., 1998; Webster and Thomson, 2002). However, these experi-ments are often carried out during dry weather and/or do notinclude sampling of deposits so there are very few data sets againstwhich to validate deposition data. In contrast to this an extensivesampling campaign was carried out following the accident atFukushima (Kinoshita et al., 2011) and this provides a unique op-portunity for the validation of model predictions of deposits.
There are a number of sources of uncertainty in the prediction ofdeposition using a dispersion model. The first source of uncertaintycomes from the source term, and a number of studies have usedinverse modelling and/or reactor inventories to estimate theamount of material released during the Fukushima accident (Stohlet al., 2012; Chino et al., 2011; Kobayashi et al., 2013). It isacknowledged that a consensus on the source has not yet beenreached and that this will have an impact on the model predictionsof deposits.
e modelled deposition of Caesium-137 from the Fukushima Dai-ichi, Journal of Environmental Radioactivity (2014), http://dx.doi.org/

S.J. Leadbetter et al. / Journal of Environmental Radioactivity xxx (2014) 1e122
A second source of uncertainty in the predictions of the depo-sition comes from the driving meteorology. In 2011 a small taskteam was convened by the World Meteorological Organization toinvestigate the impact of the meteorology on the dispersion ofmaterial from Fukushima (Draxler et al., 2012). The team compriseddispersion scientists from five countries; Austria, Canada, Japan, theUK and the USA. Each country ran their own dispersion modelusing data from one or more meteorological models in order toexamine the impact of the meteorological data sets on the disper-sion and deposition of radionuclides. The task team’s work showedthat onemeteorological data set and atmospheric dispersionmodelpair did not produce the best comparison to data sets for bothambient concentration and deposition. The UK contribution to thistask team using the UK Met Office’s Numerical Atmospheric-dispersion Modelling Environment (NAME) is described in thefirst half of this paper. Three different meteorological data sets fromNumerical Weather Prediction (NWP) models and rainfall analysesderived from radars and rain gauges are used with the samedispersion model (NAME) in order to examine the sensitivity of theestimated deposits to the driving meteorology.
Few off-line dispersion models resolve in-cloud micro-physicalprocesses or the explicit interaction between pollutants and pre-cipitation that lead to the scavenging of pollutants from the atmo-sphere and ultimately to their deposition on the ground. Therefore,the calculationofwetdepositionwithindispersionmodels is usuallybased on a parameterisation of the complex processes by whichprecipitation removes material from the atmosphere (Sportisse,2007) and this provides a third source of uncertainty in dispersionmodelling. Recently work has been undertaken to update theparameterisation of wet deposition in NAME (Webster andThomson, 2014). So, in the second half of the paper the wet scav-enging parameters used in the newwet deposition scheme inNAMEare varied in order to examine the sensitivity of the deposits to theparameterisation of wet deposition within the dispersion model.
2. Model setup
2.1. NAME model
NAME is used to model the atmospheric transport and disper-sion of a range of gases and particulates (Maryon et al., 1999; Joneset al., 2007). In NAME, emissions into the atmosphere are simulatedby creating a large number of computational particles where eachcomputational particle represents a certain proportion of the massor activity of the released pollutants. These particles are thenadvected along by the ambient three-dimensional wind field pro-vided by a meteorological model with turbulent dispersion pro-cesses being simulated using random-walk methods. The particlescan also evolve with time to account for various atmospheric pro-cesses that might transform or remove the pollutants (e.g. radio-active decay, chemical transformations, or dry and wet deposition).
Dry deposition is modelled in NAME using the concept of thedeposition velocity, vd (Webster and Thomson, 2011). The flux of
Table 1Scavenging parameters used in NAME.
Rain
Large-scale Conv
Orographic enhancement(seeder-feeder)
A ¼ 3.36 � 10�4 A ¼ 3B ¼ 0.79 B ¼ 0
Below-cloud (washout) A ¼ 8.4 � 10�5 A ¼ 8B ¼ 0.79 B ¼ 0
In-cloud (rainout) A ¼ 8.4 � 10�5 A ¼ 3B ¼ 0.79 B ¼ 0
Please cite this article in press as: Leadbetter, S.J., et al., Sensitivity of thnuclear power plant to the wet deposition parameterisation in NAME10.1016/j.jenvrad.2014.03.018
pollutant to the ground, F, is proportional to the concentration, C, ofpollutant and is given by:
F ¼ vdC (1)
where vd is the constant of proportionality. In this study thedeposition velocity is calculated using a resistance analogy
vd ¼ 1Ra þ Rb þ Rc
(2)
where Ra is the aerodynamic resistance, Rb is the laminar sub-layerresistance and Rc is the surface resistance. The aerodynamic resis-tance represents the efficiency with which material is transportedto the ground by turbulence and is independent of thematerial. Thelaminar layer resistance is used to specify the resistance to trans-port by diffusion across the thin quasi-laminar layer adjacent to thesurface. Different parameterisations for Rb are used for gases andparticulates. The surface resistance characterises the resistance tocapture by the surface and is dependent on both the pollutant andthe underlying surface. For particulates, the surface resistance istaken to be zero.
All computational particles within the boundary layer at the endof eachmodel time-step are subject to dry deposition in NAME. Thisis equivalent to assuming the boundary-layer average concentra-tion is representative of the near-surface reference concentrationand is an appropriate assumption if the radionuclide is well-mixedwithin the boundary layer.
In NAME, as in many dispersion models, the removal of materialfrom the atmosphere by wet deposition is based on the depletionequation:
dCdt
¼ LC (3)
where C is the air concentration andL is the scavenging coefficient.The scavenging coefficient is given by:
L ¼ ArB (4)
where r is the rainfall rate (in mm/hr) and A and B are scavengingparameters which may vary for different types of precipitation (i.e.,large-scale/convective and rain/snow) and for different wet depo-sition processes (i.e., rainout, washout and the seeder-feeder pro-cess) (see Table 1).
The first part of this study uses version 6.1 of NAME, in whichwet deposition from dynamic and convective precipitation arecomputed separately and then summed to give total wet deposition(Webster and Thomson, 2014; Maryon et al., 1999). Dynamic pre-cipitation is assumed to be the large-scale precipitation resolved bythe driving meteorological model while convective precipitationrefers to precipitationwhich is largely unresolved and thus must beparameterised within the meteorological model. Material locatedabove the cloud top is not subject to wet deposition. Enhanced wet
Snow/Ice
ective Large-scale Convective
.36 � 10�4 A ¼ 1.0 � 10�3 A ¼ 1.0 � 10�3
.79 B ¼ 0.79 B ¼ 0.79
.4 � 10�5 A ¼ 8.0 � 10�5 A ¼ 8.0 � 10�5
.79 B ¼ 0.305 B ¼ 0.305
.36�10�4 A ¼ 8.0 � 10�5 A ¼ 3.36 � 10�4
.79 B ¼ 0.305 B ¼ 0.79
e modelled deposition of Caesium-137 from the Fukushima Dai-ichi, Journal of Environmental Radioactivity (2014), http://dx.doi.org/
S.J. Leadbetter et al. / Journal of Environmental Radioactivity xxx (2014) 1e12 3
deposition (due to the seeder-feeder process (Houze, 1993)) isapplied to material close to the ground in elevated orographic re-gions. In addition different parameters are used for rainout, wherematerial enters cloud droplets or ice crystals within the cloud and issubsequently rained out, and washout, where material below thecloud is swept out by falling rain drops or snow. The scavengingcoefficients used in this scheme were based on field and modelexperiments (Choularton, Unpublished) and available literature atthe time (e.g. Dore et al., 1990; Knutson and Stockham, 1977;Knutson et al., 1976).
2.2. Model setup
The model setup used in this study mirrors the setup used bythe World Meteorological Organization’s task team investigatingthe impact of the meteorology on the dispersion of material fromFukushima (Draxler et al., 2012). A subset of the runs describedhere comprised the UK contribution to that study.
Air concentration and deposition were computed using thetransfer coefficient matrix (TCM) approach developed by Draxlerand Rolph (2012) where the release of each radionuclide ismodelled as a series of independent short duration sources whichare tracked separately (Equation (5)). The majority of the materialreleased from Fukushima Dai-ichi was judged to have beenreleased between the 11 and 31 March (Chino et al., 2011; Stohlet al., 2012) and this release period was divided into 3-h releasesegments each with a constant release rate. This resulted in 168independent sources each of which was followed for 72 h by whichtime the majority of the material had exited the region of interest.Air concentrations averaged over 3-h periods and between 0 and100 m agl (above ground level) and deposits integrated over 3-hperiods were calculated following Equation (5) and output on a0.05� by 0.05� grid stretching from 125�E to 155�E and 28�N to48�N.
Cj;k ¼Xi
Qi$D$TCMi;j;k (5)
Cj,k is the air concentration (or deposition) of a radionuclide for eachtime interval j and at each location k. It is calculated by summingthe release rate Q, the radioactive decay constant D and the transfercoefficient matrix TCMi,j,k over all release time periods i. TCMi,j,k isthe air concentration (or deposition) for each release period, eachoutput time interval and each location calculated by running thedispersion model with a unit release for each of the 168 3-h releasewindows.
One advantage of the TCM approach is that as information aboutthe release rate becomes available air concentration and depositioncan be recalculated using Equation (5) rather than by re-runningthe much more computationally expensive dispersion model. Asthe number of radionuclides to be modelled in the task team’sstudy was initially unknown, three generic radionuclide types wereused in the dispersion modelling; a light particle (no gravitational
Table 2Details of meteorological models used to drive NAME.
Meteorological model UKMET
Horizontal resolution w0.352� longitude byw0.234� latitudeapprox. 25 km
Vertical resolution 59 levels up to 30 kmTemporal resolution 3-hourlyReferences Davies et al. (2005)
Please cite this article in press as: Leadbetter, S.J., et al., Sensitivity of thnuclear power plant to the wet deposition parameterisation in NAME10.1016/j.jenvrad.2014.03.018
settling but subject towet and dry deposition), a depositing gas anda non-depositing gas. This approach meant that air concentrationsand deposition totals could be calculated for any additional radio-nuclide by changing the source term and the radioactive decayconstant for the relevant radionuclide in Equation (5) rather thanby re-running the dispersion models.
This study concentrates on the releases of Caesium-137 as thereare a large number of Caesium-137 measurements available andbecause detailed source term estimation has been carried out forCaesium-137 (Chino et al., 2011; Stohl et al., 2012; Terada et al.,2012; Kobayashi et al., 2013). Activity size distributions ofCaesium-137 measured in Japan were shown to have median di-ameters of 0.53e0.63 mm (Kaneyasu et al., 2012). For the region andtime period of interest here the effect of gravitational settling issmall for a particulate of <1 mm. Therefore, Caesium-137 wasmodelled as a light computational particle without gravitationalsettling and with a diameter less than 1 mm. Caesium-137 wasreleased from Fukushima Dai-ichi (37.4206N,141.0329E) at a heightof 100 m above ground in the model. A release rate derived fromlocal measurements (Chino et al. (2011) and later refined by Teradaet al. (2012); Katata et al. (2012)) was used.
2.3. Meteorological data
NAME is typically run using NWP model data from the MetOffice or ECMWF but can be configured to use data in GRIB formatfrom any meteorological model provided a suitable set of meteo-rological variables is available. In the first half of this study depo-sition is compared fromNAME runs usingmeteorological data fromthree operational NWPmodels; the UK Met Office Unified Model inits global setup (referred to hereafter as UKMET), the EuropeanCentre for Medium range Weather Forecasting model (referred tohereafter as ECMWF) and the mesoscale model of the JapanMeteorological Agency (referred to hereafter as MESO). Details ofthe models’ spatial and temporal resolution are given in Table 2.Recognising the importance of accurate precipitation data in pre-dicting the amount of radioactive material deposited in Japan,NAME runs were also carried out using meteorology from the JapanMeteorological Agency (JMA) mesoscale model along with JMAradar rainfall analysis (referred to hereafter as MESO-R) (Nagata,2012).
3. Radiological observations
Radionuclide specific radiation data, which formed part of thedeposition graphic first reported by the Japanese Ministry of Edu-cation, Culture, Sports, Science and Technology (MEXT) and pub-lished by Kinoshita et al. (2011), were used to validate the depositsof Caesium-137 predicted by the model runs. The data setcomprised measurements made by the US Department of Energy(DoE) using a fixed wing (C-12) aircraft (USDOE, 2011) and con-current ground measurements collected by MEXT (MEXT, 2011).
ECMWF MESO and MESO-R
0.125� longitude byby 0.125� latitudeapprox. 16 km
Regridded to 0.05� longitudeby 0.05� latitudeapprox. 5 km
55 levels up to w17 km 48 levels up to w21 km3-hourly 3-hourlySimmons et al. (1989) Honda et al. (2005)Rabier et al. (2000) Saito (2012)Mahfouf and Rabier (2000) Honda and Sawada (2008)
e modelled deposition of Caesium-137 from the Fukushima Dai-ichi, Journal of Environmental Radioactivity (2014), http://dx.doi.org/
S.J. Leadbetter et al. / Journal of Environmental Radioactivity xxx (2014) 1e124
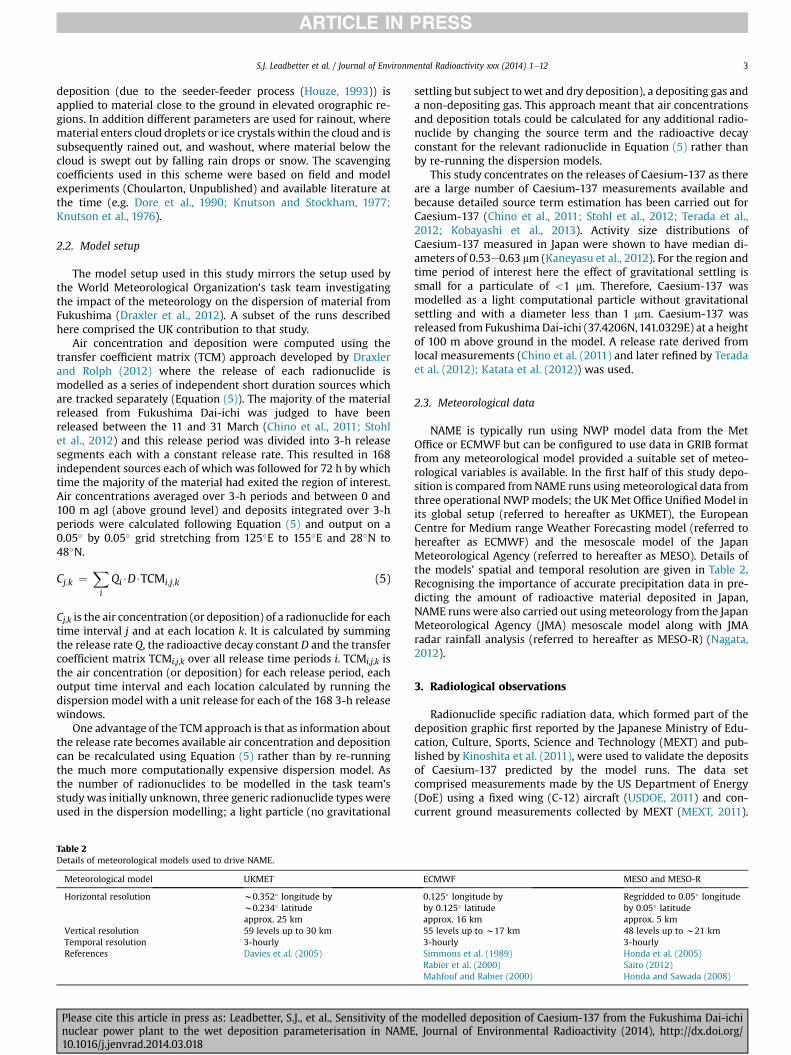
The observations were averaged onto the same grid as the modeloutput by computing the mean of the measurements within eachgrid cell (see Section 2.2 for details) resulting in a total of 543 gridcells containing measurements (Fig. 1). The evaluation was limitedto measurements collected within the Fukushima prefecture andneighbouring prefectures.
4. Sensitivity to meteorology
4.1. Comparison to observations
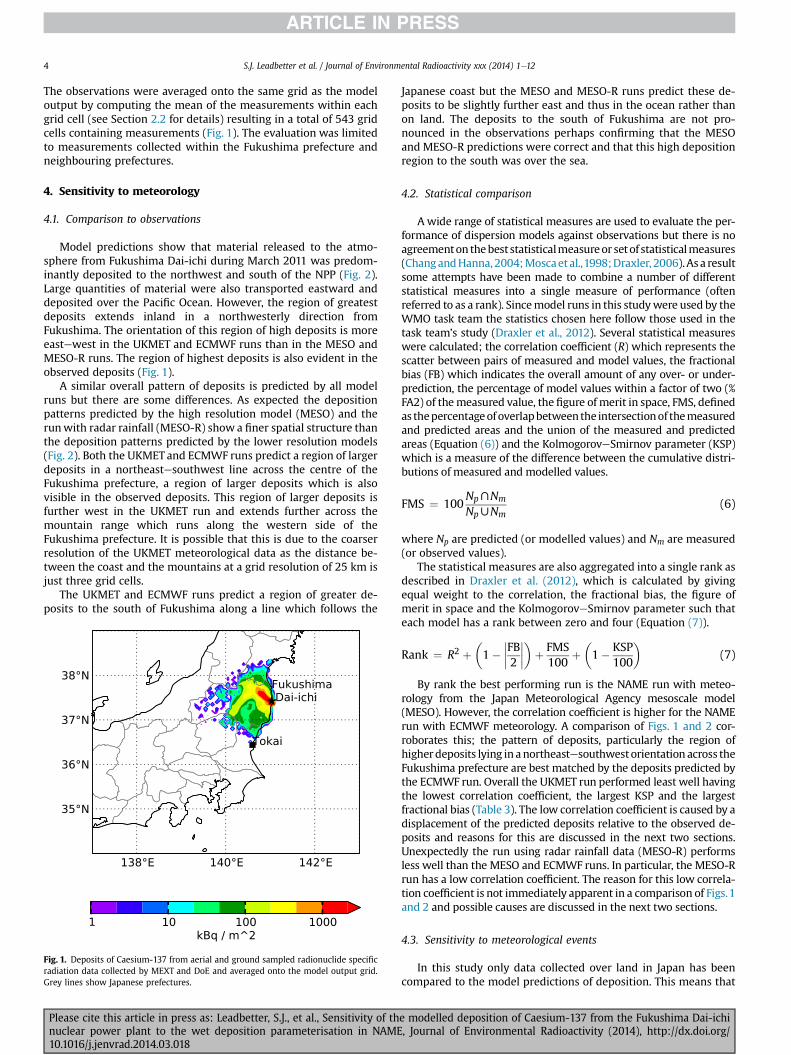
Model predictions show that material released to the atmo-sphere from Fukushima Dai-ichi during March 2011 was predom-inantly deposited to the northwest and south of the NPP (Fig. 2).Large quantities of material were also transported eastward anddeposited over the Pacific Ocean. However, the region of greatestdeposits extends inland in a northwesterly direction fromFukushima. The orientation of this region of high deposits is moreeastewest in the UKMET and ECMWF runs than in the MESO andMESO-R runs. The region of highest deposits is also evident in theobserved deposits (Fig. 1).
A similar overall pattern of deposits is predicted by all modelruns but there are some differences. As expected the depositionpatterns predicted by the high resolution model (MESO) and therunwith radar rainfall (MESO-R) show a finer spatial structure thanthe deposition patterns predicted by the lower resolution models(Fig. 2). Both the UKMET and ECMWF runs predict a region of largerdeposits in a northeastesouthwest line across the centre of theFukushima prefecture, a region of larger deposits which is alsovisible in the observed deposits. This region of larger deposits isfurther west in the UKMET run and extends further across themountain range which runs along the western side of theFukushima prefecture. It is possible that this is due to the coarserresolution of the UKMET meteorological data as the distance be-tween the coast and the mountains at a grid resolution of 25 km isjust three grid cells.
The UKMET and ECMWF runs predict a region of greater de-posits to the south of Fukushima along a line which follows the
Fig. 1. Deposits of Caesium-137 from aerial and ground sampled radionuclide specificradiation data collected by MEXT and DoE and averaged onto the model output grid.Grey lines show Japanese prefectures.
Please cite this article in press as: Leadbetter, S.J., et al., Sensitivity of thnuclear power plant to the wet deposition parameterisation in NAME10.1016/j.jenvrad.2014.03.018
Japanese coast but the MESO and MESO-R runs predict these de-posits to be slightly further east and thus in the ocean rather thanon land. The deposits to the south of Fukushima are not pro-nounced in the observations perhaps confirming that the MESOand MESO-R predictions were correct and that this high depositionregion to the south was over the sea.
4.2. Statistical comparison
Awide range of statistical measures are used to evaluate the per-formance of dispersion models against observations but there is noagreementon thebeststatisticalmeasureor setof statisticalmeasures(ChangandHanna,2004;Moscaetal.,1998;Draxler, 2006).Asa resultsome attempts have been made to combine a number of differentstatistical measures into a single measure of performance (oftenreferred to as a rank). Sincemodel runs in this studywere used by theWMO task team the statistics chosen here follow those used in thetask team’s study (Draxler et al., 2012). Several statistical measureswere calculated; the correlation coefficient (R) which represents thescatter between pairs of measured and model values, the fractionalbias (FB) which indicates the overall amount of any over- or under-prediction, the percentage of model values within a factor of two (%FA2) of themeasured value, the figure of merit in space, FMS, definedas thepercentageofoverlapbetween the intersectionof themeasuredand predicted areas and the union of the measured and predictedareas (Equation (6)) and the KolmogoroveSmirnov parameter (KSP)which is a measure of the difference between the cumulative distri-butions of measured and modelled values.
FMS ¼ 100NpXNm
NpWNm(6)
where Np are predicted (or modelled values) and Nm are measured(or observed values).
The statistical measures are also aggregated into a single rank asdescribed in Draxler et al. (2012), which is calculated by givingequal weight to the correlation, the fractional bias, the figure ofmerit in space and the KolmogoroveSmirnov parameter such thateach model has a rank between zero and four (Equation (7)).
Rank ¼ R2 þ�1�
����FB2�����þ FMS
100þ�1� KSP
100
�(7)
By rank the best performing run is the NAME run with meteo-rology from the Japan Meteorological Agency mesoscale model(MESO). However, the correlation coefficient is higher for the NAMErun with ECMWF meteorology. A comparison of Figs. 1 and 2 cor-roborates this; the pattern of deposits, particularly the region ofhigherdeposits lying inanortheastesouthwestorientation across theFukushima prefecture are best matched by the deposits predicted bythe ECMWF run. Overall the UKMET run performed least well havingthe lowest correlation coefficient, the largest KSP and the largestfractional bias (Table 3). The low correlation coefficient is caused by adisplacement of the predicted deposits relative to the observed de-posits and reasons for this are discussed in the next two sections.Unexpectedly the run using radar rainfall data (MESO-R) performsless well than the MESO and ECMWF runs. In particular, the MESO-Rrun has a low correlation coefficient. The reason for this low correla-tion coefficient is not immediately apparent in a comparison of Figs.1and 2 and possible causes are discussed in the next two sections.
4.3. Sensitivity to meteorological events
In this study only data collected over land in Japan has beencompared to the model predictions of deposition. This means that
e modelled deposition of Caesium-137 from the Fukushima Dai-ichi, Journal of Environmental Radioactivity (2014), http://dx.doi.org/
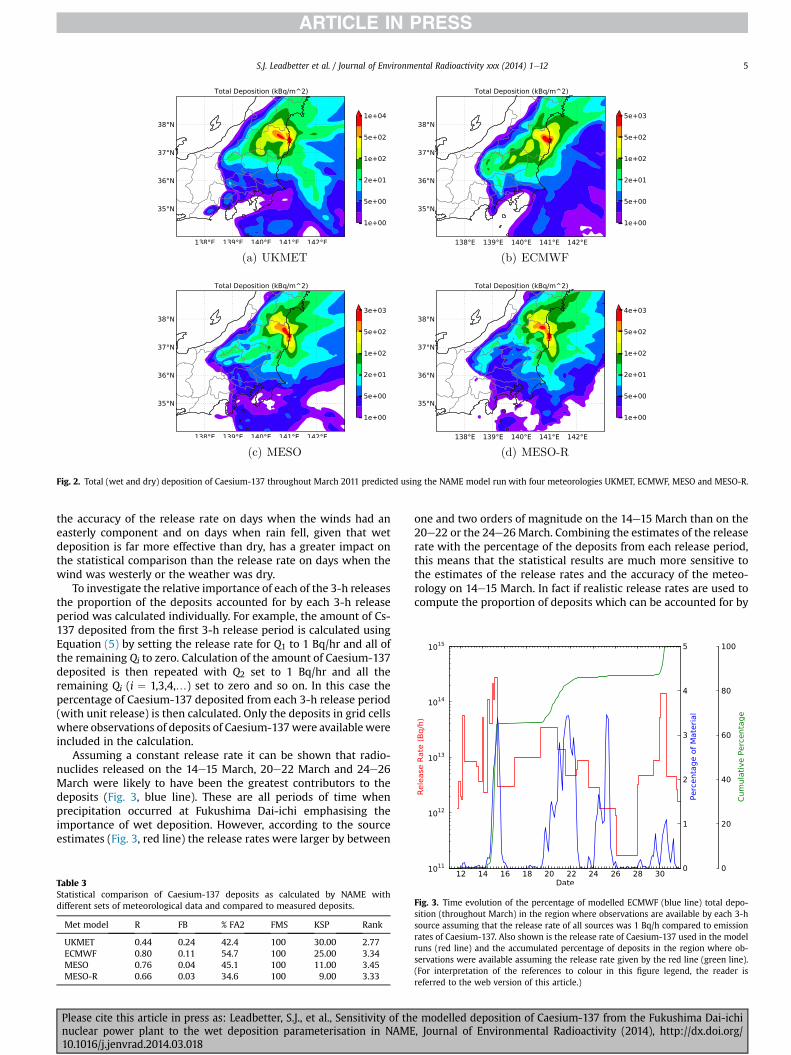
Fig. 2. Total (wet and dry) deposition of Caesium-137 throughout March 2011 predicted using the NAME model run with four meteorologies UKMET, ECMWF, MESO and MESO-R.
S.J. Leadbetter et al. / Journal of Environmental Radioactivity xxx (2014) 1e12 5
the accuracy of the release rate on days when the winds had aneasterly component and on days when rain fell, given that wetdeposition is far more effective than dry, has a greater impact onthe statistical comparison than the release rate on days when thewind was westerly or the weather was dry.
To investigate the relative importance of each of the 3-h releasesthe proportion of the deposits accounted for by each 3-h releaseperiod was calculated individually. For example, the amount of Cs-137 deposited from the first 3-h release period is calculated usingEquation (5) by setting the release rate for Q1 to 1 Bq/hr and all ofthe remaining Qi to zero. Calculation of the amount of Caesium-137deposited is then repeated with Q2 set to 1 Bq/hr and all theremaining Qi (i ¼ 1,3,4,.) set to zero and so on. In this case thepercentage of Caesium-137 deposited from each 3-h release period(with unit release) is then calculated. Only the deposits in grid cellswhere observations of deposits of Caesium-137were availablewereincluded in the calculation.
Assuming a constant release rate it can be shown that radio-nuclides released on the 14e15 March, 20e22 March and 24e26March were likely to have been the greatest contributors to thedeposits (Fig. 3, blue line). These are all periods of time whenprecipitation occurred at Fukushima Dai-ichi emphasising theimportance of wet deposition. However, according to the sourceestimates (Fig. 3, red line) the release rates were larger by between
Table 3Statistical comparison of Caesium-137 deposits as calculated by NAME withdifferent sets of meteorological data and compared to measured deposits.
Met model R FB % FA2 FMS KSP Rank
UKMET 0.44 0.24 42.4 100 30.00 2.77ECMWF 0.80 0.11 54.7 100 25.00 3.34MESO 0.76 0.04 45.1 100 11.00 3.45MESO-R 0.66 0.03 34.6 100 9.00 3.33
Please cite this article in press as: Leadbetter, S.J., et al., Sensitivity of thnuclear power plant to the wet deposition parameterisation in NAME10.1016/j.jenvrad.2014.03.018
one and two orders of magnitude on the 14e15 March than on the20e22 or the 24e26March. Combining the estimates of the releaserate with the percentage of the deposits from each release period,this means that the statistical results are much more sensitive tothe estimates of the release rates and the accuracy of the meteo-rology on 14e15 March. In fact if realistic release rates are used tocompute the proportion of deposits which can be accounted for by
Fig. 3. Time evolution of the percentage of modelled ECMWF (blue line) total depo-sition (throughout March) in the region where observations are available by each 3-hsource assuming that the release rate of all sources was 1 Bq/h compared to emissionrates of Caesium-137. Also shown is the release rate of Caesium-137 used in the modelruns (red line) and the accumulated percentage of deposits in the region where ob-servations were available assuming the release rate given by the red line (green line).(For interpretation of the references to colour in this figure legend, the reader isreferred to the web version of this article.)
e modelled deposition of Caesium-137 from the Fukushima Dai-ichi, Journal of Environmental Radioactivity (2014), http://dx.doi.org/
S.J. Leadbetter et al. / Journal of Environmental Radioactivity xxx (2014) 1e126
each 3-h release rate then more than 60% of the deposits (withinthe region where observed deposits were available) came frommaterial which was released in the 15 h period between 1800 UTCon 14 March and 0900 UTC on 15 March (Fig. 3, green line).
Other studies have also looked at the meteorological conditionsduring the Fukushima accident (e.g. Morino et al., 2011; Stohl et al.,2012; Srinivas et al., 2012; Korsakissok et al., 2013) and their resultshave also demonstrated that much of the material deposited on themain island of Japan (Honshu) was deposited on the 15 Marchwhen winds were south-south-easterly and the plume of radioac-tive material coincided with precipitation.
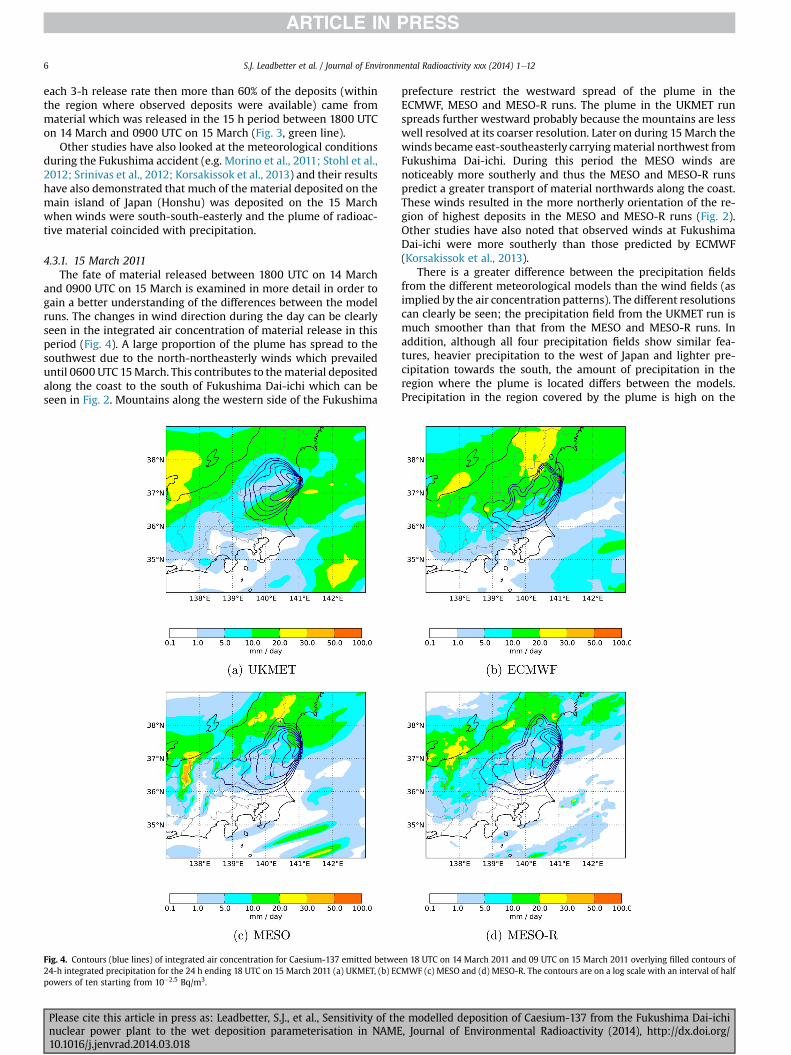
4.3.1. 15 March 2011The fate of material released between 1800 UTC on 14 March
and 0900 UTC on 15 March is examined in more detail in order togain a better understanding of the differences between the modelruns. The changes in wind direction during the day can be clearlyseen in the integrated air concentration of material release in thisperiod (Fig. 4). A large proportion of the plume has spread to thesouthwest due to the north-northeasterly winds which prevaileduntil 0600 UTC 15March. This contributes to thematerial depositedalong the coast to the south of Fukushima Dai-ichi which can beseen in Fig. 2. Mountains along the western side of the Fukushima
Fig. 4. Contours (blue lines) of integrated air concentration for Caesium-137 emitted betwe24-h integrated precipitation for the 24 h ending 18 UTC on 15 March 2011 (a) UKMET, (b) ECpowers of ten starting from 10�2.5 Bq/m3.
Please cite this article in press as: Leadbetter, S.J., et al., Sensitivity of thnuclear power plant to the wet deposition parameterisation in NAME10.1016/j.jenvrad.2014.03.018
prefecture restrict the westward spread of the plume in theECMWF, MESO and MESO-R runs. The plume in the UKMET runspreads further westward probably because the mountains are lesswell resolved at its coarser resolution. Later on during 15 March thewinds became east-southeasterly carryingmaterial northwest fromFukushima Dai-ichi. During this period the MESO winds arenoticeably more southerly and thus the MESO and MESO-R runspredict a greater transport of material northwards along the coast.These winds resulted in the more northerly orientation of the re-gion of highest deposits in the MESO and MESO-R runs (Fig. 2).Other studies have also noted that observed winds at FukushimaDai-ichi were more southerly than those predicted by ECMWF(Korsakissok et al., 2013).
There is a greater difference between the precipitation fieldsfrom the different meteorological models than the wind fields (asimplied by the air concentration patterns). The different resolutionscan clearly be seen; the precipitation field from the UKMET run ismuch smoother than that from the MESO and MESO-R runs. Inaddition, although all four precipitation fields show similar fea-tures, heavier precipitation to the west of Japan and lighter pre-cipitation towards the south, the amount of precipitation in theregion where the plume is located differs between the models.Precipitation in the region covered by the plume is high on the
en 18 UTC on 14 March 2011 and 09 UTC on 15 March 2011 overlying filled contours ofMWF (c) MESO and (d) MESO-R. The contours are on a log scale with an interval of half
e modelled deposition of Caesium-137 from the Fukushima Dai-ichi, Journal of Environmental Radioactivity (2014), http://dx.doi.org/
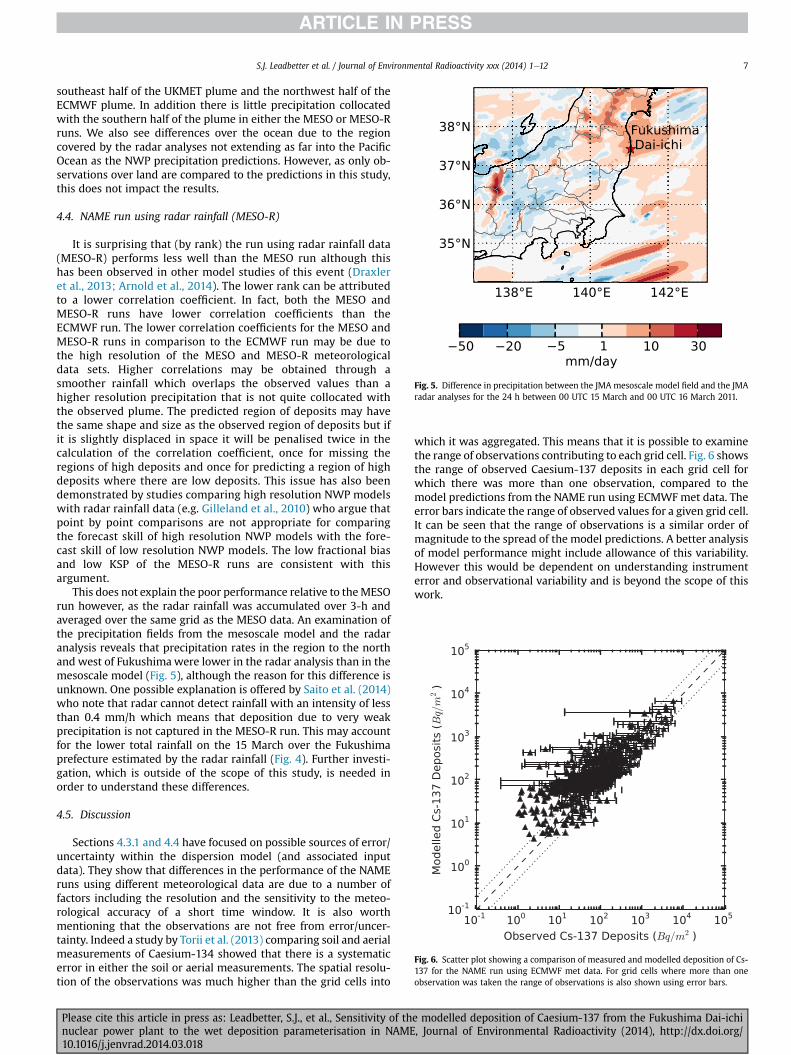
Fig. 5. Difference in precipitation between the JMA mesoscale model field and the JMAradar analyses for the 24 h between 00 UTC 15 March and 00 UTC 16 March 2011.
Fig. 6. Scatter plot showing a comparison of measured and modelled deposition of Cs-137 for the NAME run using ECMWF met data. For grid cells where more than oneobservation was taken the range of observations is also shown using error bars.
S.J. Leadbetter et al. / Journal of Environmental Radioactivity xxx (2014) 1e12 7
southeast half of the UKMET plume and the northwest half of theECMWF plume. In addition there is little precipitation collocatedwith the southern half of the plume in either the MESO or MESO-Rruns. We also see differences over the ocean due to the regioncovered by the radar analyses not extending as far into the PacificOcean as the NWP precipitation predictions. However, as only ob-servations over land are compared to the predictions in this study,this does not impact the results.
4.4. NAME run using radar rainfall (MESO-R)
It is surprising that (by rank) the run using radar rainfall data(MESO-R) performs less well than the MESO run although thishas been observed in other model studies of this event (Draxleret al., 2013; Arnold et al., 2014). The lower rank can be attributedto a lower correlation coefficient. In fact, both the MESO andMESO-R runs have lower correlation coefficients than theECMWF run. The lower correlation coefficients for the MESO andMESO-R runs in comparison to the ECMWF run may be due tothe high resolution of the MESO and MESO-R meteorologicaldata sets. Higher correlations may be obtained through asmoother rainfall which overlaps the observed values than ahigher resolution precipitation that is not quite collocated withthe observed plume. The predicted region of deposits may havethe same shape and size as the observed region of deposits but ifit is slightly displaced in space it will be penalised twice in thecalculation of the correlation coefficient, once for missing theregions of high deposits and once for predicting a region of highdeposits where there are low deposits. This issue has also beendemonstrated by studies comparing high resolution NWP modelswith radar rainfall data (e.g. Gilleland et al., 2010) who argue thatpoint by point comparisons are not appropriate for comparingthe forecast skill of high resolution NWP models with the fore-cast skill of low resolution NWP models. The low fractional biasand low KSP of the MESO-R runs are consistent with thisargument.
This does not explain the poor performance relative to theMESOrun however, as the radar rainfall was accumulated over 3-h andaveraged over the same grid as the MESO data. An examination ofthe precipitation fields from the mesoscale model and the radaranalysis reveals that precipitation rates in the region to the northand west of Fukushimawere lower in the radar analysis than in themesoscale model (Fig. 5), although the reason for this difference isunknown. One possible explanation is offered by Saito et al. (2014)who note that radar cannot detect rainfall with an intensity of lessthan 0.4 mm/h which means that deposition due to very weakprecipitation is not captured in the MESO-R run. This may accountfor the lower total rainfall on the 15 March over the Fukushimaprefecture estimated by the radar rainfall (Fig. 4). Further investi-gation, which is outside of the scope of this study, is needed inorder to understand these differences.
4.5. Discussion
Sections 4.3.1 and 4.4 have focused on possible sources of error/uncertainty within the dispersion model (and associated inputdata). They show that differences in the performance of the NAMEruns using different meteorological data are due to a number offactors including the resolution and the sensitivity to the meteo-rological accuracy of a short time window. It is also worthmentioning that the observations are not free from error/uncer-tainty. Indeed a study by Torii et al. (2013) comparing soil and aerialmeasurements of Caesium-134 showed that there is a systematicerror in either the soil or aerial measurements. The spatial resolu-tion of the observations was much higher than the grid cells into
Please cite this article in press as: Leadbetter, S.J., et al., Sensitivity of thnuclear power plant to the wet deposition parameterisation in NAME10.1016/j.jenvrad.2014.03.018
which it was aggregated. This means that it is possible to examinethe range of observations contributing to each grid cell. Fig. 6 showsthe range of observed Caesium-137 deposits in each grid cell forwhich there was more than one observation, compared to themodel predictions from the NAME run using ECMWFmet data. Theerror bars indicate the range of observed values for a given grid cell.It can be seen that the range of observations is a similar order ofmagnitude to the spread of the model predictions. A better analysisof model performance might include allowance of this variability.However this would be dependent on understanding instrumenterror and observational variability and is beyond the scope of thiswork.
e modelled deposition of Caesium-137 from the Fukushima Dai-ichi, Journal of Environmental Radioactivity (2014), http://dx.doi.org/
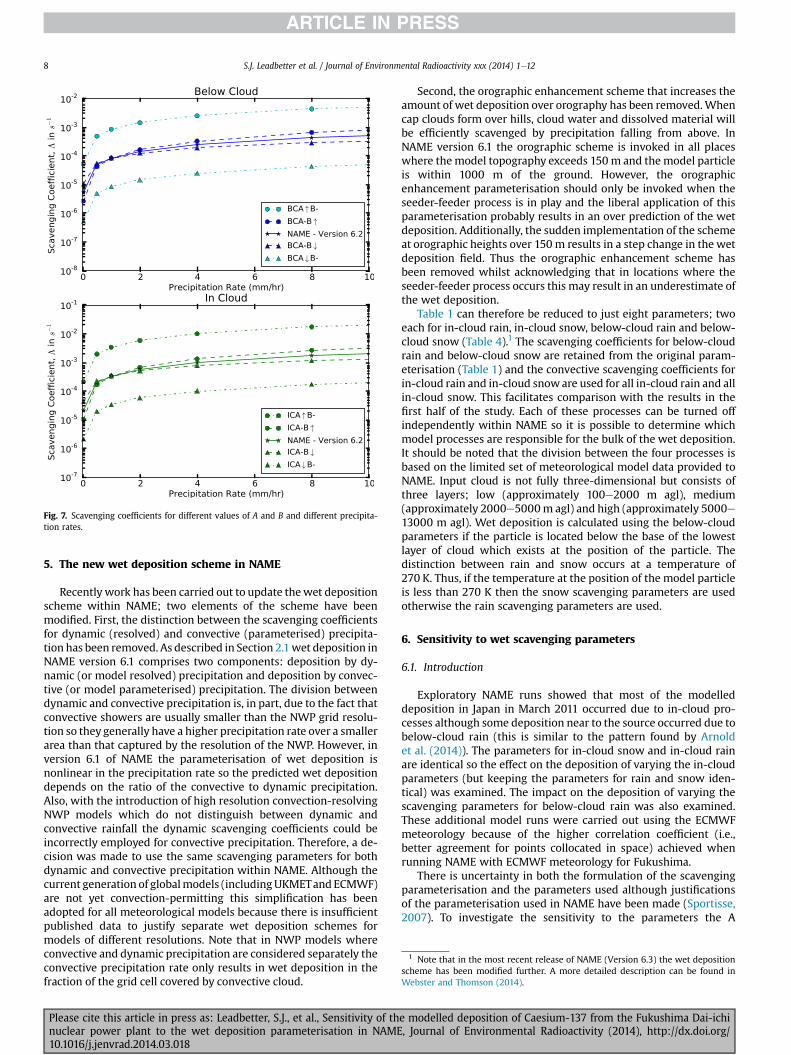
Fig. 7. Scavenging coefficients for different values of A and B and different precipita-tion rates.
1 Note that in the most recent release of NAME (Version 6.3) the wet depositionscheme has been modified further. A more detailed description can be found inWebster and Thomson (2014).
S.J. Leadbetter et al. / Journal of Environmental Radioactivity xxx (2014) 1e128
5. The new wet deposition scheme in NAME
Recently work has been carried out to update thewet depositionscheme within NAME; two elements of the scheme have beenmodified. First, the distinction between the scavenging coefficientsfor dynamic (resolved) and convective (parameterised) precipita-tion has been removed. As described in Section 2.1wet deposition inNAME version 6.1 comprises two components: deposition by dy-namic (or model resolved) precipitation and deposition by convec-tive (or model parameterised) precipitation. The division betweendynamic and convective precipitation is, in part, due to the fact thatconvective showers are usually smaller than the NWP grid resolu-tion so they generally have a higher precipitation rate over a smallerarea than that captured by the resolution of the NWP. However, inversion 6.1 of NAME the parameterisation of wet deposition isnonlinear in the precipitation rate so the predicted wet depositiondepends on the ratio of the convective to dynamic precipitation.Also, with the introduction of high resolution convection-resolvingNWP models which do not distinguish between dynamic andconvective rainfall the dynamic scavenging coefficients could beincorrectly employed for convective precipitation. Therefore, a de-cision was made to use the same scavenging parameters for bothdynamic and convective precipitation within NAME. Although thecurrent generation of globalmodels (includingUKMETand ECMWF)are not yet convection-permitting this simplification has beenadopted for all meteorological models because there is insufficientpublished data to justify separate wet deposition schemes formodels of different resolutions. Note that in NWP models whereconvective and dynamic precipitation are considered separately theconvective precipitation rate only results in wet deposition in thefraction of the grid cell covered by convective cloud.
Please cite this article in press as: Leadbetter, S.J., et al., Sensitivity of thnuclear power plant to the wet deposition parameterisation in NAME10.1016/j.jenvrad.2014.03.018
Second, the orographic enhancement scheme that increases theamount of wet deposition over orography has been removed.Whencap clouds form over hills, cloud water and dissolved material willbe efficiently scavenged by precipitation falling from above. InNAME version 6.1 the orographic scheme is invoked in all placeswhere themodel topography exceeds 150 m and the model particleis within 1000 m of the ground. However, the orographicenhancement parameterisation should only be invoked when theseeder-feeder process is in play and the liberal application of thisparameterisation probably results in an over prediction of the wetdeposition. Additionally, the sudden implementation of the schemeat orographic heights over 150 m results in a step change in the wetdeposition field. Thus the orographic enhancement scheme hasbeen removed whilst acknowledging that in locations where theseeder-feeder process occurs this may result in an underestimate ofthe wet deposition.
Table 1 can therefore be reduced to just eight parameters; twoeach for in-cloud rain, in-cloud snow, below-cloud rain and below-cloud snow (Table 4).1 The scavenging coefficients for below-cloudrain and below-cloud snow are retained from the original param-eterisation (Table 1) and the convective scavenging coefficients forin-cloud rain and in-cloud snoware used for all in-cloud rain and allin-cloud snow. This facilitates comparison with the results in thefirst half of the study. Each of these processes can be turned offindependently within NAME so it is possible to determine whichmodel processes are responsible for the bulk of the wet deposition.It should be noted that the division between the four processes isbased on the limited set of meteorological model data provided toNAME. Input cloud is not fully three-dimensional but consists ofthree layers; low (approximately 100e2000 m agl), medium(approximately 2000e5000m agl) and high (approximately 5000e13000 m agl). Wet deposition is calculated using the below-cloudparameters if the particle is located below the base of the lowestlayer of cloud which exists at the position of the particle. Thedistinction between rain and snow occurs at a temperature of270 K. Thus, if the temperature at the position of the model particleis less than 270 K then the snow scavenging parameters are usedotherwise the rain scavenging parameters are used.
6. Sensitivity to wet scavenging parameters
6.1. Introduction
Exploratory NAME runs showed that most of the modelleddeposition in Japan in March 2011 occurred due to in-cloud pro-cesses although some deposition near to the source occurred due tobelow-cloud rain (this is similar to the pattern found by Arnoldet al. (2014)). The parameters for in-cloud snow and in-cloud rainare identical so the effect on the deposition of varying the in-cloudparameters (but keeping the parameters for rain and snow iden-tical) was examined. The impact on the deposition of varying thescavenging parameters for below-cloud rain was also examined.These additional model runs were carried out using the ECMWFmeteorology because of the higher correlation coefficient (i.e.,better agreement for points collocated in space) achieved whenrunning NAME with ECMWF meteorology for Fukushima.
There is uncertainty in both the formulation of the scavengingparameterisation and the parameters used although justificationsof the parameterisation used in NAME have been made (Sportisse,2007). To investigate the sensitivity to the parameters the A
e modelled deposition of Caesium-137 from the Fukushima Dai-ichi, Journal of Environmental Radioactivity (2014), http://dx.doi.org/
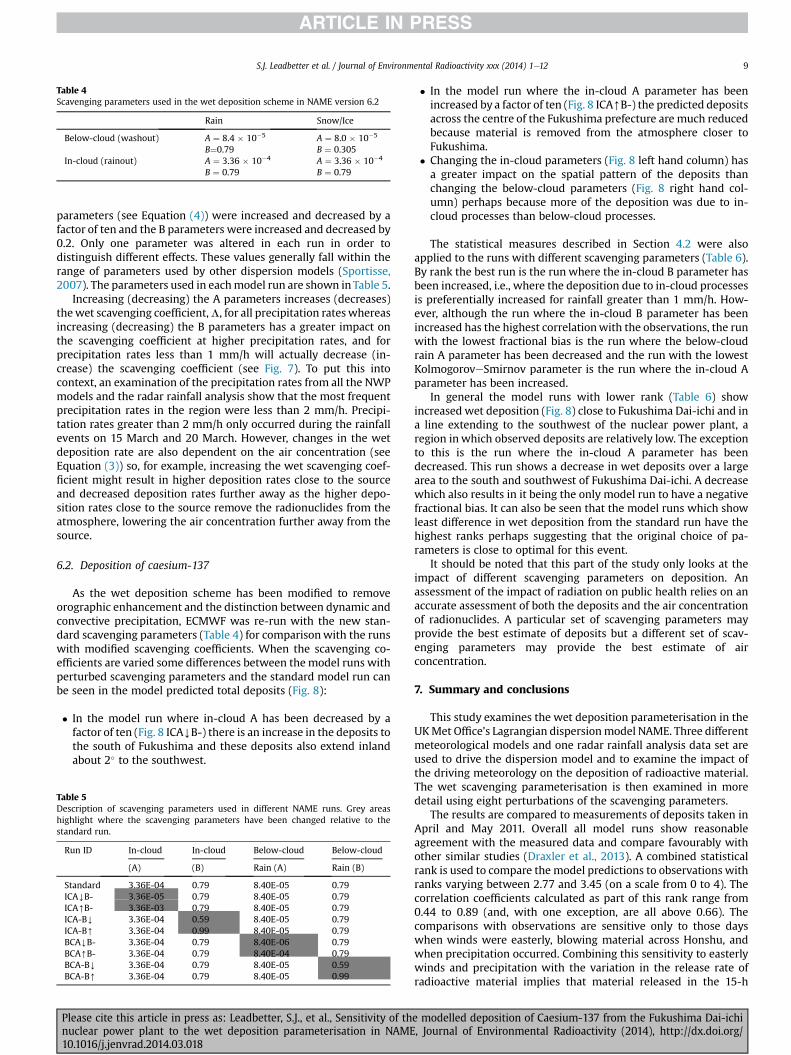
Table 4Scavenging parameters used in the wet deposition scheme in NAME version 6.2
Rain Snow/Ice
Below-cloud (washout) A ¼ 8.4 � 10�5 A ¼ 8.0 � 10�5
B¼0.79 B ¼ 0.305In-cloud (rainout) A ¼ 3.36 � 10�4 A ¼ 3.36 � 10�4
B ¼ 0.79 B ¼ 0.79
S.J. Leadbetter et al. / Journal of Environmental Radioactivity xxx (2014) 1e12 9
parameters (see Equation (4)) were increased and decreased by afactor of ten and the B parameters were increased and decreased by0.2. Only one parameter was altered in each run in order todistinguish different effects. These values generally fall within therange of parameters used by other dispersion models (Sportisse,2007). The parameters used in eachmodel run are shown in Table 5.
Increasing (decreasing) the A parameters increases (decreases)thewet scavenging coefficient,L, for all precipitation rateswhereasincreasing (decreasing) the B parameters has a greater impact onthe scavenging coefficient at higher precipitation rates, and forprecipitation rates less than 1 mm/h will actually decrease (in-crease) the scavenging coefficient (see Fig. 7). To put this intocontext, an examination of the precipitation rates from all the NWPmodels and the radar rainfall analysis show that the most frequentprecipitation rates in the region were less than 2 mm/h. Precipi-tation rates greater than 2 mm/h only occurred during the rainfallevents on 15 March and 20 March. However, changes in the wetdeposition rate are also dependent on the air concentration (seeEquation (3)) so, for example, increasing the wet scavenging coef-ficient might result in higher deposition rates close to the sourceand decreased deposition rates further away as the higher depo-sition rates close to the source remove the radionuclides from theatmosphere, lowering the air concentration further away from thesource.
6.2. Deposition of caesium-137
As the wet deposition scheme has been modified to removeorographic enhancement and the distinction between dynamic andconvective precipitation, ECMWF was re-run with the new stan-dard scavenging parameters (Table 4) for comparisonwith the runswith modified scavenging coefficients. When the scavenging co-efficients are varied some differences between themodel runs withperturbed scavenging parameters and the standard model run canbe seen in the model predicted total deposits (Fig. 8):
� In the model run where in-cloud A has been decreased by afactor of ten (Fig. 8 ICAYB-) there is an increase in the deposits tothe south of Fukushima and these deposits also extend inlandabout 2� to the southwest.
Table 5Description of scavenging parameters used in different NAME runs. Grey areashighlight where the scavenging parameters have been changed relative to thestandard run.
Run ID In-cloud In-cloud Below-cloud Below-cloud
(A) (B) Rain (A) Rain (B)
Standard 3.36E-04 0.79 8.40E-05 0.79ICAYB- 3.36E-05 0.79 8.40E-05 0.79ICA[B- 3.36E-03 0.79 8.40E-05 0.79ICA-BY 3.36E-04 0.59 8.40E-05 0.79ICA-B[ 3.36E-04 0.99 8.40E-05 0.79BCAYB- 3.36E-04 0.79 8.40E-06 0.79BCA[B- 3.36E-04 0.79 8.40E-04 0.79BCA-BY 3.36E-04 0.79 8.40E-05 0.59BCA-B[ 3.36E-04 0.79 8.40E-05 0.99
Please cite this article in press as: Leadbetter, S.J., et al., Sensitivity of thnuclear power plant to the wet deposition parameterisation in NAME10.1016/j.jenvrad.2014.03.018
� In the model run where the in-cloud A parameter has beenincreased by a factor of ten (Fig. 8 ICA[B-) the predicted depositsacross the centre of the Fukushima prefecture are much reducedbecause material is removed from the atmosphere closer toFukushima.
� Changing the in-cloud parameters (Fig. 8 left hand column) hasa greater impact on the spatial pattern of the deposits thanchanging the below-cloud parameters (Fig. 8 right hand col-umn) perhaps because more of the deposition was due to in-cloud processes than below-cloud processes.
The statistical measures described in Section 4.2 were alsoapplied to the runs with different scavenging parameters (Table 6).By rank the best run is the run where the in-cloud B parameter hasbeen increased, i.e., where the deposition due to in-cloud processesis preferentially increased for rainfall greater than 1 mm/h. How-ever, although the run where the in-cloud B parameter has beenincreased has the highest correlationwith the observations, the runwith the lowest fractional bias is the run where the below-cloudrain A parameter has been decreased and the run with the lowestKolmogoroveSmirnov parameter is the run where the in-cloud Aparameter has been increased.
In general the model runs with lower rank (Table 6) showincreased wet deposition (Fig. 8) close to Fukushima Dai-ichi and ina line extending to the southwest of the nuclear power plant, aregion in which observed deposits are relatively low. The exceptionto this is the run where the in-cloud A parameter has beendecreased. This run shows a decrease in wet deposits over a largearea to the south and southwest of Fukushima Dai-ichi. A decreasewhich also results in it being the only model run to have a negativefractional bias. It can also be seen that the model runs which showleast difference in wet deposition from the standard run have thehighest ranks perhaps suggesting that the original choice of pa-rameters is close to optimal for this event.
It should be noted that this part of the study only looks at theimpact of different scavenging parameters on deposition. Anassessment of the impact of radiation on public health relies on anaccurate assessment of both the deposits and the air concentrationof radionuclides. A particular set of scavenging parameters mayprovide the best estimate of deposits but a different set of scav-enging parameters may provide the best estimate of airconcentration.
7. Summary and conclusions
This study examines the wet deposition parameterisation in theUKMet Office’s Lagrangian dispersionmodel NAME. Three differentmeteorological models and one radar rainfall analysis data set areused to drive the dispersion model and to examine the impact ofthe driving meteorology on the deposition of radioactive material.The wet scavenging parameterisation is then examined in moredetail using eight perturbations of the scavenging parameters.
The results are compared to measurements of deposits taken inApril and May 2011. Overall all model runs show reasonableagreement with the measured data and compare favourably withother similar studies (Draxler et al., 2013). A combined statisticalrank is used to compare the model predictions to observations withranks varying between 2.77 and 3.45 (on a scale from 0 to 4). Thecorrelation coefficients calculated as part of this rank range from0.44 to 0.89 (and, with one exception, are all above 0.66). Thecomparisons with observations are sensitive only to those dayswhen winds were easterly, blowing material across Honshu, andwhen precipitation occurred. Combining this sensitivity to easterlywinds and precipitation with the variation in the release rate ofradioactive material implies that material released in the 15-h
e modelled deposition of Caesium-137 from the Fukushima Dai-ichi, Journal of Environmental Radioactivity (2014), http://dx.doi.org/
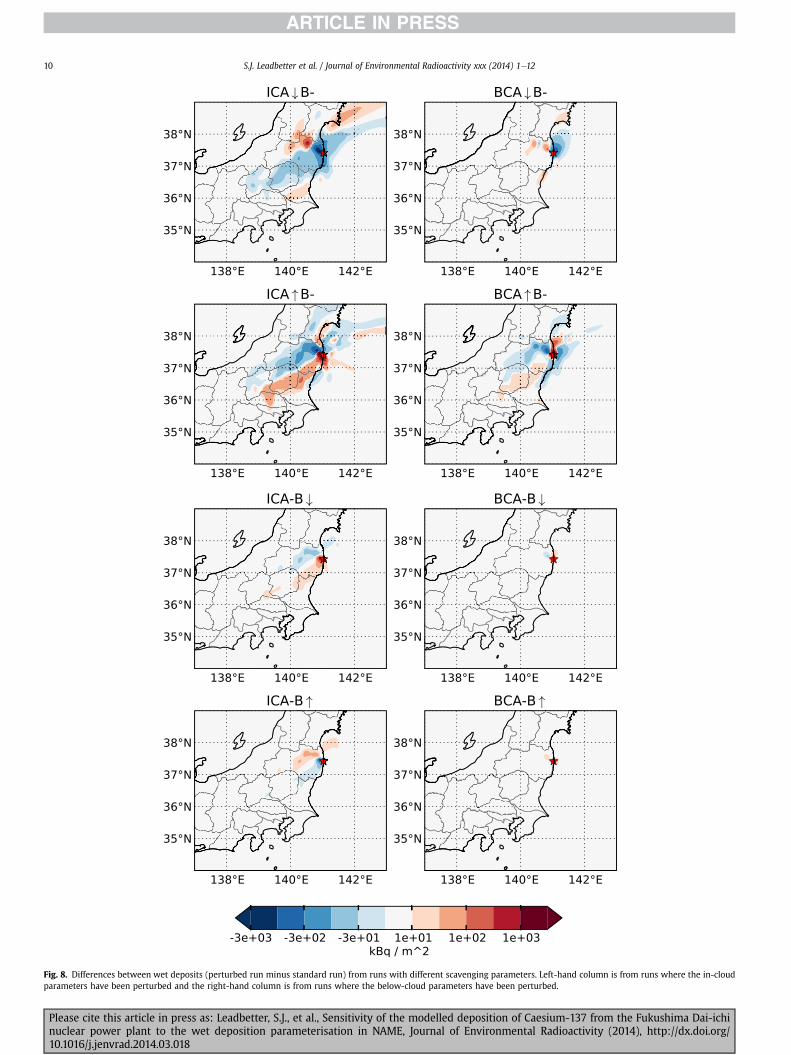
Fig. 8. Differences between wet deposits (perturbed run minus standard run) from runs with different scavenging parameters. Left-hand column is from runs where the in-cloudparameters have been perturbed and the right-hand column is from runs where the below-cloud parameters have been perturbed.
S.J. Leadbetter et al. / Journal of Environmental Radioactivity xxx (2014) 1e1210
Please cite this article in press as: Leadbetter, S.J., et al., Sensitivity of the modelled deposition of Caesium-137 from the Fukushima Dai-ichinuclear power plant to the wet deposition parameterisation in NAME, Journal of Environmental Radioactivity (2014), http://dx.doi.org/10.1016/j.jenvrad.2014.03.018
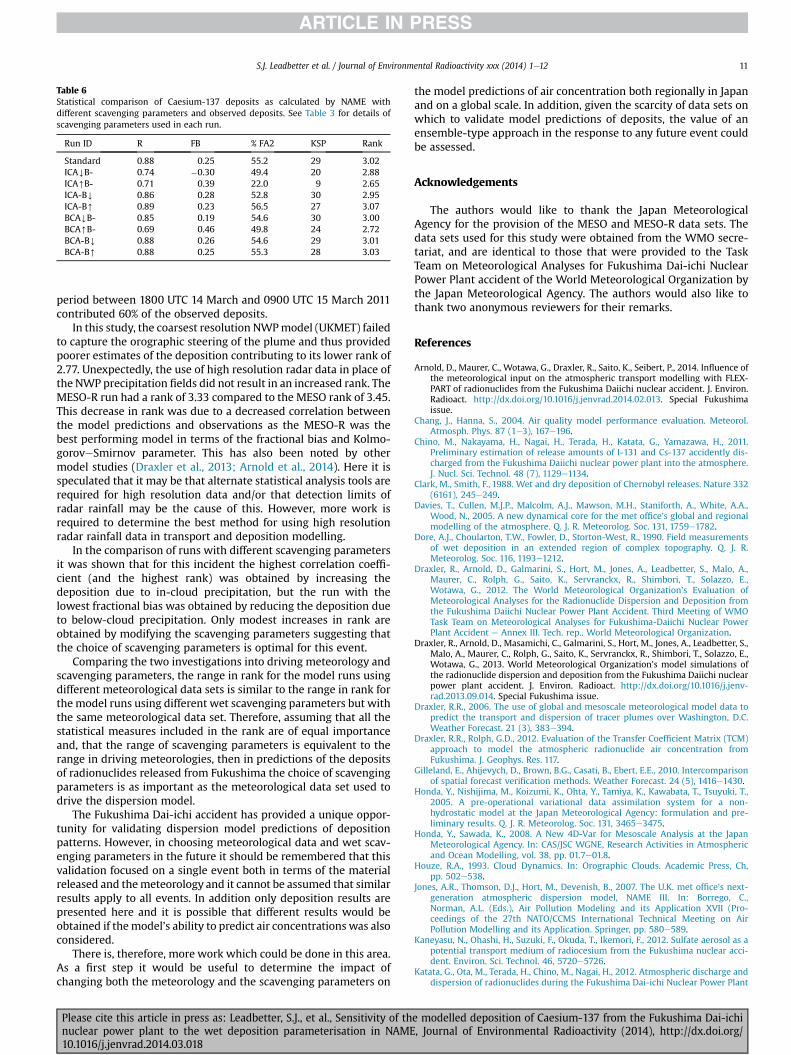
Table 6Statistical comparison of Caesium-137 deposits as calculated by NAME withdifferent scavenging parameters and observed deposits. See Table 3 for details ofscavenging parameters used in each run.
Run ID R FB % FA2 KSP Rank
Standard 0.88 0.25 55.2 29 3.02ICAYB- 0.74 �0.30 49.4 20 2.88ICA[B- 0.71 0.39 22.0 9 2.65ICA-BY 0.86 0.28 52.8 30 2.95ICA-B[ 0.89 0.23 56.5 27 3.07BCAYB- 0.85 0.19 54.6 30 3.00BCA[B- 0.69 0.46 49.8 24 2.72BCA-BY 0.88 0.26 54.6 29 3.01BCA-B[ 0.88 0.25 55.3 28 3.03
S.J. Leadbetter et al. / Journal of Environmental Radioactivity xxx (2014) 1e12 11
period between 1800 UTC 14 March and 0900 UTC 15 March 2011contributed 60% of the observed deposits.
In this study, the coarsest resolution NWPmodel (UKMET) failedto capture the orographic steering of the plume and thus providedpoorer estimates of the deposition contributing to its lower rank of2.77. Unexpectedly, the use of high resolution radar data in place ofthe NWP precipitation fields did not result in an increased rank. TheMESO-R run had a rank of 3.33 compared to the MESO rank of 3.45.This decrease in rank was due to a decreased correlation betweenthe model predictions and observations as the MESO-R was thebest performing model in terms of the fractional bias and Kolmo-goroveSmirnov parameter. This has also been noted by othermodel studies (Draxler et al., 2013; Arnold et al., 2014). Here it isspeculated that it may be that alternate statistical analysis tools arerequired for high resolution data and/or that detection limits ofradar rainfall may be the cause of this. However, more work isrequired to determine the best method for using high resolutionradar rainfall data in transport and deposition modelling.
In the comparison of runs with different scavenging parametersit was shown that for this incident the highest correlation coeffi-cient (and the highest rank) was obtained by increasing thedeposition due to in-cloud precipitation, but the run with thelowest fractional bias was obtained by reducing the deposition dueto below-cloud precipitation. Only modest increases in rank areobtained by modifying the scavenging parameters suggesting thatthe choice of scavenging parameters is optimal for this event.
Comparing the two investigations into driving meteorology andscavenging parameters, the range in rank for the model runs usingdifferent meteorological data sets is similar to the range in rank forthe model runs using different wet scavenging parameters but withthe same meteorological data set. Therefore, assuming that all thestatistical measures included in the rank are of equal importanceand, that the range of scavenging parameters is equivalent to therange in driving meteorologies, then in predictions of the depositsof radionuclides released from Fukushima the choice of scavengingparameters is as important as the meteorological data set used todrive the dispersion model.
The Fukushima Dai-ichi accident has provided a unique oppor-tunity for validating dispersion model predictions of depositionpatterns. However, in choosing meteorological data and wet scav-enging parameters in the future it should be remembered that thisvalidation focused on a single event both in terms of the materialreleased and themeteorology and it cannot be assumed that similarresults apply to all events. In addition only deposition results arepresented here and it is possible that different results would beobtained if themodel’s ability to predict air concentrations was alsoconsidered.
There is, therefore, more work which could be done in this area.As a first step it would be useful to determine the impact ofchanging both the meteorology and the scavenging parameters on
Please cite this article in press as: Leadbetter, S.J., et al., Sensitivity of thnuclear power plant to the wet deposition parameterisation in NAME10.1016/j.jenvrad.2014.03.018
the model predictions of air concentration both regionally in Japanand on a global scale. In addition, given the scarcity of data sets onwhich to validate model predictions of deposits, the value of anensemble-type approach in the response to any future event couldbe assessed.
Acknowledgements
The authors would like to thank the Japan MeteorologicalAgency for the provision of the MESO and MESO-R data sets. Thedata sets used for this study were obtained from the WMO secre-tariat, and are identical to those that were provided to the TaskTeam on Meteorological Analyses for Fukushima Dai-ichi NuclearPower Plant accident of the World Meteorological Organization bythe Japan Meteorological Agency. The authors would also like tothank two anonymous reviewers for their remarks.
References
Arnold, D., Maurer, C., Wotawa, G., Draxler, R., Saito, K., Seibert, P., 2014. Influence ofthe meteorological input on the atmospheric transport modelling with FLEX-PART of radionuclides from the Fukushima Daiichi nuclear accident. J. Environ.Radioact. http://dx.doi.org/10.1016/j.jenvrad.2014.02.013. Special Fukushimaissue.
Chang, J., Hanna, S., 2004. Air quality model performance evaluation. Meteorol.Atmosph. Phys. 87 (1e3), 167e196.
Chino, M., Nakayama, H., Nagai, H., Terada, H., Katata, G., Yamazawa, H., 2011.Preliminary estimation of release amounts of I-131 and Cs-137 accidently dis-charged from the Fukushima Daiichi nuclear power plant into the atmosphere.J. Nucl. Sci. Technol. 48 (7), 1129e1134.
Clark, M., Smith, F., 1988. Wet and dry deposition of Chernobyl releases. Nature 332(6161), 245e249.
Davies, T., Cullen, M.J.P., Malcolm, A.J., Mawson, M.H., Staniforth, A., White, A.A.,Wood, N., 2005. A new dynamical core for the met office’s global and regionalmodelling of the atmosphere. Q. J. R. Meteorolog. Soc. 131, 1759e1782.
Dore, A.J., Choularton, T.W., Fowler, D., Storton-West, R., 1990. Field measurementsof wet deposition in an extended region of complex topography. Q. J. R.Meteorolog. Soc. 116, 1193e1212.
Draxler, R., Arnold, D., Galmarini, S., Hort, M., Jones, A., Leadbetter, S., Malo, A.,Maurer, C., Rolph, G., Saito, K., Servranckx, R., Shimbori, T., Solazzo, E.,Wotawa, G., 2012. The World Meteorological Organization’s Evaluation ofMeteorological Analyses for the Radionuclide Dispersion and Deposition fromthe Fukushima Daiichi Nuclear Power Plant Accident. Third Meeting of WMOTask Team on Meteorological Analyses for Fukushima-Daiichi Nuclear PowerPlant Accident e Annex III. Tech. rep.. World Meteorological Organization.
Draxler, R., Arnold, D., Masamichi, C., Galmarini, S., Hort, M., Jones, A., Leadbetter, S.,Malo, A., Maurer, C., Rolph, G., Saito, K., Servranckx, R., Shimbori, T., Solazzo, E.,Wotawa, G., 2013. World Meteorological Organization’s model simulations ofthe radionuclide dispersion and deposition from the Fukushima Daiichi nuclearpower plant accident. J. Environ. Radioact. http://dx.doi.org/10.1016/j.jenv-rad.2013.09.014. Special Fukushima issue.
Draxler, R.R., 2006. The use of global and mesoscale meteorological model data topredict the transport and dispersion of tracer plumes over Washington, D.C.Weather Forecast. 21 (3), 383e394.
Draxler, R.R., Rolph, G.D., 2012. Evaluation of the Transfer Coefficient Matrix (TCM)approach to model the atmospheric radionuclide air concentration fromFukushima. J. Geophys. Res. 117.
Gilleland, E., Ahijevych, D., Brown, B.G., Casati, B., Ebert, E.E., 2010. Intercomparisonof spatial forecast verification methods. Weather Forecast. 24 (5), 1416e1430.
Honda, Y., Nishijima, M., Koizumi, K., Ohta, Y., Tamiya, K., Kawabata, T., Tsuyuki, T.,2005. A pre-operational variational data assimilation system for a non-hydrostatic model at the Japan Meteorological Agency: formulation and pre-liminary results. Q. J. R. Meteorolog. Soc. 131, 3465e3475.
Honda, Y., Sawada, K., 2008. A New 4D-Var for Mesoscale Analysis at the JapanMeteorological Agency. In: CAS/JSC WGNE, Research Activities in Atmosphericand Ocean Modelling, vol. 38, pp. 01.7e01.8.
Houze, R.A., 1993. Cloud Dynamics. In: Orographic Clouds. Academic Press, Ch,pp. 502e538.
Jones, A.R., Thomson, D.J., Hort, M., Devenish, B., 2007. The U.K. met office’s next-generation atmospheric dispersion model, NAME III. In: Borrego, C.,Norman, A.L. (Eds.), Air Pollution Modeling and its Application XVII (Pro-ceedings of the 27th NATO/CCMS International Technical Meeting on AirPollution Modelling and its Application. Springer, pp. 580e589.
Kaneyasu, N., Ohashi, H., Suzuki, F., Okuda, T., Ikemori, F., 2012. Sulfate aerosol as apotential transport medium of radiocesium from the Fukushima nuclear acci-dent. Environ. Sci. Technol. 46, 5720e5726.
Katata, G., Ota, M., Terada, H., Chino, M., Nagai, H., 2012. Atmospheric discharge anddispersion of radionuclides during the Fukushima Dai-ichi Nuclear Power Plant
e modelled deposition of Caesium-137 from the Fukushima Dai-ichi, Journal of Environmental Radioactivity (2014), http://dx.doi.org/

S.J. Leadbetter et al. / Journal of Environmental Radioactivity xxx (2014) 1e1212
accident. Part I: source term estimation and local-scale atmospheric dispersionin early phase of the accident. J. Environ. Radioact. 109, 103e113.
Kinoshita, N., Sueki, K., Sas, K., Kitagawa, J., Ikarashi, S., Nishimura, T., Wong, Y.-S.,Satou, Y., Handa, K., Takahashi, T., Sato, M., Yamagata, T., 2011. Assessment ofindividual radionuclide distributions from the Fukushima nuclear accidentcovering central-east Japan. Proc. Natl. Acad. Sci. 108 (49), 19526e19529.
Knutson, E.O., Sood, S.K., Stockham, J.D., 1976. Aerosol collection by snow and icecrystals. Atmosph. Environ. 10, 395e402.
Knutson, E.O., Stockham, J.D., 1977. Aerosol scavenging by snow: comparison ofsingle-flake and entire-snowfall results. In: Precipitation scavenging (1974).Proceedings of a Symposium Held at Champaign, Illinois October 14-18 1974.Oak Ridge, Tenn., Springfield, Va, pp. 195e206. Available from National Tech-nical Information Service, U.S. Dept. of Commerce.
Kobayashi, T., Nagai, H., Chino, M., Kawamura, H., 2013. Source term estimation ofatmospheric release due to the Fukushima Dai-ichi Nuclear Power Plant acci-dent by atmospheric and oceanic dispersion simulations. J. Nucl. Sci. Technol. 50(3), 255e264.
Korsakissok, I., Mathieu, A., Didier, D., 2013. Atmospheric dispersion and grounddeposition induced by the Fukushima Nuclear Power Plant accident: a local-scale simulation and sensitivity study. Atmosph. Environ. 70, 267e279.
Mahfouf, J.-F., Rabier, F., 2000. The ECMWF operational implementation of four-dimensional variational assimilation. II: experimental results with improvedphysics. Q. J. R. Meteorolog. Soc. 126, 1171e1190.
Maryon, R.H., Ryall, D.B., Malcolm, A.L., 1999. The NAME 4 Dispersion Model: Sci-ence Documentation. Tech. Rep.. UK Meterological Office. Turbulence andDiffusion Note No. 262.
MEXT, 2011. Monitoring Information of Environmental Radioactivity Level. http://radioactivity.nsr.go.jp/en/.
Morino, Y., Ohara, T., Nishizawa, M., 2011. Atmospheric behavior, deposition, andbudget of radioactive materials from the Fukushima Daiichi nuclear powerplant in March 2011. Geophys. Res. Lett. 38.
Mosca, S., Graziani, G., Klug, W., Bellasio, R., Bianconi, R., 1998. A statistical meth-odology for the evaluation of long-range dispersion models: an application tothe ETEX exercise. Atmosph. Environ. 32, 4307e4324.
Nagata, K., 2012. Quantitative Precipitation Estimation and Quantitative Precipita-tion Forecasting by the Japan Meteorological Agency. RSMC Tokyo TyphoonCenter Technical Review (13), 3750. http://www.jma.go.jp/jma/jma-eng/jma-center/rsmc-hp-pub-eg/techrev/text13-2.pdf.
Rabier, F., Järvinen, H., Klinker, E., Mahfouf, J.F., Simmons, A., 2000. The ECMWFoperational implementation of four-dimensional variational assimilation. I:experimental results with simplified physics. Q. J. R. Meteorolog. Soc. 126,1143e1170.
Please cite this article in press as: Leadbetter, S.J., et al., Sensitivity of thnuclear power plant to the wet deposition parameterisation in NAME10.1016/j.jenvrad.2014.03.018
Saito, K., 2012. Atmospheric Model Applications. InTech, Ch. The JMA Non-hydrostatic Model and its Applications to Operation and Research, p. 85110.
Saito, K., Shimbori, T., Draxler, R., 2014. JMA’s regional atmospheric transport modelcalculations for the WMO technical task team on meteorological analyses forFukushima Daiichi Nuclear Power Plant accident. J. Environ. Radioact. http://dx.doi.org/10.1016/j.jenvrad.2014.02.007. Special Fukushima issue.
Simmons, A.J., Burridge, D.M., Jarraud, M., Girard, C., Wergen, W., 1989. The ECMWFmedium-range prediction models: development of the numerical formulationsand the impact of increased resolution. Meteorol. Atmosph. Phys. 40, 28e60.
Sportisse, B., 2007. A review of parameterizations for modelling dry deposition andscavenging of radionuclides. Atmosph. Environ. 41 (13), 2683e2698.
Srinivas, C.V., Venkatesan, R., Baskaran, R., Rajagopal, V., Venkatraman, B., 2012.Regional scale atmospheric dispersion simulation of accidental releases of ra-dionuclides from Fukushima Dai-ichi reactor. Atmosph. Environ. 61, 66e84.
Stohl, A., Seibert, P., Wotawa, G., Arnold, D., Burkhart, J.F., Eckhardt, S., Tapia, C.,Vargas, A., Yasunari, T.J., 2012. Xenon-133 and caesium-137 releases into theatmosphere from the Fukushima Dai-ichi nuclear power plant: determinationof the source term, atmospheric dispersion, and deposition. Atmosph. Chem.Phys. 12 (5), 2313e2343.
Terada, H., Katata, G., Chino, M., Nagai, H., Oct 2012. Atmospheric discharge anddispersion of radionuclides during the Fukushima Dai-ichi Nuclear Power Plantaccident. Part II: verification of the source term and analysis of regional-scaleatmospheric dispersion. J. Environ. Radioact. 112, 141e154.
Torii, T., Sugita, T., Okada, C.E., Reed, M.S., Blumenthal, D.J., 2013. Enhanced analysismethods to derive the spatial distribution of 131I deposition on the ground byairborne surveys at an early stage after the Fukushima Daiichi nuclear powerplant accident. Health Phys. 105 (2), 192e200.
USDOE, 2011. United States Department of Energy NNSA Response to 2011Fukushima Incident. https://explore.data.gov/Geography-and-Environment/US-DOE-NNSA-Response-to-2011-Fukushima-Incident-Ra/prrn-6s35.
Van Dop, H., Addis, R., Fraser, G., Girardi, F., Graziani, G., Inoue, Y., Kelly, N., Klug, W.,Kulmala, A., Nodop, K., Pretel, J., 1998. ETEX: a European tracer experiment;observations, dispersion modelling and emergency response. Atmosph. Envi-ron. 32 (24), 4089e4094.
Webster, H., Thomson, D., 2002. Validation of a Lagrangian model plume risescheme using the Kincaid data set. Atmosph. Environ. 36 (32), 5031e5042.
Webster, H.N., Thomson, D.J., 2011. Dry deposition modelling in a Lagrangiandispersion model. Int. J. Environ. Pollut. 47 (1e4, SI), 1e9.
Webster, H.N., Thomson, D.J., 2014. The NAME Wet Deposition Scheme. Tech. rep.,Met Office, Forecasting Research Division Technical Report No. 584.
e modelled deposition of Caesium-137 from the Fukushima Dai-ichi, Journal of Environmental Radioactivity (2014), http://dx.doi.org/