sensing strain and damage in polyurethane-mwcnt …. introduction the addition of carbon...
TRANSCRIPT

1. IntroductionThe addition of carbon nano-fillers (nanofibers(CNF), nanotubes (CNT) etc.) into plastics has beenshown to affect the various properties of the result-ing material and effectively increase the electricalconductivity of the system by several orders ofmagnitude [1]. This is attributed to the formation ofa conductive network of the conductive nano-fillers, which can be described as a percolated net-work. The increased electrical conductivity of thenano-reinforced materials has given rise to their usein various applications [2].Polymeric foams (e.g. Rigid PolyUrethane (PUR))represent a very interesting and useful sub-group,
finding vast range of applications due to their versa-tility. In structural applications, they are commonlyused due to the weight saving capabilities they canoffer in the design (e.g. as sandwich cores).Combining nano-fillers with foam materials, nano-reinforcement of foams has been developed andstudied the past decade, but mainly focused on themechanical and thermal properties. Electrical con-ductivity of nano-composite foams is much lessstudied. Works on the electrical properties of nano-reinforced polymeric foams are rather sporadic [3–10]. The relationship between the resulting electri-cal conductivity and the density of the rigid foamsfor given CNT concentrations was reported in [6]but only recently described further [10].
40
Sensing strain and damage in polyurethane-MWCNTnano-composite foams using electrical measurementsA. Baltopoulos, N. Athanasopoulos, I. Fotiou, A. Vavouliotis, V. Kostopoulos*
Applied Mechanics Laboratory, Department of Mechanical Engineering and Aeronautics, University of Patras,GR 265 04, Rio – Patras, Greece
Received 30 May 2012; accepted in revised form 19 August 2012
Abstract. This work deals with the damage identification in polymeric foams through the monitoring of the electricalresistance of the system. To assess this idea electrically conductive rigid Poly-Urethane (PUR) foams at various densitieswere prepared. Multi-Wall Carbon Nanotubes (MWCNT) were dispersed in the host polymer at various concentrationsthrough high shear mixing to provide electrical conductivity to the system. The PUR/MWCNT foams exhibited varyingelectrical conductivity on a wide range of densities and nano-filler contents. The prepared foams were subject to compres-sion tests. Electrical resistance was recorded online during the tests to monitor the change of the bulk property of the mate-rials. A structural-electrical cross-property relation was exhibited. The distinctive phases of foam compression weresuccessfully identified from the electrical resistance profile recorded during the tests. A characteristic master curve of thechange of electrical resistivity with respect to load and damage is proposed and analyzed. It was shown that the found elec-trical resistance profile is a characteristic of all the MWCNT contents and depends on density and conductivity. MWCNTcontent contributes mainly to the sensitivity of electrical sensing in the initial stage of compression. Later compressionstages are dominated by foam microstructural damage which mask any effect of CNT dispersion. Micro-structural observa-tions were employed to verify the experimental findings and curves.
Keywords: smart polymers, nano-composite foams, electrical conductivity, damage mechanism sensing
eXPRESS Polymer Letters Vol.7, No.1 (2013) 40–54Available online at www.expresspolymlett.comDOI: 10.3144/expresspolymlett.2013.4
*Corresponding author, e-mail: [email protected]© BME-PT

The advantage electrical properties can offer is thecapability to utilize self-sensing concepts for moni-toring strain and/or damage [11]. Electrical resist-ance change method has been successfully employedas a health monitoring technique to follow strainand internal damages evolution in composite mate-rials. It has successfully been applied on nano-com-posite polymers [12–15], on carbon fibre reinforcedplastics (CFRP) [16–20] and in glass fibre rein-forced plastics (GFRP) with conductive additives toincrease matrix electrical conductivity (e.g. carbonnanotubes [21–23]). Attempts to model the electri-cal sensing and piezo-resistive response of thematerials have also been reported [12, 13, 15, 24].Even for Silicone-Carbide based ceramic matrixcomposites online monitoring of damage accumula-tion was achieved by measuring electrical proper-ties [25]. Furthermore, cross-property relationsbetween electric and elastic properties for metalfoams have been developed in [26] for direct defini-tion of elastic properties from electrical measure-ments.The use of the electric field has been proposed anddemonstrated to perform very well in defining vari-ous other properties. For example, electrical meas-urements have been used to monitor the foamingprocess and polymerization of polymeric foams[27] while dielectric measurements have been usedfor measuring the density of polymer foams [28].Brady et al. [29] developed electrically conductivepoly-pyrrole coated PUR foam. The conductance ofthe foam was found to change linearly with the com-pressive load applied; single and repeated. For alu-minium foams, Kim et al. [30] developed a set ofmathematical relationships based on experimentaldata to obtain mechanical properties (elastic modu-lus, compressive strength, densification strain) usingelectrical conductivity as a Non-Destructive Inspec-tion method.Xiang et al. [9] developed electrically conductivePUR foams (1!wt% CNT content and densitybetween 200–550 kg/m3) and studied the tempera-ture dependence of the electrical resistivity of thefoam, ultimately utilizing this dependence for sens-ing. They showed that the foams exhibited a consis-tent and repeatable negative temperature coefficientof resistivity. The reduction of the cell walls’ thick-ness causes the decrease in the distance betweenadjacent CNTs. The authors noted that the nearerand straighter CNTs, accordingly, create more
effective conductive paths within the matrix, whichreadily permit charge to transport, resulting in thedecrease in the volume resistivity.Based on the available literature, it is made obviousthat potential synergies between electrical proper-ties and nano-composite foams remain rather unex-plored. In this work, we investigate the use of elec-trical measurements for strain sensing and eventu-ally damage monitoring in nano-composite foams.For this purpose, PUR foams having different Multi-Wall CNT (MWCNT) concentrations and differentdensities were developed. The developed three-phase material (polymer, MWCNT and CO2) exhib-ited varying electrical properties with respect to themicrostructure variables. The DC electrical conduc-tivity of the various foams was studied under quasi-static compression loading. Continuous electricalrecordings during the compression tests were inves-tigated and compared against the stress state of thematerial. The deformation and damage evolution infoamed polymers from a micro-structural point ofview was studied in comparison to the recordedelectrical measurements. Identifying the loadingand damage state of the foam with the proposedmethod could provide a novel tool for strain anddamage monitoring of foams in composite struc-tures.
2. Materials and experimental setup2.1. Materials and manufacturingA two-component PUR system from R&G Faser-verbundverkstoffe GmbH (Waldenbuch, Germany)was used in this study as the polymer host matrix.The A component of the system is the polyol mix-ture (under the commercial name of Rigid PURfoam, Product code: 170090). The B component is a4,4"-diphenylmethane diisocyanate mixture (underthe commercial name PUR Hardener 1000, Productcode: 170105-2011) suitable for the production ofpolyurethane foam. Foaming of the material isachieved by the CO2 gas product of the chemicalreaction. The bulk polymer density is ~1200 kg/m3.MWCNT produced by catalyzed CVD were sup-plied by Arkema (France). According to the manu-facturer, their diameters were 10–15 nm and theywere more than 500 nm long, resulting in an aspectratio (AR) in the range of 35–50. Previous studies[19, 31, 32] utilizing the same batch of CNTs showedgood mechanical and electrical results for polymercomposites. Therefore the same procedure was fol-
Baltopoulos et al. – eXPRESS Polymer Letters Vol.7, No.1 (2013) 40–54
41
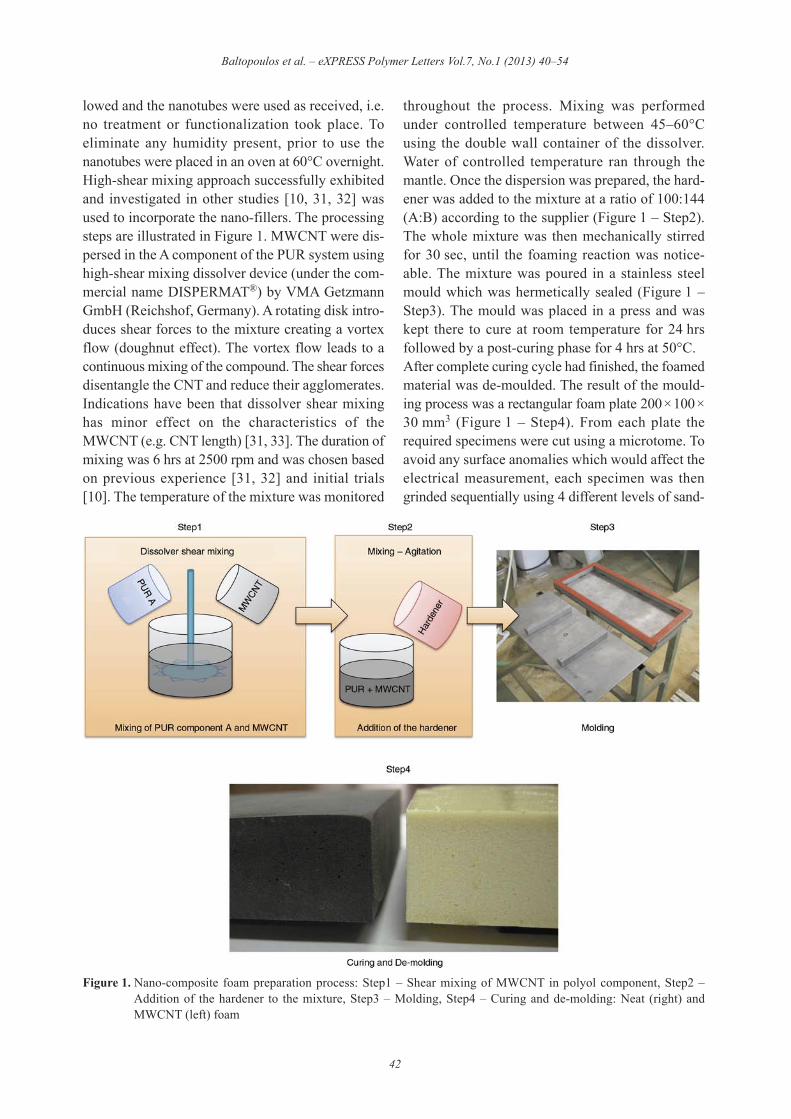
lowed and the nanotubes were used as received, i.e.no treatment or functionalization took place. Toeliminate any humidity present, prior to use thenanotubes were placed in an oven at 60°C overnight.High-shear mixing approach successfully exhibitedand investigated in other studies [10, 31, 32] wasused to incorporate the nano-fillers. The processingsteps are illustrated in Figure 1. MWCNT were dis-persed in the A component of the PUR system usinghigh-shear mixing dissolver device (under the com-mercial name DISPERMAT®) by VMA GetzmannGmbH (Reichshof, Germany). A rotating disk intro-duces shear forces to the mixture creating a vortexflow (doughnut effect). The vortex flow leads to acontinuous mixing of the compound. The shear forcesdisentangle the CNT and reduce their agglomerates.Indications have been that dissolver shear mixinghas minor effect on the characteristics of theMWCNT (e.g. CNT length) [31, 33]. The duration ofmixing was 6 hrs at 2500 rpm and was chosen basedon previous experience [31, 32] and initial trials[10]. The temperature of the mixture was monitored
throughout the process. Mixing was performedunder controlled temperature between 45–60°Cusing the double wall container of the dissolver.Water of controlled temperature ran through themantle. Once the dispersion was prepared, the hard-ener was added to the mixture at a ratio of 100:144(A:B) according to the supplier (Figure 1 – Step2).The whole mixture was then mechanically stirredfor 30 sec, until the foaming reaction was notice-able. The mixture was poured in a stainless steelmould which was hermetically sealed (Figure 1 –Step3). The mould was placed in a press and waskept there to cure at room temperature for 24 hrsfollowed by a post-curing phase for 4 hrs at 50°C.After complete curing cycle had finished, the foamedmaterial was de-moulded. The result of the mould-ing process was a rectangular foam plate 200#$100#$30 mm3 (Figure 1 – Step4). From each plate therequired specimens were cut using a microtome. Toavoid any surface anomalies which would affect theelectrical measurement, each specimen was thengrinded sequentially using 4 different levels of sand-
Baltopoulos et al. – eXPRESS Polymer Letters Vol.7, No.1 (2013) 40–54
42
Figure 1. Nano-composite foam preparation process: Step1 – Shear mixing of MWCNT in polyol component, Step2 –Addition of the hardener to the mixture, Step3 – Molding, Step4 – Curing and de-molding: Neat (right) andMWCNT (left) foam
paper (500, 1000, 2000 and 4000) on all sides. Afterthis, the density of each specimen was calculated bymeasuring the dimensions and the weight of eachspecimen. In principle, two foam density rangeswere targeted; 250–300 kg/m3 (20–25% relativedensity) and 350–400 kg/m3 (30–35% relative den-sity). Nevertheless, foams having various differentdensities were produced. For convenience, the firstgroup of densities will be referred to as Light Foam,while the second one as Dense Foam.Two MWCNT concentrations per weight were cho-sen to be studied; 3% and 5%. For the higher den-sity, 2!wt% MWCNT was also investigated. Thesevalues correspond to the weight percentage of theCNT to the polymer and CNT mixture. The materi-als developed and studied in this work are summa-rized in Table 1.
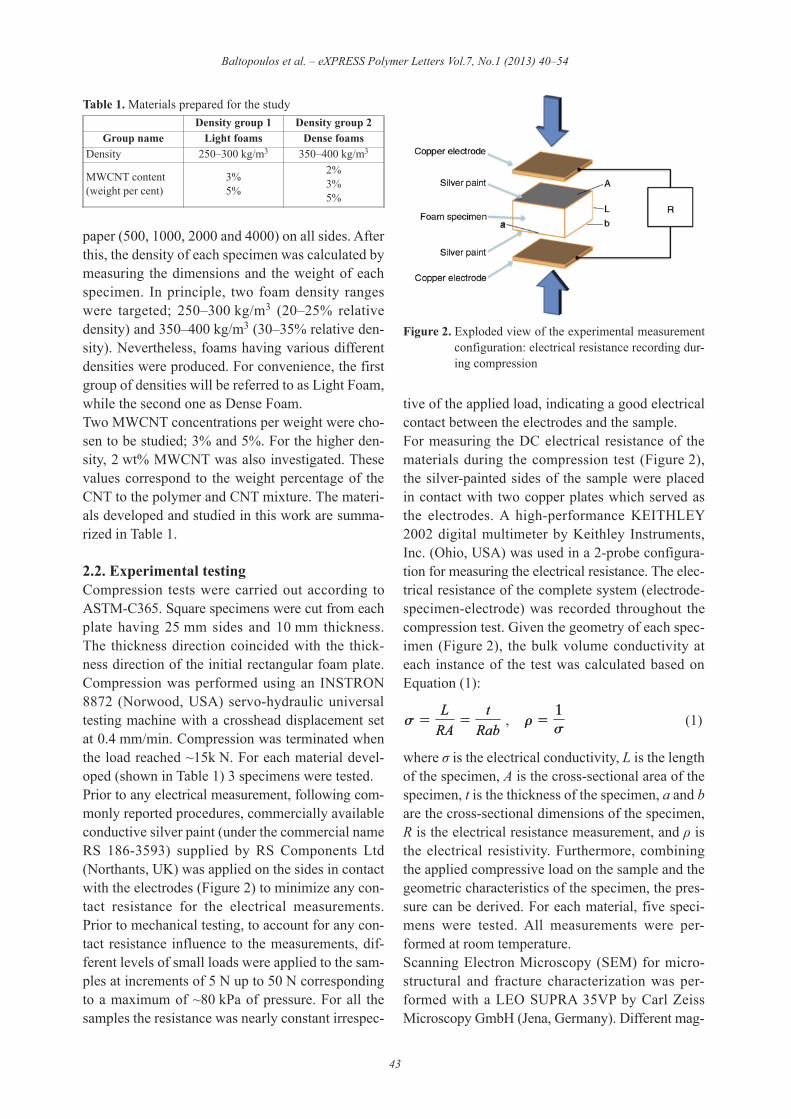
2.2. Experimental testingCompression tests were carried out according toASTM-C365. Square specimens were cut from eachplate having 25 mm sides and 10 mm thickness.The thickness direction coincided with the thick-ness direction of the initial rectangular foam plate.Compression was performed using an INSTRON8872 (Norwood, USA) servo-hydraulic universaltesting machine with a crosshead displacement setat 0.4 mm/min. Compression was terminated whenthe load reached ~15k N. For each material devel-oped (shown in Table 1) 3 specimens were tested.Prior to any electrical measurement, following com-monly reported procedures, commercially availableconductive silver paint (under the commercial nameRS 186-3593) supplied by RS Components Ltd(Northants, UK) was applied on the sides in contactwith the electrodes (Figure 2) to minimize any con-tact resistance for the electrical measurements.Prior to mechanical testing, to account for any con-tact resistance influence to the measurements, dif-ferent levels of small loads were applied to the sam-ples at increments of 5 N up to 50 N correspondingto a maximum of ~80 kPa of pressure. For all thesamples the resistance was nearly constant irrespec-
tive of the applied load, indicating a good electricalcontact between the electrodes and the sample.For measuring the DC electrical resistance of thematerials during the compression test (Figure 2),the silver-painted sides of the sample were placedin contact with two copper plates which served asthe electrodes. A high-performance KEITHLEY2002 digital multimeter by Keithley Instruments,Inc. (Ohio, USA) was used in a 2-probe configura-tion for measuring the electrical resistance. The elec-trical resistance of the complete system (electrode-specimen-electrode) was recorded throughout thecompression test. Given the geometry of each spec-imen (Figure 2), the bulk volume conductivity ateach instance of the test was calculated based onEquation (1):
, (1)
where ! is the electrical conductivity, L is the lengthof the specimen, A is the cross-sectional area of thespecimen, t is the thickness of the specimen, a and bare the cross-sectional dimensions of the specimen,R is the electrical resistance measurement, and " isthe electrical resistivity. Furthermore, combiningthe applied compressive load on the sample and thegeometric characteristics of the specimen, the pres-sure can be derived. For each material, five speci-mens were tested. All measurements were per-formed at room temperature.Scanning Electron Microscopy (SEM) for micro-structural and fracture characterization was per-formed with a LEO SUPRA 35VP by Carl ZeissMicroscopy GmbH (Jena, Germany). Different mag-
r 51s
s 5L
RA5
tRab
s 5L
RA5
tRab
r 51s
Baltopoulos et al. – eXPRESS Polymer Letters Vol.7, No.1 (2013) 40–54
43
Table 1. Materials prepared for the studyDensity group 1 Density group 2
Group name Light foams Dense foamsDensity 250–300 kg/m3 350–400 kg/m3
MWCNT content(weight per cent)
3%5%
2%3%5%
Figure 2. Exploded view of the experimental measurementconfiguration: electrical resistance recording dur-ing compression
nification levels were employed to evaluate differ-ent aspects of the materials. Low magnification wasused to assess the microstructure of the foam aswell as to verify the damaged microstructure afterthe test. Higher magnification of fractured surfaceswas used to evaluate the dispersion of the CNT aswell as to capture indications on the wall thicknessof the microstructure.
3. Results and discussion3.1. Preparation and cellular structureThe effective dispersion of CNT in polymers, as aresearch field, has attracted considerable attentiondue to the challenge to disentangle the agglomer-ates of CNT and create a homogeneous distributionthroughout the host matrix. For the development ofelectrically conductive foams this process is also avery important step. The high shear mixing processused in this work has been shown to produce goodresults in dispersing the nano-fillers and developingelectrically conductive polymers. At the levels of
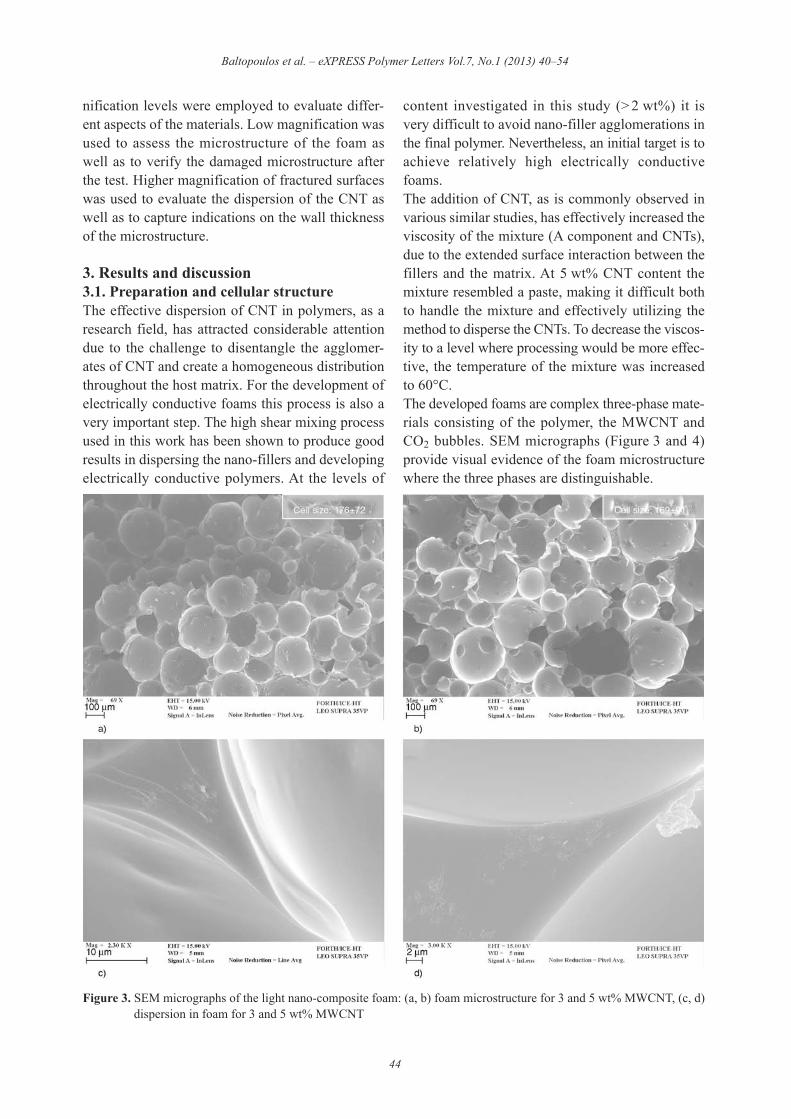
content investigated in this study (> 2!wt%) it isvery difficult to avoid nano-filler agglomerations inthe final polymer. Nevertheless, an initial target is toachieve relatively high electrically conductivefoams.The addition of CNT, as is commonly observed invarious similar studies, has effectively increased theviscosity of the mixture (A component and CNTs),due to the extended surface interaction between thefillers and the matrix. At 5!wt% CNT content themixture resembled a paste, making it difficult bothto handle the mixture and effectively utilizing themethod to disperse the CNTs. To decrease the viscos-ity to a level where processing would be more effec-tive, the temperature of the mixture was increasedto 60°C.The developed foams are complex three-phase mate-rials consisting of the polymer, the MWCNT andCO2 bubbles. SEM micrographs (Figure 3 and 4)provide visual evidence of the foam microstructurewhere the three phases are distinguishable.
Baltopoulos et al. – eXPRESS Polymer Letters Vol.7, No.1 (2013) 40–54
44
Figure 3. SEM micrographs of the light nano-composite foam: (a, b) foam microstructure for 3 and 5 wt% MWCNT, (c, d)dispersion in foam for 3 and 5 wt% MWCNT

The effect of CNT on PUR foams in terms of pro-cessing and final microstructure has been investi-gated in a number of studies [8, 10, 34, 35]. The indi-cations are that the effect of CNT on the finalmicrostructure is moderate and CNT do not con-tribute a heterogeneous nucleation factor that canchange the microstructure. In this study, SEM char-acterization performed on the developed materials
confirms these reports. The microstructure of thefoams can be seen in Figure 3a, 3b and Figure 4a–4ctogether with the elaborated values for the averagecell size. The observation reveals that the additionof CNT in the mixture has practically a minor effecton the cell size for foams with similar density. Thedeviation of the cell size seems to increase with theaddition of CNT.
Baltopoulos et al. – eXPRESS Polymer Letters Vol.7, No.1 (2013) 40–54
45
Figure 4. SEM micrographs of the dense nano-composite foam microstructure: (a–c) foam microstructure for 2, 3 and 5wt% MWCNT, (d–f) dispersion in foam for 2, 3 and 5!wt% MWCNT

Figure 3c, 3d and Figure 4d–4f present a series ofSEM micrographs focused on the strut-to-wall tran-sition area for the different developed materials.These images provide a means to assess the achieveddispersion of CNT within the polymer. It is evidentthat agglomerations are present in all the cases,which is expected considering the high level ofMWCNT in the polymer. In between the agglomer-ations individually dispersed CNT are also seen.Groups of bundled CNT form spherical structureswhich have a diameter in the range of 2 µm. For thedense foams of 5!wt% CNT, concentrated agglom-erations are witnessed (Figure 4f). In the case of thelight foams the thinning of the cell walls is obviousas well as the arrangement of CNT in the transitionzone. CNT, either in small agglomerations or indi-vidual, are seen at the tip of the cell wall which hasa thickness less than 2 µm (Figure 3d). Similar indi-cations are available for the dense foams, where anetwork of CNT is seen in the cell wall region (Fig-ure 4d).Despite the agglomerated state of CNT whichdecreases the effectiveness of nano-reinforcement,a conductive distribution of the CNT is achievedand has been verified by the measured electricalconductivity. The dependence of the electrical con-ductivity on the foaming process, the achievedmicro-structure, the MWCNT content and the rela-tive foam density has been described in [10] and isnot discussed further here.
3.2. Evolution of apparent electricalproperties during mechanical compression
As a first indication of the electrical response of thefoams to mechanical load, the recorded bulk electri-cal resistance values during quasi-static compres-sive loading are presented in Figures 5 and 6 for the
light and dense foam groups respectively. The meas-urements were performed in the through thicknessdirection as shown in Figure 2. The change of elec-trical resistance during loading is evident for allmaterial groups. A general agreement between thespecimens with the same physical characteristics isnoted. Consistent patterns are exhibited by speci-mens within the same group. Furthermore the pat-terns present similarities among the same densitygroups. Repeatability of the measurements was ver-ified for each sample prior to the test for the elasticregion of the compression curve (strain < 5%), byrepeated loading-unloading.For the light foams (Figure 5), the electrical resist-ance (R) pattern during loading exhibits a consistentbehaviour for both nano-filler contents. The responsegives repeatable results for all the specimens withinthe same group. Minor differences within the samegroup are noticed in the initial part of the curve, butdo not change the whole pattern. All electricalresistance curves start with an abrupt linear drop,reaching local minimum around 400–500 N of load.Further increase of the load, leads to an increase inR until a local maximum is reached between 2–3 kNof applied load. Increasing the applied load further,the resistance R decreases monotonically until 15 kN,where the experiment was stopped. At this finalphase the decreasing trend was almost linear. Theinitial values of the curves are all at the same rangefor both sets of nano-filler contents; 60–90 k% for3 wt% MWCNT and 0.6–1.6 k% for the 5!wt%MWCNT. This difference between the two groupswas expected due to the increase in the nano-fillercontent as verified in [10].Figure 6 presents the recorded values for the densefoam group. The pattern for the dense foams is sim-ilar for the two lower nano-filler contents. For the
Baltopoulos et al. – eXPRESS Polymer Letters Vol.7, No.1 (2013) 40–54
46
Figure 5. Electrical resistance Vs. compressive load: light foams (a) 3!wt%, (b) 5!wt% MWCNT

highest content a different response is observed. AllMWCNT contents exhibit an initial drop in the
measured resistance, up to between 200–400 N ofapplied load. For the low MWCNT contents, anincrease in the applied load further from 500 Nresults in a short plateau for the resistance R; up till3 kN for 2% and 4 kN for 3%. Continuing further toincrease the load, an asymptotic decrease up to afinal resistance value is exhibited until the loadreaches 15 kN. For the 5!wt% MWCNT concentra-tion, a clear intermediate plateau is not revealed.Rather a local minimum is shown, followed by anasymptotic increase in the final part of the curve.Again, the recorded response curves exhibit highrepeatability among the specimens, with only minordifferences in the response.To better reveal the information within the electri-cal response it is useful and commonly employed toexpress the normalized relative values of resistance.These are presented in Figure 7 together with thestress values against derived strain, for the two den-sity groups. The values to prepare these figures werecalculated based on the recordings of the experi-ment, as opposed to Figure 5 and 6 where the rawdata are reported.From the mechanical point of view, the elaboratedstress-strain curves follow the extensively docu-mented behaviour of cellular solids; an initial linearincrease in stress followed by an elasto-plasticyielding (called plateau region) and reaching thedensification region where stress increases rapidly.It can be noted that the stress-strain curves of thenano-composite foams deviate slightly from the‘nominal’ description in that the linear and plateauregions are not clearly distinct. Instead, in this regionthe materials show an increasing linear behaviour,which is a common observation among polymerfoams [36] and indicates plastic yielding earlierthan usual. Nevertheless, the difference in the slopeof the two phases is noticeable.
Baltopoulos et al. – eXPRESS Polymer Letters Vol.7, No.1 (2013) 40–54
47
Figure 6. Electrical resistance Vs. compressive load: densefoams (a) 2!wt%, (b) 3!wt%, (c) 5!wt% MWCNT
Figure 7. Stress and relative electrical resistance change (&R/R0) Vs. strain (a) light foams, (b) dense foams

From the perspective Figure 7 offers, the electricalresponse is more informative and the relationbetween the mechanical and electrical behaviour isbecoming more evident. The effect of CNT on themechanical behaviour of the foams is also visible inthe same diagram, which can directly be taken intoaccount in the electrical response evaluation.For the light foams, starting from non-strainedfoams, &R/R0 increases linearly up to nearly 5%strain and forms a peak extending between 6–8% ofstrain. As strain increases corresponding to a lin-early increasing load, &R/R0 decreases linearly until30–40% strain. At this point an extended local min-imum is reached and any further increase in strain isfollowed by an increase in &R/R0. The unstableresponse for the 3% CNT content is directly relatedto the mechanical response. The material exhibits aprolonged yielding region, which is reflected by theelectrical measurements.The dense foams exhibit a similar mechanical but adifferent electrical behaviour. For low mechanicalload levels and strains below 4%, the &R/R0 valueincreases linearly. From that point on, by increasingthe strain, &R/R0 continues to increase by a differ-ent rate until almost 30%. In the meantime stresscontinues to increase following a narrower slope.After that point the rate of increase of &R/R0decreases further, but still attains an increasing trend.This holds true for the lower CNT contents studied.For the dense foam having 5!wt% CNT (black lines),the mechanical performance seems to be poorerthan the other CNT concentrations. This is evidentby the low elastic modulus exhibited in the linearregion and the overall lower stresses. Additionally,it is very interesting to note that this is also exhib-ited by the behaviour of &R/R0. The &R/R0 curves forthe dense 5% foam samples resemble those of thelight foam.It is interesting to point out that for the cases wherethe transition of the mechanical response from the lin-ear to the yielding plateau is not clearly expressed;the electrical response exhibits a peak. The transi-tion can be identified by the change of the slope ofthe electrical curve from positive to negative. Forthe case where the mechanical transition from Stage Ito Stage II is much clearer, the respective electricalcurve exhibits a transition point where the positiveslope decreases slightly.Based on experimental indications, it can be said thatthe nano-filler content affects the sensitivity of the
electrical response to mechanical stimulus. This canbe observed by comparing the amount of change inelectrical properties versus the amount of change inthe mechanical response, which is expressed by theinitial slope of the curves in Figure 7. The trendimplies that the higher the CNT content the moresensitive the system is. This CNT loading-perfor-mance sensitivity has been reported in other sensingstudies utilizing CNTs in polymer [2, 37] and infibrous composites [18, 22, 32]. Furthermore, thecontribution of the CNTs in sensing is expected tobe expressed more in the elastic region rather thanthe yielding plateau. The reason for this is that crush-ing of the cells occurs at a higher scale level. Anyinfluence at nano-scale would be shadowed. Never-theless, the conductivity they offer to the nano-poly-mer system still remains. Therefore, it is believedthat the influence of the CNT dispersion in the laterstages of damage is much lower. As a matter of fact,their use is primarily for early sensing of damage.The difference in the electrical response of densefoam with 5!wt% MWCNT and the other two nano-filler concentrations is attributed to the dispersionof the nano-fillers. The mechanical performanceresembles that of light weight foam. At this highlevel of weight fraction, effective dispersion toachieve optimal distribution for mechanical per-formance is very challenging. Agglomerations areobserved percolating to reach a conductive networkthrough individually dispersed CNT. These agglom-erations can act as stress raisers/concentration points.Considering the thinner cross-section (cell walls)available to transfer the compressive loads, thepresence of agglomerations magnifies their effect.
3.3. Non-dimensional electrical measurementsas a function of stress state
Having the aforementioned observations and dia-grams as a basis, we attempt here to identify patternbehaviours, introduce the failure/damage mecha-nisms into perspective for sensing using electricalmeasurements and define key parameter for detect-ing the damage evolution in polymer foams.Firstly, the recorded values are expressed in a non-dimensional basis. The bulk volume resistivity ofthe foams is elaborated solving Equation (1) for theresistivity term. The stress values have already beencalculated previously. To verify that the stress andelectrical behaviour correlate, we plot the elabo-rated bulk volume resistivity against stress. Bulk
Baltopoulos et al. – eXPRESS Polymer Letters Vol.7, No.1 (2013) 40–54
48

volume resistivity takes into account the dimen-sional change of the specimens and thus is believedto convey clearer information on the state of thematerials. A logarithmic scale is used for stress val-ues to enhance the exhibited transitions between thevariables. The resulting curves are shown in Figure 8and 9 for the light and dense foam groups respec-tively.To analyze and explain the observations of the elec-trical resistivity, the mechanisms involved in thedeformation are revisited here, focusing on the fail-ure of cellular solids under compression. Along theway, we assess the effect of these mechanisms onthe electrical properties.The mechanical response curve of foam under com-pression is characterized by three stages. Eachreflects different micro-structural compliance andfailure mechanisms. [36, 38–40]As already mentioned, the first stage is the linear-elastic response of the foam. During this stage, anumber of deformation mechanisms occurs with themore dominant ones being the cell wall bending incombination with the compression of the gas con-tained within the closed foam cells. In this stage,stress increases linearly with deformation. The mod-ulus exhibited depends on the density of the foam.In principle at this level of stress, strain is recover-able, hence is characterized as elastic. Nevertheless,experimental observations here and in other studieshave a reported non-recoverable deformation alreadyfrom this stage, attributed to statistical fracture ofcells and localized stress concentrations. This isexpected to be reflected by the electrical propertiestoo. Damage in the microstructure is expected tointerrupt the conductive paths and increase resistiv-ity. Recoverable deformation is generally expectedto recoverably decrease the electrical resistivity.
This is attributed to the local re-arrangement of theCNT [2, 9] due to the compressive stresses. The CNT
Baltopoulos et al. – eXPRESS Polymer Letters Vol.7, No.1 (2013) 40–54
49
Figure 8. Bulk electrical property change Vs. stress for light foams: (a) 3!wt% and (b) 5!wt% MWCNT
Figure 9. Bulk electrical property change Vs. stress fordense foams: (a) 2!wt%, (b) 3!wt% and (c) 5 wt%MWCNT
contacts increase and more conductive paths areavailable, decreasing the exhibited resistivity.The second stage of ideally elastic-plastic foams ischaracterized by continued deformation at nearlyconstant stress, usually forming a plateau. Duringthis stage, plastic yielding occurs and thus strainincreases more rapidly than stress. The mechanismsassociated with the yielding/collapse plateau, varydepending on the properties of the cell-walls. Forrigid foams, macroscopic plastic yielding in themicro-structure is related to fracture of the wallsdue to buckling failure [39]. In compression, the fail-ure behaviour of low-density foams is dominatedby the early collapse of large porous cells whichtriggers macroscopic fracture of the specimen,whereas high-density foams exhibit more uniformdeformation, which results in ductile-like fracturemode under quasi-static loading [41]. This results inthe fracture of the material microstructure on themechanical level. The fracture interrupts the conti-nuity of the material and breaks the available con-ductive paths. Fractured cell walls are still in con-tact thus contributing to electrical conduction. How-ever, resistivity now is higher because contactresistance is higher than conduction within the net-work. This is reflected by the increase of the bulk vol-ume resistivity.The final stage of stress-strain curve is the densifi-cation. At this stage, the stress rises steeply and thefoam begins to respond as an increasingly compactsolid. The cellular structure within the material hascollapsed compacting in a lamellar microstructure.For further deformation compression of the solidmaterial is required. Essentially, the resulting lamel-lae from the collapsed cells are compacted tightly.This mechanism increases the contact surfacebetween the material formerly comprising the cellwalls, providing larger paths for electrical conduc-tion and thus decreased resistivity.In the view of the above-said, for the light foams,the distinct stages are identified for both CNT con-centrations. In Stage I, the bulk electrical resistivityis decreasing with the increase of the applied stress.The mechanical response of the foam is nearly lin-ear in semi-log axis (Figure 8a). A minimum around1 MPa for the 3!wt% MWCNT and 0.8–0.9 MPafor the 5!wt% MWCNT is consistently observed forall the specimens. This point corresponds to nearly10% compressive strain. In Stage II, resistivityincreases (nearly 3–4 times) and it reaches a peak at
a stress around 8–9 MPa. The stress is high enoughto start causing larger scale cell fracture. This con-tinues, as the stress increases further, more and morecells fracture up to a point where many cells havebeen destroyed. At this point the resistivity shows amaximum at around 9 MPa, which is the same forboth nano-filler contents. This point corresponds to55–65% strain. After this point the last stage startswhere the resistivity decreases again until the endof the experiment. The broken sides of each cellstart to touch and with the increased load they arepressed against each other. This leads to a better con-tact between the conductive cell walls and thus thedecrease in resistivity.For the dense foam, the behaviour is similar to theone described above (Figure 9). The two first stagesare clearly identified. The transition from Stage I toStage II corresponding to the minimum in resistiv-ity is observed at the range of 7–8 MPa. For the highCNT content this point is around 1.1 MPa (veryclose to the transition for light foams). The thirdcharacteristic stage is not observed as the experi-ment was stopped early in terms of stress (all load-ing curves reached a maximum of 20 MPa). As it isseen the applied load did not suffice to lead to thecompression of the fractured walls. The trend of thecurves however indicates a maximum to be expectedclose to 11–13 MPa, as previously described. It isbelieved that the bell-shaped exhibited by the lightfoams would be expressed if the compressive loadextended further higher.
3.4. Damage evolution sensed throughelectrical properties
In this section, we attempt to illustrate the describedinformation in a characteristic diagram for damagesensing through electrical properties. We introducea sigmoid curve that incorporates the aforemen-tioned observations and is based on the damagemechanisms involved (Figure 10). The X-axis is thelogarithmic compressive stress while the Y-axis isthe elaborated bulk volume resistivity. The curveconsists of three parts corresponding to the differentstages of the mechanical response of the foams. Thefirst stage giving a decrease in resistivity representsthe elastic response in compression. The second stagecorresponds to yielding with an increase of resistiv-ity. The third stage showing a decrease in resistivitycorresponds to the densification of the foam. The
Baltopoulos et al. – eXPRESS Polymer Letters Vol.7, No.1 (2013) 40–54
50
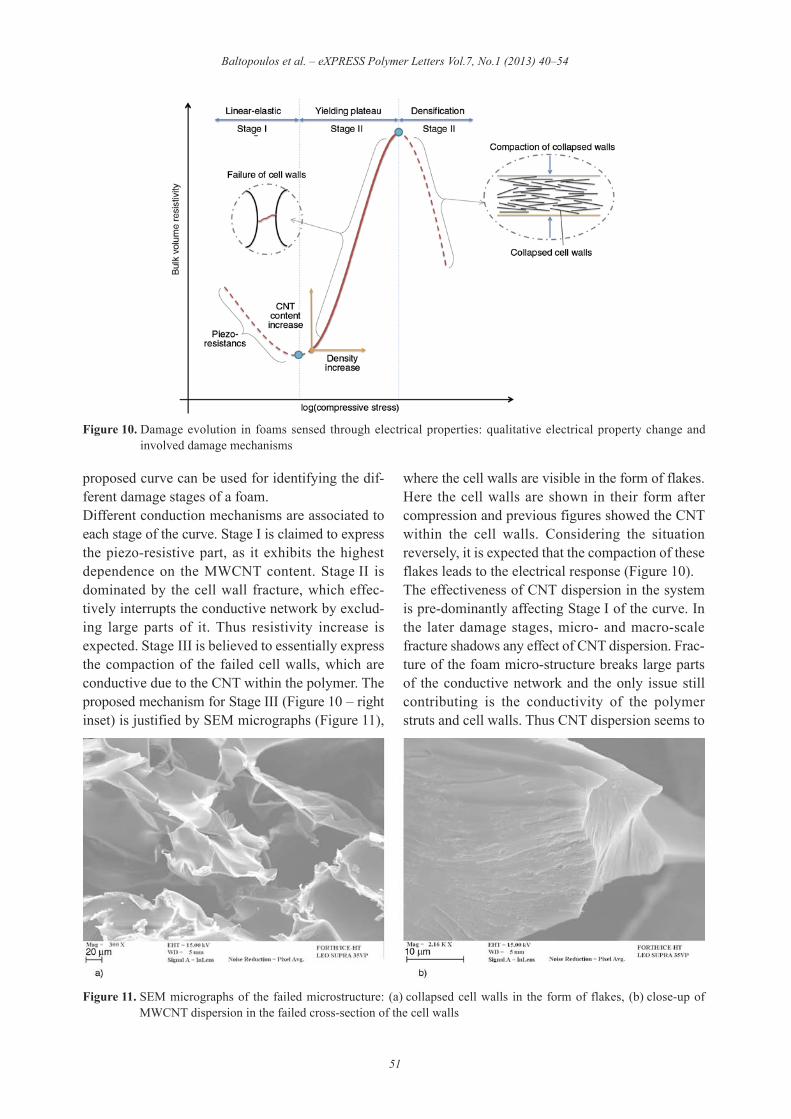
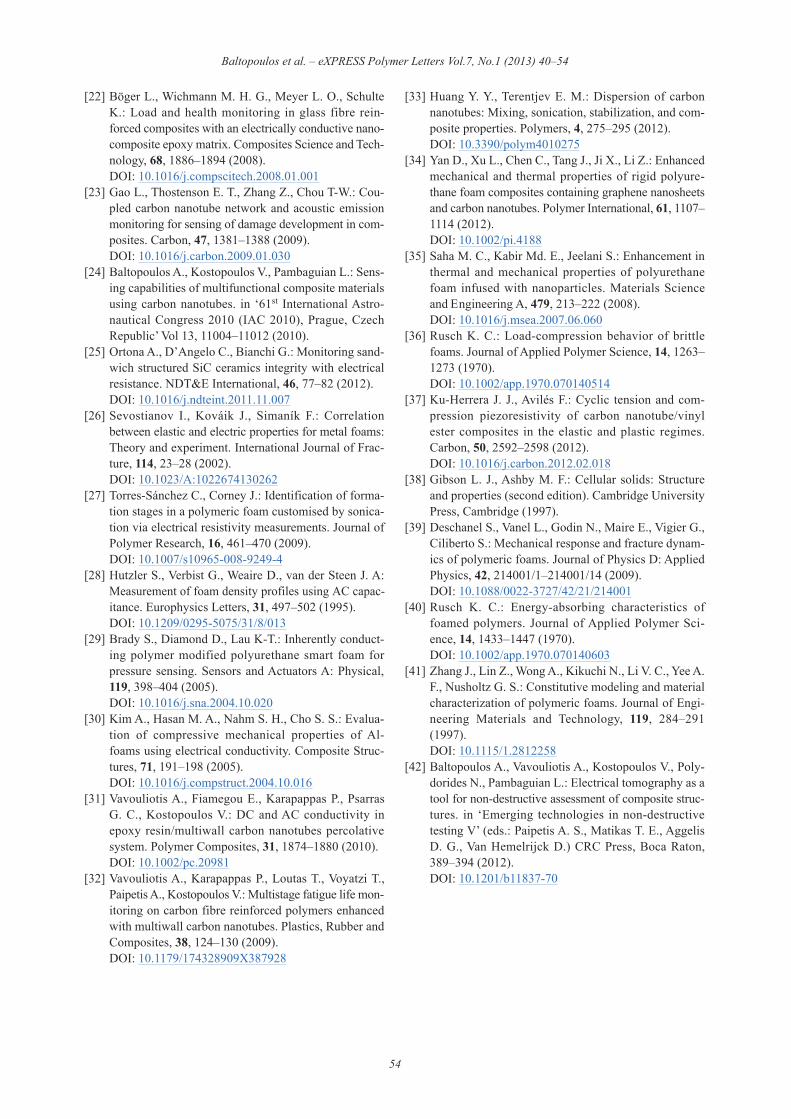
proposed curve can be used for identifying the dif-ferent damage stages of a foam.Different conduction mechanisms are associated toeach stage of the curve. Stage I is claimed to expressthe piezo-resistive part, as it exhibits the highestdependence on the MWCNT content. Stage II isdominated by the cell wall fracture, which effec-tively interrupts the conductive network by exclud-ing large parts of it. Thus resistivity increase isexpected. Stage III is believed to essentially expressthe compaction of the failed cell walls, which areconductive due to the CNT within the polymer. Theproposed mechanism for Stage III (Figure 10 – rightinset) is justified by SEM micrographs (Figure 11),
where the cell walls are visible in the form of flakes.Here the cell walls are shown in their form aftercompression and previous figures showed the CNTwithin the cell walls. Considering the situationreversely, it is expected that the compaction of theseflakes leads to the electrical response (Figure 10).The effectiveness of CNT dispersion in the systemis pre-dominantly affecting Stage I of the curve. Inthe later damage stages, micro- and macro-scalefracture shadows any effect of CNT dispersion. Frac-ture of the foam micro-structure breaks large partsof the conductive network and the only issue stillcontributing is the conductivity of the polymerstruts and cell walls. Thus CNT dispersion seems to
Baltopoulos et al. – eXPRESS Polymer Letters Vol.7, No.1 (2013) 40–54
51
Figure 10. Damage evolution in foams sensed through electrical properties: qualitative electrical property change andinvolved damage mechanisms
Figure 11. SEM micrographs of the failed microstructure: (a) collapsed cell walls in the form of flakes, (b) close-up ofMWCNT dispersion in the failed cross-section of the cell walls

matter less at the later stages, as long as the CNT-polymer remains conductive.Furthermore, it is believed that the exact location ofthe master-curve on the X-Y plane is defined byseveral parameters characterizing the material sys-tem. Two main parameters can already been identi-fied; density and nano-filler content. Firstly, basedon density the curve is shifted to the left for lightfoams, to the right for denser ones. This is based onthe observation that for the dense foams the peakand Stage III decrease is not expressed up to thestress reached. It is believed that because cell wallsare thicker in dense foams, they can withstand higherstresses. To this end, the peak value expressing ‘sat-uration’ of damaged cells and indicating the transi-tion to Stage III may also shift to higher stresses.Secondly, from the experimental results it was seenthat the nano-filler content controls the conductivitylevel of the foam and both the amount of the resis-tivity drop and the drop rate expressed in Stage I.Essentially, the level of conductivity shifts thecurve on the vertical axis.This diagram can serve as an initial attempt to for-mulate a cross-property relation for polymer foams[26, 30], but further experimental evidences areneeded to quantify and standardize the findings toform a cross-property relation.
4. ConclusionsElectrically conductive PUR foams with varyinglevels of electrical conductivity were successfullyprepared at various densities and using differentMWCNT concentrations. MWCNT were dispersedin the polyol component of PUR using high shearmixing. From this base material, conductive foamshaving different densities were produced. Thefoams exhibited varying levels of DC electricalconductivity which have been related to nano-fillerconcentration and density in [10], laying the groundfor this work.Here, for the first time, the evolution of electricalproperties of the foams during compressive loadinguntil failure was investigated. Initial results areanalysed and damage mechanisms are proposed toexplain the observed performance. The recordingswere consistent within the same material groupsand the overall behaviour of electrical propertieswas repeatable and characteristic. Three differentregions are observed in the diagram of the volumeresistivity versus compressive load. The aforemen-
tioned regions are correlated with the three discreteregions of the stress – strain curve of the foam. In thefirst region (linear elastic) the resistivity decreasesas the compressive load increases while the secondregion (yielding plateau) due to breakage of the cellsthe volume resistivity increases. In the third region(densification) the volume resistivity decreasesagain because the collapsed cells are compactedtightly. Each stage is associated to a different mech-anisms respectively; piezo-resistivity, micro-struc-ture failure, compaction of failed microstructure.The nano-phase dispersion controls the overall con-ductivity of the system and the sensitivity of the ini-tial loading stage. The later stages are more relatedto macroscale damage of the structure thus maskingany influence from the CNT dispersion; electricalconductivity of the polymer is only required. Fordenser foams, the technique may seem less efficientbut it is believed that it is due to the bearing capabil-ity of the microstructure that this occurs.In the range of CNTs content that we studied theelectrical resistivity – stress curves a range of simi-larities exists. The above laid the grounds for estab-lishing a damage evolution diagram for sensingthrough electrical properties illustrating the infor-mation collected. This diagram proved to be charac-teristic for the foams studied offering novel poten-tial for the developed systems.The information, mechanisms and formulationspresented in this work may enable the developmentof dedicated advanced Non-Destructive Inspectiontechniques for foams and sandwich composite struc,as well as modelling attempts to express the afore-mentioned observations, especially in Stage II whichrepresents the largest fraction of the materials life.Such techniques could enable on-line damage iden-tification as well as production qualification andbecome part of novel more advanced monitoringsystems [42]. As a matter of fact, similar techniqueshave demonstrated their suitability to offer promptinformation particularly on the production progressof the ‘packing’ and ‘gelation’ stages of polymericfoams, otherwise not so easily possible [27].
AcknowledgementsThis work was supported by the ‘Innovative Action forPlastics and Composites’ of the Regional Innovation Pole ofWestern Greece. The authors would like to thank Mrs. MyrtoMatzakou for her contribution in the preparation of thematerials as well as her support in the experimental work.
Baltopoulos et al. – eXPRESS Polymer Letters Vol.7, No.1 (2013) 40–54
52

References [1] Du J-H., Bai J., Cheng H-M.: The present status and
key problems of carbon nanotube based polymer com-posites. Express Polymer Letters, 1, 253–273 (2007).DOI: 10.3144/expresspolymlett.2007.39
[2] Karapappas P., Tsotra P., Scobbie K.: Effect of nano -fillers on the properties of a state of the art epoxy gel-coat. Express Polymer Letters, 5, 218–227 (2011).DOI: 10.3144/expresspolymlett.2011.21
[3] Rizvi R., Kim J-K., Naguib H.: Synthesis and charac-terization of novel low density polyethylene–multi-wall carbon nanotube porous composites. Smart Mate-rials and Structures, 18, 104002/1–104002/10 (2009).DOI: 10.1088/0964-1726/18/10/104002
[4] Yang Y., Gupta M. C., Dudley K. L., Lawrence R. W.:Conductive carbon nanofiber–polymer foam struc-tures. Advanced Materials, 17, 1999–2003 (2005).DOI: 10.1002/adma.200500615
[5] Xu X-B., Li Z-M., Shi L., Bian X-C., Xiang Z-D.:Ultralight conductive carbon-nanotube–polymer com-posite. Small, 3, 408–411 (2007).DOI: 10.1002/smll.200600348
[6] Harikrishnan G., Singh S. N., Kiesel E., Macosko C.W.: Nanodispersions of carbon nanofiber for polyure -thane foaming. Polymer, 51, 3349–3353 (2010).DOI: 10.1016/j.polymer.2010.05.017
[7] Antunes M., Mudarra M., Velasco J. I.: Broad-bandelectrical conductivity of carbon nanofibre-reinforcedpolypropylene foams. Carbon, 49, 708–711 (2011).DOI: 10.1016/j.carbon.2010.10.032
[8] Yan D-X., Dai K., Xiang Z-D., Li Z-M., Ji X., ZhangW-Q.: Electrical conductivity and major mechanicaland thermal properties of carbon nanotube-filled poly -urethane foams. Journal of Applied Polymer Science,120, 3014–3019 (2011).DOI: 10.1002/app.33437
[9] Xiang Z-D., Chen T., Li Z-M., Bian X-C.: Negativetemperature coefficient of resistivity in lightweightconductive carbon nanotube/polymer composites.Macromolecular Materials and Engineering, 294, 91–95 (2009).DOI: 10.1002/mame.200800273
[10] Athanasopoulos N., Baltopoulos A., Matzakou M.,Vavouliotis A., Kostopoulos V.: Electrical conductiv-ity of polyurethane/MWCNT nanocomposite foams.Polymer Composites, 33, 1302–1312 (2012).DOI: 10.1002/pc.22256
[11] Chung D. D. L.: Self-monitoring structural materials.Materials Science and Engineering R: Reports, 22, 57–78 (1998).DOI: 10.1016/S0927-796X(97)00021-1
[12] Rizvi R., Cochrane B., Biddiss E., Naguib H.: Piezore-sistance characterization of poly(dimethyl-siloxane)and poly(ethylene) carbon nanotube composites. SmartMaterials and Structures, 20, 094003/1–094003/9(2011).DOI: 10.1088/0964-1726/20/9/094003
[13] Wichmann M. H. G., Buschhorn S. T., Gehrmann J.,Schulte K.: Piezoresistive response of epoxy compos-ites with carbon nanoparticles under tensile load.Physical Review B, 80, 245437/1–245437/8 (2009).DOI: 10.1103/PhysRevB.80.245437
[14] Wichmann M. H. G., Buschhorn S. T., Böger L.,Adelung R., Schulte K.: Direction sensitive bendingsensors based on multi-wall carbon nanotube/epoxynanocomposites. Nanotechnology, 19, 475503/1–475503/5 (2008).DOI: 10.1088/0957-4484/19/47/475503
[15] Wang L., Wang X., Li Y.: Relation between repeateduniaxial compressive pressure and electrical resistanceof carbon nanotube filled silicone rubber composite.Composites Part A: Applied Science and Manufactur-ing, 43, 268–274 (2012).DOI: 10.1016/j.compositesa.2011.10.017
[16] Park J-M., Kim P-G., Jang J-H., Wang Z., Kim J-W.,Lee W-I., Park J-G., DeVries L. K.: Self-sensing anddispersive evaluation of single carbon fiber/carbonnanotube (CNT)-epoxy composites using electro-micromechanical technique and nondestructive acousticemission. Composites Part B: Engineering, 39, 1170–1182 (2008).DOI: 10.1016/j.compositesb.2008.03.004
[17] Abry J. C., Choi Y. K., Chateauminos A., Dalloz B.,Giraud G., Salvia M.: In-situ monitoring of damage inCFRP laminates by means of AC and DC measure-ments. Composites Science and Technology, 61, 855–864 (2001).DOI: 10.1016/S0266-3538(00)00181-0
[18] Kostopoulos V., Vavouliotis A., Karapappas P., TsotraP., Paipetis A.: Damage monitoring of carbon fiberreinforced laminates using resistance measurements.Improving sensitivity using carbon nanotube dopedepoxy matrix system. Journal of Intelligent MaterialSystems and Structures, 20, 1025–1034 (2009).DOI: 10.1177/1045389X08099993
[19] Nofar M., Hoa S. V., Pugh M. D.: Failure detectionand monitoring in polymer matrix composites sub-jected to static and dynamic loads using carbon nan-otube networks. Composites Science and Technology,69, 1599–1606 (2009).DOI: 10.1016/j.compscitech.2009.03.010
[20] Vavouliotis A., Paipetis A., Kostopoulos V.: On thefatigue life prediction of CFRP laminates using theelectrical resistance change method. Composites Sci-ence and Technology, 71, 630–642 (2011).DOI: 10.1016/j.compscitech.2011.01.003
[21] Sotiriadis G., Tsotra P., Paipetis A., Kostopoulos V.:Stiffness degradation monitoring of carbon nanotubedoped glass/vinylester composites via resistance meas-urements. Journal of Nanostructured Polymers andNanocomposites, 3, 90–95 (2007).
Baltopoulos et al. – eXPRESS Polymer Letters Vol.7, No.1 (2013) 40–54
53
[22] Böger L., Wichmann M. H. G., Meyer L. O., SchulteK.: Load and health monitoring in glass fibre rein-forced composites with an electrically conductive nano -composite epoxy matrix. Composites Science and Tech-nology, 68, 1886–1894 (2008).DOI: 10.1016/j.compscitech.2008.01.001
[23] Gao L., Thostenson E. T., Zhang Z., Chou T-W.: Cou-pled carbon nanotube network and acoustic emissionmonitoring for sensing of damage development in com-posites. Carbon, 47, 1381–1388 (2009).DOI: 10.1016/j.carbon.2009.01.030
[24] Baltopoulos A., Kostopoulos V., Pambaguian L.: Sens-ing capabilities of multifunctional composite materialsusing carbon nanotubes. in ‘61st International Astro-nautical Congress 2010 (IAC 2010), Prague, CzechRepublic’ Vol 13, 11004–11012 (2010).
[25] Ortona A., D’Angelo C., Bianchi G.: Monitoring sand-wich structured SiC ceramics integrity with electricalresistance. NDT&E International, 46, 77–82 (2012).DOI: 10.1016/j.ndteint.2011.11.007
[26] Sevostianov I., Kováik J., Simaník F.: Correlationbetween elastic and electric properties for metal foams:Theory and experiment. International Journal of Frac-ture, 114, 23–28 (2002).DOI: 10.1023/A:1022674130262
[27] Torres-Sánchez C., Corney J.: Identification of forma-tion stages in a polymeric foam customised by sonica-tion via electrical resistivity measurements. Journal ofPolymer Research, 16, 461–470 (2009).DOI: 10.1007/s10965-008-9249-4
[28] Hutzler S., Verbist G., Weaire D., van der Steen J. A:Measurement of foam density profiles using AC capac-itance. Europhysics Letters, 31, 497–502 (1995).DOI: 10.1209/0295-5075/31/8/013
[29] Brady S., Diamond D., Lau K-T.: Inherently conduct-ing polymer modified polyurethane smart foam forpressure sensing. Sensors and Actuators A: Physical,119, 398–404 (2005).DOI: 10.1016/j.sna.2004.10.020
[30] Kim A., Hasan M. A., Nahm S. H., Cho S. S.: Evalua-tion of compressive mechanical properties of Al-foams using electrical conductivity. Composite Struc-tures, 71, 191–198 (2005).DOI: 10.1016/j.compstruct.2004.10.016
[31] Vavouliotis A., Fiamegou E., Karapappas P., PsarrasG. C., Kostopoulos V.: DC and AC conductivity inepoxy resin/multiwall carbon nanotubes percolativesystem. Polymer Composites, 31, 1874–1880 (2010).DOI: 10.1002/pc.20981
[32] Vavouliotis A., Karapappas P., Loutas T., Voyatzi T.,Paipetis A., Kostopoulos V.: Multistage fatigue life mon-itoring on carbon fibre reinforced polymers enhancedwith multiwall carbon nanotubes. Plastics, Rubber andComposites, 38, 124–130 (2009).DOI: 10.1179/174328909X387928
[33] Huang Y. Y., Terentjev E. M.: Dispersion of carbonnanotubes: Mixing, sonication, stabilization, and com-posite properties. Polymers, 4, 275–295 (2012).DOI: 10.3390/polym4010275
[34] Yan D., Xu L., Chen C., Tang J., Ji X., Li Z.: Enhancedmechanical and thermal properties of rigid polyure -thane foam composites containing graphene nanosheetsand carbon nanotubes. Polymer International, 61, 1107–1114 (2012).DOI: 10.1002/pi.4188
[35] Saha M. C., Kabir Md. E., Jeelani S.: Enhancement inthermal and mechanical properties of polyurethanefoam infused with nanoparticles. Materials Scienceand Engineering A, 479, 213–222 (2008).DOI: 10.1016/j.msea.2007.06.060
[36] Rusch K. C.: Load-compression behavior of brittlefoams. Journal of Applied Polymer Science, 14, 1263–1273 (1970).DOI: 10.1002/app.1970.070140514
[37] Ku-Herrera J. J., Avilés F.: Cyclic tension and com-pression piezoresistivity of carbon nanotube/vinylester composites in the elastic and plastic regimes.Carbon, 50, 2592–2598 (2012).DOI: 10.1016/j.carbon.2012.02.018
[38] Gibson L. J., Ashby M. F.: Cellular solids: Structureand properties (second edition). Cambridge UniversityPress, Cambridge (1997).
[39] Deschanel S., Vanel L., Godin N., Maire E., Vigier G.,Ciliberto S.: Mechanical response and fracture dynam-ics of polymeric foams. Journal of Physics D: AppliedPhysics, 42, 214001/1–214001/14 (2009).DOI: 10.1088/0022-3727/42/21/214001
[40] Rusch K. C.: Energy-absorbing characteristics offoamed polymers. Journal of Applied Polymer Sci-ence, 14, 1433–1447 (1970).DOI: 10.1002/app.1970.070140603
[41] Zhang J., Lin Z., Wong A., Kikuchi N., Li V. C., Yee A.F., Nusholtz G. S.: Constitutive modeling and materialcharacterization of polymeric foams. Journal of Engi-neering Materials and Technology, 119, 284–291(1997).DOI: 10.1115/1.2812258
[42] Baltopoulos A., Vavouliotis A., Kostopoulos V., Poly-dorides N., Pambaguian L.: Electrical tomography as atool for non-destructive assessment of composite struc-tures. in ‘Emerging technologies in non-destructivetesting V’ (eds.: Paipetis A. S., Matikas T. E., AggelisD. G., Van Hemelrijck D.) CRC Press, Boca Raton,389–394 (2012).DOI: 10.1201/b11837-70
Baltopoulos et al. – eXPRESS Polymer Letters Vol.7, No.1 (2013) 40–54
54