senior plc annual report & accounts 2014 report & accounts 2014 financial statements...
TRANSCRIPT
Senior plcAnnual Report & Accounts 2014
ContentsStrategiC report1 Chairman’s statement2 Group at a glance4 Market overview5 Key growth drivers6 Our business model8 Portfolio10 Customer alignment12 Operational excellence14 People16 Strategic objectives17 Risks and uncertainties20 Key performance indicators22 Chief Executive’s statement 24 Aerospace Division 26 Flexonics Division28 Financial review31 Executive and HSE Committees
governanCe32 Board of Directors34 Report of the Directors36 Corporate governance report39 Nominations Committee report40 Audit Committee report44 Remuneration report: 44 Annual statement 45 Policy report 51 Annual report on remuneration60 Statement of Directors’ responsibilities61 Independent auditor’s report to the members
of Senior plc
FinanCial StatementS 64 Consolidated income statement64 Consolidated statement of
comprehensive income65 Consolidated balance sheets66 Consolidated statements of changes in equity67 Consolidated cash flow statements68 Notes to the Consolidated Financial Statements106 Company balance sheets107 Company statement of changes in equity108 Notes to the Company Financial Statements113 Five-year summary
additional inFormation 114 Principal Group undertakings115 Additional shareholder information116 2015 financial calendar116 Officers and advisers
Corporate reSponSibilityThe Group has five core priorities to its corporate responsibility programme. These are the areas which management can best influence and generate value for the Group by creating business development opportunities, reducing operating costs and improving productivity.
1. Developing People – attracting and retaining the best employees
2. Community Engagement – investing in the communities where the Group operates
3. Operating with Integrity – always conducting Senior’s business responsibly and ethically
4. Environment – reducing the Group’s energy usage and environmental impact
5. Health and Safety – maintaining a safe and healthy workplace
Within this Annual Report whenever this icon is seen, content refers to corporate responsibility.
read more
CaSe Study
Financial highlights
£820.8mrevenue +6% (2013 – £775.1m)
13.6%adjusted operating margin(1) – 0.3ppts (2013 – 13.9%)
£102.6madjusted profit before tax(1) +5% (2013 – £98.1m)
£80.6mprofit before tax -4% (2013 – £83.8m)
19.84padjusted earnings per share(1) +4% (2013 – 19.00p)
15.25pbasic earnings per share -11% (2013 – 17.22p)
5.63pdividends per share +10% (2013 – 5.12p)
23.8%return on capital employed -2.9ppts (2013 – 26.7%)
£57.8mFree cash flow(2) -9% (2013 – £63.8m)
£105.0mnet debt(2) £45.8m increase (2013 – £59.2m)
(1) Before acquisition costs of £0.6m (2013 – £0.4m), amortisation of intangible assets arising on acquisitions of £7.2m (2013 – £4.2m), impairment of inventory relating to the suspended L85 aircraft programme of £1.8m (2013 – £nil), restructuring costs of £1.5m (2013 – £1.9m), goodwill impairment charge of £9.4m (2013 – £12.7m), reversal of contingent consideration payable of £nil (2013 – £3.8m) and pension curtailment charge of £1.5m (2013 – £1.1m gain).
(2) See Notes 32b and 32c for derivation of free cash flow and of net debt, respectively.
The Group’s principal exchange rates for the US dollar and the Euro, applied in the translation of revenue, profit and cash flow items at average rates were $1.65 (2013 – $1.57) and €1.24 (2013 – €1.18), respectively. The US dollar and Euro rates applied to the balance sheet at 31 December 2014 were $1.56 (2013 – $1.66) and €1.29 (2013 – €1.20), respectively.
To find out more visit www.seniorplc.com
Cautionary StatementThe Annual Report & Accounts 2014 contains certain forward-looking statements. Such statements are made by the Directors in good faith based on the information available to them at the date of this Report and they should be treated with caution due to the inherent uncertainties underlying any such forward-looking statements.
overview

1Annual Report & Accounts 2014
www.seniorplc.com | Senior plc
STRATEGIC REPO
RTG
OVERN
AN
CEFIN
AN
CIAL STATEM
ENTS
AD
DITION
AL IN
FORM
ATION
Chairman’s statement
2014 PerformanCeSenior delivered another year of progress in 2014, with adjusted profit before tax increasing to £102.6m, up 5%, or 11% on a constant currency basis, over the prior year. This was mainly due to encouraging organic revenue growth in the large commercial aerospace and North American heavy-duty truck markets, operational improvements in the Flexonics Division and inclusion of the newly acquired Upeca Technologies (“Upeca”). Elsewhere, the previously discussed challenges and costs associated with the industrialisation of new aerospace programmes continued throughout the year and certain industrial markets, such as Brazil and Europe, remained weak. Further, on 20 January 2015, Bombardier informed all of its suppliers of the suspension of its Learjet 85 (“L85”) business jet programme which resulted in the Group taking non-cash non-recurring exceptional charges of £1.8m and recognising a £9.4m goodwill impairment in 2014.
Group cash generation was good, with free cash flow of £57.8m for the year resulting in a strong financial position for the Group at the end of 2014. Accordingly, the Board is proposing a final dividend of 3.96 pence per share which would bring total dividends, paid and proposed, for 2014 to 5.63 pence per share. The increase of 10% over 2013 is ahead of the increase in adjusted earnings per share reflecting the Group’s encouraging prospects and dividend cover of 3.5 times.
These underlying results reflect Senior’s strong niche market positions, its focus on tough-to-make, highly engineered products and the continued emphasis on serving its customers by delivering excellent operational performance where on-time delivery, quality and value are all key measures.
aCquisitionsAs well as growing organically, Senior seeks to increase shareholder value through the acquisition of capabilities adjacent to its existing portfolio. This strategy continued in 2014 with the acquisition of Upeca, a Malaysian-based manufacturer of high-precision engineered components serving the aerospace and energy sectors. Upeca has two manufacturing facilities in Malaysia, one selling to the aerospace industry and the other to the energy market, and a third facility in China, which specialises in energy applications. Upeca employs around 650 people and the Board is delighted to welcome these employees to the Group.
sustainabilityEnvironmental stewardship and corporate responsibility are values core to Senior and performance in these areas is increasingly important to our investors, customers and employees. As the Group expands, the responsibility to improve the environmental performance and strengthen the focus on safety within newly acquired businesses is a key operational aim. Consequently, this year’s annual report includes examples of how Senior creates value through its acquisitions by making them more efficient, environmentally responsible and safer businesses. This year the Group achieved its long-term goal of improving the energy efficiency of its operations, the single largest component of Senior’s carbon-footprint, and remains on track to achieve its long-term target for safety.
Changes to the boardIn August 2014, it was announced that Mark Rollins, Group Chief Executive, had decided to retire from a full-time executive career during the first half of 2015. Following a thorough recruitment process, undertaken by the Board’s independent directors, David Squires was announced as his successor in January this year.
David joins Senior from Cobham plc (“Cobham”), where he is currently its Chief Operating Officer. David will join Senior and the Board on 1 May 2015 as Group Chief Executive-designate, before taking over as Group Chief Executive on 1 June 2015 when Mark Rollins leaves the Group. David clearly has the depth and breadth of experience, together with the personality and drive, to lead Senior through the next stage of its development. I am confident Senior will continue to make strong progress under his leadership. In particular, his 25 years of experience in the global aerospace and defence industry, working in both developing and larger organisations, will be a significant benefit to Senior as it grows and increases its profile with its customers.
Mark Rollins has made an enormous contribution to Senior in a career spanning 17 years, including 15 years on the Board, initially as Group Finance Director and then, for the
past seven years, as Group Chief Executive. In this time, Senior has been transformed from a lowly rated, industrial conglomerate to a quality global engineering business, focused on the aerospace, defence, land vehicle and energy markets. The Group’s financial performance and market capitalisation have increased significantly during this period and Mark leaves the Group in good health, with encouraging prospects for continued, long-term growth. On behalf of the Board, I would like to thank Mark for his dedicated and successful service throughout his Senior career and to wish him all the very best for a long and fulfilling retirement.
emPloyeesSenior’s continued strength is a reflection of the quality of the people within the Group. Senior now employs over 7,400 people with around 1,200 located in Asia, demonstrating the ever-increasing global nature of the Group. On behalf of the Board, I would like to thank all of the Group’s employees for their significant contribution to Senior’s success over the past year.
strategyThe Group continues to operate in its five strategic market sectors: three in Aerospace (Fluid Conveyance Systems, Gas Turbine Engines and Structures) and two in Flexonics (Land Vehicle Emission Control and Industrial Process Control), with each strategic market sector offering deliverable growth opportunities. The Group’s strategy has proven to be successful over recent years and, whilst evolving as the Group gets larger and market conditions change, it continues to provide a solid foundation for the Group’s future growth aspirations.
outlookOverall, progress is expected to be made across the Group’s operations during 2015, with the growing large commercial aircraft market, the healthy North American heavy-truck market and the Group’s growing presence in Asia being the anticipated key drivers. The challenges associated with the successful industrialisation of new aerospace programmes and weak industrial sales in Brazil and Europe are, however, expected to continue into 2015. In addition, the recent suspension by Bombardier of its L85 business-jet programme is expected to have an adverse impact on the ongoing performance of one of the Group’s smaller aerospace operations.
Looking further ahead, a number of new aerospace programmes going into production and build-rate increases, together with economic recovery and expected market share gains in both the Aerospace and Flexonics Divisions, mean the outlook for Senior remains encouraging.
Charles BerryChairman
Senior delivered a healthy performance during 2014 and is well positioned for the future.

Annual Report & Accounts 20142
www.seniorplc.com | Senior plc
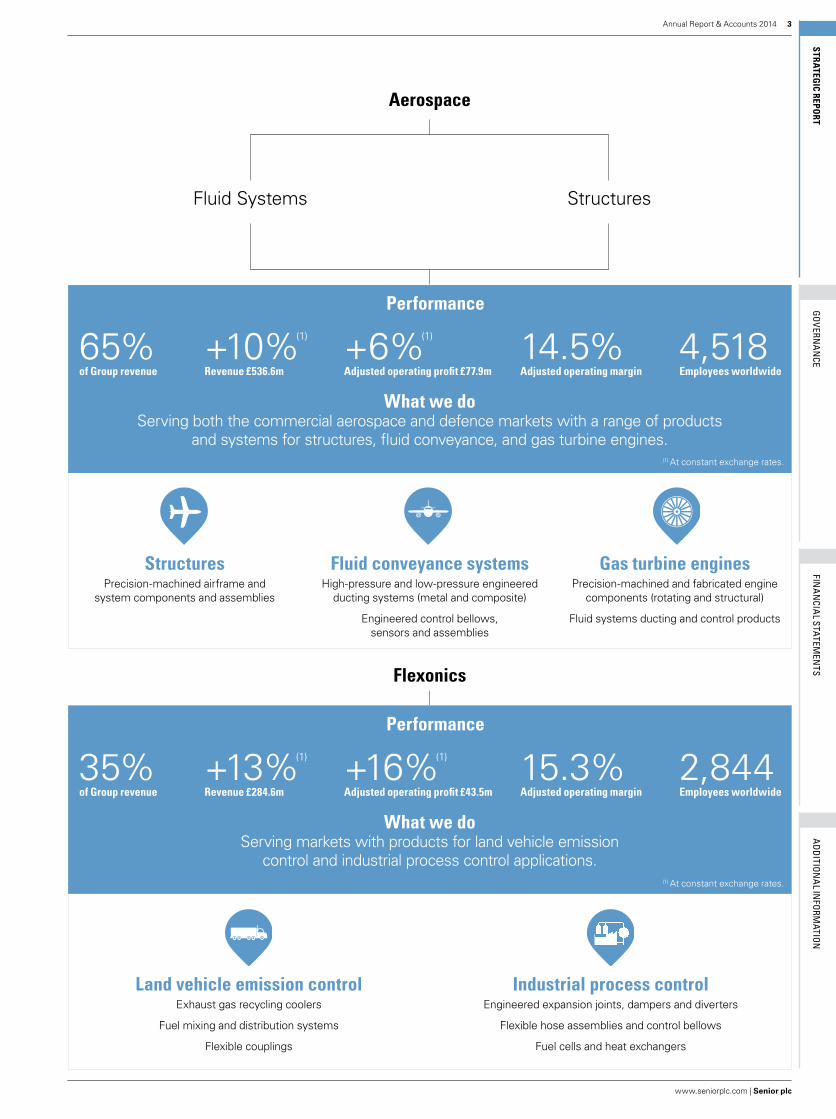
group at a glanceSenior is an international, market-leading, engineering solutions provider with 32 operations in 14 countries.
Senior designs, manufactures and markets high-technology components and systems for the principal original equipment producers in the worldwide aerospace, defence, land vehicle and energy markets. The Group is split into two divisions, Aerospace and Flexonics, servicing five key sectors.
The Group’s primary performance objective is to create long-term sustainable growth in shareholder value. It aims to achieve this objective through the development of a portfolio of collaborative high value-added engineering manufacturing companies within its five market sector framework that are capable of producing sustainable real growth in operating profit and cash flow, and that consistently exceed the Group’s cost of capital.
Read the Group Chief Executive‘s summary of the year on page 22
Read about how we create value on page 6
Read the Financial Review on page 28
Thailand 1 Aerospace
Malaysia 1 Aerospace 1 Flexonics
UK 4 Aerospace 1 Flexonics
Mexico 1 Aerospace Continental Europe
3 Aerospace 3 FlexonicsUSA
9 Aerospace 3 Flexonics India
1 Flexonics
South Africa 1 Flexonics
Brazil 1 Flexonics
Canada 1 Flexonics
China 1 Flexonics plus
a joint venture
Where we operate
3Annual Report & Accounts 2014
www.seniorplc.com | Senior plc
STRATEGIC REPO
RTG
OVERN
AN
CEFIN
AN
CIAL STATEM
ENTS
AD
DITION
AL IN
FORM
ATION
flexonics
aerospace
StructuresFluid Systems
structuresPrecision-machined airframe and
system components and assemblies
fluid conveyance systemsHigh-pressure and low-pressure engineered
ducting systems (metal and composite)
Engineered control bellows, sensors and assemblies
gas turbine enginesPrecision-machined and fabricated engine
components (rotating and structural)
Fluid systems ducting and control products
Performance
65%of group revenue
+10%(1)
revenue £536.6m+6%(1)
adjusted operating profit £77.9m14.5%adjusted operating margin
4,518employees worldwide
What we doServing both the commercial aerospace and defence markets with a range of products
and systems for structures, fluid conveyance, and gas turbine engines.
land vehicle emission controlExhaust gas recycling coolers
Fuel mixing and distribution systems
Flexible couplings
industrial process controlEngineered expansion joints, dampers and diverters
Flexible hose assemblies and control bellows
Fuel cells and heat exchangers
Performance
35%of group revenue
+13%(1)
revenue £284.6m+16%(1)
adjusted operating profit £43.5m15.3%adjusted operating margin
2,844employees worldwide
What we doServing markets with products for land vehicle emission
control and industrial process control applications.(1) At constant exchange rates.
(1) At constant exchange rates.

Annual Report & Accounts 20144
www.seniorplc.com | Senior plc
The Group services diverse markets with a wide range of products for blue-chip customers. Diversity is a key strategic advantage for Senior.
aerospace 65% flexonics 35%
market overview
MarketsLarge Commercial 59%Military/Defence 18%Business Jets 8%Regional Jets 5%Space 1%Non-military Helicopters 1%Other Non-Aerospace 8%
Truck & Off Highway 36%Passenger Vehicles 19%Power & Energy 17%Petrochemical 15%Heating, Ventilation and Solar
3%
Other Industrial 9%Aerospace 1%
Airframe & other Structural Parts
30%
Engine Structures and Mounting Systems
29%
Metallic Ducting Systems 17%Composite Ducting Systems
6%
Fluid Control Systems 6%Helicopter Machined Parts
4%
Other Non-Aerospace 8%
Rolls-Royce 17%Boeing 17%Spirit 11%UTC 8%Airbus 5%Bombardier 5%Safran Group 3%GKN 2%GE 2%Other Aerospace 22%Other Non-Aerospace 8%
North America 64%Rest of Europe 7%UK 23%Thailand 4%Malaysia 2%
Cooling and Emission Control Components
24%
Flexible Mechanisms for Vehicle Exhaust Systems
13%
Fuel Distribution Pipework 15%Off Highway Hydraulics 3%Power & Energy 17%Petrochemical 15%Heating, Ventilation and Solar
3%
Other Industrial 9%Aerospace 1%
Cummins 17%Caterpillar 9%Ford 4%PSA 4%Renault 4%Sauer Danfoss 2%GM 2%Other Land Vehicle 13%Emerson 5%Bloom Energy 3%Other Industrial 36%Woodward 1%
North America 60%Rest of Europe 21%UK 2%South Africa 6%Brazil 4%India 2%Others 5%
Products
Customers
Geography – Sales by origin
5Annual Report & Accounts 2014
www.seniorplc.com | Senior plc
STRATEGIC REPO
RTG
OVERN
AN
CEFIN
AN
CIAL STATEM
ENTS
AD
DITION
AL IN
FORM
ATION
Senior designs, manufactures and markets high-technology components and systems for the principal original equipment producers in the worldwide aerospace, defence, land vehicle and energy markets.
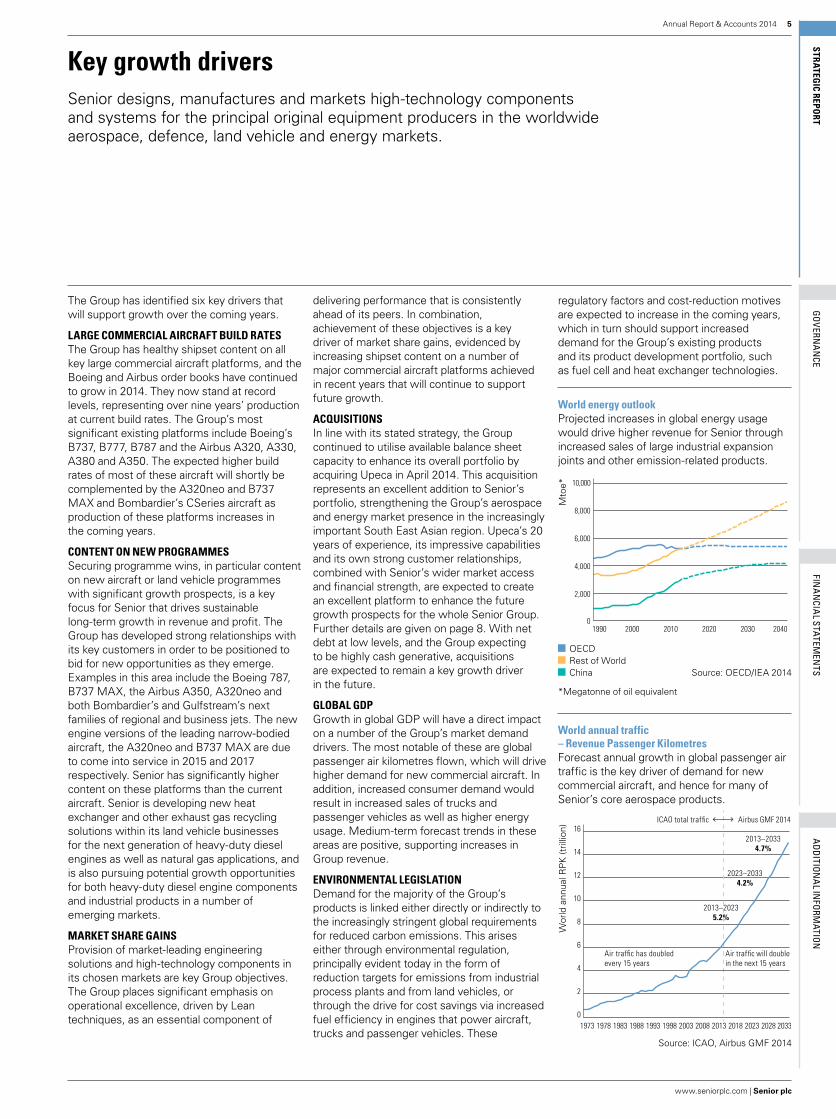
key growth drivers
The Group has identified six key drivers that will support growth over the coming years.
large CommerCial airCraft build ratesThe Group has healthy shipset content on all key large commercial aircraft platforms, and the Boeing and Airbus order books have continued to grow in 2014. They now stand at record levels, representing over nine years’ production at current build rates. The Group’s most significant existing platforms include Boeing’s B737, B777, B787 and the Airbus A320, A330, A380 and A350. The expected higher build rates of most of these aircraft will shortly be complemented by the A320neo and B737 MAX and Bombardier’s CSeries aircraft as production of these platforms increases in the coming years.
Content on neW ProgrammesSecuring programme wins, in particular content on new aircraft or land vehicle programmes with significant growth prospects, is a key focus for Senior that drives sustainable long-term growth in revenue and profit. The Group has developed strong relationships with its key customers in order to be positioned to bid for new opportunities as they emerge. Examples in this area include the Boeing 787, B737 MAX, the Airbus A350, A320neo and both Bombardier’s and Gulfstream’s next families of regional and business jets. The new engine versions of the leading narrow-bodied aircraft, the A320neo and B737 MAX are due to come into service in 2015 and 2017 respectively. Senior has significantly higher content on these platforms than the current aircraft. Senior is developing new heat exchanger and other exhaust gas recycling solutions within its land vehicle businesses for the next generation of heavy-duty diesel engines as well as natural gas applications, and is also pursuing potential growth opportunities for both heavy-duty diesel engine components and industrial products in a number of emerging markets.
market share gainsProvision of market-leading engineering solutions and high-technology components in its chosen markets are key Group objectives. The Group places significant emphasis on operational excellence, driven by Lean techniques, as an essential component of
delivering performance that is consistently ahead of its peers. In combination, achievement of these objectives is a key driver of market share gains, evidenced by increasing shipset content on a number of major commercial aircraft platforms achieved in recent years that will continue to support future growth.
aCquisitionsIn line with its stated strategy, the Group continued to utilise available balance sheet capacity to enhance its overall portfolio by acquiring Upeca in April 2014. This acquisition represents an excellent addition to Senior’s portfolio, strengthening the Group’s aerospace and energy market presence in the increasingly important South East Asian region. Upeca’s 20 years of experience, its impressive capabilities and its own strong customer relationships, combined with Senior’s wider market access and financial strength, are expected to create an excellent platform to enhance the future growth prospects for the whole Senior Group. Further details are given on page 8. With net debt at low levels, and the Group expecting to be highly cash generative, acquisitions are expected to remain a key growth driver in the future.
global gdPGrowth in global GDP will have a direct impact on a number of the Group’s market demand drivers. The most notable of these are global passenger air kilometres flown, which will drive higher demand for new commercial aircraft. In addition, increased consumer demand would result in increased sales of trucks and passenger vehicles as well as higher energy usage. Medium-term forecast trends in these areas are positive, supporting increases in Group revenue.
environmental legislation Demand for the majority of the Group’s products is linked either directly or indirectly to the increasingly stringent global requirements for reduced carbon emissions. This arises either through environmental regulation, principally evident today in the form of reduction targets for emissions from industrial process plants and from land vehicles, or through the drive for cost savings via increased fuel efficiency in engines that power aircraft, trucks and passenger vehicles. These
regulatory factors and cost-reduction motives are expected to increase in the coming years, which in turn should support increased demand for the Group’s existing products and its product development portfolio, such as fuel cell and heat exchanger technologies.
World energy outlookProjected increases in global energy usage would drive higher revenue for Senior through increased sales of large industrial expansion joints and other emission-related products.
01990 2000 2010 2020 2030 2040
4,000
2,000
8,000
6,000
10,000
Mto
e*
OECD Rest of World China Source: OECD/IEA 2014
*Megatonne of oil equivalent
World annual traffic – revenue Passenger kilometresForecast annual growth in global passenger air traffic is the key driver of demand for new commercial aircraft, and hence for many of Senior’s core aerospace products.
01973 1978 1983 1988 1993 1998 2003 2008 2013 2018 2023 2028 2033
2
4
6
8
10
12
14
16
Air traffic has doubledevery 15 years
Airbus GMF 2014ICAO total traffic
Air traffic will doublein the next 15 years
2013–20235.2%
2023–20334.2%
2013–20334.7%
Wor
ld a
nnua
l RP
K (t
rillio
n)
Source: ICAO, Airbus GMF 2014
Annual Report & Accounts 20146
www.seniorplc.com | Senior plc
our business model – how we create valueSenior’s primary strategic objective is to create long-term sustainable growth in shareholder value. This is achieved through a culture of empowerment of autonomous, but collaborative, operations working within a well-defined control framework.
The major elements of value creation for the Group can be classified into four primary drivers as follows:
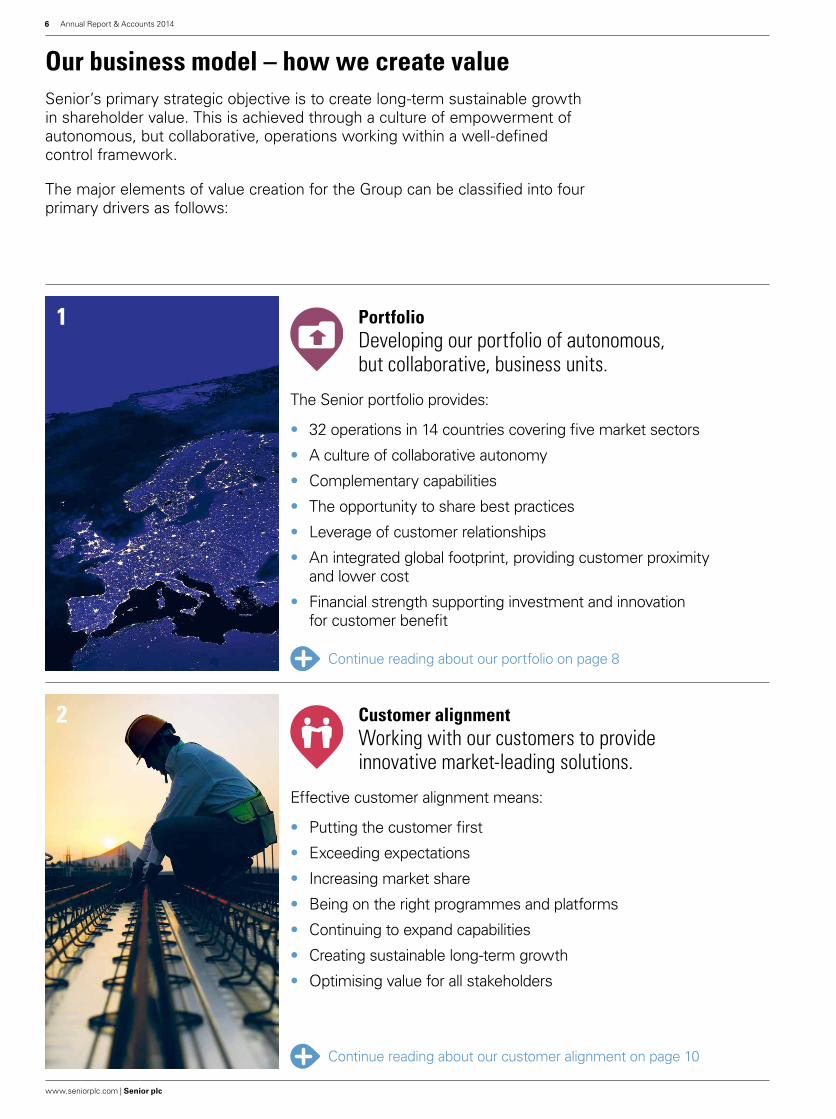
PortfolioDeveloping our portfolio of autonomous, but collaborative, business units.
The Senior portfolio provides:
• 32 operations in 14 countries covering five market sectors
• A culture of collaborative autonomy
• Complementary capabilities
• The opportunity to share best practices
• Leverage of customer relationships
• An integrated global footprint, providing customer proximity and lower cost
• Financial strength supporting investment and innovation for customer benefit
Customer alignmentWorking with our customers to provide innovative market-leading solutions.
Effective customer alignment means:
• Putting the customer first
• Exceeding expectations
• Increasing market share
• Being on the right programmes and platforms
• Continuing to expand capabilities
• Creating sustainable long-term growth
• Optimising value for all stakeholders
Continue reading about our portfolio on page 8
Continue reading about our customer alignment on page 10
1
2

7Annual Report & Accounts 2014
www.seniorplc.com | Senior plc
STRATEGIC REPO
RTG
OVERN
AN
CEFIN
AN
CIAL STATEM
ENTS
AD
DITION
AL IN
FORM
ATION
PeopleRecruiting and developing our people, to deliver sustainable growth.
Our people make the difference. They operate in a culture of:
• Empowerment of local management
• “Tell it as it is” philosophy
• Integrity and high ethical standards
• Maintaining a safe and healthy workplace
• Ongoing personal development throughout the business
• Investing in local communities
• Developing strong customer relationships
operational excellenceBeing passionate about operational excellence, driving continuous improvement.
Effective operational excellence results in:
• Quality products delivered on time
• The provision of cost-competitive solutions
• Efficient levels of working capital
• A safe working environment
• A reduction in environmental impact
• Good governance and risk management
• Satisfied customers placing more work with Senior
Continue reading about operational excellence on page 12
Continue reading about our people on page 14
3
4
Annual Report & Accounts 20148
www.seniorplc.com | Senior plc
Portfolio enhanCementThe Group has a good track record of acquiring and successfully integrating new businesses, and also of rationalising and enhancing the overall asset portfolio through disposals, utilising a framework that has been developed as part of the strategic planning process. The key enabler of this programme is the significant balance sheet capacity that has been generated in recent years through strong free cash flow generation.
exPanding CaPabilitiesThe Group’s strategy is to target a select number of complementary acquisitions in growth markets to expand its capabilities, accelerate growth and enhance its asset portfolio.
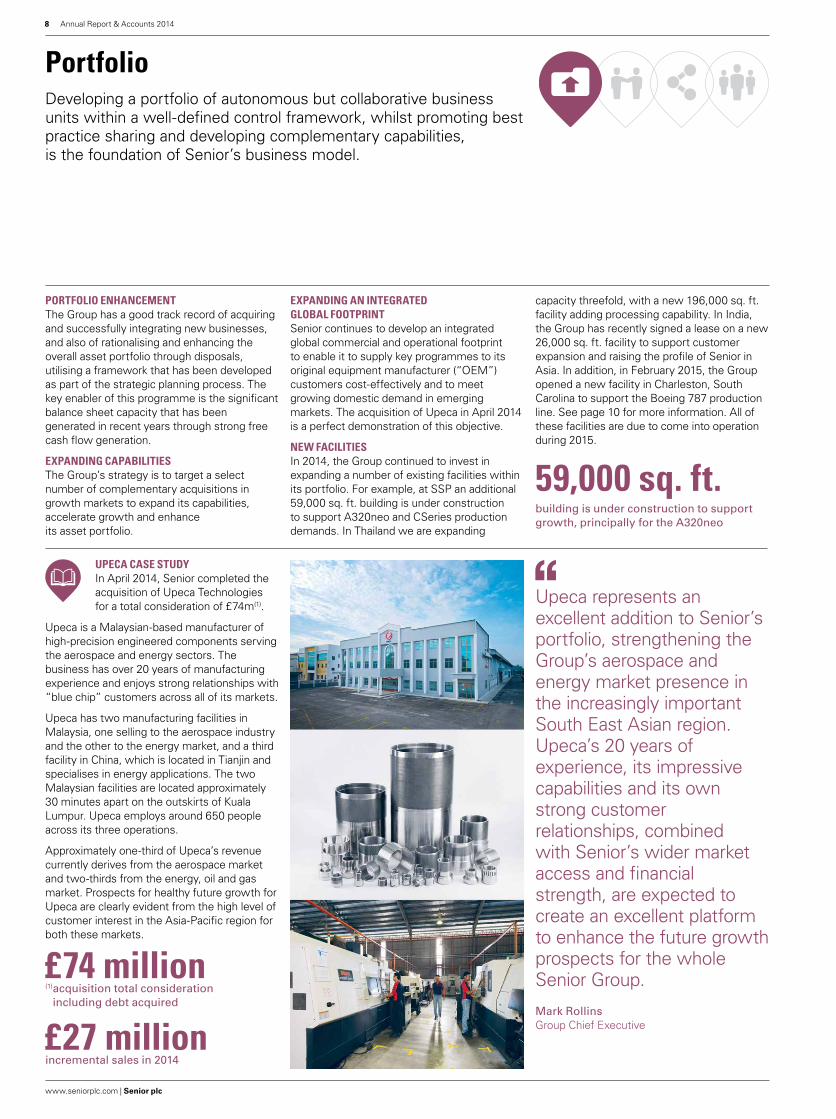
uPeCa Case studyIn April 2014, Senior completed the acquisition of Upeca Technologies for a total consideration of £74m(1).
Upeca is a Malaysian-based manufacturer of high-precision engineered components serving the aerospace and energy sectors. The business has over 20 years of manufacturing experience and enjoys strong relationships with “blue chip” customers across all of its markets.
Upeca has two manufacturing facilities in Malaysia, one selling to the aerospace industry and the other to the energy market, and a third facility in China, which is located in Tianjin and specialises in energy applications. The two Malaysian facilities are located approximately 30 minutes apart on the outskirts of Kuala Lumpur. Upeca employs around 650 people across its three operations.
Approximately one-third of Upeca’s revenue currently derives from the aerospace market and two-thirds from the energy, oil and gas market. Prospects for healthy future growth for Upeca are clearly evident from the high level of customer interest in the Asia-Pacific region for both these markets.
£74 million(1) acquisition total consideration
including debt acquired
£27 millionincremental sales in 2014
Developing a portfolio of autonomous but collaborative business units within a well-defined control framework, whilst promoting best practice sharing and developing complementary capabilities, is the foundation of Senior’s business model.
Portfolio
exPanding an integrated global footPrintSenior continues to develop an integrated global commercial and operational footprint to enable it to supply key programmes to its original equipment manufacturer (“OEM”) customers cost-effectively and to meet growing domestic demand in emerging markets. The acquisition of Upeca in April 2014 is a perfect demonstration of this objective.
neW faCilitiesIn 2014, the Group continued to invest in expanding a number of existing facilities within its portfolio. For example, at SSP an additional 59,000 sq. ft. building is under construction to support A320neo and CSeries production demands. In Thailand we are expanding
capacity threefold, with a new 196,000 sq. ft. facility adding processing capability. In India, the Group has recently signed a lease on a new 26,000 sq. ft. facility to support customer expansion and raising the profile of Senior in Asia. In addition, in February 2015, the Group opened a new facility in Charleston, South Carolina to support the Boeing 787 production line. See page 10 for more information. All of these facilities are due to come into operation during 2015.
59,000 sq. ft.building is under construction to support growth, principally for the A320neo
Upeca represents an excellent addition to Senior’s portfolio, strengthening the Group’s aerospace and energy market presence in the increasingly important South East Asian region. Upeca’s 20 years of experience, its impressive capabilities and its own strong customer relationships, combined with Senior’s wider market access and financial strength, are expected to create an excellent platform to enhance the future growth prospects for the whole Senior Group.
Mark RollinsGroup Chief Executive

9Annual Report & Accounts 2014
www.seniorplc.com | Senior plc
STRATEGIC REPO
RTG
OVERN
AN
CEFIN
AN
CIAL STATEM
ENTS
AD
DITION
AL IN
FORM
ATION
1 assess, prioritise and planSenior conducts comprehensive due diligence before acquiring a business and, once acquired, undertakes a baseline assessment against the Group’s standards for HSE. This involves identifying and assessing the top risks and establishing an improvement plan with measurable goals, timely action and clear accountability. Our initial focus is on ensuring that high risks are rigorously controlled and legal compliance is maintained.
2 resource and supportThe Group requires all its businesses to adequately resource HSE, and it is typical for a business joining Senior to appoint dedicated and professionally trained HSE advisers, if previously there were none. A variety of tools, training programmes and support is provided to assist new acquisitions develop their management of HSE, ensuring there is an assertive and timely pace of change. To sustain the improvement and fully integrate it within the business’s operating system, Senior requires all businesses to achieve the international environmental standard ISO 14001.
3 measure and reviewThe Group uses a variety of measures and metrics to monitor performance and to ensure the improvements identified in the initial review are progressing. Every business reports its HSE performance monthly to the Group HSE Committee, which is chaired by the Group Chief Executive. In addition to overseeing the alignment of new businesses with Senior’s HSE requirements, the HSE Committee is responsible for leading the Group’s HSE strategy, and managing Senior’s policies, standards and management framework for identifying, assessing, managing and reporting HSE risks.
aCquiring and enhanCing – hoW We drive safety and environmental imProvements in our aCquired businesses Senior has made a series of acquisitions since 2011 which have enhanced its portfolio. Post-acquisition, the Group invests heavily in improving and strengthening a newly acquired business and does this through a three-stage process.
A STEP-CHANGE IN SAFETy AT SENIOR AEROSPACE DAMAR
This year we have achieved some important milestones in our Zero Harm journey – over 500,000 hours injury free. Everyone is very proud of this achievement and there’s a real buzz about what more we can achieve.Charles ElderCEO Senior Aerospace Damar
When Senior acquired Damar Aerosystems in March 2011, it had an immature safety culture and Senior identified a number of areas for improvement. In the subsequent three years, the business has made significant improvement in its oversight of health and safety that has led to an 80% reduction in accidents. The newly appointed management team achieved this by first conducting a gap analysis against the Senior Group safety standards, appointing a Safety Co-ordinator and developing an improvement plan to bring all significant risks under control. The team initially focused on improving the highest risks: the safeguarding of machinery, employees working at height, and working in close proximity to forklifts. A Safety Committee was also established to lead the safety culture and engage employees in the safety improvement process by getting them to report near misses and contribute their ideas to make tasks safer. Considerable focus was also directed at preventing major incidents by learning from every near miss. A project was also launched to implement certificated management systems for environmental and safety affairs. These measures have been successful and through the commitment and engagement of all its employees, Damar has achieved ISO 14001.

Annual Report & Accounts 201410
www.seniorplc.com | Senior plc
oPtimising value and exCeeding exPeCtationsThe Group seeks to deliver competitive products utilising its engineering expertise to optimise customer value and exceed expectations whilst continuing to meet performance objectives.
This is achieved through advanced process engineering and excellent operational execution, leading to market differentiation and continued growth in organic revenue, operating margins and cash flow delivery.
targeted investmentInvestment is targeted in new product development, technologies and geographic regions, for markets having higher than average growth potential, to further enhance organic growth opportunities.
Many of the Group’s products are developed to help customers achieve their objectives for improved operating costs, particularly fuel efficiency in aircraft platforms and land vehicle engine applications, and to meet increasingly stringent global emission regulations. The Group’s level of investment in these growth areas and on expanding its geographic footprint, which now includes Thailand and China, continues to increase.
amt south Carolina exPansionSenior’s commitment to providing market-leading solutions to its customers was the primary objective
with the decision by the Group to expand operations to South Carolina. Senior has invested in a new 39,000 sq. ft. facility within close proximity to Boeing South Carolina, which will operate as an extension of Senior Aerospace AMT.
AMT South Carolina will initially focus on providing completed assemblies to Boeing delivered POU (Point of Use) and JIT (Just in Time) resulting in reduced shipping and logistics costs, lead times, and streamlined movement through the Boeing Supply Chain. The expansion created the opportunity for collaboration between Senior Aerospace and the customer to develop a cart delivery system which will reduce packaging costs and green waste. The business model provides the customer continuous “value added” services for existing work statements and positions AMT to extend the same and expanded benefits in supporting future work packages. The facility opened in February 2015.
Working with customers to provide market-leading solutions in the Group’s chosen principal markets is the primary objective of customer alignment.
Customer alignment
fuelling the fuel Cells – toWards a Zero Car Senior Flexonics Bartlett supplies fuel cell components that form
a critical role in fuel cells, helping to eliminate vehicle CO2 emissions significantly and reduce exhaust pollution. Fuel cells use an electrochemical process that take hydrogen gas, which can be introduced directly, or derived from natural gas or biogas, and generates electricity with up to 100% less CO2 than coal-fired power generation methods. Fuel cells emit virtually no pollutants such as nitrogen oxide, sulfur oxide, or particulate matter.
solar solutions – Contributing to sustainable solutionsSenior manufactures specialist RotationFlex® connectors that provide a critical function in the efficiency and reliability of solar power plants, being technology critical in the development of non-fossil fuel power.
The connectors, which are manufactured and designed by Senior Flexonics Germany, reduce CO2 emissions by 85%.
ProteCting the Plant – ProteCting against disasterSenior supplies vacuum pumps which provide a critical role in monitoring for environmental pollution at nuclear power plants and in post-accident cleanup. The vacuum pumps, which are designed and manufactured by Senior Aerospace Metal Bellows, play a vital role in protecting the environment and people from nuclear radiation around the world.
0
100
200
300
400
500
600
700
800
900
A350A380A330A320B787B777B737
$k
+7%
+3%
+3%
+5%
+10%+8%
+28%
Shipset value(1) progression – large commercial aircraft% CAGR
(1) Average based on programme share and estimated engine variant.
Dec-06 Dec-07 Dec-08 Dec-09 Dec-10 Dec-11 Dec-12 Dec-13 Dec-14
11Annual Report & Accounts 2014
www.seniorplc.com | Senior plc
STRATEGIC REPO
RTG
OVERN
AN
CEFIN
AN
CIAL STATEM
ENTS
AD
DITION
AL IN
FORM
ATION
oPerating ethiCally Senior is committed to conducting its business with integrity, honesty and fairness
and operating with the highest degree of ethical standards in everything it does. The cornerstone of management’s commitment to ethics is the Senior Code of Business Conduct that provides a clear framework for decision-making, highlighting the values and behaviours it expects its employees to demonstrate at all times.
The Code of Business Conduct applies Group-wide including to its agents and joint ventures. The Code defines standards in areas such as: anti-bribery, corruption and fraud, managing conflicts of interest and engaging in fair competition.
eduCating tomorroW’s WorkforCeEducation and skills, particularly Science, Technology, Engineering and Mathematics (“STEM”) are key to the future success of both Senior and its customers. Several Senior businesses focus their community activities on educational outreach programmes supporting local schools, technical colleges and universities. For instance, Senior Aerospace BWT works on STEM initiatives with several local schools. Two BWT employees are National STEM Ambassadors whose work includes supporting STEM Clubs in local schools, mentoring and supporting students with Career Academies, and helping students gain invaluable work experience through paid work placements.
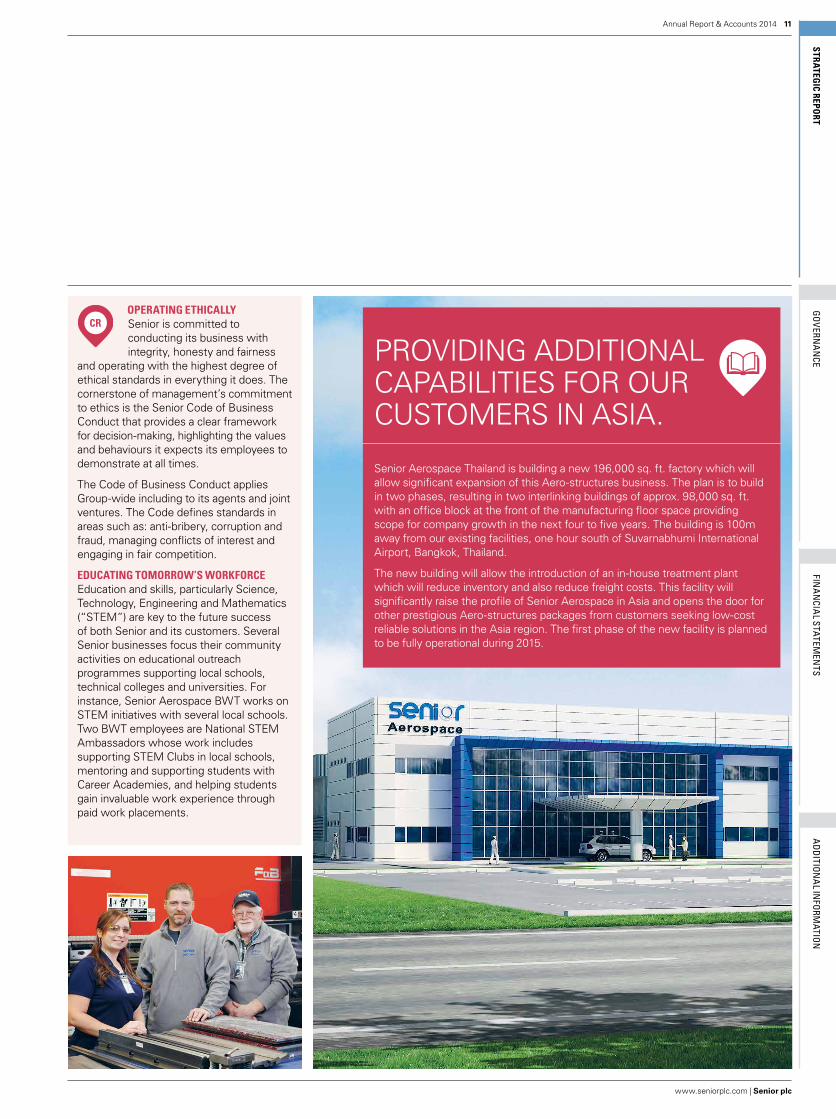
PROVIDING ADDITIONAL CAPABILITIES FOR OUR CUSTOMERS IN ASIA.
Senior Aerospace Thailand is building a new 196,000 sq. ft. factory which will allow significant expansion of this Aero-structures business. The plan is to build in two phases, resulting in two interlinking buildings of approx. 98,000 sq. ft. with an office block at the front of the manufacturing floor space providing scope for company growth in the next four to five years. The building is 100m away from our existing facilities, one hour south of Suvarnabhumi International Airport, Bangkok, Thailand.
The new building will allow the introduction of an in-house treatment plant which will reduce inventory and also reduce freight costs. This facility will significantly raise the profile of Senior Aerospace in Asia and opens the door for other prestigious Aero-structures packages from customers seeking low-cost reliable solutions in the Asia region. The first phase of the new facility is planned to be fully operational during 2015.

Annual Report & Accounts 201412
www.seniorplc.com | Senior plc
Senior’s long-standing emphasis on operational excellence is based on the principles of Lean, striving at all times for continuous improvement and the elimination of non-value-added activities and processes.
operational excellence
a bartlett kaiZen team signifiCantly imProved Welding yieldCustomer satisfaction is rated
by a company’s ability to drive waste out of its manufacturing processes in order to maintain competitiveness.
The Bartlett team focused on the Exhaust Gas Cooler manufacturing process in order to improve throughput to better satisfy customer demand.
In building a cooler, there are numerous metal-joining operations used to make this complex product. A typical process used is MIG welding, and it was determined that the first pass yield of this process was 98%, with the remaining 2% requiring time-consuming rework.
A Kaizen team collected data on the welding process to identify improvement opportunities using process mapping and Pareto analysis. The team then designed an experiment that considered the variables in the welding process and determined the root causes of any failures. Actions were taken to error-proof the process, leading to improving the yield to over 99.5%.
This result improved product quality and shop floor velocity, delivering better service for our customer. As a result, the Bartlett team was given the top Supplier Six Sigma Project Award by one of Senior’s largest customers.
looking after the environmentReducing the Group’s environmental impact helps to reduce cost and to improve
efficiencies and makes us more agile.
The Group’s main impacts on the environment are: energy consumption (and associated CO2 emissions), waste generation and recycling, and water consumption.
The Group’s objective is to improve energy efficiency by 10% between 2011 and 2015 and it remains on track to fulfil this goal. All of the Group’s operations develop energy conservation projects, tailored to their main energy consumption, and regularly monitor performance through energy usage. Senior’s Lean programme also continues to help to reduce energy demand by improving the efficiency of how the Group manufactures and streamlines the process to eliminate waste.
WasteIn 2014, the total amount of waste generated by the Group was 13,358 tonnes, a 10% increase on the 2013 levels (12,124 tonnes). It should be noted, however, that 2014 includes the additional Upeca businesses, acquired in April 2014. On a comparative basis, adjusted for acquisitions, the 2014 level is slightly lower at 12,048 tonnes.
Over three-quarters of Senior’s waste material is recycled and the Group continues to design out the waste or find alternative ways to reuse the material.
WaterDue to the addition of Upeca, the Group’s water usage has increased in 2014 from 276 megalitres to 314 megalitres. After adjusting for acquisitions, further improvements have been made in water conservation, resulting in an underlying 8% reduction in water consumption. When normalised to sales, the Group’s water usage reduced to 0.33 megalitres per £m sales (2013 – 0.36).
iso 14001Across the Group, 93% of its manufacturing locations are certified to the ISO 14001 environmental management standard and the remainder, all of which are businesses acquired in the last three years, are in the process of obtaining certification.
Co2 to turnover (tonnes of Co2 emitted per £m revenue)
07 08 09 10 11 12 13 14
110104 99 97 94 92
85 87*
* 79 excluding newly acquired businesses.
Continuous imProvementThe Group has achieved great progress in this area in recent years, driving value creation through the implementation of its operational excellence initiatives based around Lean principles and sustained superior performance in the eyes of its customers.
Each operation is challenged to deliver operational improvements as part of the annual planning cycle, using Kaizen events and other Lean practices to reduce costs, improve product flow and velocity and optimise use of resources.
Engineering teams at multiple locations are currently identifying technical improvements
in CNC machine programs and cutter technologies to speed throughput benefiting capacity load and lead times. Value stream mapping activities are frequently undertaken to reduce set-up time, manufacturing lead times and inventory levels. A good example of this is at Senior Flexonics Bartlett (see bottom left).
good governanCeGovernance procedures are designed to allow each operation to embrace and manage operational excellence effectively, and to comply with all legal and regulatory requirements, without imposing an unnecessary administrative burden. They also aim to ensure that employees act at all times safely, with integrity and in an ethical manner.

13Annual Report & Accounts 2014
www.seniorplc.com | Senior plc
STRATEGIC REPO
RTG
OVERN
AN
CEFIN
AN
CIAL STATEM
ENTS
AD
DITION
AL IN
FORM
ATION
environmental imProvements at senior aerosPaCe Weston Since joining Senior in late 2011, Weston has transformed the way
it manages its environmental affairs and significantly reduced the business’s environmental impact. After appointing its first Health, Safety and Environmental Manager in 2012, the management team undertook a comprehensive review of its environmental impacts and launched a number of improvement goals. The business focused on their three most significant environmental impacts: the high amount of landfill waste created as a by-product of its manufacturing process; its inefficient and old manufacturing facilities and the high use of industrial solvents for vapour degreasing of the products.
By designing out waste throughout the manufacturing process, alongside finding alternate use for all of the different waste materials, Weston has now achieved its
goal of zero landfill – all waste materials are recycled or recovered. Weston also set about replacing the use of solvent with an environmentally friendly product and by the end of 2014, had introduced aqueous cleaning for degreasing of parts, eliminating over five tonnes of solvents per year. In 2013, the business also moved into a purpose-built manufacturing facility that incorporated a number of energy efficiency measures, such as low energy lighting and heating system. The move consolidated manufacturing from four inefficient Victorian buildings into one state-of the-art building.
Senior Weston has now implemented an environmental and safety management system accredited to the international standard ISO 14001 and OSHAS 18001 to ensure the improvement programme is fully integrated within the business and sustained for future years.
Weston is sited in an area of outstanding natural beauty and we have deep roots in the community. Caring for the environment is part of our ‘licence to operate’.Bob BrownridgeSenior Aerospace Weston
SAFETy FOCUSED
In 2014 Senior introduced a Zero Harm programme to strengthen its safety culture and to help further reduce the number and seriousness of workplace health and safety incidents. Through the programme, the Group aims to “make safety personal” to every employee and improve the focus on accountability and behaviours. The programme incorporates a number of components manufactured by the Group.
At the core of our programme is a set of 10 Golden Rules that apply globally across Senior operations. These simple rules provide a concise and consistent level of control of the highest risks present in our businesses. The rules have been translated into the 12 common languages used across the Group and are implemented by each business.
To strengthen the understanding of safety duties and obligations amongst the Group’s line managers, a tailor-made course was developed in 2014. The “Leading for Safety” course focused on safety leadership techniques and behavioural intervention along with Senior’s 10 Golden Rules. The Group is committed to ensuring all line managers with safety responsibilities receive this training by the end of 2015. After the training each manager is required to make a personal commitment to safety with measurable improvement goals.
The third component involves improving the conformity with Senior’s technical standards for HSE. These global standards are developed for the common HSE hazards and form the basis of our internal HSE audit programme. HSE audits have been conducted against these standards and improvements continue.
We have also improved the attention given to establishing effective near miss incidents. Senior has developed a near miss toolkit and guidance to enable more operations to introduce the process.
Annual Report & Accounts 201414
www.seniorplc.com | Senior plc
Developing the capabilities and competencies of Senior’s employees to meet tomorrow’s customer requirements is critical to the future success of the Group.
People
emPoWered loCal managementThe Group benefits from having empowered, entrepreneurial and highly engaged local management. As much authority and responsibility as possible, within a well-defined control framework, is devolved to the senior management team at each of our operations. This culture of empowerment and autonomous collaboration, along with the strong reputation of the Group, helps attract and retain experienced senior executives from within the industry.
valuesSenior’s values of operating with integrity and in a respectful and ethical manner, along with entrepreneurial spirit, guide our people in the judgements, actions and decisions they make each day. This is underpinned by our “tell it as it is” philosophy.
develoPing our PeoPle The Group’s employees are one of its most valuable assets, with the financial and operational progress made during 2014, and earlier years, largely due to their hard work and dedication. The delivery of our strategy depends on the right people, skills and capabilities being in place. Each of Senior’s businesses is responsible for continuously developing its people and the skills and training needs of employees are typically reviewed through a performance review and development process. Senior continues to increase its investment in developing people at all levels of the organisation, and in addition to local training and development, Senior has expanded the Group Development Programme
and health and safety training, as detailed below. Employee development, together with a renewed emphasis on the recruitment and succession planning processes, will remain an important focus for the Group in the future.
grouP develoPment ProgrammeThe quality of Senior’s people is a core competency of the Group and how it recruits, trains and motivates its staff is pivotal. Since 2009, Senior has operated a Group Development Programme aimed at developing mid- to senior-level managers so that they acquire the broader skills essential to operate at higher management levels. The training provides an intensive learning and development forum for current high-potential senior managers. During 2014, we introduced three new courses: Programme Management – to enhance our capabilities to support the increasing complexity of successfully managing multiple projects with the Group’s customers; Fast Track Advanced Management Programme – a modified Ashridge Business School open programme for our future leaders focusing on developing key skills and knowledge across four central themes of providing leadership, making the most of people, driving growth and realising results, and setting direction; and Driving Innovation – a tailored programme developed with Ashridge Business School to enhance the capabilities of our Divisional Management and Operational CEOs to support innovation, collaboration and growth within the Group and to explore commercial insights and opportunities for the Group in the context of collaborative autonomy.
resPonding to the oso disaster The Oso landslide on 22 March 2014 occurred close to Senior‘s
Washington State businesses and directly affected many employees of Senior Aerospace businesses in the northwest of the USA. The landslide wreaked havoc in seconds, killing 43 people and destroying many homes. Senior Aerospace AMT supported the emergency services, serving as a major hub and collection point for emergency supplies and charity donation, ensuring the emergency crews working in the disaster received what they needed, such as shovels and chainsaws, along with much-needed support for the communities and homeless families.
Caring for our assets
This year, Senior Aerospace BWT introduced a wellness programme to improve the health of its employees. This has involved promoting healthy living and community awareness across its family of employees. A number of initiatives have been introduced to support these aims, including the provision of free fresh fruit in the workplace and a series of on-site wellbeing clinics provided by occupational health.
BWT has also combined the Healthy Living theme with enhancing awareness and support of the local community by encouraging and supporting employees and their families across Senior in the UK to take part in one of two Stockport-based charitable sporting events in association with Life Leisure (a not-for-profit social enterprise company and registered charity). As part of this activity, over 60 employees from Senior Weston, BWT, and Bird Bellows participated in the Big Stockport 10k Run.

15Annual Report & Accounts 2014
www.seniorplc.com | Senior plc
STRATEGIC REPO
RTG
OVERN
AN
CEFIN
AN
CIAL STATEM
ENTS
AD
DITION
AL IN
FORM
ATION
equality and diversity As a global business, Senior employed 7,405 people at the end of 2014 (2013 – 6,655)
in 14 countries; its management grades alone comprise over 16 nationalities. Diversity is therefore an integral part of how Senior operates. To achieve this, the Group promotes a policy of equal opportunity in employment and believes that employment-related decisions should always be based on relevant aptitudes, skills and abilities. The Group promotes this policy, without unlawful consideration of sex, race, nationality, age, disability, religion or any other category protected by law.
diversity
A B C
81 86 86
14 1419
Num
ber o
f em
ploy
ees
%
ProteCting our PeoPle Safety standards strengthen our business by producing higher-performing teams, lowering
costs and creating more resilient operations.
The Board’s commitment to safety starts with the Group Chief Executive who chairs the HSE Committee, setting the Group’s objectives for safety.
All operations are required to prepare an improvement plan for HSE to further progress their safety and environmental performance.
safety record over the past five years
10 11 12 13 14
3.753.59 3.48
2.97 2.94
1.600.98
1.360.95 1.13
Female Male
A Total GroupB Executive CommitteeC PLC Board
Accidents per 100 employees
Lost Time Accidents per 100 employees
INVESTING IN LOCAL COMMUNITIES
The Group actively encourages its businesses to invest and support local communities and sponsor good causes that are relevant to their business. These relationships are normally managed at a local level, where the employees typically select charitable interests within their community. In some cases, our businesses will make direct financial contributions, sponsor or participate in charitable events. For example, Senior Flexonics Cape Town provides financial support to the Carel du Toit Centre, a local charitable school supporting children with hearing disabilities through direct contribution and matching employees’ contributions. Similarly, Senior Aerospace Ketema supports the Paediatric Cancer Research Foundation, an organisation that funds and supports the research into paediatric cancer.
Senior also encourages its employees to personally support local good causes that are important to them, as we believe involving employees in community activities helps to build team spirit and maintain a positive working culture. For example, Senior Aerospace Bird Bellows works in partnership with “Friends For Leisure”, a UK charity providing leisure activities for disabled young people from the Cheshire area. The business sponsors its apprentices to participate in social activities with disabled children from the local community, providing an invaluable opportunity for the disabled youngsters to mix with other people around their age and get involved in a variety of different activities.
Similarly, employees of Senior Flexonics Canada provide support by volunteering their time to serve hot meals to members of society experiencing hardship and also arranging food banks on-site. These are often long-standing relationships which strengthen employees’ connections with their communities and improve their understanding of the difficulties that others who are less fortunate experience. Many Senior businesses raise charitable funds through sports, such as Senior Flexonics Bartlett which sponsored 40 of its employees to run in the 2014 Mill Race Marathon, an annual event in Chicago attracting over 7,000 runners. The business was a Platinum sponsor for the race and supported the race with donations and sponsorship totalling $16,000. Some Senior businesses also engage their local charities in their supply chain, such as Senior Aerospace Composites that appoints Starkey, a Kansas non-profit-making organisation that supports individuals with developmental disabilities, to help manage its waste segregation and recycling programme. Senior’s three businesses in Washington state, Senior Aerospace AMT, Absolute and Damar focus their efforts through the United Way charitable programme. Through a mixture of employee pledges, charity events and corporate sponsorship $140,000 was raised for local good causes. The employees of all three businesses are also active in the United Way Days of Caring, giving up their time to participate in community restoration projects. This year, their focus was to support Darrington, a community badly affected by the Oso landslide.

Annual Report & Accounts 201416
www.seniorplc.com | Senior plc
strategic objectives
strategic objectives delivering strategy
Structures
•Extend customer value proposition via increased collaboration across the Group
•Place significant internal emphasis upon utilisation of internal low-cost Countries such as Malaysia, Thailand and Mexico
•Continue to focus on operational excellence to drive customer satisfaction and increase market share
•Develop capabilities and build a business of increased scale in South East Asia including the expansion of process capabilities to enhance added value for customers
• Invest in new technologies necessary for substantial growth
•New programme wins with significant aircraft OEMs have resulted from leveraging existing relationships within the Group
•Capabilities increased at facilities in lower cost countries, and in support of a key customer, a new Senior Aerospace facility in Charleston, South Carolina opened in February 2015
•On-time delivery improvements have been achieved through continuous focus on key measures and the execution of improvement programmes
•New manufacturing facility under construction in Thailand for expansion of Structures operation in South East Asia which will include a specialist treatment capability
•Senior Aerospace is partnering with the AMRC (Advanced Manuafacturing Research Centre) at the University of Sheffield for the development of the latest machining and manufacturing techniques. Additionally support for additive manufacturing is ongoing with the MTC (Manufacturing Technology Centre) Coventry
Fluid conveyance systems
•Continue to develop products for new platforms• Further develop strategic customer relationships•Successful execution of new development programmes•Expand engineered product portfolio•Acquire new or adjacent technologies
•Development contracts for ducting components secured for the engines that will power the A320neo, A350 and B737 MAX. The A320neo and the A350 are due to enter service in 2015 and the B737 MAX in 2017
•A targeted approach with strategic OEM’s and tier 1 customers which have generated multi operation opportunities across Senior Aerospace
•Continued investment in engineering and programme management is ensuring new programmes enter production profitably and in line with customer milestones
•Additional focus has been given to engineering collaboration across the Group resulting in a more formalised approach with potential additional capabilities and product offerings under consideration
•New facilities at SSP are due to start production during 2015 in order to satisfy increased customer demand
Gas turbine engines
• Target higher value-added engineered or flight critical parts (e.g. rotating)
•Develop cross-business customer relationships• Further develop low-cost country footprint•Secure additional content on engines for next generation
narrow-body and wide-body commercial aircraft•Expand process capabilities via new technology investment
• First rotating parts in production as part of an outsourcing contract from a significant manufacturer. A centre frame product was manufactured by Ketema in support of the B737 MAX engine development
• Collaboration and technology sharing between an increasing number of operations is delivering new opportunities
• Further investment in Thailand and Malaysia has resulted in additional opportunities being developed with existing and new customers
• Investment in specific improvement projects with the AMRC noted above also supports our activities in gas turbine engines
Land vehicle emission control
•Develop product portfolio as emission regulation thresholds increase globally
•Build programmes with new truck and off-highway customers• Invest further in emerging market footprint, in growth markets• Investment in passenger car niches to support development of
global platform capabilities
•Development of a new design heavy-duty cooler has resulted in orders for natural gas applications as well as mid-range and smaller engine applications
•Developed and launched the state-of-the-art Flex-A-Fin® EGR cooler• Launched engine tube manufacture in India and now quoting on global programs out
of Olomouc, Mexico, Brazil and China•Presence of China JV assisted in the award of exhaust flexes which will also be
satisfied by our operations in Cape Town and Brazil• The production of common rails and exhaust flexes has commenced within China
and is expected to increase during 2015•New programme wins mean the Group’s French land vehicle operation is expected
to see continued improving financial performance in the future
Industrial process control
•Expand global presence as emerging markets add local hydrocarbon refining and processing facilities
•Secure growth from tightening emission standards in developed markets
•Seek proprietary adjacent products•Participate in new technology developments and applications
(e.g. combined heat and power fuel cells, concentrated solar power, micro turbines)
•Secure new major process projects as their capital funding becomes available
•Acquired Upeca adding product and geographic offering
•Secured and started delivery on two major Catofin projects. One in South Korea and one in Houston, USA secured several large international damper orders
•Developed a proprietary heat exchanger for Waste Heat recovery systems•Developed fuel system components for Natural Gas engines•Supplying key components to several fuel cell manufacturers and micro turbine
suppliers in both Europe and North America•Collaboration between Group operations in USA, Canada and Brazil is resulting in
improved competitiveness and broadening of product offerings• Increase in new work awarded as a result of tightening emission regulations leads
to additional damper and fabric expansion joint contracts•Developed and successfully testing new system to replace ball joints in existing solar
energy plants
The application of the Group’s four key elements of value creation has resulted in the development of the following strategic objectives in each of the Group’s five key market sectors. The Group’s progress against these objectives is also included in the table below:

17Annual Report & Accounts 2014
www.seniorplc.com | Senior plc
STRATEGIC REPO
RTG
OVERN
AN
CEFIN
AN
CIAL STATEM
ENTS
AD
DITION
AL IN
FORM
ATION
risks and uncertainties
integrated risk management and grouP risk PhilosoPhyThe Board is ultimately responsible for managing risk, and for the implementation of effective risk management procedures and internal control systems. Across the Group, these are designed to align with the UK Corporate Governance Code’s guidance on Risk Management and Internal Control. The Audit Committee is responsible for reviewing the effectiveness of the Group’s internal control systems that were in operation during the year, and the fulfilment of this responsibility is described in the Audit Committee report on pages 40 to 43.
An integrated risk management framework continues to evolve within the Group, aimed at improving the efficiency and effectiveness of the Group’s risk management procedures. Senior’s risk philosophy, embodied in a Risk Philosophy Statement which has been rolled out across the Group, is based around an acknowledgement that profits are in part the reward for risk taking, and therefore risk should be embraced and managed effectively within each business unit. The Group aims to take a relatively conservative approach to risk management, targeting a developmental approach that is evolutionary rather than revolutionary. Pursuit of opportunities is encouraged, within an effective risk management framework, as an essential component of a high-performance culture. It is acknowledged that strong risk management procedures are likely to enhance senior leadership decision-making capabilities, strengthen accountability and enhance stewardship of the Group’s assets. In turn this can be expected to result in management
teams being able to embrace increased levels of risk and pursue more opportunities, which should also allow the Group to increase its rate of performance delivery without exceeding its risk appetite.
The Group aims to embed its risk management procedures within its existing business processes and corporate governance structure, rather than impose an inefficient administrative burden on its operations. At a minimum, the Group aims to ensure that any individually significant event that:
1. has or may result in the potential to compromise its ability to achieve its objectives; or
2. could lead to a material breach of policies and procedures; or
3. could impact the delivery of earnings materially at a local operational level
is identified, reported on and dealt with through the Group’s risk management procedures.
risk assessment and risk rePorting ProCeduresThe Group has a well-established annual process for identifying, evaluating and managing its significant risks. This process starts in April each year with a risk review and assessment conducted at each of the Group’s operations, facilitated by local senior management. A Principal Risk list is generated from each review, with individual risks assigned to the categories of Strategic, Operational, Compliance or Financial Reporting in nature. Local management is required to record details of controls that are in place to mitigate each
risk, make an assessment of the residual likelihood and impact of each risk having a material impact on the operation’s ability to achieve its objectives, and to record any improvement measures that are targeted to strengthen the operation’s internal control environment around each risk. The results of these reviews are consolidated at divisional level with an accompanying divisional overlay, and divisional Principal Risk lists are then reviewed by the Executive Committee.
Following review by the Executive Committee, a risk questionnaire is compiled and circulated to each Board member, who is required to make an individual assessment of the potential significance of each risk. Completed questionnaires are reviewed and discussed at the Group’s June Board meeting, following which a Group Principal Risk list is compiled and presented for review and discussion by the Board at the July Board meeting. The final step in the process is an update of all Principal Risks as part of the annual budget-setting process and ultimately presented to the Board at its January meeting. In between formal updates, the Board monitors progress in the management of individual risks via ongoing regular executive and divisional reporting procedures and review and discussion at Board meetings.
PrinCiPal grouP risksOverall, the Group’s risk profile was largely unchanged in 2014 when compared to 2013. The principal potential risks and uncertainties, together with actions that are being taken to mitigate each risk, are set out overleaf.
the board Key Responsibilities• Has overall responsibility for ensuring the Group
risk management process and systems of internal control are robust and continuously monitored
• Formulates the Group’s Strategy and defines the Group’s Risk Appetite & Culture
• Monitors the nature, extent and management of risk exposure for the Group’s Principal Risks
• Provides direction and sets the tone on the importance of risk management
Board Sub Committee’s perform oversight activities in line with their Terms of Reference
grouP audit Committee• Supports and challenges the Board in monitoring risk
exposure in line with its Terms of Reference
• Reviews the effectiveness of the Group’s risk management & internal control systems
Independent Assurance – the 3rd line of Defence
• Remuneration Committee
• Nominations Committee
• HSE Committee
• Treasury Committee
• External Audit
• Group Internal Audit
• Other External Assurance
exeCutive Committee divisional management Operational Oversight – 2nd line of Defence• Development and implementation of strategy,
operational plans policies, procedures and budgets
• Monitoring of operating and financial performance
• Assessment and control of risk – including emerging risks
• Prioritisation and allocation of resources
grouP CorPorate funCtions• Lead and co-ordinate Group Risk and Control
related processes.
• Assesses and supports the Group in mitigating the Group’s risks including: policies and procedures, specialist support, control self assessments and business reviews
business units Operational Management – 1st line of Defence• Business Units identify, assess and mitigate
their key risks.
• Risk Assessments are reviewed and discussed by Divisional Management.
Oversight & Independent Assurance Risk Ownership & Control
Executive CommitteeDivisional Management
Group Corporate Functions
The Board
Group Audit Committee
Business Units
risk management frameWorkTop Down and Bottom Up Approach on RiskOversight from the Board and Executive Committee on all Risk Identification, Assessment and Mitigation is undertaken at all levels within the Group
Three Lines of Defence on AssuranceThe Third Line of Defence – Independent AssuranceThe Second Line of Defence – Oversight ActivitiesThe First Line of Defence – Operational Management

Annual Report & Accounts 201418
www.seniorplc.com | Senior plc
risks and uncertainties continued
risk management actions to mitigate risk
New aircraft platform delays
Significant shipset content has been secured on a number of new aircraft platforms currently under development or in initial phases of production. These include the Airbus A350, A320neo, the Boeing 737 MAX, Bombardier’s CSeries regional jet and L85 business jet. Delays in the launch or ramp-up in production of these platforms could have a material adverse impact on the Group’s rate of organic growth.
Note: On 20 January 2015, the Group was notified by Bombardier of the decision to suspend, for an indefinite period of time, the development of its L85 business jet programme.
•The Group monitors programme development and launch timing of new aircraft platforms very closely, utilising internal customer relationships and market intelligence.
•A cautious approach is taken to both capital investment in new programmes, to minimise the time between installation and utilisation of new capital equipment, and to the projected build rates and associated revenue in financial projections.
•The growing breadth of Senior’s exposure to a comprehensive and diverse range of aerospace and land vehicle platforms, together with its broad exposure in global industrial markets, means that the Group’s future organic growth profile is not overly dependent on any individual new aircraft platform.
Importance of emerging markets
Customers’ desire to move manufacture of components to lower-cost countries could render the Group’s operations uncompetitive and have an adverse impact on profitability. In addition, certain customers require global programme support as they respond to increasing domestic demand in a number of these emerging markets.
•The Group’s strategy of developing a portfolio of high value-added engineering manufacturing companies has meant that over time it has generally evolved away from products where the direct threat of lower-cost country manufacture is significant.
•The Group successfully employs a strategy of retaining commercial and engineering expertise close to customers’ locations, principally in North America and Europe. This enables effective support to be readily given to its customers, whilst increasing manufacturing at above-average growth rates in lower-cost country locations where it makes sense to do so and with customer agreement.
•The Group has an increasing presence in emerging markets via its facilities in Mexico, Thailand, Czech Republic, South Africa, Brazil, India and China. This footprint was expanded during 2014 with the acquisition of Upeca, with operations in Malaysia and China.
•Each of these operations, individually and in combination, has a healthy number of viable opportunities for further expansion either to supply domestic markets or to support customers’ increasingly global needs.
Price-down pressures
Customer pricing pressure is an ongoing challenge within our industries, driven by the expectations of airlines, land vehicle operators and governments seeking to purchase more competitively priced products in the future. This will continue to put pressure on the Group’s future operating margins.
•The Group works closely with its customers to find innovative ways to produce products at a lower cost thus helping them to meet pricing challenges.
•The Group is able to consider bundles of products that in total help achieve customer pricing challenges.
•Where appropriate, the Group is able to pass work to some of its lower-cost facilities such as Mexico, Thailand, Czech Republic, South Africa, Brazil, India, China and Malaysia with a view to help satisfy customer challenges.
Acquisitions
Failure to execute an effective acquisition programme would have a significant impact on the Group’s ability to generate long-term value for shareholders.
•Consistently strong free cash flow generation gives the Group capacity to continue to execute a targeted acquisition programme.
•The Group has a well-established acquisition framework that includes proven valuation, due diligence and integration processes.
•Post-acquisition reviews are performed on key acquisitions, comprising a full retrospective review of each deal process, integration effectiveness, operational performance compared to expectation and sharing of lessons learned with the Board and across the senior management team.
Strategy
An appropriately formulated, communicated and effectively executed strategy is essential in order to avoid the risk of inappropriate allocation of resources and failure to deliver on long-term performance goals.
•Focus is placed on the strategic planning process, to ensure that the Group formulates the most appropriate strategy to capitalise, over time, on the significant breadth of potential growth opportunities in its chosen market sectors.
•The process includes regular strategy sessions at operational, Executive Committee and Board level.
Increased risk Decreased risk Constant risk

19Annual Report & Accounts 2014
www.seniorplc.com | Senior plc
STRATEGIC REPO
RTG
OVERN
AN
CEFIN
AN
CIAL STATEM
ENTS
AD
DITION
AL IN
FORM
ATION
risk management actions to mitigate risk
Programme participation
Long-term growth in demand, including participation in future development programmes in the Group’s major markets, is an essential foundation for future growth. Failure to secure profitable new programme wins could have a severe impact on the Group’s long-term performance.
•The Group has developed a portfolio of businesses that are exposed to markets which exhibit fundamental long-term growth characteristics.
•Customer value is driven through constructive and co-operative relationships with key customers in each market, providing innovative customer solutions and quality products delivered on time and in line with specifications.
•The Group ensures that its operations are sufficiently well capitalised to be able to bid competitively on new programme opportunities, and maintains close control over operating costs to ensure that operations remain competitive on existing programmes.
•The Group utilises an internal contract approval process, comprising both financial and non-financial analyses, to ensure that bids are submitted and won at acceptable margin levels.
Employee retention
An inability to attract, develop and retain high-quality individuals in key management positions could severely affect the long-term success of the Group.
•Capable, empowered and highly engaged individuals are a key asset of the business. The strong reputation of the Group helps attract experienced senior executives from within the industry.
•The Group sponsors the development and training of key managers, at all levels, through an increasingly comprehensive in-house management development programme.
•Senior management turnover ratios remain low, a further indication of success in this important area.
Corporate governance breach
Corporate governance legislation (such as the UK Bribery Act and the US Foreign Corrupt Practices Act), regulations and guidance (such as the UK Corporate Governance Code and global health and safety regulations) are increasingly complex and onerous. A serious breach of these rules and regulations could have a significant impact on the Group’s reputation, lead to a loss of confidence on the part of investors, customers or other stakeholders and ultimately have a material adverse impact on the Group’s enterprise value.
•The Group has well-established governance policies and procedures in all key areas, including a Group Code of Business Conduct, anti-bribery procedures, a Health and Safety Charter, and various policies and procedures over the review and reporting of risk management and internal control activities.
•The Group Finance Director, the Group Company Secretary and the Head of Internal Audit collectively retain principal responsibility for reviewing governance changes that may have an impact on the Group.
•Governance updates are provided to the Board and Executive Committee at appropriate intervals, and to key operational management. Recent examples of developments in this area include formulation of a Business Continuity Framework, IT Policy Guidelines, and anti-bribery training.
Financing and liquidity
The Group could have insufficient financial resources to fund its growth strategy or meet its financial obligations as they fall due.
•The Group’s overall treasury risk management programme focuses on the unpredictability of financial markets, and seeks to minimise potential adverse effects on the Group’s financial performance.
•Compliance with financial policies and exposure limits are reviewed by the Group’s Treasury Committee on a regular basis.
•The Group enters into forward foreign exchange contracts to hedge the exchange risk arising on operations’ trading activities in foreign currencies, however, it does not enter into or trade financial instruments, including derivative financial instruments, for speculative purposes.
•The Group manages liquidity risk by maintaining adequate reserves, banking facilities and reserve borrowing facilities, and by continuously monitoring forecast and actual cash flows, matching the maturity profiles of financial assets and liabilities and paying close attention to the projected level of headroom under the covenants contained in its committed borrowing facilities.
•During 2014 cash conversion remained strong and a tranche of private placement debt was repaid in October. The Group also renegotiated its £60m revolving credit facility, which was due to expire in 2016, achieving an extension to 2019 on more commercially favourable terms.
For further details see Note 20.
Global cyclical downturn
The potential adverse impact on the Group of significant demand declines in key markets arising from the consequences of either future sovereign debt issues, ongoing government austerity measures, and/or political instability remains significant.
•The Group is well positioned in its key aerospace, industrial, and emission-related sectors of land vehicle markets, where increasingly stringent legislation should ensure that long-term demand for the Group’s products remains healthy.
•Through diversity of its end-market exposures and a robust financing position, the Group remains well placed to be able to withstand potential negative consequences that may arise from a further global cyclical downturn.
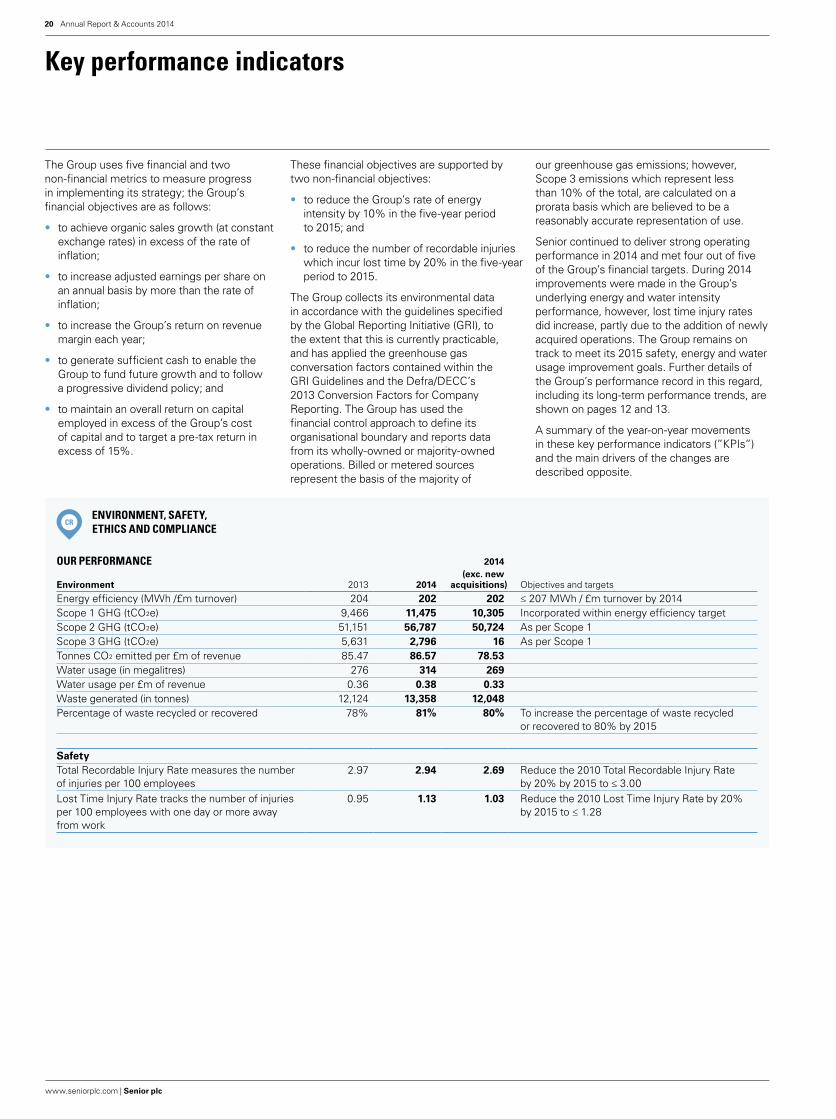
Annual Report & Accounts 201420
www.seniorplc.com | Senior plc
key performance indicators
our greenhouse gas emissions; however, Scope 3 emissions which represent less than 10% of the total, are calculated on a prorata basis which are believed to be a reasonably accurate representation of use.
Senior continued to deliver strong operating performance in 2014 and met four out of five of the Group’s financial targets. During 2014 improvements were made in the Group’s underlying energy and water intensity performance, however, lost time injury rates did increase, partly due to the addition of newly acquired operations. The Group remains on track to meet its 2015 safety, energy and water usage improvement goals. Further details of the Group’s performance record in this regard, including its long-term performance trends, are shown on pages 12 and 13.
A summary of the year-on-year movements in these key performance indicators (”KPIs”) and the main drivers of the changes are described opposite.
The Group uses five financial and two non-financial metrics to measure progress in implementing its strategy; the Group’s financial objectives are as follows:
• to achieve organic sales growth (at constant exchange rates) in excess of the rate of inflation;
• to increase adjusted earnings per share on an annual basis by more than the rate of inflation;
• to increase the Group’s return on revenue margin each year;
• to generate sufficient cash to enable the Group to fund future growth and to follow a progressive dividend policy; and
• to maintain an overall return on capital employed in excess of the Group’s cost of capital and to target a pre-tax return in excess of 15%.
These financial objectives are supported by two non-financial objectives:
• to reduce the Group’s rate of energy intensity by 10% in the five-year period to 2015; and
• to reduce the number of recordable injuries which incur lost time by 20% in the five-year period to 2015.
The Group collects its environmental data in accordance with the guidelines specified by the Global Reporting Initiative (GRI), to the extent that this is currently practicable, and has applied the greenhouse gas conversation factors contained within the GRI Guidelines and the Defra/DECC’s 2013 Conversion Factors for Company Reporting. The Group has used the financial control approach to define its organisational boundary and reports data from its wholly-owned or majority-owned operations. Billed or metered sources represent the basis of the majority of
environment, safety, ethiCs and ComPlianCe
our PerformanCe 2014
Environment 2013 2014(exc. new
acquisitions) Objectives and targets
Energy efficiency (MWh /£m turnover) 204 202 202 ≤ 207 MWh / £m turnover by 2014 Scope 1 GHG (tCO2e) 9,466 11,475 10,305 Incorporated within energy efficiency target Scope 2 GHG (tCO2e) 51,151 56,787 50,724 As per Scope 1 Scope 3 GHG (tCO2e) 5,631 2,796 16 As per Scope 1 Tonnes CO2 emitted per £m of revenue 85.47 86.57 78.53Water usage (in megalitres) 276 314 269Water usage per £m of revenue 0.36 0.38 0.33Waste generated (in tonnes) 12,124 13,358 12,048Percentage of waste recycled or recovered 78% 81% 80% To increase the percentage of waste recycled
or recovered to 80% by 2015
SafetyTotal Recordable Injury Rate measures the number of injuries per 100 employees
2.97 2.94 2.69 Reduce the 2010 Total Recordable Injury Rate by 20% by 2015 to ≤ 3.00
Lost Time Injury Rate tracks the number of injuries per 100 employees with one day or more away from work
0.95 1.13 1.03 Reduce the 2010 Lost Time Injury Rate by 20% by 2015 to ≤ 1.28
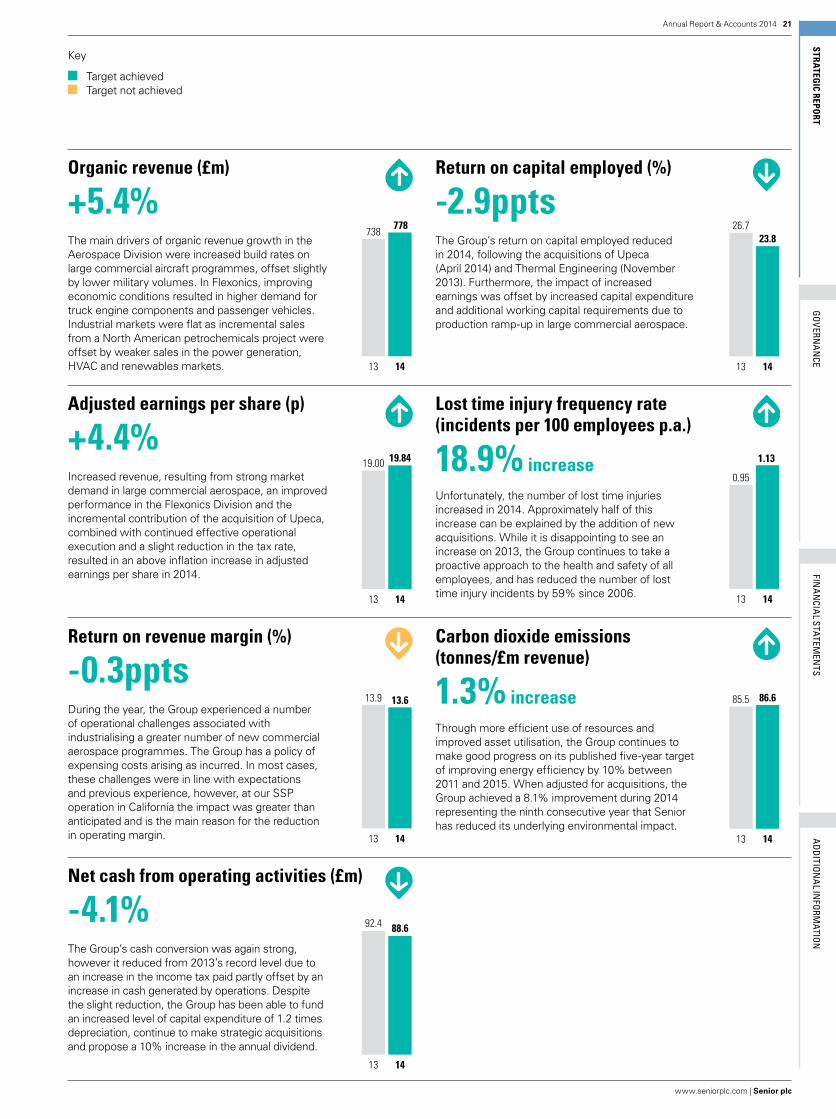
21Annual Report & Accounts 2014
www.seniorplc.com | Senior plc
STRATEGIC REPO
RTG
OVERN
AN
CEFIN
AN
CIAL STATEM
ENTS
AD
DITION
AL IN
FORM
ATION
organic revenue (£m)
+5.4%The main drivers of organic revenue growth in the Aerospace Division were increased build rates on large commercial aircraft programmes, offset slightly by lower military volumes. In Flexonics, improving economic conditions resulted in higher demand for truck engine components and passenger vehicles. Industrial markets were flat as incremental sales from a North American petrochemicals project were offset by weaker sales in the power generation, HVAC and renewables markets.
adjusted earnings per share (p)
+4.4%Increased revenue, resulting from strong market demand in large commercial aerospace, an improved performance in the Flexonics Division and the incremental contribution of the acquisition of Upeca, combined with continued effective operational execution and a slight reduction in the tax rate, resulted in an above inflation increase in adjusted earnings per share in 2014.
return on revenue margin (%)
-0.3pptsDuring the year, the Group experienced a number of operational challenges associated with industrialising a greater number of new commercial aerospace programmes. The Group has a policy of expensing costs arising as incurred. In most cases, these challenges were in line with expectations and previous experience, however, at our SSP operation in California the impact was greater than anticipated and is the main reason for the reduction in operating margin.
net cash from operating activities (£m)
-4.1%The Group’s cash conversion was again strong, however it reduced from 2013’s record level due to an increase in the income tax paid partly offset by an increase in cash generated by operations. Despite the slight reduction, the Group has been able to fund an increased level of capital expenditure of 1.2 times depreciation, continue to make strategic acquisitions and propose a 10% increase in the annual dividend.
13 14
738778
13 14
19.00 19.84
13 14
13.9 13.6
13 14
92.4 88.6
return on capital employed (%)
-2.9pptsThe Group’s return on capital employed reduced in 2014, following the acquisitions of Upeca (April 2014) and Thermal Engineering (November 2013). Furthermore, the impact of increased earnings was offset by increased capital expenditure and additional working capital requirements due to production ramp-up in large commercial aerospace.
lost time injury frequency rate (incidents per 100 employees p.a.)
18.9% increaseUnfortunately, the number of lost time injuries increased in 2014. Approximately half of this increase can be explained by the addition of new acquisitions. While it is disappointing to see an increase on 2013, the Group continues to take a proactive approach to the health and safety of all employees, and has reduced the number of lost time injury incidents by 59% since 2006.
Carbon dioxide emissions (tonnes/£m revenue)
1.3% increaseThrough more efficient use of resources and improved asset utilisation, the Group continues to make good progress on its published five-year target of improving energy efficiency by 10% between 2011 and 2015. When adjusted for acquisitions, the Group achieved a 8.1% improvement during 2014 representing the ninth consecutive year that Senior has reduced its underlying environmental impact.
13 14
26.723.8
13 14
0.95
1.13
13 14
85.5 86.6
Key
Target achieved Target not achieved
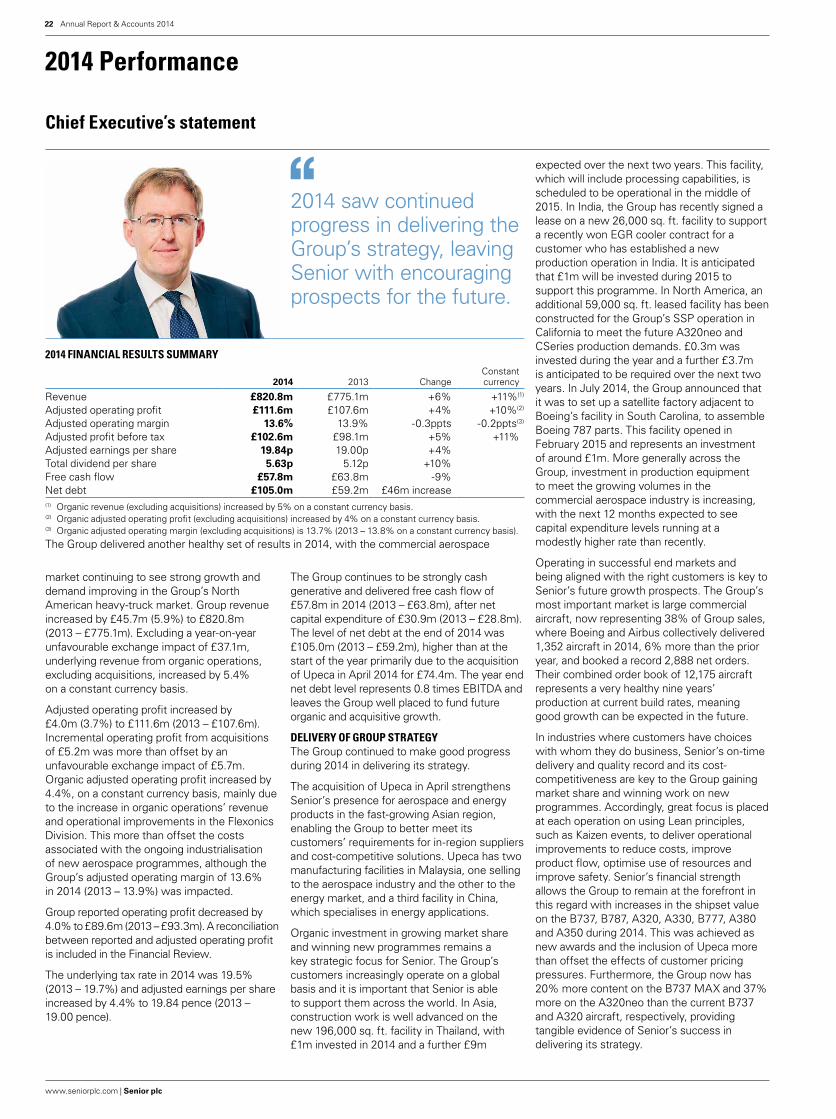
Annual Report & Accounts 201422
www.seniorplc.com | Senior plc
2014 finanCial results summary
2014 2013 ChangeConstantcurrency
Revenue £820.8m £775.1m +6% +11%(1)
Adjusted operating profit £111.6m £107.6m +4% +10%(2)
Adjusted operating margin 13.6% 13.9% -0.3ppts -0.2ppts(3)
Adjusted profit before tax £102.6m £98.1m +5% +11%Adjusted earnings per share 19.84p 19.00p +4%Total dividend per share 5.63p 5.12p +10%Free cash flow £57.8m £63.8m -9%Net debt £105.0m £59.2m £46m increase(1) Organic revenue (excluding acquisitions) increased by 5% on a constant currency basis.(2) Organic adjusted operating profit (excluding acquisitions) increased by 4% on a constant currency basis.(3) Organic adjusted operating margin (excluding acquisitions) is 13.7% (2013 – 13.8% on a constant currency basis).The Group delivered another healthy set of results in 2014, with the commercial aerospace
market continuing to see strong growth and demand improving in the Group’s North American heavy-truck market. Group revenue increased by £45.7m (5.9%) to £820.8m (2013 – £775.1m). Excluding a year-on-year unfavourable exchange impact of £37.1m, underlying revenue from organic operations, excluding acquisitions, increased by 5.4% on a constant currency basis.
Adjusted operating profit increased by £4.0m (3.7%) to £111.6m (2013 – £107.6m). Incremental operating profit from acquisitions of £5.2m was more than offset by an unfavourable exchange impact of £5.7m. Organic adjusted operating profit increased by 4.4%, on a constant currency basis, mainly due to the increase in organic operations’ revenue and operational improvements in the Flexonics Division. This more than offset the costs associated with the ongoing industrialisation of new aerospace programmes, although the Group’s adjusted operating margin of 13.6% in 2014 (2013 – 13.9%) was impacted.
Group reported operating profit decreased by 4.0% to £89.6m (2013 – £93.3m). A reconciliation between reported and adjusted operating profit is included in the Financial Review.
The underlying tax rate in 2014 was 19.5% (2013 – 19.7%) and adjusted earnings per share increased by 4.4% to 19.84 pence (2013 – 19.00 pence).
The Group continues to be strongly cash generative and delivered free cash flow of £57.8m in 2014 (2013 – £63.8m), after net capital expenditure of £30.9m (2013 – £28.8m). The level of net debt at the end of 2014 was £105.0m (2013 – £59.2m), higher than at the start of the year primarily due to the acquisition of Upeca in April 2014 for £74.4m. The year end net debt level represents 0.8 times EBITDA and leaves the Group well placed to fund future organic and acquisitive growth.
delivery of grouP strategyThe Group continued to make good progress during 2014 in delivering its strategy.
The acquisition of Upeca in April strengthens Senior’s presence for aerospace and energy products in the fast-growing Asian region, enabling the Group to better meet its customers’ requirements for in-region suppliers and cost-competitive solutions. Upeca has two manufacturing facilities in Malaysia, one selling to the aerospace industry and the other to the energy market, and a third facility in China, which specialises in energy applications.
Organic investment in growing market share and winning new programmes remains a key strategic focus for Senior. The Group’s customers increasingly operate on a global basis and it is important that Senior is able to support them across the world. In Asia, construction work is well advanced on the new 196,000 sq. ft. facility in Thailand, with £1m invested in 2014 and a further £9m
expected over the next two years. This facility, which will include processing capabilities, is scheduled to be operational in the middle of 2015. In India, the Group has recently signed a lease on a new 26,000 sq. ft. facility to support a recently won EGR cooler contract for a customer who has established a new production operation in India. It is anticipated that £1m will be invested during 2015 to support this programme. In North America, an additional 59,000 sq. ft. leased facility has been constructed for the Group’s SSP operation in California to meet the future A320neo and CSeries production demands. £0.3m was invested during the year and a further £3.7m is anticipated to be required over the next two years. In July 2014, the Group announced that it was to set up a satellite factory adjacent to Boeing’s facility in South Carolina, to assemble Boeing 787 parts. This facility opened in February 2015 and represents an investment of around £1m. More generally across the Group, investment in production equipment to meet the growing volumes in the commercial aerospace industry is increasing, with the next 12 months expected to see capital expenditure levels running at a modestly higher rate than recently.
Operating in successful end markets and being aligned with the right customers is key to Senior’s future growth prospects. The Group’s most important market is large commercial aircraft, now representing 38% of Group sales, where Boeing and Airbus collectively delivered 1,352 aircraft in 2014, 6% more than the prior year, and booked a record 2,888 net orders. Their combined order book of 12,175 aircraft represents a very healthy nine years’ production at current build rates, meaning good growth can be expected in the future.
In industries where customers have choices with whom they do business, Senior’s on-time delivery and quality record and its cost-competitiveness are key to the Group gaining market share and winning work on new programmes. Accordingly, great focus is placed at each operation on using Lean principles, such as Kaizen events, to deliver operational improvements to reduce costs, improve product flow, optimise use of resources and improve safety. Senior’s financial strength allows the Group to remain at the forefront in this regard with increases in the shipset value on the B737, B787, A320, A330, B777, A380 and A350 during 2014. This was achieved as new awards and the inclusion of Upeca more than offset the effects of customer pricing pressures. Furthermore, the Group now has 20% more content on the B737 MAX and 37% more on the A320neo than the current B737 and A320 aircraft, respectively, providing tangible evidence of Senior’s success in delivering its strategy.
2014 Performance
Chief executive’s statement
2014 saw continued progress in delivering the Group’s strategy, leaving Senior with encouraging prospects for the future.

23Annual Report & Accounts 2014
www.seniorplc.com | Senior plc
STRATEGIC REPO
RTG
OVERN
AN
CEFIN
AN
CIAL STATEM
ENTS
AD
DITION
AL IN
FORM
ATION
Recruiting and developing good leaders is arguably the most critical aspect to the Group’s future success. Senior’s culture is one of empowered entrepreneurial leadership operating within a fixed control framework, where timely communication of both good and bad news is expected, and success is recognised and fairly rewarded. Over the past six years, the Group Development Programme, which is personally important to me, has been successfully expanded and increasingly focused on leadership development. During 2014, the Programme was further enhanced with the introduction of a senior executive programme for potential future leaders and “Driving Innovation” workshops for all of the Group’s operating company CEOs, both held in conjunction with Ashridge Business School.
CorPorate resPonsibilityCorporate responsibility is a key part of how we do business at Senior and I am pleased to report continued progress in 2014.
We continue to improve our people training and development programmes and are increasing our cross-Group collaberation and sharing of best practices. During the year, we introduced a Zero Harm initiative which is designed to further strengthen and embed the Group’s safety culture. Whilst 2014’s safety record showed a marginal decline compared to the prior year, the Group’s sustained focus on safety has resulted in the 2014 lost time injury rate being only 59% of the level reported in 2006, when the current safety programme was introduced.
Senior further reduced its carbon emissions in 2014, on an underlying basis excluding the acquisition of Upeca, and the environmental metrics also demonstrated healthy improvement, as the Group invested to reduce energy and water consumption. Sustainability drives demand for many of our services and operating in an ethical and responsible manner is integral to our customer relationships.
The Group actively encourages its businesses to invest and support local communities and sponsor good causes and I am particularly proud of our staff for the contributions that they have made locally during 2014.
retirementAfter 15 years on the Board of Senior plc, I have, as announced in August 2014, taken the personal decision to retire from Senior and a full-time executive career. The Board has now appointed my successor, David Squires, and I will be leaving the Group at the end of May 2015. Whilst every business has challenges, it is pleasing to be leaving at a time when Senior is in good financial shape, with encouraging future prospects and a capable and stable anagement team in place. In David, the Group has a new
leader with the requisite personality, experience and energy to drive the business forward and I wish him the very best for the future.
Senior has come a long way in recent years and is a well-respected name in the industries in which it participates, something I take great pleasure in having been lucky enough to be part of. This achievement is largely down to the high calibre of Senior’s employees and I would like to take this opportunity to personally thank my colleagues, both past and present, for their hard work, dedication and support throughout my many enjoyable years at Senior.
market ConditionsThe production ramp-up of the A350, together with Boeing’s and Airbus’s plans to increase the build rates of their B787, B737 and A320 aircraft, mean the outlook for the large commercial aerospace sector, the Group’s most important market, is both strong and visible. In particular, the Group can expect to benefit from the greater content it has on the new-engine versions of the high-volume narrow-bodied aircraft, the A320neo and B737 MAX, which are scheduled to enter service in 2015 and 2017, respectively; production of the A330 is, however, planned to decrease in 2016. Having world-class aerospace facilities in Asia is also expected to lead to increases in market share. Consequently, the Group was pleased to achieve recent contract awards on the A350 and A320 at the newly acquired Upeca facility in Malaysia, and to be progressing as planned in bringing additional A350 and B787 work into production in Thailand during 2015. Against this growing backdrop, pricing pressure remains a challenge, but is being managed in line with expectations.
Elsewhere in the Aerospace Division, the Group expects to benefit from the entry into service of Bombardier’s CSeries aircraft, on which the Group has significant content, towards the end of 2015. Senior also has good content on the Mitsubishi Regional Jet and Embraer E2-Jet, which are scheduled to enter service in 2017 and 2018, respectively. After some difficult years, the outlook for military and defence, representing 12% of Group sales in 2014, appears to be stabilising with the rate of decline reducing in the second half of 2014. Whilst Western Government spending in the military arena remains under pressure, increasing build rates on programmes such as the Joint Strike Fighter and the A400M military transporter should at least provide partial mitigation in the future.
New product introductions and build-rate ramps are constant themes across the Aerospace Division, with the challenges they bring expected to continue to impact a number of Senior’s businesses, particularly SSP, during 2015 as the costs of the development
activities are expensed as incurred. In addition, Bombardier’s decision to suspend activity on its L85 business jet programme is expected to have an adverse impact on the Group’s small Composites business based in Wichita, USA.
In Flexonics, the outlook for Senior’s “on-highway” land vehicle operations remains encouraging, with volumes of heavy-duty trucks and passenger vehicles increasing in a number of the Group’s key markets during 2014 and expected to do so, albeit at a slower rate, in 2015. Visibility of “off-highway” land vehicles for use in agricultural markets and mining operations is less clear as the slowing GDP growth rate in China impacts commodity prices. These lower commodity prices are, however, likely to benefit the Group as stainless steel prices remain relatively benign. The recent decline in the oil price, the ongoing difficulties at Petrobras and increased uncertainty in the eurozone means some softening in the Group’s industrial activity is anticipated, particularly in Brazil and Germany. Nevertheless, given a solid order book, the first half of 2015 should see healthy sales of large expansion joints in North America. Over the longer term, environmental legislation continues to tighten, which can be expected to provide greater demand for many of the Flexonics Division’s products.
Around 80% of the Group’s profits are generated outside of the UK and, consequently, exchange rates can significantly affect the Group’s results. Although the likely effect of foreign exchange movements is difficult to predict, the impact is expected to be beneficial at current exchange rates.
outlookStaying focused on customer alignment, operational excellence and our people, will enable Senior to continue to grow organically. In addition, Senior’s cash-generative nature and strengthening market and financial position provide a solid platform from which the Group can continue to pursue acquisitive growth opportunities to complement its existing portfolio.
Overall, progress is expected to be made across the Group during 2015 and, at current exchange rates, the Board anticipates the Group to perform in line with its expectations. Senior also remains well positioned to make further progress in 2016 and beyond.
Mark RollinsGroup Chief Executive

Annual Report & Accounts 201424
www.seniorplc.com | Senior plc
2014 Performance continued
aerospace division
large CommerCial airCraft• Organic revenue growth of 10%,
underpinned by market share gains and increasing build rates of Airbus and Boeing large commercial aircraft platforms.
• Upeca acquisition brings new capabilities and geographic exposure.
• Boeing delivered 114 B787s in 2014 with production now at 10 per month, moving to 12 per month in 2016.
• Record net order intake for Boeing and Airbus in 2014, not only for the re-engined B737 MAX and A320neo, but also the current engine versions of these platforms.
• Build rate of A320 to increase to 50 per month in 2017 and B737 to increase to 52 per month in 2018.
• First Airbus A350 was delivered in December 2014, with 32 expected in 2015.
• At current build rates it will take over nine years to fulfil existing OEM order books.
regional and business jets• Organic revenue from regional jet sector
increased by 11%, with improvements coming from the Bombardier CRJ series and Superjet 100.
• Senior’s regional jet market revenue is expected to increase in the medium term as new platforms come to market, such as the Bombardier CSeries, Mitsubishi MRJ and Embraer E2-Jet.
• Organic business jet revenue decreased by 4% due to lower large jet market deliveries.
• Bombardier suspended development of its L85 business jet programme in January 2015.
military aerosPaCe• Organic revenue decreased by 7%,
reflecting the anticipated reduction in demand for the V22 Osprey helicopter and the Eurofighter Typhoon.
• 2015 military revenue is expected to be more stable, as the end of C-17 production, declines in V22 Osprey and CH47 Chinook are offset by increases in build rates of A400M.
• Western Government spending in the military arena remains under pressure.
• Beyond 2015, Joint Strike Fighter is scheduled to ramp-up significantly and A400M to reach full rate production.
Senior continues to enjoy strong demand from the large commercial aircraft sector, where order books are at record levels. The regional jet market is showing signs of improvement, while the business jet market remains satisfactory. As anticipated, after recent declines, the military and defence sector is now stabilising.
CaPabilities• Design and manufacture of systems for
delivery of air, hydraulic fluids and fuel to critical airborne system functions in composite and metallic materials.
• Design and manufacture of maintenance-free solutions for harsh operating environments.
• Precision machining of complex products and assemblies for airframe structures and systems.
• Provision of engine core, ancillary systems and related structural products to major gas turbine engine manufacturers.
• Manufacturing hot- and cold-formed components, complex fabricated assemblies and thermal insulation heat shields and systems.
• Global footprint enables in-region supply and cost-competitive solutions.

25Annual Report & Accounts 2014
www.seniorplc.com | Senior plc
STRATEGIC REPO
RTG
OVERN
AN
CEFIN
AN
CIAL STATEM
ENTS
AD
DITION
AL IN
FORM
ATION
business revieWThe Aerospace Division represents 65% (2013 – 65%) of Group revenue and consists of 19 operations. These are located in North America (10), the United Kingdom (4), continental Europe (3), Thailand and Malaysia.
On 8 April 2014, Senior completed the acquisition of Upeca for a consideration of £59.1m plus the assumption of £15.3m of net debt. One-third of Upeca’s revenue is derived from the aerospace market which is generated by a stand-alone aerospace-focused facility. This operation is now managed as part of Senior Aerospace Structures.
Elsewhere, construction work is well advanced on new facilities in Thailand and at SSP. A new facility supporting Boeing’s 787 operations in South Carolina opened in February 2015.
As previously reported in October 2014, the Group’s Mexican Aerospace facility suffered a fire which destroyed one of its two buildings. Thanks to the significant efforts of local management and employees, 85% of the operation’s revenue was back in production within three weeks, with the remainder expected to come on stream during the first half of 2015.
In November 2013, the decision was taken to merge Capo Industries into the Group’s Ketema operation. This decision resulted in an exceptional provision of £1.9m being charged in 2013. As discussed at the time of the 2014 interim results, the consolidation of the businesses took longer and was more costly than expected and the provision was fully utilised during 2014. In addition, a further £1.5m exceptional cost was charged in 2014. The merger has now been successfully completed and no further merger costs are expected.
The Aerospace Division’s main products are airframe and other structural parts (30% of 2014 divisional sales), engine structures and mounting systems (29%), metallic ducting systems (17%), composite ducting systems (6%), fluid control systems (6%) and helicopter machined parts (4%). The remaining 8% of divisional sales were to non-aerospace markets, including energy, semi-conductor and medical.
The Division’s largest customers include Rolls-Royce, representing 17% of 2014 divisional sales, Boeing (17%), Spirit Aero Systems (11%), United Technologies (8%), Airbus (5%) and Bombardier (5%).
The Aerospace Division’s operating results on a constant currency basis are summarised below:
2014£m
2013(1)
£m Change
Revenue 536.6 486.4 +10.3%Adjusted operating profit 77.9 73.7 +5.7%Operating margin 14.5% 15.2% -0.7ppts(1) 2013 translated using 2014 average exchange rates.
revenue reconciliation
A B C D E F G H
486
26 1 (7)5
511
26 537
£m
A 2013 revenueB Large commercialC Regional & business jetsD Military
E OtherF 2014 organicG AcquisitionsH 2014 revenue
Divisional revenue increased by £50.2m (10.3%) to £536.6m (2013 – £486.4m)(1) and adjusted operating profit increased by £4.2m to £77.9m (2013 – £73.7m)(1). Excluding the impact of acquisitions, organic revenue for the Division increased by £24.6m (5.1%) and adjusted operating profit increased by £1.4m (1.9%).
The operating margin declined by 0.7 percentage points to 14.5% (2013 – 15.2%). This margin reduction was broadly anticipated, reflecting expensed development costs as incurred. During the year, the Group also experienced a number of operational challenges associated with industrialising a greater number of new commercial aerospace programmes. In most cases, these challenges were in line with expectations, however, at our SSP operation in California the impact was greater than anticipated.
59% (2013 – 55%) of the Aerospace Division’s revenues are derived from the large commercial aerospace market, comprising the aircraft manufactured by Airbus and Boeing and the engines that go on those aircraft. This market remained very strong during 2014, with Boeing and Airbus collectively delivering 1,352 aircraft, a 6% increase over the prior year (2013 – 1,274 deliveries). Boeing and Airbus also recorded record aircraft orders during 2014 which, at a combined net order intake of 2,888 aircraft (2013 – 2,858 aircraft), was well ahead of aircraft deliveries for the fifth year in succession. As a consequence, their combined order book grew by 1,536 aircraft during 2014 to 12,175 aircraft at the end of the year, representing over nine years of deliveries at current production rates. On an organic basis, Senior grew its sales to the large commercial aircraft market by 10% during 2014.
Senior’s largest revenue programme is the Boeing 737. During the year, it was announced that the build rate for this aircraft will be increased to 52 per month in 2018. It is currently produced at a rate of 42 per month, and is set to increase to 47 per month in 2017.This is encouraging as Senior continues to grow its shipset content on this aircraft, and
on the B737 MAX, the re-engined, more fuel-efficient version due to come into service in 2017. At the same time, the A320neo, the narrow-bodied re-engined aircraft from Airbus, is stated to be on-track for its first delivery in Q4 2015. Once again, Senior has a higher shipset content on the A320neo. This aircraft is also being built at 42 per month today with increases to 46 per month in 2016 to 50 per month in 2017 as announced.
Senior won additional content in the period on the A350 and B787, two significant future programmes for the Group. The acquisition of Upeca also contributed meaningful content on these two key programmes. Qatar Airways took delivery of the first Airbus A350 in late December 2014 and, with a further 779 on order at the end of December 2014, the build rate of this aircraft is now increasing. During 2014, Boeing’s B787 maintained a production rate of 10 per month, with Boeing planning to increase the build rate to 12 per month in 2016 and 14 per month in 2019. Production of the A330 is, however, expected to decline from the current rate of 9 per month to 6 per month in 2016.
In the regional jet market (5% of divisional revenue), the Bombardier CSeries and Mitsubishi Regional Jet programmes, on which Senior has significant content, continued to edge closer to their expected first customer deliveries in the second half of 2015 and 2017, respectively. The Group also made encouraging progress by winning meaningful content on Embraer’s new E2 regional jet, which is due into service in 2018. Senior’s sales to the business jet market (8% of divisional revenue) declined during the year, with the Group seeing a decrease in organic revenue of 4% mainly due to lower sales of large business jets. The suspension of L85 is expected to have an adverse ongoing impact on the profitability of the Group’s small composite business based in Wichita, USA.
Revenue from the military and defence sector (18% of divisional revenue) (2013 – 21%) declined by 7% during the period on an organic basis. This was primarily due to the anticipated build rate reductions for V22 Osprey and C-17, along with the absence of significant development activity on the A400M and one-off catch-up volumes for the CH-47 (Chinook) helicopter, both of which had benefited the prior year.
Around 10% of the Division’s revenue was derived from other markets such as space, non-military helicopters, power and energy, medical and semi-conductor, where the Group manufactures products using similar technology to that used for certain aerospace products. Organic revenues in these markets were £5.2m (10.0%) higher than in 2013, due to growth in non-military helicopter and energy activities.

Annual Report & Accounts 201426
www.seniorplc.com | Senior plc
2014 Performance continued
flexonics division
land vehiCle emission Control• Truck and off-highway sales increased by
13%, with growth in the North American truck market and the continued ramp-up of new programmes in Europe.
• Continued progress and further investment in our joint venture in China.Production of heavy-duty diesel engine common rails improved and production of flexible exhaust connectors commenced just before the year end.
• Further investment was made in Mexico to supply flexible exhaust connectors and engine bellows to a key customer’s local Mexican production plant as well as its US facilities.
• Sales in the passenger vehicle sector increased by 4%, due to improved demand in many European markets and growth in China, offset partially by weaker demand in Brazil and India.
industrial ProCess Control• Organic industrial revenues were
marginally ahead of the prior year, as expansion joints for a large North American petrochemical project began shipment in the final quarter of the year. This helped offset weaker sales in the power and energy, HVAC and renewables markets, particularly in Brazil and Germany.
• The Group expects to benefit in the first half of 2015 from the remaining shipments on the project above, although the outlook for industrial sales outside North America is expected to be weaker.
• Upeca acquisition brings additional customers, new machining capabilities and greater geographic exposure to the Flexonics Division.
Senior’s principal end-market exposures in the Flexonics Division are medium- and heavy-duty diesel engine markets in North America, passenger cars in Europe and global industrial process control markets including petrochemical, HVAC and power and energy markets.
CaPabilities• Development and production of emission
control and fuel distribution products for the truck and off-road transport sector and for selected passenger car applications.
• Design and manufacture of engineered expansion joints and dampers for industrial process control applications, to meet an increasingly stringent regulatory environment.
• An integrated global footprint, providing customer proximity and lower cost.

27Annual Report & Accounts 2014
www.seniorplc.com | Senior plc
STRATEGIC REPO
RTG
OVERN
AN
CEFIN
AN
CIAL STATEM
ENTS
AD
DITION
AL IN
FORM
ATION
business revieWThe Flexonics Division represents 35% (2013 – 35%) of Group revenue and consists of 13 operations which are located in North America (4), continental Europe (3), the United Kingdom, South Africa, India, Brazil, Malaysia and China. In addition, the Group holds a 49% shareholding in a joint venture in China.
As discussed in the Aerospace Division Review, Senior completed the acquisition of Upeca Technologies in April 2014. Approximately two-thirds of Upeca’s revenue is derived from industrial markets, principally oil and gas, with the revenue generated from two dedicated facilities, one located near Kuala Lumpur, Malaysia and the other in Tianjin, China. These operations are now managed together under the leadership of a single CEO as part of the Senior Flexonics Division. These two industrial businesses performed well throughout their first period under Senior’s ownership.
During 2014, the Group established new reporting lines between the Group’s Chicago-located Bartlett operation and its Indian operation. These arrangements closely mirror the existing management structure for the Flexonics operation in Mexico, which today acts as a complementary factory for Bartlett, providing proximity and lower costs for certain customers. This recent change in management approach in India is already delivering benefits and opportunities for the Group, through best practice sharing and extensive industry knowledge. As an example, the Group has recently won an EGR cooler contract for a Western customer who is in the process of establishing a production operation in India, with Senior taking on a lease on a new 26,000 sq. ft. facility near New Delhi to support them. It is anticipated that £1m will be invested during 2015 to deliver this programme.
55% of the Flexonics Division’s revenues in 2014 were derived from demand for land vehicle components, 44% from industrial markets and 1% from aerospace markets.
The land vehicle sales comprise cooling and emission control components (24% of 2014 divisional sales), flexible mechanisms for vehicle exhaust systems (13%), diesel fuel distribution pipework (15%) and off-highway hydraulics (3%). The industrial product revenue is derived from the power and energy markets (17%), oil and gas and chemical processing industries (15%), HVAC and solar markets (3%) and a range of other markets (9%). 1% of sales is to the aerospace markets.
The Division’s largest individual end users are land vehicle customers, including Cummins (representing 17% of 2014 Divisional sales), Caterpillar (9%), Ford (4%), PSA (4%), and Renault (4%). Individual industrial customers rarely account for more than 1 or 2% of divisional sales and, given the generally bespoke and project nature of the Group’s industrial products, the customers vary significantly each year. Emerson (5%) and Bloom Energy (3%) were the largest industrial customers in the period with much of the Emerson revenue being due to the Upeca acquisition. Woodward (1%) accounted for the vast majority of aerospace revenue within the Flexonics Division in 2014.
The Flexonics Division’s operating results on a constant currency basis are summarised below:
2014£m
2013(1)
£m Change
Revenue 284.6 252.4 +12.8%Adjusted operating profit 43.5 37.4 +16.3%Operating margin 15.3% 14.8% +0.5ppts(1) 2013 results translated using 2014 average exchange
rates.
revenue reconciliation
A B C D E F G
252 12 2 1 26717 284
£m
A 2013 revenueB Truck and off-highwayC Passenger vehiclesD Industrial
E 2014 organicF AcquisitionsG 2014 revenue
Divisional revenue increased by £32.2m (12.8%) to £284.6m (2013 – £252.4m)(1) and adjusted operating profit increased by £6.1m to £43.5m (2013 – £37.4m)(1). Excluding the incremental contribution from the Upeca acquisition completed in April 2014 (£17.2m), organic revenue increased by £15.0m (5.9%) while adjusted operating profit increased by £3.7m (9.9%).
The operating margin increased to 15.3% (2013 – 14.8%), primarily due to operational improvements at the Bartlett facility and a further reduction in losses at the Group’s French land vehicle operation. Underlying margins in organic operations improved by 0.6 percentage points to 15.4% (2013 – 14.8%).
2014 saw generally better economic conditions compared to recent years, particularly in North America. Total Group sales to truck and off-highway markets (36% of divisional revenue) increased by 13% on a constant currency basis. This was mainly driven by improvements in the North American truck market where sales increased by 11% due to greater demand for high pressure rails, exhaust bellows and EGR coolers for new vehicles. As anticipated, sales of EGR coolers for the spare parts market were lower in 2014 as product longevity improved following technological advances made by Senior. The final quarter of 2014 saw some weakness in the off-highway agriculture and mining market with slowing demand from China thought to be the principal reason. Senior’s sales to the European truck market increased by 18% in 2014, albeit from a low base, as new emission-led programmes came into production. This was a pleasing performance given that the actual European truck market was weak, and down by 7%, as European economies showed little growth.
Sales to passenger vehicle markets (19% of divisional revenue) improved by 4% on a constant currency basis as the Group’s principal European markets improved from the 17-year low seen in 2013. Outside of Europe and North America, passenger vehicle sales were 12% lower as greater demand in China, largely a new market for Senior, was offset by weakness in Brazil and India.
In the Group’s industrial markets (44% of divisional revenue), sales were up 17% on a constant currency basis, primarily due to £17m of acquired revenue from Upeca. On an underlying organic basis, sales increased by 1%, with the incremental sales from a large industrial expansion joint order for a North American petrochemical project being mostly offset by weaker sales in the power generation, HVAC and renewables markets, principally in Brazil and Germany.

Annual Report & Accounts 201428
www.seniorplc.com | Senior plc
finanCial summaryA summary of the Group’s operating results is set out in the table below.
Revenue
Adjustedoperating
profit(1) Margin2014
£m2013
£m2014
£m2013
£m2014
%2013
%
Aerospace 536.6 506.6 77.9 76.5 14.5 15.1Flexonics 284.6 269.3 43.5 40.4 15.3 15.0Share of results of joint venture – – (0.3) (0.3) – –Inter-segment sales (0.4) (0.8) – – – –Central costs – – (9.5) (9.0) – –Group total 820.8 775.1 111.6 107.6 13.6 13.9(1) See table below for reconciliation of adjusted operating profit to reported operating profit.
Adjusted operating profit may be reconciled to the operating profit that is shown in the Consolidated Income Statement as follows:
2014£m
2013£m
Adjusted operating profit 111.6 107.6Exceptional pension (charge)/credit (1.5) 1.1Reversal of contingent consideration payable – 3.8Impairment of goodwill(2) (9.4) (12.7)Restructuring costs(1) (1.5) (1.9)Write-down of L85 inventory(2) (1.8) –Amortisation of intangible assets from acquisitions (7.2) (4.2)Acquisition costs (0.6) (0.4)Operating profit per Financial Statements 89.6 93.3(1) In November 2013, the decision was taken to merge Capo Industries into the Group’s Ketema operation.
This decision resulted in exceptional provisions of £1.9m in 2013. During 2014, this provision was fully utilised and a further £1.5m charged.
(2) On 20 January 2015, the Group was notified by Bombardier that it had suspended, for an indefinite period of time, the development of its L85 business jet programme. This post balance sheet event triggered a one-off £1.8m write-down of inventory and a £9.4m impairment of goodwill, both of which have been recognised as an exceptional charge in 2014.
finanCial detailRevenueGroup revenue increased by £45.7m (5.9%) to £820.8m (2013 – £775.1m).
Excluding the incremental full-year effect of acquisitions made in 2013: Thermal acquired in November 2013 (£15.6m); Atlas acquired in February 2013 (£0.4m); the current year contribution of Upeca acquired in April 2014 (£26.8m) and a year-on-year unfavourable exchange impact of £37.1m, underlying revenue from organic operations increased by 5.4% on a constant currency basis.
In 2014, 62% of sales originated from North America, 16% from the UK, 12% from the Rest of Europe and 10% from the Rest of the World.
Operating profitAdjusted operating profit increased by £4.0m (3.7%) to £111.6m (2013 – £107.6m). Incremental operating profit from acquisitions of £5.2m was more than offset by an unfavourable exchange impact of £5.7m. Organic adjusted operating profit increased by 4.4%, on a constant currency basis.
The Group achieved an operating margin of 13.6% in 2014 (2013 – 13.9%). Whilst the Flexonics Division delivered improved margins, mainly due to operational improvements at the Bartlett facility and reduced losses at its French land-vehicle operation, the Aerospace Division operating margin declined. This margin reduction was broadly as anticipated and largely reflects customer pricing pressure and expensed development costs as incurred. During the year, the Group also experienced a number of operational challenges associated with industrialising new commercial aerospace programmes, with those at SSP being greater than anticipated.
Total Group reported operating profit decreased by 4.0% to £89.6m (2013 – £93.3m).
2014 Performance continued
financial review
Our balance sheet remains strong and the Group continues to be cash generative and well placed to meet its future growth aspirations.
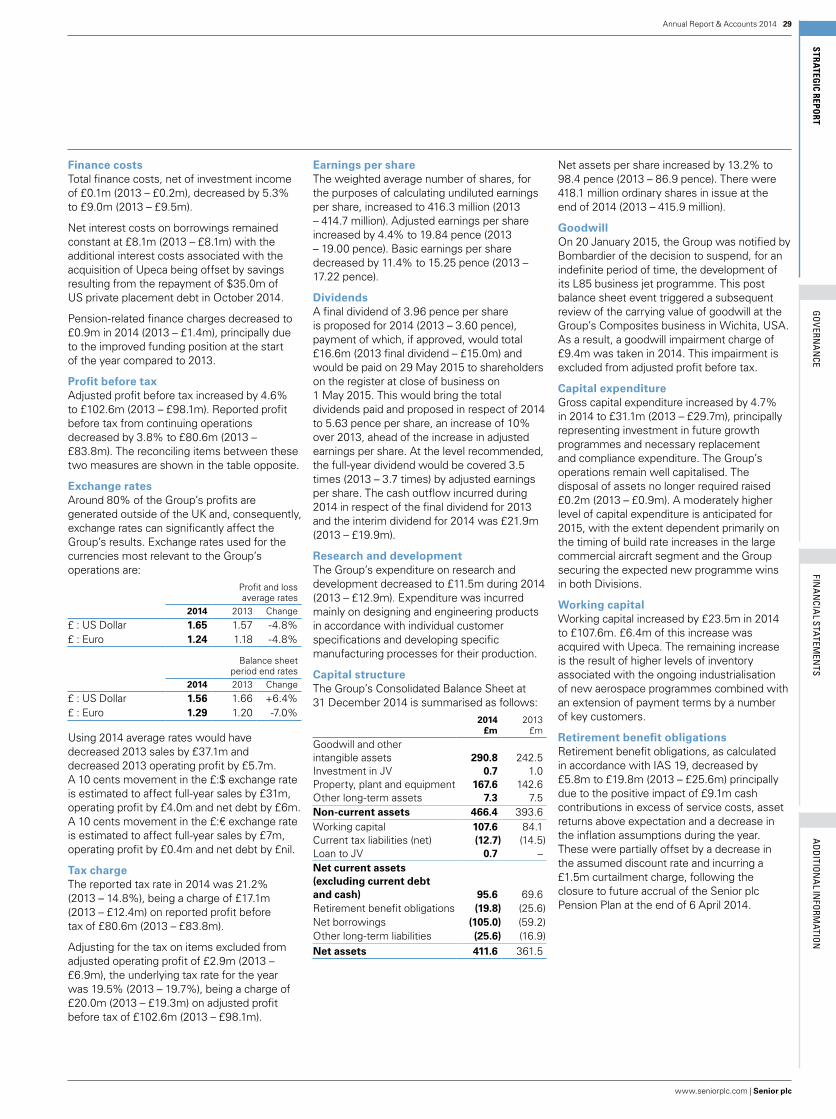
29Annual Report & Accounts 2014
www.seniorplc.com | Senior plc
STRATEGIC REPO
RTG
OVERN
AN
CEFIN
AN
CIAL STATEM
ENTS
AD
DITION
AL IN
FORM
ATION
Finance costsTotal finance costs, net of investment income of £0.1m (2013 – £0.2m), decreased by 5.3% to £9.0m (2013 – £9.5m).
Net interest costs on borrowings remained constant at £8.1m (2013 – £8.1m) with the additional interest costs associated with the acquisition of Upeca being offset by savings resulting from the repayment of $35.0m of US private placement debt in October 2014.
Pension-related finance charges decreased to £0.9m in 2014 (2013 – £1.4m), principally due to the improved funding position at the start of the year compared to 2013.
Profit before taxAdjusted profit before tax increased by 4.6% to £102.6m (2013 – £98.1m). Reported profit before tax from continuing operations decreased by 3.8% to £80.6m (2013 – £83.8m). The reconciling items between these two measures are shown in the table opposite.
Exchange ratesAround 80% of the Group’s profits are generated outside of the UK and, consequently, exchange rates can significantly affect the Group’s results. Exchange rates used for the currencies most relevant to the Group’s operations are:
Profit and lossaverage rates
2014 2013 Change
£ : US Dollar 1.65 1.57 -4.8%£ : Euro 1.24 1.18 -4.8%
Balance sheetperiod end rates
2014 2013 Change
£ : US Dollar 1.56 1.66 +6.4%£ : Euro 1.29 1.20 -7.0%
Using 2014 average rates would have decreased 2013 sales by £37.1m and decreased 2013 operating profit by £5.7m. A 10 cents movement in the £:$ exchange rate is estimated to affect full-year sales by £31m, operating profit by £4.0m and net debt by £6m. A 10 cents movement in the £:€ exchange rate is estimated to affect full-year sales by £7m, operating profit by £0.4m and net debt by £nil.
Tax chargeThe reported tax rate in 2014 was 21.2% (2013 – 14.8%), being a charge of £17.1m (2013 – £12.4m) on reported profit before tax of £80.6m (2013 – £83.8m).
Adjusting for the tax on items excluded from adjusted operating profit of £2.9m (2013 – £6.9m), the underlying tax rate for the year was 19.5% (2013 – 19.7%), being a charge of £20.0m (2013 – £19.3m) on adjusted profit before tax of £102.6m (2013 – £98.1m).
Earnings per shareThe weighted average number of shares, for the purposes of calculating undiluted earnings per share, increased to 416.3 million (2013 – 414.7 million). Adjusted earnings per share increased by 4.4% to 19.84 pence (2013 – 19.00 pence). Basic earnings per share decreased by 11.4% to 15.25 pence (2013 – 17.22 pence).
DividendsA final dividend of 3.96 pence per share is proposed for 2014 (2013 – 3.60 pence), payment of which, if approved, would total £16.6m (2013 final dividend – £15.0m) and would be paid on 29 May 2015 to shareholders on the register at close of business on 1 May 2015. This would bring the total dividends paid and proposed in respect of 2014 to 5.63 pence per share, an increase of 10% over 2013, ahead of the increase in adjusted earnings per share. At the level recommended, the full-year dividend would be covered 3.5 times (2013 – 3.7 times) by adjusted earnings per share. The cash outflow incurred during 2014 in respect of the final dividend for 2013 and the interim dividend for 2014 was £21.9m (2013 – £19.9m).
Research and developmentThe Group’s expenditure on research and development decreased to £11.5m during 2014 (2013 – £12.9m). Expenditure was incurred mainly on designing and engineering products in accordance with individual customer specifications and developing specific manufacturing processes for their production.
Capital structureThe Group’s Consolidated Balance Sheet at 31 December 2014 is summarised as follows:
2014£m
2013£m
Goodwill and other intangible assets 290.8 242.5Investment in JV 0.7 1.0Property, plant and equipment 167.6 142.6Other long-term assets 7.3 7.5Non-current assets 466.4 393.6Working capital 107.6 84.1Current tax liabilities (net) (12.7) (14.5)Loan to JV 0.7 –Net current assets (excluding current debt and cash) 95.6 69.6Retirement benefit obligations (19.8) (25.6)Net borrowings (105.0) (59.2)Other long-term liabilities (25.6) (16.9)Net assets 411.6 361.5
Net assets per share increased by 13.2% to 98.4 pence (2013 – 86.9 pence). There were 418.1 million ordinary shares in issue at the end of 2014 (2013 – 415.9 million).
GoodwillOn 20 January 2015, the Group was notified by Bombardier of the decision to suspend, for an indefinite period of time, the development of its L85 business jet programme. This post balance sheet event triggered a subsequent review of the carrying value of goodwill at the Group’s Composites business in Wichita, USA. As a result, a goodwill impairment charge of £9.4m was taken in 2014. This impairment is excluded from adjusted profit before tax.
Capital expenditureGross capital expenditure increased by 4.7% in 2014 to £31.1m (2013 – £29.7m), principally representing investment in future growth programmes and necessary replacement and compliance expenditure. The Group’s operations remain well capitalised. The disposal of assets no longer required raised £0.2m (2013 – £0.9m). A moderately higher level of capital expenditure is anticipated for 2015, with the extent dependent primarily on the timing of build rate increases in the large commercial aircraft segment and the Group securing the expected new programme wins in both Divisions.
Working capitalWorking capital increased by £23.5m in 2014 to £107.6m. £6.4m of this increase was acquired with Upeca. The remaining increase is the result of higher levels of inventory associated with the ongoing industrialisation of new aerospace programmes combined with an extension of payment terms by a number of key customers.
Retirement benefit obligationsRetirement benefit obligations, as calculated in accordance with IAS 19, decreased by £5.8m to £19.8m (2013 – £25.6m) principally due to the positive impact of £9.1m cash contributions in excess of service costs, asset returns above expectation and a decrease in the inflation assumptions during the year. These were partially offset by a decrease in the assumed discount rate and incurring a £1.5m curtailment charge, following the closure to future accrual of the Senior plc Pension Plan at the end of 6 April 2014.

Annual Report & Accounts 201430
www.seniorplc.com | Senior plc
Going concernThe Group is profitable, cash-generative and well funded with net debt of £105.0m compared to £165.6m of committed borrowing facilities.
However, economic conditions inevitably vary and so potentially create uncertainty. For this reason, a sensitivity analysis has been performed on the Group’s forecasts and projections, to take account of reasonably possible changes in trading performance. This analysis shows that the Group will be able to operate well within the level of its current committed borrowing facilities and banking covenants under all reasonably foreseeable scenarios. As a consequence, the Directors have a reasonable expectation that the Company and the Group have adequate resources to continue in operational existence for the foreseeable future, and the Board has continued to adopt the going concern basis in preparing the Group’s Annual Report & Accounts 2014.
Changes in accounting policiesThe accounting policies adopted in the Financial Statements are consistent with those followed in the preparation of the Group’s Annual Report & Accounts 2013, except for the adoption of Standards and Interpretations that are effective for the current financial year. These are highlighted in Note 2 of the Financial Statements, and do not have a material impact on the presentation of the Group’s results.
Related party transactionsThe Group’s related party transactions are between the Company and its subsidiaries, and have been eliminated on consolidation.
Derek HardingGroup Finance Director
Cash flowThe Group generated significant free cash flow of £57.8m in 2014 (2013 – £63.8m) as set out in the table below.
2014£m
2013£m
Operating profit from continuing operations 89.6 93.3Depreciation and amortisation 32.1 26.5Share of loss in joint venture 0.3 0.3Working capital movement (16.5) (19.1)Pension payments above service cost (9.1) (7.7)Impairment of goodwill 9.4 12.7Reversal of contingent consideration payable – (3.8)Other items 4.0 4.3Cash generated from operations 109.8 106.5Interest paid (net) (8.4) (7.9)Tax paid (12.7) (6.0)Capital expenditure (31.1) (29.7)Sale of fixed assets 0.2 0.9Free cash flow 57.8 63.8Dividends (21.9) (19.9)Acquisitions (60.1) (30.5)Debt assumed with acquisition (14.3) (0.2)Investment in joint venture – (0.5)Loan to joint venture (1.1) –Share issues 1.1 0.1Purchase of shares held by employee benefit trust (0.7) (0.9)Foreign exchange variations (6.6) (0.2)Opening net debt (59.2) (70.9)Closing net debt (105.0) (59.2)
Funding and liquidityAs at 31 December 2014, the Group’s gross borrowings excluding finance leases were £117.5m (2013 – £111.6m), with 87% of the Group’s gross borrowings denominated in US dollars (31 December 2013 – 99%). Cash and bank balances were £13.2m (31 December 2013 – £53.1m).
The maturity of these borrowings, together with the maturity of the Group’s committed facilities, can be analysed as follows:
Grossborrowings(1)
£m
Committedfacilities
£m
Within one year 24.1 16.0In the second year – –In years three to five 80.6 136.8After five years 12.8 12.8
117.5 165.6(1) Gross borrowings include the use of bank overdrafts,
other loans and committed facilities, but exclude finance leases of £0.7m.
At the year-end, the Group had committed facilities of £165.6m with a weighted average maturity of 3.7 years. These facilities comprise private placement debt of £96.1m and two revolving credit facilities of £60.0m and £9.5m, respectively. During the year, the Group renegotiated the £60.0m revolving credit facility, which was due to expire in 2016, achieving an extension to 2019 on more commercially favourable terms.
The Group is in a strong funding position, with headroom of £60.6m under its facilities.
The Group has £8.1m of uncommitted borrowings which are payable on demand and is due to repay a committed private placement loan of $25.0m (£16.0m) which matures in October 2015.
The Group’s committed borrowing facilities contain a requirement that the ratio of EBITDA (adjusted profit before interest, tax, depreciation and amortisation) to net interest costs must exceed 3.5x, and that the ratio of net debt to EBITDA must not exceed 3.0x. At 31 December 2014, the Group was operating well within these covenants as the ratio of EBITDA to net interest costs was 16.2x (31 December 2013 – 15.4x) and the ratio of net debt to EBITDA was 0.8x (31 December 2013 – 0.5x).
2014 Performance continued
financial review continued

31Annual Report & Accounts 2014
www.seniorplc.com | Senior plc
STRATEGIC REPO
RTG
OVERN
AN
CEFIN
AN
CIAL STATEM
ENTS
AD
DITION
AL IN
FORM
ATION
exeCutive CommitteeThe Executive Committee, although not formally appointed as a Committee of the Board, oversees the running of all Senior Group operations.
The purpose of the Executive Committee is to assist the Group Chief Executive in the performance of his duties, including:
• the development and implementation of strategy, operational plans, policies, procedures and budgets;
• the monitoring of operating and financial performance;
• the assessment and control of risk;
• the prioritisation and allocation of resources; and
• the monitoring of competitive forces in each area of operation.
The Committee is also responsible for the consideration of all other matters not specifically reserved for consideration by the Board. A report on the activities of the Executive Committee is provided to the Board by the Group Chief Executive at each Board meeting.
The Committee is comprised of two members of the Board, Mark Rollins and Derek Harding, together with Launie Fleming (Chief Executive of Aerospace Fluid Systems), Jerry Goodwin (Chief Executive of Aerospace Structures), Mike Sheppard (Chief Executive of Flexonics), David Beavan (Group Head of Business Development) and Bindi Foyle (Head of Investor Relations & People Development). Bindi Foyle also acts as Secretary to this Committee.
health, safety & environment (“hse”) CommitteeThe HSE committee is also not formally appointed as a Committee of the Board, but officially oversees all health, safety and environmental matters across the Group.
Throughout 2014, the members of this committee were: Mark Rollins (Chairman), Mike Sheppard (Chief Executive of Flexonics), Jerry Goodwin (Chief Executive of Aerospace Structures), Launie Fleming (Chief Executive of Aerospace Fluid Systems) and James Pomeroy (Group HSE Manager). The Committee met four times during the year.
1. Mark RollinsSee biography on page 33.
2. Derek HardingSee biography on page 33.
3. Launie FlemingA US citizen, he has worked for the Group for around 17 years. He joined the Executive Committee upon his appointment as Chief Executive of Aerospace Fluid Systems in September 2008. Prior to that appointment he had been Chief Executive of Senior Aerospace SSP.
4. Jerry Goodwin A US citizen, he joined the Group in June 2007 as the Chief Executive of Senior Aerospace AMT. He was appointed Chief Executive of Aerospace Structures in December 2010. Prior to joining Senior, Jerry served as Vice President and General Manager at C & D Zodiac, a composites aerospace manufacturing company.
5. Mike Sheppard A US citizen, he has worked for the Group for over 30 years and is the Chief Executive of Flexonics. A qualified engineer, Mike’s previous positions within the Group included operational roles at the two largest Flexonics businesses, Pathway and Bartlett.
6. Bindi FoyleA Chartered Accountant, she joined the Group in 2006 as the Group Financial Controller. In August 2014 she was appointed Head of Investor Relations & People Development. She is a member of the Executive Committee and acts as its Secretary. Prior to joining Senior, she held a number of finance positions at Amersham plc and GE Healthcare.
7. David BeavanDavid took up the role of Group Head of Business Development in April 2014. He joined the Group in 2004, when he was appointed the Chief Executive of Senior Aerospace BWT. Prior to joining Senior, David had general management experience within automotive and commercial aircraft 1st tier supplier industries.
aPProvalThe Strategic Report from pages 1 to 27a was approved by the Board of Directors on 27 February 2015 and signed on its behalf by
Mark RollinsGroup Chief Executive
1 Mark Rollins
2 Derek Harding
3 Launie Fleming
4 Jerry Goodwin
5 Mike Sheppard
6 Bindi Foyle
7 David Beavan
6
4 57 3
21
executive and hse Committees

Annual Report & Accounts 201432
www.seniorplc.com | Senior plc
1 Charles Berry Chairman
2 Celia Baxter Independent Non-executive Director
3 Andy Hamment Senior Independent non-executive Director
4 Derek Harding Group Finance Director
5 Giles Kerr Independent non-executive Director
6 Mark Rollins Group Chief Executive
7 Mark E. Vernon Independent non-executive Director
8 Andrew Bodenham Group Company Secretary
board and Committee membershiPMembership and the attendance record of the main Board and its Committees is shown in the table below:
Main Board Audit Committee Nominations Committee Remuneration Committee
Chair Charles Berry David Best/Giles Kerr Charles Berry Celia BaxterTotal number of meetings 9 3 5 4Charles Berry 9/9 – 5/5 4/4Celia Baxter 9/9 3/3 4/5 4/4David Best (1) 3/3 1/1 1/1 2/2Andy Hamment 9/9 3/3 5/5 4/4Derek Harding 9/9 – – –Giles Kerr 9/9 3/3 4/5 4/4Mark Rollins 9/9 – – –Mark E. Vernon 9/9 – 4/5 4/4(1) David Best – Independent non-executive Director until he retired from the Board on 25 April 2014.
1 46
87
32 5
board of directors

33Annual Report & Accounts 2014
www.seniorplc.com | Senior plc
STRATEGIC REPORT
GO
VERNA
NCE
FINA
NCIA
L STATEMEN
TSA
DDITIO
NA
L INFO
RMATIO
N
1. Charles Berry Chairman
Appointment to the Board Charles Berry was appointed to the Board in March 2012 and became non-executive Chairman and Chairman of the Nominations Committee on 27 April 2012.External Appointments Chairman of The Weir Group PLC and Drax Group plc. He is to retire from the board of Drax Group plc in April 2015.Previous Experience He was an Executive Director of Scottish Power plc from 1999 to 2005 and Chief Executive of their UK Operations between 2000 and 2005. Prior to joining Scottish Power, he was Group Development Director of Norwest Holst, a subsidiary of Compagnie General des Eaux, and held management positions within subsidiaries of Pilkington plc. He is a former non-executive director and Chairman of Eaga plc and Thus Group plc, and a former non-executive director of Impax Environmental Markets PLC and Securities Trust of Scotland plc.Qualifications BSc (Hons) in Electrical Engineering and MSc in Management.
2. Celia BaxterIndependent Non-executive Director
Appointment to the Board Celia Baxter joined the Board on 2 September 2013 and became Chair of the Remuneration Committee in December 2013. External Appointments She is the Director of Group HR of Bunzl plc.Previous Experience Her early HR career was with Ford Motor Company and KPMG. She has held executive HR positions with Hays plc, Enterprise Oil Plc and Tate & Lyle Plc.Qualifications Doctor of Philosophy (PhD) and Member of Chartered Institute of Personnel & Development.
David BestDavid Best joined the Board in May 2007 and was Chairman of the Audit Committee until he retired from the Board in April 2014.
3. Andy Hamment Senior Independent Non-executive Director
Appointment to the Board Andy Hamment joined the Board in April 2011 and became the Senior Independent Director in December 2013. External Appointments He is a non-executive director of Chemring Group plc.Previous Experience He was formerly Group Marketing Director of Ultra Electronics plc. He has worked in the aerospace and defence industry for most of his career, mainly in business development and management roles. He joined Dowty in 1988 as Managing Director of the Controls business and participated in the management buyout that created Ultra Electronics.Qualifications BA (Hons) in Economics.
4. Derek Harding Group Finance Director
Appointment to the Board Derek Harding joined the Board on 2 September 2013.Previous Experience He joined Senior from Wolseley plc, where he had worked for 11 years, most recently as Finance Director of Wolseley UK. Prior to this, he undertook a number of group roles including Director of Group Strategy & Investor Relations and Head of Mergers & Acquisitions. He qualified as a Chartered Accountant with PricewaterhouseCoopers in 1998 following which he fulfilled audit and transaction services roles in the UK and USA before joining Wolseley in 2002.Qualifications BSc (Hons) in Banking & Finance and a Chartered Accountant.
5. Giles KerrIndependent Non-executive Director
Appointment to the Board Giles Kerr joined the Board on 2 September 2013. Giles became Chairman of the Audit Committee, when David Best retired from the Board in April 2014.External Appointments He is Director of Finance of Oxford University and is a non-executive director of BTG Plc and Victrex plc.Previous Experience Giles held a number of positions with Amersham PLC within finance and corporate development, culminating in his role as Group Finance Director. He was formerly a Partner with Arthur Andersen & Co.Qualifications BA (Hons) in Economics and a Chartered Accountant.
6. Mark RollinsGroup Chief Executive
Appointment to the Board Mark Rollins became Group Finance Director in 2000, when he joined the Board. He became Group Chief Executive in March 2008. External Appointments Non-executive director of The Vitec Group PLC.Previous Experience He joined the Group in 1998 from Morgan Crucible plc. He was formerly a non-executive director of WSP Group plc.Qualifications BEng (Hons) in Civil & Structural Engineering and a Chartered Accountant.
It has been announced that Mark Rollins will retire from the Board on 31 May 2015 and David Squires will become the Group Chief Executive on 1 June 2015, following appointment to the Board on 1 May 2015.
7. Mark E. Vernon Independent Non-executive Director
Appointment to the Board Mark E. Vernon joined the Board in April 2011. External Appointments He is a director of LiqTech International, Inc.Previous Experience He was the Group Chief Executive of Spirax-Sarco Engineering plc until his retirement in January 2014. He has had a long career in the industrial engineering industry, serving previously as Group Vice-president of Flowserve’s Flow Control Business Unit, Group Vice-president of Durco International and President of Valtek International, a global controls business. Qualifications BSc in Chemistry.
8. Andrew Bodenham Group Company Secretary
Andrew Bodenham, joined as Group Company Secretary in 2002. He acts as Secretary to the Senior plc Board and its Committees and also sits on the Group’s Treasury Committee.Qualifications LLB (Hons) and a Chartered Secretary.

The Directors present their Report and supplementary reports, together with the audited Financial Statements for the year ended 31 December 2014.
Activities And Business ReviewSenior plc is a holding company. The nature of the Group’s operations and its principal activities are set out in the Strategic Report on pages 1 to 27. Its Principal Group undertakings are shown on page 114. The Strategic Report includes details of the market overview; key growth drivers; Senior’s business model; strategic objectives; risk and uncertainties; key performance indicators and a summary of 2014 performance.
Acquisitions And disposAlsOn 8 April 2014, Senior acquired 100% of the issued share capital of UPECA Technologies Sdn. Bhd. Further details of the business is given on page 8.
Results And dividendsThe results for the year are shown in the Consolidated Income Statement on page 64.
An interim dividend of 1.67 pence per share (2013 – 1.52 pence) has already been paid and the Directors recommend a final dividend of 3.96 pence per share (2013 – 3.60 pence). The final dividend, if approved, will be payable on 29 May 2015 to shareholders on the register at the close of business on 1 May 2015. This would bring the total dividend for the year to 5.63 pence per share (2013 – 5.12 pence).
shARe cApitAlThe Company has one class of ordinary shares, which carries no right to a fixed income. Each share carries the right to vote at general meetings of the Company. Changes to the Company’s issued share capital during 2014 were:
Shares in issue at 1 January 2014 415,934,031Senior plc Long-Term Incentive Plan 1,358,809 Senior plc Savings-Related Share Option Plan 786,950Shares in issue at 31 December 2014 418,079,790
Further share capital details are given in Note 25.
Details of employee share plans are set out on pages 101 and 102.
There are no specific restrictions on the size of a holding nor on the transfer of shares, which are both governed by the general provisions of the Company’s Articles of Association and prevailing legislation. The Directors are not aware of any agreements between holders of the Company’s shares that may result in restrictions on the transfer of securities or on voting rights. No person has any special rights of control over the Company’s share capital, and all issued shares are fully paid.
With regard to the appointment and replacement of Directors, the Company is governed by its Articles of Association, the UK Corporate Governance Code, the Companies Act 2006 and related legislation. The Articles may be amended by special resolution of the shareholders. The powers of Directors are described in the Matters Reserved for the PLC Board, which may be found on the Company’s website. Each year, shareholder approval is sought to renew the Board’s authority to allot relevant securities.
There are also a number of other agreements that take effect, alter or terminate upon a change of control of the Company, such as commercial contracts, bank loan agreements, property lease arrangements, and employees’ share plans. None of these are considered to be significant in terms of their likely impact on the business of the Group as a whole. Furthermore, the Directors are not aware of any agreements between the Company and its Directors or employees that provide for compensation for loss of office or employment that occurs because of a takeover bid.
FinAnciAl instRumentsNote 20 contains disclosures on Financial Instruments.
diRectoRsDetails of the Directors who served throughout the year can be found on pages 32 and 33. The Directors’ interests in the shares of the Company are included in the Directors’ Remuneration Report on page 56. None of the Directors has any interest in contracts with the Company or its subsidiary undertakings.
The provisions of the UK Corporate Governance Code require that all Directors of FTSE 350 companies should be subject to annual election by shareholders. Celia Baxter, Charles Berry, Andy Hamment, Derek Harding, Giles Kerr and Mark E. Vernon will all stand for re-election at the Annual General Meeting (the “AGM”) in April 2015. David Squires is to be appointed to the Board on 1 May 2015 and Mark Rollins will retire from the Board on 31 May 2015.
BoARd diveRsityThe Board remains committed to diversity, previously having an aspirational goal of 15% female Board representation by the end of 2013. The appointment of Celia Baxter to the Board means this goal was broadly met. The engineering sector suffers from a shortage of female personnel and as a result it can be hard to find appropriate candidates. It should be noted that Senior takes into account all aspects of a potential candidate, not just diversity.
diRectoRs’ indemnitiesQualifying third-party indemnity provisions for the benefit of the Directors were renewed by the Company during the year and remain in force at the date of this Report.
ReseARch And developmentIn 2014, the Group incurred £11.5m (2013 – £12.9m) on research and development. Product development and improving manufacturing techniques represent the primary focus of the Group’s research and development activities.
politicAl donAtionsNo political donations were made during the year.
employeesThe Group promotes the dissemination of relevant information, so that employees are kept regularly advised of Group and local operation developments. Where appropriate, local briefing sessions are held concerning such matters as health and safety, pension plans and healthcare benefits.
Annual Report & Accounts 201434
www.seniorplc.com | Senior plc
Report of the directors
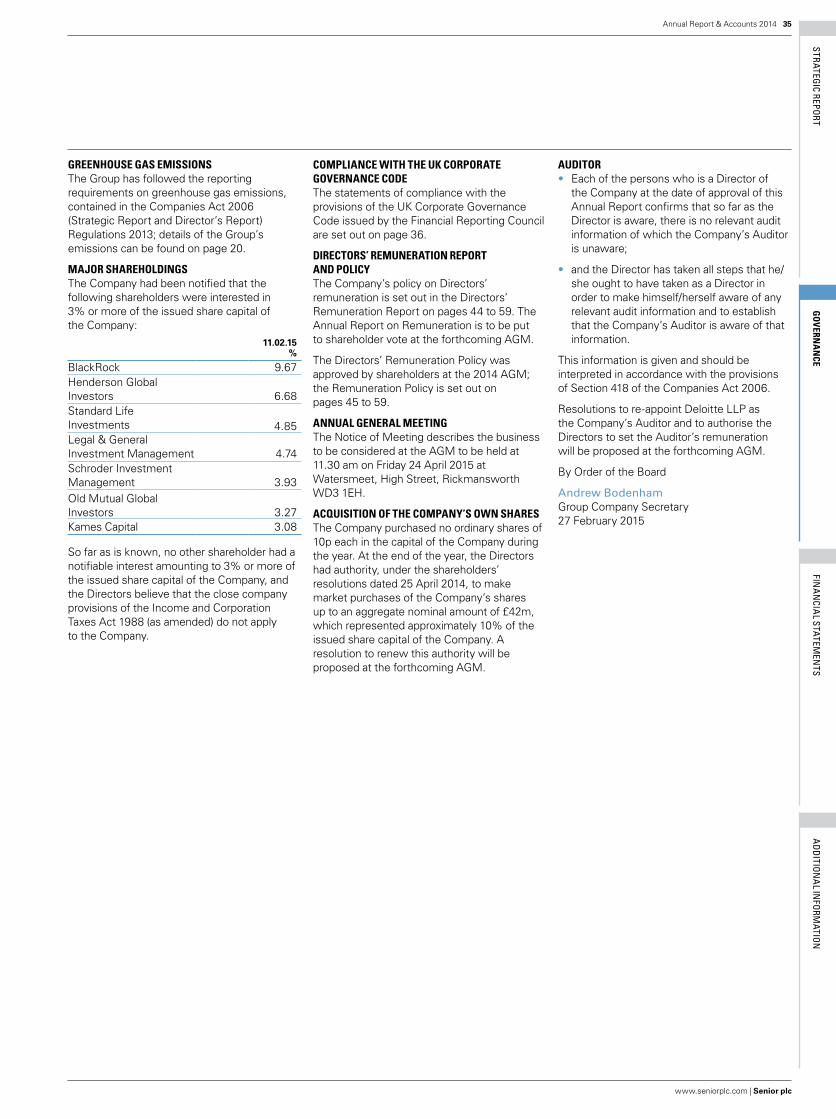
STRATEGIC REPORT
GO
VERNA
NCE
FINA
NCIA
L STATEMEN
TSA
DDITIO
NA
L INFO
RMATIO
N
compliAnce with the uK coRpoRAte GoveRnAnce codeThe statements of compliance with the provisions of the UK Corporate Governance Code issued by the Financial Reporting Council are set out on page 36.
diRectoRs’ RemuneRAtion RepoRt And policyThe Company’s policy on Directors’ remuneration is set out in the Directors’ Remuneration Report on pages 44 to 59. The Annual Report on Remuneration is to be put to shareholder vote at the forthcoming AGM.
The Directors’ Remuneration Policy was approved by shareholders at the 2014 AGM; the Remuneration Policy is set out on pages 45 to 59.
AnnuAl GeneRAl meetinGThe Notice of Meeting describes the business to be considered at the AGM to be held at 11.30 am on Friday 24 April 2015 at Watersmeet, High Street, Rickmansworth WD3 1EH.
Acquisition oF the compAny’s own shAResThe Company purchased no ordinary shares of 10p each in the capital of the Company during the year. At the end of the year, the Directors had authority, under the shareholders’ resolutions dated 25 April 2014, to make market purchases of the Company’s shares up to an aggregate nominal amount of £42m, which represented approximately 10% of the issued share capital of the Company. A resolution to renew this authority will be proposed at the forthcoming AGM.
AuditoR• Each of the persons who is a Director of
the Company at the date of approval of this Annual Report confirms that so far as the Director is aware, there is no relevant audit information of which the Company’s Auditor is unaware;
• and the Director has taken all steps that he/she ought to have taken as a Director in order to make himself/herself aware of any relevant audit information and to establish that the Company’s Auditor is aware of that information.
This information is given and should be interpreted in accordance with the provisions of Section 418 of the Companies Act 2006.
Resolutions to re-appoint Deloitte LLP as the Company’s Auditor and to authorise the Directors to set the Auditor’s remuneration will be proposed at the forthcoming AGM.
By Order of the Board
Andrew BodenhamGroup Company Secretary 27 February 2015
GReenhouse GAs emissionsThe Group has followed the reporting requirements on greenhouse gas emissions, contained in the Companies Act 2006 (Strategic Report and Director’s Report) Regulations 2013; details of the Group’s emissions can be found on page 20.
mAjoR shAReholdinGsThe Company had been notified that the following shareholders were interested in 3% or more of the issued share capital of the Company:
11.02.15%
BlackRock 9.67Henderson Global Investors 6.68Standard Life Investments 4.85Legal & General Investment Management 4.74Schroder Investment Management 3.93Old Mutual Global Investors 3.27Kames Capital 3.08
So far as is known, no other shareholder had a notifiable interest amounting to 3% or more of the issued share capital of the Company, and the Directors believe that the close company provisions of the Income and Corporation Taxes Act 1988 (as amended) do not apply to the Company.
35Annual Report & Accounts 2014
www.seniorplc.com | Senior plc

The Board delegates a certain number of its responsibilities to the Audit, Remuneration, Nominations, and Health, Safety & Environment (“HSE”) Committees. The Group Chief Executive, together with the Executive Committee, is responsible for the implementation of the decisions made by the Board and for the day-to-day conduct of the Group’s operations.
The Board meets formally on a regular basis (nine times in 2014); in addition there were three meetings of the Audit Committee in 2014, together with five meetings of the Remuneration Committee and four meetings of the Nominations Committee. There was full attendance at every Board meeting and Committee of the Board during the year with the exceptions noted on page 32. Other Committees are appointed by the Board to deal with treasury matters and specific issues such as acquisitions and disposals.
The minutes arising from all Committee meetings are made available to the Board. Procedures are in place to ensure that all Directors are properly briefed, so that decisions taken by the Board are based on the fullest, up-to-date, available information. The non-executive Directors are encouraged to visit the Group’s operations to meet the local management teams and discuss any issues that they may face. At every Board meeting there are reviews of operational, financial and administrative matters. Health, safety and environmental performance is reviewed by the Board on a regular basis; social and ethical issues, the agreement of budgets and levels of insurance cover are reviewed whenever appropriate.
There is a procedure by which all Directors can obtain independent professional advice at the Company’s expense in furtherance of their duties, if required.
Section B: EffectivenessThe Company’s Nominations Committee leads the process for Board appointments, and supervises management development and succession planning. It also makes recommendations to the Board on all new Board appointments and re-appointments, further details of which can be found on page 39. The Committee, which consists entirely of non-executive Directors, is chaired by Charles Berry, its composition is shown on page 32, and its Terms of Reference may be found on the Company’s website. The Board considers all non-executive Directors of the Company to be independent, having taken into account a list of relationships and circumstances that may appear relevant in determining independence, in accordance with the Corporate Governance Code.
When appointing new Directors, the Nominations Committee is fully cognisant of the benefits of diversity; the Board’s policy on diversity is described on page 39.
David Best retired from the Board at the conclusion of the AGM in April 2014. Details of the appointment of a new Group Chief Executive are included in the Nominations Committee Report on page 39. The Zygos Partnership was the consultancy firm appointed to manage the recruitment process for the Group Chief Executive, which was led by the Chairman. The Zygos Partnership has no other connection with the Company. A summary of the Directors’ biographies appears on page 33. All Directors receive induction upon joining the Board and are encouraged to update their knowledge and skills on a regular basis.
To enable the members of the Board and its Committees to discharge their duties effectively, the Group Company Secretary seeks to ensure that all relevant information is provided to the Directors in a timely manner, in advance of meetings.
coRpoRAte GoveRnAnce RepoRtThis Corporate Governance Report describes the manner in which the Company has applied the Main Principles of the UK Corporate Governance Code (“the Corporate Governance Code”).
stAtement oF compliAnce with the coRpoRAte GoveRnAnce codeThe Company has been in compliance with the Principles set out in Sections A to E of the Corporate Governance Code throughout the year.
ApplicAtion oF the pRinciples oF the coRpoRAte GoveRnAnce codeThe Principles of good corporate governance are detailed in the Corporate Governance Code under five areas. These Principles have each been reviewed by the Directors and are commented upon as follows:
Section A: LeadershipThe Board is structured under a non-executive Chairman, and currently includes two executive Directors and four independent non-executive Directors, who were selected for appointment because of their wide industrial and commercial experience. In addition, the Company has an Executive Committee, chaired by the Group Chief Executive, comprising the executive Directors and other key executives within the Group. Details of the members of the Board and of the Executive Committee are summarised on pages 31 to 33.
The Directors consider that an effective Board is in place which leads and controls the Group, with clear divisions of responsibility between the running of the Board and the running of the Group’s businesses.
The Board is responsible for strategic decisions affecting the Group, including the setting of commercial strategy and the approval of Group budgets and financial statements. It also approves significant financial and contractual commitments made by the Group. The Board’s Terms of Reference more fully describe the responsibilities of the Board and may be found on the Company’s website.
chAiRmAn’s letteRI am pleased to present the Group’s Corporate Governance Report for 2014 on behalf of the Board. This report is intended to provide shareholders with a clear and meaningful explanation of what governance means to the Board and how this guides its decision-making process. Good corporate governance is taken seriously across the Group; the Board sets the tone and takes the lead on all governance matters.
I am pleased to confirm that the Board reviewed the requirements of the UK Corporate Governance Code in 2014 and I confirm that the Company complies, and will continue to do so.
Charles BerryChairman
Annual Report & Accounts 201436
www.seniorplc.com | Senior plc
corporate governance report
STRATEGIC REPORT
GO
VERNA
NCE
FINA
NCIA
L STATEMEN
TSA
DDITIO
NA
L INFO
RMATIO
N
Following a formal review of the Board and its Committees by Independent Audit Limited in 2012, the Board undertook a self-assessment exercise in 2014. The review’s findings showed that the Board operated effectively throughout the period and made some suggestions for its future development. The findings will be used to help support the development of the Board as the Group continues with its strategy to grow profitability, both organically and by acquisition. Independent Audit Limited has no other connection with the Company.
In addition, in 2014 the Chairman undertook a review of the performance of individual Directors; this process involved one-on-one appraisal interviews. The results of the evaluation process are used to improve Board performance and to determine the training needs of the Directors. Andy Hamment, in consultation with the Directors, undertook an evaluation of the Chairman’s performance, and concluded that Charles Berry provided effective leadership of the Board. Based on the results of the performance evaluation process, the Chairman considers that all members of the Board, the Board collectively, and its Committees, continue to contribute effectively to the running of the Company.
In compliance with the Corporate Governance Code, all Directors offered themselves for re-election at the Company’s AGM 2014, with the exception of David Best, who retired from the Board at the conclusion of the Meeting. At the AGM 2015, all Directors will again offer themselves for election or re-election with the exception of Mark Rollins who is to retire from the Board on 31 May 2015.
Section C: Accountability The Board determines the nature and extent of the significant actions necessary to achieve its strategic objectives and maintains a sound system of internal control. The Company’s Audit Committee reports to and, for certain matters, advises the Board of Directors. The Audit Committee Report on pages 40 to 43 describes the role and activities of the Audit Committee, together with the significant issues that it considered in relation to the 2014 Financial Statements and its relationship with the internal and external auditor.
An explanation of how the Board assessed the effectiveness of the external audit process, the approach taken to re-appoint the external Auditor and the Company’s policy on the tendering of the external audit are to be found on pages 42 to 43.
Communicating the Code and operating with integritySenior trains its employees on the requirements of its Code of Business Conduct upon induction, educating them on what they can and cannot do, and how to address any ethical dilemmas they may face. The Code is reissued periodically to remind employees of the required level of conduct. The Group’s ethical procedures and Code of Business Conduct (the “Code”) were reviewed in the light of the UK Bribery Act 2010 and anti-bribery training was rolled out across the Group in 2012; this training is now routinely operated on an ongoing basis to new employees. In 2015, it is planned that all relevant employees will be required to complete a refresher course on anti-bribery.
The Board verifies compliance with the Code through its internal audit programme, ensuring that employees have received the mandatory training and its businesses operate with integrity at all times and in compliance with the Code.
Operating with integrity and in an ethical manner builds trust with customers and other stakeholders and underpins the Board’s strategic objectives.
Human rightsThe Group recognises the importance of the Universal Declaration of Human Rights (“UDHR”) and adheres to the core principles and values defined within it. The majority of countries in which Senior operates have their own laws banning child labour and promoting human rights. Senior monitors the ages of its workforce across the world to ensure compliance and identify any potential succession issues.
Senior does not restrict any of its employees in any of the countries in which it operates from joining a trade union if they wish to do so. Senior also works closely with its suppliers to ensure that they at least meet internationally recognised minimum requirements for workers’ welfare and conditions of employment.
Reporting and investigating concerns and whistle-blowingThe Company encourages Group employees to discuss any ethical concerns that they may have with local management.
As part of its internal control procedures, the Company has a Whistle-blowing Policy that is communicated throughout the Group. This policy provides employees with the opportunity to report suspected unethical or illegal corporate conduct confidentially and anonymously. All reports of suspected unethical or illegal corporate conduct are independently investigated and tracked from inception to resolution and, where necessary,
actions are taken to rectify any weakness in systems that may have been identified. These actions, and the overall integrity of the reporting system, are subject to regular scrutiny by the Audit Committee. This process is also available to third parties, such as suppliers and customers. Subject to confidentiality considerations, the outcome of each investigation is provided in so far as is possible, to the complainant.
Andy Hamment is the Company’s Senior Independent Director. His position provides employees and third parties with an alternative channel of communication to resolve issues if they have a concern that the Chairman, Group Chief Executive or Group Finance Director have failed to resolve, or where such contact with them is not appropriate.
Managing external sales agentsThe Board recognises the potential bribery and corruption risks posed by the markets in which the Group operates and, in particular, the use of third-party intermediaries it engages. All external sales agents working on behalf of Senior across the world are required to operate in compliance with the Supplier Code of Business Conduct. Local management conducts a due diligence and risk assessment process prior to engaging or re-appointing any sales agent and issues them with the Code, ensuring that they understand, acknowledge and accept its requirements. In 2013, the Board updated the Supplier Code of Business Conduct and improved the guidance it provided to the Group’s operations, giving detailed information on how they should conduct due diligence and risk assess sales agents.
Managing gifts and hospitalityThe Board recognises that gifts and hospitality have the potential to create a conflict of interest, or the perception of a conflict of interest. As a result, there is a Group policy restricting the receiving and giving of gifts and hospitality from, and to, third parties. This policy requires that all gifts and hospitality must be recorded. The Head of Internal Audit assesses compliance with the Group’s gifts and hospitality policy during audit visits.
Improvements for 2015In 2015, the Board will continue with the measures already established, to ensure that all employees and sales agents understand the Code of Business Conduct and Supplier Code of Business Conduct, as appropriate, and comply with them; it will continue to ensure that all ethical concerns raised are thoroughly investigated. The Board will also give increased focus to this area, by strengthening internal audits on compliance with these Codes, ensuring that the training and awareness of employees is fully effective and that the Code has been issued and acknowledged by all sales agents.
37Annual Report & Accounts 2014
www.seniorplc.com | Senior plc

In 2014, Bindi Foyle moved from her role as Group Financial Controller to the position of Head of Investor Relations & Leadership Development. The purpose of this newly created Investor Relations role is to enable Senior to build and maintain an even closer relationship with its existing and potential institutional shareholders on a regular basis and to openly engage in a dialogue.
No major shareholder requested a meeting with any of the non-executive Directors during the year. The Senior Independent Director is also available to attend meetings with major shareholders upon request, so providing an alternative channel of communication between the Company and its shareholders.
The Company makes constructive use of its AGMs to communicate with its private shareholders. A presentation on the Company’s annual performance was given following completion of the formal business at the 2014 AGM, and a copy of the presentation, together with other investor relations material, is available on the Company’s website.
Section D: RemunerationThe Directors’ Remuneration Report on pages 44 to 59 describes the Board’s approach to remuneration matters. The Directors’ Remuneration Policy was approved by shareholders at the Company’s AGM 2014 and became effective on 25 April 2014.
Section E: Relations with shareholdersThe Company maintains regular contact with its institutional shareholders and continued to consult with its major shareholders during early 2014 when formulating the Directors’ Remuneration Policy. Twice a year, the Group Chief Executive and Group Finance Director undertake a series of meetings with the Company’s major shareholders, following the announcement of the preliminary full-year and interim results, to discuss both the Board’s strategic objectives and the detailed performance of the business. During 2014, the Company’s non-executive Chairman also attended the preliminary full-year and interim results announcements made to analysts, in March and August respectively.
Details of the electronic poll voting for the 2014 AGM are set out in the table below:
ResolutionNumber Resolution
Number of Votes
For
Number of Votes Against
Total Votes Cast (Excluding Withheld) Abstentions
1 To receive Report & Financial Statements 298,700,141 1,479,300 300,179,441 2,2112 To approve Remuneration Report (excluding Remuneration Policy) 284,286,339 10,242,401 294,528,740 5,652,9123 To approve Remuneration Policy 292,870,222 7,174,021 300,044,243 137,4094 To declare a Final Dividend 299,818,452 363,200 300,181,652 05 To re-elect Charles Berry 278,151,228 19,995,105 298,146,333 2,035,3196 To re-elect Andy Hamment 299,757,990 422,843 300,180,833 8197 To re-elect Mark Rollins 299,759,837 421,496 300,181,333 3198 To re-elect Mark E. Vernon 299,750,330 431,003 300,181,333 3199 To elect Celia Baxter 299,663,761 509,880 300,173,641 8,01110 To elect Giles Kerr 299,652,396 451,245 300,103,641 78,01111 To elect Derek Harding 299,746,418 430,973 300,177,391 4,26112 To re-appoint Deloitte LLP 296,210,429 565,784 296,776,213 3,405,43913 To determine Auditor’s remuneration 300,117,141 29,180 300,146,321 35,33114 General power to allot shares 292,020,034 8,160,753 300,180,787 86515 Disapplication of pre-emption rights 294,300,468 323,067 294,623,535 5,558,11716 To renew share buy-back authority 299,838,409 214,611 300,053,020 128,63217 To retain 14-day notice period 291,630,850 8,535,083 300,165,933 15,71818 To approve Senior plc 2014 LTIP Rules 292,933,781 7,163,126 300,096,907 84,745
The total issued share capital of the Company as at 3 March 2014 (the date of the Notice of Meeting for the AGM 2014), was 417.3 million ordinary shares of 10p each. The total number of proxy votes received for the AGM 2014 represented approximately 71.70% (2013 – 73.73%) of the issued share capital of the Company. All resolutions put to shareholders at the AGM 2014 were passed on a poll.
Details of the electronic poll voting received by the Company for the AGM 2014 resolutions are set out in the table below.
Details of the votes to be received by the Company for the AGM 2015 resolutions will be made available on the Company’s website following the close of the meeting.
Charles BerryChairman 27 February 2015
Annual Report & Accounts 201438
www.seniorplc.com | Senior plc
corporate governance report continued
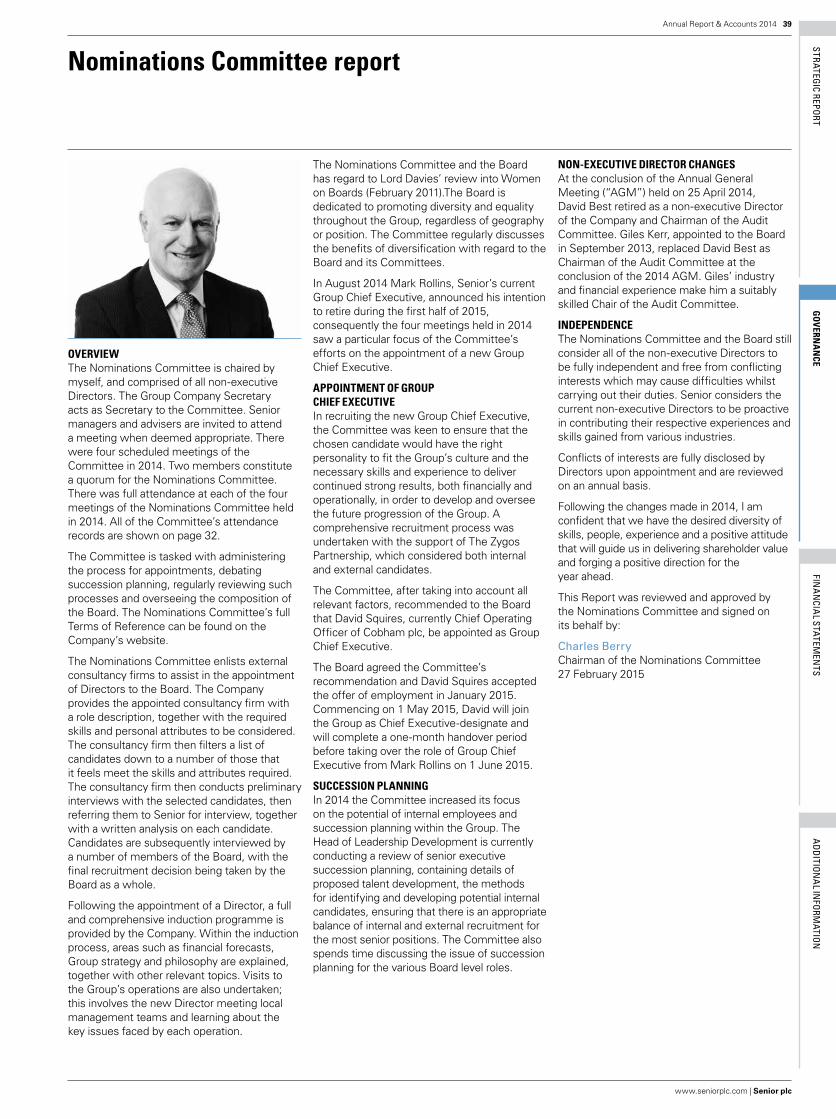
STRATEGIC REPORT
GO
VERNA
NCE
FINA
NCIA
L STATEMEN
TSA
DDITIO
NA
L INFO
RMATIO
N
oveRviewThe Nominations Committee is chaired by myself, and comprised of all non-executive Directors. The Group Company Secretary acts as Secretary to the Committee. Senior managers and advisers are invited to attend a meeting when deemed appropriate. There were four scheduled meetings of the Committee in 2014. Two members constitute a quorum for the Nominations Committee. There was full attendance at each of the four meetings of the Nominations Committee held in 2014. All of the Committee’s attendance records are shown on page 32.
The Committee is tasked with administering the process for appointments, debating succession planning, regularly reviewing such processes and overseeing the composition of the Board. The Nominations Committee’s full Terms of Reference can be found on the Company’s website.
The Nominations Committee enlists external consultancy firms to assist in the appointment of Directors to the Board. The Company provides the appointed consultancy firm with a role description, together with the required skills and personal attributes to be considered. The consultancy firm then filters a list of candidates down to a number of those that it feels meet the skills and attributes required. The consultancy firm then conducts preliminary interviews with the selected candidates, then referring them to Senior for interview, together with a written analysis on each candidate. Candidates are subsequently interviewed by a number of members of the Board, with the final recruitment decision being taken by the Board as a whole.
Following the appointment of a Director, a full and comprehensive induction programme is provided by the Company. Within the induction process, areas such as financial forecasts, Group strategy and philosophy are explained, together with other relevant topics. Visits to the Group’s operations are also undertaken; this involves the new Director meeting local management teams and learning about the key issues faced by each operation.
The Nominations Committee and the Board has regard to Lord Davies’ review into Women on Boards (February 2011).The Board is dedicated to promoting diversity and equality throughout the Group, regardless of geography or position. The Committee regularly discusses the benefits of diversification with regard to the Board and its Committees.
In August 2014 Mark Rollins, Senior’s current Group Chief Executive, announced his intention to retire during the first half of 2015, consequently the four meetings held in 2014 saw a particular focus of the Committee’s efforts on the appointment of a new Group Chief Executive.
Appointment oF GRoup chieF executiveIn recruiting the new Group Chief Executive, the Committee was keen to ensure that the chosen candidate would have the right personality to fit the Group’s culture and the necessary skills and experience to deliver continued strong results, both financially and operationally, in order to develop and oversee the future progression of the Group. A comprehensive recruitment process was undertaken with the support of The Zygos Partnership, which considered both internal and external candidates.
The Committee, after taking into account all relevant factors, recommended to the Board that David Squires, currently Chief Operating Officer of Cobham plc, be appointed as Group Chief Executive.
The Board agreed the Committee’s recommendation and David Squires accepted the offer of employment in January 2015. Commencing on 1 May 2015, David will join the Group as Chief Executive-designate and will complete a one-month handover period before taking over the role of Group Chief Executive from Mark Rollins on 1 June 2015.
succession plAnninGIn 2014 the Committee increased its focus on the potential of internal employees and succession planning within the Group. The Head of Leadership Development is currently conducting a review of senior executive succession planning, containing details of proposed talent development, the methods for identifying and developing potential internal candidates, ensuring that there is an appropriate balance of internal and external recruitment for the most senior positions. The Committee also spends time discussing the issue of succession planning for the various Board level roles.
non-executive diRectoR chAnGesAt the conclusion of the Annual General Meeting (“AGM”) held on 25 April 2014, David Best retired as a non-executive Director of the Company and Chairman of the Audit Committee. Giles Kerr, appointed to the Board in September 2013, replaced David Best as Chairman of the Audit Committee at the conclusion of the 2014 AGM. Giles’ industry and financial experience make him a suitably skilled Chair of the Audit Committee.
independenceThe Nominations Committee and the Board still consider all of the non-executive Directors to be fully independent and free from conflicting interests which may cause difficulties whilst carrying out their duties. Senior considers the current non-executive Directors to be proactive in contributing their respective experiences and skills gained from various industries.
Conflicts of interests are fully disclosed by Directors upon appointment and are reviewed on an annual basis.
Following the changes made in 2014, I am confident that we have the desired diversity of skills, people, experience and a positive attitude that will guide us in delivering shareholder value and forging a positive direction for the year ahead.
This Report was reviewed and approved by the Nominations Committee and signed on its behalf by:
Charles BerryChairman of the Nominations Committee 27 February 2015
39Annual Report & Accounts 2014
www.seniorplc.com | Senior plc
nominations committee report

deAR shAReholdeRThe Audit Committee has been established by the Board and consists entirely of independent non-executive Directors. The primary role of the Audit Committee is to maintain the integrity of the financial reporting of the Group and to ensure appropriate risk management and internal control procedures. To enable the Audit Committee to fulfil this role, its main responsibilities include:
• considering and making recommendations to the Board, and ultimately shareholders for approval, of the appointment of the external auditor, the audit fee, initiating tender processes in accordance with regulatory requirements, and any questions relating to the resignation or dismissal of the external auditor;
• assessing annually the independence and objectivity of the external auditor, its compliance with regulatory requirements and authorising the provision, if any, of non-audit services;
• monitoring the integrity of the half-year and annual Accounts and related formal Company announcements, and reviewing significant financial reporting judgements contained within them, before their submission to the Board;
• discussing with the external auditor issues and reservations, if any, arising from the interim review and final audit and any other matters the external auditor may raise;
• reviewing and approving the terms of the management representation letter addressed to the external auditor;
• reviewing the effectiveness of the internal audit function; considering the major findings of internal audit activities and management’s response; ensuring co-ordination between the Head of Internal Audit and the external auditor and ensuring that the internal audit function is adequately resourced and has appropriate standing within the Group;
• reviewing the effectiveness of the Group’s internal controls and risk management systems ensuring that the process is active and dynamic;
• understanding the strategy at both Group and operational levels to ensure that business risks and other relevant issues are effectively identified and communicated to the Board;
• reviewing the Group’s Whistle-blowing Policy, to ensure that appropriate procedures are in place for employees to raise, in confidence, any concerns that they may have relating to suspected malpractice, illegal acts, omissions or other unethical corporate conduct, regarding financial or other matters; and ensuring that arrangements are in place for investigation of such matters and follow-up action; and
• considering any other topics specifically delegated to the Committee by the Board from time to time.
The Audit Committee is required to report its findings to the Board, identifying any matters which it considers that action or improvement is needed, and to make recommendations as to the steps taken.
composition oF the Audit committee
Member Appointment date
Giles Kerr (Committee Chairman from April 2014) 2 September 2013 Celia Baxter 2 September 2013 Andy Hamment 8 April 2011David Best was Committee Chairman until he retired from the Board in April 2014 1 May 2007
There was full attendance at each of the three meetings of the Audit Committee held in 2014, subject to the appointment dates shown above. Two members constitute a quorum for the Audit Committee. The Group Company Secretary acts as Secretary to the Audit Committee.
David Best retired from the Board at the conclusion of the AGM 2014, at which point Giles Kerr was appointed Chairman of the Audit Committee.
Collectively the members of the Audit Committee have significant commercial and financial experience at a senior management level. Giles Kerr has the recent and relevant financial experience required by the UK Corporate Governance Code to chair the Audit Committee. For details of the qualifications of members of the Audit Committee, please refer to the Board Directors’ biographies shown on page 33.
Audit committee’s teRms oF ReFeRenceThe Board expects the Audit Committee to have an understanding of:
• the principles, contents, and developments in financial reporting, including the applicable accounting standards and statements of recommended practice;
• the key aspects of the Group’s operations, including corporate policies, its products and services, Group financing, and systems of internal control;
• the matters that could influence or distort the presentation of accounts and key figures;
• the principles of, and developments in, company law, sector-specific laws and other relevant corporate legislation;
• the roles of internal and external auditing and risk management; and
• the regulatory framework for the Group’s businesses.
The full Terms of Reference of the Audit Committee may be found on the Company’s website.
The Audit Committee normally invites the non-executive Chairman, Group Chief Executive, Group Finance Director, Group Financial Controller, Head of Internal Audit, and senior representatives of the external audit firm to attend its meetings, although it reserves the right to request any of these individuals to withdraw from any meeting.
The Audit Committee also holds separate discussions with the Head of Internal Audit and external auditor without executive management being present. In addition, the Chairman of the Audit Committee holds separate meetings with the internal and external auditor during the course of the year to discuss both routine and business-relevant matters.
Periodically, the Audit Committee’s Terms of Reference are reviewed to take into account current views on good practice and any recent amendments to the UK Corporate Governance Code. In October 2014, the Audit Committee adopted new Terms of Reference, following their approval by the Board of Directors.
Annual Report & Accounts 201440
www.seniorplc.com | Senior plc
Audit committee report
STRATEGIC REPORT
GO
VERNA
NCE
FINA
NCIA
L STATEMEN
TSA
DDITIO
NA
L INFO
RMATIO
N
Activities oF the Audit committee The Audit Committee met on 21 February 2014 to consider the 2013 year-end report and during the subsequent 12 months conducted the following business on the meeting dates indicated below:
Meeting date 17 July 2014 23 October 2014 19 February 2015
Standing items
•Considered the external auditor’s Interim Review for the half-year ended 30 June 2014.
•Reviewed and approved the terms of the management representation letter addressed to the external auditor.
•Reviewed key accounting judgements.
•Discussed the Group’s Preliminary Announcement and the Interim Report 2014, together with the slides for the analysts’ presentation on the Group’s interim results.
•Reviewed and agreed the basis for going concern to be adopted for the 2014 Interim Report and Accounts.
•Received and considered an internal audit activity report, which provided an update on ongoing matters under review by the Head of Internal Audit and the Audit Committee.
•Approved the fees for non-audit work to be undertaken by the external audit firm in 2014.
•Discussed and approved the external auditor’s audit planning report, including the scope of work, audit approach and fees for the 2014 audit.
•Considered potential areas requiring key accounting judgements.
•Considered the appropriate level of materiality and noted the implication of applying different levels of materiality; the Audit Committee agreed to maintain the level at 7.5% of adjusted profit before tax.
•Received an update from the external auditor on accounting, reporting and governance developments.
•Received and considered a further update from the Head of Internal Audit, noting the progress made during the year, and agreed the operations’ activities that would be the key focus for review in the coming months.
•Undertook a performance evaluation of the Audit Committee.
•Carried out an appraisal exercise on the effectiveness of the external audit process.
•Reviewed and updated the Audit Committee Terms of Reference.
•Considered the Group Whistle-blowing Policy and agreed no changes were required.
•Reviewed and accepted the Report to the Audit Committee on the 2014 audit made by the external auditor.
•Reviewed key accounting judgements, including consideration of those significant issues outlined on page 42.
•Considered the materiality of any unadjusted audit findings.
•Reviewed and discussed the Group’s Preliminary Announcement and the Annual Report & Accounts 2014 and the slides for the analysts’ presentation on the Group’s 2014 results.
•Reviewed and agreed the going concern basis to be adopted for the 2014 Accounts.
•Approved the Audit Committee report for 2014.
•Reviewed the effectiveness of the Group’s risk management and internal control systems and disclosures made in the Annual Report 2014.
•Reviewed the Notice of Meeting for the 2015 Annual General Meeting and the 2015 Annual General Meeting Proxy Form.
•Received and considered a report presented by the Head of Internal Audit, which included the proposed 2015 internal audit plan, and approved the Group Internal Audit Charter.
•Reviewed the status of the Business Continuity Plans and IT Risk Assessments against Group policy.
•Received an update on the progress of the Group’s anti-bribery training programme.
•Considered the retendering of external audit services, which is discussed in detail on page 43.
•Held separate private meetings with the external auditor and the Head of Internal Audit, without executive management being present.
41Annual Report & Accounts 2014
www.seniorplc.com | Senior plc

siGniFicAnt RisKs consideRed By the Audit committee Significant risks considered by the Committee How the risk was addressed by the Committee
Goodwill impairmentThe carrying value of goodwill relies on assumptions and judgements made by executive management.
Management performed an annual impairment assessment for all operating businesses at 31 December 2014.
The Audit Committee recognises the carrying value of goodwill as a key area of judgement and as such closely reviews executive management’s assumptions at both year-end and the half year.
In relation to the year ended 31 December 2014, a detailed review of the goodwill relating to the acquisitions of Thermal and Composites was undertaken.
For Thermal, which has been impacted by operational and performance issues following its acquisition in November 2013, executive management have considered projections which reflect the medium-term plan to recover the performance of the business but have recognised that trading conditions may be difficult and have therefore disclosed the factors which may contribute to a reasonable possible change. The Audit Committee reviewed these assumptions and was satisfied with the management’s view that no impairment was required.
On 20 January 2015, the Group was notified by Bombardier of the decision to suspend, for an indefinite period of time, the development of its L85 business jet programme. This post balance sheet event triggered a subsequent review of the carrying value of goodwill at the Group’s Composite business in Wichita, USA. As a result, a goodwill impairment charge of £9.4m was taken in 2014. This impairment is excluded from adjusted profit before tax. The Audit Committee discussed the implications of Bombardier’s decision with management and the external auditor and concluded that the impairment was reasonable and justified.
Acquisition accountingThe Group acquired 100% of the issued share capital of Upeca on 8 April 2014 for an aggregate consideration of MYR415m (£75.5m) There is judgement in determining the valuation of the intangible assets and associated goodwill with the acquisition.
The Group recognised goodwill of £36.5m and intangible assets of £17.8m on the acquisition of Upeca. The Audit Committee held discussions with executive management regarding the procedures performed to fair value the assets and liabilities acquired.
The external auditor provided the Audit Committee with details of the audit work performed to assess that the assets and liabilities are held at fair value.
The Audit Committee was satisfied that the assumptions used were appropriate and that the assets and liabilities are valued at fair value.
ProvisionsProvisions or accurals are held where management considers there is an obligation, payment is probable and the amount payable can be reliably estimated.
Provisions held by the Group include but are not limited to:
•those held against inventory;
•central UK and US tax provisions;
•centrally held, primarily warranty-related; and
•workers’ compensation.
The Audit Committee considered the basis upon which management had made its accounting judgements to determine the level of provisions.
These were further discussed with the external auditor.
The Audit Committee believes there are no reportable issues arising from these significant areas of judgement.
exteRnAl Audit Independence of the external auditor and policy on non-audit servicesTo fulfil its responsibility regarding the independence of the external auditor, the Audit Committee reviewed:
• a report from the external auditor describing the arrangements that had been made to identify, report and manage any conflicts of interest and to maintain its independence;
• the overall extent of non-audit services provided by the external auditor; and
• the FRC’s Audit Inspection Unit public report on Deloitte.
The Audit Committee’s policy in respect of services provided by the external auditor is as follows:
• the external auditor is invited to provide services which, in its position as auditor, it must or is best placed to undertake. This includes formalities relating to borrowings, shareholder and other circulars, various
Annual Report & Accounts 201442
www.seniorplc.com | Senior plc
Audit committee report continued

STRATEGIC REPORT
GO
VERNA
NCE
FINA
NCIA
L STATEMEN
TSA
DDITIO
NA
L INFO
RMATIO
N
other regulatory reports and certain work in respect of larger acquisitions and disposals;
• the auditor may provide tax compliance and advice where it is best suited. In all material cases such work is put out to tender; and
• other services may not be provided where precluded by ethical standards or where the Audit Committee believes that it would compromise audit independence and objectivity.
All proposed contracts for services to be provided by the auditor in excess of £25,000 require the Audit Committee’s approval.
In 2014, the level of non-audit work undertaken by Deloitte increased, as the Group reviewed its tax arrangements and undertook a number of projects which required advice and assistance from professional advisers. Fees for each category of non-audit work undertaken in the year are shown in the table below:
Fees£000
Other tax advisory services 0.2Total non-audit fees 0.2Non-audit fees as a % of total audit fees 29%
The Audit Committee considers that it was beneficial for the Company to retain Deloitte for this non-audit work because of the firm’s expertise in this area and knowledge of the Group. The Audit Committee continues to closely monitor the nature and level of such non-audit work, in order to balance objectivity and value for money.
Policy on tendering The Committee notes that the transitional guidance on audit tendering issued by the FRC indicated that the Company should tender the audit, at the latest, at the time of the next audit partner rotation currently scheduled for 2019. The Committee also notes the final Order from the Competition & Markets Authority (which applies for financial periods beginning on or after 1 January 2015) and the new EU Regulation under which it is likely that audit firms in the UK will need to rotate every 20 years with a tender after 10 years. The transition rules set out in the Order and the EU Regulation mean Senior is required to rotate auditors by 2023. The Company may put the audit out to tender at any time. Deloitte’s performance is reviewed annually by the Audit Committee and the matter will be reviewed on an annual basis.
Assessment of external audit effectivenessAs in prior years, the Audit Committee reviewed the effectiveness of the external auditor process, by assessing a range of key areas. In 2014, the Secretary presented the Audit Committee with a framework of questions to facilitate a debate and to assist the Audit Committee in assessing the level of auditor effectiveness. The framework required Audit Committee members to consider which areas of performance needed future focus by the auditor, the areas where the auditor was meeting expectations and those where the auditor was considered to have a special strength.
The Audit Committee discussed: the audit partner and the team as a whole; the audit planning approach and its execution; the role of executive management in the audit process; communications by the auditor to the Audit Committee and how it supported the work of the Audit Committee. The Audit Committee also discussed what insights the auditor had provided and where it had added value to the overall audit process. The Committee concluded that the auditor had challenged the thinking of the Company and the Audit Committee on a number of significant issues and maintained its independence.
Feedback about the effectiveness of the audit process from the local management teams was also considered by the Audit Committee.
Following completion of the assessment process, the Audit Committee concluded that it is satisfied with the effectiveness of the external auditor; as a consequence the Audit Committee has recommended to the Board that Deloitte LLP be re-appointed as auditor for 2015.
inteRnAl AuditThe Audit Committee is required to assist the Board in fulfilling its responsibilities relating to the effectiveness, resourcing and plans of the Group internal audit function.
The Group’s risk management and internal control procedures are reviewed by the Group’s Head of Internal Audit, who has direct access to the Chairman of the Board and the Audit Committee respectively. The Group’s internal audit function is a key element of the Group’s risk management system and it operates independently of the external auditor to enhance the audit services utilised by the Company.
In 2014, the Audit Committee discussed the resourcing of the internal audit function and the Head of Internal Audit highlighted the context and background to the audit work undertaken. The Head of Internal Audit provided, to the Audit Committee, reports on the progress made on delivering the 2014 internal audit plan key findings and provides a status update on the closure of previous internal audit recommendations. Upon completion of the 2014 internal audit plan, 18 internal audit projects/reviews had been undertaken to support the business in improving the management of risk and internal control; the audits focused on the Group’s operations within the Aerospace and Flexonics Divisions and key Corporate processes.
The non-executive Directors are actively encouraged to visit the Group’s operating businesses unaccompanied by executive Directors. This enables them to meet the local management teams and employees and also undertake site tours to review matters including production methods, health and safety and the status of internal audit findings. In 2014, a total of 28 site visits were undertaken by the Chairman and non-executive Directors. These visits by the non-executive Directors are viewed by the Audit Committee as making a positive contribution to the internal control framework.
conclusionAs a result of its work during the year, the Audit Committee has concluded that it has acted in accordance with its Terms of Reference. At the meeting on 19 February 2015, the Audit Committee considered each section of and the Annual Report & Accounts as a whole, as proposed by the Company; it reached a conclusion and advised the Board that it considered the Annual Report and Accounts 2014 to be fair, balanced and understandable and that it provided the information necessary for shareholders to assess the Company’s business model and strategy. The Chairman of the Audit Committee will be available at the 2015 AGM to answer any questions about the work of the Committee.
AppRovAlThis Report was reviewed and approved by the Audit Committee and signed on its behalf by:
Giles KerrChairman of the Audit Committee 27 February 2015
43Annual Report & Accounts 2014
www.seniorplc.com | Senior plc

deAR shAReholdeRSenior’s primary strategic objective remains the creation of long-term sustainable growth in shareholder value. This has been achieved through a culture of empowerment of autonomous, but collaborative, operations working within a well-defined control framework. We believe that Senior’s remuneration arrangements for the executive Directors, with the level of variable pay focused on the delivery of sustained earnings growth and strong cash flow, continues to support our strategy. This focus has been demonstrated again in 2014 by the continued growth in all Divisions against a backdrop of currency exchange headwinds.
During the year, the Committee reviewed the appropriateness of the performance conditions, relating to the performance shares granted under the 2005 Long-Term Incentive Plan. Taking due consideration of the prevailing economic and market conditions, the Committee decided that the performance conditions used for the grant in 2013 were still suitably stretching for the 2014 award of performance shares. Further, the Committee reviewed the key performance indicators (“KPIs”) for the 2014 annual bonus and it was agreed that earnings per share and cash flow targets were still appropriate and that the target levels were stretching without encouraging inappropriate levels of risk.
The Committee considers that the out-turn of our incentive plans appropriately reflects Senior’s performance in 2014. For example, the Group Chief Executive’s annual bonus was 54% of the maximum opportunity, which equates to 57% of his annual salary, and 92% of the 2012 LTIP share awards are to vest in March 2015. During 2014, Senior’s market capitalisation reached an all-time high and the Company was ranked ninth out of the 31 comparator companies for total shareholder return (“TSR”) performance over the three-year performance period of the 2012 LTIP award. Over the same LTIP
performance period, the annual average percentage growth of Senior’s Adjusted earnings per share exceeded the growth in the Retail Prices Index by 9.6%.
The Policy Report that describes the individual elements of the remuneration arrangements was approved (97.6% votes For) at the 2014 Annual General Meeting (“AGM”) for the period until April 2017. No changes to the Policy Report are being proposed for 2015, however for ease of reference we have included the Policy Report once again in this 2014 Annual Report, although we will only be inviting shareholders to approve the Annual Report on Remuneration, in accordance with the 2013 Regulations, at the 2015 AGM.
Also at the 2014 AGM, the 2014 Long-Term Incentive Plan (“2014 Plan”) was approved (97.6% votes For) by shareholders for a 10-year period. We intend to grant performance shares using the new plan from 2015. The 2014 Plan gives the Remuneration Committee the power to claw back all or part of the awards/payments for three years following vesting in the event of material misstatement, error or inaccurate or misleading information or gross misconduct. A clawback provision is already in place for the annual bonus in relation to unvested deferred shares, in the event of material misstatement or gross misconduct.
During the year, the Committee has considered the 2014 UK Corporate Governance code, the Update to the GC100 and various codes of practice from the institutions. Also during the year, the Shareholding Guidelines for Executive Directors which were already in place were expanded to cover other senior roles.
During 2014, the recruitment policy was used as a basis for determining the remuneration package to facilitate the recruitment of the new Group Chief Executive, David Squires, as detailed on page 59. When he joins Senior in May 2015 David will forfeit entitlements from his current employer. In structuring his recruitment package, the Committee sought to put in place similar long-term incentives with
regard to potential actual value of awards lost and timing of vesting but linking this to the performance conditions of the relevant Senior performance share grants to ensure alignment with the Senior team.
Finally, the Committee having due consideration of the policy on payment for departure from office, considered the treatment of Mark Rollins’ unvested deferred shares and LTIP share awards following his retirement in May 2015; the proposed treatment is shown on page 58.
We have retained the same structure as last year’s Remuneration Report; it consists of three sections:
1. this Annual Statement;
2. a Policy report, which describes the Company’s policy for the Remuneration of executive and non-executive Directors and is unchanged from that which was approved by shareholders for three years at the 2014 Annual General Meeting and which is not subject to audit; and
3. the Annual report on remuneration on pages 51 to 59, produced in accordance with the Large and Medium-Sized Companies and Groups (Accounts and Reports) Amendment Regulations and the relevant provisions of the Listing Rules of the Financial Conduct Authority. Parts of the Annual Report on Remuneration are subject to audit, which provides details of the Directors’ emoluments, shareholdings, long-term incentive awards and pensions for the year ended 31 December 2014 and intentions for 2015.
Celia BaxterChair of the Remuneration Committee
Annual Report & Accounts 201444
www.seniorplc.com | Senior plc
Remuneration report: Annual statement
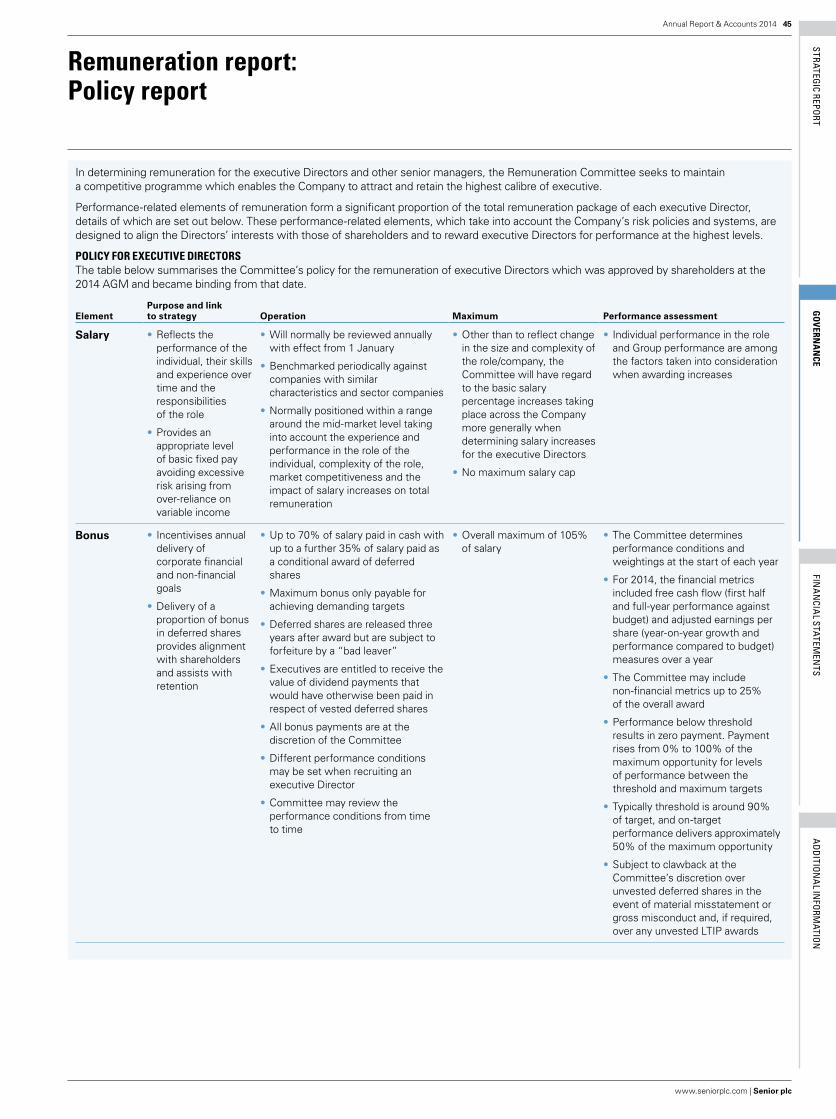
STRATEGIC REPORT
GO
VERNA
NCE
FINA
NCIA
L STATEMEN
TSA
DDITIO
NA
L INFO
RMATIO
N
In determining remuneration for the executive Directors and other senior managers, the Remuneration Committee seeks to maintain a competitive programme which enables the Company to attract and retain the highest calibre of executive.
Performance-related elements of remuneration form a significant proportion of the total remuneration package of each executive Director, details of which are set out below. These performance-related elements, which take into account the Company’s risk policies and systems, are designed to align the Directors’ interests with those of shareholders and to reward executive Directors for performance at the highest levels.
policy FoR executive diRectoRsThe table below summarises the Committee’s policy for the remuneration of executive Directors which was approved by shareholders at the 2014 AGM and became binding from that date.
ElementPurpose and link to strategy Operation Maximum Performance assessment
Salary •Reflects the performance of the individual, their skills and experience over time and the responsibilities of the role
•Provides an appropriate level of basic fixed pay avoiding excessive risk arising from over-reliance on variable income
•Will normally be reviewed annually with effect from 1 January
•Benchmarked periodically against companies with similar characteristics and sector companies
•Normally positioned within a range around the mid-market level taking into account the experience and performance in the role of the individual, complexity of the role, market competitiveness and the impact of salary increases on total remuneration
•Other than to reflect change in the size and complexity of the role/company, the Committee will have regard to the basic salary percentage increases taking place across the Company more generally when determining salary increases for the executive Directors
•No maximum salary cap
• Individual performance in the role and Group performance are among the factors taken into consideration when awarding increases
Bonus • Incentivises annual delivery of corporate financial and non-financial goals
•Delivery of a proportion of bonus in deferred shares provides alignment with shareholders and assists with retention
•Up to 70% of salary paid in cash with up to a further 35% of salary paid as a conditional award of deferred shares
•Maximum bonus only payable for achieving demanding targets
•Deferred shares are released three years after award but are subject to forfeiture by a “bad leaver”
•Executives are entitled to receive the value of dividend payments that would have otherwise been paid in respect of vested deferred shares
•All bonus payments are at the discretion of the Committee
•Different performance conditions may be set when recruiting an executive Director
•Committee may review the performance conditions from time to time
•Overall maximum of 105% of salary
•The Committee determines performance conditions and weightings at the start of each year
•For 2014, the financial metrics included free cash flow (first half and full-year performance against budget) and adjusted earnings per share (year-on-year growth and performance compared to budget) measures over a year
•The Committee may include non-financial metrics up to 25% of the overall award
•Performance below threshold results in zero payment. Payment rises from 0% to 100% of the maximum opportunity for levels of performance between the threshold and maximum targets
•Typically threshold is around 90% of target, and on-target performance delivers approximately 50% of the maximum opportunity
•Subject to clawback at the Committee’s discretion over unvested deferred shares in the event of material misstatement or gross misconduct and, if required, over any unvested LTIP awards
45Annual Report & Accounts 2014
www.seniorplc.com | Senior plc
Remuneration report: policy report

ElementPurpose and link to strategy Operation Maximum Performance assessment
Long-Term Incentive Plan (“LTIP”)
• Incentivises sustained performance over the longer term
•The use of longer-term performance targets and delivery of awards in shares rewards the achievement of the Company’s strategic goals and increases in shareholder value
•Annual grants of performance shares which vest subject to performance measured over three years and continued service
•Executives are entitled to receive the value of dividend payments that would have otherwise been paid in respect of vested deferred shares
•All awards are subject to the discretions contained in the plan rules
•Committee may review the performance conditions from time to time
•100% of salary for LTIPs were awarded in 2014
•150% of salary thereafter
•200% of salary in exceptional circumstances, such as upon recruitment
•The Committee determines performance conditions and weightings at the start of each year providing that the targets are not materially less challenging
•For 2014, the awards were based on a mix of:
– Relative Total Shareholder Return (50% of the award); and
– Group earnings growth targets (50% of the award)
• In respect of each performance element, performance below the threshold target results in zero vesting. Vesting of each performance element starts at the 25% threshold and rises to 100% for maximum level of performance
•Subject to clawback at the Committee’s discretion during the period of three years following the date of vesting
All-Employee Share Schemes
•All employees including executive Directors are encouraged to become shareholders through the operation of the Sharesave Plan, the HMRC-approved all-employee share plans
•The Sharesave Plan has standard terms under which participants can normally enter a savings contract in return for which they are granted options to acquire shares at the market value of the shares at the start of the performance period
•The rules for this plan were approved by shareholders at the 2006 AGM
•Employees can normally elect for a three-year savings contract under standard terms and within HMRC limits
•The option price for Sharesave awards can be set at a discount of up to 20% to the market value of the shares at the start of the savings contract, although no awards granted under the 2006 Sharesave Plan have been set at a discount
•N/A
Pension •Provides competitive retirement benefits for the Group’s employees
•The Group’s UK final salary pension plan closed to future accrual from 6 April 2014. Thereafter, the executive Directors may participate in the Senior plc Group Flexible Retirement Plan (“Senior GFRP”), a contract-based, money purchase pension plan, and/or receive cash allowances
•Bonuses are not included in calculating retirement benefits
•20% of basic salary either as Company contribution to Senior GFRP or as salary in lieu of pension
•N/A
OtherBenefits
•Provides a competitive package of benefits that assists with recruitment and retention
•Benefits include provision of a fully expensed car or car allowance, private medical insurance, life insurance and income protection, tax equalisation and relocation benefits
•The value of benefits is based on the cost to the Company and is not predetermined
•There is no monetary cap on Other Benefits
•N/A
Shareholder Guidelines
•Aligns executive Directors’ interests with that of other shareholders in the Company
•Executive Directors to retain at least 50% of the shares that vest under the LTIP and Deferred Bonus Award, after allowing for tax liabilities, until a shareholding equivalent in value to 100% of base salary is built up
•N/A •N/A
Annual Report & Accounts 201446
www.seniorplc.com | Senior plc
Remuneration report: policy report continued

STRATEGIC REPORT
GO
VERNA
NCE
FINA
NCIA
L STATEMEN
TSA
DDITIO
NA
L INFO
RMATIO
N
RecRuitment oF executive diRectoRsSalaries for newly appointed Directors will be set to reflect their skills and experience, the Company’s intended pay positioning and the market rate for the role.
Where it is appropriate to offer a below median salary initially, the Committee will have the discretion to allow phased salary increases over time for newly appointed Directors, even though this may involve increases in excess of the rate for the wider workforce and inflation.
Benefits will be provided in line with those offered to other employees, with national or international relocation expenses/arrangements (e.g. schooling, tax equalisation) provided for if necessary.
The aggregate incentive offered to new recruits will be no higher than that outlined in the Policy report on pages 45 and 46. The Remuneration Committee has flexibility to grant share awards of up to 200% of salary upon recruitment. Different performance measures may be set initially for the annual bonus and LTIP, taking into account the responsibilities of the individual, and the point in the financial year that they joined. Any increases in incentive quantum offered above this limit would be contingent on the Company receiving shareholder approval for an amendment to its approved policy at its next General Meeting.
Current entitlements (benefits, bonus, share schemes) may be bought out on terms that are no more favourable than a like-for-like basis (with a comparable time horizon, fair value and subject to performance conditions). Existing incentive arrangements will be used to the fullest extent possible, although awards may also be granted outside of these schemes if necessary and as permitted under the Listing Rules.
In the case of an internal hire, any outstanding variable pay awarded in relation to the previous role will be allowed to pay out according to its terms of grant (adjusted as relevant to take into account the Board appointment).
RAtionAle Behind peRFoRmAnce metRics And tARGetsThe performance-related elements take into account the Company’s risk policies and systems and are designed to align the Directors’ interests with those of shareholders. Variable pay elements aim to reward executive Directors for performance at the highest levels and as such, the Committee aims to set targets that are both stretching and achievable. All targets are set on a sliding scale. The Committee reviews the annual bonus measures set for all of the Company’s senior executives (not only the executive Directors) every year in order to ensure that they are aligned with the Company’s strategy and annual goals and to ensure that bonus arrangements amongst the Company’s senior executive team are consistent.
The annual bonus may include a mix of financial and non-financial measures reflecting the key annual priorities of the Group. The financial metrics currently include two of the Company’s KPIs: cash flow which is a key measure of the business’s ability to fund future acquisitions; and EPS which will reflect the Group’s ability to expand into new regions and product markets and increase the profitability of the existing operations. If non-financial measures are selected these may include reference to the Group’s environmental, safety and organisational goals.
The measures currently used in the LTIP are EPS and relative TSR. EPS is a measure of the Company’s overall financial success and TSR provides an external assessment of the Company’s performance against its competitors. It also aligns the rewards received by executives with the returns received by shareholders. The Committee will review the choice of performance measures and the appropriateness of the performance targets prior to each LTIP grant. In particular, the EPS
targets are reviewed prior to each grant by taking account of internal and external expectations of future EPS growth for the business. The Committee reserves the discretion to set different targets for future awards, without consulting with shareholders, providing that, in the opinion of the Committee, the new targets are no less challenging in light of the circumstances at the time than those used previously. The targets for awards granted under this Remuneration Policy are set out in the Annual report on remuneration.
RelAtionship Between executive diRectoR And employee pAyThe remuneration policy for the executive Directors is designed with regard to the policy for employees across the Group as a whole. There are some differences in the structure of the remuneration policy for the executive Directors and other senior employees, which the Remuneration Committee believes are necessary to reflect the different levels of responsibility of employees across the Company and reflect different market norms for different roles. The key differences in remuneration policy between the executive Directors and employees across the Group are the increased emphasis on performance-related pay and the inclusion of a share-based long-term incentive plan for executive Directors.
Executive Directors are provided with a competitive package of benefits that includes (depending on role) participation in the Group’s occupational pension arrangements, provision of a fully expensed car or car allowance, private medical insurance, life insurance and income protection.
The majority of Senior’s managers are eligible to participate in annual bonus arrangements with challenging targets tied to the performance of their employing entity and Division.
Long-term incentives are provided to the most senior executives and those anticipated as having the greatest potential to influence performance levels within the Company. Lower aggregate incentive quantum operates at below executive level with levels driven by the impact of the role and market comparatives.
In order to encourage wider employee share ownership, the Company operates a Sharesave Plan in which UK and US employees, including executive Directors, have participated. During 2013, the Sharesave Plan was offered to employees in other territories so that a greater proportion of the Group’s employees may participate.
how employees’ pAy is tAKen into Account when settinG executive diRectoR RemuneRAtionThe Committee also reviews the salaries of more than 200 senior managers and therefore is fully cognisant of pay levels in the Group when determining the pay of the executive Directors.
In addition, the Committee’s policy is that salary increases for the executive Directors and senior executives should not normally be greater than the general level of increases awarded to other senior managers in Europe and North America, other than when an executive changes role or when it is necessary in order to ensure levels of remuneration remain market competitive. Increases for the general workforce in Europe and North America for 2015 were approximately 2.7% (2014 – approximately 2.5%).
The Company did not consult with employees when drawing up the Directors’ Remuneration Policy set out in this part of the Remuneration report.
47Annual Report & Accounts 2014
www.seniorplc.com | Senior plc

oveRAll BAlAnce oF meAsuRes FoR vARiABle pAyRemuneration scenarios for executive DirectorsThe chart below shows how the composition of both of the executive Directors’ remuneration packages varies at different levels of performance under the Remuneration Policy set out previously.
Threshold Target Max Threshold Target Max
Group Chief Executive Finance Director
0
400
800
1,200
1,600
£000
s
14%547
86%
892
8%
26%
13%
53%
1,505
6%
31%
32%
31%
993
30%
6%
33%
32%
584
51%
13%
9%
26%370
85%
15%
Salary
Benefits and Pension
Annual Bonus
Long-Term Share Awards
This chart is based on the following assumptionsThreshold Target Maximum
Fixed pay Salary is the basic salary as at 1 January 2015
The value of Benefits and Pension is taken from the single total figure of remuneration for 2014
Annual bonus Nil Approximately 50% of the maximum payout
100% of the maximum payout
Long-term share awards
Nil 25% vesting under the LTIP (i.e. 25% of 2015 basic salary) and set out at face value, with no share price growth or dividend assumptions
100% vesting under the LTIP (i.e. 100% of 2015 basic salary) and set out at face value, with no share price growth or dividend assumptions
policy on outside AppointmentsThe Remuneration Committee believes that it is beneficial both for the individual and the Company for an executive Director to take up one external non-executive appointment. Fees paid for the appointment may be retained by the executive.
executive diRectoRs’ seRvice AGReements And loss oF oFFice pAymentsThe table below summarises the key provisions of each executive Director’s contract:Provision Detailed terms
Employment contract dates
Mark Rollins – 9 November 2007 Derek Harding – 27 March 2013
Notice period 12 months from both the Company and the executive DirectorTermination payment Contracts may be terminated without notice by the payment of a sum equal to the sum of salary due for the unexpired
notice period, and the value of pension contributions and other benefits such as use of company car, life cover and private healthcare
In addition, Mark Rollins’ contract provides for the payment of a performance-related bonus calculated pro rata to the termination date
There are no provisions in the agreements, or otherwise, for additional termination payments
Payments may be made in monthly instalments and, in these circumstances, there is a requirement for the Director to mitigate loss
Change of control There are no enhanced provisions in relation to a change of control
Copies of the executive Directors’ service contracts are available from the Group Company Secretary at the Company’s Registered Office during normal business hours. The Committee’s policy in the event of early termination of employment is set out on page 49.
Annual Report & Accounts 201448
www.seniorplc.com | Senior plc
Remuneration report: policy report continued
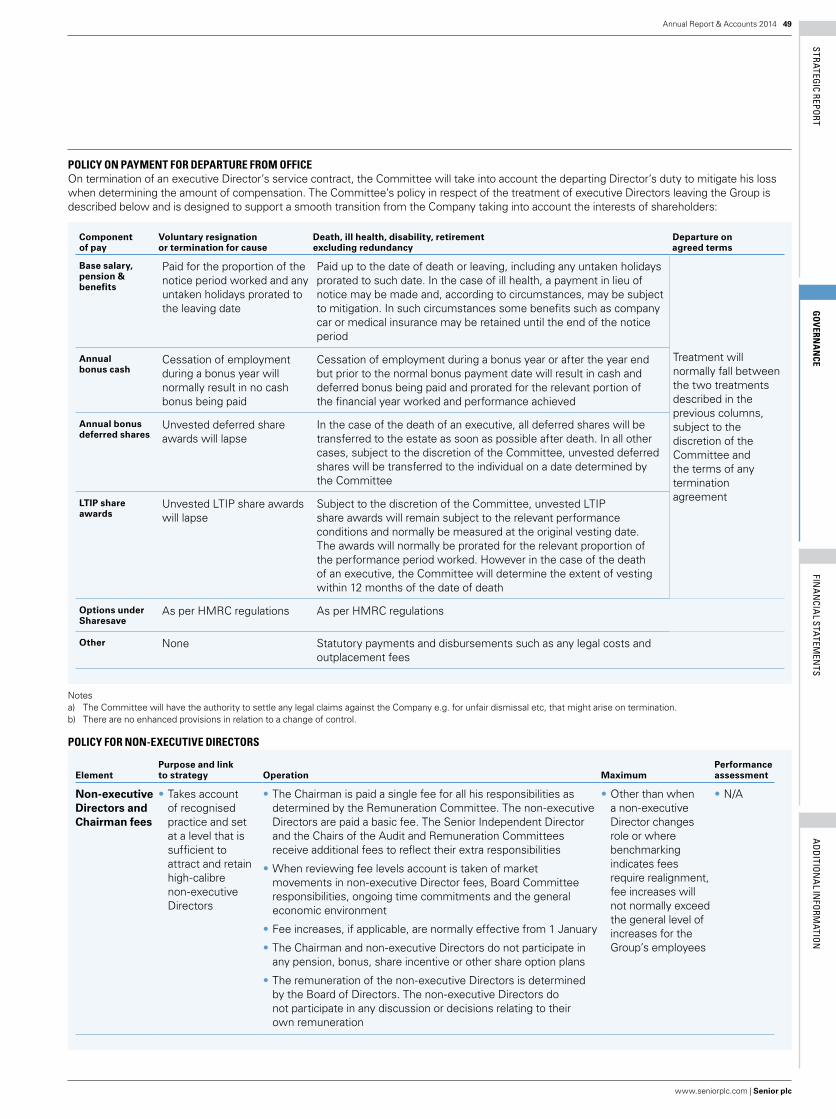
STRATEGIC REPORT
GO
VERNA
NCE
FINA
NCIA
L STATEMEN
TSA
DDITIO
NA
L INFO
RMATIO
N
policy on pAyment FoR depARtuRe FRom oFFiceOn termination of an executive Director’s service contract, the Committee will take into account the departing Director’s duty to mitigate his loss when determining the amount of compensation. The Committee’s policy in respect of the treatment of executive Directors leaving the Group is described below and is designed to support a smooth transition from the Company taking into account the interests of shareholders:
Component of pay
Voluntary resignation or termination for cause
Death, ill health, disability, retirementexcluding redundancy
Departure onagreed terms
Base salary, pension & benefits
Paid for the proportion of the notice period worked and any untaken holidays prorated to the leaving date
Paid up to the date of death or leaving, including any untaken holidays prorated to such date. In the case of ill health, a payment in lieu of notice may be made and, according to circumstances, may be subject to mitigation. In such circumstances some benefits such as company car or medical insurance may be retained until the end of the notice period
Treatment will normally fall between the two treatments described in the previous columns, subject to the discretion of the Committee and the terms of any termination agreement
Annual bonus cash
Cessation of employment during a bonus year will normally result in no cash bonus being paid
Cessation of employment during a bonus year or after the year end but prior to the normal bonus payment date will result in cash and deferred bonus being paid and prorated for the relevant portion of the financial year worked and performance achieved
Annual bonus deferred shares
Unvested deferred share awards will lapse
In the case of the death of an executive, all deferred shares will be transferred to the estate as soon as possible after death. In all other cases, subject to the discretion of the Committee, unvested deferred shares will be transferred to the individual on a date determined by the Committee
LTIP share awards
Unvested LTIP share awards will lapse
Subject to the discretion of the Committee, unvested LTIP share awards will remain subject to the relevant performance conditions and normally be measured at the original vesting date. The awards will normally be prorated for the relevant proportion of the performance period worked. However in the case of the death of an executive, the Committee will determine the extent of vesting within 12 months of the date of death
Options under Sharesave
As per HMRC regulations As per HMRC regulations
Other None Statutory payments and disbursements such as any legal costs and outplacement fees
Notes a) The Committee will have the authority to settle any legal claims against the Company e.g. for unfair dismissal etc, that might arise on termination. b) There are no enhanced provisions in relation to a change of control.
policy FoR non-executive diRectoRs
ElementPurpose and link to strategy Operation Maximum
Performance assessment
Non-executive Directors and Chairman fees
•Takes account of recognised practice and set at a level that is sufficient to attract and retain high-calibre non-executive Directors
•The Chairman is paid a single fee for all his responsibilities as determined by the Remuneration Committee. The non-executive Directors are paid a basic fee. The Senior Independent Director and the Chairs of the Audit and Remuneration Committees receive additional fees to reflect their extra responsibilities
•When reviewing fee levels account is taken of market movements in non-executive Director fees, Board Committee responsibilities, ongoing time commitments and the general economic environment
•Fee increases, if applicable, are normally effective from 1 January
•The Chairman and non-executive Directors do not participate in any pension, bonus, share incentive or other share option plans
•The remuneration of the non-executive Directors is determined by the Board of Directors. The non-executive Directors do not participate in any discussion or decisions relating to their own remuneration
•Other than when a non-executive Director changes role or where benchmarking indicates fees require realignment, fee increases will not normally exceed the general level of increases for the Group’s employees
•N/A
49Annual Report & Accounts 2014
www.seniorplc.com | Senior plc
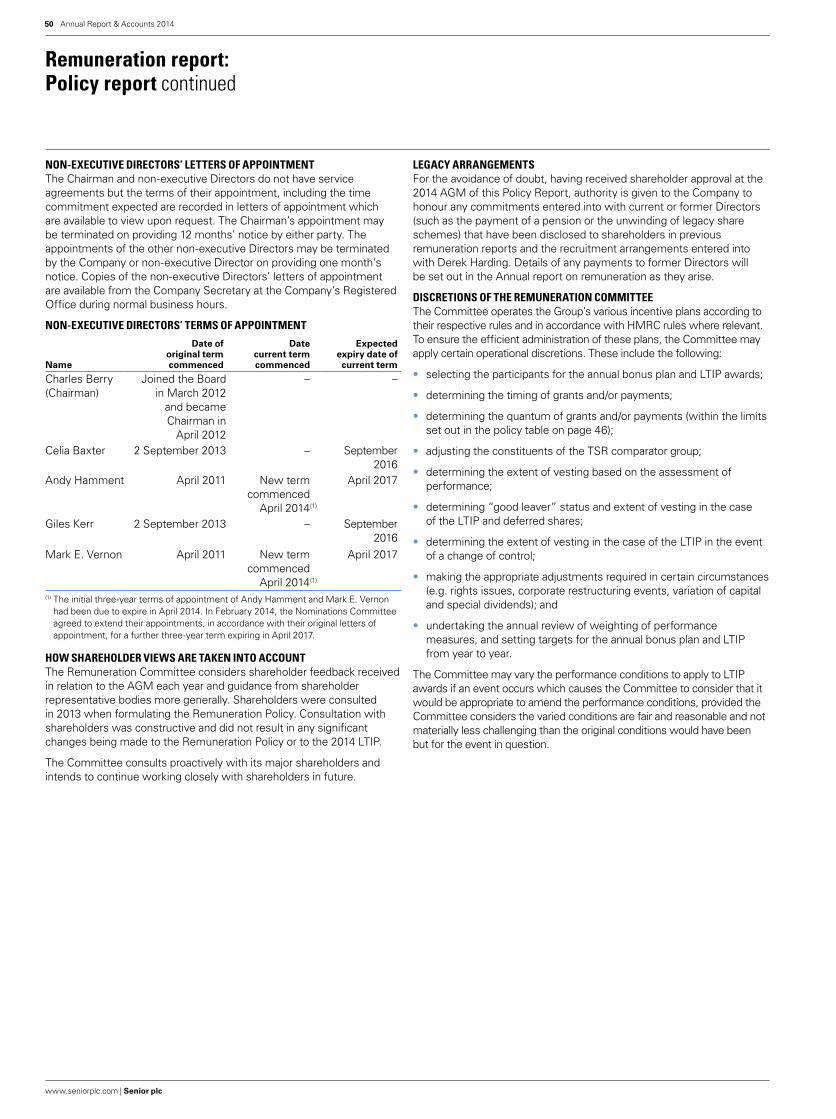
non-executive diRectoRs’ letteRs oF AppointmentThe Chairman and non-executive Directors do not have service agreements but the terms of their appointment, including the time commitment expected are recorded in letters of appointment which are available to view upon request. The Chairman’s appointment may be terminated on providing 12 months’ notice by either party. The appointments of the other non-executive Directors may be terminated by the Company or non-executive Director on providing one month’s notice. Copies of the non-executive Directors’ letters of appointment are available from the Company Secretary at the Company’s Registered Office during normal business hours.
non-executive diRectoRs’ teRms oF Appointment
Name
Date of original term commenced
Datecurrent term commenced
Expected expiry date of current term
Charles Berry (Chairman)
Joined the Board in March 2012
and became Chairman in
April 2012
– –
Celia Baxter 2 September 2013 – September 2016
Andy Hamment April 2011 New termcommenced
April 2014(1)
April 2017
Giles Kerr 2 September 2013 – September 2016
Mark E. Vernon April 2011 New term commenced
April 2014(1)
April 2017
(1) The initial three-year terms of appointment of Andy Hamment and Mark E. Vernon had been due to expire in April 2014. In February 2014, the Nominations Committee agreed to extend their appointments, in accordance with their original letters of appointment, for a further three-year term expiring in April 2017.
how shAReholdeR views ARe tAKen into AccountThe Remuneration Committee considers shareholder feedback received in relation to the AGM each year and guidance from shareholder representative bodies more generally. Shareholders were consulted in 2013 when formulating the Remuneration Policy. Consultation with shareholders was constructive and did not result in any significant changes being made to the Remuneration Policy or to the 2014 LTIP.
The Committee consults proactively with its major shareholders and intends to continue working closely with shareholders in future.
leGAcy ARRAnGementsFor the avoidance of doubt, having received shareholder approval at the 2014 AGM of this Policy Report, authority is given to the Company to honour any commitments entered into with current or former Directors (such as the payment of a pension or the unwinding of legacy share schemes) that have been disclosed to shareholders in previous remuneration reports and the recruitment arrangements entered into with Derek Harding. Details of any payments to former Directors will be set out in the Annual report on remuneration as they arise.
discRetions oF the RemuneRAtion committeeThe Committee operates the Group’s various incentive plans according to their respective rules and in accordance with HMRC rules where relevant. To ensure the efficient administration of these plans, the Committee may apply certain operational discretions. These include the following:
• selecting the participants for the annual bonus plan and LTIP awards;
• determining the timing of grants and/or payments;
• determining the quantum of grants and/or payments (within the limits set out in the policy table on page 46);
• adjusting the constituents of the TSR comparator group;
• determining the extent of vesting based on the assessment of performance;
• determining “good leaver” status and extent of vesting in the case of the LTIP and deferred shares;
• determining the extent of vesting in the case of the LTIP in the event of a change of control;
• making the appropriate adjustments required in certain circumstances (e.g. rights issues, corporate restructuring events, variation of capital and special dividends); and
• undertaking the annual review of weighting of performance measures, and setting targets for the annual bonus plan and LTIP from year to year.
The Committee may vary the performance conditions to apply to LTIP awards if an event occurs which causes the Committee to consider that it would be appropriate to amend the performance conditions, provided the Committee considers the varied conditions are fair and reasonable and not materially less challenging than the original conditions would have been but for the event in question.
Annual Report & Accounts 201450
www.seniorplc.com | Senior plc
Remuneration report: policy report continued

STRATEGIC REPORT
GO
VERNA
NCE
FINA
NCIA
L STATEMEN
TSA
DDITIO
NA
L INFO
RMATIO
N
summARy oF the committee’s teRms oF ReFeRenceThe Terms of Reference of the Remuneration Committee, available in full on the Company’s website, are summarised below:
• determine and agree with the Board the framework or broad policy for the remuneration of the Chairman of the Board, the executive Directors and other members of the executive management as it is designated to consider;
• within the terms of the agreed policy and in consultation with the Chairman and/or Group Chief Executive, as appropriate, determine the total individual remuneration package of the Chairman, each executive Director, and other designated senior executives including bonuses, incentive payments and share options or other share awards;
• approve the design of, and determine targets for, any performance-related pay plans operated by the Company and approve the total annual payments made under such plans;
• review the design of all share incentive plans for approval by the Board and shareholders. For any such plans, determine each year whether awards will be made and if so, the overall amount of such awards, the individual awards to executive Directors, and other designated senior executives and the performance targets to be used;
• determine the policy for, and scope of, pension arrangements for each executive Director and other designated senior executives;
• ensure that contractual terms on termination, and any payments made, are fair to the individual and the Company, that failure is not rewarded and that the duty to mitigate loss is recognised; and
• oversee any major changes in employee benefits structures throughout the Group.
memBeRsThe Remuneration Committee consists entirely of non-executive Directors.
Member
Number ofmeetings
during term
Number ofmeetingsattended
Celia Baxter – Chair 5 5David Best(1) 2 2Charles Berry 5 5Andy Hamment 5 5Giles Kerr 5 5Mark Vernon 5 5(1) David Best was a member of the Remuneration Committee until his retirement from
the Board on 25 April 2014.
otheR Attendees At RemuneRAtion committee meetinGsThe Group Chief Executive attends meetings by invitation and the Group Company Secretary acts as secretary to the Committee but no executive Director or other employee is present during discussions relating to their own remuneration.
AdviseRsBefore recommending proposals for Board approval, the Remuneration Committee may seek advice from external remuneration consultants to ensure that it is fully aware of comparative external remuneration practice as well as shareholder, legislative and regulatory developments. The Committee also considers publicly available sources of information relating to executive remuneration.
All advisers to the Remuneration Committee are appointed and instructed by the Committee. During the year, the Committee was advised by New Bridge Street (an Aon Hewitt company, part of Aon plc) in relation to the 2014 LTIP and the drafting of the rules, and Lane Clark & Peacock (“LCP”) in relation to the review of the remuneration packages of the executive Directors and senior managers, and the executive Directors’ pension arrangements. New Bridge Street has no other connection with the Company; LCP is appointed by the Trustee of the Senior plc Pension Plan to act as the Plan’s Actuary and Investment Adviser. During 2014, the Company incurred fees of £13,715 from New Bridge Street and £20,502 from LCP in relation to advice on executive remuneration and these costs were based on hourly rates.
The Committee does not have a formal policy of subjecting its remuneration consultants to a regular fixed-term rotation, although the Committee remains cognisant of the need to achieve objective advice and good value whilst also benefiting from the consultants’ knowledge of the Company. The Committee is satisfied that the advice it has received during 2014 has been objective and independent.
51Annual Report & Accounts 2014
www.seniorplc.com | Senior plc
Remuneration report: Annual report on remuneration
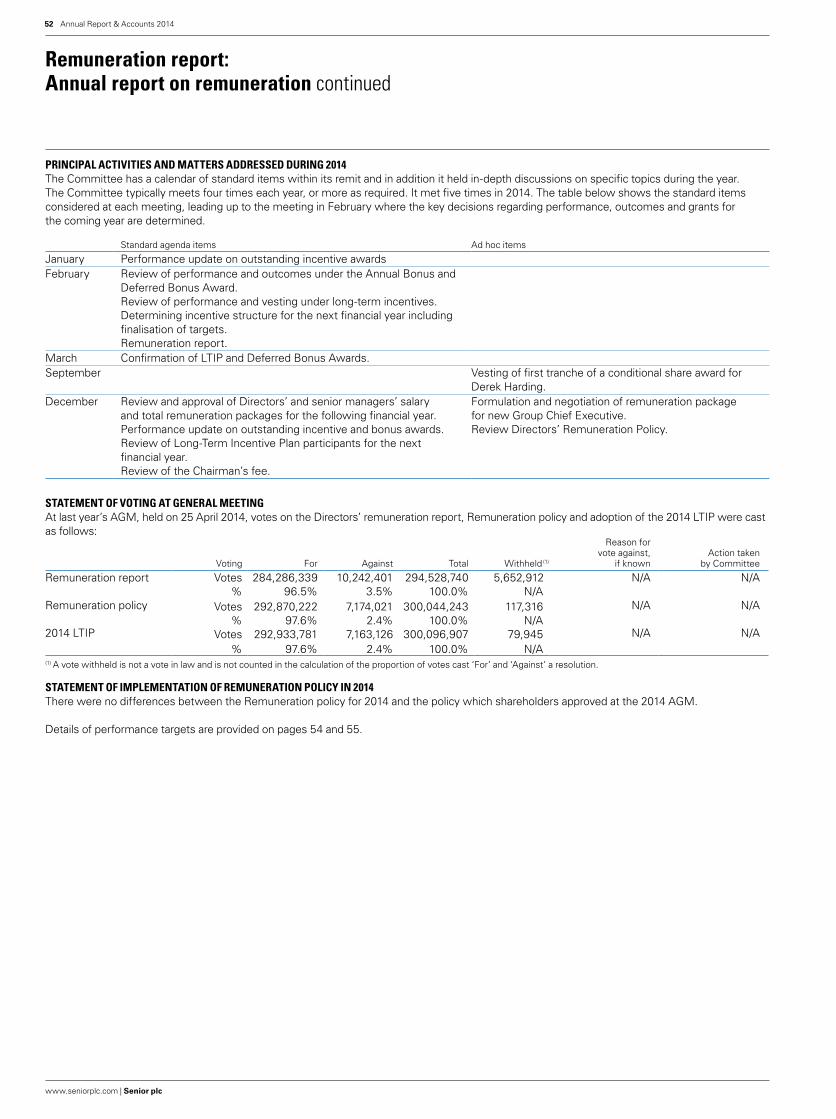
pRincipAl Activities And mAtteRs AddRessed duRinG 2014The Committee has a calendar of standard items within its remit and in addition it held in-depth discussions on specific topics during the year. The Committee typically meets four times each year, or more as required. It met five times in 2014. The table below shows the standard items considered at each meeting, leading up to the meeting in February where the key decisions regarding performance, outcomes and grants for the coming year are determined.
Standard agenda items Ad hoc items
January Performance update on outstanding incentive awardsFebruary Review of performance and outcomes under the Annual Bonus and
Deferred Bonus Award.Review of performance and vesting under long-term incentives.Determining incentive structure for the next financial year including finalisation of targets.Remuneration report.
March Confirmation of LTIP and Deferred Bonus Awards.September Vesting of first tranche of a conditional share award for
Derek Harding.December Review and approval of Directors’ and senior managers’ salary
and total remuneration packages for the following financial year.Formulation and negotiation of remuneration package for new Group Chief Executive.
Performance update on outstanding incentive and bonus awards. Review Directors’ Remuneration Policy.Review of Long-Term Incentive Plan participants for the next financial year.Review of the Chairman’s fee.
stAtement oF votinG At GeneRAl meetinGAt last year’s AGM, held on 25 April 2014, votes on the Directors’ remuneration report, Remuneration policy and adoption of the 2014 LTIP were cast as follows:
Voting For Against Total Withheld (1)
Reason for vote against,
if knownAction taken
by Committee
Remuneration report Votes 284,286,339 10,242,401 294,528,740 5,652,912 N/A N/A% 96.5% 3.5% 100.0% N/A
Remuneration policy Votes 292,870,222 7,174,021 300,044,243 117,316 N/A N/A% 97.6% 2.4% 100.0% N/A
2014 LTIP Votes 292,933,781 7,163,126 300,096,907 79,945 N/A N/A% 97.6% 2.4% 100.0% N/A
(1) A vote withheld is not a vote in law and is not counted in the calculation of the proportion of votes cast ‘For’ and ‘Against’ a resolution.
stAtement oF implementAtion oF RemuneRAtion policy in 2014There were no differences between the Remuneration policy for 2014 and the policy which shareholders approved at the 2014 AGM.
Details of performance targets are provided on pages 54 and 55.
Annual Report & Accounts 201452
www.seniorplc.com | Senior plc
Remuneration report: Annual report on remuneration continued

STRATEGIC REPORT
GO
VERNA
NCE
FINA
NCIA
L STATEMEN
TSA
DDITIO
NA
L INFO
RMATIO
N
sinGle totAl FiGuRe oF RemuneRAtion (Audited inFoRmAtion)The following table shows a single total figure of remuneration in respect of qualifying services for the 2014 financial year for each executive Director, together with comparative figures for 2013. Aggregate Directors’ emoluments are shown at the end of the Single Total Figure of Remuneration section.
Salaries and fees
£000s
Taxablebenefits and
allowances(5)
£000sBonus(6)
£000s
Recruitmentaward£000s
Long-term incentives(7)
£000s
Pension benefitsincluding cash in
lieu of pension£000s
Total£000s
2014 2013 2014 2013 2014 2013 2014 2013 2014 2013 2014 2013 2014 2013
ExecutivesMark Rollins (1) 410 400 20 19 263 310 – – 568 936 55 61 1,316 1,726Derek Harding (2) 308 100 15 5 174 68 – 325 – – 54 18 551 516Total remuneration 718 500 35 24 437 378 – 325 568 936 109 79 1,867 2,242Non-executivesCharles Berry (Chairman) 148 144 1 3 – – – – – – – – 149 147Celia Baxter (3) 48 13 – – – – – – – – – – 48 13David Best (4) 19 53 – – – – – – – – – – 19 53Andy Hamment 45 40 – – – – – – – – – – 45 40Giles Kerr (3) 46 13 – – – – – – – – – – 46 13Mark E. Vernon 41 40 34 1 – – – – – – – – 75 41Total remuneration 347 303 35 4 – – – – – – – – 382 307(1) Mark Rollins’ 2014 base salary was £463,000 (2013 – £453,000) although he elected to waive £53,000 (2013 – £53,000) of his salary and therefore received a salary of
£410,000 (2013 – £400,000), representing an increase of 2.2%. His bonus for both years was based on salary before waiver. Mark Rollins originally waived part of his salary increase in 2011 so that his percentage increase was broadly in line with the average percentage increase awarded to Group employees.
(2) Derek Harding’s 2013 total reflects him joining part way through the year, on 2 September 2013. His single figure remuneration total includes his Sign-on Awards consisting of a £100,000 cash award and a deferred share award with a face a value of £225,000. Further information on his Sign-on Award can be found on page 55.
(3) Celia Baxter and Giles Kerr’s 2013 totals reflect their joining part way through the year, on 2 September 2013.(4) David Best’s 2014 total reflects him leaving part way through the year, on 25 April 2014.(5) Taxable benefits include the provision of a fully expensed company car or car allowance and private medical insurance. The amount in respect of Mark Vernon, a US-based
Director, relates to the cost of travel to Board Meetings in the UK.(6) Awards under the deferred bonus award, the Enhanced SMIS, in respect of 2014 performance will be granted in March 2015. The deferred bonus element that is to be granted
in the form of shares to Mark Rollins and Derek Harding in March 2015 is included in the cash bonus figure and will be equivalent in value to 18.9% of 2014 base salary, namely £87,500 and £58,100 respectively.
(7) 91.8% of the 2012 LTIP Award is due to vest in March 2015. As the award had not vested at the date this report was signed, the average market value of the shares over the last three months of 2014 of 275.0p has been used to determine the value for the purposes of the single total figure. The 2013 comparator LTIP figure has been re-stated from the figure shown in the Annual Report and Accounts 2013 to reflect the difference in value of the 2011 LTIP award on the actual date of vesting on 20 March 2014 of 297.3p and the estimated value of the LTIP award having used the average market value of the shares over the last three months of 2013 of 284.7p. Consequently, the 2013 total figures have also been restated to reflect changes in the LTIP valuations. Further details on the performance conditions can be found on page 54.
Fees Received FoR outside AppointmentsMark Rollins was appointed a non-executive director of The Vitec Group plc on 2 October 2013 and received total fees of £41,000 during the year (2013 – £9,855).
AnnuAl Fees oF non-executive diRectoRsThe non-executive Directors do not participate in any pension, bonus, share incentive or other share option plans. Their remuneration reflects both the time given and the contribution made by them to the Company’s affairs during the year, including membership or chairmanship of the Board or its Committees. The remuneration of the non-executive Directors is determined by the Board of Directors. The non-executive Directors do not participate in any discussion or decisions relating to their own remuneration. Annual fees for the non-executive Directors were increased on 1 January 2014 and are shown below:
Fees2014
£2013
£Percentage
change
Chairman 147,600 144,000 2.5%Non-executive Director 41,400 40,400 2.5%Chair of Audit Committee (1) 6,500 5,500 9.1%Chair of Remuneration Committee 6,500 5,500 9.1%Senior Independent Director 3,250 2,750 9.1%(1) Giles Kerr was appointed Chair of the Audit Committee upon the retirement from the Board of David Best in April 2014.
senioR mAnAGeRs’ emolumentsIn addition to setting the remuneration of the executive Directors, the Remuneration Committee oversees the remuneration of other senior managers. The table below shows the cumulative benefits of the three Divisional CEOs, the three Divisional CFOs and the three most senior corporate managers.
2014Total
£000s
2013Total
£000s
Short-term employee benefits 2,310 2,391Post-employment benefits 195 196Share-based payments 818 1,018Total 3,323 3,605
53Annual Report & Accounts 2014
www.seniorplc.com | Senior plc
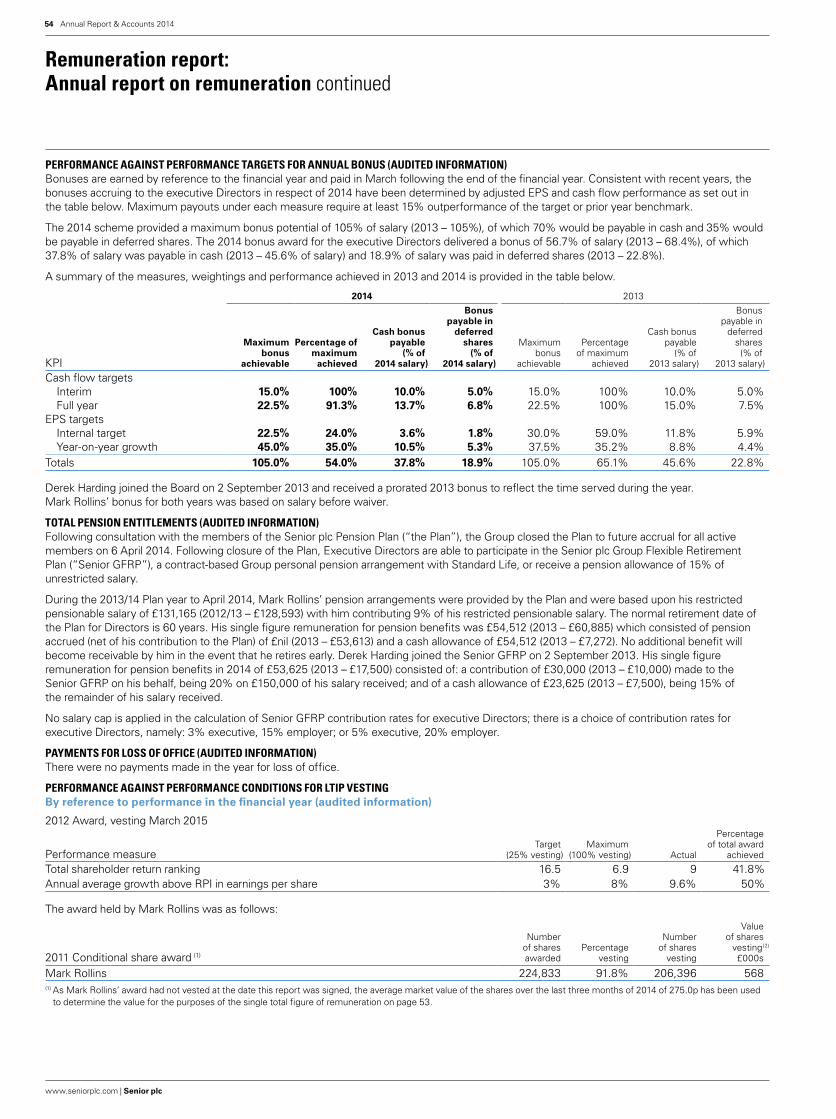
peRFoRmAnce AGAinst peRFoRmAnce tARGets FoR AnnuAl Bonus (Audited inFoRmAtion)Bonuses are earned by reference to the financial year and paid in March following the end of the financial year. Consistent with recent years, the bonuses accruing to the executive Directors in respect of 2014 have been determined by adjusted EPS and cash flow performance as set out in the table below. Maximum payouts under each measure require at least 15% outperformance of the target or prior year benchmark.
The 2014 scheme provided a maximum bonus potential of 105% of salary (2013 – 105%), of which 70% would be payable in cash and 35% would be payable in deferred shares. The 2014 bonus award for the executive Directors delivered a bonus of 56.7% of salary (2013 – 68.4%), of which 37.8% of salary was payable in cash (2013 – 45.6% of salary) and 18.9% of salary was paid in deferred shares (2013 – 22.8%).
A summary of the measures, weightings and performance achieved in 2013 and 2014 is provided in the table below.
2014 2013
KPI
Maximumbonus
achievable
Percentage of maximum
achieved
Cash bonus payable
(% of 2014 salary)
Bonus payable in
deferredshares
(% of 2014 salary)
Maximum bonus
achievable
Percentageof maximum
achieved
Cash bonus payable
(% of 2013 salary)
Bonus payable in
deferredshares (% of
2013 salary)
Cash flow targetsInterim 15.0% 100% 10.0% 5.0% 15.0% 100% 10.0% 5.0%Full year 22.5% 91.3% 13.7% 6.8% 22.5% 100% 15.0% 7.5%
EPS targetsInternal target 22.5% 24.0% 3.6% 1.8% 30.0% 59.0% 11.8% 5.9%Year-on-year growth 45.0% 35.0% 10.5% 5.3% 37.5% 35.2% 8.8% 4.4%
Totals 105.0% 54.0% 37.8% 18.9% 105.0% 65.1% 45.6% 22.8%
Derek Harding joined the Board on 2 September 2013 and received a prorated 2013 bonus to reflect the time served during the year. Mark Rollins’ bonus for both years was based on salary before waiver.
totAl pension entitlements (Audited inFoRmAtion)Following consultation with the members of the Senior plc Pension Plan (“the Plan”), the Group closed the Plan to future accrual for all active members on 6 April 2014. Following closure of the Plan, Executive Directors are able to participate in the Senior plc Group Flexible Retirement Plan (“Senior GFRP”), a contract-based Group personal pension arrangement with Standard Life, or receive a pension allowance of 15% of unrestricted salary.
During the 2013/14 Plan year to April 2014, Mark Rollins’ pension arrangements were provided by the Plan and were based upon his restricted pensionable salary of £131,165 (2012/13 – £128,593) with him contributing 9% of his restricted pensionable salary. The normal retirement date of the Plan for Directors is 60 years. His single figure remuneration for pension benefits was £54,512 (2013 – £60,885) which consisted of pension accrued (net of his contribution to the Plan) of £nil (2013 – £53,613) and a cash allowance of £54,512 (2013 – £7,272). No additional benefit will become receivable by him in the event that he retires early. Derek Harding joined the Senior GFRP on 2 September 2013. His single figure remuneration for pension benefits in 2014 of £53,625 (2013 – £17,500) consisted of: a contribution of £30,000 (2013 – £10,000) made to the Senior GFRP on his behalf, being 20% on £150,000 of his salary received; and of a cash allowance of £23,625 (2013 – £7,500), being 15% of the remainder of his salary received.
No salary cap is applied in the calculation of Senior GFRP contribution rates for executive Directors; there is a choice of contribution rates for executive Directors, namely: 3% executive, 15% employer; or 5% executive, 20% employer.
pAyments FoR loss oF oFFice (Audited inFoRmAtion)There were no payments made in the year for loss of office.
peRFoRmAnce AGAinst peRFoRmAnce conditions FoR ltip vestinGBy reference to performance in the financial year (audited information)
2012 Award, vesting March 2015
Performance measureTarget
(25% vesting)Maximum
(100% vesting) Actual
Percentageof total award
achieved
Total shareholder return ranking 16.5 6.9 9 41.8%Annual average growth above RPI in earnings per share 3% 8% 9.6% 50%
The award held by Mark Rollins was as follows:
2011 Conditional share award (1)
Numberof sharesawarded
Percentagevesting
Numberof shares
vesting
Valueof shares
vesting (2)
£000s
Mark Rollins 224,833 91.8% 206,396 568(1) As Mark Rollins’ award had not vested at the date this report was signed, the average market value of the shares over the last three months of 2014 of 275.0p has been used
to determine the value for the purposes of the single total figure of remuneration on page 53.
Annual Report & Accounts 201454
www.seniorplc.com | Senior plc
Remuneration report: Annual report on remuneration continued

STRATEGIC REPORT
GO
VERNA
NCE
FINA
NCIA
L STATEMEN
TSA
DDITIO
NA
L INFO
RMATIO
N
scheme inteRests AwARded duRinG the FinAnciAl yeAR (Audited inFoRmAtion)
Directors Scheme Basis of
awardFace value
£000s
Percentagevesting atthreshold
performanceNumber
of shares
Performanceperiod end
date
Mark Rollins LTIP Annual award 463 25% 155,421 31 December 2016Derek Harding LTIP Annual award 308 25% 103,222 31 December 2016
The face value of the awards was calculated using the closing share price on 20 March 2014, being the trading day immediately prior to the date of the award, which was 297.9p per share.
cuRRent position on outstAndinG ltip AwARds (non-Audited inFoRmAtion)The following tables show the current position against performance targets for LTIP awards outstanding from 2013 and 2014.
Conditional share awards in 2014 Conditional share awards in 2013
Performance measureTarget
(25% vesting)Maximum
(100% vesting)Actual
to dateTarget
(25% vesting)Maximum
(100% vesting)Actualto date
Total shareholder return ranking 16 6.7 14 16.5 6.9 10Annual average growth above RPI in adjusted earnings per share 4% 10% 2.8% 4% 10% 3.7%
The TSR comparator group applicable to the 2014 LTIP award consists of manufacturing companies within the following FTSE All Share sectors: Aerospace & Defence; Automobiles & Parts; Electronic & Electrical Equipment; and Industrial Engineering. The constituent comparator companies for the 2014 award, broadly similar to those used for each year of award from 2009 onwards, are listed below:
Avon Rubber Fenner Oxford Instruments Spirax-SarcoBAE Systems GKN Qinetiq Group TT ElectronicsBodycote Halma Renishaw Ultra ElectronicsChemring Group Hill & Smith Rolls-Royce Group Vitec GroupCobham IMI Rotork VolexDialight Meggitt Senior Weir GroupDomino Printing Sciences Melrose Severfield-Rowen Xaare2v technologies Morgan Advanced Materials Spectris
TSR is averaged over three months prior to the start and end of the performance period.
siGn-on AwARdsDerek Harding was appointed as Group Finance Director from 2 September 2013. In structuring his recruitment package, the Committee sought as much as possible to partly compensate him for the forfeited entitlements from his previous employer with awards that vest over longer time periods which are subject to performance conditions based on the longer-term performance of Senior and take into account the expected value of the awards. The basis and terms of his sign-on awards were fully disclosed in the 2013 Remuneration Report. In recognition of the fact that Derek Harding was relinquishing awards from his previous employment which were close to vesting or maturity, a cash payment of £100,000 was paid to Derek Harding in December 2013 and the Committee granted him the following awards:
Form of awardFace value
of awardNumber
of shares Vesting conditions
Deferred Share Award under Listing Rule 9.4.2R £225,000 82,720 No performance conditions4/9ths vest on 2 September 20143/9ths vest on 2 September 20152/9ths vest on 2 September 2016
Performance shares under the 2005 LTIP £300,000 107,874 Subject to the same performance conditions as awards granted to other senior executives in 2013. Award is due to vest in
September 2016. 25% vesting at threshold performance
The first tranche of the deferred share award over 37,405 shares, equating to 4/9ths of the total award, together with 641 shares that could have been acquired with the dividend that would have been payable during the deferral period, vested on 2 September 2014. The value of the vested shares, based on the mid-market share price of 291.5p was £109,036.
55Annual Report & Accounts 2014
www.seniorplc.com | Senior plc
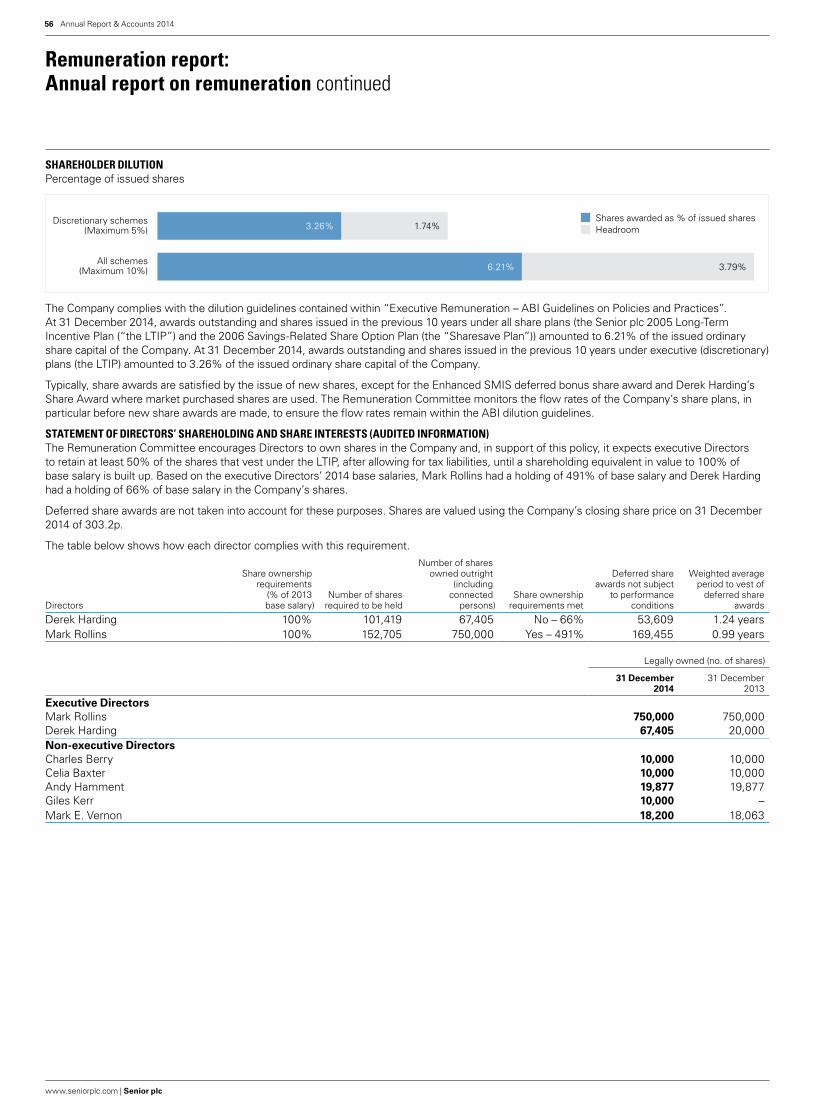
shAReholdeR dilutionPercentage of issued shares
3.26% 1.74%Discretionary schemes(Maximum 5%)
All schemes(Maximum 10%) 6.21% 3.79%
Shares awarded as % of issued sharesHeadroom
The Company complies with the dilution guidelines contained within “Executive Remuneration – ABI Guidelines on Policies and Practices”. At 31 December 2014, awards outstanding and shares issued in the previous 10 years under all share plans (the Senior plc 2005 Long-Term Incentive Plan (“the LTIP”) and the 2006 Savings-Related Share Option Plan (the “Sharesave Plan”)) amounted to 6.21% of the issued ordinary share capital of the Company. At 31 December 2014, awards outstanding and shares issued in the previous 10 years under executive (discretionary) plans (the LTIP) amounted to 3.26% of the issued ordinary share capital of the Company.
Typically, share awards are satisfied by the issue of new shares, except for the Enhanced SMIS deferred bonus share award and Derek Harding’s Share Award where market purchased shares are used. The Remuneration Committee monitors the flow rates of the Company’s share plans, in particular before new share awards are made, to ensure the flow rates remain within the ABI dilution guidelines.
stAtement oF diRectoRs’ shAReholdinG And shARe inteRests (Audited inFoRmAtion)The Remuneration Committee encourages Directors to own shares in the Company and, in support of this policy, it expects executive Directors to retain at least 50% of the shares that vest under the LTIP, after allowing for tax liabilities, until a shareholding equivalent in value to 100% of base salary is built up. Based on the executive Directors’ 2014 base salaries, Mark Rollins had a holding of 491% of base salary and Derek Harding had a holding of 66% of base salary in the Company’s shares.
Deferred share awards are not taken into account for these purposes. Shares are valued using the Company’s closing share price on 31 December 2014 of 303.2p.
The table below shows how each director complies with this requirement.
Directors
Share ownershiprequirements
(% of 2013base salary)
Number of sharesrequired to be held
Number of sharesowned outright
(includingconnected
persons)Share ownership
requirements met
Deferred shareawards not subject
to performanceconditions
Weighted averageperiod to vest of
deferred shareawards
Derek Harding 100% 101,419 67,405 No – 66% 53,609 1.24 yearsMark Rollins 100% 152,705 750,000 Yes – 491% 169,455 0.99 years
Legally owned (no. of shares)
31 December2014
31 December2013
Executive DirectorsMark Rollins 750,000 750,000Derek Harding 67,405 20,000Non-executive DirectorsCharles Berry 10,000 10,000Celia Baxter 10,000 10,000Andy Hamment 19,877 19,877Giles Kerr 10,000 –Mark E. Vernon 18,200 18,063
Annual Report & Accounts 201456
www.seniorplc.com | Senior plc
Remuneration report: Annual report on remuneration continued

STRATEGIC REPORT
GO
VERNA
NCE
FINA
NCIA
L STATEMEN
TSA
DDITIO
NA
L INFO
RMATIO
N
peRFoRmAnce GRAphShare price performanceThe closing middle market price of the shares at 31 December 2014 was 303.2p (2013 – 307.2p). During 2014, the shares traded in the range of 254.6p to 315.5p.
Senior plc total shareholder returnThe following graph compares the total shareholder return of the Company’s shares against the “FTSE All-Share, Aerospace & Defence index”, and the FTSE250 Index over a six-year period (where dividends are included gross of tax). This graph allows a comparison to be made against organisations facing broadly similar economic and market conditions as the Company.
0
200
400
600
800
1,000
Dec 09 Dec 10Dec 08 Dec 11 Dec 12 Dec 13 Dec 14
FTSE All Share Aerospace & Defence Senior FTSE250
RemuneRAtion oF GRoup chieF executive
2009 2010 2011 2012 2013(2) 2014
CEO single figure of total remuneration (£000s) 578 899 1,805 1,529 1,726 1,316Annual variable element award rates against maximum opportunity (%) 38(1) 100 100 92 65 54Long-term incentive vesting rates against maximum opportunity (%) 100 82 100 100 100 91.8(1) Given the difficult time faced by many of the Group’s employees in 2009, Mark Rollins chose to waive, in full, his entitlement to his 2009 performance bonus.(2) The single total figure of remuneration in relation to 2013 has been restated from the figure shown in 2013 Annual Report & Accounts to reflect the difference in the value of
the 2011 LTIP award on the actual date of vesting as detailed in Note 7 on page 53.
peRcentAGe chAnGe in RemuneRAtion oF the GRoup chieF executiveThe table below shows how the percentage change in Mark Rollins’ salary, benefits and bonus between 2013 and 2014 compares with the percentage change in the average of each of those components of pay for a group of employees. The Committee has selected approximately 150 of the Group’s senior managers in Europe and North America, as the operations in these territories deliver approximately 90% of the Group’s revenue, and these senior managers have broadly similarly structured remuneration packages. Businesses acquired by Senior during the year and leavers and joiners in either year have been excluded to prevent distortion.
SalaryTaxablebenefit Bonus
Percentagechange
Percentagechange
Percentagechange
Mark Rollins (1) 2.2% 5.9% -15%Pay of senior managers in Europe and the USA 2.6% 12.2%(2) -16%(1) Salary increase based on change in full basic salary from £453,000 in 2013 to £463,000 in 2014. In 2013, Mark Rollins waived £53,000 of his salary and received £400,000;
he waived £53,000 of his salary in 2014 and received £410,000.(2) For the purposes of making a more valid comparison, the comparator group for the Taxable benefit figure consisted of UK-based senior managers that had a broadly similar
benefits structure as Mark Rollins that included the use of a company car and receipt of private healthcare.
57Annual Report & Accounts 2014
www.seniorplc.com | Senior plc
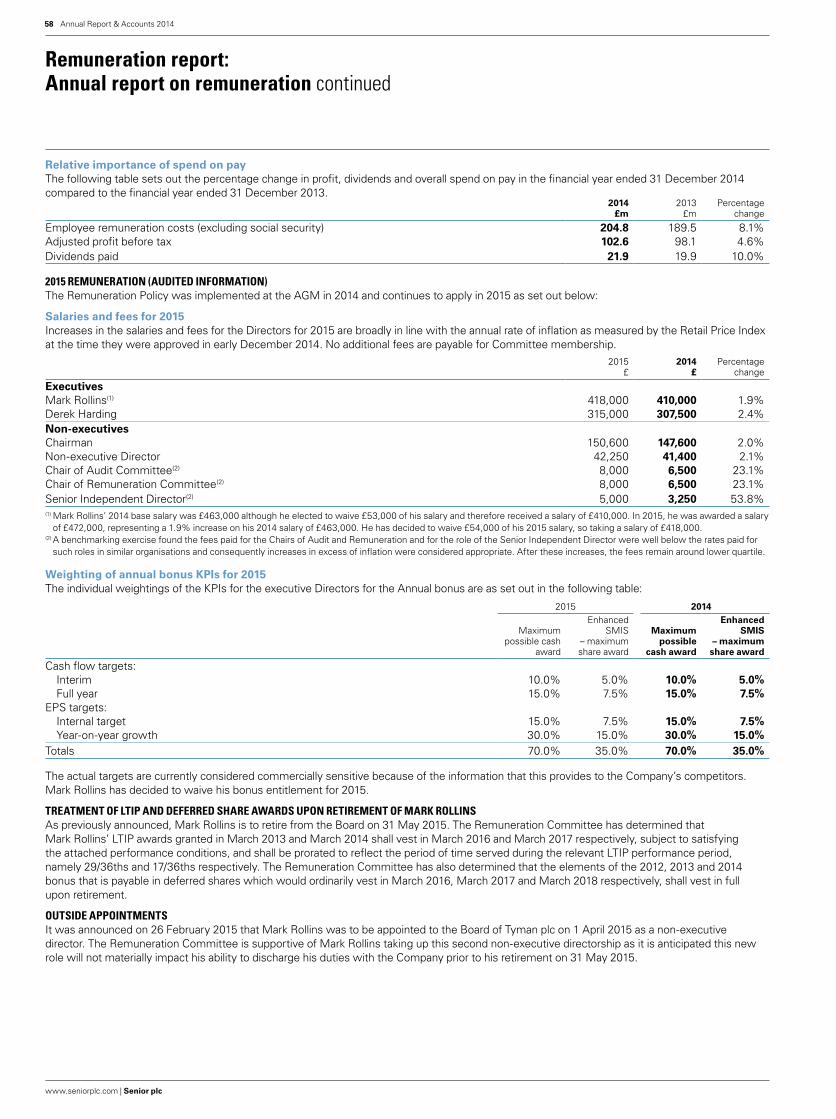
Relative importance of spend on payThe following table sets out the percentage change in profit, dividends and overall spend on pay in the financial year ended 31 December 2014 compared to the financial year ended 31 December 2013.
2014£m
2013£m
Percentagechange
Employee remuneration costs (excluding social security) 204.8 189.5 8.1%Adjusted profit before tax 102.6 98.1 4.6%Dividends paid 21.9 19.9 10.0%
2015 RemuneRAtion (Audited inFoRmAtion)The Remuneration Policy was implemented at the AGM in 2014 and continues to apply in 2015 as set out below:
Salaries and fees for 2015Increases in the salaries and fees for the Directors for 2015 are broadly in line with the annual rate of inflation as measured by the Retail Price Index at the time they were approved in early December 2014. No additional fees are payable for Committee membership.
2015£
2014£
Percentagechange
ExecutivesMark Rollins(1) 418,000 410,000 1.9%Derek Harding 315,000 307,500 2.4%Non-executivesChairman 150,600 147,600 2.0%Non-executive Director 42,250 41,400 2.1%Chair of Audit Committee(2) 8,000 6,500 23.1%Chair of Remuneration Committee(2) 8,000 6,500 23.1%Senior Independent Director(2) 5,000 3,250 53.8%(1) Mark Rollins’ 2014 base salary was £463,000 although he elected to waive £53,000 of his salary and therefore received a salary of £410,000. In 2015, he was awarded a salary
of £472,000, representing a 1.9% increase on his 2014 salary of £463,000. He has decided to waive £54,000 of his 2015 salary, so taking a salary of £418,000.(2) A benchmarking exercise found the fees paid for the Chairs of Audit and Remuneration and for the role of the Senior Independent Director were well below the rates paid for
such roles in similar organisations and consequently increases in excess of inflation were considered appropriate. After these increases, the fees remain around lower quartile.
Weighting of annual bonus KPIs for 2015The individual weightings of the KPIs for the executive Directors for the Annual bonus are as set out in the following table:
2015 2014
Maximumpossible cash
award
EnhancedSMIS
– maximumshare award
Maximumpossible
cash award
EnhancedSMIS
– maximumshare award
Cash flow targets: Interim 10.0% 5.0% 10.0% 5.0% Full year 15.0% 7.5% 15.0% 7.5%EPS targets: Internal target 15.0% 7.5% 15.0% 7.5% Year-on-year growth 30.0% 15.0% 30.0% 15.0%Totals 70.0% 35.0% 70.0% 35.0%
The actual targets are currently considered commercially sensitive because of the information that this provides to the Company’s competitors. Mark Rollins has decided to waive his bonus entitlement for 2015.
tReAtment oF ltip And deFeRRed shARe AwARds upon RetiRement oF mARK RollinsAs previously announced, Mark Rollins is to retire from the Board on 31 May 2015. The Remuneration Committee has determined that Mark Rollins’ LTIP awards granted in March 2013 and March 2014 shall vest in March 2016 and March 2017 respectively, subject to satisfying the attached performance conditions, and shall be prorated to reflect the period of time served during the relevant LTIP performance period, namely 29/36ths and 17/36ths respectively. The Remuneration Committee has also determined that the elements of the 2012, 2013 and 2014 bonus that is payable in deferred shares which would ordinarily vest in March 2016, March 2017 and March 2018 respectively, shall vest in full upon retirement.
outside AppointmentsIt was announced on 26 February 2015 that Mark Rollins was to be appointed to the Board of Tyman plc on 1 April 2015 as a non-executive director. The Remuneration Committee is supportive of Mark Rollins taking up this second non-executive directorship as it is anticipated this new role will not materially impact his ability to discharge his duties with the Company prior to his retirement on 31 May 2015.
Annual Report & Accounts 201458
www.seniorplc.com | Senior plc
Remuneration report: Annual report on remuneration continued

STRATEGIC REPORT
GO
VERNA
NCE
FINA
NCIA
L STATEMEN
TSA
DDITIO
NA
L INFO
RMATIO
N
peRFoRmAnce conditions FoR 2015 AwARdsConditional share awards to be granted in 2015
The performance conditions for awards which will be made in 2015 will again be based on growth in EPS (50% weighting) and relative TSR measured against a peer group (50% weighting) and will have the same performance scale as for 2014, as set out below:
Performance measure WeightingTarget
(25% vesting)Maximum
(100% vesting)
Total shareholder return ranking 50% Median
or higher
Upper quintile or
higherAverage annual growth in earnings per share 50%
4% overRPI
10% overRPI
The TSR group applicable to the 2015 LTIP awards will broadly reflect the list of the 2014 LTIP award constituent comparator companies shown on page 55. Mark Rollins will not be considered for an LTIP award in 2015.
RemuneRAtion pAcKAGe AwARded to new GRoup chieF executiveAs announced on 6 January 2015, David Squires will join the Company and the Board on 1 May 2015 as Group Chief Executive-designate before taking over as Group Chief Executive on 1 June 2015 when Mark Rollins retires. The remuneration package for David Squires, as set out below, was agreed within the terms of the Remuneration Policy:
1 Salary £460,000 p.a. paid monthly in arrears and reviewed annually on 1 January, commencing 1 January 2016.
2 Annual bonus Invited to participate in the Company’s Senior Management Incentive Scheme (“SMIS”). The SMIS is non-contractual and discretionary. Currently, the SMIS provides a maximum bonus of up to 105% of basic salary and is dependent upon the Company’s performance when measured against a number of financial criteria. The SMIS offered to David Squires is in line with the Remuneration Policy and is consistent with that offered to other executives.
The SMIS bonus payable for the Company’s 2015 financial year shall be prorated to reflect the period of time that David Squires will have been employed by the Company during 2015.
3 Long-Term Incentive Plan Upon appointment, to be granted an award equal to 150% of basic salary under the Senior plc 2014 Long-Term Incentive Plan (“LTIP”). The performance conditions attaching to his award shall be the same as those applied to LTIP awards to be made to other executives in March 2015.
4 Car, pension and other benefits
Benefits are in line with the Remuneration Policy. The car benefit provides a fully expensed car with a value of up to £55,000 or an annual car allowance of £14,000.
5 Compensation for loss of benefits
By way of compensation for the loss of certain benefits and share awards with and without performance conditions with his previous employer as a result of joining Senior, the Company shall provide him the following awards upon appointment:
i) a one-off award of 4,770 Senior shares;
ii) a long-term incentive award over 32,000 Senior’s shares. The terms of this share award shall mirror the rules and performance conditions attaching to the LTIP award made to other Senior executives on 25 March 2013 under the Senior plc 2005 Long-Term Incentive Plan. This award will ordinarily vest, subject to the achievement of the associated performance conditions, on or after 25 March 2016; and
iii) a long-term incentive award over 60,000 Senior’s shares. The terms of this share award shall mirror the rules and performance conditions attaching to the LTIP award made to other Senior executives on 21 March 2014 under the Senior plc 2005 Long-Term Incentive Plan. This award will ordinarily vest, subject to the achievement of the associated performance conditions, on or after 21 March 2017.
The long-term incentive awards described in paragraphs 5ii) and 5iii) above shall be in addition to the LTIP award described in paragraph 3 above.
AppRovAl oF the diRectoRs’ RemuneRAtion RepoRtThe Directors’ Remuneration Report was approved by the Board on 27 February 2015.
Signed on behalf of the Board
Celia BaxterChair of the Remuneration Committee27 February 2015
59Annual Report & Accounts 2014
www.seniorplc.com | Senior plc
The Directors are responsible for preparing the Annual Report and the Financial Statements in accordance with applicable law and regulations.
Company law requires the Directors to prepare Financial Statements for each financial year. Under that law the Directors are required to prepare the Group Financial Statements in accordance with International Financial Reporting Standards (“IFRS”) as adopted by the European Union and Article 4 of the IAS Regulation and have also chosen to prepare the Parent Company Financial Statements under IFRS as adopted by the EU. Under company law the Directors must not approve the accounts unless they are satisfied that they give a true and fair view of the state of affairs of the Company and of the profit or loss of the Company for that period. In preparing these Financial Statements, International Accounting Standard 1 requires that Directors:
• properly select and apply accounting policies;
• present information, including accounting policies, in a manner that provides relevant, reliable, comparable and understandable information;
• provide additional disclosures when compliance with the specific requirements in IFRS are insufficient to enable users to understand the impact of particular transactions, other events and conditions on the entity’s financial position and financial performance; and
• make an assessment of the Company’s ability to continue as a going concern.
The Directors are responsible for keeping adequate accounting records that are sufficient to show and explain the Company’s transactions and disclose with reasonable accuracy at any time the financial position of the Company and enable them to ensure that the Financial Statements comply with the Companies Act 2006. They are also responsible for safeguarding the assets of the Company and hence for taking reasonable steps for the prevention and detection of fraud and other irregularities.
The Directors are responsible for the maintenance and integrity of the corporate and financial information included on the Company’s website. Legislation in the United Kingdom governing the preparation and dissemination of Financial Statements may differ from legislation in other jurisdictions.
Responsibility statement We confirm that to the best of our knowledge:
• the Financial Statements, prepared in accordance with IFRS as adopted by the European Union, give a true and fair view of the assets, liabilities, financial position and profit or loss of the Company and the undertakings included in the consolidation taken as a whole;
• the Strategic Report includes a fair review of the development and performance of the business and the position of the Company and the undertakings included in the consolidation taken as a whole, together with a description of the principal risks and uncertainties that they face; and
• the Annual Report and Financial Statements taken as a whole are fair, balanced and understandable and provide the information necessary for shareholders to assess the Company’s performance, business model and strategy.
By Order of the Board
Mark Rollins Derek HardingGroup Chief Executive Group Finance Director27 February 2015 27 February 2015
Annual Report & Accounts 201460
www.seniorplc.com | Senior plc
statement of Directors’ responsibilities

opinion on financial statements of senioR plcIn our opinion:
• the financial statements give a true and fair view of the state of the Group’s and of the Parent Company’s affairs as at 31 December 2014 and of the Group’s profit for the year then ended;
• the Group financial statements have been properly prepared in accordance with International Financial Reporting Standards (IFRSs) as adopted by the European Union;
• the Parent Company financial statements have been properly prepared in accordance with Financial Reporting Standard 101; and
• the financial statements have been prepared in accordance with the requirements of the Companies Act 2006 and, as regards the Group financial statements, Article 4 of the IAS Regulation.
The financial statements comprise the Consolidated Income Statement, the Consolidated Statement of Comprehensive Income, the Group and Parent Company Balance Sheets, the Group and Parent Company Statements of Changes in Equity, the Group and Parent Company Cash Flow Statements, and the related Notes 1 to 54. The financial reporting framework that has been applied in their preparation of the Group financial statements is applicable law and IFRSs as adopted by the European Union. The financial framework that has been applied in the
preparation of the Parent Company financial statements is applicable law and Financial Reporting Standard 101 Reduced Disclosure Framework.
GoinG conceRnAs required by the Listing Rules we have reviewed the directors’ statement contained within that the Group is a going concern. We confirm that:
• we have concluded that the directors’ use of the going concern basis of accounting in the preparation of the financial statements is appropriate; and
• we have not identified any material uncertainties that may cast significant doubt on the Group’s ability to continue as a going concern.
However, because not all future events or conditions can be predicted, this statement is not a guarantee as to the Group’s ability to continue as a going concern.
ouR assessment of Risks of mateRial misstatementThe assessed risks of material misstatement described below are those that had the greatest effect on our audit strategy, the allocation of resources in the audit and directing the efforts of the engagement team.
Risk How tHe scope of ouR auDit ResponDeD to tHe Risk
Goodwill impairmentThe carrying value of goodwill of £262.5m, a material balance for the Group, relies on key assumptions and judgements made by management concerning the estimated value of future cash flows, associated discount rates, and growth rates based on management’s view of future business prospects. Further details are disclosed in Note 2 and Note 13 of the financial statements including details of the impairment charge of £9.4m recorded in the year in relation to Composites.
In particular, there is a risk around components that underperform or that have been impacted by adverse market and /or trading circumstances, namely Thermal and Composites.
We challenged management’s key assumptions used in the impairment model for goodwill, by, but not limited to:
• the cash flow projections, by considering the consistency of the forecasts with industry trends, historical budgeting accuracy, and comparing them with historically achieved results;
• discount rates, by engaging our internal valuation specialists to review assumptions made against external market data;
• perpetuity rates, by benchmarking against industry and GDP growth rates; and
• sensitivities adopted to assess whether they reflected a reasonable possible change.
Tax provisions and deferred tax recognitionAs the Group operates in a number of different tax jurisdictions, judgement is required over the levels of tax provisions held at year end principally in the US and UK which are the Group’s most significant trading countries. Further information is provided in Note 2 to the financial statements.
In addition to this, there is a deferred tax asset of £6.5m as at 31 December 2014. Deferred tax asset recognition as detailed in Note 21 depends on the future profitability of the Group’s underlying business and therefore requires judgement over the level of the asset that can be recognised.
We assessed the tax provisions in conjunction with our internal tax experts. Our assessment included a review of prior year open computations, assumptions made and related correspondence with the tax authorities.
We evaluated management’s key judgements in respect of deferred tax assets by considering future forecasts of profitability, past results, length of forecast period and risk factors applied and used these to assess the probability that sufficient future taxable profits will arise.
STRATEGIC REPORT
GO
VERNA
NCE
FINA
NCIA
L STATEMEN
TSA
DDITIO
NA
L INFO
RMATIO
N61Annual Report & Accounts 2014
www.seniorplc.com | Senior plc
independent auditor’s report to the members of senior plc

Risk How tHe scope of ouR auDit ResponDeD to tHe Risk
Inventory levels and provisionsInventory at the year end of £119.3m, as disclosed in note 17, is a material balance for the Group which requires management judgement in determining an appropriate costing basis and assessing if this is lower than the net realisable value of the inventory on hand at year end.
There are also judgements required in determining inventory excess and obsolescence provisions as these are based on forecast inventory usage and assessing if the provision level is adequate.
We attended inventory counts at all components, and performed detailed substantive testing on a sample of items at significant components to assess the cost basis and net realisable value of inventory.
We compared the inventory excess and obsolescence provision to the Group’s policy and challenged management’s judgement of the adequacy of this by performing a review of the level of provisions on an aggregate and by unit basis as well as understanding the levels of demand for significant items. We investigated manual adjustments made to the mechanical application of the inventory obsolescence provisioning policy, and assessed whether they were valid and the appropriateness of the final excess and obsolescence provision.
Acquisition accounting As outlined in the Audit Committee Report on page 42, Group management exercised judgement in determining their provisional valuation of the intangible assets of £17.8m and goodwill of £36.5m associated with the Upeca acquisition. These judgements could have a material impact on the financial statements and as such, this is a key audit risk.
We evaluated and tested the acquisition accounting for Upeca, including using internal valuation experts in the consideration of the recognition and valuation of intangible assets. Our audit procedures included, but were not limited to: agreeing the cash flow projections to supporting audit evidence on a sample basis; assessing the appropriateness of the valuation methodology and discount rate applied; and performing substantive testing on a sample of the underlying assets and liabilities of the business.
In the prior, our audit report included an audit risk in relation to warranty and employee related provisions. In the current year, this was deemed to be immaterial.
The description of risks above shall be read in conjunction with the Audit Committee’s consideration of certain of these risks as set out on page 42.
Our audit procedures relating to these matters were designed in the context of our audit of the financial statements as a whole, and not to express an opinion on individual accounts or disclosures. Our opinion on the financial statements is not modified with respect to any of the risks described above, and we do not express an opinion on these individual matters.
ouR application of mateRialityWe define materiality as the magnitude of misstatement in the financial statements that makes it probable that the economic decisions of a reasonably knowledgeable person would be changed or influenced. We use materiality both in planning the scope of our audit work and in evaluating the results of our work.
We determined materiality for the Group to be £6.8 million (2013: £7.0 million), which is approximately 7.4% (2013: 7.5%) of pre tax profit adjusted to exclude the impact of the Composites impairment charge and the write-down of the L85 inventory (2013: adjusted to exclude the impact of the impairment charge for Capo Industries and the release of the GAMFG Precision LLC deferred consideration). These items have been excluded in our determination of materiality as they are exceptional and non recurring.
We agreed with the Audit Committee that we would report to the Committee all audit differences in excess of £136,000 (2013: £140,000), as well as differences below that threshold that, in our view, warranted reporting on qualitative grounds. We also report to the Audit Committee on disclosure matters that we identified when assessing the overall presentation of the financial statements.
an oveRview of tHe scope of ouR auDitOur Group audit was scoped by obtaining an understanding of the Group and its environment, including Group-wide controls, and assessing the risks of material misstatement at the Group level. Based on that assessment, we focused our Group audit scope primarily on the audit work at 24 (2013: 25) key operating locations.
21 of these were subject to full scope audit procedures, of which eight were performed through a combination of work completed by the local component auditors and work completed by the Group team. The other three key operating locations were subject to specified audit procedures on certain balances. Our work at each location was carried out at levels of materiality applicable to each individual entity which ranged from £2.0 million to £3.4 million.
Together with the Group Functions, which were also subject to a full scope audit procedures, the 24 locations represent the principal business units within the Group’s two reportable segments and account for 90% (2013: 90%) of the Group’s revenue and 92% (2013: 94%) of the Group’s profit before tax. They were also selected to provide an appropriate basis for undertaking audit work to address the risks of material misstatement identified above.
At the parent entity level we have also tested the consolidation process and carried out analytical procedures to confirm our conclusions that there were no significant risks of material misstatement of the aggregated financial information of its remaining components not subject to audit or audit of specified account balances. We also tested the consolidation at the parent company level.
Full scope audit procedures 81%Specified audit procedures 9%Reviewed at Group level 10%
auDit coveRaGe by site as a pRopoRtion of 2014 Revenue
Full scope audit procedures 80%Specified audit procedures 12%Reviewed at Group level 8%
auDit coveRaGe by site as a pRopoRtion of 2014 pRofit befoRe tax
Annual Report & Accounts 201462
www.seniorplc.com | Senior plc
independent auditor’s report to the members of senior plc continued

The Group audit team continued to follow a programme of planned visits that has been designed so that a senior member of the Group audit team visits each of the locations where the Group audit scope was focused at least once every three years. In years when we do not visit a significant component we include the component audit team in our team briefing, discuss their risk assessment, and review documentation of the findings from their work.
opinion on otHeR matteRs pRescRibeD by tHe companies act 2006In our opinion:
• the part of the Directors’ Remuneration Report to be audited has been properly prepared in accordance with the Companies Act 2006; and
• the information given in the Strategic Report and the Directors’ Report for the financial year for which the financial statements are prepared is consistent with the financial statements.
matteRs on wHicH we aRe RequiReD to RepoRt by exceptionAdequacy of explanations received and accounting recordsUnder the Companies Act 2006 we are required to report to you if, in our opinion:
• we have not received all the information and explanations we require for our audit; or
• adequate accounting records have not been kept by the Parent Company, or returns adequate for our audit have not been received from branches not visited by us; or
• the Parent Company financial statements are not in agreement with the accounting records and returns.
We have nothing to report in respect of these matters.
Directors’ remunerationUnder the Companies Act 2006 we are also required to report if in our opinion certain disclosures of directors’ remuneration have not been made or the part of the Directors’ Remuneration Report to be audited is not in agreement with the accounting records and returns. We have nothing to report arising from these matters.
Corporate Governance StatementUnder the Listing Rules we are also required to review the part of the Corporate Governance Statement relating to the Company’s compliance with ten provisions of the UK Corporate Governance Code. We have nothing to report arising from our review.
Our duty to read other information in the Annual ReportUnder International Standards on Auditing (UK and Ireland), we are required to report to you if, in our opinion, information in the annual report is:
• materially inconsistent with the information in the audited financial statements; or
• apparently materially incorrect based on, or materially inconsistent with, our knowledge of the Group acquired in the course of performing our audit; or
• otherwise misleading.
In particular, we are required to consider whether we have identified any inconsistencies between our knowledge acquired during the audit and the directors’ statement that they consider the annual report is fair, balanced and understandable and whether the annual report appropriately discloses those matters that we communicated to the audit committee which we consider should have been disclosed.
We confirm that we have not identified any such inconsistencies or misleading statements.
Respective Responsibilities of DiRectoRs anD auDitoRAs explained more fully in the Directors’ Responsibilities Statement, the directors are responsible for the preparation of the financial statements and for being satisfied that they give a true and fair view. Our responsibility is to audit and express an opinion on the financial statements in accordance with applicable law and International Standards on Auditing (UK and Ireland). Those standards require us to comply with the Auditing Practices Board’s Ethical Standards for Auditors. We also comply with International Standard on Quality Control 1 (UK and Ireland). Our audit methodology and tools aim to ensure that our quality control procedures are effective, understood and applied. Our quality controls and systems include our dedicated professional standards review team and independent partner reviews.
This report is made solely to the Company’s members, as a body, in accordance with Chapter 3 of Part 16 of the Companies Act 2006. Our audit work has been undertaken so that we might state to the Company’s members those matters we are required to state to them in an auditor’s report and for no other purpose. To the fullest extent permitted by law, we do not accept or assume responsibility to anyone other than the Company and the Company’s members as a body, for our audit work, for this report, or for the opinions we have formed.
scope of tHe auDit of tHe financial statementsAn audit involves obtaining evidence about the amounts and disclosures in the financial statements sufficient to give reasonable assurance that the financial statements are free from material misstatement, whether caused by fraud or error. This includes an assessment of: whether the accounting policies are appropriate to the Group’s and the parent Company’s circumstances and have been consistently applied and adequately disclosed; the reasonableness of significant accounting estimates made by the directors; and the overall presentation of the financial statements. In addition, we read all the financial and non-financial information in the annual report to identify material inconsistencies with the audited financial statements and to identify any information that is apparently materially incorrect based on, or materially inconsistent with, the knowledge acquired by us in the course of performing the audit. If we become aware of any apparent material misstatements or inconsistencies we consider the implications for our report.
Mark Mullins FCA (Senior statutory auditor) for and on behalf of Deloitte LLPChartered Accountants and Statutory AuditorReading, United Kingdom27 February 2015
STRATEGIC REPORT
GO
VERNA
NCE
FINA
NCIA
L STATEMEN
TSA
DDITIO
NA
L INFO
RMATIO
N63Annual Report & Accounts 2014
www.seniorplc.com | Senior plc
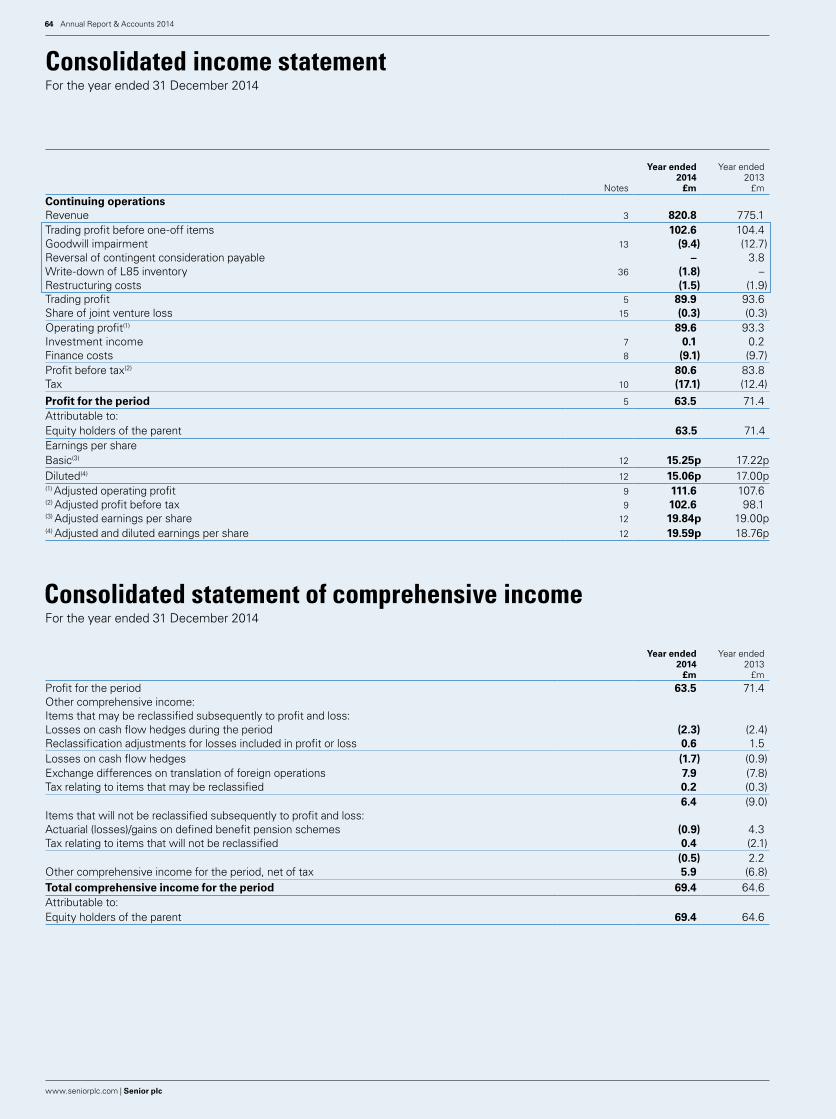
Notes
Year ended2014
£m
Year ended2013
£mContinuing operationsRevenue 3 820.8 775.1 Trading profit before one-off items 102.6 104.4Goodwill impairment 13 (9.4) (12.7)Reversal of contingent consideration payable – 3.8Write-down of L85 inventory 36 (1.8) –Restructuring costs (1.5) (1.9)Trading profit 5 89.9 93.6 Share of joint venture loss 15 (0.3) (0.3)Operating profit(1) 89.6 93.3 Investment income 7 0.1 0.2 Finance costs 8 (9.1) (9.7)Profit before tax(2) 80.6 83.8 Tax 10 (17.1) (12.4)Profit for the period 5 63.5 71.4 Attributable to:Equity holders of the parent 63.5 71.4 Earnings per shareBasic(3) 12 15.25p 17.22pDiluted(4) 12 15.06p 17.00p(1) Adjusted operating profit 9 111.6 107.6(2) Adjusted profit before tax 9 102.6 98.1(3) Adjusted earnings per share 12 19.84p 19.00p(4) Adjusted and diluted earnings per share 12 19.59p 18.76p
consolidated statement of comprehensive incomeFor the year ended 31 December 2014
Year ended2014
£m
Year ended2013
£mProfit for the period 63.5 71.4Other comprehensive income:Items that may be reclassified subsequently to profit and loss:Losses on cash flow hedges during the period (2.3) (2.4)Reclassification adjustments for losses included in profit or loss 0.6 1.5Losses on cash flow hedges (1.7) (0.9)Exchange differences on translation of foreign operations 7.9 (7.8)Tax relating to items that may be reclassified 0.2 (0.3)
6.4 (9.0)Items that will not be reclassified subsequently to profit and loss:Actuarial (losses)/gains on defined benefit pension schemes (0.9) 4.3Tax relating to items that will not be reclassified 0.4 (2.1)
(0.5) 2.2Other comprehensive income for the period, net of tax 5.9 (6.8)Total comprehensive income for the period 69.4 64.6Attributable to:Equity holders of the parent 69.4 64.6
Annual Report & Accounts 201464
www.seniorplc.com | Senior plc
consolidated income statementFor the year ended 31 December 2014
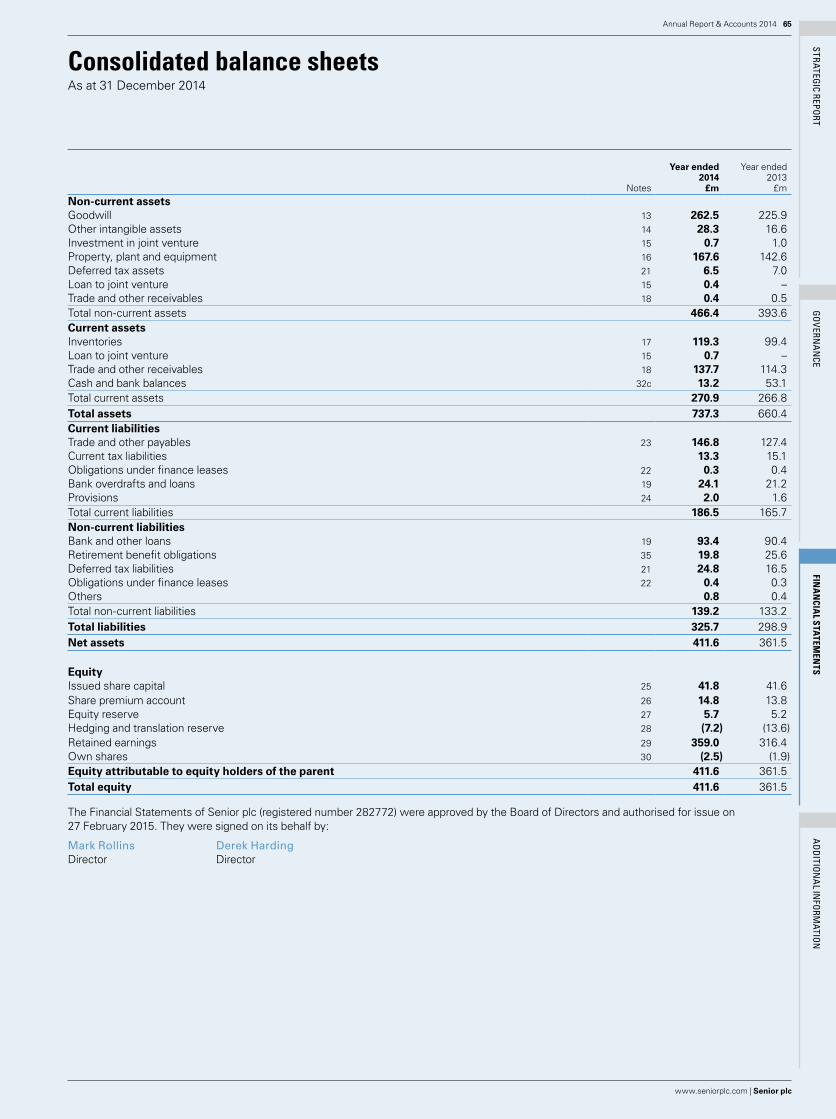
STRATEGIC REPORT
GO
VERNA
NCE
FINA
NCIA
L STATEMEN
TSA
DDITIO
NA
L INFO
RMATIO
N
Notes
Year ended2014
£m
Year ended2013
£mNon-current assetsGoodwill 13 262.5 225.9 Other intangible assets 14 28.3 16.6 Investment in joint venture 15 0.7 1.0 Property, plant and equipment 16 167.6 142.6 Deferred tax assets 21 6.5 7.0 Loan to joint venture 15 0.4 – Trade and other receivables 18 0.4 0.5 Total non-current assets 466.4 393.6 Current assetsInventories 17 119.3 99.4 Loan to joint venture 15 0.7 – Trade and other receivables 18 137.7 114.3 Cash and bank balances 32c 13.2 53.1 Total current assets 270.9 266.8 Total assets 737.3 660.4 Current liabilitiesTrade and other payables 23 146.8 127.4 Current tax liabilities 13.3 15.1 Obligations under finance leases 22 0.3 0.4 Bank overdrafts and loans 19 24.1 21.2 Provisions 24 2.0 1.6 Total current liabilities 186.5 165.7 Non-current liabilitiesBank and other loans 19 93.4 90.4 Retirement benefit obligations 35 19.8 25.6 Deferred tax liabilities 21 24.8 16.5 Obligations under finance leases 22 0.4 0.3 Others 0.8 0.4 Total non-current liabilities 139.2 133.2 Total liabilities 325.7 298.9 Net assets 411.6 361.5
EquityIssued share capital 25 41.8 41.6 Share premium account 26 14.8 13.8 Equity reserve 27 5.7 5.2 Hedging and translation reserve 28 (7.2) (13.6)Retained earnings 29 359.0 316.4 Own shares 30 (2.5) (1.9)Equity attributable to equity holders of the parent 411.6 361.5 Total equity 411.6 361.5
The Financial Statements of Senior plc (registered number 282772) were approved by the Board of Directors and authorised for issue on 27 February 2015. They were signed on its behalf by:
Mark Rollins Derek Harding Director Director
65Annual Report & Accounts 2014
www.seniorplc.com | Senior plc
consolidated balance sheetsAs at 31 December 2014

All equity is attributable to equity holders of the parent
Issuedshare
capital£m
Sharepremium account
£m
Equityreserve
£m
Hedgingand
translationreserve
£m
Retained earnings
£m
Ownshares
£m
Totalequity
£mBalance at 1 January 2013 41.4 13.7 3.8 (4.6) 259.6 (1.0) 312.9 Profit for the year 2013 – – – – 71.4 – 71.4 Losses on cash flow hedges – – – (0.9) – – (0.9)Exchange differences on translation of foreign operations – – – (7.8) – – (7.8)Actuarial gains on defined benefit pension schemes – – – – 4.3 – 4.3 Tax relating to components of other comprehensive income – – – (0.3) (2.1) – (2.4)Total comprehensive income for the period – – – (9.0) 73.6 – 64.6 Issue of share capital 0.2 0.1 (0.2) – – – 0.1 Share-based payment charge – – 3.0 – – – 3.0 Tax relating to share-based payments – – – – 1.7 – 1.7 Purchase of shares held by employee benefit trust – – – – – (0.9) (0.9)Transfer to retained earnings – – (1.4) – 1.4 – – Dividends paid – – – – (19.9) – (19.9)Balance at 31 December 2013 41.6 13.8 5.2 (13.6) 316.4 (1.9) 361.5 Profit for the year 2014 – – – – 63.5 – 63.5Losses on cash flow hedges – – – (1.7) – – (1.7)Exchange differences on translation of foreign operations – – – 7.9 – – 7.9 Actuarial losses on defined benefit pension schemes – – – – (0.9) – (0.9)Tax relating to components of other comprehensive income – – – 0.2 0.4 – 0.6Total comprehensive income for the period – – – 6.4 63.0 – 69.4Issue of share capital 0.2 1.0 (0.1) – – – 1.1 Share-based payment charge – – 2.3 – – – 2.3 Tax relating to share-based payments – – – – (0.1) – (0.1)Purchase of shares held by employee benefit trust – – – – – (0.7) (0.7)Use of shares held by employee benefit trust – – – – (0.1) 0.1 – Transfer to retained earnings – – (1.7) – 1.7 – – Dividends paid – – – – (21.9) – (21.9)Balance at 31 December 2014 41.8 14.8 5.7 (7.2) 359.0 (2.5) 411.6
Annual Report & Accounts 201466
www.seniorplc.com | Senior plc
consolidated statements of changes in equityFor the year ended 31 December 2014

STRATEGIC REPORT
GO
VERNA
NCE
FINA
NCIA
L STATEMEN
TSA
DDITIO
NA
L INFO
RMATIO
N
Notes
Year ended2014
£m
Year ended2013
£mNet cash from operating activities 32a) 88.6 92.4 Investing activitiesInterest received 0.1 0.2 Proceeds on disposal of property, plant and equipment 0.2 0.9 Purchases of property, plant and equipment (29.6) (28.7)Purchases of intangible assets (1.5) (1.0)Acquisition of Upeca 31 (60.1) – Acquisition of Thermal – (28.1)Acquisition of Atlas – (2.4)Loan to joint venture (1.1) – Investment in joint venture – (0.5)Net cash used in investing activities (92.0) (59.6)Financing activitiesDividends paid (21.9) (19.9)Repayment of borrowings (34.5) (0.2)Repayments of obligations under finance leases (1.4) (0.5)Share issues 1.1 0.1 Purchase of shares held by employee benefit trust (0.7) (0.9)New loans raised 16.1 – Net cash used in financing activities (41.3) (21.4)Net (decrease)/increase in cash and cash equivalents (44.7) 11.4 Cash and cash equivalents at beginning of period 53.1 43.9 Effect of foreign exchange rate changes 0.1 (2.2)Cash and cash equivalents at end of period 32c 8.5 53.1
67Annual Report & Accounts 2014
www.seniorplc.com | Senior plc
consolidated cash flow statementsFor the year ended 31 December 2014

1. GeneRal infoRmationSenior plc is a company incorporated in the England and Wales under the Companies Act. The address of the registered office is given on the inside back cover. The nature of the Group’s operations and its principal activities are set out in Note 4 and on pages 2 to 30.
Items included in the financial statements of each of the Group’s entities are measured using the currency of the primary economic environment in which the entity operates (the functional currency). These Financial Statements are presented in Pounds Sterling, which is the Company’s functional and the Group’s presentation currency.
2. siGnificant accountinG policiesBasis of accountingThese Financial Statements have been prepared in accordance with International Financial Reporting Standards (“IFRS”) adopted by the European Union and they therefore comply with Article 4 of the EU IAS Regulation. They have been prepared on the historical cost basis, except for the revaluation of certain properties and financial instruments. They have also been prepared on the going concern basis as set out in the Financial review on pages 28 to 30. The Directors have, at the time of approving these Financial Statements, a reasonable expectation that the Group and Company have adequate resources to continue in operational existence for the foreseeable future. Thus they continue to adopt the going concern basis of accounting in preparing these Financial Statements.
In the current financial year, the Group has adopted the following standards and amendments:
IFRS 10 establishes a single basis to determine whether an entity should be included in the consolidated financial statements. This standard does not change the Group’s conclusion on control and therefore does not represent a material impact on the Group’s Financial Statements.
IFRS 11 introduces an amended approach to joint arrangements and provides guidance on how to account for joint operations and joint ventures. This standard does not change the Group’s conclusion on its joint venture and therefore does not represent a material impact on the Group’s Financial Statements.
IFRS 12 provides disclosure requirements for all forms of interest in other entities. The required enhanced disclosures are included, where applicable, in these Financial Statements.
IFRS 10, IFRS 11 and IFRS 12: Consolidated Financial Statements, Joint Arrangements and Disclosure of Interests in Other Entities – Transition Guidance provides additional relief by limiting the requirements to provide comparative information to only the preceding comparative period. This guidance does not represent a material impact on the Group’s Financial Statements.
IAS 19 amendments permit contributions to be recognised as a reduction in the service cost in the period in which the related service is rendered if the amount of contribution from an employee or third party is independent of the number of years of service. As the Group’s largest defined benefit plan is closed to future accruals this amendment does not represent a material impact on the Group’s Financial Statements.
IAS 27 contains the accounting and disclosure requirements for investments in subsidiaries, joint arrangements and associates when preparing separate financial statements. This standard has no material impact on the Group’s Financial Statements.
IAS 28 prescribes the accounting for associates and joint ventures. This standard does not represent a material impact on the Group’s Financial Statements.
Annual Improvements to IFRSs 2010–2012 Cycle and Annual Improvements to IFRSs 2011–2013 Cycle incorporate necessary,
but non-urgent, amendments to 11 International Financial Reporting Standards. The amendments most relevant to the Group are:
IFRS 2: Share-based payments amends the definition of “vesting condition” and “market condition” and adds a definition of “performance condition” and “service condition”. This amendment does not currently represent a material impact on these Financial Statements.
IFRS 9: Operating Segment requires an entity to disclose the judgements made by management in applying the aggregation criteria to operating segments. The enhanced disclosure is included in these Financial Statements.
The remaining nine amendments in Annual Improvements to IFRSs 2010–2012 Cycle and Annual Improvements to IFRSs 2011–2013 Cycle do not currently impact these Financial Statements.
The following amendments to Standards and Interpretations are also effective from the current financial year, but currently do not impact the Group’s operations: IFRS 10, IFRS 12 and IAS 27 (Amendments) Investment Entities, IAS 39 (Amendments) Novation of Derivatives and Continuation of Hedge Accounting and IFRIC 21 Levies.
At the date of authorisation of these Financial Statements, the following Standards and Interpretations, which have not been applied in these Financial Statements, were in issue but not yet effective and not yet endorsed by the EU:
IFRS 9: Financial Instruments. Effective for annual periods beginning 1 January 2018.
Amendments to IFRS 10 and IAS 28: Sale or Contribution of Assets between an Investor and its Associate or Joint Venture. Effective for annual periods beginning 1 January 2016.
Amendments to IFRS 10, IFRS 12 and IAS 28: Investment Entities Applying the Consolidation Exemption. Effective for annual periods beginning 1 January 2016.
IFRS 11 (Amendments): Accounting for Acquisitions of Interests in Joint Operations. Effective for annual periods beginning 1 January 2016.
IFRS 14: Regulatory Deferral Accounts. Effective for annual periods beginning 1 January 2016.
IFRS 15: Revenue from Contracts with Customers. Effective for annual periods beginning 1 January 2017.
Amendments to IAS 1: Disclosure Initiatives. Effective for annual periods beginning 1 January 2016.
Amendments to IAS 16 and IAS 38: Clarification of Acceptable Methods of Depreciation and Amortisation. Effective for annual periods beginning 1 January 2016.
Amendments to IAS 16 and IAS 41: Bearer Plants. Effective for annual periods beginning 1 January 2016.
IAS 27: Equity Method in Separate Financial Statements. Effective for annual periods beginning 1 January 2016.
Annual Improvements to IFRSs 2012–2014 Cycle as published in September 2014. Effective for annual periods beginning 1 January 2016.
With the exception of IFRS 9 and IFRS 15, the Directors anticipate that the adoption of these Standards and Interpretations in future period will not have a material impact on these Financial Statements, except for additional disclosures, when the relevant standards come into effect.
IFRS 9 and IFRS 15 may impact both the measurement and disclosures of the Group’s Financial Statements in future periods. However, it is not practicable to provide a reasonable estimate of the effect of these standards until a detailed review has been completed.
Annual Report & Accounts 201468
www.seniorplc.com | Senior plc
notes to the consolidated financial statements

STRATEGIC REPORT
GO
VERNA
NCE
FINA
NCIA
L STATEMEN
TSA
DDITIO
NA
L INFO
RMATIO
N
2. siGnificant accountinG policies continuedThe principal accounting policies under IFRS are set out below:
Basis of consolidationThe Consolidated Financial Statements incorporate the Financial Statements of Senior plc and the entities controlled by it (its subsidiaries) made up to 31 December. Control is achieved when Senior plc has the power to govern the financial and operating policies of an invested entity so as to obtain benefits from its activities.
Acquisitions of subsidiaries and businesses are accounted for using the acquisition method. The consideration transferred for each acquisition is the aggregate of the fair values (at the date of exchange) of assets transferred, liabilities incurred or assumed, and equity interests issued by the Group. The consideration transferred includes the fair value of any asset or liability resulting from a contingent consideration arrangement. Acquisition-related costs are expensed as incurred. Identifiable assets acquired and liabilities and contingent liabilities assumed are measured initially at their fair values at the acquisition date. On an acquisition-by acquisition-basis, the Group recognises any non-controlling interest in the acquiree either at fair value or at the non-controlling interest’s proportionate share of the acquiree’s net assets.
The results of subsidiaries acquired or disposed of during the year are included in the Consolidated Income Statement from the effective date of acquisition or up to the effective date of disposal, as appropriate.
The results of joint ventures are accounted for using the equity accounting method.
Where necessary, adjustments are made to the financial statements of subsidiaries to bring the accounting policies used into line with those used by the Group.
All intra-Group transactions, balances, income and expenses are eliminated on consolidation.
GoodwillGoodwill arising on consolidation is measured as the excess of the consideration transferred, the amount of any non-controlling interest in the acquiree and the acquisition date fair value of any previous equity interest in the acquiree over the fair value of the Group’s share of the identifiable net assets acquired. It is recognised as an asset and reviewed for impairment at least annually. Any impairment is recognised immediately through the Consolidated Income Statement and is not subsequently reversed.
If the consideration transferred, the amount of any non-controlling interest in the acquiree and the acquisition date fair value of any previous equity interest in the acquiree is less than the fair value of the net assets acquired (i.e. bargain purchase), the difference is credited to the Consolidated Income Statement in the period of acquisition.
Goodwill acquired in a business combination is allocated, at acquisition, to the cash-generating units (“CGUs”) that are expected to benefit from that business combination. CGUs to which goodwill has been allocated are tested for impairment annually, or more frequently when there is an indication that the unit may be impaired. If the recoverable amount of the CGU is less than its carrying amount, the impairment loss is allocated first to reduce the carrying amount of any goodwill allocated to the CGU and then to the other assets of the unit pro rata on the basis of the carrying amount of each asset in the unit. An impairment loss recognised for goodwill is not reversed in a subsequent period.
On disposal of a subsidiary, associate or jointly controlled entity, the attributable amount of goodwill is included in the determination of the profit or loss on disposal.
Goodwill arising on acquisitions prior to the date of transition to IFRS has been retained at the previous UK GAAP amount subject to being tested for impairment at that date. Goodwill written off to reserves under UK GAAP prior to 1998 has not been reinstated and is not included in determining any subsequent profit or loss on disposal.
Revenue recognitionRevenue is measured at the fair value of the consideration received or receivable and represents amounts receivable for goods and services provided in the normal course of business, net of discounts, VAT and other sales-related taxes.
Sales of goods are recognised when goods are delivered in accordance with the terms and conditions of the sale.
Interest income is accrued on a time basis, by reference to the principal outstanding and at the effective interest rate applicable.
Dividend income from investments is recognised when the shareholders’ legal rights to receive payment have been established.
LeasingLeases are classified as finance leases whenever the terms of the lease substantially transfer all the risks and rewards of ownership to the lessee. All other leases are classified as operating leases.
Assets held under finance leases are recognised as assets of the Group at their fair value or, if lower, at the present value of the minimum lease payments, each determined at the inception of the lease. The corresponding liability to the lessor is included in the Balance Sheet as a finance lease obligation. Lease payments are apportioned between finance charges and a reduction of the lease obligation in order to achieve a constant rate of interest on the remaining balance of the liability. Finance charges are charged directly to the Income Statement.
Rentals payable under operating leases are expensed on a straight-line basis over the term of the relevant lease.
Benefits received and receivable as incentives to enter into an operating lease are also spread on a straight-line basis over the lease term.
Foreign currenciesTransactions in currencies other than the functional currency are recorded at the rates of exchange prevailing on the date of the transaction. At each balance sheet date, monetary assets and liabilities that are denominated in foreign currencies are retranslated at the rates prevailing on the balance sheet date. Non-monetary items carried at fair value that are denominated in foreign currencies are translated at the rates prevailing at the date when the fair value was determined. Non-monetary items that are measured at historical cost in a foreign currency are not retranslated. Gains and losses arising on retranslation are included in net profit or loss for the period, except for exchange differences arising on non-monetary assets and liabilities where the changes in fair value are recognised directly in equity, subject to meeting the requirements under IAS 21.
In order to hedge its exposure to certain foreign exchange risks, the Group enters into forward contracts (see section below on Derivative financial instruments and hedging for details of the Group’s accounting policies in respect of such derivative financial instruments).
On consolidation, the assets and liabilities of the Group’s overseas operations are translated at exchange rates prevailing on the balance sheet date. Income and expense items are translated at the average exchange rates for the period. Exchange rate differences arising, if any, are classified as equity and transferred to the Group’s translation reserve. Such translation differences are recognised as income or expense in the period in which the operation is disposed of.
69Annual Report & Accounts 2014
www.seniorplc.com | Senior plc

2. siGnificant accountinG policies continuedGoodwill and fair value adjustments arising on the acquisition of a foreign entity are treated as assets and liabilities of the foreign entity and translated at the closing rate on the relevant balance sheet date.
The exchange rates for the major currencies applied in the translation of results were as follows:
Average rates2014
Averagerates2013
Year-endrates2014
Year-endrates2013
US dollar 1.65 1.57 1.56 1.66Euro 1.24 1.18 1.29 1.20
Government grantsGovernment grants received for items of a revenue nature are recognised as income over the period necessary to match them with the related costs and are deducted in reporting the related expense.
Government grants relating to investment in property, plant and equipment are deducted from the initial carrying value of the related capital asset.
Operating profitOperating profit is stated before investment income and finance costs relating to external borrowings and retirement benefit obligations.
Retirement benefit costsPayments to defined contribution retirement plans are charged as an expense as they fall due. Payments made to state-managed retirement benefit plans are dealt with as payments to defined contribution plans where the Group’s obligations under the plans are equivalent to those arising in a defined contribution retirement plan.
For defined benefit retirement plans, the cost of providing benefits is determined using the Projected Unit Method, with full actuarial valuations being carried out on a triennial basis, and updated at each balance sheet date. Actuarial gains and losses are recognised in full in the period in which they occur. They are recognised outside the Income Statement and are presented in the Statement of Comprehensive Income.
Past service cost is recognised immediately to the extent that the benefits are already vested. Otherwise, it is amortised on a straight-line basis over the period until the benefits become vested.
The retirement benefit obligation recognised in the Balance Sheet represents the present value of the defined benefit obligation as adjusted for unrecognised past service costs, and as reduced by the fair value of scheme assets. Any net asset resulting from this calculation is limited to the past service cost plus the present value of available refunds and reductions in future contributions to the plan.
TaxationThe tax currently payable is based on taxable profit for the year. Taxable profit differs from net profit as reported in the Income Statement because it excludes items of income or expense that are taxable or deductible in other years and it further excludes items that are never taxable or deductible. The Group’s liability for current tax is calculated using tax rates that have been enacted or substantively enacted by the balance sheet date.
Deferred tax is the tax expected to be payable or recoverable on differences between the carrying amounts of assets and liabilities in the Financial Statements and the corresponding tax bases used in the computation of taxable profit, and is accounted for using the balance sheet liability method. Deferred tax liabilities are generally recognised for all taxable temporary differences and deferred tax assets are recognised to the extent it is probable that taxable profits will be available against which deductible temporary differences can be utilised. Such assets and liabilities are not recognised if the temporary difference arises from goodwill or from the initial recognition (other than in a business combination) of other assets and liabilities in a transaction that affects neither the Group’s taxable profit nor its accounting profit.
Deferred tax liabilities are recognised for taxable temporary differences arising on investments in subsidiaries and associates, and interests in joint ventures, except where the Group is able to control the reversal of the temporary difference and it is probable that the temporary difference will not reverse in the foreseeable future.
The carrying value of deferred tax assets is reviewed at each balance sheet date and reduced to the extent it is no longer probable that sufficient taxable profits will be available to allow all or part of the deferred tax asset to be recovered.
Deferred tax is calculated at the tax rates that are expected to apply in the period when the liability is settled or the asset is realised based on tax laws and rates that have been enacted at the balance sheet date. Deferred tax is charged or credited in the Income Statement, except when it relates to items charged or credited directly to equity, in which case the deferred tax is also dealt with in equity.
Property, plant and equipmentLand and buildings held for use in the production or supply of goods or services, or for administrative purposes, are stated in the Balance Sheet at their historical cost, or at modified historical cost, being a revaluation undertaken in 1988 which has been taken as the effective cost on transition to IFRS. Land and buildings were revalued to fair value at the date of revaluation.
The Group does not intend to conduct annual revaluations.
Fixtures, plant and equipment are stated at cost less accumulated depreciation and any recognised impairment loss.
Depreciation is charged to write off the cost of an asset on a straight-line basis over the estimated useful life of the asset, and is charged from the time an asset becomes available for its intended use. Annual rates are as follows:
Freehold land NilFreehold buildings 2%Improvements to leasehold buildings according to remaining
lease termPlant and equipment 5%–33%
Assets held under finance leases are depreciated over their expected useful lives on the same basis as owned assets or, where shorter, over the term of the relevant lease.
The gain or loss arising on the disposal or retirement of an asset is determined as the difference between the sale proceeds and the carrying amount of the asset at disposal and is recognised in income.
Annual Report & Accounts 201470
www.seniorplc.com | Senior plc
notes to the consolidated financial statements continued
STRATEGIC REPORT
GO
VERNA
NCE
FINA
NCIA
L STATEMEN
TSA
DDITIO
NA
L INFO
RMATIO
N
2. siGnificant accountinG policies continuedOther intangible assetsOther intangible assets include computer software and customer relationships acquired in a business combination. Computer software is measured initially at purchase cost and the cost of customer relationships acquired in a business combination is generally based on fair market values. Intangible assets are amortised on a straight-line basis over their estimated useful lives, being between three and five years.
Internally generated intangible assets – research and development expenditureAn internally generated intangible asset arising from the Group’s development activities is recognised if all of the following conditions are met:
i) an asset is created that can be separately identified;
ii) it is probable that the asset created will generate future economic benefits; and
iii) the development cost of the asset can be measured reliably.
Internally generated intangible assets are amortised on a straight-line basis over their useful lives.
Development work is also carried out on a funded basis. In such circumstances the costs are accumulated in inventory and are recognised when the related billings are made. Any amounts held in inventory are subject to normal inventory valuation principles. Otherwise expenditure on research and development activities is recognised as an expense in the period in which it is incurred.
Impairment of tangible and intangible assets excluding goodwillAt each balance sheet date, the Group reviews the carrying amounts of its tangible and intangible assets to determine whether there is any indication that those assets have suffered an impairment loss. If any such indication exists, the recoverable amount of the asset is estimated in order to determine the extent of the impairment loss (if any). Where the asset does not generate cash flows that are independent from other assets, the Group estimates the recoverable amount of the CGU to which the asset belongs.
The recoverable amount is the higher of the fair value less the costs to sell and the value in use. In assessing the value in use, the estimated future cash flows are discounted to their present value using a pre-tax discount rate that reflects current market assessments of the time value of money and the risks specific to the asset for which the estimates of future cash flows have not been adjusted.
If the recoverable amount of an asset is estimated to be less than its carrying amount, the carrying amount of the asset is reduced to its recoverable amount. An impairment loss is recognised as an expense immediately, unless the relevant asset is carried at a revalued amount, in which case the impairment loss is treated as a revaluation decrease.
Where an impairment loss subsequently reverses, the carrying amount of the asset is increased to the revised estimate of its recoverable amount, so that the increased carrying amount does not exceed the carrying amount that would have been determined had no impairment loss been recognised for the asset in prior years. A reversal of an impairment loss is recognised as income immediately, unless the relevant asset is carried at a revalued amount, in which case the reversal of the impairment loss is treated as a revaluation increase.
InventoriesInventories are stated at the lower of cost and net realisable value. Costs comprise direct materials and, where applicable, direct labour costs and an appropriate allocation of production overheads. Cost is calculated using the first-in, first-out method. Net realisable value represents the estimated selling price less the estimated costs of completion and the costs to be incurred in marketing, selling and distribution.
Financial instrumentsFinancial assets and liabilities are recognised when the Group becomes a party to the contractual provisions of the relevant instrument and derecognised when it ceases to be a party to such provisions.
Financial instruments are classified as cash and cash equivalents, bank overdrafts and loans, obligations under finance leases, trade receivables, trade payables, deferred consideration receivable, other receivables and other payables, as appropriate.
Non-derivative financial assets are categorised as “loans and receivables” and non-derivative financial liabilities are categorised as “other financial liabilities”. Derivative financial assets and liabilities that are not designated and effective as hedging instruments are categorised as “financial assets at fair value through profit or loss” and “financial liabilities at fair value through profit or loss”, respectively. The classification depends on the nature and purpose of the financial assets and liabilities and is determined at the time of initial recognition.
Trade receivablesTrade receivables do not carry any interest and are stated at their nominal value as reduced by appropriate allowances for estimated irrecoverable amounts. These are recognised in the Income Statement when there is objective evidence that the asset is impaired. Significant financial difficulties of the debtor, probability that the debtor will enter bankruptcy or financial reorganisation, and default or delinquency in payments are considered indicators that the asset is impaired. The carrying amount of the asset is reduced through the use of an allowance account. When a trade receivable is considered uncollectible, it is written off against the allowance account. Subsequent recoveries of amounts previously written off are credited against the allowance account. Changes in the carrying amount of the allowance account are recognised in the Income Statement.
Cash and cash equivalentsCash and cash equivalents comprise cash at bank and other short-term highly liquid investments that are readily convertible to a known amount of cash and are subject to an insignificant risk of changes in value.
Non-derivative financial liabilitiesNon-derivative financial liabilities are stated at amortised cost using the effective interest method. The effective interest method is a method of calculating the amortised financial liability and of allocating interest over the relevant period. The effective interest rate is the rate that exactly discounts estimated future cash payments through the expected life of the financial liability, or, where appropriate, a shorter period, to the net carrying amount on initial recognition. For borrowings, their carrying value includes accrued interest payable, as well as unamortised issue costs.
Equity instrumentsEquity instruments issued by the Company are recorded at the value of the proceeds received, net of direct issue costs.
71Annual Report & Accounts 2014
www.seniorplc.com | Senior plc
2. siGnificant accountinG policies continuedDerivative financial instruments and hedgingThe Group’s activities expose it primarily to the financial risks of changes in foreign currency exchange rates and interest rates. The Group uses foreign exchange contracts and, on occasion, interest rate swap contracts to hedge these exposures. The use of financial derivatives is governed by the Group’s Treasury Policies as approved by the Board of Directors, which provides written principles on the use of derivatives. The Group does not use derivative financial instruments for speculative purposes.
Certain derivative instruments do not qualify for hedge accounting. These are categorised as at “fair value through profit or loss” and are stated at fair value, with any resultant gain or loss recognised in the Income Statement.
The Group designates certain hedging instruments in respect of foreign currency risk as cash flow hedges. At the inception of the hedge relationship, the Group documents the relationship between the hedging instrument and the hedged item, along with its risk management objectives and strategy for undertaking various hedging transactions. The Group also documents, both at hedge inception and on an ongoing basis, whether the hedging instrument that is used in a hedging relationship is highly effective in offsetting changes in fair values or cash flows of the hedged item.
Changes in the fair value of derivative financial instruments that are designated and are effective as a cash flow hedge are recognised directly in equity and the ineffective portion is recognised immediately in the Income Statement. If the cash flow hedge of a firm commitment or forecasted transaction results in the recognition of an asset or a liability, then, at the time the asset or liability is recognised, the associated gains or losses on the derivative that had previously been recognised in equity are included in the initial measurement of the asset or liability. For hedges that do not result in the recognition of an asset or a liability, amounts deferred in equity are recognised in the Income Statement in the same period in which the hedged item affects net profit or loss.
For an effective hedge of an exposure to changes in fair value, the hedged item is adjusted for changes in fair value attributable to the risk being hedged with the corresponding entry in the Income Statement. Gains or losses from remeasuring the derivative are also recognised in the Income Statement. If the hedge is effective, these entries will offset in the Income Statement.
Changes in the fair value of derivative financial instruments that do not qualify for hedge accounting are recognised in the Income Statement as they arise.
Hedge accounting is discontinued when the hedging instrument expires or is sold, terminated, exercised, or no longer qualifies for hedge accounting. At that time, any cumulative gain or loss on the hedging instrument recognised in equity is retained in equity until the forecasted transaction occurs. If a hedged transaction is no longer expected to occur, the net cumulative gain or loss recognised in equity is transferred to the Income Statement for the period.
Gains and losses accumulated in equity are recognised in the Income Statement on disposal of the foreign operation.
ProvisionsProvisions are recognised when the Group has a present obligation (legal or constructive) as a result of a past event, it is probable that the Group will be required to settle that obligation and a reliable estimate can be made of the amount of the obligation. Provisions are measured at the Directors’ best estimate of the expenditure required to settle the obligation at the balance sheet date, taking into account the risks and uncertainties surrounding the obligation. They are not discounted to present value if the effect is not material.
Provisions for restructuring costs are recognised when the Group has a detailed formal plan for the restructuring and the plan has been communicated to the affected parties. Provisions for the expected cost for warranty obligations under local sale of goods legislation are recognised at the date of sale of the relevant products.
Share-based paymentsThe Group has applied the requirements of IFRS 2 Share-based payments.
The Group has issued equity-settled and cash-settled share-based payments to certain employees. The fair value (excluding the effect of non-market-related conditions), as determined at the grant date, is expensed on a straight-line basis over the vesting period, based on the Group’s estimate of the number of shares that will eventually vest and adjusted for the effect of non-market-related conditions.
Fair value is measured by use of a Black-Scholes model for the share option plans, and a binomial model for the share awards under the 2005 Long-Term Incentive Plan.
The liability in respect of equity-settled amounts is included in equity, whereas the liability in respect of cash-settled amounts is included in current and non-current liabilities as appropriate.
Critical accounting judgements and key sources of estimation and uncertaintyIn the process of applying the Group’s accounting policies, management has made a number of judgements. Estimates and assumptions concerning the future are also made by the Group. These are continually evaluated and are based on historical experience and other factors that are considered to be relevant. The resulting accounting estimates will, by definition, seldom equal the related actual results.
The key assumptions concerning the future and other key sources of estimation uncertainty and judgements at the balance sheet date that have a significant risk of causing a material adjustment to the carrying amounts of assets and liabilities within the next financial year are as follows:
GoodwillThe Group reviews the carrying values of its goodwill balances by carrying out impairment tests at least on an annual basis. These tests require estimates to be made of the value in use of its CGUs which are dependent on estimates of future cash flows and long-term growth rates of the CGUs. The carrying amount of goodwill at 31 December 2014 was £262.5m (2013 – £225.9m). Further details on these estimates are set out in Note 13.
Notes to the Consolidated Financial Statements continued
Annual Report & Accounts 201472
www.seniorplc.com | Senior plc

STRATEGIC REPORT
GO
VERNA
NCE
FINA
NCIA
L STATEMEN
TSA
DDITIO
NA
L INFO
RMATIO
N
2. siGnificant accountinG policies continuedFair value of intangible assets acquired on acquisitionOn acquisition of a business, the Group reviews the potential for recognising intangible assets and to date has recognised amounts in respect of customer relationships acquired. The fair values of these intangible assets are dependent on estimates of attributable future revenues, profitability and cash flows. The carrying amount at 31 December 2014 of intangible assets in respect of customer relationships acquired was £25.1m (2013 – £14.3m).
Income taxesIn determining the Group provisions for income tax and deferred tax it is necessary to consider transactions in a small number of key tax jurisdictions for which the ultimate tax determination is uncertain. To the extent that the final outcome differs from the tax that has been provided, adjustments will be made to income tax and deferred tax provisions held in the period the determination is made. The carrying amount of net current tax liability and deferred tax liability at 31 December 2014 was £12.7m (2013 – £14.5m) and £18.3m (2013 – £9.5m), respectively. Further details on these estimates are set out in Notes 10 and 21.
Retirement benefit obligationsThe asset or liability recognised in respect of retirement benefit obligations is dependent on a number of estimates including those relating to mortality, inflation, salary increases, expected return on plan assets and the rate at which liabilities are discounted. Any change in these assumptions would impact the retirement benefit obligation recognised. The carrying amount of retirement benefit obligations at 31 December 2014 was a liability of £19.8m (2013 – £25.6m). Further details on these estimates are set out in Note 35.
3. RevenueAn analysis of the Group’s revenue is as follows:
Year ended2014
£m
Year ended2013
£mSales of goods 820.8 775.1
820.8 775.1
4. seGment infoRmationThe Group reports its segment information as two operating Divisions according to the market segments they serve, Aerospace and Flexonics. For management purposes, the Aerospace Division is managed as two sub-divisions, Aerostructures and Fluid Systems, in order to enhance management oversight; however, these are aggregated as one reporting segment as they service similar markets and customers in accordance with IFRS 8. The Flexonics Division is managed as a single division.
The accounting policies of the reportable segments are the same as the Group’s accounting policies described in Note 2 and the sales between segments are carried out at arm’s length. Adjusted operating profit, as described in Note 9, is the key measure reported to the Group’s Executive Committee for the purpose of resource allocation and assessment of segment performance. Investment income, finance costs and tax are not allocated to segments, as this type of activity is driven by the central tax and treasury function.
Segment assets include directly attributable computer software assets, property, plant and equipment, and working capital assets. Goodwill, intangible customer relationships, cash, deferred and current tax and other financial assets (except for working capital) are not allocated to segments for the purposes of reporting financial performance to the Group’s Executive Committee.
Segment liabilities include directly attributable working capital liabilities. Debt, finance leases, retirement benefit obligations, deferred and current tax and other financial liabilities (except for working capital) are not allocated to segments for the purposes of reporting financial performance to the Group’s Executive Committee.
73Annual Report & Accounts 2014
www.seniorplc.com | Senior plc
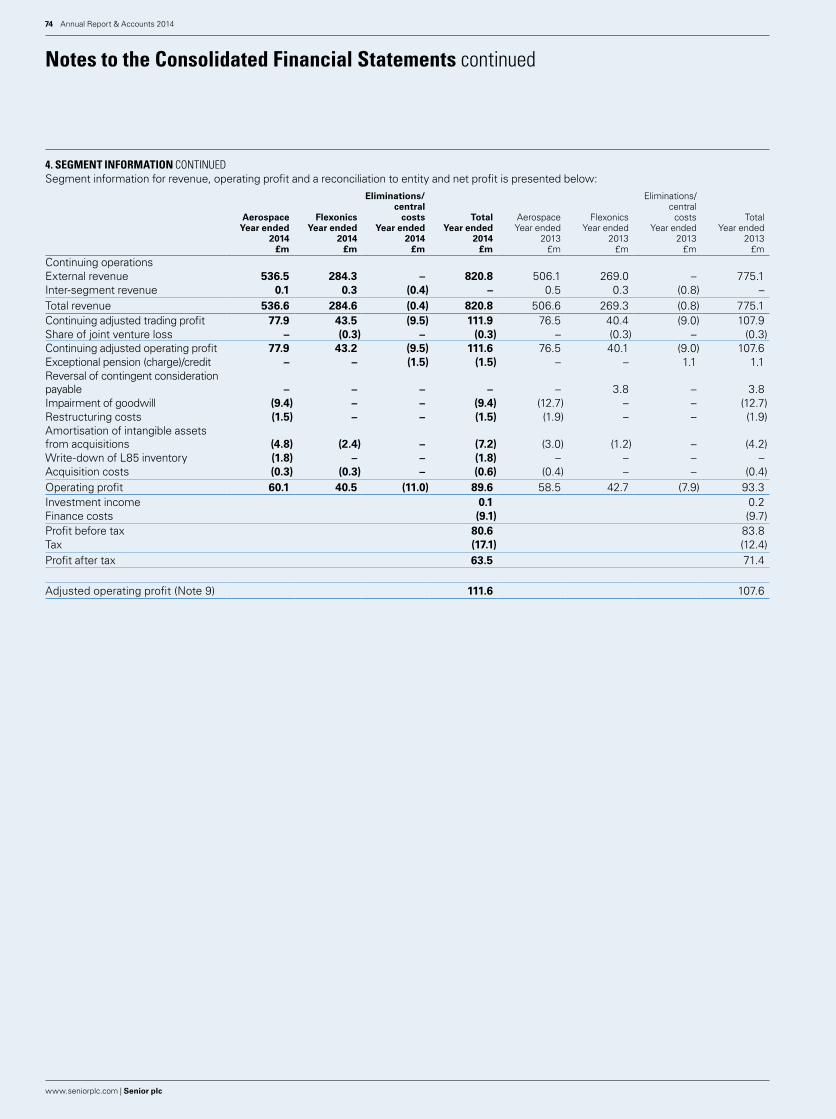
4. seGment infoRmation continuedSegment information for revenue, operating profit and a reconciliation to entity and net profit is presented below:
AerospaceYear ended
2014£m
FlexonicsYear ended
2014£m
Eliminations/central
costsYear ended
2014£m
TotalYear ended
2014£m
AerospaceYear ended
2013£m
FlexonicsYear ended
2013£m
Eliminations/central
costsYear ended
2013£m
TotalYear ended
2013£m
Continuing operationsExternal revenue 536.5 284.3 – 820.8 506.1 269.0 – 775.1 Inter-segment revenue 0.1 0.3 (0.4) – 0.5 0.3 (0.8) – Total revenue 536.6 284.6 (0.4) 820.8 506.6 269.3 (0.8) 775.1 Continuing adjusted trading profit 77.9 43.5 (9.5) 111.9 76.5 40.4 (9.0) 107.9 Share of joint venture loss – (0.3) – (0.3) – (0.3) – (0.3)Continuing adjusted operating profit 77.9 43.2 (9.5) 111.6 76.5 40.1 (9.0) 107.6 Exceptional pension (charge)/credit – – (1.5) (1.5) – – 1.1 1.1 Reversal of contingent consideration payable – – – – – 3.8 – 3.8 Impairment of goodwill (9.4) – – (9.4) (12.7) – – (12.7)Restructuring costs (1.5) – – (1.5) (1.9) – – (1.9)Amortisation of intangible assets from acquisitions (4.8) (2.4) – (7.2) (3.0) (1.2) – (4.2)Write-down of L85 inventory (1.8) – – (1.8) – – – – Acquisition costs (0.3) (0.3) – (0.6) (0.4) – – (0.4)Operating profit 60.1 40.5 (11.0) 89.6 58.5 42.7 (7.9) 93.3 Investment income 0.1 0.2 Finance costs (9.1) (9.7)Profit before tax 80.6 83.8 Tax (17.1) (12.4)Profit after tax 63.5 71.4
Adjusted operating profit (Note 9) 111.6 107.6
Notes to the Consolidated Financial Statements continued
Annual Report & Accounts 201474
www.seniorplc.com | Senior plc
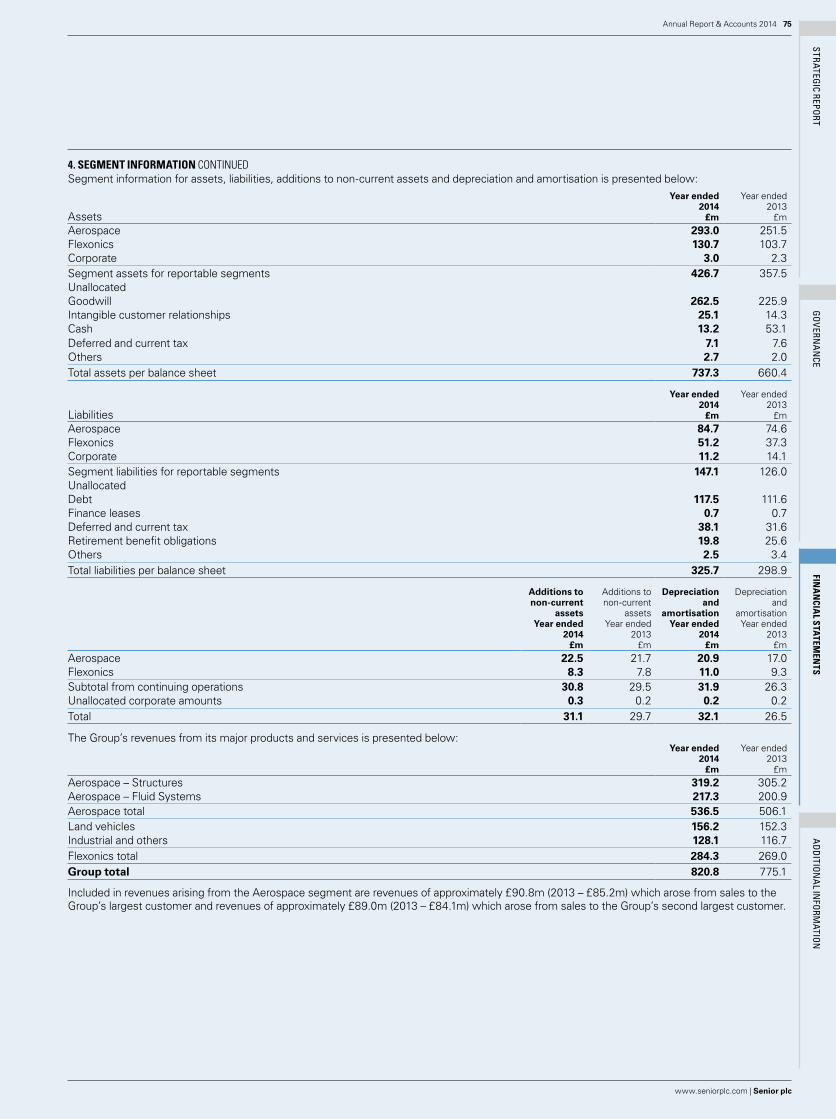
STRATEGIC REPORT
GO
VERNA
NCE
FINA
NCIA
L STATEMEN
TSA
DDITIO
NA
L INFO
RMATIO
N
4. seGment infoRmation continuedSegment information for assets, liabilities, additions to non-current assets and depreciation and amortisation is presented below:
Assets
Year ended2014
£m
Year ended2013
£mAerospace 293.0 251.5 Flexonics 130.7 103.7 Corporate 3.0 2.3 Segment assets for reportable segments 426.7 357.5 UnallocatedGoodwill 262.5 225.9 Intangible customer relationships 25.1 14.3 Cash 13.2 53.1 Deferred and current tax 7.1 7.6 Others 2.7 2.0 Total assets per balance sheet 737.3 660.4
Liabilities
Year ended2014
£m
Year ended2013
£mAerospace 84.7 74.6 Flexonics 51.2 37.3 Corporate 11.2 14.1 Segment liabilities for reportable segments 147.1 126.0 UnallocatedDebt 117.5 111.6 Finance leases 0.7 0.7 Deferred and current tax 38.1 31.6 Retirement benefit obligations 19.8 25.6 Others 2.5 3.4 Total liabilities per balance sheet 325.7 298.9
Additions tonon-current
assetsYear ended
2014 £m
Additions tonon-current
assetsYear ended
2013 £m
Depreciationand
amortisationYear ended
2014 £m
Depreciationand
amortisationYear ended
2013 £m
Aerospace 22.5 21.7 20.9 17.0 Flexonics 8.3 7.8 11.0 9.3 Subtotal from continuing operations 30.8 29.5 31.9 26.3 Unallocated corporate amounts 0.3 0.2 0.2 0.2 Total 31.1 29.7 32.1 26.5
The Group’s revenues from its major products and services is presented below:Year ended
2014 £m
Year ended2013
£mAerospace – Structures 319.2 305.2 Aerospace – Fluid Systems 217.3 200.9 Aerospace total 536.5 506.1 Land vehicles 156.2 152.3 Industrial and others 128.1 116.7 Flexonics total 284.3 269.0 Group total 820.8 775.1
Included in revenues arising from the Aerospace segment are revenues of approximately £90.8m (2013 – £85.2m) which arose from sales to the Group’s largest customer and revenues of approximately £89.0m (2013 – £84.1m) which arose from sales to the Group’s second largest customer.
75Annual Report & Accounts 2014
www.seniorplc.com | Senior plc

4. seGment infoRmation continuedGeographical informationThe Groups’ operations are located principally in North America and Europe.
The following table provides an analysis of the Group’s sales by geographical market, irrespective of the origin of the goods/services. The carrying values of segment non-current assets are analysed by the geographical area in which the assets are located.
Salesrevenue
Year ended2014
£m
Salesrevenue
Year ended2013
£m
Segment non-current
assetsYear ended
2014 £m
Segment non-current
assetsYear ended
2013 £m
USA 405.5 405.6 240.5 233.4 UK 150.1 129.1 110.5 111.6 Rest of the World 265.2 240.4 108.9 41.6 Subtotal continuing operations 820.8 775.1 459.9 386.6 Unallocated amounts – – 6.5 7.0 Total 820.8 775.1 466.4 393.6
The unallocated amounts on non-current assets relate to deferred tax assets.
5. tRaDinG pRofit anD pRofit foR tHe peRioDTrading profit for continuing operations can be analysed as follows:
Year ended2014
£m
Year ended2013
£mRevenue 820.8 775.1 Cost of sales (618.6) (578.5)Gross profit 202.2 196.6 Distribution costs (5.1) (4.2)Administrative expenses (107.2) (98.8)Trading profit 89.9 93.6
Profit for the period has been arrived at after charging:Year ended
2014£m
Year ended2013
£mNet foreign exchange losses 2.0 2.7 Research and development costs 11.5 12.9 Depreciation of property, plant and equipment 24.1 21.6 Amortisation of intangible assets included in administration expenses 8.0 4.9 Cost of inventories recognised as expense 618.6 578.5 Provision for impairment for doubtful receivables 0.6 0.5 Staff costs (see Note 6) 242.2 223.1
All research and development costs were expensed during the year.
Notes to the Consolidated Financial Statements continued
Annual Report & Accounts 201476
www.seniorplc.com | Senior plc

STRATEGIC REPORT
GO
VERNA
NCE
FINA
NCIA
L STATEMEN
TSA
DDITIO
NA
L INFO
RMATIO
N
5. tRaDinG pRofit anD pRofit foR tHe peRioD continuedThe analysis of the Auditor’s remuneration is as follows:
Year ended2014
£m
Year ended2013
£mFees payable to the Company’s Auditor and their associates for the audit of the Company’s annual accounts 0.2 0.1
Fees payable to the Company’s Auditor and their associates for other services to the Group
– The audit of the Company’s subsidiaries 0.5 0.5
Total audit fees 0.7 0.6
– Other taxation advisory services 0.2 0.1 Total non-audit fees 0.2 0.1
Fees payable to Deloitte LLP and their associates for non-audit services to the Company are not required to be disclosed because the Consolidated Financial Statements are required to disclose such fees on a consolidated basis.
Details of the Company’s policy on the use of auditors for non-audit services, the reasons why the Auditor was used rather than another supplier and how the Auditor’s independence and objectivity was safeguarded are set out in the Audit Committee report on pages 40 to 43. No services were provided pursuant to contingent fee arrangements.
6. staff costsThe average monthly number of employees (including Directors) was:
Year ended2014
Number
Year ended2013
NumberProduction 6,248 5,441 Distribution 51 43 Sales 302 292 Administration 654 586
7,255 6,362
Year ended2014
£m
Year ended2013
£mTheir aggregate remuneration comprised:Wages and salaries 204.8 189.5 Social security costs 25.2 23.0 Other pension costs – defined contribution (see Note 35a) 7.4 6.2 Other pension costs – defined benefit (see Note 35e) 0.8 2.0 Share-based payments (see Note 34) 2.5 3.5 Aggregate remuneration 240.7 224.2 Exceptional pension charge/(credit) (see Note 35) 1.5 (1.1)Total 242.2 223.1
77Annual Report & Accounts 2014
www.seniorplc.com | Senior plc
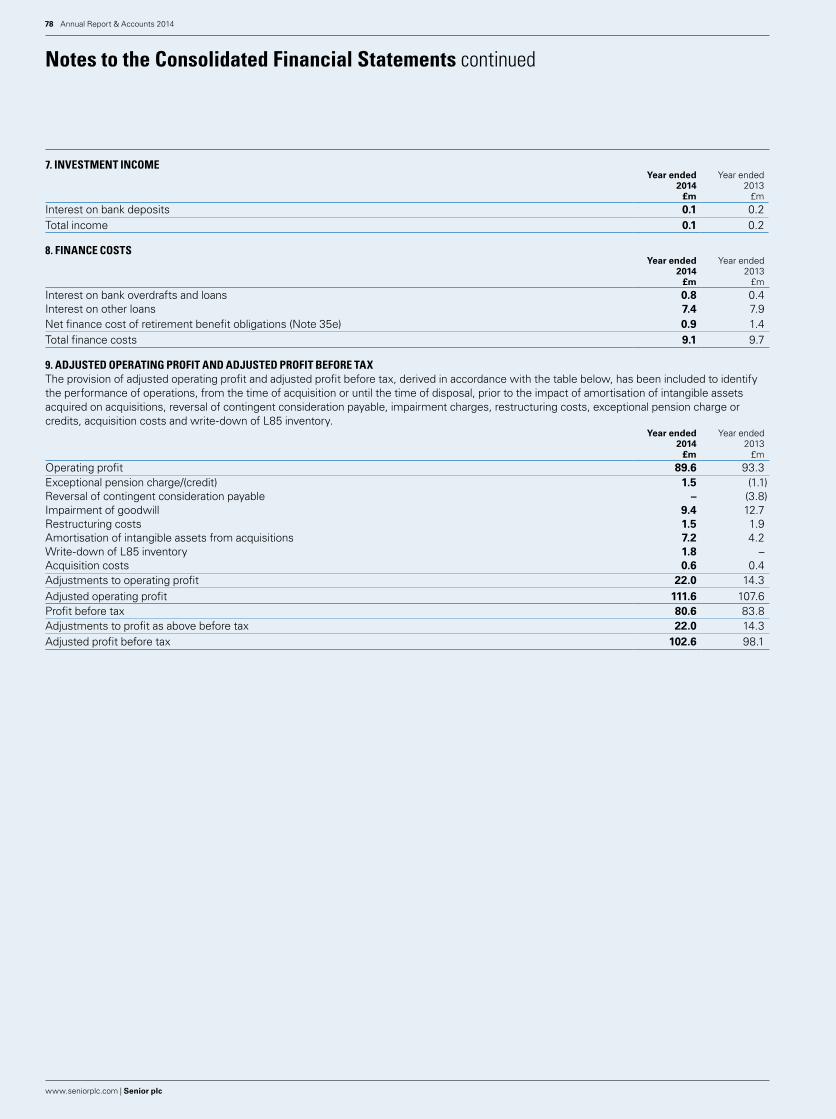
7. investment incomeYear ended
2014£m
Year ended2013
£mInterest on bank deposits 0.1 0.2 Total income 0.1 0.2
8. finance costsYear ended
2014£m
Year ended2013
£mInterest on bank overdrafts and loans 0.8 0.4 Interest on other loans 7.4 7.9 Net finance cost of retirement benefit obligations (Note 35e) 0.9 1.4 Total finance costs 9.1 9.7
9. aDjusteD opeRatinG pRofit anD aDjusteD pRofit befoRe taxThe provision of adjusted operating profit and adjusted profit before tax, derived in accordance with the table below, has been included to identify the performance of operations, from the time of acquisition or until the time of disposal, prior to the impact of amortisation of intangible assets acquired on acquisitions, reversal of contingent consideration payable, impairment charges, restructuring costs, exceptional pension charge or credits, acquisition costs and write-down of L85 inventory.
Year ended2014
£m
Year ended2013
£mOperating profit 89.6 93.3 Exceptional pension charge/(credit) 1.5 (1.1)Reversal of contingent consideration payable – (3.8)Impairment of goodwill 9.4 12.7 Restructuring costs 1.5 1.9 Amortisation of intangible assets from acquisitions 7.2 4.2 Write-down of L85 inventory 1.8 –Acquisition costs 0.6 0.4 Adjustments to operating profit 22.0 14.3 Adjusted operating profit 111.6 107.6 Profit before tax 80.6 83.8 Adjustments to profit as above before tax 22.0 14.3 Adjusted profit before tax 102.6 98.1
Notes to the Consolidated Financial Statements continued
Annual Report & Accounts 201478
www.seniorplc.com | Senior plc

STRATEGIC REPORT
GO
VERNA
NCE
FINA
NCIA
L STATEMEN
TSA
DDITIO
NA
L INFO
RMATIO
N
10. tax cHaRGeYear ended
2014£m
Year ended2013
£mCurrent tax:Current year 12.4 12.6 Adjustments in respect of prior periods (0.5) (3.7)
11.9 8.9 Deferred tax (Note 21):Current year 6.2 0.3 Adjustments in respect of prior periods (1.0) 3.2
5.2 3.5 17.1 12.4
The Finance Act 2013, which provides for reductions in the main rate of Corporation Tax from 23% to 21% effective from 1 April 2014 and to 20% effective from 1 April 2015, was substantively enacted on 2 July 2013. These rate reductions have been reflected in the calculation of UK deferred tax at the balance sheet date.
UK Corporation Tax is calculated at an effective rate of 21.5% (2013 – 23.25%) of the estimated assessable profit for the year.
Taxation for other jurisdictions is calculated at the rates prevailing in the respective jurisdictions.
The charge for the year on profit from continuing operations can be reconciled to the profit per the Consolidated Income Statement as follows:Year ended
2014£m
Year ended2014
%
Year ended2013
£m
Year ended2013
%
Profit before tax from continuing operations 80.6 83.8 Tax at the UK Corporation Tax rate of 21.5% (2013 – 23.25%) 17.3 19.4 Tax effect of income/expenses that are non-taxable/deductible in determining taxable profit (8.6) (7.7)Tax effect of unrelieved tax losses – (0.3)Tax effect of movements in temporary differences not previously recognised (0.2) (0.7)Deferred tax expense resulting from a reduction in tax rate – 0.6 Effect of different tax rates of subsidiaries operating in other jurisdictions 10.1 1.6 Adjustments to tax charge in respect of prior periods (1.5) (0.5)Tax expense and effective tax rate for the year 17.1 21.2 12.4 14.8
79Annual Report & Accounts 2014
www.seniorplc.com | Senior plc

10. tax cHaRGe continuedIn addition to the amount charged to the Consolidated Income Statement, the following amounts relating to tax have been recognised directly in other comprehensive income:
Year ended2014
£m
Year ended2013
£mCurrent tax:Items that may be reclassified subsequently to profit or lossExchange differences on translation of foreign operations 0.6 (0.1)Deferred tax:Items that will not be reclassified subsequently to profit and lossTax on actuarial losses/(gains) 0.4 (1.5)Effect of change in tax rate – (0.6)Items that may be reclassified subsequently to profit or lossExchange differences on translation of foreign operations (0.4) (0.2)Total tax recognised directly in other comprehensive income 0.6 (2.4)
Current tax 0.6 (0.1)Deferred tax (Note 21) – (2.3)
0.6 (2.4)
In addition to the amount charged to the Consolidated Income Statement and other comprehensive income, the following amounts relating to tax have been recognised directly in equity:
Year ended2014
£m
Year ended2013
£mCurrent tax:Excess tax deductions related to share-based payments in exercised options 0.7 0.5 Deferred tax:Excess tax deductions related to share-based payments in exercised options 0.3 0.3 Change in estimated excess tax deductions related to share-based payments (1.1) 0.9 Total tax recognised directly in equity (0.1) 1.7
Notes to the Consolidated Financial Statements continued
Annual Report & Accounts 201480
www.seniorplc.com | Senior plc

STRATEGIC REPORT
GO
VERNA
NCE
FINA
NCIA
L STATEMEN
TSA
DDITIO
NA
L INFO
RMATIO
N
11. DiviDenDsYear ended
2014£m
Year ended2013
£mAmounts recognised as distributions to equity holders in the period:Final dividend for the year ended 31 December 2013 of 3.60p (2012 – 3.27p) per share 15.0 13.6 Interim dividend for the year ended 31 December 2014 of 1.67p (2013 – 1.52p) per share 6.9 6.3
21.9 19.9 Proposed final dividend for the year ended 31 December 2014 of 3.96p (2013 – 3.60p) per share 16.6 15.0
The proposed final dividend is subject to approval by shareholders at the Annual General Meeting 2015 and has not been included as a liability in these Financial Statements.
12. eaRninGs peR sHaReThe calculation of the basic and diluted earnings per share is based on the following data:
Number of shares
Year ended2014
Million
Year ended2013
MillionWeighted average number of ordinary shares for the purposes of basic earnings per share 416.3 414.7 Effect of dilutive potential ordinary shares:Share options 5.3 5.4 Weighted average number of ordinary shares for the purposes of diluted earnings per share 421.6 420.1
Year ended 2014 Year ended 2013
Earnings and earnings per shareEarnings
£mEPS
penceEarnings
£mEPS
pence
Profit for the period from continuing operations 63.5 15.25 71.4 17.22 Adjust:Amortisation of intangible assets from acquisitions net of tax of £1.3m (2013 – £1.4m) 5.9 1.42 2.8 0.67 Acquisition costs net of tax of £nil (2013 – £nil) 0.6 0.14 0.4 0.10 Reversal of contingent consideration payable net of tax of £nil (2013 – £nil) – – (3.8) (0.92)Goodwill impairment charge net of tax of £nil (2013 – £5.1m) 9.4 2.26 7.6 1.83 Exceptional pension charge/(credit) net of tax of £0.3m (2013 – £0.4m) 1.2 0.29 (0.7) (0.17)Write-down of L85 inventory net of tax of £0.7m (2013 – £nil) 1.1 0.26 Restructuring costs net of tax of £0.6m (2013 – £0.8m) 0.9 0.22 1.1 0.27 Adjusted earnings after tax 82.6 19.84 78.8 19.00 Earnings per share– basic 15.25p 17.22p– diluted 15.06p 17.00p– adjusted 19.84p 19.00p– adjusted and diluted 19.59p 18.76p
The effect of dilutive shares on the earnings for the purposes of diluted earnings per share is £nil (2013 – £nil).
The denominators used for all basic, diluted and adjusted earnings per share are as detailed in the “Number of shares” table above.
The provision of an adjusted earnings per share, derived in accordance with the table above, has been included to identify the performance of operations, from the time of acquisition or until the time of disposal, prior to the impact of the following items:
– amortisation of intangible assists acquired on acquisitions;
– exceptional pension charge or credits;
– acquisition costs;
– reversal of contingent consideration payable;
– impairment charges;
– restructuring costs; and
– write-down of L85 inventory.
81Annual Report & Accounts 2014
www.seniorplc.com | Senior plc

13. GooDwillYear ended
2014£m
Year ended2013
£mCostAt 1 January 246.1 228.4 Exchange differences 9.5 (3.3)Increases (see Note 31) 1.3 0.3 Recognised on acquisition of subsidiaries (See Note 31) 36.5 20.7 At 31 December 293.4 246.1 Accumulated impairment lossesAt 1 January 20.2 8.3 Impairment charge in the year 9.4 12.7 Exchange differences 1.3 (0.8)At 31 December 30.9 20.2 Carrying amount at 31 December 262.5 225.9
Goodwill acquired in a business combination is allocated, at acquisition, to the CGUs that are expected to benefit from that business combination. As noted in the Strategic Report on pages 24 to 27, the Aerospace Division consists of 19 operations and the Flexonics Division consists of 13 operations. Each of these operations is considered to be a separate CGU. Goodwill had been allocated to 20 of these individual CGUs – 13 in Aerospace and seven in Flexonics. The table below highlights the carrying amount of goodwill allocated to the CGUs that are considered significant in comparison with the total carrying amount of goodwill. Where the carrying amount of goodwill allocated to a CGU is individually not considered significant, it is aggregated in the table below. The carrying amount of goodwill of the aggregated Aerospace CGUs is considered significant and the recoverable amounts for these units are based principally on the same key assumptions.
Year ended2014
£m
Year ended2013
£mAerospace– Capo Industries – 15.3 – Ketema 16.3 – – AMT 34.5 32.4 – Weston 27.6 27.6 – Jet Products 16.5 15.5 – Connecticut 13.4 12.6 – BWT and Atlas 16.7 16.7 – Bird Bellows 12.0 12.0 – Thermal 20.3 19.0 – Senior Aerospace Upeca 14.2 –– Other Aerospace CGUs 18.3 26.8
189.8 177.9 Flexonics– Pathway 22.8 21.4 – GA 18.5 17.4 – Senior Flexonics Upeca 22.0 –– Other Flexonics CGUs 9.4 9.2
72.7 48.0 Total 262.5 225.9
Following the completion of the merger of Capo into Ketema, the goodwill of Capo has been reallocated to Ketema.
The Group tests goodwill annually for impairment, or more frequently if there are indications that goodwill might be impaired. The 2014 goodwill impairment review was undertaken as at 31 December 2014. The recoverable amounts of all the CGUs are determined from value in use calculations. The calculations use cash flow forecasts derived from the most recent financial budgets and forecasts per individual unit, as approved by management for the next three years. For some CGUs this is supplemented by forecasts of performance for a further two years. These forecasts, where appropriate, take account of the current economic environment as set out in the Strategic Report on pages 1 to 30. Cash flows thereafter have been extrapolated based on estimated growth rates. These growth rates do not exceed independently sourced long-term average growth rates for the relevant markets. The cash flow forecasts for each CGU have also been adjusted to reflect risks specific to each CGU. The pre-tax rate used to discount for forecast cash flows for all CGUs is 10.1% (2013 – 10.5%). This is based on the Group’s weighted average pre-tax cost of capital and is the measurement used by management in assessing investment appraisals.
The key assumptions used in the value in use calculations for all Aerospace CGUs are the forecast build rates for aircraft, forecast gross margins and long-term average forecast growth rates. Forecast build rates for aircraft are in line with market forecasts and guidance available from manufacturers such as Boeing and Airbus. Forecast gross margins are set individually by each CGU and reflect past experience, notably the most recently achieved margins, but also factor in continuing efficiency improvements to counteract inflationary increases in underlying costs. Cash flows extrapolated beyond the initial forecast period of three years are based on growth rates of 3.0% per annum which does not exceed the
Notes to the Consolidated Financial Statements continued
Annual Report & Accounts 201482
www.seniorplc.com | Senior plc

STRATEGIC REPORT
GO
VERNA
NCE
FINA
NCIA
L STATEMEN
TSA
DDITIO
NA
L INFO
RMATIO
N
13. GooDwill continuedlong-term average growth rate forecasts for the aerospace market as included in market outlooks from Boeing and Airbus. For Thermal, which has been impacted by operational and performance issues following its acquisition in November 2013, projections for the initial forecast period have been expanded a further two years beyond the initial forecast period of three years to reflect the medium-term plan of management to recover the performance of the business. Beyond this combined five-year period, cash flows are projected to grow at a compound annual growth rate of 3.0% into perpetuity, less than the industry’s 20-year market projections. Management’s base case cash flows were reduced by 28% to reflect further potential risk in performance. This results in Thermal’s weighted average recoverable amount exceeding its carrying value by £9m. A reduction in management’s base case cash flows of 44% would result in the recoverable amount reducing to a level comparable with its carrying value. Factors that could lead to lower cash flows than currently estimated over the initial five-year period include: not meeting customers’ expectations for quality and on-time delivery performance which would result in additional rework and inspection costs to be incurred; not securing sufficient new business with existing customers; and not introducing sufficient new growth customers. Management believes that any reasonably possible change in any of the key assumptions would not cause the carrying amount of AMT, Weston, Jet Products, Connecticut, BWT and Atlas, Bird Bellows, Senior Aerospace Upeca and all other aggregated Aerospace CGUs, with the exception of Composites as noted below, to exceed the recoverable amount of those units and aggregated units, respectively.
As noted in the Strategic Report and the post balance sheet events note (see Note 36), following the announcement by Bombardier to suspend activity on its L85 business jet programme, Composites forecast is expected to be adversely impacted. An impairment review for this CGU was performed following this announcement and the recoverable amount was determined from a value in use calculation. The calculation used the cash flow forecasts derived from the most recent forecasts at the time, as approved by management for the next five years, removing the L85 business jet programme. Cash flows thereafter were extrapolated based on estimated growth rates that did not exceed independently sourced estimated long-term average growth rates for the aerospace industry. Different scenarios, where the compound annual sales growth over the initial five-year period ranged from management’s base case of 19.4% to 7.6% were considered. Beyond this combined five-year period, cash flows were projected to grow at a compound annual growth rate of 3.0%. The pre-tax rate used to discount the forecast cash flows was 10.1%. As at 31 December 2014, before impairment testing, goodwill of £9.4m was allocated to Composites within Aerospace. As a result of the impairment test noted above, an impairment loss of £9.4m was recognised against Composites goodwill, leaving a balance of £nil at 31 December 2014. This impairment loss has been included within trading profit in the Consolidated Income Statement.
The key assumptions used in the value in use calculations for Pathway, GA and Senior Flexonics Upeca are the forecast orders and forecast gross margins. Forecast orders are based on the orders secured and quote activity at the time of setting the budget, and also reflect past experience with the build-up of orders and quote success rates. Forecast gross margins reflect past experience, notably the most recently achieved margins, but also factor in expected efficiency improvements to counteract inflationary increases in underlying costs. Management believes that any reasonable possible change in the key assumptions would not cause the carrying amount of Pathway, GA and Senior Flexonics Upeca to exceed its recoverable amount. Other than as noted for GA, no significant goodwill is associated with CGUs operating in land vehicle markets.
An impairment charge of £9.4m has been recognised in 2014 (2013 – £12.7m).
14. otHeR intanGible assetsYear ended
2014Customer
relationships£m
Year ended2014
Computersoftware
£m
Year ended2014
Total£m
Year ended2013
Customer relationships
£m
Year ended2013
Computersoftware
£m
Year ended2013
Total£m
CostAt 1 January 46.2 10.0 56.2 44.9 9.5 54.4 Additions – 1.5 1.5 – 1.0 1.0 Disposals – (0.7) (0.7) – (0.3) (0.3)Acquired on acquisition of subsidiaries 17.8 0.2 18.0 1.8 – 1.8 Exchange differences 1.9 0.1 2.0 (0.5) (0.2) (0.7)At 31 December 65.9 11.1 77.0 46.2 10.0 56.2 AmortisationAt 1 January 31.9 7.7 39.6 28.2 7.5 35.7 Charge for the year 7.2 0.8 8.0 4.2 0.7 4.9 Disposals – (0.7) (0.7) – (0.3) (0.3)Exchange differences 1.7 0.1 1.8 (0.5) (0.2) (0.7)At 31 December 40.8 7.9 48.7 31.9 7.7 39.6 Carrying amount at 31 December 25.1 3.2 28.3 14.3 2.3 16.6
The carrying amount of the Group’s customer relationships includes an amount of £15.1m in respect of customer contracts acquired as part of the acquisition of Upeca in 2014. These are being amortised over five years from the date of acquisition.The carrying amount of the Group’s customer relationships also includes an amount of £3.7m (2013 – £4.7m) in respect of customer contracts acquired as part of the acquisition of GA in 2012 and £1.1m (2013 – £1.7m) in respect of customer contracts acquired as part of the acquisition of Thermal in 2013. These are being amortised over five years and two months and three years from the date of acquisitions, respectively.
In addition, the carrying amount of the Group’s customer relationships includes an amount of £5.2m (2013 – £7.9m) in respect of customer contracts acquired as part of the acquisition of Weston 2011. This is being amortised over five years from the date of acquisition.
83Annual Report & Accounts 2014
www.seniorplc.com | Senior plc
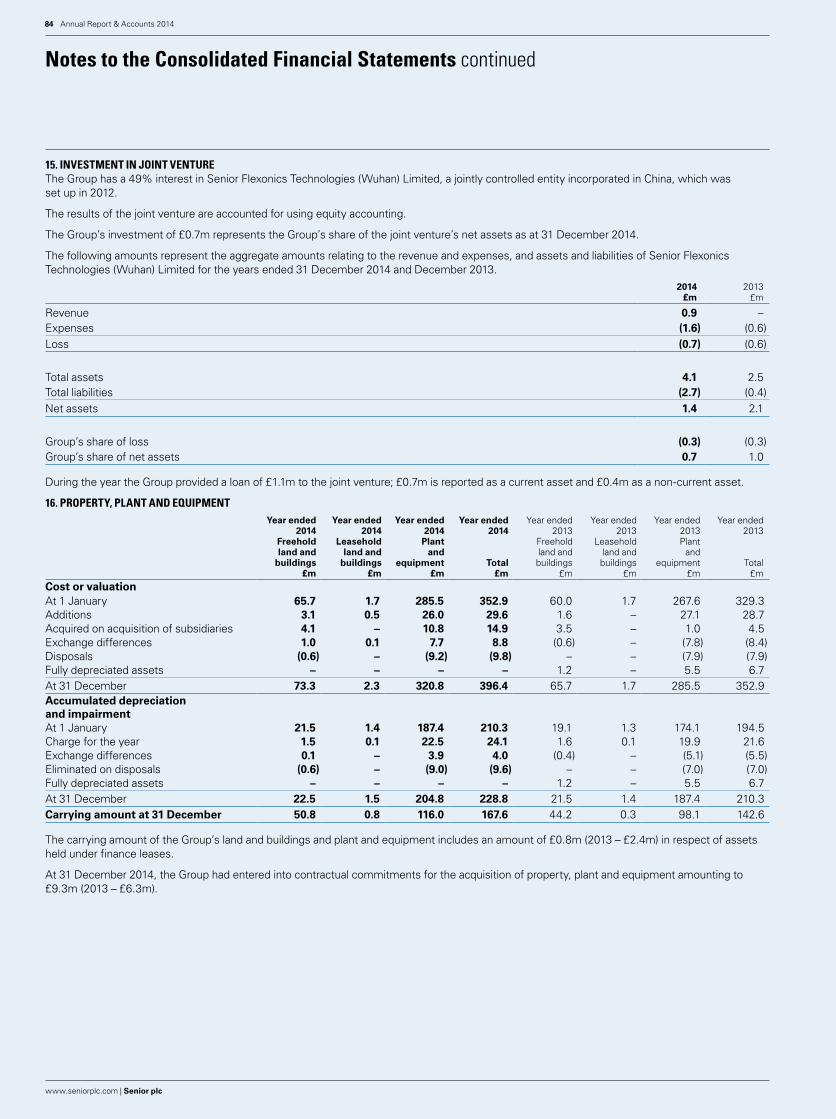
15. investment in joint ventuReThe Group has a 49% interest in Senior Flexonics Technologies (Wuhan) Limited, a jointly controlled entity incorporated in China, which was set up in 2012.
The results of the joint venture are accounted for using equity accounting.
The Group’s investment of £0.7m represents the Group’s share of the joint venture’s net assets as at 31 December 2014.
The following amounts represent the aggregate amounts relating to the revenue and expenses, and assets and liabilities of Senior Flexonics Technologies (Wuhan) Limited for the years ended 31 December 2014 and December 2013.
2014£m
2013£m
Revenue 0.9 –Expenses (1.6) (0.6)Loss (0.7) (0.6)
Total assets 4.1 2.5 Total liabilities (2.7) (0.4)Net assets 1.4 2.1
Group’s share of loss (0.3) (0.3)Group’s share of net assets 0.7 1.0
During the year the Group provided a loan of £1.1m to the joint venture; £0.7m is reported as a current asset and £0.4m as a non-current asset.
16. pRopeRty, plant anD equipmentYear ended
2014Freehold land andbuildings
£m
Year ended2014
Leasehold land andbuildings
£m
Year ended2014
Plantand
equipment£m
Year ended2014
Total£m
Year ended2013
Freehold land andbuildings
£m
Year ended2013
Leasehold land andbuildings
£m
Year ended2013Plant
andequipment
£m
Year ended2013
Total£m
Cost or valuationAt 1 January 65.7 1.7 285.5 352.9 60.0 1.7 267.6 329.3 Additions 3.1 0.5 26.0 29.6 1.6 – 27.1 28.7 Acquired on acquisition of subsidiaries 4.1 – 10.8 14.9 3.5 – 1.0 4.5 Exchange differences 1.0 0.1 7.7 8.8 (0.6) – (7.8) (8.4)Disposals (0.6) – (9.2) (9.8) – – (7.9) (7.9)Fully depreciated assets – – – – 1.2 – 5.5 6.7 At 31 December 73.3 2.3 320.8 396.4 65.7 1.7 285.5 352.9 Accumulated depreciation and impairmentAt 1 January 21.5 1.4 187.4 210.3 19.1 1.3 174.1 194.5 Charge for the year 1.5 0.1 22.5 24.1 1.6 0.1 19.9 21.6 Exchange differences 0.1 – 3.9 4.0 (0.4) – (5.1) (5.5)Eliminated on disposals (0.6) – (9.0) (9.6) – – (7.0) (7.0)Fully depreciated assets – – – – 1.2 – 5.5 6.7 At 31 December 22.5 1.5 204.8 228.8 21.5 1.4 187.4 210.3 Carrying amount at 31 December 50.8 0.8 116.0 167.6 44.2 0.3 98.1 142.6
The carrying amount of the Group’s land and buildings and plant and equipment includes an amount of £0.8m (2013 – £2.4m) in respect of assets held under finance leases.
At 31 December 2014, the Group had entered into contractual commitments for the acquisition of property, plant and equipment amounting to £9.3m (2013 – £6.3m).
Notes to the Consolidated Financial Statements continued
Annual Report & Accounts 201484
www.seniorplc.com | Senior plc

STRATEGIC REPORT
GO
VERNA
NCE
FINA
NCIA
L STATEMEN
TSA
DDITIO
NA
L INFO
RMATIO
N
17. inventoRiesYear ended
2014£m
Year ended2013
£mRaw materials 34.8 27.8 Work-in-progress 59.6 51.6 Finished goods 24.9 20.0
119.3 99.4
Inventory write-downs and provisions, excluding acquisitions, increased by £1.6m in the year (2013 – decreased by £1.7m).
18. tRaDe anD otHeR ReceivablesTrade and other receivables at 31 December comprise the following:
Year ended2014
£m
Year ended2013
£mNon-current assetsOther receivables 0.4 0.5
0.4 0.5
Current assetsTrade receivables 123.4 103.2 Current tax recoverable 0.6 0.6 Value added tax 3.3 1.2 Currency derivatives 0.8 1.9 Prepayments and accrued income 7.1 5.5 Other receivables 2.5 1.9
137.7 114.3 Total trade and other receivables 138.1 114.8
85Annual Report & Accounts 2014
www.seniorplc.com | Senior plc
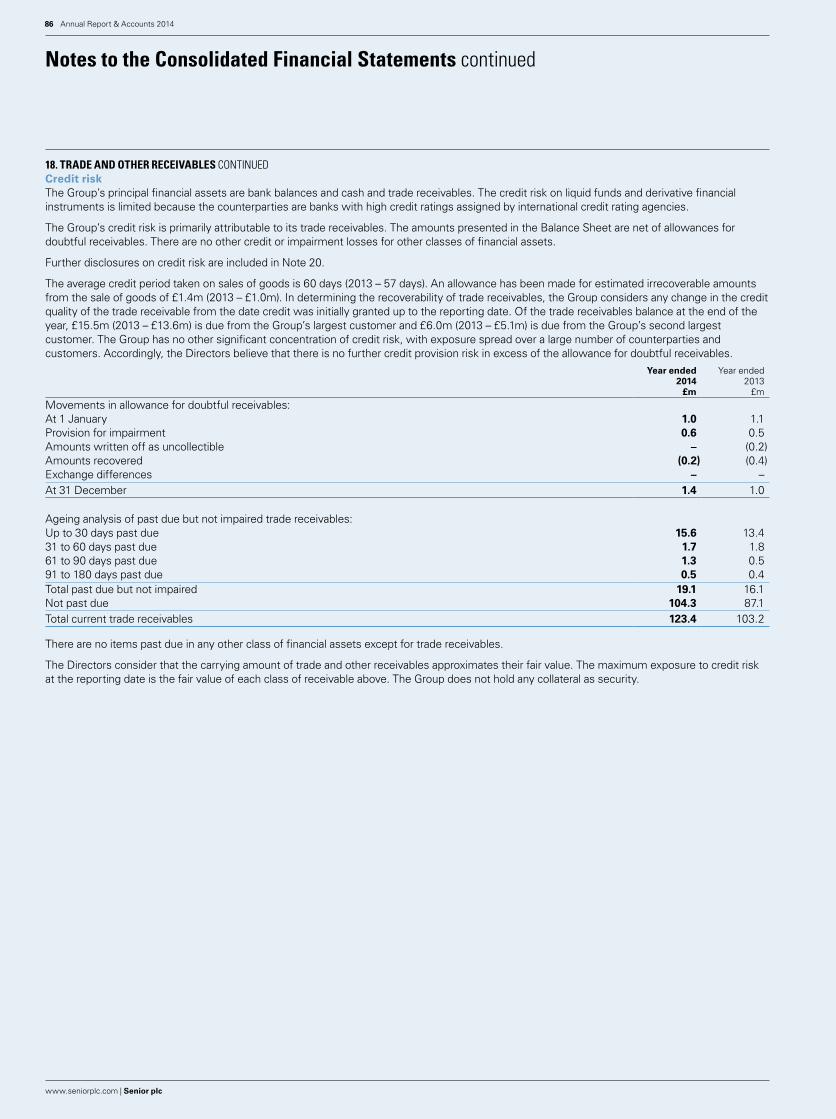
18. tRaDe anD otHeR Receivables continuedCredit riskThe Group’s principal financial assets are bank balances and cash and trade receivables. The credit risk on liquid funds and derivative financial instruments is limited because the counterparties are banks with high credit ratings assigned by international credit rating agencies.
The Group’s credit risk is primarily attributable to its trade receivables. The amounts presented in the Balance Sheet are net of allowances for doubtful receivables. There are no other credit or impairment losses for other classes of financial assets.
Further disclosures on credit risk are included in Note 20.
The average credit period taken on sales of goods is 60 days (2013 – 57 days). An allowance has been made for estimated irrecoverable amounts from the sale of goods of £1.4m (2013 – £1.0m). In determining the recoverability of trade receivables, the Group considers any change in the credit quality of the trade receivable from the date credit was initially granted up to the reporting date. Of the trade receivables balance at the end of the year, £15.5m (2013 – £13.6m) is due from the Group’s largest customer and £6.0m (2013 – £5.1m) is due from the Group’s second largest customer. The Group has no other significant concentration of credit risk, with exposure spread over a large number of counterparties and customers. Accordingly, the Directors believe that there is no further credit provision risk in excess of the allowance for doubtful receivables.
Year ended2014
£m
Year ended2013
£mMovements in allowance for doubtful receivables:At 1 January 1.0 1.1 Provision for impairment 0.6 0.5 Amounts written off as uncollectible – (0.2)Amounts recovered (0.2) (0.4)Exchange differences – –At 31 December 1.4 1.0
Ageing analysis of past due but not impaired trade receivables:Up to 30 days past due 15.6 13.4 31 to 60 days past due 1.7 1.8 61 to 90 days past due 1.3 0.5 91 to 180 days past due 0.5 0.4 Total past due but not impaired 19.1 16.1 Not past due 104.3 87.1 Total current trade receivables 123.4 103.2
There are no items past due in any other class of financial assets except for trade receivables.
The Directors consider that the carrying amount of trade and other receivables approximates their fair value. The maximum exposure to credit risk at the reporting date is the fair value of each class of receivable above. The Group does not hold any collateral as security.
Notes to the Consolidated Financial Statements continued
Annual Report & Accounts 201486
www.seniorplc.com | Senior plc

STRATEGIC REPORT
GO
VERNA
NCE
FINA
NCIA
L STATEMEN
TSA
DDITIO
NA
L INFO
RMATIO
N
19. bank oveRDRafts anD loansYear ended
2014£m
Year ended2013
£mBank overdrafts 4.7 –Bank loans 16.7 –Other loans 96.1 111.6
117.5 111.6
The borrowings are repayable as follows:On demand or within one year 24.1 21.2 In the second year – 15.1 In the third to fifth years inclusive 80.6 63.3 After five years 12.8 12.0
117.5 111.6
Less: amount due for settlement within 12 months(shown under current liabilities) (24.1) (21.2)Amount due for settlement after 12 months 93.4 90.4
Analysis of borrowings by currency31 December 2014
Total£m
PoundSterling
£mEuros
£m
USdollars
£mOthers
£m
Bank overdrafts 4.7 6.1 – (1.9) 0.5 Bank loans 16.7 8.0 – 8.5 0.2 Other loans 96.1 – – 96.1 –
117.5 14.1 – 102.7 0.7
31 December 2013
Total£m
PoundSterling
£mEuros
£m
USdollars
£mOthers
£mOther loans 111.6 – 0.2 111.4 –
111.6 – 0.2 111.4 –
The weighted average interest rates paid were as follows:Year ended
2014%
Year ended2013
%Bank loans and overdrafts 1.60 1.50 Other loans 6.58 6.46
87Annual Report & Accounts 2014
www.seniorplc.com | Senior plc

19. bank oveRDRafts anD loans continuedBank loans and overdrafts of £21.4m (2013 – £nil) are arranged at floating rates, thus exposing the Group to cash flow interest rate risk. Other borrowings are mainly arranged at fixed interest rates and expose the Group to fair value interest rate risk. No interest rate swaps were taken out in 2013 or 2014.
The Directors estimate the fair value of the Group’s borrowings to be as follows:Year ended
2014£m
Year ended2013
£mBank loans and overdrafts 21.4 –Other loans 106.3 124.9
127.7 124.9
The fair value of Other loans has been determined by applying a make-whole calculation using the prevailing treasury bill yields plus the applicable credit spread for the Group.
The other principal features of the Group’s borrowings are as follows:
Bank overdrafts are repayable on demand. The effective interest rates on bank overdrafts are determined based on appropriate LIBOR rates plus applicable margin.
The Group’s main loans are unsecured guaranteed loan notes in the US private placement market and revolving credit facilities.
a) Loan notes of $120m, 2014 £76.9m (2013 – £72.3m) were taken out in October 2008. Notes of $25m carry interest at a rate of 6.42% and are due for repayment in October 2015. Notes of $75m carry interest at the rate of 6.84% and are due for repayment in October 2018. Notes of $20m carry interest at the rate of 6.94% and are due for repayment in October 2020.
b) Loan notes of $30m, 2014 £19.2m (2013 – £18.1m) were taken out in January 2007 and are due for repayment in January 2017. The loan notes carry interest at the rate of 5.85% per annum.
c) Loan notes of $35m, 2014 £nil (2013 – £21.0m) were taken out in October 2007. These were repaid in October 2014. The loan notes carried interest at the rate of 5.93% per annum.
The Group also has two revolving credit facilities.
A committed £60m five-year syndicated multi-currency facility was entered into in November 2014, which amended and restated a facility of the same amount which was entered into during 2011. As at 31 December 2014, £8m was drawn under the facility. There were no amounts drawn under the old facility as at 31 December 2013.
A committed $25m single bank (£16.1m) loans and letter of credit facility was amended in October 2014 and now matures in June 2017. This facility was reduced from $50m to $25m in October 2013. There were $8.2m (£5.3m) loans drawn under the facility on 31 December 2014 and no loans drawn on 31 December 2013 and there were letters of outstanding credit of $10.3m (£6.6m) (2013 – £2.9m).
As at 31 December 2014, the Group had available £56.2m (2013 – £72.2m) of undrawn committed borrowing facilities in respect of which all conditions precedent had been met.
Notes to the Consolidated Financial Statements continued
Annual Report & Accounts 201488
www.seniorplc.com | Senior plc

STRATEGIC REPORT
GO
VERNA
NCE
FINA
NCIA
L STATEMEN
TSA
DDITIO
NA
L INFO
RMATIO
N
20. financial instRumentsCapital risk managementThe Group manages its capital structure to safeguard its ability to continue as a going concern whilst maximising the return to stakeholders through the optimisation of the balance between debt and equity. In considering the appropriate level of net debt the Group pays close attention to its level as compared to the cash generation potential of the Group, measured by adjusted profit before interest, tax, depreciation and amortisation (“EBITDA”). The Group also monitors capital on the basis of a gearing ratio. This ratio is calculated as net debt divided by total capital. Net debt is calculated as the total of bank and other loans, obligations under finance leases, forward exchange contract losses less cash and cash equivalents and forward exchange contract gains. Total capital is the equity shown in the Consolidated Balance Sheet.
All of the Group’s external borrowing facilities have a requirement for the ratio of net debt to EBITDA to be less than 3.0x. Internally the Group aims for this ratio to be between 0.5x and 1.5x. At 31 December 2014 net debt was 0.8x the Group’s level of EBITDA (31 December 2013 – 0.5x). In addition, all borrowing facilities contain the requirement for EBITDA interest cover (the number of times net interest is covered by the Group’s EBITDA) to be in excess of 3.5x. At 31 December 2014 EBITDA was 16.2x the level of net interest (31 December 2013 – 15.4x). Therefore, the Group currently has considerable funding headroom.
The Group’s strategy in respect of gearing is to target a long-term gearing ratio within the range of 50% to 70%. Ratios outside this range may still be considered to be acceptable, in certain circumstances. The gearing ratio for the Group at the end of 2014 was 26% (2013 – 16%). The increase in 2014 is attributable mainly to the acquisition in the period. The cash generated by the Group in recent years has led to the gearing ratio being lower than the targeted range.
Financial risk managementThe Group’s activities expose it to a variety of financial risks including foreign exchange risk, interest rate risk, credit risk and liquidity risk. The Group’s overall treasury risk management programme focuses on the unpredictability of financial markets, and seeks to minimise potential adverse effects on the Group’s financial performance.
The Group uses derivative financial instruments to hedge certain risk exposures. The use of financial derivatives is governed by the Group’s policies approved by the Board, which provide written principles on foreign exchange risk, interest rate risk, credit risk, the use of financial derivatives and non-derivative financial instruments, and the investment of excess liquidity. Compliance with policies and exposures limits is reviewed by the Group’s Treasury Committee on a regular basis. The Group does not enter into or trade financial instruments, including derivative financial instruments, for speculative purposes.
Foreign exchange risk managementThe Group enters into forward foreign exchange contracts to hedge the exchange risk arising on the operations’ trading activities in foreign currencies. Where commented on below, the sensitivity analysis of the Group’s exposure to foreign currency risk at the reporting date has been determined based on the change taking place at the beginning of the financial year and left unchanged throughout the reporting period, with all other variables held constant (such as interest rates). The sensitivity assumptions are based on analysis reviewed by the Group’s Treasury Committee.
Translation riskThe Group derived 84% of its revenue from businesses outside the United Kingdom, with 62% relating to operations in North America. Fluctuations in the value of the US dollar and other currencies in relation to Pound Sterling have had, and may continue to have, a significant impact on the results of the Group’s operations when reported in Pound Sterling. The Group decided not to hedge this translation risk. In addition, the majority of assets are denominated in foreign currency, particularly in US dollars. In order to provide a hedge against volatility in the value of these assets compared to the Group’s earnings, and hence provide a natural hedge against the Group’s principal lending covenant (the ratio of net debt to EBITDA), the Group aims to borrow in foreign currencies in similar proportions to its generation of foreign currency EBITDA, where practical and economic. A 10% appreciation (or depreciation) of all other currencies against Pound Sterling would have increased (or decreased) 2014 Group operating profit by £9.6m (£7.2m of which would have been due to the US dollar movement) and would have increased (or decreased) net equity by £31.5m (£17.4m of which would have been due to the US dollar movement).
Transaction riskThe Group has a number of transaction-related foreign currency exposures, particularly between the Euro and the South African Rand, and between the US dollar and the Pound Sterling. The Group seeks to hedge transaction-related exposures on a rolling 15- to 18-month forward basis and applies hedge accounting where the forwards can be designated in a qualifying cash flow hedge relationship. Based on the net of the annual sales and purchase-related exposures, all transaction-related foreign currency exposures to Group profit after hedging in existence at 31 December 2014 are immaterial. The impact on net equity is determined by the unrecognised portion of open forward contracts at the year-end. A 10% appreciation (or depreciation) of the Euro against the Rand and of the US dollar against Pound Sterling would have decreased (or increased) net equity by £0.4m and £2.1m, respectively.
89Annual Report & Accounts 2014
www.seniorplc.com | Senior plc

20. financial instRuments continuedInterest rate risk managementThe Group has a policy of maintaining approximately 60% of its borrowing costs at fixed interest rates. The Group generally borrows long term in fixed rates but at times may borrow at floating rates and swap into fixed depending on credit market conditions. Occasionally a portion of fixed debt interest is swapped into floating rates. The combination of maintaining an acceptable balance of fixed and floating rate debt, and the Group’s policy of borrowing in foreign currency in proportion to its generation of foreign currency earnings, provides an effective hedge against the impact of interest rate and foreign currency volatility on total interest costs. In 2014 the Group increased its share of debt at variable interest rates by refinancing (at their stated maturity) long-term debt with funds borrowed under its revolving credit facility. As at year end 2014 the percentage of debt at fixed interest was 75% (2013 – 100%).
The following sensitivity analysis of the Group’s exposure to interest rate risk at the reporting date has been determined based on the exposure to interest rates at the beginning of the financial year, and held constant throughout the reporting period with all other variables held constant (such as foreign exchange rates). The sensitivity assumptions are based on analysis reviewed by the Group’s Treasury Committee. If variable interest rates had been 0.5% lower (or higher), the Group’s net profit would have increased (or decreased) by £nil. Any fixed interest debt is held to maturity and not fair value adjusted through the profit and loss. An increase (or decrease) of 0.5% in the US dollar market interest rate for the fixed rate debt held up to maturity would have decreased (or increased) the fair value of the Group’s borrowings by £1.5m. The Group’s sensitivity to interest rates has remained broadly consistent with the prior period due to the high proportion of fixed debt.
Credit risk managementThe Group’s credit risk is primarily attributable to its trade receivables. The credit quality of customers is assessed taking into account their financial position, past experience and other factors. Further details on determining the recoverability of trade receivables is provided in Note 18. The Group is guarantor under the lease of one building in the UK, which arose on the disposal of a former Group-owned subsidiary in 2001.
Credit risk on liquid funds and derivative financial instruments is limited because the counterparties are financial institutions with high credit ratings assigned by international credit rating agencies. The carrying amount of financial assets recorded in the Financial Statements, which is net of impairment losses, represents the Group’s maximum exposure to credit risk.
Liquidity risk managementLiquidity risk reflects the risk that the Group will have insufficient resources to meet its financial liabilities as they fall due. The Group manages liquidity risk by maintaining adequate reserves, banking facilities and reserve borrowing facilities, by continuously monitoring forecast and actual cash flows and matching the maturity profiles of financial assets and liabilities. Cash flow forecasts are produced monthly, together with appropriate capacity planning and scenario analysis, to ensure that bank covenant and liquidity targets will be met. The Directors also regularly assess the balance of capital and debt funding of the Group, as part of a process to satisfy the Group’s long-term strategic funding requirements.
As noted in the Financial Review on pages 28 to 30, the Group is currently in a well-funded position, with significant headroom under its committed borrowing facilities. It is considered unlikely that the Group will face any significant funding issues in the foreseeable future.
Notes to the Consolidated Financial Statements continued
Annual Report & Accounts 201490
www.seniorplc.com | Senior plc

STRATEGIC REPORT
GO
VERNA
NCE
FINA
NCIA
L STATEMEN
TSA
DDITIO
NA
L INFO
RMATIO
N
20. financial instRuments continuedCategories of financial instruments
Year ended2014
£m
Year ended2013
£mCarrying value of financial assets:Cash and cash equivalents 13.2 53.1 Trade receivables 123.4 103.2 Other receivables 2.9 2.4 Loans and receivables at amortised cost 139.5 158.7 Currency derivatives used for hedging 0.8 1.9 Total financial assets 140.3 160.6
Carrying value of financial liabilities:Bank overdrafts and loans 117.5 111.6 Obligations under finance leases 0.7 0.7 Trade payables 82.4 64.5 Other payables 53.2 52.2 Other financial liabilities at amortised cost 253.8 229.0 Currency derivatives used for hedging 3.0 2.3 Total financial liabilities 256.8 231.3
Undiscounted contractual maturity of other financial liabilities:Amounts payable:On demand or within one year 166.4 145.6 In the second to fifth years inclusive 96.1 97.9 After five years 13.7 13.7
276.2 257.2 Less: future finance charges (22.4) (28.2)Other financial liabilities at amortised cost 253.8 229.0
The carrying amount is a reasonable approximation of fair value for the financial assets and liabilities noted above except for bank overdrafts and loans, disclosure of which are included within Note 19.
An ageing analysis of trade, deferred consideration and other receivables is as disclosed within Note 18.
91Annual Report & Accounts 2014
www.seniorplc.com | Senior plc

20. financial instRuments continuedForward foreign exchange contractsThe Group enters into forward foreign exchange contracts to hedge the exchange risk arising on the operation’s trading activities in foreign currencies. At the balance sheet date, total notional amounts and fair values of outstanding forward foreign exchange contracts that the Group has committed are given below:
Year ended2014
£m
Year ended2013
£mNotional amounts:Foreign exchange contracts – cash flow hedges 67.4 55.2 Total 67.4 55.2 Less: amounts maturing within 12 months (55.4) (44.0)Amounts maturing after 12 months 12.0 11.2
Contractual maturity:Cash flow hedges balances due within one year:Outflow 68.7 45.3 Inflow 67.1 53.5
Cash flow hedges balances due between one and two years:Outflow 12.0 9.9 Inflow 11.9 6.6
Cash flow hedges balances due between two and three years:Outflow – –Inflow – –
Held for trading balances due within one year:Outflow – –Inflow – –
Fair values:Foreign exchange contracts – cash flow hedges (2.2) (0.4)Total liability (2.2) (0.4)
These fair values are based on market values of equivalent instruments at the balance sheet date, comprising £0.8m (2013 – £1.9m) assets included in trade and other receivables and £3.0m (2013 – £2.3m) included in trade and other payables. The fair value of currency derivatives that are designated and effective as cash flow hedges amounting to £1.9m loss (2013 – £0.3m loss) has been deferred in equity.
Notes to the Consolidated Financial Statements continued
Annual Report & Accounts 201492
www.seniorplc.com | Senior plc
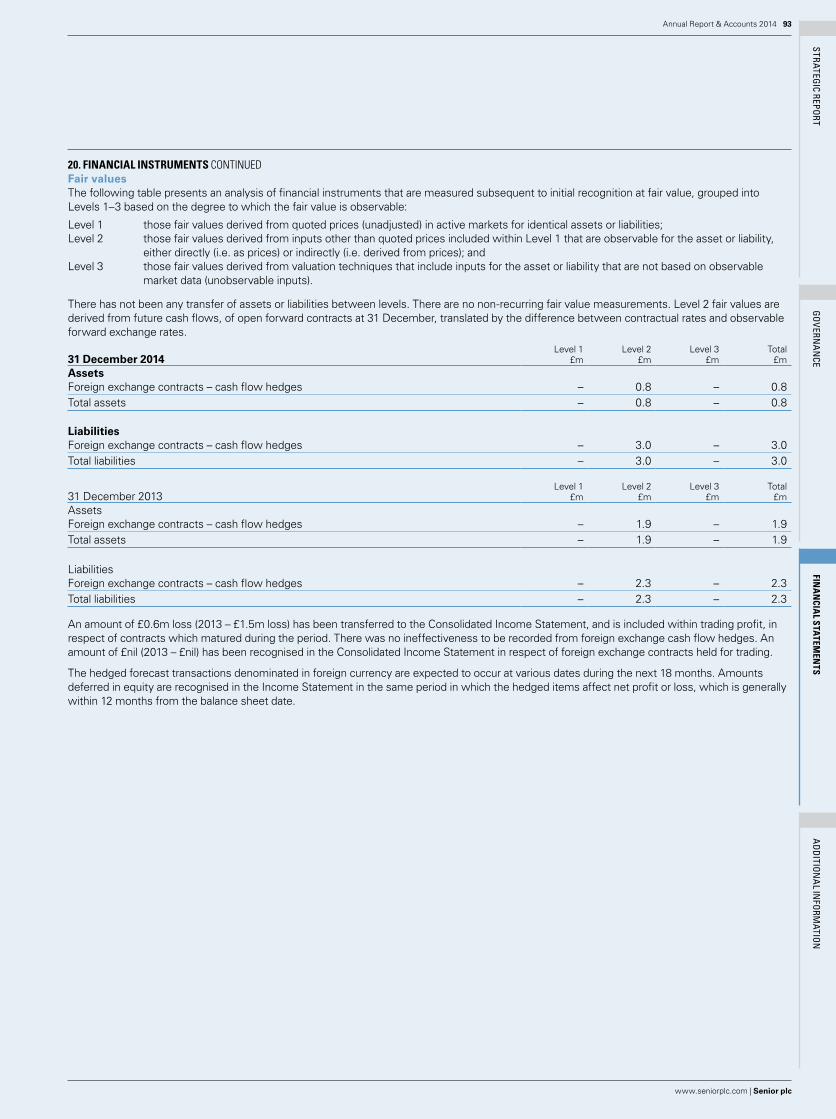
STRATEGIC REPORT
GO
VERNA
NCE
FINA
NCIA
L STATEMEN
TSA
DDITIO
NA
L INFO
RMATIO
N
20. financial instRuments continuedFair valuesThe following table presents an analysis of financial instruments that are measured subsequent to initial recognition at fair value, grouped into Levels 1–3 based on the degree to which the fair value is observable:
Level 1 those fair values derived from quoted prices (unadjusted) in active markets for identical assets or liabilities;Level 2
those fair values derived from inputs other than quoted prices included within Level 1 that are observable for the asset or liability, either directly (i.e. as prices) or indirectly (i.e. derived from prices); and
Level 3
those fair values derived from valuation techniques that include inputs for the asset or liability that are not based on observable market data (unobservable inputs).
There has not been any transfer of assets or liabilities between levels. There are no non-recurring fair value measurements. Level 2 fair values are derived from future cash flows, of open forward contracts at 31 December, translated by the difference between contractual rates and observable forward exchange rates.
31 December 2014Level 1
£mLevel 2
£mLevel 3
£mTotal
£mAssets Foreign exchange contracts – cash flow hedges – 0.8 – 0.8 Total assets – 0.8 – 0.8
Liabilities Foreign exchange contracts – cash flow hedges – 3.0 – 3.0 Total liabilities – 3.0 – 3.0
31 December 2013
Level 1£m
Level 2£m
Level 3£m
Total£m
AssetsForeign exchange contracts – cash flow hedges – 1.9 – 1.9 Total assets – 1.9 – 1.9
LiabilitiesForeign exchange contracts – cash flow hedges – 2.3 – 2.3 Total liabilities – 2.3 – 2.3
An amount of £0.6m loss (2013 – £1.5m loss) has been transferred to the Consolidated Income Statement, and is included within trading profit, in respect of contracts which matured during the period. There was no ineffectiveness to be recorded from foreign exchange cash flow hedges. An amount of £nil (2013 – £nil) has been recognised in the Consolidated Income Statement in respect of foreign exchange contracts held for trading.
The hedged forecast transactions denominated in foreign currency are expected to occur at various dates during the next 18 months. Amounts deferred in equity are recognised in the Income Statement in the same period in which the hedged items affect net profit or loss, which is generally within 12 months from the balance sheet date.
93Annual Report & Accounts 2014
www.seniorplc.com | Senior plc
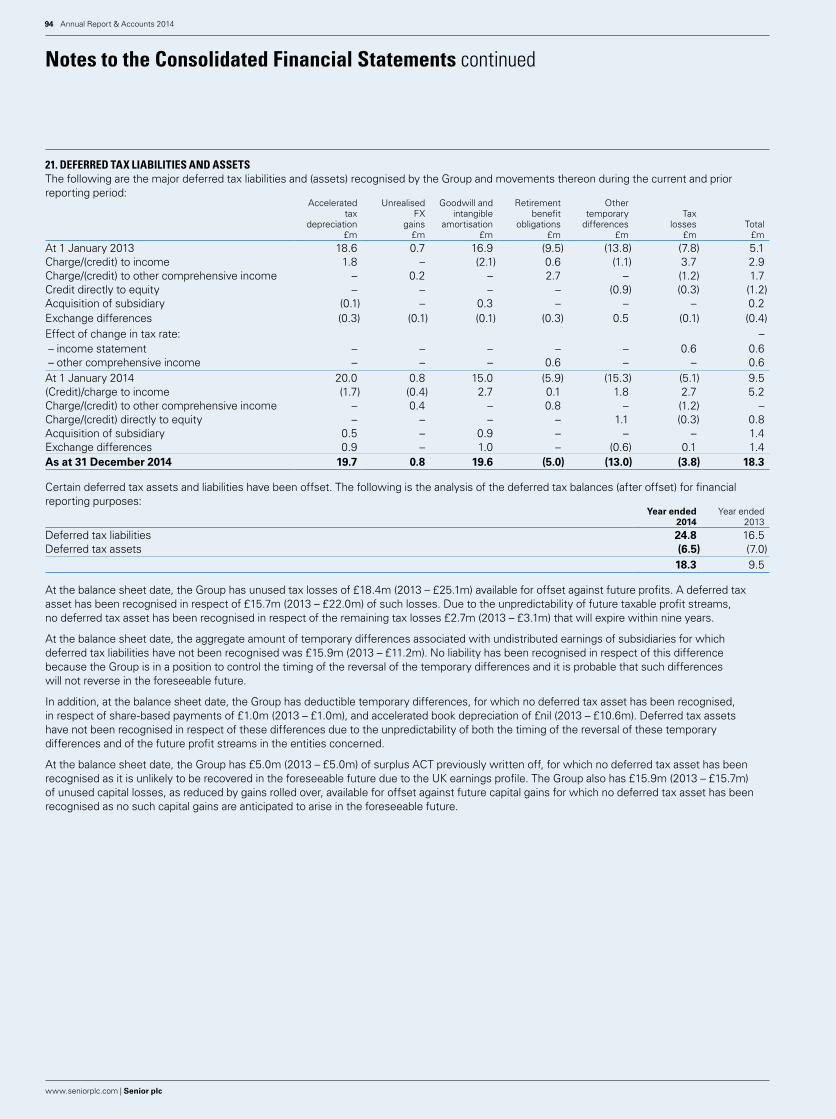
21. DefeRReD tax liabilities anD assetsThe following are the major deferred tax liabilities and (assets) recognised by the Group and movements thereon during the current and prior reporting period:
Acceleratedtax
depreciation£m
Unrealised FX
gains£m
Goodwill and intangible
amortisation£m
Retirementbenefit
obligations£m
Other temporary
differences£m
Tax losses
£mTotal
£mAt 1 January 2013 18.6 0.7 16.9 (9.5) (13.8) (7.8) 5.1 Charge/(credit) to income 1.8 – (2.1) 0.6 (1.1) 3.7 2.9 Charge/(credit) to other comprehensive income – 0.2 – 2.7 – (1.2) 1.7 Credit directly to equity – – – – (0.9) (0.3) (1.2)Acquisition of subsidiary (0.1) – 0.3 – – – 0.2 Exchange differences (0.3) (0.1) (0.1) (0.3) 0.5 (0.1) (0.4)Effect of change in tax rate: – – income statement – – – – – 0.6 0.6 – other comprehensive income – – – 0.6 – – 0.6 At 1 January 2014 20.0 0.8 15.0 (5.9) (15.3) (5.1) 9.5 (Credit)/charge to income (1.7) (0.4) 2.7 0.1 1.8 2.7 5.2Charge/(credit) to other comprehensive income – 0.4 – 0.8 – (1.2) –Charge/(credit) directly to equity – – – – 1.1 (0.3) 0.8Acquisition of subsidiary 0.5 – 0.9 – – – 1.4Exchange differences 0.9 – 1.0 – (0.6) 0.1 1.4As at 31 December 2014 19.7 0.8 19.6 (5.0) (13.0) (3.8) 18.3
Certain deferred tax assets and liabilities have been offset. The following is the analysis of the deferred tax balances (after offset) for financial reporting purposes:
Year ended2014
Year ended2013
Deferred tax liabilities 24.8 16.5 Deferred tax assets (6.5) (7.0)
18.3 9.5
At the balance sheet date, the Group has unused tax losses of £18.4m (2013 – £25.1m) available for offset against future profits. A deferred tax asset has been recognised in respect of £15.7m (2013 – £22.0m) of such losses. Due to the unpredictability of future taxable profit streams, no deferred tax asset has been recognised in respect of the remaining tax losses £2.7m (2013 – £3.1m) that will expire within nine years.
At the balance sheet date, the aggregate amount of temporary differences associated with undistributed earnings of subsidiaries for which deferred tax liabilities have not been recognised was £15.9m (2013 – £11.2m). No liability has been recognised in respect of this difference because the Group is in a position to control the timing of the reversal of the temporary differences and it is probable that such differences will not reverse in the foreseeable future.
In addition, at the balance sheet date, the Group has deductible temporary differences, for which no deferred tax asset has been recognised, in respect of share-based payments of £1.0m (2013 – £1.0m), and accelerated book depreciation of £nil (2013 – £10.6m). Deferred tax assets have not been recognised in respect of these differences due to the unpredictability of both the timing of the reversal of these temporary differences and of the future profit streams in the entities concerned.
At the balance sheet date, the Group has £5.0m (2013 – £5.0m) of surplus ACT previously written off, for which no deferred tax asset has been recognised as it is unlikely to be recovered in the foreseeable future due to the UK earnings profile. The Group also has £15.9m (2013 – £15.7m) of unused capital losses, as reduced by gains rolled over, available for offset against future capital gains for which no deferred tax asset has been recognised as no such capital gains are anticipated to arise in the foreseeable future.
Notes to the Consolidated Financial Statements continued
Annual Report & Accounts 201494
www.seniorplc.com | Senior plc
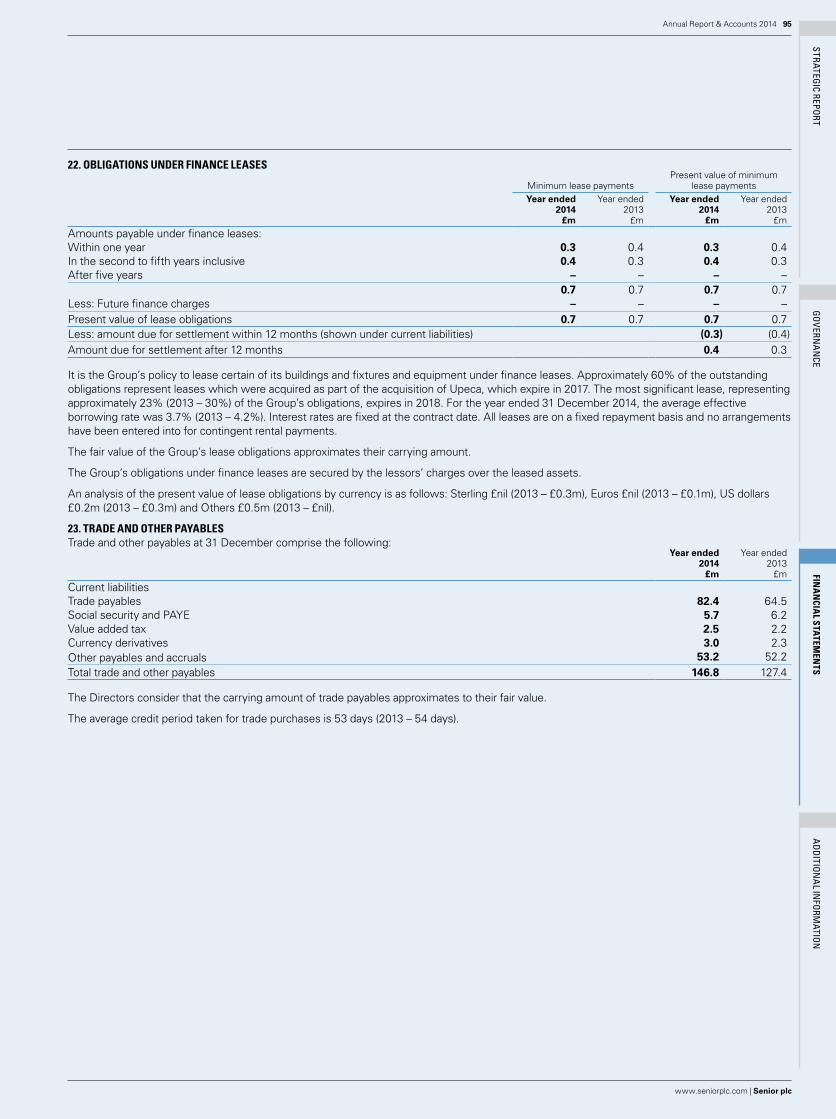
STRATEGIC REPORT
GO
VERNA
NCE
FINA
NCIA
L STATEMEN
TSA
DDITIO
NA
L INFO
RMATIO
N
22. obliGations unDeR finance leases
Minimum lease paymentsPresent value of minimum
lease paymentsYear ended
2014£m
Year ended2013
£m
Year ended2014
£m
Year ended2013
£mAmounts payable under finance leases:Within one year 0.3 0.4 0.3 0.4 In the second to fifth years inclusive 0.4 0.3 0.4 0.3 After five years – – – –
0.7 0.7 0.7 0.7 Less: Future finance charges – – – –Present value of lease obligations 0.7 0.7 0.7 0.7 Less: amount due for settlement within 12 months (shown under current liabilities) (0.3) (0.4)Amount due for settlement after 12 months 0.4 0.3
It is the Group’s policy to lease certain of its buildings and fixtures and equipment under finance leases. Approximately 60% of the outstanding obligations represent leases which were acquired as part of the acquisition of Upeca, which expire in 2017. The most significant lease, representing approximately 23% (2013 – 30%) of the Group’s obligations, expires in 2018. For the year ended 31 December 2014, the average effective borrowing rate was 3.7% (2013 – 4.2%). Interest rates are fixed at the contract date. All leases are on a fixed repayment basis and no arrangements have been entered into for contingent rental payments.
The fair value of the Group’s lease obligations approximates their carrying amount.
The Group’s obligations under finance leases are secured by the lessors’ charges over the leased assets.
An analysis of the present value of lease obligations by currency is as follows: Sterling £nil (2013 – £0.3m), Euros £nil (2013 – £0.1m), US dollars £0.2m (2013 – £0.3m) and Others £0.5m (2013 – £nil).
23. tRaDe anD otHeR payablesTrade and other payables at 31 December comprise the following:
Year ended2014
£m
Year ended2013
£mCurrent liabilitiesTrade payables 82.4 64.5 Social security and PAYE 5.7 6.2 Value added tax 2.5 2.2 Currency derivatives 3.0 2.3 Other payables and accruals 53.2 52.2 Total trade and other payables 146.8 127.4
The Directors consider that the carrying amount of trade payables approximates to their fair value.
The average credit period taken for trade purchases is 53 days (2013 – 54 days).
95Annual Report & Accounts 2014
www.seniorplc.com | Senior plc

24. pRovisionsWarranties
£mOther
£mTotal
£m
At 1 January 2013 5.8 0.3 6.1 Additional provision in the year 0.6 – 0.6 Utilisation of provision (1.2) – (1.2)Release of unused amounts (4.1) – (4.1)Unwinding of discount – – –Exchange difference 0.2 – 0.2 At 1 January 2014 1.3 0.3 1.6 Additional provision in the year 1.7 – 1.7 Utilisation of provision (1.0) – (1.0)Release of unused amounts (0.3) – (0.3)Unwinding of discount – – –Exchange difference – – –At 31 December 2014 1.7 0.3 2.0 Included in current liabilities 1.7 0.3 2.0
Provisions for warranty costs are based on an assessment of future claims with reference to past experience.
25. sHaRe capitalYear ended
2014£m
Year ended2013
£mAuthorised:750 million ordinary shares of 10p each 75.0 75.0 Issued and fully paid:418.1 million ordinary shares of 10p each 41.8 41.6
At 31 December 2013, the issued and fully paid up share capital was 415.9 million ordinary shares of 10p each.
786,950 shares were issued during 2014 at an average price of 146.8p per share under share option plans raising £1.1m. 1,358,809 shares were issued during 2014 under the 2005 Long-Term Incentive Plan.
The Company has one class of ordinary shares which carry no right to fixed income.
26. sHaRe pRemium accountYear ended
2014£m
Year ended2013
£mBalance at 1 January 13.8 13.7 Movement in year 1.0 0.1 Balance at 31 December 14.8 13.8
27. equity ReseRveYear ended
2014£m
Year ended2013
£mBalance at 1 January 5.2 3.8 Transfer to retained earnings reserve (1.7) (1.4)Movement in year 2.2 2.8 Balance at 31 December 5.7 5.2
The transfer to retained earnings reserve is in respect of equity-settled share-based payments that vested during the year.
The movement in the year includes £2.3m (2013 – £3.0m) in respect of the share-based payment charge for the year, and £0.1m (2013 – £0.2m) release in respect of the shares issued in the year under the 2005 Long-Term Incentive Plan.
Notes to the Consolidated Financial Statements continued
Annual Report & Accounts 201496
www.seniorplc.com | Senior plc

STRATEGIC REPORT
GO
VERNA
NCE
FINA
NCIA
L STATEMEN
TSA
DDITIO
NA
L INFO
RMATIO
N
28. HeDGinG anD tRanslation ReseRvesHedgingreserve
Year ended2014
£m
Translationreserve
Year ended2014
£m
TotalYear ended
2014£m
Hedgingreserve
Year ended2013
£m
Translationreserve
Year ended2013
£m
TotalYear ended
2013£m
Balance at 1 January (37.9) 24.3 (13.6) (37.0) 32.4 (4.6)Exchange differences on translation of overseas operations – 7.9 7.9 – (7.8) (7.8)Change in fair value of hedging derivatives (1.7) – (1.7) (0.9) – (0.9)Tax on items taken directly to equity – 0.2 0.2 – (0.3) (0.3)Balance at 31 December (39.6) 32.4 (7.2) (37.9) 24.3 (13.6)
29. RetaineD eaRninGsYear ended
2014£m
Year ended2013
£mBalance at 1 January 316.4 259.6 Dividends paid (21.9) (19.9)Net profit for the year 63.5 71.4 Pension actuarial (loss)/gain (0.9) 4.3 Transfer from equity reserve 1.7 1.4 Transfer from own shares reserve (0.1) –Tax on deductible temporary differences 0.3 (0.4)Balance at 31 December 359.0 316.4
30. own sHaResYear ended
2014£m
Year ended2013
£mBalance at 1 January (1.9) (1.0)Transfer to retained earnings reserve 0.1 – Purchase of new shares (0.7) (0.9)Balance at 31 December (2.5) (1.9)
The own shares reserve represents the cost of shares purchased in the market and held by the Senior plc Employee Benefit Trust to satisfy options under the Group’s share option schemes (see Note 34).
31. acquisitionsThermal Engineering LimitedAs noted in the Annual Report & Accounts 2013, on 29 November 2013 the Group acquired 100% of the issued share capital of Thermal Engineering Ltd and its parent company Thermal Engineering Holding Ltd (collectively ”Thermal“). On reviewing the financial exposures during 2014, the fair value of financial liabilities increased by £1.3m resulting in a corresponding increase in goodwill of £1.3m.
UPECA Technologies Sdn. Bhd.On 8 April 2014, the Group acquired 100% of the issued share capital of UPECA Technologies Sdn. Bhd., and its 100%-owned subsidiaries UPECA Flowtech Sdn. Bhd., UPECA Engineering (Tianjin) Co. Ltd, UPECA Valve Automation Sdn. Bhd. and UPECA Engineering Sdn. Bhd., together with its 75%-owned subsidiary UPECA Aerotech Sdn. Bhd. (collectively “Upeca”). The Group also subsequently acquired the remaining 25% minority interest in UPECA Aerotech Sdn. Bhd. Upeca is located in Selangor, Malaysia and Tianjin, China and manufactures high-precision engineered components serving the aerospace and energy sectors. Upeca’s capabilities are highly complementary to Senior’s existing portfolio, strengthening the Group’s aerospace and energy market presence in the increasingly important South East Asian region. The consideration was £59.1m plus the assumption of £15.3m of net debt and the acquisition was funded by the Group’s existing debt facilities.
97Annual Report & Accounts 2014
www.seniorplc.com | Senior plc

31. acquisitions continuedSet out below is a provisional summary of the net assets acquired:
Recognised amounts of identifiable assets acquired and liabilities assumed: £m
Identifiable intangible assets 17.8 Property, plant and equipment and computer software 15.1 Inventories 4.7 Financial assets, excluding cash and cash equivalents 7.5 Cash and cash equivalents 4.9 Financial liabilities excluding bank overdraft and other borrowings (5.8)Bank overdraft and other borrowings (20.2)Deferred tax liability (1.4)Net assets acquired 22.6 Goodwill 36.5 Total consideration 59.1 Consideration satisfied by:Cash paid 59.1 Net cash outflow arising on acquisition:Cash consideration 59.1 Add: overdraft net of cash and cash equivalents acquired 1.0 Net cash outflow arising on acquisition 60.1
The goodwill of £36.5m represents the premium paid in anticipation of future profitability from assets that are not capable of being separately identified and separately recognised such as the assembled workforce as well as the expectation that the Group will be able to leverage its wider market access and strong financial position to generate sustainable financial growth beyond what Upeca would have potentially achieved as a stand-alone company. None of the goodwill is expected to be deductible for tax purposes.
The intangible assets acquired as part of the acquisition relate mainly to customer contracts and relationships, the fair value of which is dependent on estimates of attributable future revenues, profitability and cash flows, and are being amortised over five years.
The financial assets acquired include trade receivables with a provisional fair value of £6.8m and a gross contractual value of £6.8m, all of which is currently expected to be collectible.
Acquisition-related costs of £0.6m are included in administrative expenses within trading profit in the Group’s Consolidated Income Statement for the year ended 31 December 2014.
The fair value of the acquired identifiable assets and liabilities is provisional pending finalisation of the fair value exercise.
Upeca contributed £26.8m of external revenue and £4.1m to the Group’s operating profit from the date of acquisition to 31 December 2014. If the acquisition had been completed on 1 January 2014, continuing Group revenue for the 12 months ended 31 December 2014 would have been £828.8m and continuing Group operating profit would have been £90.9m.
Notes to the Consolidated Financial Statements continued
Annual Report & Accounts 201498
www.seniorplc.com | Senior plc
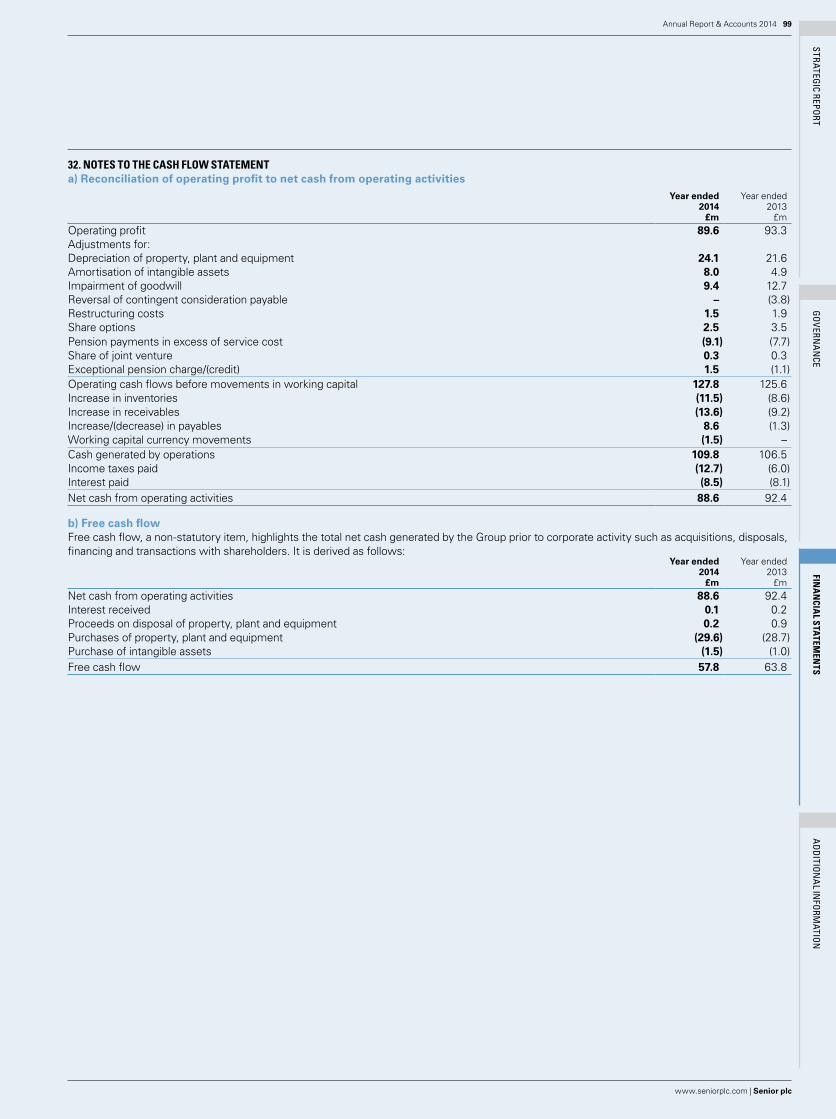
STRATEGIC REPORT
GO
VERNA
NCE
FINA
NCIA
L STATEMEN
TSA
DDITIO
NA
L INFO
RMATIO
N
32. notes to tHe casH flow statementa) Reconciliation of operating profit to net cash from operating activities
Year ended2014
£m
Year ended2013
£mOperating profit 89.6 93.3 Adjustments for:Depreciation of property, plant and equipment 24.1 21.6 Amortisation of intangible assets 8.0 4.9 Impairment of goodwill 9.4 12.7 Reversal of contingent consideration payable – (3.8)Restructuring costs 1.5 1.9 Share options 2.5 3.5 Pension payments in excess of service cost (9.1) (7.7)Share of joint venture 0.3 0.3 Exceptional pension charge/(credit) 1.5 (1.1)Operating cash flows before movements in working capital 127.8 125.6 Increase in inventories (11.5) (8.6)Increase in receivables (13.6) (9.2)Increase/(decrease) in payables 8.6 (1.3)Working capital currency movements (1.5) –Cash generated by operations 109.8 106.5 Income taxes paid (12.7) (6.0)Interest paid (8.5) (8.1)Net cash from operating activities 88.6 92.4
b) Free cash flowFree cash flow, a non-statutory item, highlights the total net cash generated by the Group prior to corporate activity such as acquisitions, disposals, financing and transactions with shareholders. It is derived as follows:
Year ended2014
£m
Year ended2013
£mNet cash from operating activities 88.6 92.4 Interest received 0.1 0.2 Proceeds on disposal of property, plant and equipment 0.2 0.9 Purchases of property, plant and equipment (29.6) (28.7)Purchase of intangible assets (1.5) (1.0)Free cash flow 57.8 63.8
99Annual Report & Accounts 2014
www.seniorplc.com | Senior plc

32. notes to tHe casH flow statement continuedc) Analysis of net debt
At1 January
2014£m
Cashflow£m
Non-cashitems
£m
Assumed onacquisition
£m
Exchangemovement
£m
At31 December
2014£m
Cash 53.1 (40.0) – – 0.1 13.2 Overdrafts – (4.7) – – – (4.7)Cash and cash equivalents 53.1 (44.7) – – 0.1 8.5Debt due within one year (21.2) 31.5 (16.0) (12.9) (0.8) (19.4)Debt due after one year (90.4) (13.1) 16.0 – (5.9) (93.4)Finance leases (0.7) 1.4 – (1.4) – (0.7)Total (59.2) (24.9) – (14.3) (6.6) (105.0)
Year ended2014
£m
Year ended2013
£mCash and cash equivalents comprise:Cash 13.2 53.1 Bank overdrafts (4.7) –Total 8.5 53.1
Cash and cash equivalents (which are presented as a single class of assets on the face of the Balance Sheet) comprise cash at bank and other short-term highly liquid investments with a maturity of three months or less. The Directors consider that the carrying amount of cash and cash equivalents approximates to their fair value.
33. opeRatinG lease aRRanGementsThe Group as lessee
Year ended2014
£m
Year ended2013
£m
Minimum lease payments under operating leases recognised in the Consolidated Income Statement for the year 7.8 7.8
The Group also received £0.6m under sub-leases recognised in the Consolidated Income Statement for the year (2013 – £0.5m).
At 31 December, the Group had outstanding commitments for future minimum lease payments under non-cancellable operating leases, which fall due as follows:
Year ended2014
£m
Year ended2013
£mWithin one year 7.6 7.6 In the second to fifth years inclusive 21.8 23.1 After five years 14.9 13.1
44.3 43.8
The total of future minimum sub-lease payments expected to be received by the Group under non-cancellable sub-leases at the end of 2014 was £1.9m (2013 – £2.2m).
Operating lease payments principally represent rentals payable by the Group for certain of its manufacturing properties. The four most significant leases, representing 45% (2013 – 36%) of the Group’s commitment, expire in 2026 and three in 2024.
Notes to the Consolidated Financial Statements continued
Annual Report & Accounts 2014100
www.seniorplc.com | Senior plc

STRATEGIC REPORT
GO
VERNA
NCE
FINA
NCIA
L STATEMEN
TSA
DDITIO
NA
L INFO
RMATIO
N
34. sHaRe-baseD paymentsThe Group recognised total expenses of £2.5m (2013 – £3.5m) related to share-based payments, of which £2.3m (2013 – £3.0m) related to equity-settled share-based payments, and £0.2m (2013 – £0.5m) related to social security costs on share-based payments. As at 31 December 2014, the Group had a liability of £0.4m (2013 – £0.7m) arising from share-based payments relating to social security costs.
a) 2005 Long-Term Incentive PlanEquity-Settled Long-Term Incentive PlansOn 21 March 2014 982,115 shares were awarded under the 2005 Long-Term Incentive Plan. Awards under this plan have a three-year vesting period, subject to earnings per share (“EPS”) and total shareholder return (“TSR”) performance conditions being met. Half the awards have an attaching performance target for EPS growth over the three-year performance period of at least 4% per annum above RPI. The other half of the awards begin to vest if the Group’s TSR falls in the top half of a comparator group at the end of the three-year performance period. Vesting levels increase with higher performance. The awards are settled by delivering shares to the participants.
The estimated fair value for the awards granted in the year with EPS conditions is 283.10p, which is essentially the share price at the date of grant of 301.60p per share less an allowance for dividends foregone over the three-year vesting period. The estimated fair value for the awards granted in the year with TSR conditions is 139.80p per share reflecting an adjustment of 49% to the fair value of the awards with EPS conditions due to the stringent TSR condition.
These fair values were calculated by applying a binomial option pricing model. This model incorporates a technique called “bootstrapping”, which models the impact of the TSR condition. The model inputs at the date of grant were the share price of 297.90p, expected volatility of 30.0% per annum, net dividend yield of 1.7% per annum, and the performance conditions as noted above. Expected volatility was determined by calculating the historical volatility of the Group’s share price over the previous three years.
The following share awards were outstanding as at 31 December 2014 and 2013:Year ended
2014Number of
shares
Year ended2013
Number ofshares
Outstanding at 1 January 4,192,569 4,961,212 Granted 982,115 1,321,647 Exercised (1,358,809) (2,039,740)Forfeited (119,273) (50,550)Outstanding at 31 December 3,696,602 4,192,569
Cash-Settled Long-Term Incentive PlanUnder the 2005 Plan, phantom awards were granted to certain employees. These are subject to the same general terms and conditions as the above equity-settled awards, however, on vesting the holder is entitled to receive an amount equal to the market value of the shares in relation to which the phantom award vests.
On 21 March 2014, 4,047 notional shares subject to the phantom awards were awarded under the 2005 Long-Term Incentive Plan. 20,674 phantom awards were forfeited during the year. At 31 December 2014 there were no notional shares outstanding (2013 – 16,627).
b) Enhanced SMIS Deferred Share AwardOn 21 March 2014, 243,076 shares were awarded under the Enhanced SMIS Deferred Share Award. Shares earned under this award have a three-year deferral period and would be subject to forfeiture by a “bad leaver” over that deferral period. There are no performance criteria for this award. The awards are settled by delivering shares to the participants.
The estimated fair value for the awards granted in the year is 283.10p per share, which is essentially the share price at the date of grant of 301.60p per share less an allowance for dividends foregone over the three-year deferral period.
The following share awards were outstanding as at 31 December 2014 and 2013: Year ended
2014Number of
shares
Year ended2013
Number ofshares
Outstanding at 1 January 820,307 450,726 Granted 243,076 369,581 Exercised – –Forfeited – –Outstanding at 31 December 1,063,383 820,307
101Annual Report & Accounts 2014
www.seniorplc.com | Senior plc

34. sHaRe-baseD payments continuedc) Savings-Related Share Option PlanThe Company operates a Savings-Related Share Option Plan for eligible employees across the Group. There are no performance criteria for this arrangement and options are issued to all participants in accordance with the HM Revenue & Customs rules for such savings plans. Savings-Related Share Options were last issued on 30 April 2013.
The following options were outstanding as at 31 December 2014 and 2013:Year ended 2014 Year ended 2013
Number ofshare
options
Weightedaverageexercise
price
Number ofshare
options
Weightedaverageexercise
priceOutstanding at 1 January 3,238,237 219.62p 978,082 144.40pGranted – – 2,617,888 244.40pExercised (786,950) 146.81p (42,422) 144.85pForfeited (386,259) 235.77p (277,540) 209.98pExpired – – (37,771) 144.40pOutstanding at 31 December 2,065,028 244.34p 3,238,237 219.62pExercisable at 31 December 1,250 144.40p – –
The weighted average share price at the date of exercise for share options exercised during the period was 277.72p (2013 – 245.77p). The options outstanding at 31 December 2014 had an exercise price of 244.40p and 144.40p per share, and a weighted average remaining contractual life of 2.0 years. The options outstanding at 31 December 2013 had exercise prices of 244.40p and 144.40p per share, and a weighted average remaining contractual life of 2.5 years.
d) One-off Share AwardOn 3 September 2013, a One-off Award of 82,720 shares was granted under the terms of a share award agreement agreed in connection with and to facilitate Derek Harding’s recruitment as Group Finance Director, in order to partly compensate him for foregoing entitlements from his previous employer. During the year 4/9ths of the One-off Award vested. In the normal course of events, the remaining 3/9ths will vest on 2 September 2015 and 2/9ths on 2 September 2016, in each case subject to Derek Harding’s continued service until the relevant vesting date.
The following share awards were outstanding as at 31 December 2014 and 2013:Year ended
2014Number of
shares
Year ended2013
Number ofshares
Outstanding at 1 January 82,720 –Granted – 82,720 Exercised (36,764) –Forfeited – –Outstanding at 31 December 45,956 82,720
35. RetiRement benefit scHemesThe Group operates a number of pension plans in the UK, North America and Europe. These include both defined contribution arrangements and defined benefit arrangements. The largest defined benefit arrangement for the Group and Company, the Senior plc Pension Plan, is a funded scheme in the UK, providing benefits based on final pensionable emoluments for the employees of the Group and Company. This plan was closed to future accrual at the end of 6 April 2014. The latest full actuarial valuation was carried out as at 5 April 2013 and, for the purposes of accounting under IAS 19, this valuation has been rolled forward to 31 December 2014.
In addition, the Group operates two defined benefit plans in the USA, one of which was closed to future accrual from October 2009. The second plan was closed to future participants from September 2013, and the Executive section was also closed to future accruals from December 2013. Separate disclosure is made for the funded UK and US defined benefit arrangements. In both the UK and the USA the assets of funded plans are held in separate trustee administered funds managed by independent financial institutions and have pension costs assessed by consulting actuaries using the Projected Unit Method. The Trustees are required to act in the best interests of the plans’ beneficiaries.
The Group also has a small number of unfunded post-retirement plans, including a closed healthcare scheme in the US. Separate disclosure is provided for these arrangements.
The bulk of the pension obligations relate to the UK Plan and we provide more detail on that arrangement below.
Notes to the Consolidated Financial Statements continued
Annual Report & Accounts 2014102
www.seniorplc.com | Senior plc
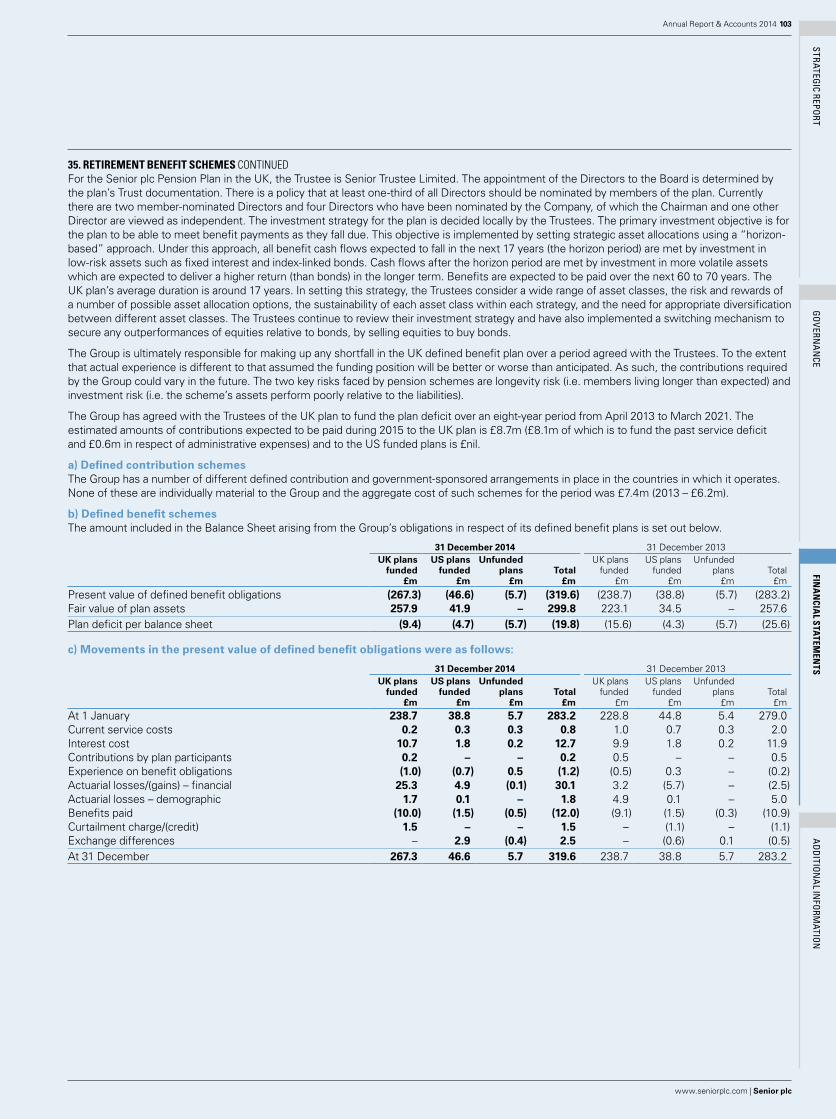
STRATEGIC REPORT
GO
VERNA
NCE
FINA
NCIA
L STATEMEN
TSA
DDITIO
NA
L INFO
RMATIO
N
35. RetiRement benefit scHemes continuedFor the Senior plc Pension Plan in the UK, the Trustee is Senior Trustee Limited. The appointment of the Directors to the Board is determined by the plan’s Trust documentation. There is a policy that at least one-third of all Directors should be nominated by members of the plan. Currently there are two member-nominated Directors and four Directors who have been nominated by the Company, of which the Chairman and one other Director are viewed as independent. The investment strategy for the plan is decided locally by the Trustees. The primary investment objective is for the plan to be able to meet benefit payments as they fall due. This objective is implemented by setting strategic asset allocations using a “horizon-based” approach. Under this approach, all benefit cash flows expected to fall in the next 17 years (the horizon period) are met by investment in low-risk assets such as fixed interest and index-linked bonds. Cash flows after the horizon period are met by investment in more volatile assets which are expected to deliver a higher return (than bonds) in the longer term. Benefits are expected to be paid over the next 60 to 70 years. The UK plan’s average duration is around 17 years. In setting this strategy, the Trustees consider a wide range of asset classes, the risk and rewards of a number of possible asset allocation options, the sustainability of each asset class within each strategy, and the need for appropriate diversification between different asset classes. The Trustees continue to review their investment strategy and have also implemented a switching mechanism to secure any outperformances of equities relative to bonds, by selling equities to buy bonds.
The Group is ultimately responsible for making up any shortfall in the UK defined benefit plan over a period agreed with the Trustees. To the extent that actual experience is different to that assumed the funding position will be better or worse than anticipated. As such, the contributions required by the Group could vary in the future. The two key risks faced by pension schemes are longevity risk (i.e. members living longer than expected) and investment risk (i.e. the scheme’s assets perform poorly relative to the liabilities).
The Group has agreed with the Trustees of the UK plan to fund the plan deficit over an eight-year period from April 2013 to March 2021. The estimated amounts of contributions expected to be paid during 2015 to the UK plan is £8.7m (£8.1m of which is to fund the past service deficit and £0.6m in respect of administrative expenses) and to the US funded plans is £nil.
a) Defined contribution schemesThe Group has a number of different defined contribution and government-sponsored arrangements in place in the countries in which it operates. None of these are individually material to the Group and the aggregate cost of such schemes for the period was £7.4m (2013 – £6.2m).
b) Defined benefit schemesThe amount included in the Balance Sheet arising from the Group’s obligations in respect of its defined benefit plans is set out below.
31 December 2014 31 December 2013UK plans
funded£m
US plansfunded
£m
Unfundedplans
£mTotal
£m
UK plansfunded
£m
US plansfunded
£m
Unfundedplans
£mTotal
£m
Present value of defined benefit obligations (267.3) (46.6) (5.7) (319.6) (238.7) (38.8) (5.7) (283.2)Fair value of plan assets 257.9 41.9 – 299.8 223.1 34.5 – 257.6 Plan deficit per balance sheet (9.4) (4.7) (5.7) (19.8) (15.6) (4.3) (5.7) (25.6)
c) Movements in the present value of defined benefit obligations were as follows:
31 December 2014 31 December 2013UK plans
funded£m
US plansfunded
£m
Unfundedplans
£mTotal
£m
UK plansfunded
£m
US plansfunded
£m
Unfundedplans
£mTotal
£mAt 1 January 238.7 38.8 5.7 283.2 228.8 44.8 5.4 279.0 Current service costs 0.2 0.3 0.3 0.8 1.0 0.7 0.3 2.0 Interest cost 10.7 1.8 0.2 12.7 9.9 1.8 0.2 11.9 Contributions by plan participants 0.2 – – 0.2 0.5 – – 0.5 Experience on benefit obligations (1.0) (0.7) 0.5 (1.2) (0.5) 0.3 – (0.2)Actuarial losses/(gains) – financial 25.3 4.9 (0.1) 30.1 3.2 (5.7) – (2.5)Actuarial losses – demographic 1.7 0.1 – 1.8 4.9 0.1 – 5.0 Benefits paid (10.0) (1.5) (0.5) (12.0) (9.1) (1.5) (0.3) (10.9)Curtailment charge/(credit) 1.5 – – 1.5 – (1.1) – (1.1)Exchange differences – 2.9 (0.4) 2.5 – (0.6) 0.1 (0.5)At 31 December 267.3 46.6 5.7 319.6 238.7 38.8 5.7 283.2
103Annual Report & Accounts 2014
www.seniorplc.com | Senior plc

35. RetiRement benefit scHemes continuedd) Movements in the fair value of plan assets were as follows:
31 December 2014 31 December 2013UK plans
funded£m
US plansfunded
£m
Unfundedplans
£mTotal
£m
UK plansfunded
£m
US plansfunded
£m
Unfundedplans
£mTotal
£mAt 1 January 223.1 34.5 – 257.6 205.5 36.4 – 241.9 Interest on plan assets 10.2 1.6 – 11.8 9.1 1.4 – 10.5 Actuarial return on plan assets less interest 26.5 3.3 – 29.8 9.5 (2.9) – 6.6 Contributions from employer 8.8 1.5 – 10.3 8.4 1.7 – 10.1 Contributions by plan participants 0.2 – – 0.2 0.5 – – 0.5 Benefits paid (10.0) (1.5) – (11.5) (9.1) (1.5) – (10.6)Running costs (0.9) – – (0.9) (0.8) – – (0.8)Exchange differences – 2.5 – 2.5 – (0.6) – (0.6)At 31 December 257.9 41.9 – 299.8 223.1 34.5 – 257.6
e) Amounts recognised in the Income Statement in respect of these defined benefit schemes are as follows:
31 December 2014 31 December 2013UK plans
funded£m
US plansfunded
£m
Unfundedplans
£mTotal
£m
UK plansfunded
£m
US plansfunded
£m
Unfundedplans
£mTotal
£mCurrent service cost included within operating profit 0.2 0.3 0.3 0.8 1.0 0.7 0.3 2.0 Running costs 0.9 – – 0.9 0.8 – – 0.8 Curtailment charge/(credit) 1.5 – – 1.5 – (1.1) – (1.1)Charge/(credit) included within operating profit 2.6 0.3 0.3 3.2 1.8 (0.4) 0.3 1.7 Included within finance costs 0.5 0.2 0.2 0.9 0.8 0.4 0.2 1.4 Amount recognised in the Income Statement 3.1 0.5 0.5 4.1 2.6 – 0.5 3.1
f) Amounts recognised in other comprehensive income are as follows:
31 December 2014 31 December 2013
UK plansfunded
£m
US plansfunded
£m
Unfundedplans
£mTotal
£m
UK plansfunded
£m
US plansfunded
£m
Unfundedplans
£m Total
£m
Net actuarial gain/(losses) in the year due to:– Change in financial assumptions (25.3) (4.9) 0.1 (30.1) (3.2) 5.7 – 2.5 – Change in demographic assumptions (1.7) (0.1) – (1.8) (4.9) (0.1) – (5.0)– Experience adjustments on benefit obligations 1.0 0.7 (0.5) 1.2 0.5 (0.3) – 0.2 Actual return on plan assets less interest on benefit obligations 26.5 3.3 – 29.8 9.5 (2.9) – 6.6 Gains/(losses) recognised in other comprehensive income 0.5 (1.0) (0.4) (0.9) 1.9 2.4 – 4.3
Actuarial losses of £0.9m (2013 – £4.3m gains) have been recognised in the Statement of Comprehensive Income. The cumulative amount of actuarial losses recognised in the Statement of Comprehensive Income as at 31 December 2014 is £47.2m (2013 – £46.3m).
g) Assets and assumptions in funded plansUK plans funded US plans funded
2014£m
2013£m
2014£m
2013£m
Fair value of plan assetsEquities 74.8 72.4 – –Bonds 84.2 80.9 41.9 34.5 Gilts 96.9 68.4 – –Cash and net current assets 2.0 1.4 – –Total 257.9 223.1 41.9 34.5
Actual return on plan assets 36.7 18.6 4.9 (1.5)
The UK plan assets are held exclusively within instruments with quoted market prices in an active market with the exception of the holdings in insurance policies.
Notes to the Consolidated Financial Statements continued
Annual Report & Accounts 2014104
www.seniorplc.com | Senior plc

STRATEGIC REPORT
GO
VERNA
NCE
FINA
NCIA
L STATEMEN
TSA
DDITIO
NA
L INFO
RMATIO
N
35. RetiRement benefit scHemes continuedThe UK plan does not invest directly in property occupied by the Company or in financial securities issued by the Company.
UK plans funded US plans funded2014 2013 2014 2013
Major assumptions (per annum %)Inflation 2.90% 3.30% n/a n/aIncrease in salaries n/a 2.00% n/a 4.00%Increase in pensions 2.80% 3.20% 0.00% 0.00%Increase in deferred pensions 2.90% 3.30% 0.00% 0.00%Rate used to discount plan liabilities 3.50% 4.50% 3.90% 4.80%
Life expectancy of a male aged 65 at the year-end (years) 22.0 21.9 21.6 19.2 Life expectancy of a male aged 65, 20 years after the year-end (years) 23.7 23.6 21.6 19.2
Benefits under the US funded plans are not linked to inflation.
For the UK plan, the estimated impact on the plan deficit at 31 December 2014 for changes in assumptions is as follows:Increase inplan deficit
£m0.5% decrease in the discount rate 22.0 One-year increase in life expectancy 8.0 0.5% increase in inflation 13.0
These sensitivities have been calculated to show the movement in the defined benefit obligation in isolation, and assuming no other changes in market conditions at the accounting date. This is unlikely in practice – for example, a change in discount rate is unlikely to occur without any movement in the value of the assets held by the plan.
h) Other post-retirement liabilities This balance comprises an unfunded German pension plan £3.3m (2013 – £3.2m), unfunded closed pension and post-retirement healthcare plans in the USA £0.4m (2013 – £0.3m) and provision for post-retirement payments in France of £2.0m (2013 – £2.2m).
The closed pension and post-retirement healthcare plans in the US have been valued on a Projected Unit Method using a discount rate of 3.9%. As at 31 December 2014 no more participants were eligible for medical benefits under the plan. The German plan has been subject to formal actuarial valuation on a Projected Unit Method with the following assumptions: discount rate 2.2%; salary growth 0.0%; and inflation 2.0%. In France, the provision arises from a legal obligation to make payments to retirees in the first two years post-retirement. Hence, it is not subject to discounting to the same extent as the other longer-term post-retirement liabilities.
36. post balance sHeet eventsOn 20 January 2015, the Group was notified by Bombardier of the decision to suspend, for an indefinite period of time, the development of its L85 business jet programme. This post balance sheet event triggered a one-off £1.8m impairment of inventory and a £9.4m impairment of goodwill, both of which have been recognised as exceptional charges in 2014.
105Annual Report & Accounts 2014
www.seniorplc.com | Senior plc
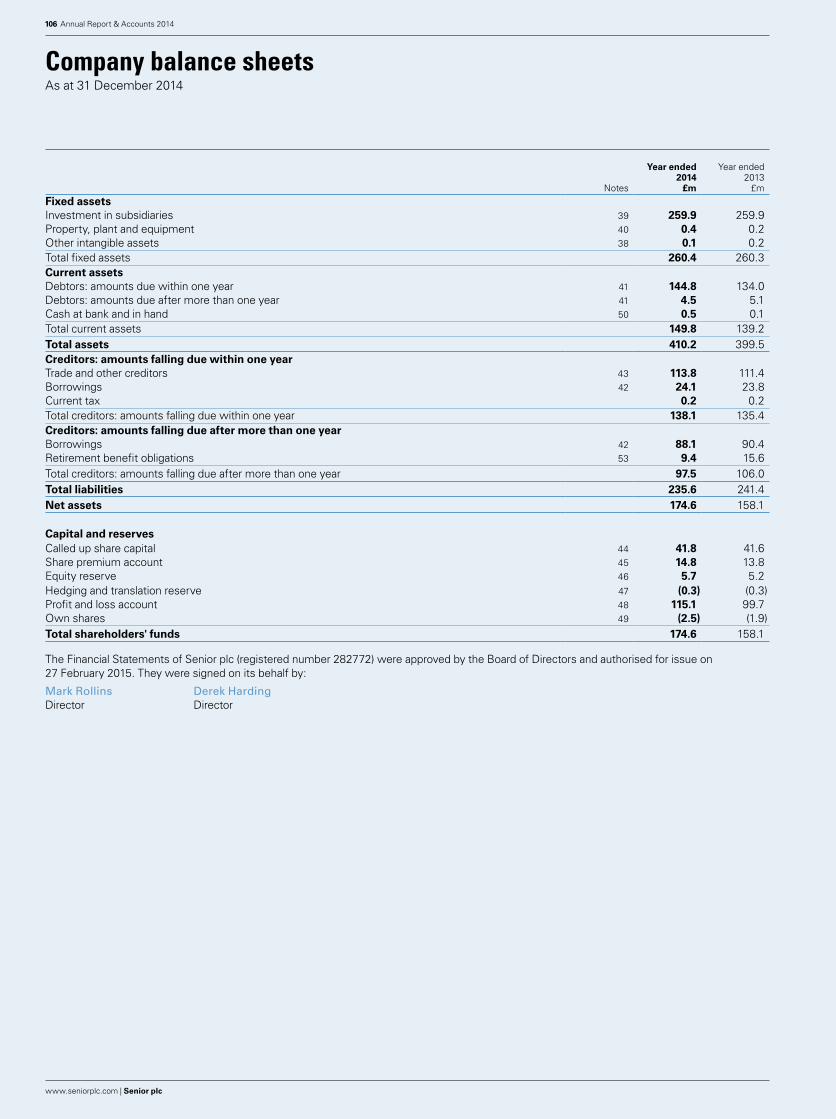
Notes
Year ended2014
£m
Year ended2013
£mFixed assetsInvestment in subsidiaries 39 259.9 259.9 Property, plant and equipment 40 0.4 0.2 Other intangible assets 38 0.1 0.2 Total fixed assets 260.4 260.3 Current assetsDebtors: amounts due within one year 41 144.8 134.0 Debtors: amounts due after more than one year 41 4.5 5.1 Cash at bank and in hand 50 0.5 0.1 Total current assets 149.8 139.2 Total assets 410.2 399.5 Creditors: amounts falling due within one yearTrade and other creditors 43 113.8 111.4 Borrowings 42 24.1 23.8 Current tax 0.2 0.2 Total creditors: amounts falling due within one year 138.1 135.4 Creditors: amounts falling due after more than one yearBorrowings 42 88.1 90.4 Retirement benefit obligations 53 9.4 15.6 Total creditors: amounts falling due after more than one year 97.5 106.0 Total liabilities 235.6 241.4 Net assets 174.6 158.1
Capital and reservesCalled up share capital 44 41.8 41.6 Share premium account 45 14.8 13.8 Equity reserve 46 5.7 5.2 Hedging and translation reserve 47 (0.3) (0.3)Profit and loss account 48 115.1 99.7 Own shares 49 (2.5) (1.9)Total shareholders' funds 174.6 158.1
The Financial Statements of Senior plc (registered number 282772) were approved by the Board of Directors and authorised for issue on 27 February 2015. They were signed on its behalf by:
Mark Rollins Derek Harding Director Director
Annual Report & Accounts 2014106
www.seniorplc.com | Senior plc
company balance sheetsAs at 31 December 2014

STRATEGIC REPORT
GO
VERNA
NCE
FINA
NCIA
L STATEMEN
TSA
DDITIO
NA
L INFO
RMATIO
N
All equity is attributable to equity holders of the Company
Called upshare
capital£m
Sharepremiumaccount
£m
Equityreserve
£m
Hedgingand
translationreserve
£m
Profit andloss
account£m
Ownshares
£m
Totalequity
£mBalance at 1 January 2013 41.4 13.7 3.8 (0.3) 81.1 (1.0) 138.7 Profit for the year 2013 – – – – 35.2 – 35.2 Actuarial gain on defined benefit pension schemes – – – – 1.9 – 1.9 Total comprehensive income for the period – – – – 37.1 – 37.1 Issue of share capital 0.2 0.1 (0.2) – – – 0.1 Share-based payment charge – – 3.0 – – – 3.0 Purchase of shares held by employee benefit trust – – – – – (0.9) (0.9)Transfer to profit and loss account – – (1.4) – 1.4 – –Dividends paid – – – – (19.9) – (19.9)Balance at 31 December 2013 41.6 13.8 5.2 (0.3) 99.7 (1.9) 158.1 Profit for the year 2014 – – – – 35.2 – 35.2 Actuarial gains on defined benefit pension schemes – – – – 0.5 – 0.5 Total comprehensive income for the period – – – – 35.7 – 35.7 Issue of share capital 0.2 1.0 (0.1) – – – 1.1 Share-based payment charge – – 2.3 – – – 2.3 Purchase of shares held by employee benefit trust – – – – – (0.7) (0.7)Use of shares held by employee benefit trust – – – – (0.1) 0.1 –Transfer to profit and loss account – – (1.7) – 1.7 – –Dividends paid – – – – (21.9) – (21.9)Balance at 31 December 2014 41.8 14.8 5.7 (0.3) 115.1 (2.5) 174.6
107Annual Report & Accounts 2014
www.seniorplc.com | Senior plc
company statement of changes in equityFor the year ended 31 December 2014

37. accountinG policiesBasis of accounting (Company only)The Company meets the definition of a qualifying entity under FRS 100 (Financial Reporting Standard 100) issued by the Financial Reporting Council. Accordingly, as notified in the 2013 Annual Report & Accounts, the Company has elected to early adopt FRS 101 (Financial Reporting Standard 101) ‘Reduced Disclosure Framework’ as issued by the Financial Reporting Council.
As permitted by FRS 101, the Company has taken advantage of the disclosure exemptions available under that standard in relation to share-based payments, financial instruments, fair value measurements, capital management, presentation of comparative information in respect of certain assets, presentation of a cash flow statement and disclosure of related party transactions.
The financial statements have been prepared on the historical cost basis. They have also been prepared on the going concern basis. The principal accounting policies adopted are the same as those set out in Note 2 to the Consolidated Financial Statements, except in respect of investments in subsidiaries, which are stated at cost less, where appropriate, provisions for impairment.
38. otHeR intanGible assetsYear ended
2014Computersoftware
£m
CostAt 1 January and at 31 December 0.3 AmortisationAt 1 January 0.1 Charge for the year 0.1 At 31 December 0.2 Carrying amount at 31 December 0.1
39. investments in subsiDiaRiesA list of the significant investments in subsidiaries, including the name, country of incorporation, and proportion of ownership interest is given on page 114.
Year ended2014
£m
Year ended2013
£m
At 1 January 259.9 251.8 Additional investment in subsidiaries – 8.1 At 31 December 259.9 259.9
40. pRopeRty, plant anD equipmentYear ended
2014Plant and
equipment£m
CostAt 1 January 0.5 Additions 0.3 Disposals (0.1)At 31 December 0.7 Accumulated depreciationAt 1 January 0.3 Charge for the year 0.1 Eliminated on disposals (0.1)At 31 December 0.3 Carrying amount at 31 December 0.4
Annual Report & Accounts 2014108
www.seniorplc.com | Senior plc
notes to the company financial statements
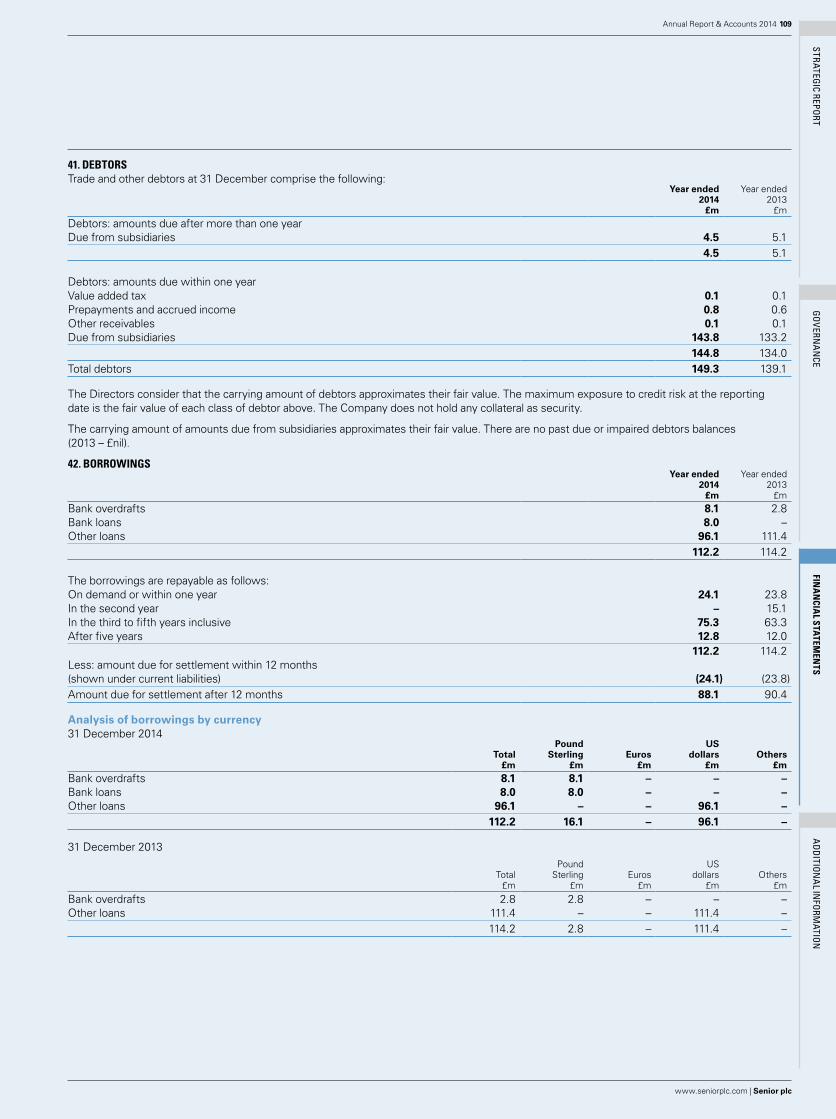
STRATEGIC REPORT
GO
VERNA
NCE
FINA
NCIA
L STATEMEN
TSA
DDITIO
NA
L INFO
RMATIO
N
41. DebtoRsTrade and other debtors at 31 December comprise the following:
Year ended2014
£m
Year ended2013
£mDebtors: amounts due after more than one yearDue from subsidiaries 4.5 5.1
4.5 5.1
Debtors: amounts due within one yearValue added tax 0.1 0.1 Prepayments and accrued income 0.8 0.6 Other receivables 0.1 0.1 Due from subsidiaries 143.8 133.2
144.8 134.0 Total debtors 149.3 139.1
The Directors consider that the carrying amount of debtors approximates their fair value. The maximum exposure to credit risk at the reporting date is the fair value of each class of debtor above. The Company does not hold any collateral as security.
The carrying amount of amounts due from subsidiaries approximates their fair value. There are no past due or impaired debtors balances (2013 – £nil).
42. boRRowinGsYear ended
2014£m
Year ended2013
£mBank overdrafts 8.1 2.8 Bank loans 8.0 –Other loans 96.1 111.4
112.2 114.2
The borrowings are repayable as follows:On demand or within one year 24.1 23.8 In the second year – 15.1 In the third to fifth years inclusive 75.3 63.3 After five years 12.8 12.0
112.2 114.2 Less: amount due for settlement within 12 months(shown under current liabilities) (24.1) (23.8)Amount due for settlement after 12 months 88.1 90.4
Analysis of borrowings by currency31 December 2014
Total£m
PoundSterling
£mEuros
£m
USdollars
£mOthers
£m
Bank overdrafts 8.1 8.1 – – –Bank loans 8.0 8.0 – – –Other loans 96.1 – – 96.1 –
112.2 16.1 – 96.1 –
31 December 2013
Total£m
PoundSterling
£mEuros
£m
USdollars
£mOthers
£m
Bank overdrafts 2.8 2.8 – – –Other loans 111.4 – – 111.4 –
114.2 2.8 – 111.4 –
109Annual Report & Accounts 2014
www.seniorplc.com | Senior plc

42. boRRowinGs continuedThe weighted average interest rates paid were as follows:
Year ended2014
%
Year ended2013
%Bank loans and overdrafts 1.20 1.50 Other loans 6.58 6.46
Bank loans and overdrafts of £16.1m (2013 – £2.8m) are arranged at floating rates, thus exposing the Company to cash flow interest rate risk. Other borrowings are mainly arranged at fixed interest rates and expose the Company to fair value interest rate risk. No interest rate swaps were taken out in 2013 or 2014.
The Directors estimate the fair value of the Company’s borrowings to be as follows:Year ended
2014£m
Year ended2013
£mBank loans and overdrafts 16.1 2.8 Other loans 106.3 124.7
122.4 127.5
43. tRaDe anD otHeR cReDitoRsTrade and other creditors at 31 December comprise the following:
Year ended2014
£m
Year ended2013
£mCreditors: amounts falling due within one yearTrade creditors 0.2 0.3 Social security and PAYE 0.1 0.1 Other creditors and accruals 3.6 3.7 Due to subsidiaries 109.9 107.3 Total trade and other creditors 113.8 111.4
The Directors consider that the carrying amount of trade creditors approximates to their fair value.
44. calleD up sHaRe capitalYear ended
2014£m
Year ended2013
£mAuthorised:750 million ordinary shares of 10p each 75.0 75.0 Called up and fully paid:418.1 million ordinary shares of 10p each 41.8 41.6
At 31 December 2013, the called up and fully paid share capital was 415.9 million ordinary shares of 10p each.
786,950 shares were issued during 2014 at an average price of 146.8p per share under share option plans raising £1.1m. 1,358,809 shares were issued during 2014 under the 2005 Long-Term Incentive Plan.
The Company has one class of ordinary shares which carry no right to fixed income.
45. sHaRe pRemium accountYear ended
2014£m
Year ended2013
£mBalance at 1 January 13.8 13.7 Movement in year 1.0 0.1 Balance at 31 December 14.8 13.8
Notes to the Company Financial Statements continued
Annual Report & Accounts 2014110
www.seniorplc.com | Senior plc

STRATEGIC REPORT
GO
VERNA
NCE
FINA
NCIA
L STATEMEN
TSA
DDITIO
NA
L INFO
RMATIO
N
46. equity ReseRveYear ended
2014£m
Year ended2013
£mBalance at 1 January 5.2 3.8 Transfer to profit and loss account (1.7) (1.4)Movement in year 2.2 2.8 Balance at 31 December 5.7 5.2
The transfer to profit and loss account is in respect of equity-settled share-based payments that vested during the year.
The movement in the year includes £2.3m (2013 – £3.0m) in respect of the share-based payment charge for the year, and £0.1m (2013 – £0.2m) release in respect of the shares issued in the year under the 2005 Long-Term Incentive Plan.
47. HeDGinG anD tRanslation ReseRvesHedgingreserve
Year ended2014
£m
Translationreserve
Year ended2014
£m
TotalYear ended
2014£m
Hedgingreserve
Year ended2013
£m
Translationreserve
Year ended2013
£m
TotalYear ended
2013£m
Balance at 1 January and 31 December – (0.3) (0.3) – (0.3) (0.3)
48. pRofit anD loss accountYear ended
2014£m
Year ended2013
£mBalance at 1 January 99.7 81.1 Dividends paid (21.9) (19.9)Net profit for the year 35.2 35.2 Pension actuarial gain 0.5 1.9 Transfer from equity reserve 1.7 1.4 Transfer from own share reserve (0.1) –Balance at 31 December 115.1 99.7
£7.5m (2013 – £7.5m) of the Company’s retained earnings are considered undistributable.
In accordance with Section 408 of the Companies Act 2006, the Company has not presented its own Statement of Comprehensive Income, including the Income Statement and related notes.
49. own sHaResYear ended
2014£m
Year ended2013
£m
Balance at 1 January (1.9) (1.0)Transfer to profit and loss account 0.1 – Purchase of new shares (0.7) (0.9)Balance at 31 December (2.5) (1.9)
The own shares reserve represents the cost of shares purchased in the market and held by the Senior plc Employee Benefit Trust to satisfy options under the Group’s share option schemes (see Note 34).
50. casH at bank anD in HanDYear ended
2014£m
Year ended2013
£mCash and cash equivalents comprise:Cash 0.5 0.1 Bank overdrafts (8.1) (2.8)Total (7.6) (2.7)
Cash at bank and in hand held by the Company (which are presented as a single class of assets on the face of the Balance Sheet) comprise cash at bank and other short-term highly liquid investments with a maturity of three months or less. The Directors consider that the carrying amount of cash and cash equivalents approximate to their face value.
111Annual Report & Accounts 2014
www.seniorplc.com | Senior plc

51. opeRatinG lease aRRanGementsThe Company as lessee
Year ended2014
£m
Year ended2013
£m
Minimum lease payments under operating leases recognised in the Income Statement for the year 0.1 0.1
At 31 December, the Company had outstanding commitments for future minimum lease payments under non-cancellable operating leases, which fall due as follows:
Year ended2014
£m
Year ended2013
£mWithin one year 0.1 –In the second to fifth years inclusive 0.5 0.4 After five years 1.0 1.2
1.6 1.6
As at the date of approving the accounts, the Company has guaranteed £1.0m (2013 – £1.0m) of annual lease commitments of certain current and previous subsidiary entities.
52. DefeRReD taxThe Company has deductible temporary differences, for which no deferred tax asset has been recognised, in respect of retirement benefit obligations of £9.4m (2013 – £15.6m), share-based payments of £2.5m (2013 – £2.9m), accelerated book depreciation of £0.6m (2013 – £0.6m) and other temporary differences of £0.3m (2013 – £0.3m). Deferred tax assets have not been recognised in respect of these differences due to the unpredictability of both the timing of the reversal of these temporary differences and of the future profit streams of the Company.
53. RetiRement benefit scHemesThe Company’s defined benefit scheme obligations are shown in Note 35 in the “UK plans funded” column.
54. RelateD paRty tRansactionsThe remuneration of the Directors and senior managers, who are the key management personnel of the Group, is set out in the Remuneration Report on pages 44 to 59.
Notes to the Company Financial Statements continued
Annual Report & Accounts 2014112
www.seniorplc.com | Senior plc

STRATEGIC REPORT
GO
VERNA
NCE
FINA
NCIA
L STATEMEN
TSA
DDITIO
NA
L INFO
RMATIO
N
Group income statement
2014£m
2013£m
2012£m
2011£m
2010£m
RevenueContinuing operations 820.8 775.1 712.0 622.3 552.2 Discontinued operations – – 17.8 18.4 14.7
820.8 775.1 729.8 640.7 566.9 Adjusted operating profitContinuing operations 111.6 107.6 100.6 87.3 74.4 Discontinued operations – – 0.8 1.0 1.0
111.6 107.6 101.4 88.3 75.4 (Loss)/profit on sale of fixed assets – – (0.1) (0.3) 0.2 Exceptional pension (charge)/credit (1.5) 1.1 (1.9) –Amortisation of intangible assets from acquisitions (7.2) (4.2) (4.3) (4.4) (4.6)Impairment of goodwill (9.4) (12.7) – – (8.7)Restructuring costs (1.5) (1.9) – – –Reversal of contingent consideration payable – 3.8 – – –Write-down of L85 inventory (1.8) – – – – Acquisition costs (0.6) (0.4) (0.6) (0.6) (0.1)Operating profit 89.6 93.3 94.5 83.0 62.2 Investment income/finance costs, net (8.1) (8.1) (7.7) (7.9) (7.9)Net finance cost of retirement benefit obligations (0.9) (1.4) (2.6) (2.4) (2.2)Profit on disposal of discontinued operations – – 2.5 – –Profit before tax 80.6 83.8 86.7 72.7 52.1 Tax (17.1) (12.4) (16.8) (17.7) (11.7)Profit for the year 63.5 71.4 69.9 55.0 40.4
Depreciation and amortisation of intangibles 32.1 26.5 25.1 23.0 24.6 Gross capital expenditure (including finance lease assets) 31.1 29.7 26.1 22.3 14.2 Basic earnings per share 15.25p 17.22p 17.11p 13.68p 10.11pDiluted earnings per share 15.06p 17.00p 16.69p 13.21p 9.77pAdjusted earnings per share 19.84p 19.00p 17.75p 14.55p 12.01pDividends in respect of years – per share 5.63p 5.12p 4.65p 3.80p 3.12p
– value 23.5 21.3 19.3 15.3 12.5
Group balance sheetsNon-current assets 466.4 393.6 387.4 362.9 292.2 Net current assets 84.4 101.1 94.8 75.0 93.3 Non-current liabilities (139.2) (133.2) (169.3) (161.6) (159.6)Net assets 411.6 361.5 312.9 276.3 225.9 Net borrowings (105.0) (59.2) (70.0) (93.0) (63.7) Group cash flowNet cash from operating activities 88.6 92.4 83.3 77.1 70.2 Interest received 0.1 0.2 0.3 0.3 0.7 Proceeds from disposal of property, plant and equipment 0.2 0.9 0.1 0.3 2.1 Purchase of property, plant and equipment – cash (29.6) (28.7) (25.3) (21.1) (13.5)Purchase of intangible assets (1.5) (1.0) (0.8) (1.0) (0.7)Free cash flow 57.8 63.8 57.6 55.6 58.8 Dividends paid (21.9) (19.9) (16.4) (13.1) (10.8) Acquisitions less disposals (60.1) (30.5) (23.6) (68.6) (8.3)Investment in joint venture – (0.5) (0.9) – –Loan to joint venture (1.1) – – – –Share issues 1.1 0.1 2.3 – 0.3 (Purchase)/sale of shares held by employee benefit trust (0.7) (0.9) (1.0) – 1.4 Decrease in loans (18.4) (0.2) (0.2) (0.2) (4.6)Decrease in finance leases (1.4) (0.5) (0.6) (0.4) (0.2)Cash inflow on forward contracts – – – 0.2 –(Decrease)/increase in cash and cash equivalents (44.7) 11.4 17.2 (26.5) 36.6
113Annual Report & Accounts 2014
www.seniorplc.com | Senior plc
five-year summary
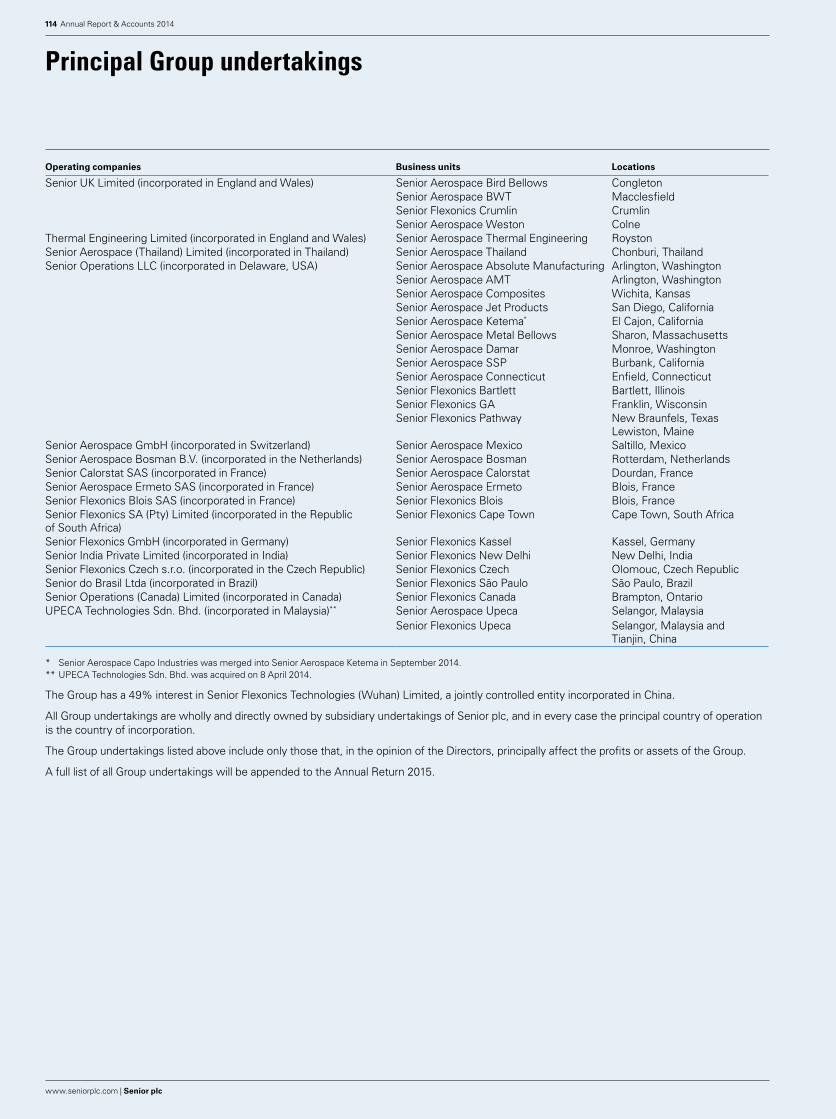
Operating companies Business units Locations
Senior UK Limited (incorporated in England and Wales) Senior Aerospace Bird Bellows CongletonSenior Aerospace BWT MacclesfieldSenior Flexonics Crumlin CrumlinSenior Aerospace Weston Colne
Thermal Engineering Limited (incorporated in England and Wales) Senior Aerospace Thermal Engineering RoystonSenior Aerospace (Thailand) Limited (incorporated in Thailand) Senior Aerospace Thailand Chonburi, ThailandSenior Operations LLC (incorporated in Delaware, USA) Senior Aerospace Absolute Manufacturing Arlington, Washington
Senior Aerospace AMT Arlington, WashingtonSenior Aerospace Composites Wichita, KansasSenior Aerospace Jet Products San Diego, CaliforniaSenior Aerospace Ketema* El Cajon, CaliforniaSenior Aerospace Metal Bellows Sharon, MassachusettsSenior Aerospace Damar Monroe, WashingtonSenior Aerospace SSP Burbank, CaliforniaSenior Aerospace Connecticut Enfield, ConnecticutSenior Flexonics Bartlett Bartlett, IllinoisSenior Flexonics GA Franklin, WisconsinSenior Flexonics Pathway New Braunfels, Texas
Lewiston, MaineSenior Aerospace GmbH (incorporated in Switzerland) Senior Aerospace Mexico Saltillo, MexicoSenior Aerospace Bosman B.V. (incorporated in the Netherlands) Senior Aerospace Bosman Rotterdam, NetherlandsSenior Calorstat SAS (incorporated in France) Senior Aerospace Calorstat Dourdan, FranceSenior Aerospace Ermeto SAS (incorporated in France) Senior Aerospace Ermeto Blois, FranceSenior Flexonics Blois SAS (incorporated in France) Senior Flexonics Blois Blois, FranceSenior Flexonics SA (Pty) Limited (incorporated in the Republic of South Africa)
Senior Flexonics Cape Town Cape Town, South Africa
Senior Flexonics GmbH (incorporated in Germany) Senior Flexonics Kassel Kassel, GermanySenior India Private Limited (incorporated in India) Senior Flexonics New Delhi New Delhi, IndiaSenior Flexonics Czech s.r.o. (incorporated in the Czech Republic) Senior Flexonics Czech Olomouc, Czech RepublicSenior do Brasil Ltda (incorporated in Brazil) Senior Flexonics São Paulo São Paulo, BrazilSenior Operations (Canada) Limited (incorporated in Canada) Senior Flexonics Canada Brampton, OntarioUPECA Technologies Sdn. Bhd. (incorporated in Malaysia)** Senior Aerospace Upeca Selangor, Malaysia
Senior Flexonics Upeca Selangor, Malaysia and Tianjin, China
* Senior Aerospace Capo Industries was merged into Senior Aerospace Ketema in September 2014. ** UPECA Technologies Sdn. Bhd. was acquired on 8 April 2014.
The Group has a 49% interest in Senior Flexonics Technologies (Wuhan) Limited, a jointly controlled entity incorporated in China.
All Group undertakings are wholly and directly owned by subsidiary undertakings of Senior plc, and in every case the principal country of operation is the country of incorporation.
The Group undertakings listed above include only those that, in the opinion of the Directors, principally affect the profits or assets of the Group.
A full list of all Group undertakings will be appended to the Annual Return 2015.
Annual Report & Accounts 2014114
www.seniorplc.com | Senior plc
principal Group undertakings
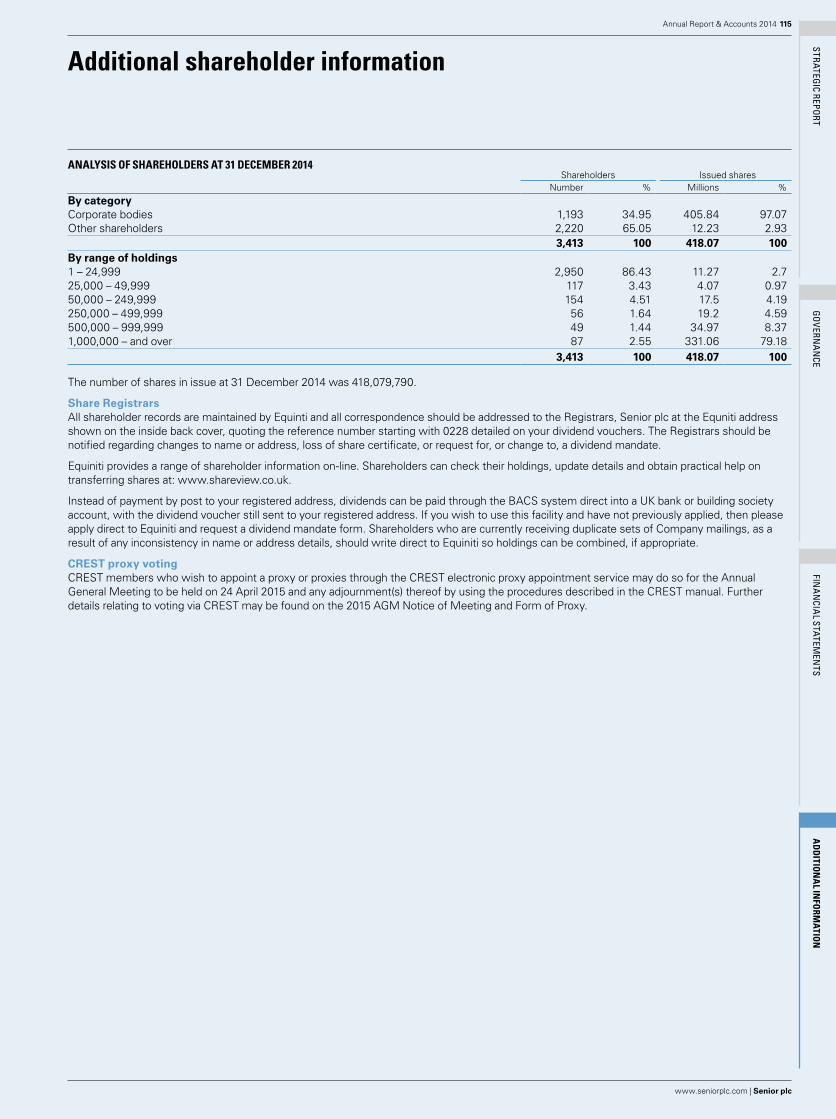
STRATEGIC REPORT
GO
VERNA
NCE
FINA
NCIA
L STATEMEN
TSA
DD
ITION
AL IN
FORM
ATION
analysis of sHaReHolDeRs at 31 DecembeR 2014Shareholders Issued shares
Number % Millions %By categoryCorporate bodies 1,193 34.95 405.84 97.07Other shareholders 2,220 65.05 12.23 2.93
3,413 100 418.07 100By range of holdings1 – 24,999 2,950 86.43 11.27 2.725,000 – 49,999 117 3.43 4.07 0.9750,000 – 249,999 154 4.51 17.5 4.19250,000 – 499,999 56 1.64 19.2 4.59500,000 – 999,999 49 1.44 34.97 8.371,000,000 – and over 87 2.55 331.06 79.18
3,413 100 418.07 100
The number of shares in issue at 31 December 2014 was 418,079,790.
Share RegistrarsAll shareholder records are maintained by Equinti and all correspondence should be addressed to the Registrars, Senior plc at the Equniti address shown on the inside back cover, quoting the reference number starting with 0228 detailed on your dividend vouchers. The Registrars should be notified regarding changes to name or address, loss of share certificate, or request for, or change to, a dividend mandate.
Equiniti provides a range of shareholder information on-line. Shareholders can check their holdings, update details and obtain practical help on transferring shares at: www.shareview.co.uk.
Instead of payment by post to your registered address, dividends can be paid through the BACS system direct into a UK bank or building society account, with the dividend voucher still sent to your registered address. If you wish to use this facility and have not previously applied, then please apply direct to Equiniti and request a dividend mandate form. Shareholders who are currently receiving duplicate sets of Company mailings, as a result of any inconsistency in name or address details, should write direct to Equiniti so holdings can be combined, if appropriate.
CREST proxy votingCREST members who wish to appoint a proxy or proxies through the CREST electronic proxy appointment service may do so for the Annual General Meeting to be held on 24 April 2015 and any adjournment(s) thereof by using the procedures described in the CREST manual. Further details relating to voting via CREST may be found on the 2015 AGM Notice of Meeting and Form of Proxy.
115Annual Report & Accounts 2014
www.seniorplc.com | Senior plc
additional shareholder information

secRetaRy anD ReGisteReD officeAndrew Bodenham Senior plc 59/61 High Street, Rickmansworth, Hertfordshire WD3 1RH
Registered in England and Wales No. 282772
ReGistRaRsEquiniti Aspect House, Spencer Road, Lancing, West Sussex BN99 6DA
auDitoRDeloitte LLP Abbots House, Abbey Street, Reading RG1 3BD
sHaReGift If you have only a small number of shares which would cost more for you to sell than they are worth, you may wish to consider donating them to the charity ShareGift (Registered Charity 1052686) which specialises in accepting such shares as donations. The ShareGift Transfer Form may be obtained from Equiniti, the Company’s Registrars, at www.shareview.co.uk. There are no implications for Capital Gains Tax purposes (no gain or loss) on gifts of shares to charity and it is also possible to obtain income tax relief. Further information about ShareGift may be obtained on 020 7930 3737 or from www.ShareGift.org.
solicitoRsSlaughter and May One Bunhill Row, London EC1Y 8YY
pRincipal uk cleaRinG bankeRs Lloyds Banking Group plc 25 Gresham Street, London EC2V 7HN
financial aDviseRs Lazards & Co., Limited 50 Stratton Street, London W1J 8LL
stockbRokeRsJefferies Hoare Govett Vintners Place 68 Upper Thames Street London EC4V 3BJ
tHe key events foR senioR in 2015 aRe set out belowSome of the dates are indicative only and may be subject to change.
2 MarchPreliminary announcement of the 2014 Annual Results.
6 MarchPublication of the Annual Report & Accounts 2014.
24 AprilAnnual General Meeting.
29 AprilShares ex-dividend for the 2014 final dividend.
1 MayRecord date for shareholders on register to receive 2014 final dividend.
29 MayPayment of the 2014 final dividend.
27 JulyPreliminary announcement of the 2015 Interim Results.
3 AugustPublication of the Interim Report 2015.
21 OctoberShares ex-dividend for the 2015 interim dividend.
23 OctoberRecord date for shareholders on register to receive 2015 interim dividend.
30 NovemberPayment of the 2015 interim dividend.
Annual Report & Accounts 2014116
www.seniorplc.com | Senior plc
2015 financial calendar
officers and advisers

Designed by Printed by Park Communications

Senior plc59/61 High Street Rickmansworth Hertfordshire WD3 1RH United Kingdom
www.seniorplc.com
T +44 (0) 1923 775547
F +44 (0) 1923 775583