spectris plc annual report and accounts 2014 report and accounts 2014. spectris plc annual report...
TRANSCRIPT

Interactive PDF User guideThis PDF allows you to find information and navigate around this document more easily.
Links in this PDFWords and numbers that are underlined are links – clicking on them will take you to further information within the document or to a web page (which opens in a new window) if they are a url (e.g. www.spectris.com).
Guide to buttons
Back to user guide
Search this PDF
Print options
Preceding page
Next page
Last visited page
Spectris plcAnnual Report and Accounts 2014

Spectris plcAnnual Report and Accounts 2014
Streamlining ProcessesSaving TimeIncreasing YieldImproving Quality
Enhancing Productivity

Spectris is a leading supplier of productivity- enhancing instrumentation and controls. Our businesses are leaders in the markets they serve, with recognised brands and award-winning products.
Our valuesThe way we work is underpinned by our values, providing a framework which all of our people understand and respect.
Customerfocus
EmpowermentAbsoluteintegrity
Highperformance
Restlessinnovation
What we doWe make highly-specialised measuring instruments and controls for some of the most technically demanding industrial applications. Our products and services aim to enhance customers’ productivity, yielding them clear benefits by helping them to work better, faster and more efficiently.
Increasing yield
Saving time
Improving quality
Streamliningprocesses
Growth driversEnhancing productivity is an ever-present goal of the global manufacturing sector that in turn drives good organic demand for our products and services, particularly in high-growth emerging markets. Long-term customer relationships, strong intellectual property and continuous innovation serve to protect our market positions and enhance organic growth. We supplement this organic growth through stand-alone and bolt-on acquisitions.
Who our customers areWe serve a broad spectrum of blue-chip customers across all key manufacturing industries. We work closely with them, adapting our technology to meet their needs. After the initial product sale, we provide a range of aftermarket services including maintenance, training and consultancy support. This gives us a unique ability to anticipate and respond to the constantly changing demands of our customers and fosters strong long-term customer relationships, with the result that the majority of our sales is repeat business.
Where we areWe are headquartered in the UK, employing more than 8,000 people in over 30 countries worldwide. Our people have in-depth know-how and expertise in their chosen fields and our global network of sales offices and technical centres provides local delivery and service for our customers, wherever they are based.
Who We Are

Strategic Report 01–41 Governance 42–74 Financial Statements 75–131
01Spectris plc Annual Report and Accounts 2014
Highlights Contents
• Like-for-like (‘LFL’) sales growth of 2%, with improved growth in the second half.
• Good performance from Test and Measurement, In-line Instrumentation and Industrial Controls, with combined LFL sales growth of 4%.
• Materials Analysis LFL sales declined 3% due to weak demand in the metals, minerals and mining industries.
• Six acquisitions completed in 2014.
• Continued strong operating cash conversion of 89%.
• Dividend up by 9%.
Sales1 £m
£1,173.7mAdjusted operating profit1 £m
£198.1m14 1,173.7
13 1,197.8
12 1,177.2
11 1,106.2
10 901.9
14 198.1
13 214.7
12 216.9
11 201.5
10 142.1
Adjusted earnings per share1 pence
124.4pDividend pence
46.50p14 124.4
13 132.9
12 130.3
11 124.1
10 86.6
14 46.50
13 42.75
12 39.00
11 33.60
10 28.00
Cash conversion %
89%Net debt to EBITDA
0.6x14 89
13 86
12 94
11 89
10 112
14 0.6
13 0.4
12 1.0
11 1.6
10 0.5
1 The adjusted performance measures represent the statutory results excluding certain non-operational items. The 2013 and 2012 results exclude the trading results and impact of the disposal of the Fusion UV business which was sold on 31 January 2013. Years prior to 2012 have not been restated to reflect the disposal.
Strategic Report01 Highlights02 Chairman’s and Chief Executive’s
Review04 Our Business Model06 Our Group Structure08 Our Strategy14 Key Performance Indicators16 Principal Risks and Uncertainties21 Sustainability Report28 Ethics Report30 Operating Review38 Financial Review
Governance42 Corporate Governance Report42 Board of Directors48 Nomination Committee Report50 Accountability51 Audit and Risk Committee Report57 Other Statutory Information58 Statement of Directors’ Responsibilities59 Compliance with UK Corporate
Governance Code61 Directors’ Remuneration Report
Financial Statements75 Independent Auditor’s Report78 Consolidated Income Statement79 Consolidated Statement
of Comprehensive Income80 Consolidated Statement
of Changes in Equity81 Consolidated Statement
of Financial Position82 Consolidated Statement of Cash Flows83 Notes to the Accounts124 Company Balance Sheet125 Notes to the Company Accounts132 Shareholder Information
Throughout the report we have used the following icons to help navigate to further information.
Links to pages Quick read within our website summary
Links to pages Key highlights within this report
Read more online, or download the interactive PDF at
www.spectris.com
Integrated reportingCorporate responsibility information is integrated throughout our Annual Report and Accounts. This reflects how managing our environmental, economic and social impacts is central to how we do business. It also provides readers with greater clarity on the relationship between our financial and non-financial key performance indicators.

Strategic Report 01–41 Governance 42–74 Financial Statements 75–131
02Spectris plc Annual Report and Accounts 2014
Chairman’s and Chief Executive’s Review
Trading in 2014 was principally driven by a strong North American performance, partly offset by more challenging conditions in the Eurozone and China.
Results overviewFollowing a good fourth quarter, the Group delivered full-year sales growth of 2% on a constant currency organic (like-for-like, ‘LFL’) basis1. Reported sales2 declined by 2% to £1,173.7 million, with a one percentage point contribution from acquisitions being more than offset by a five percentage point adverse impact from foreign currency exchange movements. There was a good performance from three of our four business segments, with combined sales growth of 4% across the Test and Measurement, In-line Instrumentation and Industrial Controls segments. Sales declined by 3% in the Materials Analysis segment, although it did recover to deliver good growth in the fourth quarter. This segment faced weak demand in the metals, minerals and mining industries, which was only partially offset by sales growth in the pharmaceutical and semiconductor sectors. More detail on the contribution made by each of the four business segments can be found in the Operating Review on pages 30 to 37.
Regionally, sales to North America grew by 6%. Sales to Asia Pacific increased by 1%, with good growth in Japan offset by a flat performance in China and a slight decline elsewhere in the region. In Europe, sales declined by 1%, with strong growth in the UK offset by weakness in Germany and other Eurozone economies, particularly during the second half of the year. Sales to Germany declined by 3% in the year. Sales to the Rest of the world declined by 1%, with good sales growth in Brazil offset by a decline in sales to both Africa and Russia, the latter due to the imposition of economic sanctions early in the year.
On a reported basis, adjusted operating profit3 declined by 8% to £198.1 million and LFL operating profit decreased by 6%. Sales growth of 2% was insufficient to offset the combined effect of a lower gross margin arising from sales mix, anticipated headcount increases, investments in our strategic growth initiatives and overhead cost inflation. Consequently, operating margins declined by one percentage point on a LFL basis to 16.9%. Net interest charges decreased by £3.5 million to £5.6 million, principally reflecting lower average net debt levels and a reduced average interest rate. The combined effect of the above movements was a decline of 6% in adjusted profit before tax from £205.6 million to £192.5 million.
Financial position and dividendOperating cash flow continued to be strong, with 89% of our operating profit being converted into cash. Combined with normal dividend and tax outflows and the consideration paid for the six acquisitions made during the year, this resulted in net debt increasing by £21.5 million compared to the end of 2013. At year end, net debt stood at £125.6 million, around 0.6 times the full-year EBITDA of £219.8 million.
The Board is proposing to pay a final dividend of 30.5 pence per share which, combined with the interim dividend of 16.0 pence per share, gives a total of 46.5 pence per share for the year, an increase of 9%. The dividend is covered 2.7 times. This is consistent with our policy of making progressive dividend payments based upon affordability and sustainability. The dividend will be paid on 26 June 2015 to shareholders on the register at the close of business on 29 May 2015.
StrategyWe have a clearly-defined strategy and in 2014 we maintained our focus and investment on our key strategic growth initiatives.
We continued to invest in innovation and new product development, increasing R&D spend broadly in line with sales growth to £86.5 million and launching new products across all segments. R&D expenditure as a percentage of sales remained at 7.4% for the full year. We believe that this investment will further strengthen our market positions and leaves the Group well placed to deliver good growth rates through the cycle.
Our drive to expand Omega Engineering (‘Omega’) beyond its predominantly US customer base to become a global business continued in 2014. In January 2014, we opened an office in Japan, supplementing previous investments in China, Korea, Singapore, Brazil and Mexico. Since then we have further strengthened Omega’s presence in Europe and Asia through additional investment in digital marketing and local operational capabilities in these regions.
Sales
£1,173.7mAdjusted operating profit 3
£198.1mAdjusted earnings per share3
124.4p Dividend
46.5p
1 Unless otherwise stated, references to sales increases/decreases going forward relate to the LFL sales increase/decrease rather than the reported sales increase/decrease.
2 The numbers stated in this report have been restated to exclude the trading results and impact of the disposal of the Fusion UV business which was sold on 31 January 2013.
3 Unless otherwise stated, figures quoted for operating profit, net interest, profit before tax, tax, earnings per share and operating cash flow are adjusted measures – for an explanation of adjusted figures and reconciliation to the statutory reported figures see Note 2 to the Financial Statements.
John O’HigginsChief Executive
John HughesChairman

Lisa, Bill and Ulf bring significant knowledge and relevant experience in the energy, automotive and aerospace and mining industries respectively, and their expertise will be a valuable addition to the Board. We would like to thank John Warren for the significant contributions he has made to the Spectris Board since his appointment in 2006, and wish him well for the future following his retirement from the Board in April.
Spectris’ valuesOur values are central to Spectris, guiding our decision-making and ensuring that we always comply with the highest standards, wherever we are in the world. We want to be a company that our people are proud to work for, where they feel valued, motivated and capable of reaching their full potential. We believe that our values are pivotal to our success and growth and this has been demonstrated by the relentless commitment given by all our employees across the world during the year. In October, we conducted our first ethics survey, an independently-run anonymous survey to help us assess our ethical culture and the effectiveness of our ethics programme. The feedback from the survey, which in aggregate was very positive, will help us continue to evolve and improve our programme during the course of 2015 and beyond.
Summary and outlookTrading in 2014 was principally driven by a strong North American performance, partly offset by more challenging conditions in the Eurozone and China. Assuming a similar macroeconomic environment in 2015, we expect to deliver progress as we benefit from our investment in new products and from the acquisitions made during 2014 and the early part of 2015. These investments, together with our broad end-market exposures and strong financial position, provide the Board of Spectris with confidence that the Company is well positioned for 2015 and beyond.
Since the end of 2014, we have invested a further £28.0 million on another bolt-on acquisition: ReliaSoft, a reliability engineering software business that is being integrated into an existing software business in Test and Measurement. More information on all of these acquisitions can be found within the Operating Review on pages 30 to 37.
Management and BoardThere were a number of changes to Spectris’ Executive Committee in 2014. Eoghan O’Lionaird joined the Committee on 3 February and assumed Jim Webster’s responsibilities for the Materials Analysis and Test and Measurement segments. Before joining Spectris, Eoghan was president of the Leica Microsystems division of Danaher Corporation in Germany. Jo Hallas joined on 16 May, taking on responsibility for the In-line Instrumentation and Industrial Controls segments following the departure of Steve Blair. Jo was formerly general manager of Residential Controls at Invensys plc.
There were also a number of changes to the composition of the Board of Spectris during the year. On 25 April, Lisa Davis joined the Board as a Non-executive Director. Lisa is now a member of the Siemens AG managing board and chair of Siemens Corporation in the US. On 19 December, we announced that Bill Seeger and Ulf Quellmann would join the Board as Non-executive Directors with effect from 1 January 2015. In addition, Bill will assume the role of Chairman of the Audit and Risk Committee from John Warren with immediate effect. Bill was previously group finance director of GKN plc up until August 2014, a position he had held for seven years, and prior to that spent over 20 years in senior finance roles within the automotive and aerospace industries. He currently serves as chairman of the audit committee at Smiths Group plc. Ulf is currently global head of treasury at Rio Tinto plc, having worked in the metals, minerals and mining industry for the past 12 years. Prior to that he held a number of senior management roles at General Motors.
After nine years of service, John Warren will retire as a Non-executive Director of Spectris plc immediately following the Annual General Meeting (‘AGM’) on 24 April 2015. With effect from 1 January 2015, he stood down as Senior Independent Director and Russell King has assumed this role in addition to remaining Chairman of the Remuneration Committee.
It is pleasing to see that this investment in the geographic expansion of Omega is starting to show results, with good sales performance in 2014, particularly in Asia.
We made six acquisitions during 2014, investing a total of £94.1 million, adding a new business within the Test and Measurement segment and boosting the growth prospects of several of our existing businesses. A new strategic growth platform was created in the Test and Measurement segment with the addition of ESG Solutions (‘ESG’) in December. ESG is a leading supplier of microseismic monitoring equipment and analysis solutions. Its technology enables its customers, who are primarily in the oil and gas and mining sectors, to optimise production and improve their return on investment. We believe that there is a significant opportunity to strengthen ESG’s market position, expand internationally and accelerate its growth, both organically and via further acquisitions.
The other five acquisitions (four in the Materials Analysis segment and one in the Test and Measurement segment) all strengthen existing businesses, bringing new technologies and customer access. Two of the acquisitions in Materials Analysis increase our presence in the life science sector, a fast-growing market that we identified as a key growth opportunity in early 2012. Since then we have invested both through in-house product development and strategic bolt-on acquisitions to develop this new business stream. We remain encouraged by the progress we have made to date and the growth prospects for this business in 2015 and beyond.
Focussing on operationalexcellence
At Omega, initiatives to deliver operational improvements such as reduced process time, improved delivery performance and inventory reduction are being implemented. For example, changes to the thermocouple wire re-spooling process have improved lead times from five days to two days and reduced finished stock inventory by $500,000.
Strategic Report 01–41 Governance 42–74 Financial Statements 75–131
03Spectris plc Annual Report and Accounts 2014

Strategic Report 01–41 Governance 42–74 Financial Statements 75–131
04Spectris plc Annual Report and Accounts 2014
Our Business Model
What we do
Enhancing productivityOur businesses focus on value-enhancing solutions for our customers. Many of these involve a focus on improving our customers’ development and manufacturing processes, with a tangible and measurable return on investment delivered by our products and services. Shortening development cycles, improving design quality, enhancing manufacturing yield, minimising input costs and improving factory productivity through automation and measurement are all typical applications of our products.
How we do it
Customer focusWe pride ourselves on building long-term business relationships. This gives us a deep understanding of our customers’ businesses and the productivity challenges they face. We work alongside our customers – often within their plants – in order to help install our products and ensure that the maximum benefits are achieved. This proximity can be the inspiration for new products and we often involve key customers in the development and testing phases.
We offer a full range of services after the initial product sale including installation, training, technical support, calibration and maintenance. Aftermarket service and support provides a resilient revenue stream and accounts for around 25% of Group sales.
InnovationWe invest around 7% of sales each year in R&D. New products serve to protect our market position and enhance organic growth by providing innovative solutions to customers’ problems. Our businesses develop appropriate strategies to protect and maximise the value of this technology. Bolt-on acquisitions provide an alternative route to new technology and many of our smaller acquisitions bring new products and the associated inventors.
High barriers to entryThe result of our focus on customers is that the relationships we develop with our customers, and the knowledge of their business processes, are a significant competitive advantage. The majority of our revenue comes from sales to customers who have purchased from us in the preceding two years. Our continuous focus on innovation means that we own a large number of patents, trademarks and intellectual property licences and processes are in place to protect and maximise the value of this proprietary technology.
Our business model is a key differentiator in the way we create value for customers and shareholders. We build long-term relationships with our customers and work closely with them to develop in-depth knowledge of their sector, business and processes and adapt our technology to meet their needs, with a specific focus on enhancing productivity. This approach is difficult to replicate and brings significant competitive advantage. As a result, we believe we have the most appropriate structure to deliver sustainable profitable growth over the long term.
Who we areThe Spectris Board and Executive team provide strategic direction, oversight and support to a number of operating companies, which are organised into four business segments according to the applications and end-user industries they serve. Each operating company is focussed on the relevant technologies, products and services for customers in their chosen markets whilst still being able to take advantage of being part of a larger organisation. Our values define how we operate and are essential to our business success. They underpin the way we work, guide our decision-making, are central to our Code of Business Ethics and shape our culture across the Group.
We have a disciplined approach to mergers and acquisitions, actively screening for bolt-on opportunities that would enhance our existing operating companies as well as for new stand-alone businesses within the Group which will provide a new platform for growth. We provide central support in certain areas such as legal, tax, HR, accounting, treasury and corporate development, as well as managing a central purchasing function and other supply chain initiatives which can be beneficial to our operating companies. We also facilitate the sharing of best practice across our businesses.
Market leadership We aspire to be leaders in the markets we serve. We focus on niche markets with high barriers to entry where our products typically involve low capital expenditure but provide significant and rapid payback for our customers and enhance their productivity.
Our businesses serve customers in the major global manufacturing industries around the world. Our model is based on direct routes to market, through a network of sales and support offices, and we derive significant revenues of nearly 30% of Group sales from high-growth emerging markets that are industrialising.
What we deliver
Sustainable growthWe deliver sustainable growth by enhancing customers’ productivity and developing strong long-term customer relationships, with organic growth supplemented by selective acquisitions.
High returnsHigh barriers to entry, generated via long-term customer relationships, strong intellectual property and continuous innovation, lead to limited pricing pressure and high gross margins.
Strong cash conversionOur businesses are capital efficient, focussing on the areas where we have market-leading expertise and competitive advantage, such as research and development, product design and assembly and testing. The majority of component and sub-assembly production is outsourced to suppliers who can deliver high quality at a competitive cost. This results in steady and strong cash conversion.
Balanced portfolioA broad spread of customers, end markets and geographies limits the risk to the Group from sudden economic or political changes in any given territory. No individual customer accounts for more than 2% and no end market more than 12% of Group revenue. See the following pages for more information on our portfolio of businesses.

Strategic Report 01–41 Governance 42–74 Financial Statements 75–131
05Spectris plc Annual Report and Accounts 2014
Who we are
Four businesssegments
Strong managementP&L ownershipSpeed and flexibilityAsset-light manufacturing
Strategy/M&AGovernanceValues and EthicsShared services
What we do
Increasing yield
Improving quality
Saving time
Streamliningprocesses
Enhancing productivity for our customers
How we do it
Innovation High barriersto entry
Market leadership
Customerfocus
Competitive advantage
What we deliver Value creation
Highreturns
Strong cashconversion
Balancedportfolio
Sustainablegrowth

Strategic Report 01–41 Governance 42–74 Financial Statements 75–131
06Spectris plc Annual Report and Accounts 2014
Our Group StructureWe have structured our organisation in the most effective way to deliver our strategy.
How we workSpectris comprises four business segments, which reflect the applications and end-user industries we serve.
Our businesses are united by the same purpose, the same values and the same corporate strategy. They all work according to a strong common framework of controls, management KPIs, financial discipline and rigorous operating principles, but each business is focussed on its own markets, customers and technologies.
Sales by end-user industry Total Group reported sales 2014
Automotive and aerospace 12%
Pharmaceuticals, fine chemicals 11%
Energy and utilities 10%
Academic research 9%
Machine building 9%
Metals, minerals and mining 9%
Semicon, telecoms, electronics 9%
Pulp, paper and tissue 8%
Other, including distribution 23%
Automotive and aerospace 12%
Pharmaceuticals, fine chemicals 11%
Energy and utilities 10%
Academic research 9%
Machine building 9%
Metals, minerals and mining 9%
Semicon, telecoms, electronics 9%
Pulp, paper and tissue 8%
Other, including distribution 23%
Sales by destination Total Group reported sales 2014
North America 33%
Europe 32%
Asia Pacific 29%
Rest of the world 6%
North America 33%
Europe 32%
Asia Pacific 29%
Rest of the world 6%
Laboratory/ off-line businessesOur solutions help customers to improve accuracy and speed of materials analysis in the laboratory, in process manufacturing and in academic research applications. We also provide test and measuring equipment and software for product design optimisation, manufacturing control, microseismic monitoring and environmental noise monitoring.
Materials AnalysisMaterials Analysis provides products and services that enable customers to determine structure, composition, quantity and quality of particles and materials, during their research and product development processes, when assessing materials before production, or during the manufacturing process.
Test and MeasurementTest and Measurement supplies test, measurement and analysis equipment, software and services for product design optimisation, manufacturing control, microseismic monitoring and environmental noise monitoring.
IndustriesMetals, minerals and mining Pharmaceuticals and fine chemicals Academic research institutes
IndustriesAutomotive Aerospace Consumer electronics Environmental noise monitoring Energy
Operating companiesMalvern Instruments Particle Measuring Systems PANalytical
Operating companiesBrüel & Kjær Sound & Vibration ESG Solutions HBM
More about Materials Analysis Page 30
More about Test and Measurement Page 32
Sales
£348.8mOperating profit
£53.3mGroup sales %
30
Group operating profit %
27
Sales
£342.9mOperating profit
£52.2mGroup sales %
29
Group operating profit %
26

Strategic Report 01–41 Governance 42–74 Financial Statements 75–131
07Spectris plc Annual Report and Accounts 2014
Sales by end-user industry Total Group reported sales 2014
Automotive and aerospace 12%
Pharmaceuticals, fine chemicals 11%
Energy and utilities 10%
Academic research 9%
Machine building 9%
Metals, minerals and mining 9%
Semicon, telecoms, electronics 9%
Pulp, paper and tissue 8%
Other, including distribution 23%
Automotive and aerospace 12%
Pharmaceuticals, fine chemicals 11%
Energy and utilities 10%
Academic research 9%
Machine building 9%
Metals, minerals and mining 9%
Semicon, telecoms, electronics 9%
Pulp, paper and tissue 8%
Other, including distribution 23%
Sales by destination Total Group reported sales 2014
North America 33%
Europe 32%
Asia Pacific 29%
Rest of the world 6%
North America 33%
Europe 32%
Asia Pacific 29%
Rest of the world 6%
Process/manufacturing businessesOur applications and services provide precision measurement and control in challenging operating environments, ensuring process quality, asset uptime, safety and improved yield. We also provide automation and control products for the general manufacturing industries.
In-line InstrumentationIn-line Instrumentation provides process analytical measurement, asset monitoring and online controls as well as associated consumables and services for both primary processing and the converting industries.
Industrial ControlsIndustrial Controls provides products and solutions that measure, monitor, control, inform, track and trace during the production process.
IndustriesProcess industries Energy and utilities Pulp, paper and tissue Converting, web and packaging
IndustriesGeneral manufacturing
Operating companiesBrüel & Kjær Vibro BTG NDC Technologies Servomex
Operating companiesMicroscan Omega Engineering Red Lion Controls
More about In-line Instrumentation Page 34
More about Industrial Controls Page 36
Sales
£261.4mOperating profit
£48.0mGroup sales %
22
Group operating profit %
24
Sales
£220.6mOperating profit
£44.6mGroup sales %
19
Group operating profit %
23
Revenue is reported. Operating profit is adjusted.

Strategic Report 01–41 Governance 42–74 Financial Statements 75–131
08Spectris plc Annual Report and Accounts 2014
Our Strategy Our objective is to deliver shareholder value sustainably over the long term by supplying productivity-enhancing solutions and services for our customers.
Our strategy comprises five specific elements, as described below. On this and the subsequent pages we have set out some of our achievements since we established this strategy seven years ago.
These icons are used throughout this report to highlight our strategy in action.
Strategy Overview
Strengthening market positions through innovation
Innovation is at the heart of our business and we invest around 7% of sales each year in research and development to maintain and strengthen our competitive advantage.
Increasing regional expansion with a focus on emerging markets
We seek to expand our businesses internationally, with particular emphasis on emerging markets such as China, India and Latin America.
Building our presence in key strategic growth areas, both organically and through acquisition
We aim to grow our existing business organically by developing new products, as well as pursuing opportunities for growth in new markets. Acquisitions are targetted in both existing and new markets.
Growing existing businesses through acquisition
We seek to enhance the growth potential of our businesses by pursuing an active but disciplined approach to acquisitions, both of smaller bolt-on businesses and larger strategic platforms. We focus on businesses which are strong players in specific application areas where there are significant barriers to entry.
Focussing on operational excellence
We focus on improving all aspects of our business through a range of actions, including process efficiencies, value pricing, optimising routes to market, cost competitiveness, designing products for low cost production, reducing inventory and improving supply chain management.

Strategic Report 01–41 Governance 42–74 Financial Statements 75–131
09Spectris plc Annual Report and Accounts 2014
Strengthening market positions through innovation
Innovation is at the heart of our business. Our understanding of our customers’ businesses and the productivity challenges they face are the drivers for our product development programmes, helping them to work better, faster and more efficiently.
2008£57.0m
2009£58.2m
2010£62.4m
2011
£75.8m
2012£85.5m
2013£88.5m 2014
£86.5m
Research and development investment
*Spending maintained during downturn
Zetasizer HelixOur investment in the development of solutions focussed on the life science sector resulted in the launch of the Zetasizer Helix in 2014. This instrument enables the study of both size and structure of proteins on a single sample, thus eliminating the risk of changes in the properties which could occur when moving the sample from one instrument to another.
QuantumXIn 2014, we launched a new capability for our existing QuantumX data acquisition system to measure the high voltages associated with electric drivetrains. This is the first system to be able to capture both electrical and mechanical properties in real time.
Further examples of new products for each of the business segments are shown in the Operating Review.
BenefitFewer test samples result in efficiency cost savings.
BenefitSpeeds up new product development process.
What we have achieved
We invest around 7% of sales each year in research and development to maintain and strengthen our competitive advantage. Examples of new products launched in 2014 are shown above and in the Operating Review on pages 30 to 37.

Strategic Report 01–41 Governance 42–74 Financial Statements 75–131
10Spectris plc Annual Report and Accounts 2014
Increasing regional expansion with a focus on emerging markets
We seek to expand our business internationally, with particular emphasis on emerging markets such as China, India and Latin America.
2008
Sales by destination
7%Rest of
*the world*
23%North
America 42%Europe
33%North
America
6%Rest of
*the world*
32%Europe
29%Asia
*Paci�c*
28%Asia
*Paci�c*
2008 2014
Group sales to emerging markets*
£202m £338m
2014
*Emerging markets is defined as Asia Pacific excluding Japan and Australia plus Rest of the world
What we have achieved
A combination of investment in the emerging economies and strategic acquisitions has resulted in a more balanced spread of markets and customers, providing greater protection against material changes in the trading environment in any given territory. Emerging markets now comprise almost 30% of Group sales.

Strategic Report 01–41 Governance 42–74 Financial Statements 75–131
11Spectris plc Annual Report and Accounts 2014
Building our presence in key strategic growth areas, both organically and through acquisition
We aim to grow our existing businesses organically by developing new products, as well as pursuing opportunities for growth in new markets. Acquisitions are targetted at both existing and new markets.
2014
Industrial Controls segment
Percentage of Group sales
Return on sales
6%
18.4%
19%
20.2%
2008
2008
2014
2014£220.6m
2008£45.7m
Expanding the segmentWe have scaled up the Industrial Controls segment by targetted acquisitions, both bolt-on and stand-alone, in order to achieve a greater balance in our business portfolio.
In 2010, we acquired N-Tron Corporation, a US-based manufacturer of ethernet switches – the products used to connect multiple ethernet devices to each other and to build network infrastructure. N-Tron’s hardware capabilities, combined with Red Lion's communications technologies, have enabled us to help meet the growing demand for connectivity on the factory floor and to build our position in the industrial controls market around the world. Red Lion’s position was further consolidated with the acquisition in 2011 of Sixnet, a leading manufacturer of automation and wireless solutions for the industrial market.
In 2011, we acquired Omega Engineering, a leading supplier of process measurement and control instrumentation to customers in industrial and academic markets.A predominantly US-centric business, we have developed Omega’s global presence since acquisition and in 2014 we launched a new operation in Japan, which completed the initial phase of our Asian expansion programme.
Sales
What we have achieved
In 2010, we made a strategic decision to invest in the expansion of the Industrial Controls segment. A series of targetted bolt-on and stand-alone acquisitions have brought new markets and platforms to this segment and increased its profitability. It is now a significant part of the Group and has the highest return on sales across our four business segments.

Strategic Report 01–41 Governance 42–74 Financial Statements 75–131
12Spectris plc Annual Report and Accounts 2014
Growing existing businesses through acquisition
We seek to grow the business portfolio through the acquisition of stand-alone or bolt-on businesses which complement or extend the range of products and applications we can provide.
Acquisitions
Expanding the Materials Analysis segmentOver the past three years, we have increased our R&D investment in the Materials Analysis segment in order to capture growth opportunities in the life science sector. To supplement this programme, and buildingoff the acquisition of Nanosight in 2013, we made two more bolt-on acquisitions in 2014: MicroCal, a leading provider of microcalorimetry instruments, and Affinity Biosensors, which includes the Archimedes instrument for measuring the density of individual particles, molecules or cells. These additions to the Materials Analysis segment further expand our portfolio of solutions across the life science market.
29Acquisitionssince 2008
What we have achieved
Since 2008 we have spent £690 million on 29 acquisitions across all our business segments and geographies. Our disciplined approach to acquisitions has meant that the businesses we acquire are quickly earnings-enhancing.

Strategic Report 01–41 Governance 42–74 Financial Statements 75–131
13Spectris plc Annual Report and Accounts 2014
Focussing on operational excellence
We focus on improving all aspects of our business through a range of actions including process efficiencies, optimising the business mix and improving supply chain management by outsourcing non-critical engineering activities.
Process efficiency
Process
People Technology
Operationalexcellence
2008 2014
13.4%11.5%
–1.9%
Materials AnalysisMalvern Instruments manufactures a range of optically-based instrumentation used for particle characterisation. Following the launch of a new product, the company decided that significant benefits could be gained by consolidating eight components of an optical sub-assembly under the responsibility of a single supplier. This is now delivered as a single component ready for final assembly into the instrument, achieving significant savings in terms of component cost and assembly and test time, and a reduction in internal processes.
Industrial ControlsMicroscan’s products are sold through a worldwide network of sales partners. The company has recently installed a web-based order management system which can be accessed via the partner portal. Around 80% of orders are now entered directlyby partners, who can also check inventory availability, lead time and order status via the site. The implementation of the system has led to significant cost savings (including redeploying some staff into greater value-add positions), improved accuracy and greater customer satisfaction.
Test and MeasurementHBM’s lean manufacturing programme has improved productivity at the Suzhou facility in China, see page 33.
In-line InstrumentationA Six Sigma initiative at Servomex resulted in a 200% increase in output for the laser product, see page 35.
What we have achieved
A focus on improving supply chain management, lean manufacturing techniques and new channels to market has enabled us to enhance our own productivity over recent years. Examples of the actions taken are described above and on pages 30 to 37 in this report.

Strategic Report 01–41 Governance 42–74 Financial Statements 75–131
14Spectris plc Annual Report and Accounts 2014
Key Performance Indicators
We monitor progress against the delivery of our strategic goals using five financial key performance indicators and two non-financial indicators. The elements of the strategy each key performance indicator measures are shown in the margin via the relevant icons.
Key performance indicator
SalesWe invest around 7% of sales each year in R&D in order to maintain our market- leading positions. Sales growth is a measure of how these investments help to grow our business organically. We aim to achieve year-on-year growth in sales, on a like-for-like basis, which excludes the effects of currency translation and acquisitions or divestments.
Organic sales growth, continuing businesses, at constant currencies %
14 2
12 3
11 15
10 12
13 0
2014 performance is described in more detail in the Financial Review. Pages 38 to 41
Return on salesReturn on sales is a measure of improving profitability in our business. Return on sales is defined as adjusted operating profit as a percentage of sales. Our intention is to achieve a mid-teens return on sales margin on average throughout the cycle.
Return on sales, continuing businesses %
14 16.9
13 17.9
12 18.4
11 18.2
10 15.8
2014 performance is described in more detail in the Financial Review. Pages 38 to 41
Earnings per shareEarnings per share is a commonly-used measure of financial performance for shareholders. We aim to achieve growth in adjusted earnings per share. Adjusted earnings per share excludes certain non-operational items as defined by management in Note 2 to the Financial Statements. Adjusted earnings per share is defined as the ratio of adjusted earnings for the year to the weighted average number of ordinary shares outstanding during the year.
Adjusted EPS pence
14 124.4
13 132.9
12 130.3
11 124.1
10 86.6
Growth %
–6 14
13 2
12 9
11 43
10 91
2014 performance is described in more detail in the Financial Review. Pages 38 to 41
Cash conversionWe focus on cash generation and use cash conversion as a performance measure as we believe cash represents an effective measure of the quality of our earnings. Our target is to deliver high cash conversion of operating profit in each financial year. Cash conversion is defined by management as adjusted operating cash flow as a percentage of adjusted operating profit.
Cash conversion %
14 89
13 86
12 94
11 89
10 112
2014 performance is described in more detail in the Financial Review. Pages 38 to 41
KPIs 1 to 4 exclude the Fusion UV business (which was sold in January 2013) in 2013 and 2012. Years prior to 2012 have not been restated.

Strategic Report 01–41 Governance 42–74 Financial Statements 75–131
15Spectris plc Annual Report and Accounts 2014
Key performance indicator
Economic profitEconomic profit is a commonly-used measure demonstrating the extent to which a company is generating a return on assets in excess of its weighted average cost of capital. We have defined economic profit as the annual result derived from deducting a capital charge (applied to average capital employed) from adjusted operating profit, aggregated over a three-year period.
Annual economic profit £m
14 67.3
13 98.5
12 125.8
11 108.2
10 66.2
Three-year aggregate economic profit £m
14 291.6
13 332.5
12 300.2
11 179.8
10 125.2
Energy consumptionEnergy efficiency makes a significant contribution to environmental sustainability and helps us to reduce our operating costs. We monitor our use of key sources of energy (electricity, gas, oil and steam) with the aim of reducing our carbon emissions and thus our environmental impact on society.
MWh per £m revenue
14 75.7
13 77.6
12 79.6
11 79.5
10 90.5
Excluding acquisitions and disposals made in the year.
Details of greenhouse gas emissions can be found in the Sustainability Report. Page 23
Accident incident rateWe are committed to being a responsible business and ensuring the health, safety and well-being of our people. We monitor how we are performing by measuring work-related accidents or ill health resulting in lost time in excess of three days.
Reportable accidents per 1,000 employees
14 4.2
13 4.4
12 4.7
11 2.7
10 5.3
Excluding acquisitions and disposals made in the year.
Non-financial KPIs are described in more detail in the Sustainability Report. Pages 21 to 27

Strategic Report 01–41 Governance 42–74 Financial Statements 75–131
16Spectris plc Annual Report and Accounts 2014
Principal Risks and Uncertainties
Our approach to risk management incorporates both bottom-up and top-down elements to the identification, evaluation and management of risks and all risks are evaluated with reference to the Group’s achievement of its strategic objectives, as outlined on page 8.
Our business units are required to undertake formal risk management reviews at least twice per year. This involves the use of a consistent framework for the assessment of significant risks with respect to impact, likelihood and the time frame in which the risk could materialise. Risks are assessed both before and after the effect of controls and mitigating actions has been taken into account.
The Group’s business units are also required to evaluate the status of a number of higher- impact risks. This ensures consideration is given to risks which may not necessarily be preoccupations when viewed from a day-to-day, operational perspective, but which may be capable of having a significant impact on operations were they to materialise.
Overall ownership for each risk, together with responsibility for all associated mitigating actions, is clearly assigned and communicated.
The resulting risk registers are then subject to review on an ongoing basis as part of regular operational reviews. This regular review of the status of risks and corresponding mitigating actions ensures that risk management is embedded in day-to-day management processes and decision-making as well as in the annual strategic planning cycle.
In addition, the Executive Directors consider those risks to the Group’s strategic objectives which are not addressed within the business units and develop appropriate approaches to managing and mitigating these.
The overall effectiveness of the Group’s risk management and mitigation processes is reviewed regularly by the Executive Directors and twice yearly by the Audit and Risk Committee.
The key potential risks and uncertainties facing the Group’s ability to deliver its strategy, together with mitigating actions, are described on the following pages. Whilst these risks are consistent with those reported in 2013, we provide an update on how these risks, and our ability to respond and manage them, have changed during 2014.
We recognise that managing risk effectively is a requirement for achieving our strategic objectives. Therefore, risk management forms an integral part of our day-to-day operations and the Group has a well-established process which delivers visibility and accountability for risk management across our businesses. This process forms part of the Group’s overall internal control framework, as described on page 50.

Strategic Report 01–41 Governance 42–74 Financial Statements 75–131
17Spectris plc Annual Report and Accounts 2014
Risk description Potential impact Mitigation 2014 update
New product developmentIn order to strengthen our market positions and sustain competitive advantage, the Group continues to make significant investment in research and development of approximately 7% of Group revenue. The development of new technologies and products necessarily involves risk, including:
• The product being more expensive or taking longer to develop than originally planned.
• The product failing to reach the commercialisation phase.
• The market for the product being smaller than originally envisaged.
• Reduced profitability and cash flow.
• Loss of market share.
• Failure to recoup investment in innovation.
• Regular strategic evaluations of product portfolios and the markets in which we compete, ensuring that our investment in new products is targetted so as to maximise the opportunity of success.
• Project management disciplines are in place across our product development programmes and audits provide assurance that these disciplines are applied consistently.
• Work closely with customers to ensure that we develop solutions tailored to their specific needs.
• Maintain customer involvement throughout the life-cycle of product development to product launch through, for example, beta evaluations.
• New product developments are based on standard platforms, customised through high added-value applications engineering.
During 2014, we conducted our annual strategy review with each operating business, involving in-depth evaluations of each business’s product roadmap against customer needs and demand. These reviews often result in targetted investment in new product platforms, upgrades to existing products and services and bolt-on acquisitions. This was again the case in 2014, which saw several important new product launches, new technologies and products acquired in both the Materials Analysis and Test and Measurement segments, and many more acquisition ideas have surfaced.
Intellectual propertyOur business is focussed on the design and manufacture of technologically advanced products and applications. Significant investment in research and development is made towards this end. As a consequence, we own and protect patents, trademarks, trade secrets, confidential information and copyright as well as exploiting intellectual property through licensing.
The risk therefore exists that our intellectual property may be infringed by third parties or that we may inadvertently infringe third-party rights.
• Reduced profitability and cash flow.
• Loss of market share.
• Failure to recoup investment in innovation.
• Policies and procedures in place requiring all of our businesses to:
– maintain a watching brief on new third-party patent applications and competitor activity;
– ensure adequate protection for key intellectual property including registration where appropriate;
– undertake specific freedom-to- operate technical reviews prior to commencing new product development, acquisitions or licences; and
– register intellectual property where appropriate.
• Maintain a portfolio of intellectual property assets such that no single patent, trade secret or trademark is sufficiently important to present a material risk to the ongoing success of the Company.
The general level of patent litigation is increasing, although this must be understood in the context of an increasing number of patents being granted.
During the year, we have taken steps to ensure that the Group’s policies and procedures (referred to opposite) have been subject to review and further strengthening. At the same time, internal training and a programme of compliance audits against these policies and procedures have been introduced.

Strategic Report 01–41 Governance 42–74 Financial Statements 75–131
18Spectris plc Annual Report and Accounts 2014
Risk description Potential impact Mitigation 2014 update
Laws and regulationsWe operate in a large number of jurisdictions and, as a consequence, we are subject to numerous domestic and international regulations and restrictions. These include laws and regulations covering product safety, export controls, anti-bribery, fair competition and false accounting.
Any failure by the Group or its representatives to comply with relevant laws and regulations could result in civil or criminal liabilities, leading to significant fines and penalties or the disqualification of the Group from participation in government-related contracts for a period of time. In the event of a failure to comply with export control regulations, the Group could also be exposed to restrictions being placed upon its ability to trade.
• Reduced sales, profitability and cash flow.
• Reputational damage.
• Diversion of management resources to address any resulting investigation.
• Inability to attract and retain talent.
• Strong culture, internal control framework and policies.
• Ethics training provided to all employees.
• Formal export controls compliance procedures in place, including strict product classification and transaction screening protocols.
The Group, like many other global businesses, continues to be exposed to an increasingly challenging governance and regulatory environment. At the same time, the Group has continued to grow its presence in territories where there is a general perception that ethical conduct risk remains higher, for example with reference to the Transparency International Corruption Perceptions Index.
During the year, the Group has continued to take a number of actions designed to further mitigate this risk. These have included increased ethics training targetting key risk topics, the roll out of a third-party due diligence programme and fair competition training to relevant employees. For more details of our ethics programme during the year see pages 28 and 29.
Political and economic risksWe operate in a range of end-user markets around the world and may be affected by political, economic or regulatory developments in any of these countries. Material adverse changes in the political and economic environments in the countries in which we operate have the potential to put at risk our ability to execute our strategy.
• Reduced profitability and cash flow.
• Maintain a broad spread of markets, products and customers to limit risks associated with any given territory.
• Monitor market intelligence so that we can respond quickly to changing trading conditions.
• Ensure we remain structured in such a way that enables us to take prompt action in the event of a material change in the trading environment.
• Ensure we maintain a strong balance sheet and financial position.
The Group has a balanced geographical mix, with similar exposure to North America, Europe and Asia Pacific/Rest of the world. During 2014, this has enabled the Group to mitigate the effects of a gradual weakening of the Eurozone economies, a slightly softer Chinese economy and economic sanctions on Russia through strong growth in North America, the UK and Japan. Similarly, our broad end-market exposure, with no single industry accounting for more than 12% of Group sales, has meant that we have been able to mitigate weak demand in certain end markets with growth in others.
Principal Risks and Uncertaintiescontinued

Strategic Report 01–41 Governance 42–74 Financial Statements 75–131
19Spectris plc Annual Report and Accounts 2014
Risk description Potential impact Mitigation 2014 update
AcquisitionsA key element of our strategy is to grow the business portfolio through the acquisition of stand-alone or bolt-on businesses which complement or extend the range of products and applications we can provide.
Integration of the operations and personnel of acquired businesses can be a complex process. Potential risks therefore exist that the planned benefits from the acquisition may not be achieved as a result of problems encountered during integration of the acquired business, incorrect assumptions made in the business case, changing market conditions, or issues which were not identified during the due diligence process. Further, the Company could be exposed to past acts or omissions of the acquired business.
• Failure to achieve the benefits outlined in the business case.
• Reduced profitability and cash flow.
• Unforeseen liabilities.
• Rigorous financial, commercial and legal assessment of target businesses involving external consultants as appropriate.
• Strict authority levels which, subject to size, involve review by the Board for such transactions.
• Comprehensive representations and warranties in purchase agreements.
• Extensive integration planning and execution.
• Regular review against the business case for the acquired businesses.
• Post-acquisition control reviews.
There has been a significant increase in acquisition activity in our marketplace during 2014 as compared to both 2012 and 2013. Whilst we have participated in this activity, making five bolt-on acquisitions and one stand-alone platform acquisition, we have been careful to maintain our rigorous financial, commercial and legal due diligence and disciplines, which has meant that we have also excluded ourselves from a number of potential deals.
Competitive activityThe nature of the markets in which we operate means that all of our businesses are exposed to risk from competitor activity.
• Loss of market share.
• Reduced profitability and cash flow.
• Ongoing monitoring of competitor activity and trends in the markets in which we compete.
• Maintain market-leading positions through strong customer relationships, significant investment in research and development and a lean operating model.
• Diversified portfolio of products and markets limits the overall risk from any single competitor.
• Maintain ability to react quickly to changes in customer and market demand.
During 2014, we have maintained a high level of investment in research and development of around 7% of Group sales, with all of our operating businesses bringing new products and solutions to market in order to sustain and strengthen our strong customer relationships and competitive advantages.
Fluctuations in exchange ratesBecause of the global nature of our business, we have operations which sell and purchase goods in foreign currencies and whose results we record in a variety of different currencies. We are therefore exposed to any significant changes in exchange rates between a variety of currencies.
• Unexpected variations in the Company’s results.
• Reduced profitability and cash flow.
• Forward contracts cover up to 75% of forecast exposures up to 18 months ahead.
• Natural hedging strategy, matching invoicing and purchasing currencies where practical.
• Foreign currency investments hedged with borrowings in the same currency wherever possible.
• Regular monitoring, including sensitivity analyses to understand the impact of exchange rate movements on the Group’s reporting.
Whilst there has been no material change to the Company’s exposure to exchange rate movements in 2014, the strengthening of Sterling relative to 2013 exchange rates has had a significant negative impact on the Group’s reporting from a translational perspective. Our transactional hedging policy has mitigated these losses to some degree, thereby reducing volatility in the Group’s reporting.

Strategic Report 01–41 Governance 42–74 Financial Statements 75–131
20Spectris plc Annual Report and Accounts 2014
Risk description Potential impact Mitigation 2014 update
Supply chain dependencies and disruptionWe are exposed to the risk that some of the components we source, particularly for custom-built items or ageing products, are provided by a single supplier and are therefore vulnerable to interruption of supply.
Our businesses also manufacture components using proprietary technologies at a number of locations. Our ability to supply products to customers could be adversely impacted by a disaster or other disruptive event at any of these sites.
Any interruption to the Company’s supplies or any related increase in costs may result in an adverse effect on the business’s financial position and future performance.
• Inability to fulfil customer orders resulting in lost sales and reputational damage.
• Increased costs reduce profitability.
• Loss of market share.
• Strategic sourcing teams source cost-effective suppliers across a range of markets whilst validating suppliers’ business processes, quality and standards.
• Alternative sources of supply actively sought to reduce dependency upon single- source suppliers.
• Safety stock levels established for critical components.
• Business continuity plans and disaster prevention measures in place for all material manufacturing locations.
• Business interruption insurance.
• Strong contract review process.
Where key dependencies exist, we have continued during 2014 to identify and qualify secondary sources of supply. We have also worked with our key electronic manufacturing suppliers to strengthen our disaster support and recovery processes.
Information securityAs with most organisations of a similar size and complexity, our businesses face both internal and external information security risks, the nature and complexity of which are constantly changing.
• Loss of sensitive information/data which could put the businesses at a serious competitive disadvantage relative to their competitors.
• Being subject to a malicious attack causing system failure, data corruption or loss, or theft of commercial or sensitive information/data.
• Our businesses employ a number of physical, logical and control measures designed to reduce the risk of a breach in information security arising.
• Our systems are monitored against unauthorised access.
• A programme of continuous improvement focussing on information security risks evaluates whether the Group’s existing controls in this area would benefit from additional strengthening.
• Employees receive online and face-to-face awareness training of information security risks and controls.
During the year, detailed threat and vulnerability information security risk assessments of the Group’s sensitive information/data have taken place at each operating company, which included a detailed review of the information security control environment. These risk and controls assessments are being benchmarked against other similar organisations such that a detailed security roadmap will be developed in 2015.
Principal Risks and Uncertaintiescontinued
Strategic Report 01–41 Governance 42–74 Financial Statements 75–131
21Spectris plc Annual Report and Accounts 2014
Sustainability Report
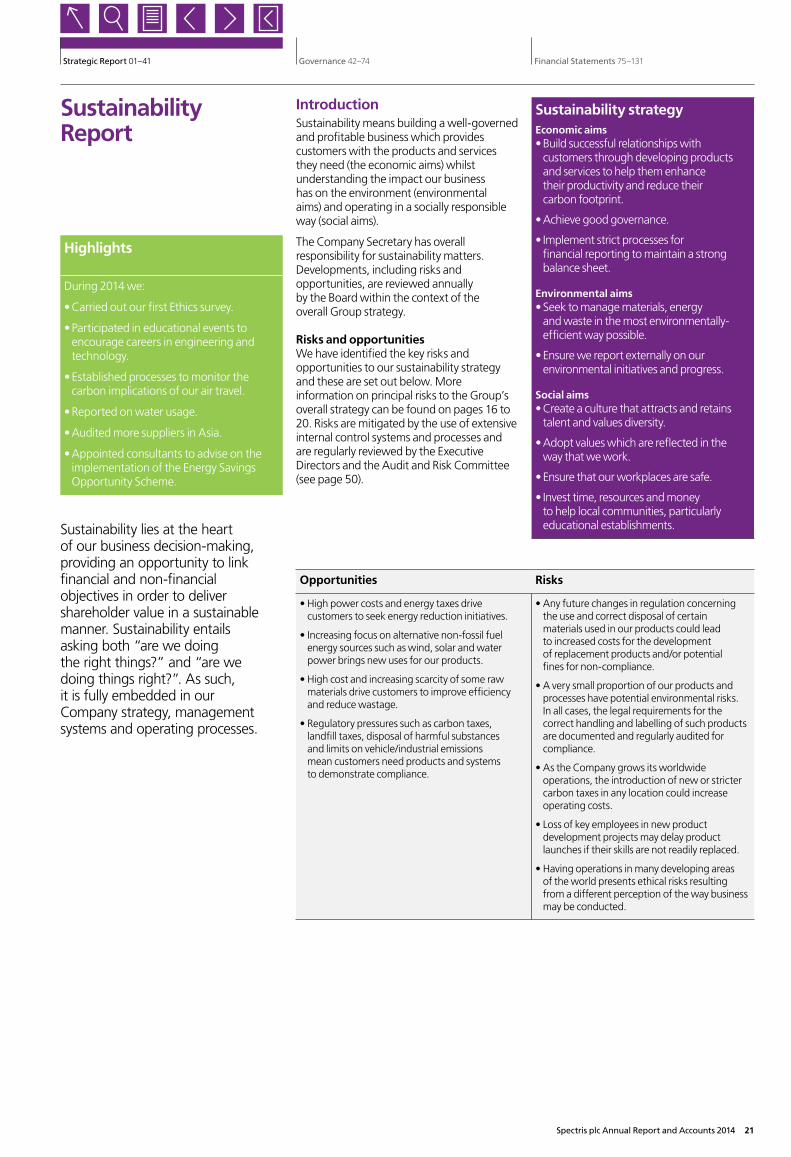
IntroductionSustainability means building a well-governed and profitable business which provides customers with the products and services they need (the economic aims) whilst understanding the impact our business has on the environment (environmental aims) and operating in a socially responsible way (social aims).
The Company Secretary has overall responsibility for sustainability matters. Developments, including risks and opportunities, are reviewed annually by the Board within the context of the overall Group strategy.
Risks and opportunitiesWe have identified the key risks and opportunities to our sustainability strategy and these are set out below. More information on principal risks to the Group’s overall strategy can be found on pages 16 to 20. Risks are mitigated by the use of extensive internal control systems and processes and are regularly reviewed by the Executive Directors and the Audit and Risk Committee (see page 50).
Highlights
During 2014 we:
•Carried out our first Ethics survey.
•Participated in educational events to encourage careers in engineering and technology.
•Established processes to monitor the carbon implications of our air travel.
•Reported on water usage.
•Audited more suppliers in Asia.
•Appointed consultants to advise on the implementation of the Energy Savings Opportunity Scheme.
Sustainability lies at the heart of our business decision-making, providing an opportunity to link financial and non-financial objectives in order to deliver shareholder value in a sustainable manner. Sustainability entails asking both “are we doing the right things?” and “are we doing things right?”. As such, it is fully embedded in our Company strategy, management systems and operating processes.
Sustainability strategyEconomic aims •Build successful relationships with customers through developing products and services to help them enhance their productivity and reduce their carbon footprint.
•Achieve good governance.
• Implement strict processes for financial reporting to maintain a strong balance sheet.
Environmental aims •Seek to manage materials, energy and waste in the most environmentally- efficient way possible.
•Ensure we report externally on our environmental initiatives and progress.
Social aims •Create a culture that attracts and retains talent and values diversity.
•Adopt values which are reflected in the way that we work.
•Ensure that our workplaces are safe.
• Invest time, resources and money to help local communities, particularly educational establishments.
Opportunities Risks
• High power costs and energy taxes drive customers to seek energy reduction initiatives.
• Increasing focus on alternative non-fossil fuel energy sources such as wind, solar and water power brings new uses for our products.
• High cost and increasing scarcity of some raw materials drive customers to improve efficiency and reduce wastage.
• Regulatory pressures such as carbon taxes, landfill taxes, disposal of harmful substances and limits on vehicle/industrial emissions mean customers need products and systems to demonstrate compliance.
• Any future changes in regulation concerning the use and correct disposal of certain materials used in our products could lead to increased costs for the development of replacement products and/or potential fines for non-compliance.
• A very small proportion of our products and processes have potential environmental risks. In all cases, the legal requirements for the correct handling and labelling of such products are documented and regularly audited for compliance.
• As the Company grows its worldwide operations, the introduction of new or stricter carbon taxes in any location could increase operating costs.
• Loss of key employees in new product development projects may delay product launches if their skills are not readily replaced.
• Having operations in many developing areas of the world presents ethical risks resulting from a different perception of the way business may be conducted.

Strategic Report 01–41 Governance 42–74 Financial Statements 75–131
22Spectris plc Annual Report and Accounts 2014
Minimising energy useIn energy-intensive industries such as cement and steel production, our materials analysis instruments help drive efficiencies, by assessing the shape and size of the raw material particles. This can generate substantial reductions in energy use and hence carbon emissions.
Another important sector for us is pulp and paper. We manufacture instruments that assess and test the quality, consistency and colour of pulp before it enters the production process, thereby reducing waste and improving quality. We also make durable high-precision ceramic blades which ensure that speciality papers and packaging receive exactly the right quantity and consistency of coating, which again reduces waste and energy use.
Internally, we are also focussed on reducing energy consumption and a key objective of the product development process is to lower the cost of operating our instruments by optimising the amount of power they require in use and on stand-by.
Cutting emissionsGovernments around the world are implementing ever stricter legislation in relation to air quality, especially in cities. Our instruments can measure the size of fuel particles, which helps to produce more efficient injection systems for vehicle engines. Our gas analysis products can measure pollutants, enabling combustion processes to be optimised, thereby reducing greenhouse gas emissions generated by industrial processes. This helps ensure compliance with environmental legislation and often forms part of certification testing. For example, power stations can save anything between 1% and 5% of their fuel costs by improving combustion efficiency, which means less energy wasted, less use of natural resources, and lower emissions.
CASe Study
Reducing raw material wastage in tissue production
Our Total Tissue Capability solution helps paper manufacturers to measure and control the tissue manufacturing process. Fibre represents about 45% of the total cost to produce a ton of tissue, so good consistency measurement and control can save a lot of money. Unscheduled downtime for production problems costs the tissue industry millions of dollars every year in lost production, product downgrade, slower operating speeds and equipment costs. Our diagnostics help the tissue producer to identify the root cause of these problems and intervene before damage is caused.
For example, on a typical premium tissue machine, a deterioration in control accuracy of as little as 0.1% can increase a mill’s fibre cost by €80,000 – €120,000 per year. This also has an impact on quality: poor fibre blending affects the softness of the tissue, downgrading a premium product to a lower value one. A typical virgin fibre tissue mill produces around 67,000 tons/year of premium and value brand tissue products. Assuming a manufacturer’s selling price of €3,700/ton for premium tissue and €2,400/ton for value tissue, if just 1% of annual production had to be downgraded for low softness, the mill would lose €870,000/year in profit.
Economic aimsThe Group’s mission is to help customers to increase yield, improve quality, save time and streamline processes. This enables a wide range of manufacturers to reduce their impact on the environment whilst improving their productivity and reducing costs.
Opportunities for business growth stem from the issues our customers are seeking to address. As a result, we continue to innovate in order to provide appropriate products and services to help our customers respond to an increasingly competitive and regulated business environment. Our direct selling model and our unique understanding of our customers’ business, together with our commitment to aftermarket service and support, result in long-standing relationships with our customers and enable us to work closely with them in the development of new products.
Contributing to a sustainable worldAt Spectris, sustainability is not just about how we do business, it is the business we are in. Our products help our clients become more sustainable, both economically and environmentally, because they are designed to improve productivity, reduce waste and save time, money and resources, including reducing power consumption. In our view, it is a virtuous circle: our products make a significant contribution to the achievement of a lower carbon world, and these products, in turn, drive our own economic success and future growth.
New products are designedto help reduce environmental
impact for customers…
…whilst helping to drive asustainable business for Spectris
Sustainability Reportcontinued

Strategic Report 01–41 Governance 42–74 Financial Statements 75–131
23Spectris plc Annual Report and Accounts 2014
Supporting renewablesWe have world-leading expertise in providing solutions for customers involved in renewable energy generation in the following areas:
Wind powerThe rotor blades are key to wind turbine performance. They need to be able to withstand vast temperature and humidity differences, and an environment susceptible to strong winds and lightning strikes. Our instrumentation is used for the design and stress testing of new materials to enable the blades to withstand these extreme conditions. In addition, as a growing number of turbines are sited offshore, it is vital that they can operate without requiring constant maintenance. We also provide systems to monitor turbine performance remotely, ensuring that they are set up correctly for optimum performance and that preventive maintenance can be scheduled where required. This minimises wear and tear, prevents damage and optimises efficiency, saving both time and money.
HydropowerAs with offshore wind, maintaining the machinery involved in hydropower facilities can be expensive and time-consuming, and small improvements in efficiency and uptime can translate into major savings. Our instrumentation can monitor turbines and generators in real time, to predict and prevent problems before they require a costly shutdown in order to be repaired.
Solar powerWe also have a presence in the solar energy sector, where our equipment helps ensure that the layers of photovoltaic film in solar panels are the correct thickness for maximum efficiency. Lighter weight and more flexible panels provide for an increased range of applications.
Environmental aimsAs well as helping our customers to reduce their impact on the environment, it is also a focus for our own efforts. Although we outsource a high proportion of product manufacturing, we still take responsibility for this and work actively with our suppliers to ensure that our products are made in a responsible manner, and meet our environmental performance standards (ISO 14001/SA 8000 assessments). We monitor the use of key sources of energy (electricity, gas, oil and steam) and water with the aim of reducing consumption throughout the Group. The tables opposite show our performance.
Energy consumption KPI MWh per £m revenue
14 75.7
13 77.6
12 79.6
11 79.5
10 90.5
Excluding acquisitions and disposals made in the year.
Water usage m3
14 160,251
Excluding acquisitions and disposals made in the year.
In 2013, we commenced the reporting of company vehicle miles and refrigerant gas loss, the data for which is reported in Scope 1 emissions in the table below. We also commenced Scope 3 reporting by establishing processes to record all air miles travelled by Company personnel during the year. Although Scope 3 reporting is not yet mandatory, we believe that it is an important area and control of air travel may be where we can make the most significant impact on the environment, after electricity. This entails a significant data collection exercise across our 190 offices around the world. Not all businesses were in a position to report a complete year’s data for company vehicle mileage, refrigerant gas loss or air miles in 2013. In 2014, a full year’s data was obtained for all Spectris businesses and, consequently, there is an increase in Scope 1 and Scope 3 emissions compared with the prior year.
Greenhouse gas emissions Tonnes CO2
2014 2013 2012
Scope 1 10,380 3,030 2,934
Scope 2 35,210 37,024 40,533
Scope 3 26,065 7,152 7,564
Total gross emissions 71,655 47,206 51,031
Total carbon emissions per £m revenue 61.98 39.27 41.46
Notes1 Emissions-releasing activities are categorised into three groups, known as scopes. These are:
Scope 1 (direct emissions): Activities owned or controlled by the company that release emissions straight into the atmosphere, for example from combustion in owned or controlled boilers, furnaces, vehicles; emissions from chemical production in owned or controlled process equipment.
Scope 2 (energy indirect): Emissions released into the atmosphere associated with the company’s consumption of purchased electricity, heat, steam and cooling.
Scope 3 (other indirect): Emissions that are a consequence of the company’s actions, which occur at sources which the company does not own or control and which are not classed as Scope 2 emissions, for example business travel, waste disposal, or purchased materials or fuels.
2 Raw Scope 1, Scope 2 and Scope 3 data is measured and reported by all Spectris’ operations worldwide. This data is converted into carbon emissions tonnes CO2e using the conversion factors from the 2014 DEFRA/DEC Guidelines for GHG Reporting.
3 Our reporting processes, and the above data derived from them, are verified by Lloyds Register Quality Assurance.
4 Excluding acquisitions and disposals made in the year.
In addition, we have reported on water usage for the first time in 2014. This data has been verified by Lloyds Register Quality Assurance.
We have also asked third-party consultants Ricardo-AEA to advise on the implementation of the Energy Savings Opportunity Scheme Regulations (‘ESOS’) which came into force in July 2014. This legislation affects significant Spectris entities in Europe and requires the mandatory identification and reporting of energy-saving opportunities by December 2015.
Although we have not set specific Group- wide targets, management incentives are in place which encourage individual operating companies to reduce their electricity and water consumption, for example, in order to improve profitability. As an example of initiatives undertaken, one of our operating companies has installed a power voltage regulator which is estimated to save up to 10% in annual electricity usage.
We also provide environmental data to the Carbon Disclosure Project, a not-for-profit organisation which collects climate change data from companies around the world and compares their disclosure and emissions reduction performance. A high disclosure score demonstrates that a company has provided detailed information about how it manages its carbon footprint. Our disclosure score of 89 out of 100 in the 2014 survey places us in the top quartile of companies in our sector and underlines our commitment to environmental accountability.

Strategic Report 01–41 Governance 42–74 Financial Statements 75–131
24Spectris plc Annual Report and Accounts 2014
Social aims
How we do businessWe have always placed a high priority on the standards by which we do business, because we believe that how we work is as important as what we do. We have a comprehensive strategy in this area and in recent years we have improved our governance processes and oversight, and enhanced our Code of Business Ethics, in order to achieve our commitment to manage our business according to the highest ethical standards. There is more on this on page 28.
Our values are pivotal to how we operate and essential to our business success and growth. They underpin the way we work, guide our decision-making and shape our culture.
Our peopleSpectris is a very specialised and technical business, and we rely on the skills and expertise of our 8,000 people, many of whom are highly qualified engineers and technicians. We have built our success on a combination of operational excellence and intelligent innovation, and we know that such innovation requires a way of working which is open, positive and respectful, and supports the development of new ideas, and the taking of reasonable and measured risks.
Diversity and equalityOurs is a diverse business, with operations at more than 190 locations throughout the world, and employees in over 30 different countries and cultures. We recruit, develop and promote our people based on their talent, commitment and achievement; everyone is treated equally and fairly whatever their race, colour, religion, national origin, gender, sexual orientation, age or background.
Our people are key to the success of our business. As such, we need a workforce based on a diverse group of talent able to provide solutions to a wide range of customers around the world. We are aware that our current employee base is not fully representative of the geographies we operate in and that the gender balance does not reflect the population as a whole, a common challenge in the engineering sector, as the following table demonstrates.
Employees by gender and role As at 31 December 2014
Male Female Total
Directors 6 2 8
Senior management1 134 25 159
Other 5,521 2,311 7,831
Total 5,661 2,338 7,998
% of total 70.8% 29.2% 100%
1 ‘Senior management’ is defined as Company employees who are Presidents or Managing Directors and their immediate (line 1) reports who are Directors or Vice-Presidents.
Excludes contractors.
CASe Study
Women in engineering
Malvern Instruments is a member of the Women’s Engineering Society (‘WES’). This UK society is a professional, not-for-profit network of women engineers, scientists and technologists working to inspire women in engineering and offer support and professional development. Members work together to encourage women to participate and achieve their potential as engineers, scientists and leaders, and inspire others to enter the field. WES collaborates with partners across the science, technology and engineering environment to demonstrate what women can achieve in so-called non-traditional jobs. Projects include the ‘National Women in Engineering Day’, aimed at raising the profile and celebrating the achievements of women in engineering, and Student Engineering Groups, building a network of women engineering students across the UK. In 2014, female engineers from Malvern Instruments attended the annual WES conference, where they gave presentations on scientific applications and hosted conference tables at the evening event.
CASe Study
Servomex achieves Planet Mark certification
In 2014, Servomex achieved The Planet Mark for their commitment to improve sustainability performance at their Technical Centre in Crowborough, England, and to engage in a programme to measure, report and improve environmental, social and related economic performance. This third-party certification, in partnership with the Eden Project, is an international recognition of high sustainability standards. The carbon footprint for the facility was calculated at 1,130 t/CO2e and in line with their environmental policy, Servomex have set a target to reduce equivalent emissions by 5% on an annual basis.
Sustainability Reportcontinued

Strategic Report 01–41 Governance 42–74 Financial Statements 75–131
25Spectris plc Annual Report and Accounts 2014
As Spectris grows, there is a need for a more structured approach to identify and promote talent across the Group, for example by ensuring that any obstacles that exist for women to progress are overcome and that talented women are assisted to fulfil their potential. To address this, we are putting in place a programme for succession planning and talent development within each of our operating businesses. This is being led from the top, with a key strategic objective set by the Board for the Chief Executive being to increase the diversity of the Group.
Another issue facing engineering companies such as Spectris is how to encourage more talented young people to pursue careers in manufacturing and engineering. Our businesses participate in various initiatives including student internships, apprenticeships, industrial placements, participation at school careers days and other events designed to raise awareness amongst school children of the opportunities to work in manufacturing and engineering.
We encourage our employees to maintain a healthy balance between their working and personal lives, and offer flexible part-time and job-share opportunities to employees with family commitments, wherever possible.
We do not tolerate discrimination or harassment in any form. Disabled persons are recruited, trained and promoted on the basis of aptitude and ability. If employees become disabled, every effort is made to retain them and, when necessary, re-train them for appropriate posts.
Training, development and compensationOur training programmes help our employees to develop both personally and professionally and reach their full potential. We carry out annual performance reviews to determine each individual’s training needs and assess their performance against the previous year’s targets. Our two principal UK businesses, Malvern Instruments and Servomex, have received the Investors in People award for their training, appraisal, employee development and skills programmes.
We work hard to build a creative working environment for our people with scope for individual responsibility and personal achievement. We seek to attract and retain the best talent and our compensation and benefits schemes are in line with other leading companies in our sector, with rewards dependent on the achievement of individual and corporate objectives. Our Savings-Related Share Option Scheme is available to all UK employees, and grants to senior management worldwide under our Performance Share Plan are designed to reward loyalty and performance.
CASe Study
Tomorrow’s engineers
In order to encourage interest in technology and engineering as a career, many of our businesses work closely with local schools and colleges to promote science to young people. HBM participates in the German ‘Girls Day’ (Mädchen-Zukunftstag) project. This annual event sees engineering companies, universities and research organisations open their doors to female school students, in order to provide an insight into science and technology professions. The open days help girls to make well-informed decisions about their future and encourage them to choose careers in science and technology. In 2014, around 30 pupils aged between 11 and 15 spent the day gaining an insight into science and engineering at HBM’s Darmstadt facility.
PANalytical participates in ‘Dutch Technology Week’, a project aimed at promoting technology and technical education to school children. PANalytical joins other high-tech companies in the region participating in numerous events held throughout the week. The children are given a tour of the X-Ray tube manufacturing factory in Eindhoven and an assignment to perform, to help them discover that technology is fun. The main event in 2014 was the High-Tech Experience where Dutch astronaut André Kuipers made a lively presentation to the young visitors.
Every November, BTG opens its doors to young people for ‘National Future Day’. This event sees youngsters spending a day at work with their parents to experience the world of work. Girls are encouraged to join their fathers and boys to join their mothers and spend the day with them in the workplace, with the aim of encouraging school children to consider professions regardless of background and gender.
At Omega Engineering’s Stamford, USA, site, the company has created a Machinist Apprentice programme in order to encourage students to develop technical capabilities in machining, tool making and related fields. This programme is a combination of classes at a local technical college, online courses and on the job training. Currently, four employees are participating in the machinist programme.

Strategic Report 01–41 Governance 42–74 Financial Statements 75–131
26Spectris plc Annual Report and Accounts 2014
We regularly conduct employee satisfaction surveys as part of an evaluation and measurement process, which also includes monitoring the rate of voluntary staff turnover in our key regions. This is compared against local data for our industry sector in order that our management teams can identify any unusual patterns and take the appropriate steps to improve employee retention.
Voluntary staff turnover % of staff leaving the Company voluntarily
total
14 5.9
13 6.0
12 5.8
11 6.9
europe
14 3.1
13 3.2
12 2.7
11 3.3
Americas
14 5.8
13 6.1
12 5.2
11 5.8
Asia Pacific
14 12.2
13 12.2
12 13.9
11 16.2
Our full employment policy is published on our website.
Human rightsOur human rights policy is consistent with the Core Conventions of the International Labor Organization, and we comply with internationally-recognised human rights standards at all our sites. The policy includes our position on non-discrimination, harassment, pay and forced labour. Human rights considerations are also included in the due diligence process we undertake before any potential acquisition. This ensures that before we acquire a business, we are fully informed of their approach in areas such as non-discrimination, equal opportunities and freedom of association. Our full human rights policy is available on our website.
Working with our supply chainWe collaborate on sustainability both up and down our value chain, working with our customers and our suppliers. We encourage our suppliers to reduce their own impact on the environment, and share our expertise to help them do that. We have strict criteria for selecting suppliers and expect them to share our principles and meet our standards.
Increasingly, our customers are asking us to provide information on how we manage our supply chain. Our strategic sourcing team members work alongside local managers to carry out regular inspections at our suppliers’ sites and we use the SA 8000:2008 Social Accountability standard to assess key suppliers against criteria such as workers’ rights, workplace conditions and health, safety and the environment. We have continued our supplier audit in the Asia Pacific region, with the suppliers audited to date representing approximately 70% of our total purchasing spend in the region in 2014. Any current suppliers who decline to undergo an audit against the standard are removed from the approved list and alternative suppliers are selected. No new suppliers are added to the approved list if they decline to undergo an audit.
Operational excellence
Health and safetyAs a responsible employer, we take the health and safety of our employees seriously. We are proud to have an excellent record of safety in our workplaces, but we remain vigilant and track our accident incident rate as a key performance indicator, with the aim of reducing this to as low a level as reasonably practical. Local health and safety managers and officers carry out regular audits and employee training and suggest improvements in working practices where appropriate in order to create a safer workplace. We are pleased to be able to report that we have not had a death or serious work-related injury for over ten years.
Accident Incident Rate KPI Reportable accidents1 per 1,000 employees
14 4.2
13 4.4
12 4.7
11 2.7
10 5.3
1 Work-related accidents or ill health resulting in lost time in excess of three days.
Excluding acquisitions and disposals made in the year.
Each of our operating companies is responsible for implementing the Group- wide health and safety policy, and for complying with any additional local regulations. Our Group policy covers our own employees, sub-contractors and – where appropriate – our suppliers. You can read the full policy on our website. All our major locations are regularly inspected by independent assessors for their compliance with health and safety policy and procedures. Any recommendations for improvements are put into practice. A number of our UK offices have achieved certification to ISO 18001 (see section on management systems and certification opposite).
Sustainability Reportcontinued

Strategic Report 01–41 Governance 42–74 Financial Statements 75–131
27Spectris plc Annual Report and Accounts 2014
Working with our communitiesCommunity involvement and decisions on charitable donations and sponsorship are undertaken by local management teams, and may vary from one company to another, depending on business and regional priorities. As described above, many of the activities we undertake are aimed at promoting science and engineering. For example, PANalytical offers the loan of its spectroscopy instruments to graduate students in an annual programme aimed at inspiring creative research projects. 12 students were selected for the 2014 programme with topics of research including climate change impacts, forest analysis with satellite imagery, forensic science and industrial polymerisation. Malvern Instruments are supporting STEMNET, a project designed to encourage young people to learn more about Science, Technology, Engineering and Mathematics. In one project, Malvern employees ran sessions on design, marketing and business planning to help local school children develop a ‘Dragon’s Den’ buggy in conjunction with local car manufacturer Morgan Motors.
Management systems and certification Over 60% of our own manufacturing operations by turnover are certified to ISO 14001:2004 for Environmental Management Systems, including our head office. The head office and our principal UK offices also have certification to OHSAS 18001 Occupational Health & Safety Management Systems.
Lloyds Register Quality Assurance (‘LRQA’)have independently verified the data associated with energy consumption, water usage, greenhouse gas (‘GHG’) emissions, voluntary staff turnover and accident incident rate. The LRQA Assurance Statement confirming terms of engagement, approach, opinion and observations is available on our website at www.spectris.com.
Looking aheadWe will continue to grow our business in a sustainable way, both by developing products and services which help our customers to reduce their impact on the environment and by looking at our own processes and those of our suppliers in order to lower our direct and indirect impact. In addition to measuring key sources of energy and GHG emissions (Scope 1 and 2), we are now monitoring the carbon implications of air travel in preparation for the likely future mandatory Scope 3 reporting requirements. We have asked Ricardo-AEA to look into emerging legislation and report on the most effective way for Spectris to respond to the increasing requirements.
Spectris remains a constituent of the FTSE4Good Index Series, the leading responsible investment benchmark. Companies in this index are regularly assessed on environment, social and governance issues.
Business ethics will remain central to the way we operate, and in 2015 we will be planning our programme based on the results of the first global ethics survey, as described in the Ethics Report on pages 28 and 29. The training and development of our own people will again be an important area in the coming year, with particular focus on developing a more diverse workforce.

Strategic Report 01–41 Governance 42–74 Financial Statements 75–131
28Spectris plc Annual Report and Accounts 2014
Ethics Report Our main areas of focus during 2014 were continuous employee engagement and training, implementation of our third-party due diligence framework for our sales channel and our first Group-wide ethics survey.
Training, engagement and supportOur engagement strategy focusses on raising awareness among employees that running our business in an ethical way makes good business sense and providing practical training to help them with ethical decision-making.
In April, a comprehensive fair competition e-learning course covering cartels and restrictive agreements, interactions with competitors and managing internal communications was launched to approximately 2,700 employees in our senior management, business development, sales, marketing, procurement, customer support, legal and contract management teams. This was followed up with ‘Train the Trainer’ sessions which reinforced learning for approximately 80 managers across the Group and equipped them to cascade training to their teams. Approximately 40% of the relevant employees had received training at the date of this report. Refresher anti-bribery workshops were held in a number of locations across the Group in May. Training is delivered in local language to aid employee understanding where necessary.
Key training events that took place during 2014 are shown in the time-line below.
We remain focussed on values and risk-based engagement and are dedicated to facilitating discussion between all employees in order to build an environment in which employees feel empowered to act according to our shared values. Our engagement and training plan will continue into 2015 and beyond and will be developed to address key risk areas that are identified.
A culture of openness and supportWe actively encourage a culture of openness, engagement and communication, so employees feel they can discuss any issues that arise in the course of their work, and raise any concerns with their managers. 93% of our employees indicated in our ethics survey that they prefer to report a violation to their supervisor. Further details of the ethics survey are set out opposite.
Our independent hotline (www.spectrishotline.com) gives our people, business partners and other third parties the ability to report concerns anonymously if they wish. All reports are followed up and investigated and the results are communicated to the Audit and Risk Committee every six months. We make a commitment to protect the careers and reputations of employees who report wrongdoing, as long as they do so in good faith and in the best interests of the Group.
During 2014, 20 reports were received via the hotline or reported to operating company or head office management. Some reports related to human resources grievances which were investigated and resolved at operating company level. Other issues related to infringements of the Code of Business Ethics and, following investigation, additional guidance, training and monitoring was made available or disciplinary action was taken as appropriate.
2014 key training events
Jan Feb Mar Apr May Jun Jul Aug Sep Oct Nov Dec
Fair competitione-learning course
Anti-bribery
refreshertraining
Fair competition ‘Train the Trainer’
face-to-face workshops
Third-party due diligence webinars and video library
Fair competition face-to-face training workshops, held at operating
company level, continuing into 2015
Ethics leadershipengagement
sessionsenior new hires
Running our business in an ethical way makes good business sense.
We believe that an ethical approach to responsible business practice is integral to achieving our business strategy, as well as being a vital element of effective risk management.
Our ethics training and engagement strategy • Values and risk-based training.
• Interactive and engaging.
• Delivery by senior and line managers.
• Face-to-face wherever feasible.
• Online modules to reinforce awareness.
• New employees, including those who join the Group following an acquisition, receive training on the Code of Business Ethics and other relevant topics within six months of joining.

Strategic Report 01–41 Governance 42–74 Financial Statements 75–131
29Spectris plc Annual Report and Accounts 2014
Senior management and employee certificationManagers are expected to demonstrate ethical leadership and are required to certify annually that they have created and fostered an open ethical culture. For certification purposes, senior management includes the Executive team, operating company Presidents as well as the regional Presidents for Asia and South America, the Finance and Administrative Head in Russia, Vice Presidents, Country Managers and Senior Sales Managers and Ethics Officers. 100% of senior managers had confirmed compliance for the year ended 31 December 2014 as at the date of this report.
All new employees certify compliance with the Code of Business Ethics upon completion of their initial ethics training.
Third-party due diligenceWe have seen good progress with the first stage of our third-party management programme, initially addressing our sales channel. Details can be found within the Audit and Risk Committee Report on page 55.
Ethics surveyWe launched our first ethics survey in October. The survey measured a number of dimensions to help us assess our ethical culture and the effectiveness of our programme. The dimensions are set out opposite.
All employees were invited to participate in the independently-run anonymous survey. Survey scores against each dimension measured are set out opposite.
Over half of our employee population participated in the survey. We are encouraged by the response rate, which we are advised is at a high level for these types of survey. The survey feedback, employee views derived from hotline reports and face-to-face training will help us continue to evolve and improve our programme.
Ethics survey dimensions
Clarity of standards The degree to which rules and procedures are concrete so that employees know what is expected of them with regard to ethical conduct.
Role modelling The degree to which management sets a good example for employees.
Enabling environment The degree to which the Company’s targets correspond to pre-determined values and norms and whether sufficient time, resources and information are available to realise responsibilities.
Support for integrity The degree to which management and employees feel motivated to actively uphold the Company’s values.
Transparency The degree to which behaviour of management and employees is visible within the organisation.
Openness to discuss dilemmas
The degree to which employees can discuss dilemmas and feel comfortable raising and addressing concerns.
Comfort to report misconduct
The degree to which employees are called to account about unethical behaviour.
Enforcement The degree to which desired behaviour is rewarded and misconduct punished and people learn from mistakes and incidents.
Ethics survey scores
90Clarity of standards
Transparencyof misconduct
Openness todiscuss dilemmas
Comfort toreport misconduct
Enforcement
Support of employeesfor integrity
Enablingenvironment
Role modelling706050403020100
80
90%100%
Clarity ofstandards
Transparencyof misconduct
Opennessto discussdilemmas
Comfort toreport
misconduct
Enforcement
Support of employeesfor integrity
Enablingenvironment
Role modelling70%60%50%40%30%20%10%0
80%

Strategic Report 01–41 Governance 42–74 Financial Statements 75–131
30Spectris plc Annual Report and Accounts 2014
Operating ReviewMaterials Analysis
Highlights
•Good growth in pharmaceutical sector.
•Weak demand in metals, minerals and mining industries.
•Flat sales to academic research sector, with good growth in H2 after weak H1.
•Four bolt-on acquisitions, bringing new technologies and customer access and supporting life science investment programme.
Sales
£348.8m LFL –3%
14 348.8
13 362.4
Operating profit
£53.3m LFL –20%
14 53.3
13 63.3
Return on sales
15.3% LFL –3.0pp
14 15.3
13 17.5
Aftersales
31%14 31
13 29
Operating companiesMalvern Instruments PANalytical Particle Measuring Systems
Group sales %
30
Group profit %
27
Like-for-like (‘LFL’) sales for Materials Analysis declined by 3% in 2014, whilst reported sales declined by 4%. Acquisitions contributed four percentage points to reported sales growth whilst foreign currency exchange movements adversely impacted reported sales growth by five percentage points. The LFL sales decline primarily reflected weakness in the metals, minerals and mining industries and first-half weakness in the academic research sector, partially offset by sales growth in the pharmaceutical and semiconductor sectors. Operating profit and operating margins declined on a LFL basis, reflecting low sales, adverse product and geographic mix and costs incurred in relation to new product launches in the life science sector.
Sales to the pharmaceutical sector increased, driven by growing demand from biopharmaceutical and generic drug manufacturers, particularly in North America, though Asia and Europe also grew. There remain significant opportunities in the biopharmaceutical industry, which is already growing strongly and has around 5,000 biotherapeutics drugs in development. During 2014, we continued our investment in the development of solutions focussed on this industry, launching a number of new platforms, including the Zetasizer Helix, which can be used to characterise protein size and structure. Additionally, we completed the acquisitions of MicroCal™ and the trade and assets of Affinity Biosensors. MicroCal is a leading provider of microcalorimetry instruments for material research with particular applications in biomolecular applications, whilst with Affinity Biosensors we obtained the Archimedes™ instrument, which accurately measures the density of individual particles, molecules and cells. Combined with the acquisition of NanoSight in September 2013, these additions to the Materials Analysis segment enhance our existing portfolio of solutions across the life science market.
The metals, minerals and mining sector was challenging in 2014, notably in China, Australia and Indonesia where there was a significant decline in new commodity-related infrastructure investment as customers focussed on improving their returns on existing investments in the face of slowing global commodity demand. In addition, many large projects in China were postponed or subject to extended tendering processes and other delays. We continued to develop new products and applications for this market, launching the upgraded X-Ray Fluorescence (‘XRF’) benchtop system, the Epsilon 3x. We have been pleased with the initial customer response to this system, and indeed to our entire portfolio of benchtop systems, particularly within the North American market. In June, we acquired La Corporation
Scientifique Claisse, thereby enhancing our presence within the XRF sample preparation market, primarily for mining, pharmaceutical and industrial applications, whilst also increasing our sales of consumables used for sample preparation to customers in this market. The integration of this business is progressing well.
Sales to academic research institutes were broadly flat, as the decline experienced in the first half was offset by good growth in the second half. After a weak first half, sales to Chinese universities grew strongly in the second half, benefitting from environmental projects to improve river water quality and energy storage across China. There was also good growth from the UK academic sector in the second half.
Demand in the semiconductor sector improved as the year progressed, reflecting more favourable market conditions and an increased rate of new product introductions. The acquisition of our distributor in South Korea during the second half of 2014 also contributed to our growth in this sector.
Segment outlookAfter three consecutive quarters of sales decline, this segment returned to growth in the fourth quarter and we expect to show good progress in 2015, boosted by new product launches and the acquisitions made in the past 18 months. Continued investment in new products should deliver progress in the pharmaceutical, life science and semiconductor sectors, albeit we expect slower growth in the Chinese (small molecule) pharmaceutical market as compliance with new regulations, which generated good growth in 2013 and early 2014, has now been achieved. We expect the academic research market to remain subdued given public sector budget constraints. Demand from the metals, minerals and mining sector is expected to remain low in 2015; while there are some early signs that demand is stabilising, the timing of any recovery remains uncertain.

Strategic Report 01–41 Governance 42–74 Financial Statements 75–131
31Spectris plc Annual Report and Accounts 2014
C N O
In February, PANalytical launched the upgraded X-Ray Fluorescence benchtop system, the Epsilon 3x. This highly flexible analytical tool is simple to operate and requires little or no sample preparation. It is suitable for applications in a wide range of industries such as cement production, mineral analysis and polymer production and provides customers with fast and accurate quality control analysis.
Strengthening market positionsthrough innovation
To supplement our increased R&D programme in this segment, Malvern Instruments made two bolt-on acquisitions in July (MicroCal and Affinity Biosensors), which further expand our portfolio of solutions across the life science market. These are described in more detail opposite.
In September, Particle Measuring Systems acquired the trade and assets of Sudo Premium Engineering (‘Sudo’), its exclusive distributor in South Korea and the market leader for environmental monitoring in the South Korean electronics sector. The acquisition gives ParticleMeasuring Systems direct access to key customers, offering direct sales, technical support and product service from Sudo’s facility.
Building our presence in key strategic growth areas, both organically and through acquisition
Increasing regional expansion with a focus on emerging markets

Strategic Report 01–41 Governance 42–74 Financial Statements 75–131
32Spectris plc Annual Report and Accounts 2014
Like-for-like (‘LFL’) sales for Test and Measurement increased by 4% in 2014. Reported sales declined by 2% due to a six percentage point adverse impact from foreign currency exchange movements. LFL operating profit improved by 1% and operating margins decreased by 0.5 percentage points to 15.2%, primarily reflecting investments in our engineering software business and IT infrastructure together with higher personnel costs.
There was good growth in the automotive sector, particularly in North America and Japan. Growth is being driven not only by the investment cycles of the large automotive manufacturers but also rising demand from the industry to understand the noise and vibration characteristics of vehicles and engines in order to gain competitive advantages and meet legislative requirements. The industry also continues to invest in hybrid and full electric vehicles, including in China where clean energy is a priority for the government. During 2014, we launched important new products targetted at this market, such as the MX403B amplifier, the latest member of HBM’s QuantumX family of systems, which measures the high voltages associated with electric car batteries, and the SomatXR data acquisition system. Both have been well received to date.
Whilst overall demand levels from the aerospace market remain solid, sales declined in 2014 following some particularly large shipments in 2013 and a second-half decline in sales to Russia. As aerospace companies continue to focus on designing the next generation of lighter and more fuel-efficient aircraft, we launched new modules for our data analysis software which enable fatigue testing of new carbon fibre composite materials. We also purchased an optical sensors business during the fourth quarter, a bolt-on technology acquisition that will allow HBM to accelerate its growth in optical measurement and monitoring solutions for a wide range of applications, including new material development and power systems within the aerospace, automotive and power industries. We saw significant declines in the defence and space market in 2014, particularly in the second half when the imposition of economic sanctions on Russia meant we were unable to export our vibration test systems for communications satellites to this market. In addition, defence budgets have been constrained in most developed markets.
We saw continued strong growth in demand for our engineering software solutions in 2014. Customers are increasingly using software to enhance their productivity by converting engineering and process data into information that enables them to improve the quality, reliability and durability of their products, equipment and processes.
In January 2015, we acquired ReliaSoft, a reliability engineering software business that will strengthen and extend our existing software applications offering.
Sales to the consumer electronics market were strong throughout the year, benefitting from large projects in North America and China as customers seek to enhance the audio quality on their electronic devices. We see opportunities to grow in this market by providing calibration services, thereby increasing the resilience of our revenues in a sector where sales patterns are often lumpy, driven by large customer projects.
We continued to develop our environmental noise monitoring business during the year, launching a service called Noise Sentinel on Demand aimed at construction and industrial markets. This service requires no capital outlay and is low cost and simple to use, enabling clients to focus on data interpretation and providing advice to their own customers.
In December, we added a third operating company to this segment following our acquisition of ESG Solutions (‘ESG’). ESG is a leader in the niche market for the provision of microseismic monitoring equipment and analysis solutions, and its technology enables oil and gas and mining companies to enhance their productivity and improve their return on investment.
Segment outlookWe expect further progress in 2015, benefitting from our acquisitions and robust market conditions in the automotive, aerospace and consumer electronics sectors. We see increased opportunities for software applications to support innovation in vehicle design and engine technologies, with our new solutions such as PULSE Reflex targetted at these opportunities. We expect growing demand for measurement equipment to test new composite materials used in automotive and aircraft frames. The consumer electronics market remains attractive with good opportunities for our sound quality testing applications, although a repeat of the large projects in 2014 may not materialise. Near-term market conditions in the oil and gas and mining industries are uncertain; however, there are good prospects for the increased adoption of microseismic monitoring solutions in these markets over the coming years. The space market is likely to remain subdued whilst economic sanctions against Russia remain in place, and defence spending will also be constrained by continued pressure on government finances.
Highlights
•Good growth in automotive market.
•Lower sales to aerospace sector, reflecting strong comparators and lower sales to Russia.
•Strong demand from consumer electronics market.
•ESG Solutions acquisition creates new strategic growth platform in microseismic monitoring.
Sales
£342.9m LFL +4%
14 342.9
13 348.7
Operating profit
£52.2m LFL +1%
14 52.2
13 54.8
Return on sales
15.2% LFL –0.5pp
14 15.2
13 15.7
Aftersales
20%14 20
13 21
Operating companiesBrüel & Kjær Sound & Vibration ESG Solutions HBM
Group sales %
29
Group profit %
26
Operating ReviewTest and Measurement

Strategic Report 01–41 Governance 42–74 Financial Statements 75–131
33Spectris plc Annual Report and Accounts 2014
Brüel & Kjær’s new lightweight Portable Impedance Meter System measures the acoustic properties of the materials used to help reduce noise from aircraft engines. This helps manufacturers to develop quieter aircraft in order to meet increasing environmental noise regulations.
Strengthening market positionsthrough innovation
HBM’s lean manufacturing programme, ProHBM, is driving productivity at the Suzhou facility in China. The programme was implemented to improve efficiency as costs increase throughout China. One initiative involved redesigning the production cell system so that all assembly, quality inspection and final packaging is integrated into a single work station. This has resulted in a 50% reduction in the cycle time for each load cell manufactured.
In December 2014, we acquired ESG. ESG’s technology enables its customers, who are primarily in the oil and gas and mining sectors, to optimise production and improve their return on investment. ESG will benefit from sharing capabilities in sensors, software, data acquisition hardware and analytical software with the other businesses in this segment, and we believe that there is a significant opportunity to strengthen ESG’s market position, expand internationally and accelerate its growth, both organically and via further acquisitions.
Building our presence in key strategic growth areas, both organically and through acquisition
Focussing on operational excellence

Strategic Report 01–41 Governance 42–74 Financial Statements 75–131
34Spectris plc Annual Report and Accounts 2014
Like-for-like (‘LFL’) sales for In-line Instrumentation increased by 3% in 2014 but, after adjusting for a five percentage point adverse impact from foreign currency exchange movements, reported sales declined by 2%. Operating margins for the year were down by 1.2 percentage points on a LFL basis, reflecting adverse product mix, primarily in our pulp and paper business.
In the energy and utilities market, sales were up significantly in 2014 with strong demand in China, driven particularly by legislation to reduce emissions, and good growth from the downstream petrochemical markets in North America and the Middle East. We have launched a new laser gas analyser to this sector, announced in the second half of 2014. This product is smaller and lighter than other products in the market, resulting in a significantly easier and lower cost installation for customers. In India, we benefitted from the continued expansion of one of the world’s largest petrochemical producers, Reliance Industries, with substantial orders received for our gas analysis products. We also received a major contract from EDP Renewables (‘EDPR’) North America for the supply and retrofit installation of condition monitoring systems on several hundred wind turbines of different OEM brands in the US, together with the adoption of VibroSuite, our monitoring and surveillance software, into EDPR’s systems.
In the first half of 2014, we decided to merge NDC and Beta LaserMike in order to enhance our competitive positioning in the converting, web and packaging industries. With combined specialised know-how, the new company, renamed NDC Technologies, provides customers with a broader product offering with state-of-the-art technologies. We expect that NDC Technologies will be able to increase sales penetration to a number of markets, and the integration of these businesses is progressing well. During 2014, sales to the converting, web and packaging industries showed strong growth, particularly in Europe and Asia, benefitting from new solutions such as the AccuScan 6012 gauge, the industry’s first four-axis diameter and ovality gauge for measuring products up to 12mm.
Sales to the pulp and paper markets declined compared to 2013, as market conditions triggered mill closures, curtailments and de-stocking activity. While sales of our products for tissue applications grew strongly during the year, especially in North America, this was insufficient to offset lower demand for graphic coated paper, particularly in China and Europe. Trading conditions in China were also negatively impacted by project delays and increased price competition. Despite these difficult market conditions we are maintaining our focus on innovation to increase our customers’ productivity, launching products such as the PROTO UF tungsten carbide coating blade to enhance our market position.
Segment outlookOverall, we expect further progress from this segment in 2015. Whilst near-term trading conditions in the coated paper market are likely to remain challenging, we see good opportunities in the tissue industry for consumable products such as our creping blades, as well as for our process control instruments, as manufacturers continue to seek to improve their productivity. We see good medium-term growth potential across the energy and utilities sector, albeit the near-term outlook for the energy market is uncertain. We have a strong pipeline of new products and solutions to target this sector in 2015 and beyond. In the converting, web and packaging industries, new food safety regulations in the US provide good growth opportunities, whilst we also expect to see incremental benefits from the creation of the new operating company NDC Technologies.
Highlights
•Sales increased significantly in energy and utilities sector.
•Sales to pulp and paper market declined, with growth in tissue applications offset by weakness in coated paper.
•Creation of NDC Technologies will enhance our competitive positioning in converting, web and packaging industries, markets where there was good sales growth in 2014.
Sales
£261.4m LFL +3%
14 261.4
13 265.7
Operating profit
£48.0m LFL –3%
14 48.0
13 51.2
Return on sales
18.4% LFL –1.2pp
14 18.4
13 19.3
Aftersales
41%
14 41
13 43
Operating companiesBrüel & Kjær Vibro BTG Group NDC Technologies Servomex
Group sales %
22
Group profit %
24
Operating ReviewIn-line Instrumentation

Strategic Report 01–41 Governance 42–74 Financial Statements 75–131
35Spectris plc Annual Report and Accounts 2014
Brüel & Kjær Vibro’s latest compact portable monitoring instrument line, the VIBROTEST/VIBROPORT 80, is more powerful, intelligent and lighter than its predecessor. These handheld vibration measurement tools play an important role in predicting where faults may occur, thus preventing damage to machinery and avoiding unscheduled downtime.
Strengthening market positionsthrough innovation
In November, NDC Technologies launched the AccuScan 6012 gauge, the industry’s first four-axis gauge for measuring products up to 12mm. Featuring a 25% improvement in flaw detection accuracy compared with conventional three-axis gauges, and up to 100% ovality accuracy, manufacturers of extruded products such as medical tubing and high-performance cable can control product quality even more reliably and reduce wastage. Producing any medical tubing product with an ‘out-of-tolerance’ diameter or roundness affects the performance of life-critical devices such as catheters, with the result that the unusable product ends up being scrapped, increasing manufacturing costs.
Strengthening market positionsthrough innovation
Servomex’s Business System, based around the principles of lean manufacturing and Six Sigma, encourages individuals and teams to identify and drive improvement. An anticipated increase in demand for the laser product line posed a significant challenge for the laser manufacturing team, who were already working at full capacity. Having reviewed the existing process, brainstormed ideas and trialled new initiatives, the team managed to increase output by over 200% within two months, creating headroom above demand without adding headcount.
Focussing on operationalexcellence
200%

Strategic Report 01–41 Governance 42–74 Financial Statements 75–131
36Spectris plc Annual Report and Accounts 2014
Like-for-like (‘LFL’) sales for Industrial Controls increased by 5% in 2014 but, after adjusting for a five percentage point adverse impact from foreign currency exchange movements, reported sales were flat. LFL operating profit grew by 3% and operating margins remained above 20%, though they were down 0.4 percentage points on a LFL basis as a result of continued investment in the expansion of Omega Engineering (‘Omega’) and intellectual property-related legal costs.
Investment in the geographic expansion of Omega is starting to show results with good sales performance in 2014, particularly in Asia. The opening of Omega’s Japan office in January 2014 completed the initial phase of our Asian expansion programme. Since then we have further strengthened our presence in Europe and Asia through additional investment in digital marketing, development of sales staff and local operational capabilities in these regions. In the latter part of 2014, we launched a new ERP system across Omega’s global organisation. This will greatly enhance Omega’s back-office processes and give faster and improved insight into daily orders and sales. During 2014, we also increased the number of new product introductions, both through private label products and internal development. For example, in late 2014 a new wireless transmitter and Omega app was released which allows customers to use their smartphones or tablets as a data logger for temperature, pH and humidity.
This segment saw particularly strong growth in 2014 from sales into the supply chain supporting the North American oil and gas sector, where our Graphite™ series of display panels has developed a good position in the fuel distribution market. These displays are rugged and robust and provide an interface for operators to communicate and control
fuel tank pumping activity to a central server. We are seeing many customers use the Graphite series on their tanks as part of their digital oilfield initiative and we are expanding our production facilities for this business to increase capacity and take advantage of growing demand. We also launched a number of new products to strengthen our industrial networking and factory automation offerings. These included the N-Tron Gigabit Power over Ethernet Plus injector, which allows factories and other industrial sites to add new technology without disrupting existing networks.
Sales growth for our track, trace and control products improved as the year progressed. This reflected easier comparator figures in the second half, together with increased activity from our major electronics customers and the successful launch in mid-2014 of AutoVISION 3.0, our latest intuitive and easy-to-use machine vision solution that automates tasks such as inspection, gauging and counting, and reads barcodes and optical characters.
Segment outlookWe expect to see further growth in this segment in the coming year and beyond. We will continue to leverage our investment in Omega and increase our emphasis on new product development and innovation. The need for our customers to improve productivity and efficiency is expected to result in increased demand for factory automation and industrial networking products, particularly in China where there is a drive to improve the return on previous capital investments.
Highlights
•Geographic expansion of Omega business delivering good results.
•Significant orders received for our HMI and networking products.
•Good demand for track, trace and control products as contract electronics manufacturers scale up facilities for new product launches.
Sales
£220.6m LFL +5%
14 220.6
13 221.0
Operating profit
£44.6m LFL +3%
14 44.6
13 45.4
Return on sales
20.2% LFL –0.4pp
14 20.2
13 20.6
Aftersales
1%14 1
13 3
Operating companiesMicroscan Omega Engineering Red Lion Controls
Group sales %
19
Group profit %
23
Operating ReviewIndustrial Controls

Strategic Report 01–41 Governance 42–74 Financial Statements 75–131
37Spectris plc Annual Report and Accounts 2014
Microscan’s new CloudLink interface enables users to monitor product barcode inspections performed by its AutoVISION software and smart cameras remotely. This easily customisable machine vision tool improves productivity by allowing the userto see the results immediately on any web-enabled device such as PCs, tablets and smartphones.
Strengthening market positionsthrough innovation
Red Lion Controls has added the N-Tron Series Gigabit Power over Ethernet Plus injectors to its portfolio of industrial networking solutions. These compact injectors are ideal for space-constrained applications and deliver both power and data over a single ethernet cable, thus eliminating the need for additional power cables. Gigabit ethernet is becoming the standard in industrial networking, and these products are particularly suitable for video security and other applications requiring high-speed communications.
Strengthening market positionsthrough innovation
In September 2011, we acquired the Omega Engineering business, a leading supplier of process measurement and control instrumentation to customers in industrial and academic markets. Since the acquisition, we have expanded Omega’s presence from a predominantly US-centric business to a more global customer base, with a particular focus on emerging markets.
Increasing regional expansion witha focus on emerging markets Opened
in Japan

Strategic Report 01–41 Governance 42–74 Financial Statements 75–131
38Spectris plc Annual Report and Accounts 2014
IntroductionSpectris uses adjusted figures as key performance measures in addition to those reported under adopted IFRS, as management believe these measures enable them to assess the underlying trading performance of the businesses. Adjusted figures exclude certain non-operational items which management has defined in Note 2 of the Financial Statements. Unless otherwise stated, figures quoted for operating profit, net interest, profit before tax, tax, earnings per share and operating cash flow are adjusted measures. In addition, all adjusted income statement and operating cash flow measures for 2013 have been restated to exclude the trading results and impact of the disposal of the Fusion UV business which was sold on 31 January 2013.
Operating performanceReported sales were down 2.0% to £1,173.7 million (2013: £1,197.8 million). The year-on-year contribution to sales from acquisitions was £17.6 million (+1.5%), but this was offset by adverse foreign exchange movements of £63.6 million (–5.3%) arising from the strengthening of Sterling against the major currencies. As a result, on an organic constant currency like-for-like (‘LFL’) basis, sales increased by 1.8% compared to 2013.
Gross margins were 0.5 percentage points lower than the prior year at 57.6% of sales. Excluding adverse foreign exchange movements (0.2 percentage points) and acquisitions (0.1 percentage points), LFL gross margins declined by 0.8 percentage points. Although our margins benefitted from slightly improved pricing and our ongoing procurement initiatives, with 17% (2013: 15%) of our material now sourced from low-cost countries, these only partly mitigated the effects of an adverse sales mix, particularly within the Materials Analysis and In-line Instrumentation segments.
During the year, we continued to invest in our key strategic organic growth initiatives. We increased LFL R&D spend by 1.6%, investing in product development in sectors such as life science, and the geographic expansion of the Omega Engineering business continued. In addition, we merged two of our operating companies in the In-line Instrumentation segment, NDC and Beta LaserMike, into a newly-formed company renamed NDC Technologies. We will start to see the benefits from this merger in 2015.
The impact of the lower gross margin, combined with the investment in the strategic growth initiatives outlined above, as well as anticipated headcount increases and overhead cost inflation, all resulted in operating profit decreasing by 7.7% from £214.7 million in 2013 to £198.1 million in 2014. Acquisitions contributed 2.0% to operating profit and foreign currency exchange movements had an adverse impact of 4.0%, with the result that LFL operating profit declined by 5.7% for the year. The operating margin decreased by 1.0 percentage point from 17.9% in 2013 to 16.9% in 2014, and decreased by 1.3 percentage points on a LFL basis.
Net finance costs for the year decreased by £3.5 million to £5.6 million (2013: £9.1 million) as a result of the Group’s continued strong operating cash generation (operating cash flow conversion of 89% compared with 86% in 2013), lower average net debt level for 2014 (approximately £27 million lower than in 2013) and lower interest rates. Following the successful re-financing of the higher margin US private placement debt in October 2013, the Group re-financed its main $550 million revolving credit facility in October 2014 on more favourable terms, resulting in a reduction in the Group’s weighted average interest rate on debt.
Reported sales decreased by 2.0% to £1,173.7 million. Like-for-like sales increased by 1.8%. Adjusted operating profit decreased by 7.7% to £198.1 million, with a decrease of 5.7% on a like-for-like basis.
Like-for-like 2014 2013 change change1
Sales (£m) 1,173.7 1,197.8 –2.0% 1.8% Adjusted operating profit (£m) 198.1 214.7 –7.7% –5.7% Operating margin (%) 16.9 17.9 –1.0pp –1.3pp
Statutory2 Sales (£m) 1,173.7 1,202.0 –2.4% Operating profit (£m) 168.3 185.9 –9.5% Operating margin (%) 14.3 15.5 –1.2pp
1 At constant exchange rates and excluding acquisitions.
2 The statutory figures include the results of the Fusion UV business which was disposed of on 31 January 2013.
Financial Review
Clive WatsonGroup Finance Director

Strategic Report 01–41 Governance 42–74 Financial Statements 75–131
39Spectris plc Annual Report and Accounts 2014
Profit before tax decreased by 6.4% from £205.6 million to £192.5 million.
Statutory operating profit, after including acquisition-related intangible asset amortisation of £25.9 million (2013: £28.9 million) and net acquisition-related costs and fair value adjustments of £3.9 million (2013: £0.7 million), decreased by 9.5% from £185.9 million to £168.3 million.
Statutory profit before tax decreased by 37% from £271.7 million in 2013 to £171.1 million in 2014, reflecting the profit recognised on the disposal of Fusion of £98.3 million in 2013.
The reconciliation of statutory to adjusted measures is shown in the table above.
AcquisitionsThe Group completed six acquisitions during 2014, five of which closed in the second half of the year. The total cost of acquisitions in the year was £103.8 million (2013: £17.7 million), including £0.9 million (2013: £1.8 million) for cash acquired. Included in the total cost of acquisitions is an amount of £11.6 million (2013: £0.5 million) attributable to the fair value of deferred and contingent consideration which is expected to be paid in future years. In addition, a net £0.3 million (2013: £1.5 million) was paid in respect of prior year acquisitions, making the net cash outflow in the year £91.6 million (2013: £16.9 million). Furthermore, an amount of £2.5 million (2013: £1.3 million) was spent on acquisition-related legal and professional fees, which makes the total acquisition-related cash outflow for the year £94.1 million (2013: £18.2 million). Acquisitions contributed £17.6 million (2013: £8.7 million) of incremental sales and £4.4 million (2013: £0.4 million) of incremental operating profit during the year.
TaxationThe effective tax rate on adjusted profit before tax was 23.2% (2013: 23.6%), a decrease of 0.4 percentage points, mainly due to a reduction in the weighted average statutory tax rate on adjusted profits and additional research and development-related tax incentives. On a statutory basis, the effective tax rate of 21.0% (2013: 26.4%, due to the tax paid and profit recognised from the disposal of the Fusion UV business) continues to be below the weighted average statutory tax rate of 28.1% (2013: 30.9%), primarily as a consequence of research and development-related tax incentives and a tax-efficient financing structure.
Earnings per shareEarnings per share decreased by 6.4% from 132.9p to 124.4p, reflecting the net impact of the 6.4% decrease in profit before tax, the reduction in our effective tax rate and the increase in the weighted average number of shares from 118.2 million in 2013 to 118.8 million in 2014.
Statutory basic earnings per share decreased by 32.8% from 169.2p to 113.7p. The difference between the two measures is shown in the table below.
2014 2013 Earnings per share Pence Pence
Statutory basic earnings per share 113.7 169.2 Amortisation of acquisition-related intangible assets 21.8 24.4 Net acquisition-related costs and fair value adjustments 3.3 0.6 Profit on disposal of businesses (2.0) (83.2) Increase in fair value of cross-currency interest rate swaps – (0.6) Net (gain)/loss on retranslation of short-term inter-company loan balances (5.1) 3.5 Tax effect of the above and other non-recurring items (7.3) 19.4 Divested businesses – (0.4)
Adjusted earnings per share 124.4 132.9
2014 2013
IFRS Spectris IFRS Spectris (Statutory) Adjustments adjusted (Statutory) Adjustments 1 adjusted Reconciliation of statutory and adjusted measures £m £m £m £m £m £m
Sales 1,173.7 – 1,173.7 1,202.0 (4.2) 1,197.8 Gross margin 676.4 – 676.4 697.6 (2.1) 695.5 Operating profit before acquisition-related items 198.1 – 198.1 215.5 (0.8) 214.7 Amortisation of acquisition-related intangibles (25.9) 25.9 – (28.9) 28.9 – Net acquisition-related costs and fair value adjustments (3.9) 3.9 – (0.7) 0.7 –
Operating profit 168.3 29.8 198.1 185.9 28.8 214.7 Profit on disposal of businesses 2.4 (2.4) – 98.3 (98.3) – Increase in fair value of cross-currency interest rate swaps – – – 0.7 (0.7) – Net gain/(loss) on retranslation of short-term inter-company loan balances 6.0 (6.0) – (4.1) 4.1 – Net bank interest payable (5.4) – (5.4) (8.6) – (8.6) Net IAS 19 (Revised) finance income (0.1) – (0.1) (0.2) – (0.2) Other finance costs (0.1) – (0.1) (0.3) – (0.3)
Profit before tax 171.1 21.4 192.5 271.7 (66.1) 205.6
1 Adjustments to sales, gross margin and operating profit before acquisition-related items represent the results of the Fusion UV business.

Strategic Report 01–41 Governance 42–74 Financial Statements 75–131
40Spectris plc Annual Report and Accounts 2014
Cash flow 2014 2013 Cash flow £m £m
Operating cash flow Operating profit 198.1 214.7 Depreciation and software amortisation 21.7 21.6 Working capital and other movements (16.7) (17.2) Capital expenditure (27.4) (31.7)
Operating cash flow 175.7 187.4
Operating cash flow conversion 89% 86%
Non-operating cash flow Tax paid (43.0) (64.1) Net interest paid (6.3) (9.4) Dividends paid (52.3) (47.7) Acquisition of businesses, net of cash (91.6) (16.9) Acquisition-related costs (2.5) (1.3) Disposals – 106.0 Exercise of share options 0.3 0.3 Foreign exchange (1.8) (4.3)
Total non-operating cash flow (197.2) (37.4)
Operating cash flow 175.7 187.4
Movement in net debt (21.5) 150.0
Average trade working capital, expressed as a percentage of sales, increased to 13.3% (2013: 11.5%), a 1.8 percentage point increase. The year-end trade working capital to sales ratio increased to 15.3% from 12.7% in 2013, a 2.6 percentage point increase, of which 0.8 percentage points relates to acquisitions. Excluding acquisitions, the increase in working capital arose primarily within the Materials Analysis segment, due to higher inventory levels for new product launches and service, and the In-line Instrumentation segment, where higher inventory levels were maintained at the end of the year to meet customer demand, together with a higher level of receivables in all segments arising from the phasing of sales.
Capital expenditure during the year equated to 2.3% of sales (2013: 2.6%) and, at £27.4 million (2013: £31.7 million), was 126% of depreciation and software amortisation (2013: 147%), due to ongoing investments in infrastructure projects in the Netherlands and a new ERP system for Omega Engineering.
Overall, net debt increased by £21.5 million (2013: decrease of £150.0 million) from £104.1 million to £125.6 million. Net interest costs, excluding the financing charge arising from IAS 19 (Revised), were covered by operating profit 36.7 times (2013: 25.0 times).
Financing and treasury The Group finances its operations from both retained earnings and third-party borrowings, with the majority of year-end net debt being at fixed rates of interest.
As at 31 December 2014, the Group had £475 million of committed facilities denominated in different currencies, consisting of a five-year £48 million term loan maturing in September 2015, a five-year £353 million revolving credit facility maturing in October 2019, and a seven-year £74 million term loan maturing in October 2020. £317 million of the revolving credit facility was undrawn at the year end. In addition, the Group had a cash balance of £35 million and other uncommitted facilities, mainly in the form of overdraft facilities at local operations.
At the year end, the Group’s borrowings amounted to £160 million, 76% of which was at fixed interest rates (2013: 84%). The ageing profile at the year end showed that 32% of year-end borrowings are due to mature within one year (2013: 1%), 0% between one and two years (2013: 31%), 22% between two and five years (2013: 14%) and 46% in greater than five years (2013: 54%).
CurrencyThe Group has both translational and transactional currency exposures. Translational exposures arise on the consolidation of overseas company results into Sterling. Transactional exposures arise where the currency of sale or purchase invoices differs from the functional currency in which each company prepares its local accounts. The transactional exposures include situations where foreign currency denominated trade debtor, trade creditor and cash balances are held.
After matching the currency of revenue with the currency of costs wherever practical, forward exchange contracts are used to hedge a proportion (up to 75%) of the remaining forecast net transaction flows where there is reasonable certainty of an exposure. At 31 December 2014, approximately 50% of the estimated net Euro, US Dollar and Japanese Yen exposures for 2015 were hedged using forward exchange contracts, mainly against the Swiss Franc, Sterling, the Euro and the Danish Krone.
The largest translational exposures are to the US Dollar, Euro, Japanese Yen, Danish Krone and Swiss Franc. Translational exposures are not hedged. The table below shows the key average exchange rates compared to Sterling during 2014 and 2013.
2014 2013 Exchange rates (Average) (Average)
USD 1.65 1.56 EUR 1.24 1.18 JPY 174 153
Financial Reviewcontinued

Strategic Report 01–41 Governance 42–74 Financial Statements 75–131
41Spectris plc Annual Report and Accounts 2014
To demonstrate the transaction and translation currency exposure faced by the Group, the table below shows the differences between the Group’s consolidated revenues and costs for each of the major currencies in 2014 before reflecting the effect of transactional hedges taken out in the year.
Revenue and cost by major currency USD1 EUR1 GBP JPY Other Total
Total sales (£m) 496 396 75 56 151 1,174 % of sales (%) 42 34 6 5 13 100 Total costs (£m)2 (376) (337) (78) (32) (158) (981)
Profit before tax by currency (£m) 120 59 (3) 24 (7) 193
% of profit before tax 62 31 (2) 13 (4) 100
1 Dollar/Euro categories include tracking currencies.
2 Costs include interest of £3.6 million in USD, and £2.0 million in EUR.
The above table is for overall guidance only as the phasing of income and the movement in the monthly average exchange rates during the year can have a significant effect on the impact of foreign exchange.
Defined benefit pension schemesThe Company operates a number of pension schemes throughout the Group. The net pension liability in the balance sheet (before taking account of the related deferred tax asset of £3.8 million) has increased to £14.0 million (2013: £8.2 million). The movement can be summarised as follows:
Movement in net pension deficit £m
Net deficit in defined benefit schemes as at 31 December 2013 (8.2) Actuarial losses (6.5) Contributions in excess of current service cost 0.3 Scheme administration costs (0.3) Expected return on pension scheme assets net of interest costs on pension scheme liabilities (0.1) Exchange difference and other movements 0.8
Net deficit in defined benefit pension schemes as at 31 December 2014 (14.0)
The movement in individual plan deficits is shown in the table below:
Movement in net Total Net
pension surplus/ UK Germany Netherlands Switzerland overseas total
(deficit) by country £m £m £m £m £m £m
Surplus/(deficit) as at 1 January 2014 7.2 (7.2) (1.8) (6.4) (15.4) (8.2) (Decrease)/increase in surplus/(deficit) (3.6) (0.5) 0.1 (1.8) (2.2) (5.8)
Surplus/(deficit) as at 31 December 2014 3.6 (7.7) (1.7) (8.2) (17.6) (14.0)
The UK plan surplus of £7.2 million at 31 December 2013 has decreased to £3.6 million at 31 December 2014 due to a reduction in the discount rate, whilst the net deficit for the overseas plans has increased by £2.2 million to £17.6 million. The increase in the net deficit is primarily due to changes in market conditions during the year, in particular a fall in the discount rates used to value the plans’ liabilities.
The Strategic Report was approved by the Board of Directors on 27 February 2015.
By order of the Board
Roger Stephens Company Secretary
27 February 2015

Strategic Report 01–41 Governance 42–74 Financial Statements 75–131
42Spectris plc Annual Report and Accounts 2014
Corporate Governance Report
Board of Directors
This Corporate Governance Report and the associated Nomination Committee and Audit and Risk Committee Reports form the Directors’ Report. Disclosures elsewhere in the Annual Report and Accounts are cross-referenced where appropriate. Taken together, they fulfil the combined requirements of company law, the Disclosure and Transparency Rules and the Listing Rules.
UK Corporate Governance Code statement of complianceAt Spectris we are committed to maintaining high standards of corporate governance, both at Board level and throughout the Group. We see this as fundamental to the effective and responsible management of the business and for the delivery of shareholder value over the long term. Time is allocated at Board and Committee meetings to consider governance issues.
We particularly emphasise the strong relationship that exists between ethics and governance and the role of the Board in demonstrating ethical leadership. The standards we require are set out in our Code of Business Ethics, which is communicated to all our employees and business partners.
Spectris plc is subject to the 2012 UK Corporate Governance Code (‘the Code’), as appended to the Listing Rules of the UK Listing Authority. The Code sets out principles and provisions relating to the good governance of companies. This report describes how the Company applied the principles and complied with the provisions of the Code during 2014.
The Board considers that it was throughout the year, and continues to be, in full compliance with the provisions set out in the Code. The Company further expects to be in full compliance with the September 2014 version of the UK Corporate Governance Code (‘the New Code’) throughout 2015 and has complied with the New Code’s provisions, to the extent possible, in this Annual Report and Accounts.
Pages 44 to 58 of this report are intended to give shareholders a clear and comprehensive description of the Company’s governance arrangements and how they operated during the year. Compliance by the Company with each principle and provision of the Code is set out on pages 59 and 60.
Peter Chambré Non-executive Director
AppointedAugust 2006
CommitteesNomination, Remuneration, Audit and Risk
Relevant experiencePeter Chambré was formerly chief executive officer of Cambridge Antibody Technology Group plc and prior to that was chief operating officer of Celera Genomics Group and chief executive of Bespak plc.
Other appointmentsChairman of 7TM Pharma A/S and immatics biotechnologies GmbH. He is a director of Cancer Research Technology Ltd, OneMed Sverige AB and Imperial Innovations Group plc.
Bill SeegerNon-executive Director
AppointedJanuary 2015
CommitteesAudit and Risk (Chairman designate), Nomination, Remuneration
Relevant experienceBill Seeger was formerly group finance director of GKN plc and prior to that president and CEO of the propulsion systems and special products division of GKN, having previously been CFO in the aerospace division. He spent most of his career at TRW, latterly in senior finance roles, including as vice president, financial planning and analysis, and vice president, finance, of TRW Automotive.
Other appointmentsNon-executive director and chairman of the audit committee of Smiths Group plc.

Strategic Report 01–41 Governance 42–74 Financial Statements 75–131
43Spectris plc Annual Report and Accounts 2014
Dr John Hughes cbe Chairman
AppointedJune 2007. Appointed Chairman in May 2008.
CommitteesNomination (Chairman)
Relevant experienceJohn Hughes was formerly executive vice president and chief operating officer of defence, aerospace and electronic systems company, Thales Group SA.
Other appointmentsExecutive chairman of Telecity Group plc and non-executive chairman of Sepura plc and Just Eat plc. Non-executive director of CSG International, Inc. (a NASDAQ-listed company). Special advisor for Oakley Capital Corporate Finance. Ambassador for the Alzheimer’s Society.
Lisa DavisNon-executive Director
AppointedApril 2014
CommitteesNomination, Remuneration, Audit and Risk
Relevant experienceMember of the Siemens AG managing board and chair of Siemens Corporation in the US. Lisa Davis’ responsibilities include Americas, power and gas, wind power and renewables and power generation services. She was formerly executive vice president of strategy, portfolio and alternative energy, Shell International Petroleum Company.
John Warren Non-executive Director
AppointedMarch 2006
CommitteesAudit and Risk (Chairman), Nomination, Remuneration
Relevant experienceJohn Warren was previously group finance director of WH Smith PLC and United Biscuits plc.
Other appointmentsNon-executive director of Bovis Homes Group PLC, 4imprint Group plc, Greencore Group plc (Eire) and Welsh Water, a privately-owned company.
John O’Higgins Chief Executive
AppointedJanuary 2006
CommitteesNomination
Relevant experienceBefore joining Spectris, John O’Higgins worked for Honeywell in a number of management roles, most recently as president of automation and control solutions, Asia Pacific. John began his career as a design engineer at Daimler Benz in Stuttgart. He has engineering degrees from University College Dublin and Purdue University and an MBA from INSEAD.
Other appointmentsNon-executive director of Exide Technologies, a NASDAQ-listed company.
Russell King Non-executive Director
AppointedOctober 2010
CommitteesRemuneration (Chairman), Nomination, Audit and Risk, Senior Independent Director
Relevant experienceRussell King is chairman of Hummingbird Resources Plc. He was previously chief strategy officer of Anglo American PLC and a non-executive director of Anglo Platinum Ltd. Prior to that he spent over 20 years in senior roles at ICI.
Other appointmentsNon-executive director of Aggreko plc, Sepura plc and Interserve Plc.
Martha Wyrsch Non-executive Director
AppointedJune 2012
CommitteesNomination, Remuneration, Audit and Risk
Relevant experienceMartha Wyrsch is executive vice president and general counsel of Sempra Energy, a company quoted on the New York Stock Exchange. Martha was formerly president of Vestas Americas, a subsidiary of Vestas Wind Systems A/S and prior to that she was president and CEO of Spectra Energy Transmission.
Other appointmentsDirector of the Cristo Rey Network, a US educational foundation, San Diego Gas and Electric Company, a wholly-owned subsidiary of Sempra Energy, and Southern California Gas Company, a publicly traded company in the USA.
Clive Watson Group Finance Director
AppointedOctober 2006
Relevant experienceClive Watson was previously chief financial officer and executive vice president for business support at Borealis. Prior to this, he was group finance director at Thorn Lighting Group and before that group finance director Europe with Black & Decker. Clive is a member of the Institute of Chartered Accountants in England and Wales and the Chartered Institute of Taxation.
Other appointmentsNon-executive director of Spirax-Sarco Engineering plc.
Ulf QuellmannNon-executive Director
AppointedJanuary 2015
CommitteesNomination, Remuneration, Audit and Risk
Relevant experienceUlf Quellmann is global head of treasury at Rio Tinto plc. He was previously vice president, investor relations and media relations, and chief pension investment officer and assistant treasurer at Alcan Inc. Prior to that he held senior management positions at General Motors, including as senior manager, capital planning, and managing director of Vauxhall Masterhire.
Roger Stephens Head of Commercial and Company Secretary
AppointedJanuary 1997
Relevant experienceRoger Stephens is responsible for legal and governance matters and capital projects across the Group. Prior to joining Spectris, Roger held commercial roles in the power and construction sectors, specialising in contract negotiation, litigation and claims resolution, IP exploitation and property development.

Strategic Report 01–41 Governance 42–74 Financial Statements 75–131
44Spectris plc Annual Report and Accounts 2014
Corporate Governance Reportcontinued
The Board delegates specific responsibilities to Board committees, notably the Nomination, Remuneration, and Audit and Risk Committees. The terms of reference for these Committees are published on the Company’s website and the following additional documents are available to shareholders on application to the Company Secretary:
•schedule of matters reserved for decision by the Board;
• responsibilities of the Chairman, the Chief Executive and the Non-executive Directors;
• relations with shareholders; and
•procedure for taking independent professional advice.
Board delegation
Nomination Committee
Remuneration Committee
Audit and Risk Committee
The Board
Ulf Quellmann and Bill Seeger were not members of any Board Committee during 2014 as both were appointed Non-executive Directors of the Company on 1 January 2015. They both served on all Board Committees
between 1 January and 27 February 2015, following which the membership of these Committees was restructured, as described in the letter from the Chairman of the Nomination Committee on page 48.
Under the Companies Act 2006, a Director must avoid a situation where he or she has, or may have, a direct or indirect interest that conflicts, or may conflict, with the Company’s interests. During the year, in accordance with the powers and duties of Directors laid down in the Company’s Articles, Directors were asked to declare any such conflict or potential conflict of interest to the Board, and to request the Board’s authorisation of any matter which otherwise might have given rise to a conflict of interest. No such conflicts have been declared.
The table below includes all Directors who held office at any point during the year. S Blair, L A Davis and J C Webster held office for part of the year only. S Blair attended all of the Board meetings which he was eligible to attend. L A Davis attended three of the four Board meetings, the Audit and Risk Committee meeting and two of the three Remuneration Committee meetings which she was eligible to attend. She was unable to attend the Nomination Committee meeting which she was eligible to attend. J C Webster attended three of the four Board meetings which he was eligible to attend.
Board composition, procedures and activities during the yearThe Board currently comprises the Chairman, two Executive Directors and seven Non-executive Directors. The Board has carried out a rigorous review of the independence of its Non-executive Directors (Peter Chambré, Lisa Davis, Russell King, Ulf Quellmann, Bill Seeger, John Warren and Martha Wyrsch) and considers each to be independent in character and judgement in that none of them is, or has ever been, the holder of an executive office with the Company and each continues to demonstrate the qualities of independence in carrying out their role. The positions of Chairman, Chief Executive and Senior Independent Director are held by separate individuals and, in accordance with the Code, the Board has adopted written profiles for the first two of these.
The Board meets formally at regular intervals throughout the year to develop the Company’s strategy and long-term objectives and to review trading results and operational and business issues. It also deals with those matters reserved to it for decision, including annual financial planning, the acquisition and disposal of businesses, major capital expenditure, the appointment and (if necessary) removal of Directors, and Board and senior management succession. Additional meetings are convened as required to consider specific topics requiring immediate decision. Authority for operational decisions is delegated by the Board to senior management at operating company level, over which the Executive Directors exercise supervision. All Directors receive detailed progress reports one week prior to each Board meeting.
The Board of Directors
Executive Directors 2 Non-executive Directors 8
Male Directors 8 Female Directors 2
Board and Committee meeting attendance in 2014
Remuneration Audit and Risk Nomination Board Committee Committee Committee
Total meetings during the year 7 6 3 3
Dr J L M Hughes cbe (Chairman) 6 N/A N/A 3
R J King (Senior Independent Director) 7 6 3 3
P A Chambré 7 6 3 3
L A Davis 3 2 1 –
J A Warren 7 6 3 3
M B Wyrsch 7 6 3 3
J E O’Higgins (Chief Executive) 7 N/A N/A 3
S Blair 2 N/A N/A N/A
C G Watson 7 N/A N/A N/A
J C Webster 3 N/A N/A N/A
Board focus Approximate percentage allocation of Board time
Strategy 35.0% Business operations 25.0% Acquisitions 25.0% Financial management 7.5% Legal, risk, governance and compliance 7.5%

Strategic Report 01–41 Governance 42–74 Financial Statements 75–131
45Spectris plc Annual Report and Accounts 2014
Board evaluationAn overview of the Board evaluations undertaken between 2011 and 2014, and to be undertaken in 2015, is set out below, including whether reviews were internally or externally facilitated, the form of those reviews, their focus and outcomes. In 2013, the Board undertook its triennial external Board evaluation. This was reported on in the 2013 Annual Report and Accounts. The conclusion reached was that the Board was functioning well, but a number of areas for improvement were identified following
the Board’s discussion of the report. These are outlined in the diagram below.
The Board is engaged in a continuing review process on how it can drive significantly accelerated growth. Strategic discussions are an important part of the Board’s agenda as it seeks to develop the Group’s existing businesses and exploit new business opportunities. Therefore, for its internal evaluation in 2014, the Board chose to focus on determining whether it had the appropriate mix of skills, knowledge, experience and perspectives to serve the
Group’s existing and future strategic needs. This included an assessment of whether the experience and knowledge of other industry sectors beyond those familiar to the Board, such as oil and gas, would be beneficial to its operation. The Nomination Committee was asked to carry out this assessment and the results are contained in the following diagrams. Any shortfall in required sector expertise and experience will inform the recruitment brief for future Board appointments.
Board evaluation cycle
Year 2011 2012 2013 2014 2015
Internal Internal External Internal Internal
Process and focus
• Submissions from all Directors in response to a structured questionnaire focussed on strategy, Board structure and organisation, succession planning and risk management.
• Summary report including comparative data from 2010 to track progress.
• Narrative responses from each Director on open-ended questions focussed on a number of strategic areas including the Group’s business strategy, risk appetite, management development and alignment of remuneration strategy with business strategy.
• One-on-one follow- up discussions with Company Secretary.
• Facilitated by Armstrong Bonham Carter.
• Structured interviews with each Director, Company Secretary, Head of Internal Audit, Head of Business Ethics and Governance, external audit partner and external remuneration consultant.
• Report presented to the Board in January 2014.
• Further Board discussion and actions determined.
• Focussed on Board skills, experience and perspectives match to strategic objectives including new end-user markets and geographies.
• Board effectiveness/behaviours survey and reporting feedback.
• Narrative responses from each Director on open-ended questions focussed on a number of areas including the Group’s strategy development, the structure of the Board, its composition, behaviour, significant topics requiring discussion, time to be allocated to those topics and how the Board can best support the Executive team.
• One-on-one follow- up discussions with Company Secretary.
Outcomes and actions
• Focus on range of skills of Board members.
• Establish continuing review process focussed on driving accelerated growth.
• Develop forward- looking metrics on the health of the Group: product vitality, customer satisfaction, talent identification, integrity health.
• Details on page 46.

Strategic Report 01–41 Governance 42–74 Financial Statements 75–131
46Spectris plc Annual Report and Accounts 2014
Number of Directors with relevant skills, knowledge and expertise
Manufacturing
Financialqualifications
M&A
Services
Interneteconomy
B2B
Commercialand marketing
Legal, governanceand risk control
Listedcompany
International 12
12
13
13
15
7 6
37
32
67
5
6
6
14
14
6
4
Board and Executive team (15 in total) Executive team only (7 in total)
Number of Directors with experience of end-user market
7
8
4
2
65
10
6
1
12
Semicon, telecomsand electronics
Automotive
Aerospace
Pharmaceuticalsand fine chemicals
Metals, mineralsand mining
Academicresearch
Energyand utilities
Pulp andpaper
Manufacturingand machine
building
5
4
21
33
1
7
Board and Executive team (15 in total) Executive team only (7 in total)
Number of Directors with geographical experience
Europe
Russia
Middle East
North America
Africa
Latin America
North andSouth-East Asia
Australia andNew Zealand
7
7
3
3
2
2
12
14
5
50
0
6
0
7
1
Board and Executive team (15 in total) Executive team only (7 in total)
To assist this process, each Director and Executive completed a skills and experience self-assessment. The outcome of these discussions and the subsequent gap analysis was put into practice in the succession planning referred to on page 49 of the Nomination Committee Report.
In planning for its 2015 evaluation, the Board considered commissioning an external evaluation but determined that this was not necessary. An internal evaluation process will therefore be followed, comprising submissions from Board members in response to a structured questionnaire focussed upon significant areas identified by the Board; notably, strategy development, the structure of the Board, its composition, the significant topics requiring its attention, and the time to be allocated to these. A gap analysis will then be carried out. The overall aim is to assist the Board in defining how it can best support the Executive team in delivering the Company’s growth ambitions.
As part of the 2015 evaluation, a Board behaviours/effectiveness survey will also be deployed, preparatory to the process described above. This will assist the Board in reviewing the quality and quantity of its interactions in each of its principal areas of focus – governance, strategy, performance management, decision-making and communication.
Corporate Governance Reportcontinued

Strategic Report 01–41 Governance 42–74 Financial Statements 75–131
47Spectris plc Annual Report and Accounts 2014
Board development and training: visits to operating companiesIn addition to periodic updates to the Board on legal, accounting, regulatory and compliance matters, Board training and development is predominantly focussed on building a deep understanding of our businesses.
Two meetings were held at operating company locations during 2014 and encompassed a detailed review of the relevant businesses. In June, the Board visited Malvern Instruments in Malvern, UK, and in October the Board visited Brüel & Kjær Sound & Vibration in Naerum, Denmark.
A summary of the presentations the Board received at these businesses is detailed below.
A presentation was also received from the President of Spectris Asia Pacific at the Board’s December 2014 meeting.
Through these meetings and the access given to the Group’s operations and its staff, all Directors maintain and deepen their detailed knowledge of Group operations, as required for them to discharge their duties.
Board development visit to Malvern Instruments
Board development visit to Brüel & Kjær Sound & Vibration
The Board toured the Malvern Instruments (‘Malvern’) facility, met senior staff and received a presentation from the Managing Director of Malvern.
Recent acquisitions plus new products emerging from the in-house development team in the US have significantly enhanced Malvern’s presence in the life science segment. New, segregated, sales channels are being developed to focus on these applications, in addition to the traditional industrial customer base. The new technologies will also have industrial applications, particularly in relation to nano materials.
The combination of technology acquisition and in-house development is considered of particular benefit to the business.
The Board toured the Brüel & Kjær Sound & Vibration (‘BKSV’) facility in Naerum, Denmark, met senior staff and received a presentation from the Managing Director of BKSV.
BKSV operates a dual sales channel focussing on products and solutions. It has a long-term strategy to move from being product-centric to being solutions-centric, thereby adding additional value to its customers’ development and production processes.
To further that strategy, BKSV is expanding its offering beyond the research and development laboratory and focussing on production, sales, support, services and marketing. It is seeking top-line expansion with increased efficiency. New growth vectors include cloud-based data management and CAE (computer aided engineering) integration.
Governance events: investor relationsSpectris encourages two-way communication with investors and has a comprehensive investor relations programme designed to assist existing and potential investors understand the Group’s business activities, strategy and prospects.
Spectris conducts regular dialogue with institutional shareholders, including meetings during investor roadshows, following the announcement of the full-year and half-year results and other trading updates, attendance at conferences hosted by brokers, and frequent ad-hoc meetings outside of such road shows and/or conferences. Meetings and discussions with investors are normally undertaken by the Chief Executive, the Group Finance Director and the Head of Corporate Affairs, although the Chairman, the Senior Independent Director and Non-executive Directors are available for discussions with shareholders if required.
During the year, 125 face-to-face meetings and telephone conference calls were held with institutional investors in the UK, North America and Europe, covering over 65% of the shareholder base. In addition, there were over 100 face-to-face meetings and telephone conference calls with potential investors.
Shareholders are invited to attend the Company’s Annual General Meeting and have the opportunity to meet and question the Chairman and Board members. The results of proxy votes are available at the Annual General Meeting and these are published on the Group’s website at www.spectris.com following the meeting. The Annual Report and Accounts is sent to all shareholders who elect to receive a copy and is also available on the Company’s website, which additionally contains information on the Group’s activities and published results and presentations.

Strategic Report 01–41 Governance 42–74 Financial Statements 75–131
48Spectris plc Annual Report and Accounts 2014
Nomination Committee Report
Letter from Dr John Hughes cbe
Chairman of the Nomination Committee
Dear Shareholder
I am pleased to present our Nomination Committee Report, which summarises our work during the year.
The Board has delegated authority to the Committee to assist it with the review of the Company’s leadership needs to ensure its continued ability to compete effectively in the marketplace. Our principal activity in 2014 comprised assisting the Board with the recruitment of three Non-executive Directors: Lisa Davis, Ulf Quellmann and Bill Seeger. These appointments were founded upon an analysis of the additional skills, experiences and diversity in its widest aspects which it would be desirable to see represented on the Board. This analysis was a key focus of our 2014 Board evaluation process, as described within the Corporate Governance Report.
The Committee considered a range of candidates with the financial skills and experience necessary to assume the chairmanship of the Audit and Risk Committee. Bill Seeger will replace John Warren as Chairman with immediate effect, ahead of John’s retirement from the Board after the 2015 Annual General Meeting. In addition, we identified the desirability of further strengthening the financial experience available to the Audit and Risk Committee, resulting in the appointment of Ulf Quellmann.
These appointments increase the number of Non-executive Directors on the Board to six and permit modification of the membership of the three Board Committees. It is no longer appropriate or necessary for all to serve on each Committee. This reduction will allow each Director to focus specifically upon their particular Committee responsibilities and then for the Board as a whole to review the work of each Committee in a more structured manner than previously. With immediate effect, the Committee memberships will thus be as follows:
Audit and RiskBill Seeger (Chairman), Peter Chambré, Ulf Quellmann, Martha Wyrsch.
RemunerationRussell King (Chairman), Peter Chambré, Lisa Davis, Ulf Quellmann.
NominationDr John Hughes (Chairman), John O’Higgins, Peter Chambré, Lisa Davis, Russell King, Martha Wyrsch.
At our meeting in January this year, we considered the effectiveness and contribution of individual Directors during the past year and recommended to the Board that each (save for John Warren who retires after nine years’ service) be put forward for re-election at the 2015 Annual General Meeting. The Committee also considered and re-confirmed the independence of each of the Board’s Non-executive Directors. I hope you will join me in supporting the re-election of the Directors at the Annual General Meeting, where I will be happy to answer any questions you may have.
Yours faithfully
Dr John Hughes cbe Chairman of the Nomination Committee
27 February 2015
Dr John Hughes cbe
Chairman of the Nomination Committee

Strategic Report 01–41 Governance 42–74 Financial Statements 75–131
49Spectris plc Annual Report and Accounts 2014
Membership and responsibilities The Nomination Committee is appointed by the Board. Its members are the Chairman, the Chief Executive and all of the Non-executive Directors. It is chaired by the Chairman of the Board, save in the event of discussions relating to his succession, when the Senior Independent Director would take the chair.
The Committee reviews the size, structure and composition (including skills, experience and diversity) of the Board and its Committees; considers succession planning for Directors, Executive Committee members and senior leadership; is responsible for identifying candidates for Board positions; and reviews the results of Board performance evaluations. Full terms of reference are available to view on the Company’s website.
Activities during the yearThe Committee met three times during the year. Further details are set out on page 44.
Succession planningBoard succession planning is considered by the Nomination Committee and this year was linked closely to the Board evaluation process which focussed upon the desired range of Directors’ skills, experience and diversity necessary to support development of the Group strategy and its implementation. The information obtained from this analysis was and will be used by the Nomination Committee to address any gaps in experience, end-user markets, geographical knowledge and perspectives.
Following consideration of a report from the Nomination Committee, the Board agreed that overall it possessed an appropriate and complementary mix of experiences and background, but that it would benefit from additional experience in the downstream oil and gas and automotive sectors and in finance/accounting.
In accordance with the UK Corporate Governance Code, all Non-executive Directors are each year required to retire and be subject to re-election by shareholders.
The diagram below indicates for each Non-executive Director the period to the ninth anniversary of his or her first election by shareholders, during which a Non-executive Director will be considered independent in accordance with the UK Corporate Governance Code. Any extension of the appointment beyond that point would require close review by the Committee of the individual’s continued independence, effectiveness and contribution to the Board’s deliberations.
Appointment process Following the Board’s decision that the appointment of a new Director is appropriate, the Committee works with external search firms to present suitably qualified candidates for Board consideration. In doing so, we evaluate the balance of skills, knowledge and experience on the Board and the Executive team and develop a description of the role and required capabilities. In searching for a suitable replacement for John Warren, the Committee had been directed to look both for finance experience and sector/industry experience to complement and enhance the Board’s existing skills and experience mix. Diversity in all aspects and nationality were also considered as part of the search process.
Short-listed candidates are subject to a rigorous process of interviews and comprehensive reference checks. The Chairman gathers the feedback from each member of the Committee individually prior to collective debate in order to ensure that all Directors’ impressions and recommendations are taken fully into consideration.
This process was followed for the appointment of new Non-executive Directors Lisa Davis (in April 2014), Ulf Quellmann and Bill Seeger (in January 2015) and new Business Group Directors Eoghan O’Lionaird and Jo Hallas (in February and May 2014, respectively). External search firm Egon Zehnder was engaged for each of these appointments. Egon Zehnder adheres to the Voluntary Code of Conduct for Executive Search Firms and provided no other services to the Company during the year.
Non-executive Director tenure
John Warren
Peter Chambré
Russell King
Martha Wyrsch
Lisa Davis
Bill Seeger
Ulf Quellmann
2006 2007 2008 2009 2010 2011 2012 2013 2014 2015
Date of AGM
2016 2017 2018 2019 2020 2021 2022 2023 2024

Strategic Report 01–41 Governance 42–74 Financial Statements 75–131
50Spectris plc Annual Report and Accounts 2014
Accountability
Internal controlsThe Board is ultimately responsible for the Group’s system of internal controls and for reviewing its effectiveness.
Consistent with the guidance provided for directors on internal control by the Financial Reporting Council, which reflects the 2014 version of the UK Corporate Governance Code (‘Guidance on Risk Management, Internal Control and Related Financial and Business Reporting’), the Board confirms that a) there is a robust, ongoing process for identifying, evaluating and managing the principal risks faced by the Group, b) this has been in place for the year ended 31 December 2014 and up to the date of approval of the Annual Report and Accounts and c) this process has been reviewed by the Board during the year.
The Board recognises that internal control is a dynamic process. Therefore, the Group’s internal control framework, including the risk management processes, is subject to ongoing review and improvements are made to ensure that, where appropriate, the framework is adapted to the Group’s changing risk profile or in order to address any weaknesses, identified in the control framework itself.
The key elements of the Group’s internal controls are described below:
•Day-to-day operational activities are conducted within an established internal control framework comprising clear rules, policies, and lines of responsibility and delegated authorities.
•A Group Policies and Procedures Manual (‘the Manual’) provides a common control framework and sets out the minimum standards, procedures and internal controls to be applied in relation to managing technical, commercial, legal and financial risks.
•The consistent application of Group accounting policies and reporting protocols, supplemented by oversight from the Group finance team.
•Monthly reporting from the Group’s operating companies captures each business’ performance against plan and highlights key developments in relation to commercial outlook, operational matters, legal issues and internal controls.
•Annual strategic and financial plans are established for each business unit and are subject to review and approval. Performance against the plans is subject to ongoing review by the Executive Directors and the Group has a comprehensive system for reporting performance to the Board.
•Significant capital investments or contractual commitments and major acquisitions or divestments are all subject to a clear process for appraisal, review and approval by the Board.
•An ethics hotline exists which employees and other third parties can use to report any instances of suspected wrongdoing.
The processes which the Board and the Audit and Risk Committee have applied in reviewing the effectiveness of the Group’s internal control framework include the following:
•The Executive Directors report to the Board on changes in the business and external environment which present significant risks.
•The Executive Directors provide the Board with monthly trading and financial information which includes key performance indicators and information on the Group’s operating segments.
•Regular reports on significant legal, ethics, compliance issues and insurance matters are received from the Company Secretary, including summaries of any reports received through the Group’s ethics hotline.
•A certification process in relation to compliance with the Manual, accounting judgements and representations has been established, providing for a documented trail of accountability from business unit senior management to the Audit and Risk Committee.
•The Group has an internal audit function which reviews the design and operating effectiveness of internal controls across the Group’s operations, including financial, operational and compliance controls. The Audit and Risk Committee receives regular reports on the output of internal audit activity, including the operation of, and issues arising from, the Group’s internal controls and procedures.
•A control self-assessment process against the Group’s internal control standards is completed by each business unit and each material location, with any gaps in controls assessed and remediation plans established as appropriate.
•The Group’s approach to risk management is described on page 16 of the Principal Risks and Uncertainties section. The effectiveness of risk management and mitigation is reviewed regularly by the Executive Directors and twice yearly by the Audit and Risk Committee.
The Board notes that, as with all such systems, the Group’s internal control framework is designed to manage rather than eliminate risk of failure to achieve business objectives, and can provide only reasonable and not absolute assurance against material misstatement or loss.

Strategic Report 01–41 Governance 42–74 Financial Statements 75–131
51Spectris plc Annual Report and Accounts 2014
Audit and Risk Committee Report
Letter from John WarrenChairman of the Audit and Risk Committee
Dear Shareholder
As the Chairman of the Audit and Risk Committee I am pleased to present to you the Committee’s 2014 report.
One of our key tasks at the end of the year was to review and satisfy ourselves that the ‘fair, balanced and understandable’ requirement for the 2014 Annual Report and Accounts had been met. A number of additional procedures were put in place by the Company, including a working session of the Committee in December, to enable this assessment to be made on as informed a basis as possible. At our February meeting we were comfortable therefore in concluding that the requirement had been met and making a recommendation to the Board to that effect.
One of the key accounting judgements that the Committee needed to consider during the year was the assessment of the Group’s weighted average cost of capital and the long-term growth rates of each business as part of its annual goodwill impairment review. We were able to conclude that these assessments had been made on a reasonable and prudent basis. The internal audit activity and process over the year was reviewed, together with the level of internal audit resourcing, which the Committee considers to be satisfactory. The Committee examined the work done to identify the full range of third-party assurance activity; to better understand how this affects the Group’s risk profile and to address any gaps arising. Work will continue in this area. The Committee noted the Group’s information security initiatives and the progress made to date, including penetration testing to measure resilience against external threats.
In the external environment, there is continuing focus on the quality of work and reporting in relation to significant financial issues and the challenge that audit committees bring to bear. Within our report, we discuss the areas of accounting judgements that arose during the year, distinguishing between those that are specific to the year and those of a recurring nature, and how we satisfied ourselves that they were prudent and appropriate.
The Group’s internal control systems are subject to continuous assessment, but the Guidance on Risk Management, Internal Control and Related Financial and Business Reporting, issued in September 2014, provides an opportunity to carry out a fresh and holistic review. This, together with the review of our processes to enable the Board to make our long-term viability statement, will be the significant priorities for the Committee during 2015.
Yours faithfully
John Warren Chairman of the Audit and Risk Committee
27 February 2015
John WarrenChairman of the Audit and Risk Committee

Strategic Report 01–41 Governance 42–74 Financial Statements 75–131
52Spectris plc Annual Report and Accounts 2014
The following matters were considered by the Committee at its scheduled meetings:
January 2014
• 2013 year-end issues including legal and divestment provisions, weighted average cost of capital, impairment and the going concern statements.
• 2013 internal audit review and 2014 plan.
• 2013 draft Audit and Risk Committee Report and draft external auditor’s audit opinion.
• Ethics programme – areas of focus in 2014 and review of whistleblowing reports.
February 2014
• The full-year Financial Statements including the independent Auditor’s Report.
• Fair, balanced and understandable assessment.
• External auditor’s objectivity, effectiveness and independence.
• Defined benefit plan, valuations and control measures.
• Update on information security measures.
July 2014
• The interim Financial Statements and issues raised by management and the external auditor.
• The 2014 external audit strategy and scope.
• Update on the internal audit review and resourcing within the internal audit function.
• Internal audit risk management update.
• Update on the business ethics programme including a review of progress in Group-wide training initiatives and the third-party risk assessment and due diligence programme.
• Review of whistleblowing reports.
• Risk management review and significant legal issues.
December 2014
• Working meeting to discuss an early draft of the 2014 Annual Report with the project team.
• Early discussion of fair, balanced and understandable assessment.
January 2015
• 2014 year-end issues including legal and other provisions, weighted average cost of capital, long-term growth rate, impairment and the going concern statements.
• 2014 internal audit review and 2015 plan.
• 2014 draft Audit and Risk Committee Report and draft external auditor’s audit opinion.
• Information Security review.
• Ethics programme update and whistleblowing reports.
• Update on the Group’s current risk landscape.
• Potential impact of IFRS 15.
February 2015
• The full-year Financial Statements including the independent Auditor’s Report.
• Fair, balanced and understandable assessment.
• External auditor’s objectivity, effectiveness and independence.
• Fair value accounting in relation to 2014 acquisitions.
• Defined benefit plan, valuations and control measures.
A number of these are discussed in further detail opposite.
Membership and responsibilities The Committee is appointed by the Board and comprises, at the date of this report, John Warren (Chairman), Peter Chambré, Lisa Davis, Russell King, Ulf Quellmann, Bill Seeger and Martha Wyrsch. John Warren is a chartered accountant and has recent and relevant financial experience, having been the former group finance director of both United Biscuits plc and WH Smith PLC and currently chairing the audit committees of Bovis Homes Group plc, Welsh Water, 4imprint plc and Greencore Group plc. The Committee benefits greatly from Mr Warren’s skilled leadership and the wide-ranging expertise of the other Committee members. Full biographical details are on pages 42 and 43. The Head of Business Ethics and Governance acts as secretary to the Committee.
The Committee operates under terms of reference approved by the Board which are available on the Company’s website.
Activities during the yearThe Committee met formally three times during 2014, and had an informal working meeting in December to consider various reports in the 2014 Annual Report and Accounts. The formal meetings coincided with key dates in the financial reporting cycle. Committee members’ attendance can be found on page 44. The Head of Business Ethics and Governance and the Group Finance Director worked with the Chairman to set each meeting’s agenda. Executives and other senior management were invited to attend as appropriate to provide updates on operational and strategic matters, participate in debate and answer questions posed by the Committee.
Audit and Risk Committee Reportcontinued
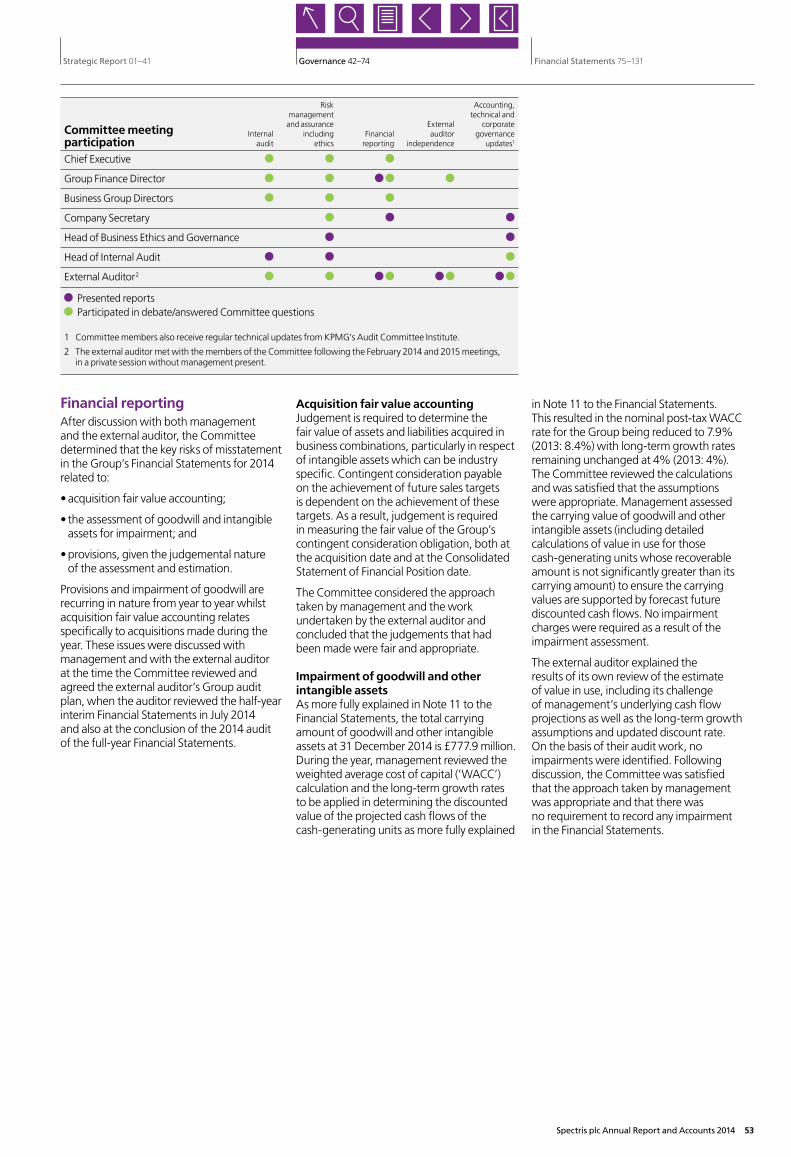
Strategic Report 01–41 Governance 42–74 Financial Statements 75–131
53Spectris plc Annual Report and Accounts 2014
Financial reporting After discussion with both management and the external auditor, the Committee determined that the key risks of misstatement in the Group’s Financial Statements for 2014 related to:
•acquisition fair value accounting;
• the assessment of goodwill and intangible assets for impairment; and
•provisions, given the judgemental nature of the assessment and estimation.
Provisions and impairment of goodwill are recurring in nature from year to year whilst acquisition fair value accounting relates specifically to acquisitions made during the year. These issues were discussed with management and with the external auditor at the time the Committee reviewed and agreed the external auditor’s Group audit plan, when the auditor reviewed the half-year interim Financial Statements in July 2014 and also at the conclusion of the 2014 audit of the full-year Financial Statements.
Acquisition fair value accountingJudgement is required to determine the fair value of assets and liabilities acquired in business combinations, particularly in respect of intangible assets which can be industry specific. Contingent consideration payable on the achievement of future sales targets is dependent on the achievement of these targets. As a result, judgement is required in measuring the fair value of the Group’s contingent consideration obligation, both at the acquisition date and at the Consolidated Statement of Financial Position date.
The Committee considered the approach taken by management and the work undertaken by the external auditor and concluded that the judgements that had been made were fair and appropriate.
Impairment of goodwill and other intangible assetsAs more fully explained in Note 11 to the Financial Statements, the total carrying amount of goodwill and other intangible assets at 31 December 2014 is £777.9 million. During the year, management reviewed the weighted average cost of capital (‘WACC’) calculation and the long-term growth rates to be applied in determining the discounted value of the projected cash flows of the cash-generating units as more fully explained
in Note 11 to the Financial Statements. This resulted in the nominal post-tax WACC rate for the Group being reduced to 7.9% (2013: 8.4%) with long-term growth rates remaining unchanged at 4% (2013: 4%). The Committee reviewed the calculations and was satisfied that the assumptions were appropriate. Management assessed the carrying value of goodwill and other intangible assets (including detailed calculations of value in use for those cash-generating units whose recoverable amount is not significantly greater than its carrying amount) to ensure the carrying values are supported by forecast future discounted cash flows. No impairment charges were required as a result of the impairment assessment.
The external auditor explained the results of its own review of the estimate of value in use, including its challenge of management’s underlying cash flow projections as well as the long-term growth assumptions and updated discount rate. On the basis of their audit work, no impairments were identified. Following discussion, the Committee was satisfied that the approach taken by management was appropriate and that there was no requirement to record any impairment in the Financial Statements.
Risk Accounting, management technical and and assurance External corporate Committee meeting Internal including Financial auditor governance participation audit ethics reporting independence updates1
Chief Executive
Group Finance Director
Business Group Directors
Company Secretary
Head of Business Ethics and Governance
Head of Internal Audit
External Auditor2
Presented reports Participated in debate/answered Committee questions
1 Committee members also receive regular technical updates from KPMG’s Audit Committee Institute.
2 The external auditor met with the members of the Committee following the February 2014 and 2015 meetings, in a private session without management present.

Strategic Report 01–41 Governance 42–74 Financial Statements 75–131
54Spectris plc Annual Report and Accounts 2014
Provisions
Working capital provisionsProvisions are made to write down slow- moving and obsolete inventory items to net realisable value, based on an assessment of technological and market developments and on an analysis of historic and projected usage with regard to quantities. The assessment used to calculate the provisions needed requires the application of judgement by management.
The Group’s approach to trade receivables is for the initially recognised fair value to be reduced by appropriate allowances for estimated irrecoverable amounts. The application of this approach requires judgement by management in respect of amounts which are deemed irrecoverable. Further information about our exposure to credit risk and the quality of our receivables is set out in Note 14 to the Financial Statements.
Management confirmed to the Committee that there have been no significant changes to the approach used to estimate working capital provisions from the prior year.
The external auditor explained to the Committee the work it had conducted during the year. On the basis of its audit work, the external auditor reported no material inconsistencies or misstatements. Following discussion, the Committee was satisfied that the judgements that had been exercised were appropriate and that therefore the provisions were appropriately stated at the year end.
tax provisionsProvisions held in respect of tax risks are included within current and deferred tax liabilities depending on the underlying circumstances of the provision. Significant management judgement is exercised in arriving at the amounts to be provided.
Management confirmed to the Committee that the provisions recorded at 31 December 2014 represent their best estimate of the likely financial exposure faced by the Group.
The external auditor explained to the Committee the work it had conducted during the year, including how its audit procedures were focussed on those provisions with the highest level of judgement on recognition criteria and/or measurement. The Committee discussed with both management and the external auditor the key judgements which had been made and was satisfied that they were reasonable and that, accordingly, the provision amounts recorded were appropriate.
Other provisions (including product warranty, legal and divestment-related provisions)As further explained in Note 1 to the Financial Statements, a provision is recognised in the Financial Statements when the Group has a present legal or constructive obligation as a result of a past event and it is probable an outflow of resources, that can be reliably measured, will be required to settle the obligation. Provisions are recognised at an amount equal to management’s best estimate of the expenditure required to settle the Group’s liability, taking into account the time value of money, where this is considered material.
On legal and contractual exposures, the Committee received reports in January and July 2014 and January 2015 from the Head of Commercial and Company Secretary outlining the open legal and contractual disputes and best estimate of the expected costs associated with such matters.
Management confirmed to the Committee that the provisions recorded at 31 December 2014 represented their best estimate of the likely financial exposure faced by the Group.
The external auditor explained to the Committee the work it had conducted during the year, which supported the carrying value of the provisions. Following discussion of the key assumptions and judgements, the Committee concluded that the carrying values were reasonable in the circumstances.
Further information about the specific categories of provisions held by the Group is set out in Note 18 to the Financial Statements.
Misstatements Management confirmed to the Committee they were not aware of any material or immaterial misstatements made intentionally to achieve a particular presentation.
The Committee confirms that as a result of the presentations made to the Committee by the external auditor and the ensuing discussions and questioning of the external auditor by Committee members, it is satisfied that the external auditor has fulfilled its responsibilities with diligence and professional scepticism.
After reviewing the presentations and reports from management and consulting where necessary with the external auditor, the Committee is satisfied that the Financial Statements appropriately address critical judgements and key estimates (both in respect to the amounts reported and the disclosures). The Committee is also satisfied that the significant assumptions used for determining the value of assets and liabilities have been appropriately scrutinised, challenged and are sufficiently robust.
Audit and Risk Committee Reportcontinued

Strategic Report 01–41 Governance 42–74 Financial Statements 75–131
55Spectris plc Annual Report and Accounts 2014
Fair, balanced and understandable The fair, balanced and understandable processes adopted in relation to the 2013 Annual Report were further enhanced this year with the establishment of a project team made up of members of Group Finance, Group Secretariat and Corporate Affairs, all responsible for authoring the Annual Report. Regular meetings were held during the compilation period to ensure that there was appropriate linkage between the various sections of the report and balanced reporting. In addition, an extensive verification exercise was undertaken to ensure factual accuracy, and comprehensive reviews of the draft Annual Report and Accounts were undertaken by Executive and senior management, including a formal review of all Board and Board Committee minutes. The December 2014 meeting held to review an early draft of the Annual Report and Accounts provided an opportunity to challenge the fair, balanced and understandable assessment and test whether appropriate balance had been given to positive and negative news. Following discussions at our February 2015 meeting, we have advised the Board that the Annual Report and Accounts, taken as a whole, are fair, balanced and understandable.
Oversight of internal audit and risk management The Committee took responsibility for reviewing the Group’s internal controls through engagement with the Head of Internal Audit, who is employed to perform control reviews across the Group according to a work programme agreed by the Committee. The 2014 internal audit plan was established based on a number of factors. These include ensuring an appropriate level of audit coverage of the Group’s core financial processes is achieved through rotational site visits, whilst also providing the Committee with reasonable assurance that controls in respect of certain key areas of risk management, such as compliance with laws and regulations or new product development, operate effectively.
The Head of Internal Audit is assisted in this work by six further internal auditors who are located in key strategic locations of the United States, Asia and the UK. In addition, the internal audit function is supported by additional resources as required – drawn both internally from within the organisation and externally through a co-sourcing agreement with Deloitte.
The Committee debated and agreed the adequacy of internal assurance resources at its meetings in January and July 2014 and January 2015, during which the progress on the internal audit plan was also examined.
Each operating company regularly assesses, evaluates and reports risks of Group significance against established criteria with respect to the impact, likelihood and time frame of each identified risk. In addition, each operating company is required to document how it is managing and mitigating these risks. A summary of the status of risks is reviewed by the Committee at least twice a year.
Additional information on the Group’s risk management framework is contained on page 16 in the Strategic Report.
Further information on the processes which the Board and the Committee have applied in reviewing the effectiveness of the Group’s internal control framework is summarised on page 50.
Anti-bribery framework – third-party management
During the year, robust efforts were made in the operating companies to implement the enhanced third-party due diligence framework, which assesses the commercial viability of existing and new sales channel partners as well as the potential anti-bribery risks, with a particular focus on higher-risk territories.
As part of the Committee’s risk remit, it scrutinised the third-party management framework and programme implementation at its July 2014 meeting. Further periodic updates will be provided to the Committee going forward.
Scope of third parties• Sales channel partners identified and quantified across the Group
Third-party risk assessment and due diligence
• Circa 25% of partners prioritised for risk assessment
• Principal criteria used for prioritisation include:
– Home market and countries of operation
– Sales volume
– Length of relationship
– Interactions with government entities
Risk mitigation and approval
• Mitigation steps include:
– Contractual audit rights
– Anti-bribery undertakings
– Anti-bribery training
– Contract termination
Appropriate segregation of responsibilities as part of control framework: end-to-end processing or qualification is not completed by a single individual. Review, determination of appropriate mitigation and approval dealt with by different individuals dependent on risk score.
Phase 1:Information gathering
Phase 2:Third-partyqualification

Strategic Report 01–41 Governance 42–74 Financial Statements 75–131
56Spectris plc Annual Report and Accounts 2014
External auditor – appointment, effectiveness and independenceThe Committee is responsible for overseeing the selection process relating to the appointment of the external auditor, making recommendations to the Board for the auditor’s reappointment and approving the external auditor’s remuneration, its terms of engagement and scope of work. Re-appointment of the external auditor is considered by the Committee each year following a review of the external auditor’s effectiveness. The effectiveness of KPMG LLP was therefore reviewed by the Committee and following that review the Committee was content to reappoint KPMG LLP as the Company’s external auditor.
KPMG LLP was appointed as the Company’s auditor on 12 May 1998, but the lead audit partner has changed three times subsequently, in line with rotation requirements. The current audit partner is Richard Broadbelt, who was appointed on 19 April 2012. It is the Committee’s current policy to put the external audit contract out to tender at least every ten years. The next tender will be no later than the planned rotation of the current audit partner in 2016. There are no contractual obligations that restrict the Committee’s choice of auditor.
To assess the effectiveness of the external auditor, the Committee reviewed the fulfilment of the agreed audit plan, reports of major issues arising from the audit process and commentary from the Group Finance Director, Group Finance, Internal Audit, and operating company management teams. The Committee also reviewed the procedures followed by the external auditor to achieve audit quality.
The Committee has a non-audit services policy governing and restricting the appointment of the external auditor for non-audit services. Services which have the potential to, or appear to, impair their independence, for example, involvement in activities that require making judgements or decisions which are the responsibility of management, are expressly precluded. The policy is available on the Company’s website.
The Committee considers it essential to rigorously impose the cumulative annual cap for non-audit services (save for acquisition due diligence and taxation services), above which all engagements are subject to the Committee’s prior approval. Non-audit fees for the year amounted to £0.3 million. Further details are included in Note 5 to the Financial Statements.
The external auditor’s full-year report to the Committee contained a statement on its independence and compliance with the Auditing Practices Board’s Ethical Standards, arrangements to manage conflicts of interest and the nature and associated fees for non-audit services provided, which was assessed by the Committee.
The cumulative cap, periodic refreshment of the external audit team and review of its work, together with the ten-year re-tendering of the external audit service contract, are considered by the Committee to be appropriate controls to mitigate threats to the independence and objectivity of the external auditor.
The Committee has considered the risk of the withdrawal of its auditor from the market in its risk evaluation and planning and has concluded that the risk is insignificant. In the event that the Company’s auditor did exit the market, a replacement appointment would be made from audit firms of equivalent standing.
Whistleblowing policy and processDetails of the Group’s whistleblowing policy are provided within the Ethics Report on page 28.
Information security During 2014, we further developed our information security programme. We continued the rollout of our information security training programme entitled “The value of information” in order to increase the level of information security awareness, provide guidance and encourage the adoption of safe information handling practices. In August, a series of meetings were held with operating companies to set out the future vision of the information security programme, ensuring that there was a common information security risk baseline across the Group with valuable information assets and specific risks/threats against these assets identified. A new risk register was developed to facilitate this, detailing the controls in place and risk mitigating strategies required. In 2015, an external advisory firm will be engaged to undertake an independent assessment and benchmarking of the identified risks and controls at the operating companies, such that a tailored information security roadmap will be developed. The operating companies will then be tasked to prioritise and implement the recommendations. Following this implementation, assurance on the risks and controls will be obtained from Group internal audit.
Audit and Risk Committee Reportcontinued

Strategic Report 01–41 Governance 42–74 Financial Statements 75–131
57Spectris plc Annual Report and Accounts 2014
Acquisitions and disposalsDetails of the Group’s acquisitions during 2014 are given in Note 24 to the Financial Statements and are described in the Financial Review on page 39. There were no disposals during the year.
Share capitalThe share capital of the Company comprises ordinary shares of 5p each; each share carries the right to one vote at general meetings of the Company. The authorised and issued share capital of the Company, together with movements in the Company’s issued share capital during the year, is shown in Note 21 on page 109. The Articles of Association of the Company, available on the Company’s website, contain provisions governing the ownership and transfer of shares.
At the 2014 Annual General Meeting, shareholders authorised the Directors to make market purchases of the Company’s ordinary shares up to a maximum number of 11,867,000 shares, representing approximately 10% of the issued share capital of the Company (excluding Treasury shares) and to either cancel the shares or hold them as Treasury shares which may then be cancelled, sold for cash, or transferred for the purposes of the Company’s share plans, depending on the best interests of the Company’s shareholders at the time. No such purchases were made during the year. At the close of business on 26 February 2015, the Company had 125,005,123 ordinary shares in issue, of which 6,011,089 were held in Treasury. During the year, 289,419 shares were transferred out of Treasury to meet the Company’s obligations under its share plans, with no shares being cancelled out of Treasury. An authority to make further market purchases of the Company’s ordinary shares, if believed appropriate, will be sought at the forthcoming Annual General Meeting, although the Board has no present intention of so doing.
Included in the special business of the 2015 Annual General Meeting are proposals to renew the Directors’ authority to allot shares up to prescribed limits.
At 26 February 2015, interests notified to the Company in accordance with Chapter 5 of the Disclosure and Transparency Rules
comprised the below. All significant holdings are held by institutional investors:
•Massachusetts Financial Services Company 5,952,015 shares (5.02% material interest)
•Standard Life Investments Limited 5,912,289 shares (4.97% material interest)
Takeovers DirectivePursuant to Section 992 of the Companies Act 2006, which implements the EU Takeovers Directive, the Company is required to disclose certain additional information. The disclosures not covered elsewhere in this Annual Report are as follows:
The Company’s Articles of Association (‘Articles’) give power to the Board to appoint Directors, but require Directors to submit themselves for election at the first Annual General Meeting following their appointment, and for annual re-election at subsequent Annual General Meetings.
The Board is responsible for the management of the business of the Company and may exercise all the powers of the Company subject to the provisions of the relevant statutes and the Company’s Articles. The Articles contain specific provisions and restrictions regarding the Company’s power to borrow money. Powers relating to the issuing and buying back of shares are also included in the Articles, and such authorities are renewed by shareholders each year at the Annual General Meeting. Required amendments to the Articles are approved by shareholders in general meeting.
There are a number of agreements that take effect, alter or terminate upon a change of control of the Group following a takeover, such as bank loan agreements and Company share plans. None of these are deemed to be significant in terms of their potential impact on the business of the Group as a whole. It is also possible that funding arrangements for the Group’s defined benefit pension arrangements would need to be enhanced following a change of control if that resulted in a weakening of the employer covenant.
DividendResults for the Group are set out in the Consolidated Income Statement on page 78 and in the supporting notes. A final dividend of 30.5p per ordinary share is proposed for the year to 31 December 2014 (2013: 28.0p). With the interim dividend, this makes a total for the year of 46.5p (2013: 42.75p). The final dividend will be paid on 26 June 2015 to shareholders on the register on 29 May 2015.
DirectorsThe Directors of the Company are named on pages 42 and 43.
In accordance with the requirement of the UK Corporate Governance Code, each Director resigned at the 2014 Annual General Meeting and submitted themselves for election or re-election, with all Directors being elected or re-elected.
The Directors’ total remuneration for the year and their interests in the shares of the Company and its subsidiaries at 31 December 2014 are disclosed in the Directors’ Remuneration Report on pages 61 to 74.
In accordance with Section 236 of the Companies Act 2006, the Directors disclose a qualifying third-party indemnity provision entered into between the Company and its Directors and officers which was in force at the date of approval of this report. This indemnity gives contractual force to the Indemnity of Officers provision contained in the Company’s Articles.
AuditorSeparate resolutions to re-appoint KPMG LLP as auditor and to authorise the Directors to agree its remuneration will be proposed at the Annual General Meeting.
Annual General MeetingThe Notice of Annual General Meeting to be held at Great Fosters, Stroude Road, Egham, Surrey TW20 9UR on Friday, 24 April 2015 at 12.30 pm, is contained in a separate letter from the Chairman accompanying this report.
Going concernHaving reviewed the Group’s plans and available financial facilities, the Board has a reasonable expectation that the Group has adequate resources to continue in operational existence for the foreseeable future. For this reason it continues to adopt the going concern basis in preparing the Group’s accounts.
Other Statutory Information

Strategic Report 01–41 Governance 42–74 Financial Statements 75–131
58Spectris plc Annual Report and Accounts 2014
Company law requires the Directors to prepare Group and Parent Company Financial Statements for each financial year. Under that law they are required to prepare the Group Financial Statements in accordance with International Financial Reporting Standards (‘IFRS’) as adopted by the EU and applicable law and have elected to prepare the Parent Company Financial Statements in accordance with UK Accounting Standards.
Under company law the Directors must not approve the Financial Statements unless they are satisfied that they give a true and fair view of the state of affairs of the Group and Parent Company and of their profit or loss for that period. In preparing each of the Group and Parent Company Financial Statements, the Directors are required to:
•select suitable accounting policies and then apply them consistently;
•make judgements and estimates that are reasonable and prudent;
• for the Group Financial Statements, state whether they have been prepared in accordance with IFRS as adopted by the EU;
• for the Parent Company Financial Statements, state whether applicable UK Accounting Standards have been followed, subject to any material departures disclosed and explained in the Parent Company Financial Statements; and
•prepare the Financial Statements on the going concern basis unless it is inappropriate to presume that the Group and Parent Company will continue in business.
The Directors are responsible for keeping adequate accounting records that are sufficient to show and explain the Parent Company’s transactions and disclose with reasonable accuracy at any time the financial position of the Parent Company and enable them to ensure that its Financial Statements comply with the Companies Act 2006. They have general responsibility for taking such steps as are reasonably open to them to safeguard the assets of the Group and to prevent and detect fraud and other irregularities.
Under applicable law and regulations, the Directors are also responsible for preparing a Strategic Report, Directors’ Report, Directors’ Remuneration Report and Corporate Governance Statement that comply with that law and those regulations.
The Directors are responsible for the maintenance and integrity of the corporate and financial information included on the Company’s website. Legislation in the UK governing the preparation and dissemination of financial statements may differ from legislation in other jurisdictions.
The Directors who held office at the date of approval of the Directors’ Report confirm that, so far as they are each aware, there is no relevant audit information of which the Company’s auditor is unaware; and each Director has taken all steps that they ought to have taken as a Director in order to make themselves aware of any relevant audit information and to establish that the Company’s auditor is aware of that information.
Responsibility statement of the Directors in respect of the Annual Report and Accounts We confirm that to the best of our knowledge:
• the Financial Statements, prepared in accordance with the applicable set of accounting standards, give a true and fair view of the assets, liabilities, financial position and profit or loss of the Company and the undertakings included in the consolidation taken as a whole; and
• the Strategic Report includes a fair review of the development and performance of the business and the position of the issuer and the undertakings included in the consolidation, taken as a whole, together with a description of the principal risks and uncertainties that they face.
We consider that the Annual Report and Accounts, taken as a whole, is fair, balanced and understandable, and provides the information necessary for shareholders to assess the Group’s position and performance, business model and strategy.
By order of the Board
Roger Stephens Secretary
27 February 2015
Statement of Directors’ Responsibilities in respect of the Annual Report and the Financial Statements
The Directors are responsible for preparing the Annual Report and the Group and Parent Company Financial Statements in accordance with applicable law and regulations.

Strategic Report 01–41 Governance 42–74 Financial Statements 75–131
59Spectris plc Annual Report and Accounts 2014
Compliance with the UK Corporate Governance Code
For the year ended 31 December 2014, the Board believes that the Company has complied with the principles and provisions of the UK Corporate Governance Code. A full version of the UK Corporate Governance Code can be found on the Financial Reporting Council’s website at www.frc.org.uk. Further details on how compliance is achieved can be found in the Corporate Governance Report and the Directors’ Remuneration Report.
A Leadership
A1 The Board’s roleThe Board met seven times in 2014 in order to review the Company’s performance and strategy against set objectives. The Board’s role is to lead the Group with a view to the creation of strong, sustainable financial performance and long-term shareholder value.
The Board has adopted a clear schedule of matters reserved for its specific approval, including a framework for those decisions which can be delegated to committees or otherwise.
A2 A clear division of responsibilitiesThe Board’s policy is that the roles of the Chairman and the Chief Executive should be performed by different people. The division of responsibilities is documented and clearly understood. The Chairman is responsible for the leadership and effectiveness of the Board, and the Chief Executive is responsible for leading the day-to-day management of the Company within the strategy set by the Board.
A3 Role of the ChairmanThe Chairman sets the agenda for meetings, manages the meeting timetable and facilitates open and constructive dialogue during the meetings.
A4 Role of the Non-executive DirectorsThe Chairman promotes an open and constructive environment in the boardroom and actively invites the Non-executive Directors’ views.
The then Senior Independent Director, John Warren, held a meeting in June 2014 with the Non-executive Directors without the Executive Directors being present, providing an opportunity for any concerns to be discussed.
B Effectiveness
B1 The Board’s compositionThe composition of the Board is reviewed regularly by the Nomination Committee to ensure that there is an appropriate mix of skills on the Board and a range of diverse experience. Board members’ biographies are provided on pages 42 and 43, which identify the experience each Director brings to the Board. Diagrams identifying the skills and experience of Board members can be found on page 46.
The Board determines, through the Nomination Committee, the independence of its members. Conflicts of interest are regularly monitored.
The Board currently consists of ten individuals: the Chairman, two Executive Directors, and seven independent Non-executive Directors.
B2 Board appointmentsThe appointment of new Directors to the Board is led by the Nomination Committee.
The Committee’s terms of reference, as published on the Company’s website, document its responsibility regarding Board appointments. The Committee consists of all seven Non-executive Directors, the Chairman and the Chief Executive. Further details of the appointments undertaken during the year and succession planning can be found on page 49.
B3 Time commitmentsThe time commitments of Non-executive Directors are defined on appointment.
The Chairman’s significant listed company interests are as executive chairman of Telecity Group plc, non-executive chairman of Sepura plc and Just Eat plc, and as non-executive director of CSG International, Inc. (the latter company being listed on NASDAQ). The Board has formally reviewed the Chairman’s other commitments and confirms that it believes that the Chairman’s obligations to the Company are properly fulfilled notwithstanding these directorships. Indeed, the Board is appreciative of the additional skills and experience the Chairman brings to the Board arising from these directorships.

Strategic Report 01–41 Governance 42–74 Financial Statements 75–131
60Spectris plc Annual Report and Accounts 2014
Compliance with the UK Corporate Governance Codecontinued
B4 Training and developmentThere are procedures for Directors to receive induction and training as appropriate. The Chairman reviews and agrees with each Director their training and development needs annually.
B5 Provision of information and supportDirectors are able to solicit independent professional advice at the Company’s expense where specific expertise is required in the course of discharging their duties. All Directors have access to the Company Secretary, who is responsible for ensuring compliance with appropriate statutes and regulations.
B6 Board and Committees performance evaluationThe Board and the Board Committees undertook an internal evaluation in 2014.
Details of the process undertaken and outcomes are detailed on page 45.
B7 Re-election of the DirectorsAll Directors are subject to election by shareholders at the first AGM following their appointment to the Board. In accordance with the UK Corporate Governance Code, all Directors are then subject to annual re-election.
Each Director retires at the AGM and, if considered appropriate by the Board, is proposed for election or re-election. That procedure took place at the 2014 AGM, with all Directors being elected or re-elected. In determining whether a Director should be proposed for re-election at the 2015 AGM, the Board took into account the Nomination Committee’s advice based on the results of a peer group review of each Director’s contribution to the Board’s effectiveness, which formed part of the internal Board evaluation. This review confirmed that all Directors continue to be effective and demonstrate commitment to their roles and the Committee accordingly recommended their re-appointment.
C Accountability
C1 Financial and business reportingThe Statement of the Directors’ Responsibilities is set out on page 58, and the Independent Auditor’s Report is on pages 75 to 77. The Company’s business model is explained on pages 4 and 5.
C2 Risk management and internal control systemsThe Board sets the Company’s risk appetite and annually reviews the effectiveness of the Company’s risk management and internal control systems. The work of the Audit and Risk Committee, which assists the Board with its responsibilities in relation to risk management, reporting and assurance, is set out on pages 51 to 56.
C3 Role and responsibilities of the Audit and Risk Committee Details of the composition of the Audit and Risk Committee, and how the Committee has discharged its responsibilities during the year, are provided in the Audit and Risk Committee Report on pages 51 to 56.
D Remuneration
D1 Levels and elements of remunerationThe Board believes that the Directors’ Remuneration Policy continues to promote the long-term success of the Company, taking account of appropriate risk considerations, in the interest of shareholders. Executive Director remuneration is an appropriate balance between fixed and performance related elements, the latter being subject to demanding performance conditions aligned with the Group’s strategic objectives. For further information, see the Directors’ Remuneration Policy, contained in the 2013 Annual Report and Accounts. This can be viewed under the Investors section of the Company’s website.
D2 Development of remuneration policy and packagesThe membership of the Remuneration Committee is made up of the Non-executive Directors only. The terms of reference for the Remuneration Committee are available on the Company’s website.
The Remuneration Committee has delegated authority for setting the remuneration of the Executive Directors and the Chairman. The fees payable to the Non-executive Directors are determined by the Board.
E Relations with shareholders
E1 Shareholder engagement and dialogueSpectris has a comprehensive Investor Relations programme designed to assist existing and potential investors in understanding the Group. These meetings are attended by the Chief Executive, the Group Finance Director and the Head of Corporate Affairs. Spectris conducts regular dialogue with institutional shareholders and discloses such information as is permitted within the guidelines of the Listing Rules.
Shareholders representing in excess of 2.5% of the Company’s issued share capital receive a standing invitation to meet with the Chairman, the Senior Independent Director, or Non-executive Directors. Such meetings supplement if necessary, but do not replace, the regular meetings with the Chief Executive and the Group Finance Director. The Board is kept informed of the views, needs and expectations of shareholders through periodic reports including, but not limited to, market feedback on Investor Relations, shareholding analysis and consensus.
E2 Constructive use of the AGMShareholders are invited to the Company’s AGM and have the opportunity to meet and question the Chairman and Board members. The results of proxy votes are available at the AGM. These are then published on the Company’s website.

Strategic Report 01–41 Governance 42–74 Financial Statements 75–131
61Spectris plc Annual Report and Accounts 2014
Letter from Russell KingChairman of the Remuneration Committee
Directors’ Remuneration Report
Dear Shareholder
I am pleased to present the 2014 Directors’ Remuneration Report.
I should like to express your Committee’s thanks to our investors for the overwhelming support given to the new Directors’ Remuneration Policy at the 2014 AGM. The changes introduced within the Policy remain appropriate for the Company’s needs and, consequently, no amendments are being proposed for consideration at the 2015 AGM.
Remuneration strategy Linking total reward closely to business strategy and performance continues to underpin your Committee’s consideration of executive remuneration. We aim to ensure that the Company’s Remuneration Policy is designed to promote long-term success, taking account of appropriate risk considerations. Accordingly, the Executive Directors’ overall package provides an appropriate balance between fixed and performance-related remuneration, with the latter elements being subject to demanding performance conditions aligned with the Group’s strategic objectives.
The key elements of the Executive Directors’ remuneration arrangements are:
• base salary and total package set modestly below the median of UK quoted companies of comparable size, subject to adjustment up or down to reflect the experience and performance of individual incumbents;
• on-target and maximum annual bonus of, respectively, 60% and 125% of salary, only payable on achievement of stretching profit and individual objectives;
• annual awards under the Company’s Performance Share Plan (‘PSP’) of up to 200% of salary, with vesting after three years based one-third upon Total Shareholder Return (‘TSR’) relative to the FTSE 250 index, one-third upon Earnings Per Share (‘EPS’) growth, and one-third on economic profit delivery;
• benefits provided on a market competitive basis; and
• any bonus payment in excess of 60% to be applied to the purchase of Spectris shares and any shares arising (post tax) from PSP vesting to be retained until a three times base salary shareholding is achieved.
The anticipated reward mix for the Chief Executive and Group Finance Director is shown in the chart opposite. This assumes PSP awards with a value on grant equal to 200% of the Director’s base salary leading to an expected vesting of 110% of base salary and an annual bonus on-plan expectation of 60% of salary.
The recently released update to the UK Corporate Governance Code asks Remuneration Committees to consider requiring an extended holding period for shares arising after the vesting of three-year PSP grants. I can confirm that this possibility was considered prior to submission of the Directors’ Remuneration Policy to the 2014 AGM and has been reviewed subsequently. Whilst appreciating the desirability of longer-term alignment with shareholders’ interests, your Committee believes that this is equally achieved by the three times base salary shareholding guideline, which was introduced within the new policy and lies significantly above normal practice elsewhere. However, the issue will be brought forward for further review in 2015.
Russell KingChairman of the Remuneration Committee
Anticipated reward mix for Chief Executive and Group Finance Director
Base pay 40% Pension 10% Annual bonus 24% Performance Share Plan 26%

Strategic Report 01–41 Governance 42–74 Financial Statements 75–131
62Spectris plc Annual Report and Accounts 2014
2014 remunerationThe Spectris Executive Team has produced satisfactory results for 2014 in challenging conditions for certain markets. However, the target profitability established by your Committee at the outset of the year was not achieved and hence no payment will be made under this element of the annual bonus plan.
A good level of performance was achieved against the personal objectives set in respect of 2014, and an average bonus was achieved for the Executive Directors of 17% out of a potential 25% of base salary for these objectives.
In the period from the end of the base year, 2011, to 2014, the Company’s share price has risen by 63% and the annual dividend by 38%. However, the PSP awards maturing on 24 February 2015 will not vest on the EPS measure and are not expected to vest on the TSR measure. In the period from 2012 to 2014, the EPS compound annual return growth was modest at 0.2%, largely due to measuring this growth from a high EPS base year in 2011.
Whilst only a snapshot in time, as at the end of 2014 the PSP grants maturing in 2016 are also unlikely to vest on either of the EPS or TSR measures. The grants made in March 2014 are too early in their three-year performance period to make reliable predictions as to outcome.
Future reviewsThe Committee’s remuneration advisers, FIT Remuneration Consultants LLP (‘FIT’), completed the biennial benchmarking review of the Chairman’s fee during the year. Based on the results of that review, your Committee determined that an increase from £180,000 to £200,000 should be implemented with effect from 1 January 2015; with a subsequent increase to £210,000 to follow at 1 January 2016. FIT benchmarking data shows a median Chairman fee of £220,000 for companies of comparable size to Spectris.
2015 salary Increase
J E O’Higgins £569,500 1.8%
C G Watson £361,800 1.8%
In line with the undertaking I provided last year, the Executive Directors’ salaries were increased at a level consistent with average UK wage inflation as shown above (although, in accordance with the Directors’ Remuneration Policy, the Committee reserves the right to award future increases in excess of this should this be considered appropriate).
I hope that you will agree that our remuneration strategy and its implementation remain appropriate and that you will support the advisory vote on the 2014 Directors’ Remuneration Report at the 2015 AGM.
Yours sincerely
Russell King Chairman of the Remuneration Committee
27 February 2015
Directors’ Remuneration Reportcontinued

Strategic Report 01–41 Governance 42–74 Financial Statements 75–131
63Spectris plc Annual Report and Accounts 2014
The Directors present their Remuneration Report for the year ended 31 December 2014.
Remuneration CommitteeThe Committee is responsible for recommending to the Board the policy for the remuneration of the Chairman, the Chief Executive, the Group Finance Director, the Company Secretary and other members of the Group Executive Committee. The remuneration of Non-executive Directors is reserved to the Board.
The Remuneration Committee at the date of this report comprises Russell King (Chairman), Peter Chambré, Lisa Davis, Ulf Quellmann, Bill Seeger, John Warren and Martha Wyrsch (all of whom are independent Non-executive Directors). No member of the Committee is a serving executive director at another UK listed company. The Chairman and Chief Executive may be in attendance by invitation and the Committee takes into consideration their recommendations regarding the remuneration of their executive colleagues. Neither are involved in discussions concerning their own remuneration.
Within its terms of reference agreed by the Board, the Committee determines:
• total individual remuneration packages, including bonuses and share-based incentives for the Executive Directors and other members of the Executive Committee;
• targets for any performance-related incentives;
• the scope of any pension arrangements;
•contractual terms of engagement and any payments to be made on termination; and
• the policy for authorising claims for expenses from the Chairman and Chief Executive.
The Remuneration Committee regularly reviews the balance between fixed and variable pay and the performance conditions attaching to short and long-term incentives. The Committee also monitors the level and structure of remuneration for business unit Presidents and Managing Directors.
The terms of reference of the Remuneration Committee can be found on the Company’s website and are available on request.
FIT was appointed in August 2011 to advise the Committee on various aspects of the Chairman’s and Executive Directors’ remuneration. FIT’s Mr J Lee provides such advice to the Committee. Neither FIT nor Mr Lee provide any other services to the Company. New Bridge Street (‘NBS’) separately provide services to the Company in compiling IFRS 2 ‘Share Based Payment’ reporting on the Company’s share plans and TSR performance calculations in relation to the Company’s Performance Share Plan. NBS do not provide any other services to the Company. FIT was paid £35,083 in respect of services undertaken in 2014 (2013: £58,909). NBS was paid £24,854 in respect of services undertaken in 2014 (2013: £28,298). These fees were charged on the basis of each firm’s standard terms of business.
Both FIT and NBS are members of the Remuneration Consultants Group and adhere to its Code of Conduct. The firms were appointed by the Committee following appropriate consideration of their experience and their knowledge of the Company’s business. The Committee is therefore satisfied that the advice which it receives is objective and independent.
Remuneration Policy implementation statement The Board, in considering the recommendations of the Remuneration Committee, complied throughout the year with the provisions of the UK Corporate Governance Code (including the principles for performance-related remuneration set out in Section D). The Directors’ Remuneration Policy, approved by shareholders at the 2014 Annual General Meeting, was adhered to throughout the year and seeks to ensure that the high calibre individuals required at board level are a) fairly and competitively remunerated and b) incentivised in a manner which aligns with and drives the Group’s strategic objectives in a manner compatible with its risk policies and internal control systems.
The Directors’ Remuneration Policy was set out within the 2013 Directors’ Remuneration Report, contained in the 2013 Annual Report and Accounts. This can be viewed under the Investors section of the Company’s website.
The table below describes each component of the remuneration package applicable to the Executive Directors under the Directors’ Remuneration Policy:
Element of remuneration package
Relevance to the Company’s short and long-term strategic objectives
Operation Maximum potential value
Performance metrics
Base salary Competitive fixed remuneration that enables Spectris to attract and retain key executives.
Reviewed annually. Benchmarked triennially against relevant comparators.
The current intent is to limit any increases for Executive Directors to the average increase for general UK wage inflation although the Committee reserves the right to award increases in excess of this should it consider that to be appropriate.
The general policy is to limit salaries to the median for the roles. However, as a formal cap is required, no increase will be made if it would take an Executive Director’s salary above (or, if already above, further above) 110% of the median level of the salaries of chief executives within a comparator group of companies which, when or shortly prior to when the increase is proposed, are ranked by market capitalisation within plus or minus 20 companies of Spectris.
Reflects both the role and the Director’s skills, performance and experience, referenced to a level at or modestly below the comparator group’s median.

Strategic Report 01–41 Governance 42–74 Financial Statements 75–131
64Spectris plc Annual Report and Accounts 2014
Element of remuneration package
Relevance to the Company’s short and long-term strategic objectives
Operation Maximum potential value
Performance metrics
Annual bonus Drives short-term profit performance.
Incentivises executives to achieve specific pre-determined stretching objectives relevant to Spectris and the individual’s personal responsibilities.
Bonus potential is set at a market competitive level.
Bonus payments in excess of 60% of salary must be used to acquire shares in Spectris until the minimum holding of three times base salary is achieved.
Payable in cash.
Clawback provisions enable variable remuneration to be reclaimed under exceptional circumstances, were there to be any miscalculation of entitlement, misstatement of accounts, or incidence of fraud.
Increased to 125% of salary from 2014 (previously 100%).
The performance measures to be applied will be assessed annually and may be financial or non-financial and corporate, divisional or individual and in such proportions as the Committee considers appropriate.
Once set, performance measures will generally remain unchanged for the year, except to reflect events such as corporate acquisitions or other major transactions.
A minimum (threshold) level of performance will result in a 1% of salary bonus. At target this is 60% of salary and at maximum, this will be 125% of salary.
The Spectris Performance Share Plan (‘PSP’)
Drives the delivery of sustained compound annual growth in EPS, relative out- performance in TSR, and increased economic profit.
Awards made annually, with a three-year vesting duration. The Committee may modify the terms for future awards provided they are not, overall, more favourable to participants.
Subject to similar clawback provisions as described above for annual bonus.
Awards may be made in the standard form of awards to receive shares for nil or nominal cost (with the shares either being delivered automatically at vesting or being delivered at a time following vesting at the individual’s choice), forfeitable awards of shares or in the form of cash-based conditional awards.
The Company also has scope to satisfy the above awards using an HMRC-approved Executive Share Option Scheme (which permits market value share options to be awarded subject to the HMRC’s limit of, currently, £30,000).
The Company will honour the vesting of all awards granted under previous policies in accordance with the terms of such awards.
Increased to 200% of salary from 2014 (previously 125%).
Notional reinvestment of dividends will apply from date of grant to date of vesting.
The Committee may set such performance conditions on PSP awards as it considers appropriate (whether financial or non-financial and whether corporate, divisional or individual).
Directors’ Remuneration Reportcontinued

Strategic Report 01–41 Governance 42–74 Financial Statements 75–131
65Spectris plc Annual Report and Accounts 2014
Element of remuneration package
Relevance to the Company’s short and long-term strategic objectives
Operation Maximum potential value
Performance metrics
Pension and benefits in kind
Market competitive defined contribution pension and benefits in kind, enabling Spectris to attract and retain key executives.
Benefits in kind include company cars or allowances, private fuel and medical expenses, life and disability insurance.
Pension and benefits in kind are benchmarked periodically.
25% of salary company pension contribution and/or taxable allowance in lieu.
It is not possible to prescribe the likely change in the cost of insured benefits or the cost of some of the other reported benefits and so a monetary limit of £30,000 p.a. post tax per Executive Director has been set for the duration of this policy although, clearly, the Committee will monitor the costs in practice and ensure that the overall costs do not increase by more than the Committee considers to be appropriate in all the circumstances.
Where the requirements of the business involve a Director relocating, the Company may make a payment towards related expenses of up to £60,000. While not practice to date, the Committee may award additional expatriate allowances if such a relocation is to outside the UK of up to a further £30,000 p.a.
A departing gift may be provided up to a value of £2,500 per Director.
Not applicable to this element.
All-employee share plans
The Spectris Savings Related Share Option Scheme is operated to encourage share ownership by employees, thereby allowing them to share in the long-term success of the Group and align their interests with those of shareholders.
Individuals may save up to a maximum of £500 per month for a fixed period of three years. At the end of the savings period, individuals may use their savings to buy ordinary shares in the Company. There is flexibility to set an exercise price at a discount (currently capped at 20%) to the market price set at the launch of each scheme although Spectris does not currently offer such a discount.
Executive Directors are able to participate in all-employee share plans on the same terms as other Group employees.
Consistent with normal practice, such awards are not subject to performance conditions.
Share ownership guidelines
To encourage share ownership by the Executive Directors and ensure their interests are aligned with shareholders.
Executive Directors are required to apply the post-tax benefit of any vested Plan awards or any bonus payments exceeding 60% of base salary to the acquisition of shares until the required level of shareholding is achieved.
Each Executive Director is, subject to personal circumstances, required to build a retained shareholding in Spectris plc of at least three times base salary in value within a five-year period from appointment.
Not applicable to this element.
Directors’ Remuneration Reportcontinued

Strategic Report 01–41 Governance 42–74 Financial Statements 75–131
66Spectris plc Annual Report and Accounts 2014
The table below describes the remuneration package applicable to the Chairman and the Non-executive Directors under the Directors’ Remuneration Policy:
Element of remuneration package
Relevance to the Company’s short and long-term strategic objectives
Operation Maximum potential value
Performance metrics
Fees Competitive fees that enable Spectris to attract able and experienced Directors.
Reviewed biennially and determined by reference to market practice.
Base fee is supplemented by allowances for chairmanship of the Audit and Risk and Remuneration Committees, travel allowance and chairmanship of the pension scheme trustee board. The Board reserves the right to vary the basis for setting fees (such as introducing Committee membership fees) should it consider that to be appropriate.
There is no participation in bonus, share plan or pension arrangements.
The Company reserves the ability to provide the Company Chairman with certain benefits in kind and/or a contribution towards the provision of office facilities where appropriate, although the current Chairman does not presently receive such benefits.
A departing gift may be provided up to a value of £2,500 per Director.
The aggregate fees of the Chairman and Non-executive Directors will not exceed the limit from time to time prescribed within the Articles.
Not applicable to this element.
Directors’ Remuneration Reportcontinued

Strategic Report 01–41 Governance 42–74 Financial Statements 75–131
67Spectris plc Annual Report and Accounts 2014
Implementation of the Remuneration Policy 2015
Element of Remuneration Policy
Implementation detail
Base salary Increase in the Chief Executive’s salary to £569,500 and the Group Finance Director’s salary to £361,800 with effect from 1 January 2015. In line with the Directors’ Remuneration Policy, these increases are at a level consistent with average UK wage inflation.
Annual bonus Bonus maximum for the Executive Directors is unchanged at 125% of base salary.
Performance measures for annual bonus in 2015 are weighted as follows:
• 100% adjusted profit before tax.
• 25% personal objectives.
These weightings are unchanged from 2014. The performance targets for the adjusted profit before tax measure will be disclosed within the 2015 Directors’ Remuneration Report.
Performance Share Plan Award levels for the Executive Directors for 2015 are unchanged at 200% of base salary.
Pensions and benefits in kind
No changes to these elements from 2014.
• 25% of base salary pension contribution for the Executive Directors.
• No change to benefits in kind provided.
All-employee share plans
Continued opportunity to participate in an HMRC approved Savings Related Share Option Scheme on the same basis as all other UK employees.
Share ownership guidelines
300% of base salary (as from the 2014 Annual General Meeting).
Chairman’s and Non-executive Directors’ fees
Increase in the Chairman’s fee to £200,000, the Non-executive Directors’ fee to £53,000, the Audit and Risk and Remuneration Committee Chairman’s fee to £10,000 and the Senior Independent Director fee to £5,000. Travel supplement of £7,500 for each of L A Davis, W C Seeger and M B Wyrsch.
The following table sets out a summary of the Directors’ service contracts or terms of appointment. Executive Directors’ service contracts provide, subject to statutory rights, for automatic termination on the Director reaching the age of 65.
Date of Expiry Notice Length of service at contract date period 27 February 2015
Executive Directors
J E O’Higgins 1.1.06 3.2.29 12 months 9 years 1 month
C G Watson 1.10.06 4.2.23 12 months 8 years 4 months
Non-executive Directors
P A Chambré 1.8.06 renewable at each AGM 6 months 8 years 6 months
L A Davis 25.4.14 renewable at each AGM 6 months 10 months
Dr J L M Hughes cbe 1.6.07 renewable at each AGM 6 months 7 years 8 months
R J King 12.10.10 renewable at each AGM 6 months 4 years 4 months
U Quellmann 1.1.15 renewable at each AGM 6 months 1 month
W C Seeger 1.1.15 renewable at each AGM 6 months 1 month
J A Warren 7.3.06 retires at 2015 AGM 6 months 8 years 11 months
M B Wyrsch 1.6.12 renewable at each AGM 6 months 2 years 8 months
Directors’ Remuneration Reportcontinued

Strategic Report 01–41 Governance 42–74 Financial Statements 75–131
68Spectris plc Annual Report and Accounts 2014
Dr J L M £’000 J E O’Higgins C G Watson J C Webster S Blair Hughes cbe P A Chambré L A Davis R J King J A Warren M B Wyrsch
A Base salary/fees
2014 560 355 100 37 180 50 34 58 76 58
2013 528 335 283 270 180 50 – 58 76 58
B Taxable benefits
2014 17 17 9 2 – – – – – –
2013 19 20 21 14 – – – – – –
C Bonus
2014 101 57 51 – – – – – – –
2013 106 54 50 25 – – – – – –
D PSP and Save As You Earn
2014 304 188 163 – – – – – – –
20131 1,366 875 781 N/A – – – – – –
E Pension-related benefits
2014 140 89 21 11 – – – – – –
2013 132 83 71 68 – – – – – –
Total
2014 1,122 706 344 50 180 50 34 58 76 58
20131 2,151 1,367 1,206 377 180 50 – 58 76 58
1 The 2013 numbers for PSP and Save As You Earn have been adjusted as described in Share plans, opposite.
The total aggregate base salaries, fees, benefits, cash bonuses and share schemes for all Directors in 2014 was £2,678,000 (20131: £5,523,000).
Taxable benefits are company cars, private fuel, allowances paid in lieu of company cars and private fuel, medical expenses insurance and travel allowance.
For Against Abstain
Number % Number % Number %
To approve the Directors’ Remuneration Policy 88,029,696 98.2% 1,575,026 1.7% 267,154 0.1%
To approve the Directors’ Remuneration Report for the year ended 31 December 2013 88,866,196 99% 844,193 0.9% 161,492 0.1%
Non-executive DirectorsAll Non-executive Directors’ conditions of appointment provide for a six-month period of notice and are renewable at each Annual General Meeting, subject to review prior to proposal for re-election. Ordinarily appointments do not continue beyond nine years after first election, at which time Non-executive Directors cease to be presumed independent under the UK Corporate Governance Code.
Directors’ remuneration and interestsKPMG LLP, the Company’s external auditor, is required to report if certain information disclosed below has been prepared in accordance with the Companies Act 2006. The information subject to audit is clearly identified.
Consideration of shareholders’ viewsThe Directors’ Remuneration Policy and the 2013 Directors’ Remuneration Report were supported by 98% and 99%, respectively, of those registering votes by proxy in advance of the 2014 AGM, as can be seen from the table below:
Single total figure of remuneration (subject to audit)The single figure for the remuneration of each Director who served during the year is as follows:
Directors’ Remuneration Reportcontinued

Strategic Report 01–41 Governance 42–74 Financial Statements 75–131
69Spectris plc Annual Report and Accounts 2014
2015 salary reviewsThe Executive Directors’ salaries were reviewed effective 1 January 2015; an increase of 1.8% to both the Chief Executive and the Group Finance Director being awarded. Increases effective 1 January 2015 of 11% to £200,000 for the Chairman (increasing to £210,000 at 1 January 2016), 6% to £53,000 for the Non-executive Directors, and £2,000 to the supplement paid for Committee chairmanship reflect the biennial review structure and the Company’s increase in market capitalisation over the preceding two years.
2014 annual bonusAnnual bonus was achievable up to 125% of base salary, based on profit before tax (100% of base salary potential) and personal (25% of base salary potential) targets. Bonuses achieved in respect of 2014 performance, based on the targets set at the start of the financial year, were as follows (as a percentage of salary at 31 December 2014):
J E O’Higgins 18%
C G Watson 16%
Within the above bonus payments for Mr O’Higgins and Mr Watson, 0% related to the profitability target and the balance to achievement of personal objectives.
The profitability bonus range established by the Committee for 2014 was as follows:
Bonus level 0% 50% 100%
Adjusted profit before tax £195m £215m £235m
The personal objectives covered a range of areas for each Director. The Chief Executive’s objectives focussed upon strategy – growth and execution, organisation and operational excellence, business ethics and values, and investor relations. The Group Finance Director’s objectives included tax optimisation, working capital and cash pooling, strategy for efficiencies in the Asian and Russian operations, internal audit – fraud detection and risk mitigation – and improved management reporting and forecasting accuracy.
No amount of bonus was deferred.
Similar targets have been set for 2015 and the Committee will report those targets in next year’s report (considering the financial targets to be commercially sensitive prior to the end of the financial year).
Share plansPerformance Share Plan values for 2014 represent:
• the actual value at vesting (11 April 2014) of those shares subject to a TSR performance condition, within the 2011 PSP grant; and
• the number of shares expected to vest during 2015 in respect of the portion of the 2012 PSP award subject to an EPS growth condition, measured to 31 December 2014 and multiplied by the three-month average share price to 31 December 2014 (1,864p). The targets for the EPS growth condition were as shown in the following section and were not met, resulting in nil vesting.
Performance Share Plan values for 2013 represent:
• the actual value at vesting (8 March 2013) of those shares subject to a TSR performance condition within the 2010 PSP grant; and
• the number of shares vested on 11 April 2014 in respect of the portion of the 2011 PSP award subject to an EPS growth condition, measured to 31 December 2013 and multiplied by the share price on 11 April 2014 (2,250p). In the equivalent calculation
Company EPS performance % of award that vests (expressed as a percentage of one-third of the total number of shares subject to an award)
Consumer Prices Index (‘CPI’) + 13% compound per annum (‘c.p.a.’)
100%
Between CPI + 5% and 13% c.p.a. Pro-rata straight line between 20% and 100%
CPI + 5% c.p.a. 20%
Less than CPI + 5% c.p.a. 0%
Company TSR performance relative to the FTSE 250 (excluding investment trusts)
% of award that vests (expressed as a percentage of one-third of the total number of shares subject to an award)
Upper quintile or above 100%
Between upper quintile and median Pro-rata straight line between 20% and 100%
Median 20%
Below median 0%
Aggregate economic profit over the performance period
2014 award
Aggregate economic profit over the performance period
2015 award
% of award that vests (expressed as a percentage of one-third of the total number of shares subject to an award)
Less than £260 million Less than £250 million Nil
£260 million £250 million 20%
Between £260 million and £340 million
Between £250 million and £370 million
Between 20% and 100% on a straight-line basis
£340 million or more £370 million or more 100%
for the 2013 accounts an estimated figure was used based on a three-month average share price to 31 December 2013 (2,336p). The amounts included in the prior year for J E O’Higgins, C G Watson and J C Webster have been adjusted from £1,387,000 to £1,366,000, £888,000 to £875,000 and £792,000 to £781,000 respectively, to reflect the share price on 11 April 2014.
A value of £674 is recognised in 2014 in respect of the Savings Related Share Option Scheme option granted to the Chief Executive in September 2014 based on the difference between the option exercise price and the three-month average share price to 31 December 2014.
Performance Share PlanAwards to the Executive Directors are currently structured so that one-third of the award is subject to an adjusted EPS target, one-third is subject to a TSR target and one-third is subject to an economic profit target. Each condition operates over a fixed three-year period with no opportunity for retesting. These performance criteria are summarised in the tables below.

Strategic Report 01–41 Governance 42–74 Financial Statements 75–131
70Spectris plc Annual Report and Accounts 2014
The 2011 award maturing in March 2014 vested in full against the EPS target (50% of total award) and to 56.92% against the TSR target (50% of total award). The TSR performance condition is measured independently by New Bridge Street. The EPS figure is obtained from the audited Financial Statements and the calculation of achievement against the growth condition is presented to and approved by the Committee.
The TSR condition is also subject to an underpin that the Committee must satisfy itself that the Company’s relative TSR performance is reflective of its underlying financial performance. The Committee reviewed and was satisfied in this respect in relation to the 2011 award which vested in 2014.
Additional details:
•The PSP weightings above are unchanged from 2014.
•The aggregate economic profit range is determined by the Committee for each new three-year performance period.
•The performance periods for the EPS and economic profit measures for the 2015 awards will be the three financial years 2015, 2016 and 2017. The TSR performance period is the period of three years from the award date.
•EPS is defined as adjusted EPS of the Company as disclosed in the full-year Financial Statements.
•Economic profit is defined as adjusted operating profit (being pre-tax and interest) less capital employed multiplied by the Company’s weighted average cost of capital (‘WACC’). WACC was set at 12.5% for the 2014 award and 11% for the 2015 award, except that lower transitional rates will be applied for subsequent acquisitions. Any impairment of goodwill over a performance period will be added back to capital employed. The Committee will monitor outcomes for the economic profit measure to ensure that they achieve the original objectives and may adjust the vesting accordingly. Any exercise of discretion will be justified in the next Directors’ Remuneration Report.
•For all performance measures, pro-rata straight-line vesting will apply for achievement of performance between the thresholds shown.
Pension entitlements (subject to audit)The Executive Directors are entitled to a defined contribution pension contribution of 25% of base salary. In light of the pension lifetime allowance of £1.25 million and the maximum annual pension contribution allowance of £40,000, the Executive Directors are entitled, at their option, to a taxable salary supplement in lieu of some or all of such pension contributions.
Directors’ shareholdings (subject to audit)Each Executive Director is, subject to personal circumstances, required to build a retained shareholding in Spectris plc of at least three times base salary in value and is required to apply the post-tax benefit of any vested Performance Share Plan awards or any bonus payments exceeding 60% of base salary to the acquisition of shares until this required level of shareholding is achieved. There is no requirement for Non-executive Directors to own shares in the Company.
The 2014 version of the UK Corporate Governance Code requires the Committee to consider an extended holding period, including after leaving the Company, for shares arising following vesting of the three-year awards under the Performance Share Plan. This matter was considered by the Committee prior to submission of the Directors’ Remuneration Policy to the 2014 Annual General Meeting and has been reviewed subsequently. In the context of the Directors’ Remuneration Policy targetting below median levels of reward, the three times base salary shareholding requirement being significantly above the norm of one or two times salary, each Executive Director having in practice a much higher shareholding than the requirement, and recognising that to introduce a deferral period would require the Remuneration Policy to be re-submitted to the 2015 Annual General Meeting, the Committee determined not to impose a shareholding retention period, but to keep the position under review.
Executive Directors’ current shareholding
0
100
200
300
400
500
600
700
800
900
1000
1100
1200
10
9
8
7
6
5
4
3
2
1
J E O’Higgins C G Watson0
Shar
e ow
ners
hip
guid
elin
e
5,65
7
2,63
5
Mul
tiple
of s
alar
y
Current shareholding (£‘000)
Directors’ Remuneration Reportcontinued

Strategic Report 01–41 Governance 42–74 Financial Statements 75–131
71Spectris plc Annual Report and Accounts 2014
The following Directors or their families had beneficial interests in the ordinary shares of the Company:
Shareholdings
2014 2014 31 December 1 January (or date of (or date of resignation) appointment)
Dr J L M Hughes cbe 8,000 8,000
J E O’Higgins 256,574 256,574
P A Chambré 5,812 5,694
L A Davis – –
R J King 3,000 3,000
J A Warren 3,000 3,000
C G Watson 119,500 116,602
M B Wyrsch 3,000 3,000
S Blair 393 393
J C Webster 112,570 112,570
U Quellmann and W C Seeger held no ordinary shares of the Company at their appointment on 1 January 2015.
There were no changes to the above interests between the year end and the date of this report.
External appointmentsExecutive Directors may retain any payments received in respect of external non-executive appointments. Such appointments are limited to one per Director at any time and are subject to the approval of the Board. Mr O’Higgins is a non-executive director of NASDAQ-listed Exide Technologies and was paid a fee of US$150,000 during 2014. Mr Watson is a non-executive director of Spirax-Sarco Engineering plc and was paid a fee of £54,500 during 2014. No other external directorships are held by the Executive Directors.
Performance graph and tableThe table below shows the total remuneration of the Chief Executive over a six-year period, as well as the bonus award and Performance Share Plan vesting rates against maximum opportunity for that period.
Bonus award PSP vesting Single figure rates against rates against of total maximum maximum remuneration opportunity opportunity J E O’Higgins £’000 % %
2014 1,122 18 28
2013 2,172 20 100
2012 2,995 70 100
2011 1,481 100 100
2010 1,104 95 89
2009 849 0 33

Strategic Report 01–41 Governance 42–74 Financial Statements 75–131
72Spectris plc Annual Report and Accounts 2014
The graph below shows the value, at 31 December 2014, of £100 invested in Spectris plc on 31 December 2008 compared with the value of £100 invested in the FTSE 250 Index (excluding investment trusts) over the same period.
Total Shareholder Return
600
500
400
300
Valu
e (£
)200
100
31 Dec2008
31 Dec2009
31 Dec2010
31 Dec2011
31 Dec2012
31 Dec2013
31 Dec2014
0
Spectris plc FTSE 250 (excluding investment trusts)
Source: Thomson Reuters
Percentage change in the remuneration of the Chief ExecutiveThe base salary and taxable benefits of the Chief Executive increased by 6% and decreased by 13%, respectively, in 2014. The 2014 bonus of the Chief Executive (paid in March 2015) decreased by 5% compared to 2013. This compares to a 4% base salary increase awarded on average to the Company’s UK employees, an increase in their taxable benefits of 15% and an increase in their bonuses of 5% in 2014. Your Committee considers the Company’s UK employees to be the most appropriate comparator group to the Chief Executive.
Relative importance of spend on payThe following graph shows the percentage change in profit, dividends and overall expenditure on Group pay in the reporting period, compared to the prior financial year.
Relative importance of spend on pay
110
105
100
95
Valu
e of
a 1
00 u
nit p
aid
at 3
1 D
ecem
ber 2
013
2013 201490
109
94
100
Dividends Staff costs Profit before tax
As the Company’s principal measure of profitability, adjusted profit before tax was chosen by the Directors as the base comparator to the spend on pay. Adjusted profit before tax is calculated by taking the statutory profit before tax and adjusting it for certain non-operational items defined in Note 2 to the Consolidated Financial Statements.
Directors’ Remuneration Reportcontinued

Strategic Report 01–41 Governance 42–74 Financial Statements 75–131
73Spectris plc Annual Report and Accounts 2014
Directors’ interests in options to purchase ordinary shares under the Spectris Savings Related Share Option Scheme (‘SAYE’) (subject to audit)
Face value Share of option price at Options Granted Exercise Exercised at date of date of Lapsed Options Date held during price during grant exercise during held Date Expiry granted 1 Jan 14 the year (p) the year (£) (p) the year 31 Dec 14 exercisable date
J E O’Higgins SAYE Sep 2012 530 – 1,695 – 8,984 – 530 Dec 2015 Jun 2016
Sep 2014 446 2,015 8,987 – 446 Dec 2017 Jun 2018
Total 530 446 17,971 976
Directors’ share awards under the Spectris Performance Share Plan (subject to audit)
Number of shares subject to Market Face value award at value Number of 31 Dec 14 of each Performance of shares Additions award at Market (or date of share at period subject to Exercise Granted of date of Exercised price at Lapsed cessation of date of end date/ award at Date price during reinvested grant during exercise during employment award date Expiry 1 Jan 14 granted (p) the year dividends1 (£) the year (p) the year if earlier) (p) exercisable date
S Blair 14,340 Oct 2011 5 196,888 (14,340) – 1,373.0 Oct 2014 Oct 2021
18,390 Feb 2012 5 312,483 (18,390) – 1,699.2 Feb 2015 Feb 2022
14,020 Feb 2013 5 337,882 (14,020) – 2,410.0 Feb 2016 Feb 2023
46,750 (46,750) –
J E O’Higgins 44,600 Apr 2011 5 3,099 624,846 (9,607) 38,092 1,401.0 Apr 2014 Apr 2021
36,780 Feb 2012 5 624,966 36,780 1,699.2 Feb 2015 Feb 2022
27,370 Feb 2013 5 659,617 27,370 2,410.0 Feb 2016 Feb 2023
May 2014 5 50,460 1,118,900 50,460 2,217.4 May 2017 May 2024
108,750 50,460 3,099 (9,607) 152,702
C G Watson 27,600 Apr 2011 5 1,871 386,676 (4,839) 1903.5 (5,946) 18,686 1,401.0 Apr 2014 Apr 2021
22,800 Feb 2012 5 387,418 22,800 1,699.2 Feb 2015 Feb 2022
17,390 Feb 2013 5 419,099 17,390 2,410.0 Feb 2016 Feb 2023
May 2014 5 32,050 710,677 32,050 2,217.4 May 2017 May 2024
67,790 32,050 1,871 (4,839) (5,946) 90,926
J C Webster 23,900 Apr 2011 5 1,465 334,839 (5,149) 20,216 1,401.0 Apr 2014 Apr 2021
19,710 Feb 2012 5 334,912 (4,300) 15,410 1,699.2 Feb 2015 Feb 2022
14,670 Feb 2013 5 353,547 (8,134) 6,536 2,410.0 Feb 2016 Feb 2023
58,280 1,465 (17,583) 42,162
Total 281,570 82,510 6,435 6,802,750 (4,839) (79,886) 285,790
25% of award shares are receivable on achievement of minimum performance and 100% for maximum.
1 Under the terms of the Performance Share Plan, notional dividends of the Company are applied over award shares during the performance period and exercise period to date of exercise (reduced to date of vesting for the 2014 grant and subsequent grants), thereby increasing the number of award shares granted. These additional award shares are subject to application of the performance criteria attaching to the award.

Strategic Report 01–41 Governance 42–74 Financial Statements 75–131
74Spectris plc Annual Report and Accounts 2014
The above awards were made as conditional rights to acquire shares (structured as nominal cost options) and the number of shares awarded was based on the average of the mid-market closing price of the Company’s shares over the five business days prior to the date of grant, which was 2,217.4p for the 2014 awards. For each of Mr O’Higgins and Mr Watson, the value of the 2014 Performance Share Plan award was equivalent to 200% of their base salaries. Details of the performance measures applicable to 2014 Performance Share Plan awards are set out in the earlier section describing the Performance Share Plan. The face value is the maximum number of shares that would vest multiplied by the share price at the date of grant. If the base targets are not achieved, no shares vest.
The awards granted to Mr O’Higgins, Mr Watson and Mr Webster in 2011 of 44,600, 27,600 and 23,900 shares, respectively, became exercisable during the year and were partially exercised by Mr Watson. The awards had two performance conditions attaching to them. The TSR target was met to 56.92% (50% of the award) and the EPS target was met in full (50% of the award). In determining the level of vesting against the TSR target, the Committee took into account the Company’s underlying financial performance. The awards were satisfied from the Company’s Treasury shares.
The Spectris Performance Share Plan operates within the dilution limits laid down by the Association of British Insurers. 3.8% of the 5% limit has been utilised.
Mr Watson retained 4,839 shares arising from a partial exercise of his 2011 award on 28 July 2014. The gain on exercise was £91,868.
Mr Webster’s unvested share awards were pro-rated on his retirement in proportion to the time spent in employment.
The aggregate gains on exercise for all Directors under the Company’s share plans were thus £91,868 (2013: £7,521,325).
All of the awards granted to Mr Blair lapsed on his leaving employment on 25 February 2014.
Termination arrangements for Directors (subject to audit)Mr Webster retired from the Board on 30 June 2014 after over 20 years’ service. He received his salary and fixed benefits to the date of retirement. Mr Webster received a pro-rated bonus for his period of employment in 2014 at the on-target level following his fulfilment of various tasks set by the Board, including assisting with the transition to the new management structure. He retained all outstanding Performance Share Plan awards (which remain subject to performance conditions and will be pro-rated for time).
Mr Blair ceased to be a Director on 25 February 2014, having served notice in October 2013. No compensation payments were made and he received his salary and fixed benefits to the date of cessation. Mr Blair was not considered for a bonus for 2014 and all outstanding Performance Share Plan awards have lapsed.
Interest in contractsNo Director had during the year or at the end of the year any material interest in any contract of significance to the Group’s business.
Share priceAt 31 December 2014 the middle market closing share price on the London Stock Exchange was 2,102p. The highest share price in the year was 2,547p and the lowest was 1,643p.
Loans to DirectorsDuring the year there were no outstanding loans to any Director.
By order of the Board
Russell King Chairman of the Remuneration Committee
27 February 2015
Company No. 2025003
Directors’ Remuneration Reportcontinued

Strategic Report 01–41 Governance 42–74 Financial Statements 75–131
75Spectris plc Annual Report and Accounts 2014
Independent Auditor’s ReportTo the members of Spectris plc only
Opinions and conclusions arising from our audit
1. Our opinion on the Financial Statements is unmodifiedWe have audited the Financial Statements of Spectris plc for the year ended 31 December 2014 which comprise the Consolidated Income Statement, the Consolidated Statement of Comprehensive Income, the Consolidated Statement of Changes in Equity, the Consolidated Statement of Financial Position, the Consolidated Statement of Cash Flows, the Parent Company Balance Sheet and the related notes. In our opinion:
• the Financial Statements give a true and fair view of the state of the Group’s and of the Parent Company’s affairs as at 31 December 2014 and of the Group’s profit for the year then ended;
• the Group Financial Statements have been properly prepared in accordance with International Financial Reporting Standards as adopted by the European Union (IFRS as adopted by the EU);
• the Parent Company Financial Statements have been properly prepared in accordance with UK Accounting Standards; and
• the Financial Statements have been prepared in accordance with the requirements of the Companies Act 2006 and, as regards the Group Financial Statements, Article 4 of the IAS Regulation.
2. Our assessment of risks of material misstatementIn arriving at our audit opinion above on the Group Financial Statements the risks of material misstatement that had the greatest effect on our Group audit were as follows:
Recoverability of goodwill and other intangible assetsRefer to page 53 (Audit and Risk Committee Report), page 84 (accounting policy) and page 99 (financial disclosures).
The risk:
•The Group’s cash-generating units operate across a broad range of markets, products and geographies. The assessment of the recoverability of the goodwill and other intangible assets attributable to these cash-generating units is reliant on the forecast future performance of the Group across these areas.
•Due to the inherent uncertainty involved in forecasting and discounting future cash flows, which are the basis of the assessment of recoverability, this is one of the key judgemental areas that our audit is concentrated on to address the risk that the key assumptions, estimates and judgements on which the calculations are based are inappropriate and that goodwill and other intangible assets are overstated as a result.
Our response:
•Our audit procedures included using our own valuation specialists to assist us in evaluating the Group’s key assumptions and methodologies, in particular those related to more recent acquisitions or where recent performance has been lower than our expectation.
•We critically assessed the Group’s assumptions using publically available data as well as our own assessments in relation to key inputs such as projected growth rates, discount rates, margins, profit to cash conversion, cost inflation and foreign exchange. We applied sensitivities to the assumptions used by the Group in its impairment models; this included a consideration of the historical accuracy of the Group’s forecasting.
•To sense check, we compared the sum of the discounted cash flows to the Group’s market capitalisation to assess the reasonableness of those cash flows. For more recent acquisitions we compared actual results post acquisition to the results in the business case supporting the transaction.
•We also assessed whether the Group’s disclosures (see Note 11) about the sensitivity of the outcome of the impairment assessment to changes in key assumptions properly reflected the risks.
Working capital provisions Refer to page 54 (Audit and Risk Committee Report), pages 85 and 86 (accounting policy) and page 104 (financial disclosures).
The risk:
•The Group has significant inventory and trade receivable balances and the Directors have to apply judgement to assess the level of provisions required to write down slow-moving, excess and obsolete inventory items to their net realisable value and to write down the value of trade receivables to their recoverable amounts.
• In respect of inventory provisions each operating company in the Group is required to apply a methodology to calculate an inventory provision that the Group feels is appropriate to the specific business.
• In respect of trade receivables the Group’s credit risk policy requires full provision to be made against all trade receivables that are over 120 days past due.
•The level of judgement involved in determining whether a provision should be recognised and how it should be measured, coupled with the fact that provision movements impact earnings, results in working capital provisions being one of the key judgemental areas that our audit is concentrated on.
Our response:
• In respect of inventory provisions our audit procedures included considering the appropriateness of the Group’s methodology used in the context of our understanding of the individual businesses in the Group with reference to the ageing and nature of inventory, past usage, forecast future usage, observing physical inventory counts, economic conditions and new product launches and technology. We compared the methodology and assumptions used in calculating the inventory provision to those used in prior years; as part of this we considered whether we would expect a change to the methodology and assumptions used. We also considered the historical accuracy of provisions made by the Group by examining the reversal of previously recorded provisions.
• In respect of trade receivable provisions our audit procedures included considering the appropriateness of the provisions recorded against trade receivable balances and the appropriateness of the Group’s provisioning policy, with reference to the ageing of customer balances, past history of recovery, economic conditions and the concentration of counter-party risk.
•We also considered the adequacy of the Group’s disclosures in respect of working capital provisions.

Strategic Report 01–41 Governance 42–74 Financial Statements 75–131
76Spectris plc Annual Report and Accounts 2014
Independent Auditor’s Report continued
tax provisionsRefer to page 54 (Audit and Risk Committee Report), page 86 (accounting policy) and page 96 (financial disclosures).
The risk:
•Governmental challenge of transfer pricing may result in tax exposures and potential interest and penalties. Provisions for tax exposures relating to open tax years are subject to management judgement and estimation.
•This is one of the key judgemental areas that our audit is concentrated on due to the Group operating in a number of tax jurisdictions, the complexities of transfer pricing and other international tax legislation and the time taken for tax matters to be agreed with the tax authorities. Movements in tax provisions impact earnings.
Our response:
•Our audit procedures included the use of our own international and local tax specialists to assess the Group’s tax positions and to read its correspondence with the relevant tax authorities to analyse and challenge the assumptions used to determine tax provisions based on our knowledge and experiences of the application of the international and local legislation by the relevant authorities and courts.
•We have also considered the adequacy of the Group’s disclosures in respect of tax and uncertain tax positions.
Other provisions (including product warranty, legal and divestment related)Refer to page 54 (Audit and Risk Committee Report), page 86 (accounting policy) and page 104 (financial disclosures).
The risk:
•Provisions are recorded based on the Directors’ best estimate of the Group’s ultimate liability to settle an obligation. Like other companies in this sector, events that have led to claims in the past include product performance, commercial disputes, alleged patent infringements and divestments.
•The level of judgement involved in determining whether the recognition criteria for provisions are met and then in calculating the best estimate, coupled with the fact provision movements impact earnings, results in other provisions being one of the key judgemental areas that our audit is concentrated on.
Our response:
•Our audit procedures included challenging the Group’s basis for recognising and measuring provisions with reference to the latest available corroborative information, selected third party confirmations and in light of our understanding of the business gained throughout the audit process.
• In addition, we assessed completeness of provisions through review of legal expenses and discussion with the Group’s internal legal counsel.
•We also assessed whether the Group’s disclosures about provisions and the movements in the year were appropriate.
Acquisition accountingRefer to page 53 (Audit and Risk Committee Report), page 84 (accounting policy) and page 114 (financial disclosures).
The risk:
•During the year the Group completed the acquisitions of Affinity Biosensors LLC, MicroCal, Sudo Engineering, Fibersensing, La Corporation Scientifique Claisse and Engineering Seismology Group, for a total consideration of £103.8m.
•There is significant judgement involved in determining the fair value of the identifiable assets and liabilities acquired given the specialised nature of the acquired businesses and associated technological, customer and marketing related intangibles.
•Contingent consideration of £11.6m in respect of current year acquisitions has been recognised and is payable on the achievement of future sales targets. Given the uncertainty regarding achievement of these targets, significant judgement is required in measuring the fair value of the Group’s contingent consideration obligation both at the acquisition date and at the balance sheet date.
•Purchase price adjustments can be disputed by the seller and, therefore, can require judgement in determining the expected settlement amount.
Our response:
•Our audit procedures included the inspection of the Group’s valuation analysis, which included reading the independent external valuation reports, for the acquisitions of MicroCal, Affinity Biosensors LLC, La Corporation Scientifique Claisse and Engineering Seismology Group, and the internal valuation reports for the other two acquisitions, which were used as the basis for the determination of the fair value of the intangible assets.
•We used our own valuation specialists to the extent necessary to assist us in critically challenging the key valuation assumptions and methodologies. This included comparison against industry norms, and consideration of the reasonableness of assumptions underlying the identification of separately identifiable intangible assets and associated revenue growth rates used in the forecasts, and their useful economic lives together with considering what is represented by residual goodwill.
• In respect of contingent consideration our work was focussed on the forecast results of the acquired businesses which is the basis for the estimate of the contingent consideration liability. The key assumptions underlying those forecasts were compared with the Group’s planned development of the business and also the historical trading performance of the acquired operation, results since the acquisition date and order book at year end.
• In respect to disputed purchase price adjustments, we critically challenged the assumptions used in assessing the expected recoverable amount from the seller with reference to the purchase agreement, past experience history, discussion with the Group’s internal legal counsel and review of correspondence with the Group’s external legal counsel where relevant.
•We also considered the adequacy of the Group’s disclosures (see Note 24) with respect to the acquisitions, purchase price adjustments and contingent consideration.
3. Our application of materiality and an overview of the scope of our auditThe materiality for the Group Financial Statements as a whole was set at £11.0m. This has been determined with reference to a benchmark of Group profit before tax, which we consider to be one of the principal considerations for members of the Company in assessing the financial performance of the Group. Materiality represents 6% of Group profit before tax as disclosed on the face of the Consolidated Income Statement.
We agreed with the Audit and Risk Committee to report to it all corrected and uncorrected misstatements we identified through our audit with a value in excess of £0.4m, in addition to other identified misstatements below that threshold that we believe warranted reporting on qualitative grounds.

Strategic Report 01–41 Governance 42–74 Financial Statements 75–131
77Spectris plc Annual Report and Accounts 2014
Audits for Group reporting purposes were performed at key reporting components in the following countries: Australia, China, Denmark, France, Germany, the Netherlands, Singapore, Spain, Sweden, Switzerland, the United Kingdom and the USA. In addition, specified audit procedures were performed by the Group audit team over other reporting components as part of the audit for Group reporting purposes. These other reporting components, typically smaller in size, were selected at short notice to give an element of unpredictability in our overall scope of work. In aggregate our audit procedures covered 69% of total Group revenue; 81% of Group profit before tax; and 68% of total Group assets. The segment disclosure in Note 3 sets out the individual significance of a specific country.
The remaining 31% of total Group revenue, 19% of Group profit before tax and 32% of total Group assets is represented by reporting components none of which individually represent more than 4% of these measures. For the remaining components, we performed analysis at an aggregated Group level to re-examine our assessment that there were no significant risks of material misstatement within these. Local statutory audits are performed at a limited number of these components after the date of this report.
The audits undertaken for Group reporting purposes at the key reporting components of the Group were all performed to materiality levels set, or approved, by the Group audit team. These local materiality levels, set individually for each component, having regard to the size and risk profile of each component, ranged from £0.1m to £2.0m.
The Group audit team instructed component auditors as to the significant areas to be covered including the relevant risks detailed above and the information to be reported back.
The Group audit team performed the work on recoverability of goodwill and other intangible assets, acquisition accounting, retirement benefit schemes and centrally held provisions. The Group audit team performed the audit work and were physically present at five out of six reporting components in scope in the USA, the Group’s single largest geographical market. In addition, the Group audit team physically visited key reporting components in the following countries to discuss significant risks and audit strategy: Brazil, Denmark, the Netherlands and the United Kingdom. Telephone meetings were also held with the auditors at these locations and all of the other locations that were not physically visited.
4. Our opinion on other matters prescribed by the Companies Act 2006 is unmodifiedIn our opinion:
• the part of the Directors’ Remuneration Report to be audited has been properly prepared in accordance with the Companies Act 2006; and
• the information given in the Strategic Report and Directors’ Report for the financial year for which the Financial Statements are prepared is consistent with the Financial Statements.
5. We have nothing to report in respect of the matters on which we are required to report by exception Under ISAs (UK and Ireland) we are required to report to you if, based on the knowledge we acquired during our audit, we have identified other information in the Annual Report that contains a material inconsistency with either that knowledge or the Financial Statements, a material misstatement of fact, or that is otherwise misleading.
In particular, we are required to report to you if:
•we have identified material inconsistencies between the knowledge we acquired during our audit and the Directors’ statement that they consider that the Annual Report and Financial Statements taken as a whole is fair, balanced and understandable and provides the information necessary for shareholders to assess the Group’s performance, business model and strategy; or
• the Audit and Risk Committee Report does not appropriately address matters communicated by us to the Audit and Risk Committee.
Under the Companies Act 2006 we are required to report to you if, in our opinion:
•adequate accounting records have not been kept by the Parent Company, or returns adequate for our audit have not been received from branches not visited by us; or
• the Parent Company Financial Statements and the part of the Directors’ Remuneration Report to be audited are not in agreement with the accounting records and returns; or
•certain disclosures of Directors’ remuneration specified by law are not made; or
•we have not received all the information and explanations we require for our audit.
Under the Listing Rules we are required to review:
• the Directors’ statement, set out on page 57, in relation to going concern; and
• the part of the Corporate Governance Report on page 59 relating to the Company’s compliance with the ten provisions of the 2012 UK Corporate Governance Code specified for our review.
We have nothing to report in respect of the above responsibilities.
Scope of report and responsibilitiesAs explained more fully in the Directors’ Responsibilities Statement set out on page 58, the Directors are responsible for the preparation of the Financial Statements and for being satisfied that they give a true and fair view. A description of the scope of an audit of Financial Statements is provided on the Financial Reporting Council’s website at www.frc.org.uk/auditscopeukprivate. This report is made solely to the Company’s members as a body and subject to important explanations and disclaimers regarding our responsibilities, published on our website at www.kpmg.com/uk/auditscopeukco2014a, which are incorporated into this report as if set out in full and should be read to provide an understanding of the purpose of this report, the work we have undertaken and the basis of our opinions.
Richard Broadbelt (Senior Statutory Auditor) for and on behalf of KPMG LLP, Statutory Auditor Chartered Accountants 15 Canada Square London E14 5GL
27 February 2015
Independent Auditor’s Report continued

Strategic Report 01–41 Governance 42–74 Financial Statements 75–131
78Spectris plc Annual Report and Accounts 2014
Consolidated Income StatementFor the year ended 31 December 2014
2014 2013 Note £m £m
Continuing operations
Revenue 4 1,173.7 1,202.0 Cost of sales (497.3) (504.4)
Gross profit 676.4 697.6
Indirect production and engineering expenses (93.2) (96.9) Sales and marketing expenses (271.3) (268.0) Administrative expenses (143.6) (146.8)
Operating profit before acquisition-related items 198.1 215.5
Net acquisition-related costs and fair value adjustments (3.9) (0.7) Amortisation of acquisition-related intangible assets (25.9) (28.9)
Operating profit 2, 5 168.3 185.9
Profit on disposal of businesses 25 2.4 98.3 Financial income 7 6.3 1.2 Finance costs 7 (5.9) (13.7)
Profit before tax 171.1 271.7
Taxation – UK 8 (2.0) (4.2) Taxation – Overseas 8 (34.0) (67.5)
Profit after tax for the period from continuing operations attributable to owners of the Parent Company 135.1 200.0
Basic earnings per share 10 113.7p 169.2p Diluted earnings per share 10 113.4p 168.5p
Interim dividends paid and final dividends proposed for the year (per share) 9 46.50p 42.75p Dividends paid during the year (per share) 9 44.00p 40.25p
Spectris uses adjusted figures as key performance measures in addition to those reported under adopted IFRS. Reconciliations showing how the adjusted performance measures are derived from those reported under adopted IFRS are set out in Note 2.

Strategic Report 01–41 Governance 42–74 Financial Statements 75–131
79Spectris plc Annual Report and Accounts 2014
Consolidated Statement of Comprehensive IncomeFor the year ended 31 December 2014
2014 2013 Note £m £m
Profit for the year attributable to owners of the Parent Company 135.1 200.0
Other comprehensive income: Items that will not be reclassified to the Consolidated Income Statement: Re-measurement of net defined benefit liability, net of foreign exchange 19 (5.6) 3.4 Tax on items above 8 1.5 (0.9)
(4.1) 2.5
Items that are or may be reclassified subsequently to the Consolidated Income Statement: Net (loss)/gain on effective portion of changes in fair value of forward exchange contracts (3.3) 0.7 Foreign exchange movements on translation of overseas operations (5.5) (8.5) Currency translation differences transferred to profit on disposal of businesses – (1.5) Tax on items above 8 0.5 (0.1)
(8.3) (9.4)
Total comprehensive income for the year attributable to owners of the Parent Company 122.7 193.1

Strategic Report 01–41 Governance 42–74 Financial Statements 75–131
80Spectris plc Annual Report and Accounts 2014
Consolidated Statement of Changes in EquityFor the year ended 31 December 2014
Capital Share Share Retained Translation Hedging Merger redemption Total capital premium earnings reserve reserve reserve reserve equity £m £m £m £m £m £m £m £m
Balance at 1 January 2014 6.2 231.4 562.9 40.4 (0.2) 3.1 0.3 844.1
Profit for the year – – 135.1 – – – – 135.1
Other comprehensive income: Net loss on effective portion of changes in fair value of forward exchange contracts, net of tax – – – – (2.8) – – (2.8) Foreign exchange movements on translation of overseas operations – – – (5.5) – – – (5.5) Re-measurement of net defined benefit liability, net of foreign exchange and tax – – (4.1) – – – – (4.1)
Total comprehensive income for the year – – 131.0 (5.5) (2.8) – – 122.7 Transactions with owners recorded directly in equity: Equity dividends paid by the Company – – (52.3) – – – – (52.3) Share-based payments, net of tax – – 1.2 – – – – 1.2 Share options exercised from own shares (treasury) purchased – – 0.3 – – – – 0.3
Balance at 31 December 2014 6.2 231.4 643.1 34.9 (3.0) 3.1 0.3 916.0
Capital Share Share Retained Translation Hedging Merger redemption Total capital premium earnings reserve reserve reserve reserve equity For the year ended 31 December 2013 £m £m £m £m £m £m £m £m
Balance at 1 January 2013 6.2 231.4 401.0 50.4 (0.8) 3.1 0.3 691.6
Profit for the year – – 200.0 – – – – 200.0
Other comprehensive income: Net gain on effective portion of changes in fair value of forward exchange contracts, net of tax – – – – 0.6 – – 0.6 Foreign exchange movements on translation of overseas operations – – – (8.5) – – – (8.5) Foreign exchange gain on disposal of businesses taken to income statement – – – (1.5) – – – (1.5) Re-measurement of net defined benefit liability, net of foreign exchange and tax – – 2.5 – – – – 2.5
Total comprehensive income for the year – – 202.5 (10.0) 0.6 – – 193.1 Transactions with owners recorded directly in equity: Equity dividends paid by the Company – – (47.7) – – – – (47.7) Share-based payments, net of tax – – 6.8 – – – – 6.8 Share options exercised from own shares (treasury) purchased – – 0.3 – – – – 0.3
Balance at 31 December 2013 6.2 231.4 562.9 40.4 (0.2) 3.1 0.3 844.1

Strategic Report 01–41 Governance 42–74 Financial Statements 75–131
81Spectris plc Annual Report and Accounts 2014
Consolidated Statement of Financial PositionAs at 31 December 2014
2014 2013 Note £m £m
ASSETS Non-current assets Intangible assets:
Goodwill 11 569.4 521.0 Other intangible assets 11 208.5 177.5
777.9 698.5 Property, plant and equipment 12 162.5 159.0 Deferred tax assets 20 18.3 17.0 Retirement benefit assets 19 3.6 7.2
962.3 881.7
Current assets Inventories 13 175.7 162.0 Taxation recoverable 1.1 1.9 Trade and other receivables 14 232.6 215.8 Derivative financial instruments 27 – 3.6 Cash and cash equivalents 15 34.8 43.8
444.2 427.1
Total assets 1,406.5 1,308.8
LIABILITIES Current liabilities Short-term borrowings 16 (50.9) (2.2) Derivative financial instruments 27 (0.3) – Trade and other payables 17 (201.0) (194.0) Current tax liabilities (28.8) (32.6) Provisions 18 (17.7) (21.0)
(298.7) (249.8)
Net current assets 145.5 177.3
Non-current liabilities Medium- and long-term borrowings 16 (109.5) (145.7) Other payables 17 (21.6) (14.8) Retirement benefit obligations 19 (17.6) (15.4) Deferred tax liabilities 20 (43.1) (39.0)
(191.8) (214.9)
Total liabilities (490.5) (464.7)
Net assets 916.0 844.1
EQUITY Share capital 21 6.2 6.2 Share premium 231.4 231.4 Retained earnings 643.1 562.9 Translation reserve 34.9 40.4 Hedging reserve (3.0) (0.2) Merger reserve 3.1 3.1 Capital redemption reserve 0.3 0.3
Total equity attributable to equity holders of the Parent Company 916.0 844.1
Total equity and liabilities 1,406.5 1,308.8
The Financial Statements on pages 78 to 123 were approved by the Board of Directors on 27 February 2015 and were signed on its behalf by:
Clive WatsonGroup Finance Director Company Registration No. 2025003

Strategic Report 01–41 Governance 42–74 Financial Statements 75–131
82Spectris plc Annual Report and Accounts 2014
Consolidated Statement of Cash FlowsFor the year ended 31 December 2014
2014 2013 Note £m £m
Cash flows from operating activities Profit after tax 135.1 200.0 Adjustments for: Taxation 8 36.0 71.7 Profit on disposal of businesses 25 (2.4) (98.3) Finance costs 7 5.9 13.7 Financial income 7 (6.3) (1.2) Depreciation 12 18.2 18.1 Amortisation of intangible assets 11 29.4 32.4 Acquisition-related fair value adjustments – (0.4) Acquisition costs not yet paid 1.4 – (Profit)/loss on sale of property, plant and equipment 5 (0.3) 0.2 Equity-settled share-based payment transactions 6 2.2 2.3
Operating cash flow before changes in working capital and provisions 219.2 238.5 Increase in trade and other receivables (16.3) (6.1) (Increase)/decrease in inventories (8.1) 0.7 Increase/(decrease) in trade and other payables 3.9 (11.5) Decrease in provisions and employee benefits (0.5) (5.2) Net income taxes paid (43.0) (64.1)
Net cash flows generated from operating activities 155.2 152.3
Cash flows from investing activities Purchase of property, plant and equipment and software (27.4) (31.7) Proceeds from sale of property, plant and equipment 2.4 1.4 Acquisition of businesses, net of cash acquired 24 (91.6) (16.9) Proceeds from disposal of businesses 25 – 106.0 Interest received 0.3 0.3
Net cash flows (used in)/generated from investing activities (116.3) 59.1
Cash flows from financing activities Interest paid (6.6) (9.7) Dividends paid 9 (52.3) (47.7) Proceeds from exercise of share options (treasury shares) 0.3 0.3 Proceeds from borrowings 20.8 80.4 Repayment of borrowings (8.2) (233.8)
Net cash flows used in financing activities (46.0) (210.5)
Net (decrease)/increase in cash and cash equivalents (7.1) 0.9 Cash and cash equivalents at beginning of year 41.6 39.8 Effect of foreign exchange rate changes (2.2) 0.9
Cash and cash equivalents at end of year 15 32.3 41.6
2014 2013 Reconciliation of changes in cash and cash equivalents to movements in net debt Note £m £m
Net (decrease)/increase in cash and cash equivalents (7.1) 0.9 Proceeds from borrowings (20.8) (80.4) Repayment of borrowings 8.2 233.8 Effect of foreign exchange rate changes (1.8) (4.3)
Movement in net debt (21.5) 150.0 Net debt at start of year 16 (104.1) (254.1)
Net debt at end of year 16 (125.6) (104.1)

Strategic Report 01–41 Governance 42–74 Financial Statements 75–131
83Spectris plc Annual Report and Accounts 2014
Notes to the Accounts
1. Basis of preparation and summary of significant accounting policies
a) Basis of preparation
Basis of accountingThe Consolidated Financial Statements have been prepared on a historical cost basis except for items that are required by IFRS to be measured at fair value, principally certain financial instruments. The Consolidated Financial Statements have been prepared in accordance with IFRS as issued by the International Accounting Standards Board (‘IASB’) and interpretations issued by the International Financial Reporting Interpretations Committee (‘IFRIC’) of the IASB, as adopted by the European Union (adopted IFRS), and in accordance with the provisions of the Companies Act 2006.
The Financial Statements set out on pages 78 to 123 have been prepared using consistent accounting policies, except for the adoption of new accounting standards and interpretations noted below. No revisions to adopted IFRS that became applicable in 2014 had a significant impact on the Group Financial Statements.
These Financial Statements are presented in millions of Sterling rounded to the nearest one decimal place.
Basis of consolidationThe Consolidated Financial Statements set out the Group’s financial position as at 31 December 2014 and the Group’s financial performance for the year ended 31 December 2014.
Subsidiaries are those entities controlled by the Group. Control exists when the Group has the power, directly or indirectly, to govern the financial and operating policies of an entity so as to obtain benefits from its activities. Subsidiaries are consolidated from the date on which control is transferred to the Group and cease to be consolidated from the date on which control is transferred out of the Group. Associates are accounted for using the equity method of accounting and are initially recognised at cost.
All inter-company balances and transactions, including unrealised profits arising from intra-group transactions, have been eliminated in full. Unrealised losses are eliminated in the same way as unrealised gains except that they are only eliminated to the extent that there is no evidence of impairment.
Going concernThe Group’s business activities, together with factors likely to affect its future development, performance and financial position, are set out in the Strategic Report on pages 1 to 41. The financial position of the Group, its cash flows, liquidity position and borrowing facilities are described in the Financial Review on pages 38 to 41. In addition, Note 26 to the Financial Statements includes the Group’s objectives, policies and processes for managing its capital; its financial risk management objectives; details of its financial instruments and hedging activities; and its exposure to credit risk and liquidity risk.
The Group’s net debt balance at 31 December 2014 was £125.6m (2013: £104.1m), with available undrawn committed borrowing facilities of £316.8m (2013: £311.0m).
The Board has reviewed sensitivity analysis on the Group’s forecasts to 30 June 2016, the maturity profile of its financial facilities and liabilities (Notes 16 and 27) and the ability of the Group to refinance these obligations as they fall due. The principal liquidity and solvency risk is mitigated through its financial risk management policies (Note 26). For the foreseeable future, the Board has a high level of confidence that the Group will have the necessary liquid resources to meet its liabilities as they fall due and will be able to sustain its business model, strategy and operations and remain solvent, including the impact of reasonable scenarios. For this reason, it continues to adopt the going concern basis in preparing the Group Financial Statements. There are no key sensitivities identified in relation to this conclusion.
New standards and interpretations not yet adoptedThere are a number of new standards, amendments to standards and interpretations that are not yet effective for the year ended 31 December 2014 and have, therefore, not been applied in preparing these Consolidated Financial Statements. IFRS 15 ‘Revenue from contracts with customers’ is effective from the 31 December 2017 year end. The adoption of this standard is not expected to have a significant impact on the results or Consolidated Statement of Financial Position reported in the Consolidated Financial Statements.

Strategic Report 01–41 Governance 42–74 Financial Statements 75–131
84Spectris plc Annual Report and Accounts 2014
Notes to the Accounts continued
1. Basis of preparation and summary of significant accounting policies continued
Intangible assets and amortisationThe cost of acquiring software (including associated implementation costs where applicable) that is not specific to an item of property, plant and equipment is classified as an intangible asset.
Self-funded research and development costs are charged to the Consolidated Income Statement in the year in which they are incurred unless development expenditure meets certain strict criteria for capitalisation. These criteria include demonstration of the technical feasibility and intent of completing a new intangible asset that will be available for sale and that the asset will generate probable future economic benefits. From the point where expenditure meets the criteria, development costs are capitalised and amortised over their useful economic lives. The Directors consider that, due to the nature of projects undertaken, the proportion of development costs incurred that meets the criteria for capitalisation is immaterial.
Intangible assets arising from a business combination that are separable from goodwill are recognised initially at fair value at the date of acquisition. Other acquired intangible assets (including software not specific to an item of property, plant and equipment) are initially recognised at cost (plus any associated implementation costs where applicable).
Subsequent expenditure is capitalised only when it increases the future economic benefits, otherwise it is expensed as incurred.
Amortisation of intangible assets is charged to administration expenses in the Consolidated Income Statement on a straight-line basis over the shorter of the estimated useful economic life (determined on an asset by asset basis) or underlying contractual life. The estimated useful lives are as follows:
•Software – 3 to 5 years.
•Patents, contractual rights and technology – up to 10 years, dependent upon the nature of the underlying contractual right.
•Customer-related and trade names – 3 to 20 years, dependent upon the underlying contractual arrangements and specific circumstances such as customer retention experience.
Property, plant and equipment and depreciationProperty, plant and equipment is stated at cost less accumulated depreciation and impairment losses. The cost comprises the purchase price paid and any costs directly attributable to bringing it into working condition for its intended use.
Depreciation is recognised in the Consolidated Income Statement on a straight-line basis to write off the cost, less the estimated residual value (which is reviewed annually), of property, plant and equipment over its estimated useful economic life. Depreciation commences on the date the assets are ready for use within the business and the asset carrying values are reviewed for impairment when there is an indication that they may be impaired. The depreciation charge is revised where useful lives are different from those previously estimated, or where technically obsolete assets are required to be written down. Where parts of an item of plant and equipment have separate lives, they are accounted for and depreciated as separate items. Land is not depreciated. Estimated useful lives are as follows:
•Freehold and long leasehold property – 20 to 40 years.
•Short leasehold property – over the period of the lease.
•Plant and equipment – 3 to 20 years.
Borrowing costs directly attributable to the acquisition, construction or production of qualifying assets that take a substantial period of time to get ready for their intended use are capitalised as part of the cost of the respective asset.
InventoriesInventories and work in progress are carried at the lower of cost and net realisable value. Inventory acquired as part of business combinations is valued at fair value less cost to sell. Cost represents direct costs incurred and, where appropriate, production or conversion costs and other costs to bring the inventory to its existing location and condition. In the case of manufacturing inventory and work in progress, cost includes an appropriate share of production overheads based on normal operating capacity. Inventory is accounted for on a first-in, first-out basis or, in some cases, a weighted average basis is used if deemed more appropriate for the business. Provisions are made to write down slow-moving, excess and obsolete items to net realisable value, based on an assessment of technological and market developments and on an analysis of historic and projected usage with regard to quantities on hand.
Trade and other receivablesTrade receivables are carried at original invoice amount which is considered a reasonable proxy for fair value, less provision made for impairment of these receivables. A provision for impairment of trade receivables is established when there is objective evidence that the Group will not be able to collect all amounts due according to the original terms of the receivables. The amount of the provision is the difference between the original carrying amount and the recoverable amount, being the present value of expected cash flows receivable. The amount of the provision is recognised in the Consolidated Income Statement.
Cash and cash equivalentsCash and cash equivalents comprises cash at bank and in hand and short-term deposits held on call or with maturities of less than three months at inception. Bank overdrafts that are repayable on demand and form an integral part of the Group’s cash management are included as a component of cash equivalents for the purposes of the Consolidated Statement of Cash Flows.

Strategic Report 01–41 Governance 42–74 Financial Statements 75–131
85Spectris plc Annual Report and Accounts 2014
Notes to the Accounts continued
1. Basis of preparation and summary of significant accounting policies continued
Significant accounting judgements and estimatesIn preparing the Consolidated Financial Statements, management have made judgements, estimates and assumptions that affect the application of the Group’s accounting policies and the reported amounts of assets, liabilities, income and expenses. Actual results may differ from these estimates.
Estimates and assumptions are reviewed on an ongoing basis and are based on historical experience and various other factors that are believed to be reasonable under the circumstances.
Information about significant areas of judgements, estimates and assumptions is included in the following notes:
•Note 11 – Impairment of goodwill. The carrying amount of goodwill has been tested for impairment by estimating the value in use of the cash-generating units to which it has been allocated. Note 11 outlines the significant assumptions made in performing the impairment tests;
•Note 13 – Provisions against inventory. Judgement is applied to assess the level of provisions required to write down slow-moving, excess and obsolete inventory to their net realisable value;
•Note 14 – Provisions for impairment of trade receivables. Judgement is applied to assess whether a trade receivable is recoverable or not, and whether the level of provision required to write down the value of the receivable to its recoverable amount is appropriate;
•Notes 18 and 28 – Provisions and contingent liabilities in relation to determining the risk-adjusted probability, quantum and timing of management’s best estimate of future payments;
•Note 19 – Defined benefit pension obligations. The defined benefit pension obligations are calculated using a number of assumptions, including future inflation, salary increases and mortality, and the obligation is then discounted to its present value using an assumed discount rate. The pension deficit has been calculated using the assumptions set out in Note 19;
•Note 20 – Deferred tax. The recognition of deferred tax assets is dependent on assessments of future taxable income in the relevant countries concerned; and
•Note 24 – Business combinations in relation to the estimation of the provisional fair values and useful lives of acquired assets and liabilities at the date of acquisition.
b) Summary of significant accounting policiesThe accounting policies set out below have been applied consistently by Group entities to all years presented in these Financial Statements.
Business combinations and goodwillThe Group applies IFRS 3 (Revised) ‘Business Combinations’ for transactions arising after 1 January 2010. This changed the Group’s definition of the cost of business combinations and the treatment of contingent consideration. The subsequent accounting for contingent consideration depends on whether this was initially recognised as equity or as a liability and whether the event is considered a measurement period adjustment. Transaction costs on a business combination are expensed as incurred in the Consolidated Income Statement.
All business combinations are accounted for by applying the acquisition method. Goodwill represents the excess of the fair value of the purchase consideration for the interests in subsidiary undertakings over the net fair value to the Group of the identifiable assets, liabilities and contingent liabilities acquired.
Goodwill arising on the acquisition of a business is tested annually for impairment. Goodwill is not amortised, and any impairment losses are not subsequently reversed. The net book value of goodwill at the date of transition to IFRS has been treated as deemed cost. On the subsequent disposal or discontinuance of a previously acquired business, the relevant goodwill is dealt with in the Consolidated Income Statement except for the goodwill already charged to reserves. From 1 January 2004, goodwill is allocated on acquisition to cash-generating units that are anticipated to benefit from the combination. Goodwill is tested for impairment by assessing the recoverable amount of the cash-generating unit to which the goodwill relates and comparing it against the net book value. This estimate of recoverable amount is determined at each statement of financial position date. The Group’s identified cash-generating units are smaller than the reportable operating segments in Note 3.
The estimate of recoverable amount requires significant assumptions to be made and is based on a number of factors such as the near-term business outlook for the cash-generating unit, including both its operating profit and operating cash flow performance. Where the recoverable amount of the cash-generating unit is less than the carrying amount, an impairment loss is recognised. Where goodwill forms part of a cash- generating unit and part of the operation within that unit is disposed of, the goodwill associated with the operation disposed of is included in the carrying amount of the operation when determining the gain or loss on disposal. Goodwill disposed of in this circumstance is measured on the basis of the relative values of the operation disposed of and the portion of the cash-generating unit retained.

Strategic Report 01–41 Governance 42–74 Financial Statements 75–131
86Spectris plc Annual Report and Accounts 2014
Notes to the Accounts continued
1. Basis of preparation and summary of significant accounting policies continued
Trade and other payablesTrade and other payables are carried at the amounts expected to be paid to counterparties.
ProvisionsA provision is recognised in the Consolidated Statement of Financial Position when the Group has a present legal or constructive obligation as a result of a past event and it is probable that an outflow of resources, that can be reliably measured, will be required to settle the obligation. In respect of warranties, a provision is recognised when the underlying products or services are sold. Provisions are recognised at an amount equal to the best estimate of the expenditure required to settle the Group’s liability. A contingent liability is disclosed where the existence of the obligation will only be confirmed by future events or where the amount of the obligation cannot be measured with reasonable reliability. Contingent assets are not recognised, but are disclosed where an inflow of economic benefit is probable. Obligations arising from restructuring plans are recognised when detailed formal plans have been established and when there is a valid expectation that such a plan will be carried out.
LeasingRentals payable under operating leases are charged to the Consolidated Income Statement on a straight-line basis over the term of the relevant lease. Benefits received and receivable as an incentive to enter into an operating lease are also spread on a straight-line basis over the lease term.
TaxationTax on the profit or loss for the year comprises both current and deferred tax. Tax is recognised in the Consolidated Income Statement except to the extent that it relates to items recognised either in other comprehensive income or directly in equity, in which case tax is recognised in the Consolidated Statement of Comprehensive Income or the Consolidated Statement of Changes in Equity, respectively.
Current tax is the expected tax payable on the taxable income for the year, using tax rates enacted or substantively enacted at the statement of financial position date, and any adjustments to tax payable in respect of prior years.
Deferred taxation is provided on taxable temporary differences between the carrying amounts of assets and liabilities in the Financial Statements and their corresponding tax bases. No provision is made for deferred tax which would become payable on the distribution of retained profits by overseas subsidiaries where the timing of the reversal of the temporary difference can be controlled and it is probable that the temporary difference will not reverse in the foreseeable future. Deferred tax is measured using the tax rates expected to apply when the asset is realised or the liability settled based on tax rates enacted or substantively enacted by the statement of financial position date. However, deferred tax is not provided on the initial recognition of goodwill, nor on the initial recognition of an asset or liability unless the related transaction is a business combination or affects tax or accounting profit.
A deferred tax asset is recognised only to the extent that it is probable that future taxable profits will be available against which the asset can be utilised or that they will reverse. Deferred tax assets are reduced to the extent that it is no longer probable that the related tax benefit will be realised.
Deferred tax assets and liabilities are offset if a legally enforceable right exists to set off current tax assets against current tax liabilities and the deferred taxes relate to the same taxable entity and the same taxation authority.
Additional income taxes that arise from the distribution of intra-group dividends are recognised at the same time as the liability to pay the related dividend.
Foreign currency translationThe functional currency for each entity in the Group is determined with reference to the currency of the primary economic environment in which it operates. Transactions in currencies other than the functional currency are initially recorded at the functional currency rate ruling at the date of the transaction. Monetary assets and liabilities denominated in foreign currencies are retranslated at the rate of exchange ruling at the statement of financial position date. Exchange gains and losses on settlement of foreign currency transactions are translated at the rate prevailing at the date of the transactions, or the translation of monetary assets and liabilities at period end exchange rates, and are charged/credited to the Consolidated Income Statement. Non-monetary assets and liabilities denominated in foreign currencies that are stated at historical cost are translated to the functional currency at the foreign exchange rate ruling at the date of the transaction.
On consolidation, the income statement items of subsidiaries are translated into Sterling at average rates of exchange. Statement of financial position items are translated into Sterling at year end exchange rates. Exchange differences on the retranslation are taken to the translation reserve within equity. Exchange differences on foreign currency borrowings designated as a hedge of the net investment in a foreign operation are reported in the Consolidated Statement of Comprehensive Income. All other exchange differences are charged or credited to the Consolidated Income Statement in the year in which they arise. On disposal of an overseas subsidiary, any cumulative exchange movements relating to that subsidiary held in the translation reserve are transferred to the Consolidated Income Statement.
Derivative financial instruments may be purchased to hedge the Group’s exposure to changes in foreign exchange rates. The accounting policies applied in these circumstances are described below.

Strategic Report 01–41 Governance 42–74 Financial Statements 75–131
87Spectris plc Annual Report and Accounts 2014
Notes to the Accounts continued
1. Basis of preparation and summary of significant accounting policies continued
Interest-bearing borrowingsInterest-bearing borrowings are recognised initially at the fair value of consideration received less directly attributable transaction costs. Subsequent to initial recognition, interest-bearing borrowings are measured at amortised cost with any difference between cost and redemption value being recognised in the Consolidated Income Statement over the period of the borrowings on an effective interest basis.
Financial instruments
RecognitionThe Group recognises financial assets and liabilities on its Consolidated Statement of Financial Position when it becomes a party to the contractual provisions of the instrument.
Financial assets and liabilities are offset and the net amount is reported in the Consolidated Statement of Financial Position when there is a legally enforceable right to set off the recognised amounts and there is an intention to settle on a net basis, or realise the asset and settle the liability simultaneously.
MeasurementWhen financial assets and liabilities are initially recognised, they are measured at fair value, being the consideration given or received plus directly attributable transaction costs.
In determining estimated fair value, investments are valued at quoted bid prices on the trade date. When quoted prices on an active market are not available, fair value is determined by reference to price quotations for similar instruments traded.
Loans and receivables comprise loans and advances other than purchased loans. Originated loans and receivables are initially recognised in accordance with the policy stated above and subsequently re-measured at amortised cost using the effective interest method. Allowance for impairment is estimated on a case-by-case basis.
The Group uses derivative financial instruments such as forward foreign exchange contracts to hedge risks associated with foreign exchange fluctuations. These are designated as cash flow hedges. At the inception of the hedge relationship, the Group documents the relationship between the hedging instrument and the hedged item, along with its risk management objectives and its strategy for undertaking various hedge transactions. Furthermore, at the inception of the hedge and on an ongoing basis, the Group documents whether the hedging instrument that is used in a hedging relationship is highly effective in offsetting changes in cash flows of the hedged item.
The effective portion of changes in the fair value of derivatives that are designated and qualify as cash flow hedges are deferred in equity. The gain or loss relating to the ineffective portion is recognised immediately in the Consolidated Income Statement.
Amounts deferred in equity are recycled to the Consolidated Income Statement in the periods when the hedged item is recognised in the Consolidated Income Statement, in the same line of the Consolidated Income Statement as the recognised hedged item. However, when the forecast transaction that is hedged results in the recognition of a non-financial asset or a non-financial liability, the gains and losses previously deferred in equity are transferred from equity and included in the initial measurement of the cost of the asset or liability.
Hedge accounting is discontinued when the Group revokes the hedging relationship, the hedging instrument expires or is sold, terminated, or exercised, or no longer qualifies for hedge accounting. Any cumulative gain or loss deferred in equity at that time remains in equity and is recognised when the forecast transaction is ultimately recognised in the Consolidated Income Statement. When a forecast transaction is no longer expected to occur, the cumulative gain or loss that was deferred in equity is recognised immediately in the Consolidated Income Statement.
derecognitionA financial asset is derecognised when the Group loses control over the contractual rights that comprise that asset. This occurs when the rights are realised, expire or are surrendered. A financial liability is derecognised when it is extinguished. Originated loans and receivables are derecognised on the date they are transferred by the Group.
Impairment of financial assetsThe Group assesses at each Consolidated Statement of Financial Position reporting date whether there is any objective evidence that a financial asset, or Group of financial assets, is impaired. A financial asset, or group of financial assets, is deemed to be impaired if, and only if, there is objective evidence of impairment as a result of one or more events that has occurred after the initial recognition of the asset (an incurred ‘loss event’) and that loss event has an impact on the estimated future cash flows of the financial asset or Group of financial assets that can be reliably estimated.
Net investment hedge accountingThe Group uses US Dollar and Euro-denominated borrowings as a hedge against the translation exposure on the Group’s net investment in overseas companies. Where the hedge is fully effective at hedging the variability in the net assets of such companies, caused by changes in foreign exchange rates, the changes in the value of the borrowings are recognised in the Consolidated Statement of Comprehensive Income. The ineffective part of any change in value caused by changes in foreign exchange rates is recognised in the Consolidated Income Statement.

Strategic Report 01–41 Governance 42–74 Financial Statements 75–131
88Spectris plc Annual Report and Accounts 2014
Notes to the Accounts continued
1. Basis of preparation and summary of significant accounting policies continued
Employee benefitsThe Group operates defined benefit post-retirement benefit schemes and defined contribution pension schemes.
Defined benefit plansThe Group’s net obligation recognised in the Consolidated Statement of Financial Position in respect of defined benefit schemes is calculated separately for each plan as the present value of schemes’ liabilities less the fair value of schemes’ assets. The operating and financing costs of defined benefit schemes are recognised separately in the Consolidated Income Statement. Operating costs comprise the current service cost, scheme administrative expense, any gains or losses on settlement or curtailments, and past service costs where benefits have vested. Finance items comprise the unwinding of the discount on net asset/deficit. Actuarial gains or losses comprising changes in schemes’ liabilities due to experience and changes in actuarial assumptions are recognised in the Consolidated Statement of Comprehensive Income.
The amount of any pension fund asset recognised in the Consolidated Statement of Financial Position is limited to any future refunds from the plan or the present value of reductions in future contributions to the plan.
Defined contribution schemeA defined contribution plan is a post-employment benefit plan under which an entity pays fixed contributions into a separate entity and will have no legal or constructive obligation to pay further amounts. Obligations for contributions to defined contribution pension plans are recognised in the Consolidated Income Statement in the periods during which services are rendered by employees.
In certain countries, the Group participates in industry-wide defined benefit-type pension arrangements. In such circumstances, it is not possible to determine the amount of any surplus or deficit attributable to the Group and the pension costs are accounted for as if the arrangements were defined contribution schemes. These are not material to the Group and, accordingly, no additional disclosures are provided.
Short-term benefitsShort-term employee benefit obligations are measured on an undiscounted basis and are expensed as the related service is provided. A liability is recognised for the amount expected to be paid under short-term cash bonus or profit-sharing plans if the Group has a present legal or constructive obligation to pay this amount as a result of past service provided by the employee, and the obligation can be estimated reliably.
Share-based paymentsCertain employees of the Group receive part of their remuneration in the form of share-based payment transactions, whereby employees render services in exchange for shares or rights over shares (equity-settled transactions). The cost of equity-settled transactions with employees is measured at fair value at the date at which they are granted. The fair value of share awards with market-related vesting conditions is determined by an external consultant and the fair value at the grant date is expensed on a straight-line basis over the vesting period based on the Group’s estimate of shares that will eventually vest. The estimate of the number of awards likely to vest is reviewed at each Consolidated Statement of Financial Position reporting date up to the vesting date, at which point the estimate is adjusted to reflect the actual outcome of awards which have vested. No adjustment is made to the fair value after the vesting date even if the awards are forfeited or not exercised.
Where it is not possible to incentivise managers of the Group’s operating companies with equity-settled options, they are issued with cash-settled options. The charge for these awards is adjusted to reflect the expected and actual levels of options that vest and the fair value is based on either the share price at date of exercise or the share price at the Consolidated Statement of Financial Position date if sooner.
Own sharesOwn equity instruments which are re-acquired (own shares) are recognised at cost and deducted from equity. No gain or loss is recognised in the Consolidated Income Statement on the purchase, sale, issue or cancellation of the Group’s own equity instruments. Any difference between the carrying amount and the consideration paid to acquire such equity instruments is recognised within equity.
DividendsDividends are recognised as a liability in the period in which they are approved by shareholders.
RevenuesRevenues comprise sales to external customers after discounts and excluding Value Added Tax and similar sales taxes.
Revenue from the sale of goods is recognised in the Consolidated Income Statement when the significant risk and rewards of ownership of the goods have been transferred to the customer, which is typically on delivery. For contracts that involve a significant element of installation or testing of equipment, revenue is recognised at the point of customer acceptance. Revenue from services rendered is recognised in the Consolidated Income Statement in proportion to the measurement of the stage of completion of services rendered as at the Consolidated Statement of Financial Position date. This is assessed by reference to the amount of time incurred in proportion to the total expected time to be taken to deliver the service.
Occasionally, the initial contract covers both the supply of goods and ongoing support, servicing and maintenance. For such contracts revenue is allocated across each of the individual components in line with their relative value and each element is accounted for as described above.
Interest payable and receivableInterest payable comprises the interest payable on borrowings calculated using the effective interest method. Interest receivable comprises interest income on cash and funds invested and is recognised in the Consolidated Income Statement as it accrues.

Strategic Report 01–41 Governance 42–74 Financial Statements 75–131
89Spectris plc Annual Report and Accounts 2014
Notes to the Accounts continued
2. Adjusted performance measures
Spectris plc uses adjusted figures as key performance measures in addition to those reported under adopted IFRS, as management believe these measures enable them to assess the underlying trading performance of the businesses. Adjusted figures exclude certain non-operational items which management have defined as amortisation and impairment of acquisition-related intangible assets, acquisition-related costs and contingent consideration fair value adjustments, acquisition-related fair value adjustments, profits or losses on termination or disposal of businesses, unrealised changes in the fair value of financial instruments, gains or losses on retranslation of short-term inter-company loan balances, related tax effects and other tax items which do not form part of the underlying tax rate (see Note 8). In addition, all comparative income statement and operating cash flow figures have been restated to exclude the trading results and impact of the disposal of the Fusion UV business which was disposed of on 31 January 2013.
The adjusted performance measures are derived from the reported figures under adopted IFRS as follows: 2014 2013 Sales £m £m
Sales as reported under adopted IFRS 1,173.7 1,202.0 Divested businesses – (4.2)
Sales excluding divested businesses 1,173.7 1,197.8
Materials Test and In-line Industrial 2014 Analysis Measurement Instrumentation Controls Total Sales by segment Note £m £m £m £m £m
Sales as reported under adopted IFRS 3 348.8 342.9 261.4 220.6 1,173.7
Materials Test and In-line Industrial 2013 Analysis Measurement Instrumentation Controls Total Sales by segment Note £m £m £m £m £m
Sales as reported under adopted IFRS 362.4 348.7 269.9 221.0 1,202.0 Divested businesses – – (4.2) – (4.2)
Sales excluding divested businesses 3 362.4 348.7 265.7 221.0 1,197.8
The following is an analysis of revenue by geographical destination: 2014 2013 £m £m
UK 44.4 39.9 Germany 116.7 125.4 France 39.9 46.3 Rest of Europe 171.5 177.8 USA 344.2 336.9 Rest of North America 37.5 36.3 Japan 59.4 61.3 China 153.7 159.5 South Korea 33.6 33.7 Rest of Asia Pacific 96.6 100.9 Rest of the world 76.2 79.8
1,173.7 1,197.8
2014 2013 Adjusted operating profit Note £m £m
Operating profit as reported under adopted IFRS 168.3 185.9 Net acquisition-related costs and fair value adjustments 3.9 0.7 Amortisation of acquisition-related intangible assets 11 25.9 28.9
Adjusted operating profit 198.1 215.5 Divested businesses – (0.8)
Adjusted operating profit excluding divested businesses 198.1 214.7

Strategic Report 01–41 Governance 42–74 Financial Statements 75–131
90Spectris plc Annual Report and Accounts 2014
Notes to the Accounts continued
2. Adjusted performance measures continued Materials Test and In-line Industrial 2014 Analysis Measurement Instrumentation Controls Total Adjusted operating profit by segment – 2014 Note £m £m £m £m £m
Operating profit as reported under adopted IFRS 48.0 45.7 45.6 29.0 168.3 Net acquisition-related costs and fair value adjustments (2.3) 0.9 – 5.3 3.9 Amortisation of acquisition-related intangible assets 7.6 5.6 2.4 10.3 25.9
Adjusted operating profit: segment result 3 53.3 52.2 48.0 44.6 198.1
Materials Test and In-line Industrial 2013 Analysis Measurement Instrumentation Controls Total Adjusted operating profit by segment – 2013 Note £m £m £m £m £m
Operating profit as reported under adopted IFRS 54.7 49.4 49.3 32.5 185.9 Net acquisition-related costs and fair value adjustments 0.3 – – 0.4 0.7 Amortisation of acquisition-related intangible assets 8.3 5.4 2.7 12.5 28.9
Adjusted operating profit: segment result 3 63.3 54.8 52.0 45.4 215.5 Divested businesses – – (0.8) – (0.8)
Adjusted operating profit excluding divested businesses: segment result 63.3 54.8 51.2 45.4 214.7
Net acquisition-related costs and fair value adjustments are comprised of acquisition costs of £3.9m (2013: £1.1m) that have been recognised in the Consolidated Income Statement under IFRS 3 (Revised) ‘Business Combinations’, fair value adjustments to inventory of £0.6m (2013: £0.1m) and other fair value adjustments, resulting in a credit of £0.6m (2013: credit £0.5m). Net acquisition-related costs and fair value adjustments are included within administrative expenses. Acquisition-related costs have been excluded from the adjusted operating profit and acquisition costs paid of £2.5m (2013: £1.3m) have been excluded from adjusted operating cash flow. Materials Test and In-line Industrial 2014 Analysis Measurement Instrumentation Controls Total Return on sales by segment – 2014 % % % % %
Using operating profit as reported under adopted IFRS 13.8 13.3 17.4 13.1 14.3 Using adjusted operating profit 15.3 15.2 18.4 20.2 16.9
Materials Test and In-line Industrial 2013 Analysis Measurement Instrumentation Controls Total Return on sales by segment – 2013 % % % % %
Using operating profit as reported under adopted IFRS 15.1 14.2 18.3 14.7 15.5 Using adjusted operating profit 17.5 15.7 19.3 20.6 17.9 Using adjusted operating profit excluding divested businesses 17.5 15.7 19.3 20.6 17.9
2014 2013 Reconciliation to adjusted profit before tax and adjusted operating profit Note £m £m
Profit before tax as reported under adopted IFRS 171.1 271.7 Add/(deduct): Net acquisition-related costs and fair value adjustments 3.9 0.7 Amortisation of acquisition-related intangible assets 11 25.9 28.9 Profit on disposal of businesses 25 (2.4) (98.3) Increase in fair value of cross-currency interest rate swaps – (0.7) Net (gain)/loss on retranslation of short-term inter-company loan balances 7 (6.0) 4.1
Adjusted profit before tax 192.5 206.4 Divested businesses – (0.8)
Adjusted profit before tax excluding divested businesses 192.5 205.6
Adjusted net finance costs (see below) 5.6 9.1
Adjusted operating profit excluding divested businesses 198.1 214.7

Strategic Report 01–41 Governance 42–74 Financial Statements 75–131
91Spectris plc Annual Report and Accounts 2014
Notes to the Accounts continued
2. Adjusted performance measures continued 2014 2013 Adjusted net finance costs Note £m £m
Net interest income/(costs) as reported under adopted IFRS 7 0.4 (12.5) Increase in fair value of cross-currency interest rate swaps – (0.7) Net (gain)/loss on retranslation of short-term inter-company loan balances 7 (6.0) 4.1
Adjusted net finance costs (5.6) (9.1)
2014 2013 Adjusted operating cash flow £m £m
Net cash from operating activities under adopted IFRS 155.2 152.3 Acquisition-related costs paid 2.5 1.3 Net income taxes paid 43.0 64.1 Purchase of property, plant and equipment and software (27.4) (31.7) Proceeds from sale of property, plant and equipment 2.4 1.4
Adjusted operating cash flow 175.7 187.4 Divested businesses – (2.6)
Adjusted operating cash flow excluding divested businesses 175.7 184.8
2014 2013 Adjusted earnings per share Note £m £m
Profit after tax as reported under adopted IFRS 135.1 200.0 Adjusted for: Net acquisition-related costs and fair value adjustments 3.9 0.7 Amortisation of acquisition-related intangible assets 11 25.9 28.9 Profit on disposal of businesses 25 (2.4) (98.3) Increase in fair value of cross-currency interest rate swaps – (0.7) Net (gain)/loss on retranslation of short-term inter-company loan balances 7 (6.0) 4.1 Tax effect of the above and other non-recurring items 8 (8.7) 22.8
Adjusted earnings 147.8 157.5 Profit after tax on divested businesses – (0.5)
Adjusted earnings excluding divested businesses 147.8 157.0
Weighted average number of shares outstanding (millions) 10 118.8 118.2
Adjusted earnings per share (pence) 124.4 133.3
Adjusted earnings per share excluding divested businesses (pence) 124.4 132.9
Adjusted diluted earnings per share Note 2014 2013
Diluted weighted average number of shares outstanding (millions) 10 119.1 118.7
Adjusted diluted earnings per share (pence) 124.1 132.7
Adjusted diluted earnings per share excluding divested businesses (pence) 124.1 132.3
Basic and diluted earnings per share in accordance with IAS 33 ‘Earnings Per Share’ are disclosed in Note 10. 2014 2013 Analysis of net debt for management purposes Note £m £m
Bank overdrafts 16 2.5 2.2 Bank loans – unsecured 16 157.9 145.7
Total borrowings 160.4 147.9 Cash balances 15 (34.8) (43.8)
Net debt 125.6 104.1

Strategic Report 01–41 Governance 42–74 Financial Statements 75–131
92Spectris plc Annual Report and Accounts 2014
Notes to the Accounts continued
3. Operating segments
The Group has four reportable segments, as described below, which are the Group’s strategic business units. These units offer different applications, assist companies at various stages of the production cycle and are focussed towards specific industries. These segments reflect the internal reporting provided to the Chief Operating Decision Maker (considered to be the Board) on a regular basis to assist in making decisions on capital allocation to each segment and to assess performance. The segment results include an allocation of head office expenses. The following summary describes the operations in each of the Group’s reportable segments:
•Materials Analysis provides products and services that enable customers to determine structure, composition, quantity and quality of particles and materials, during their research and product development processes, when assessing materials before production or during the manufacturing process. The operating companies in this segment are Malvern Instruments, PANalytical and Particle Measuring Systems.
•Test and Measurement supplies test, measurement, and analysis equipment, software and services for product design optimisation, manufacturing control, microseismic monitoring and environmental noise monitoring systems. The operating companies in this segment are Brüel & Kjær Sound & Vibration, ESG Solutions and HBM.
• In-line Instrumentation provides process analytical measurement, asset monitoring and on-line controls as well as associated consumables and services for both primary processing and the converting industries. The operating companies in this segment are Brüel & Kjær Vibro, BTG Group, NDC Technologies and Servomex.
• Industrial Controls provides products and solutions that measure, monitor, control, inform, track and trace during the production process. The operating companies in this segment are Microscan, Omega Engineering and Red Lion Controls.
Further details of the nature of these segments and the products and services they provide are contained in the Strategic Report on pages 30 to 37. Materials Test and In-line Industrial 2014 Analysis Measurement Instrumentation Controls Total Information about reportable segments £m £m £m £m £m
Segment revenues 348.7 343.1 261.7 220.8 1,174.3 Inter-segment revenue 0.1 (0.2) (0.3) (0.2) (0.6)
External revenue 348.8 342.9 261.4 220.6 1,173.7
Reportable segment profit for continuing operations 53.3 52.2 48.0 44.6 198.1 Net acquisition-related costs and fair value adjustments 2.3 (0.9) – (5.3) (3.9) Amortisation of acquisition-related intangible assets (7.6) (5.6) (2.4) (10.3) (25.9)
Operating profit 48.0 45.7 45.6 29.0 168.3 Profit on disposal of businesses1 2.4 Financial income1 6.3 Finance costs1 (5.9)
Profit before tax 171.1 Tax1 (36.0)
Profit after tax 135.1
Materials Test and In-line Industrial 2013 Analysis Measurement Instrumentation Controls Total £m £m £m £m £m
Segment revenues 362.6 349.2 270.0 221.5 1,203.3 Inter-segment revenue (0.2) (0.5) (0.1) (0.5) (1.3)
External revenue 362.4 348.7 269.9 221.0 1,202.0
Reportable segment profit for continuing operations 63.3 54.8 52.0 45.4 215.5 Net acquisition-related costs and fair value adjustments (0.3) – – (0.4) (0.7) Amortisation of acquisition-related intangibles (8.3) (5.4) (2.7) (12.5) (28.9)
Operating profit 54.7 49.4 49.3 32.5 185.9 Profit on disposal of businesses1 98.3 Financial income1 1.2 Finance costs1 (13.7)
Profit before tax 271.7 Tax1 (71.7)
Profit after tax 200.0
1 Not allocated to reportable segments in reporting to the Chief Operating Decision Maker.
Reportable segment profit is consistent with that presented to the Chief Operating Decision Maker. Inter-segment pricing is on an arm’s length basis. Segments are presented on the basis of actual inter-segment charges made.

Strategic Report 01–41 Governance 42–74 Financial Statements 75–131
93Spectris plc Annual Report and Accounts 2014
Notes to the Accounts continued
3. Operating segments continued Carrying amount of Carrying amount of segment assets segment liabilities
2014 2013 2014 2013 £m £m £m £m
Materials Analysis 357.7 304.2 (90.9) (92.2) Test and Measurement 363.5 321.6 (84.9) (75.8) In-line Instrumentation 217.5 214.3 (40.8) (42.0) Industrial Controls 410.0 395.2 (23.7) (19.8)
Total segment assets and liabilities 1,348.7 1,235.3 (240.3) (229.8) Cash and borrowings 34.8 43.8 (160.4) (147.9) Derivative financial instruments – 3.6 (0.3) – Pension asset/(liability) 3.6 7.2 (17.6) (15.4) Taxation 19.4 18.9 (71.9) (71.6)
Consolidated total assets and liabilities 1,406.5 1,308.8 (490.5) (464.7)
Segment assets comprise: goodwill, other intangible assets, property, plant and equipment, inventories, trade and other receivables. Segment liabilities comprise: trade and other payables, provisions and other payables, which can be reasonably attributed to the reported operating segments. Unallocated items represent current and deferred taxation balances, defined benefit scheme assets and liabilities, derivative financial instruments and all components of net debt. Additions to Depreciation and non-current assets amortisation
2014 2013 2014 2013 £m £m £m £m
Materials Analysis 59.7 22.2 13.1 13.6 Test and Measurement 57.3 8.1 13.2 13.4 In-line Instrumentation 6.7 8.8 7.6 7.7 Industrial Controls 6.9 6.6 13.7 15.8
130.6 45.7 47.6 50.5
Geographical segmentsThe Group’s operating segments are each located in several geographical locations and sell on to external customers in all parts of the world.
No individual country amounts to more than 3% of external revenue, other than those noted below.
The following is an analysis of revenue by geographical destination. Materials Test and In-line Industrial 2014 Analysis Measurement Instrumentation Controls Total £m £m £m £m £m
UK 14.9 14.0 8.1 7.4 44.4 Germany 22.1 60.2 24.4 10.0 116.7 France 11.9 19.0 7.0 2.0 39.9 Rest of Europe 55.3 61.9 44.7 9.6 171.5 USA 67.7 65.4 64.2 146.9 344.2 Rest of North America 10.7 4.6 7.6 14.6 37.5 Japan 23.7 22.8 11.3 1.6 59.4 China 53.1 42.7 45.1 12.8 153.7 South Korea 11.9 11.9 6.3 3.5 33.6 Rest of Asia Pacific 41.5 21.0 25.4 8.7 96.6 Rest of the world 36.0 19.4 17.3 3.5 76.2
348.8 342.9 261.4 220.6 1,173.7

Strategic Report 01–41 Governance 42–74 Financial Statements 75–131
94Spectris plc Annual Report and Accounts 2014
Notes to the Accounts continued
3. Operating segments continued Materials Test and In-line Industrial 2013 Analysis Measurement Instrumentation Controls Total £m £m £m £m £m
UK 11.8 13.4 7.5 7.2 39.9 Germany 26.1 61.9 26.7 10.8 125.5 France 12.6 22.6 9.0 2.1 46.3 Rest of Europe 60.0 64.0 44.8 9.2 178.0 USA 63.6 59.7 64.9 149.9 338.1 Rest of North America 11.1 4.3 7.5 13.5 36.4 Japan 24.1 22.8 14.2 1.3 62.4 China 57.2 45.0 47.0 10.9 160.1 South Korea 11.8 13.0 5.3 3.8 33.9 Rest of Asia Pacific 48.0 21.4 23.5 8.7 101.6 Rest of the world 36.1 20.6 19.5 3.6 79.8
362.4 348.7 269.9 221.0 1,202.0
Non-current assets
2014 2013 £m £m
UK 88.6 89.8 Germany 25.9 27.7 France 0.1 0.1 Rest of Europe1 279.8 291.8 USA 443.3 397.5 Rest of North America 57.8 5.3 Japan 0.4 1.4 China 4.1 7.1 South Korea 5.6 0.3 Rest of Asia Pacific 31.2 30.6 Rest of the world 3.6 5.9
940.4 857.5 Retirement benefit assets 3.6 7.2 Deferred taxation2 18.3 17.0
Total non-current assets 962.3 881.7
1 Principally in Denmark and Switzerland. 2 Not allocated to reportable geographic area in reporting to the Chief Operating Decision Maker.
4. Revenue
An analysis of the Group’s revenue is as follows: 2014 2013 £m £m
Sale of goods 1,019.7 1,042.8 Services rendered 154.0 159.2
Revenue 1,173.7 1,202.0
No individual customer accounted for more than 2% of external revenue in either 2014 or 2013.

Strategic Report 01–41 Governance 42–74 Financial Statements 75–131
95Spectris plc Annual Report and Accounts 2014
Notes to the Accounts continued
5. Operating profit
Operating profit has been arrived at after charging/(crediting): 2014 2013 £m £m
Net foreign exchange losses 0.3 1.4 Research and development expenditure 86.5 88.5 Depreciation of property, plant and equipment 18.2 18.1 Impairment of property, plant and equipment 1.3 – Amortisation of intangible assets 29.4 32.4 Profit/(loss) on sale of property, plant and equipment (0.3) 0.2
2014 2013 Auditor’s remuneration £m £m
Fees payable to the Company’s auditor for the audit of the Company’s annual accounts 0.5 0.5 Fees payable to the Company’s auditor and its associates for other services: – the audit of the Company’s subsidiaries, pursuant to legislation 1.1 1.1 – audit-related assurance services1 0.1 0.1 – tax advisory services 0.1 0.2 – other services 0.1 0.1
1.9 2.0
1 Review of the half-year Financial Statements.
6. Employee costs and other information
Employee costs, including Directors’ remuneration, comprise: 2014 2013 Note £m £m
Wages and salaries 337.5 335.7 Social security costs 61.1 62.9 Defined benefit pension plans: – current service cost 19 1.2 1.1 Defined contribution pension plans 19 11.5 11.2 Equity-settled share-based payment expense 2.2 2.3 Cash-settled share-based payment expense 0.1 0.8
413.6 414.0
2014 2013 Directors’ remuneration £m £m
Short-term benefits 2.0 2.4 Post-employment benefits – 0.1 Equity-settled share-based payment expense 0.5 0.9
2.5 3.4
Further details of Directors’ remuneration and share options are given in the Directors’ Remuneration Report on pages 61 to 74. 2014 2013 Average number of employees Number Number
Production and engineering 3,792 3,646 Sales and marketing 3,118 2,958 Administrative 766 740
7,676 7,344

Strategic Report 01–41 Governance 42–74 Financial Statements 75–131
96Spectris plc Annual Report and Accounts 2014
Notes to the Accounts continued
7. Financial income and finance costs 2014 2013 Financial income Note £m £m
Interest receivable 0.3 0.5 Increase in fair value of cross-currency interest rate swaps 27 – 0.7 Net gains on retranslation of short-term inter-company loan balances 6.0 –
6.3 1.2
2014 2013 Finance costs £m £m
Interest payable on loans and overdrafts 5.7 9.1 Net losses on retranslation of short-term inter-company loan balances – 4.1 Net interest cost on pension scheme liabilities 0.1 0.2 Other finance costs 0.1 0.3
5.9 13.7
Net interest costs of £5.4m (2013: £8.6m) for the purposes of the calculation of interest cover comprise bank interest receivable of £0.3m (2013: £0.5m) and interest payable on loans and overdrafts of £5.7m (2013: £9.1m).
8. Taxation 2014 2013
UK Overseas Total UK Overseas Total £m £m £m £m £m £m
Current tax charge 5.3 37.9 43.2 5.4 70.1 75.5 Adjustments in respect of current tax of prior years (1.8) (1.5) (3.3) (1.3) (3.0) (4.3) Deferred tax – origination and reversal of temporary differences (1.5) (2.4) (3.9) 0.1 0.4 0.5
2.0 34.0 36.0 4.2 67.5 71.7
The standard rate of corporation tax for the year, based on the weighted average of tax rates applied to the Group’s profits, is 28.1% (2013: 30.9%). The tax charge for the year is lower than the standard rate of corporation tax for the reasons set out in the following reconciliation: 2014 2013 £m £m
Profit before taxation 171.1 271.7
Corporation tax at standard rate of 28.1% (2013: 30.9%) 48.1 84.0 Non-taxable income and gains (6.0) (6.1) Non-deductible expenditure 0.3 1.0 Movements on unrecognised deferred tax assets 0.1 – Research and development tax incentives (4.4) (3.7) Change in tax rates 0.1 (0.2) Other adjustments to prior year current and deferred tax charges (2.2) (3.3)
Total taxation 36.0 71.7
Factors that may affect the future tax chargeThe Group’s tax charge in future years is likely to be affected by the proportion of profits arising, and the effective tax rates, in the various territories in which the Group operates. 2014 2013 Tax on items recognised directly in the Consolidated Statement of Comprehensive Income £m £m
Tax on net (loss)/gain on effective portion of changes in fair value of forward exchange contracts (0.5) 0.1 Tax on re-measurement of net defined benefit liability, net of foreign exchange (1.5) 0.9
Aggregate current and deferred tax (credit)/charge relating to items recognised directly in the Consolidated Statement of Comprehensive Income (2.0) 1.0

Strategic Report 01–41 Governance 42–74 Financial Statements 75–131
97Spectris plc Annual Report and Accounts 2014
Notes to the Accounts continued
8. Taxation continued 2014 2013 Tax on items recognised directly in the Consolidated Statement of Changes in Equity £m £m
Tax charge/(credit) in relation to share-based payments 1.0 (4.5)
Aggregate current and deferred tax charge/(credit) on items recognised directly in the Consolidated Statement of Changes in Equity 1.0 (4.5)
The following tax charges relate to items of income and expense that are excluded from the Group’s adjusted performance measures. 2014 2013 Tax on items of income and expense that are excluded from the Group’s adjusted profit before tax £m £m
Tax charge on unrealised change in fair value of cross-currency interest rate swaps – 0.2 Tax credit on amortisation of acquisition-related intangible assets (8.4) (9.8) Tax credit on net acquisition-related costs and fair value adjustments (0.9) (0.1) Tax credit on retranslation of short-term inter-company loan balances (0.2) (0.5) Tax charge on profit of disposal of businesses 0.8 33.0
Total tax (credit)/charge (8.7) 22.8
The effective adjusted tax rate for the year was 23.2% (2013: 23.6%) as set out in the reconciliation below. 2014 2013 Reconciliation of total tax charge on adopted IFRS basis to adjusted tax charge Note £m £m
Total tax charge on adopted IFRS basis 36.0 71.7 Tax credit/(charge) on items of income and expense that are excluded from the Group’s adjusted profit before tax 8.7 (22.8)
Adjusted tax charge 44.7 48.9 Divested businesses – (0.3)
Adjusted tax charge excluding divested businesses 44.7 48.6
Adjusted profit before tax excluding divested businesses 2 192.5 205.6
9. Dividends 2014 2013 Amounts recognised and paid as distributions to owners of the Parent Company in the year £m £m
Final dividend for the year ended 31 December 2013 of 28.00p (2012: 25.50p) per share 33.3 30.2 Interim dividend for the year ended 31 December 2014 of 16.00p (2013: 14.75p) per share 19.0 17.5
52.3 47.7
2014 2013 Amounts arising in respect of the year £m £m
Interim dividend for the year ended 31 December 2014 of 16.00p (2013: 14.75p) per share 19.0 17.5 Proposed final dividend for the year ended 31 December 2014 of 30.50p (2013: 28.00p) per share 36.3 33.2
55.3 50.7
The proposed final dividend is subject to approval by shareholders at the Annual General Meeting on 24 April 2015 and has not been included as a liability in these Financial Statements.

Strategic Report 01–41 Governance 42–74 Financial Statements 75–131
98Spectris plc Annual Report and Accounts 2014
Strategic Report 01–41 Governance 42–74 Financial Statements 75–131
98Spectris plc Annual Report and Accounts 2014
Notes to the Accounts continued
10. Earnings per share
Basic earnings per share amounts are calculated by dividing net profit for the year attributable to ordinary shareholders by the weighted average number of ordinary shares outstanding during the year (excluding treasury shares).
Diluted earnings per share amounts are calculated by dividing the net profit attributable to ordinary shareholders by the weighted average number of ordinary shares outstanding during the year but adjusted for the effects of dilutive options. The key features of share option contracts are described in Note 23.
Basic earnings per share 2014 2013
Profit after tax (£m) 135.1 200.0 Weighted average number of shares outstanding (millions) 118.8 118.2
Basic earnings per share (pence) 113.7 169.2
Diluted earnings per share 2014 2013
Profit after tax (£m) 135.1 200.0 Basic weighted average number of shares outstanding (millions) 118.8 118.2 Weighted average number of dilutive 5p ordinary shares under option (millions) 0.7 0.7 Weighted average number of 5p ordinary shares that would have been issued at average market value from proceeds of dilutive share options (millions) (0.4) (0.2)
Diluted weighted average number of shares outstanding (millions) 119.1 118.7
Diluted earnings per share (pence) 113.4 168.5

Strategic Report 01–41 Governance 42–74 Financial Statements 75–131
99Spectris plc Annual Report and Accounts 2014
Notes to the Accounts continued
11. Goodwill and other intangible assets Patents, contractual Customer- rights and related and Goodwill technology trade names Software Total Cost Note £m £m £m £m £m
At 1 January 2013 562.1 126.4 142.2 35.7 866.4 Additions – – – 6.3 6.3 Recognised on acquisitions 24 3.2 11.2 3.8 – 18.2 Transfers from property, plant and equipment 12 – – – 0.2 0.2 Other movements (4.0) – – – (4.0) Disposals – – – (1.5) (1.5) Foreign exchange difference (4.1) (2.6) (4.4) 0.3 (10.8)
At 31 December 2013 557.2 135.0 141.6 41.0 874.8 Additions – – – 5.7 5.7 Recognised on acquisitions 24 48.5 22.9 24.6 – 96.0 Disposals – – – (0.6) (0.6) Foreign exchange difference (2.9) 5.0 5.8 (0.8) 7.1
At 31 December 2014 602.8 162.9 172.0 45.3 983.0
Accumulated amortisation and impairment losses
At 1 January 2013 35.4 46.6 38.8 27.4 148.2 Charge for the year – 15.1 13.8 3.5 32.4 Disposals – – – (1.5) (1.5) Foreign exchange difference 0.8 (1.4) (2.4) 0.2 (2.8)
At 31 December 2013 36.2 60.3 50.2 29.6 176.3 Charge for the year – 14.7 11.2 3.5 29.4 Disposals – – – (0.6) (0.6) Foreign exchange difference (2.8) 1.6 2.0 (0.8) –
At 31 December 2014 33.4 76.6 63.4 31.7 205.1
Carrying amount
At 31 December 2014 569.4 86.3 108.6 13.6 777.9
At 31 December 2013 521.0 74.7 91.4 11.4 698.5
GoodwillGoodwill is allocated to the cash-generating units that are anticipated to benefit from the acquisition.
The Group’s identified cash-generating units are smaller than the four reportable segments, being the 13 operating companies. Bolt-on acquisitions are quickly integrated into existing Group companies and are therefore not considered separately.
The most significant elements of goodwill are as follows: 2014 2013
Pre-tax Pre-tax Goodwill discount rate Goodwill discount rate £m % £m %
Omega Engineering 170.1 13.4 160.1 14.4 PANalytical 92.7 12.0 94.2 12.7 Brüel & Kjær Sound & Vibration 65.0 11.9 67.9 12.6 HBM 64.9 12.4 65.3 13.0 BTG 50.6 11.8 52.7 12.4

Strategic Report 01–41 Governance 42–74 Financial Statements 75–131
100Spectris plc Annual Report and Accounts 2014
Notes to the Accounts continued
11. Goodwill and other intangible assets continued
As part of the annual impairment review, the carrying amount of goodwill (for all businesses excluding Engineering Seismology Group (‘ESG’) – see below) has been assessed with reference to value in use to perpetuity, reflecting the projected cash flows of each cash-generating unit based on actual operating results, the most recent budget for the next financial year as approved by the Board, and strategic review projections for 2016 and 2017.
The key assumptions on which the value in use calculations are based relate to business performance over the next three years, projected long-term growth rates beyond 2017 and the discount rates applied. The forecast cash flows include management’s latest estimates on sales volumes and pricing, production and other costs. There are no individually significant business level cash flow assumptions in respect of any business that materially impact the impairment testing. The key judgements are the level of revenue and operating margins anticipated and the proportion of operating profit converted to cash in each year. Growth rates for the years beyond 2017 are assumed to be 4.0% (2013: 4.0%), based on the lowest operating profit growth experience by any cash-generating unit over the past ten years. The cash flow projections have been discounted using cash-generating unit specific pre-tax discount rates between 11% and 15% (2013: 12% and 16%). These rates have been determined by taking the size of business and specific geographic and industry risk factors into account. The reduction in the discount rates compared to the prior year is primarily due to a reduction in the risk-free rate. Following the annual impairment review, no impairment charge was recognised in either 2014 or 2013.
The Directors do not consider that there are any reasonably possible sensitivities for these businesses that could arise in the next 12 months that could result in an impairment charge. For illustration, the Directors have considered the following specific individual sensitivities:
•a two percentage point (‘pp’) increase in the pre-tax discount rate applied to each cash-generating unit would result in an impairment of £nil (2013: £nil);
• if the long-term growth rate assumption was reduced by 2.5pp to 1.5% (2013: reduced by 2.5pp to 1.5%), no impairment would arise (2013: £nil); and
• if the cash flow projections of all cash-generating units were reduced by 25% for the next two years, no impairment would arise (2013: £nil).
For ESG (acquired on 10 December 2014), given the proximity to the year end, the carrying value of goodwill has been assessed by reference to the value in use based on the acquisition business plan that assumed long-term growth rates in line with that anticipated for the rest of the Group, and certain post-acquisition synergies associated with being part of a wider Group with shared support functions.
Given the assumptions built into the ESG acquisition business case, the Directors do not consider that there is a significant risk of impairment of the ESG acquisition goodwill arising in the next 12 months.
Other intangible assetsThe Directors consider that operating results in 2014 confirm that none of the Group’s brought forward trading businesses has suffered a permanent diminution in value as a result of the current economic environment.
Of the total amortisation charge of £29.4m (2013: £32.4m), the amount attributable to the amortisation of acquisition-related intangible assets was £25.9m (2013: £28.9m).
The transfers from property, plant and equipment to software in 2013 relate to identifiable software assets.
The Group has no internally-generated intangible assets from development expenditure as the criteria for the recognition as an asset under IAS 38 ‘Intangible Assets’ have not been met (2013: £nil).
The trade names and technology assets recognised on the acquisition of Omega Engineering in 2011, and included within the Industrial Controls reportable segment, are considered significant by the Directors as they represent 48.0% (2013: 58.1%) of total customer-related and trade names, and 25.0% (2013: 30.1%) of total patents, contractual rights and technology, respectively. The carrying amount of the trade name intangible at 31 December 2014 is £52.2m (2013: £53.1m) and is being amortised over 20 years with the remaining amortisation period being 16.8 years. The carrying amount of the technology intangible at 31 December 2014 is £19.4m (2013: £21.0m) and is being amortised over ten years with the remaining amortisation period being 6.8 years.

Strategic Report 01–41 Governance 42–74 Financial Statements 75–131
101Spectris plc Annual Report and Accounts 2014
Notes to the Accounts continued
12. Property, plant and equipment Freehold Leasehold Plant and property property equipment Total Cost Note £m £m £m £m
At 1 January 2013 131.2 10.0 152.9 294.1 Additions 6.1 1.4 17.9 25.4 Recognised on acquisitions 24 – – 0.1 0.1 Transfers to other intangible assets 11 – – (0.2) (0.2) Disposals (0.1) (0.3) (12.9) (13.3) Foreign exchange difference 1.5 (0.3) 0.1 1.3
At 31 December 2013 138.7 10.8 157.9 307.4 Additions 3.5 0.9 17.3 21.7 Recognised on acquisitions 24 2.3 0.6 4.3 7.2 Disposals (2.1) (0.5) (7.4) (10.0) Foreign exchange difference (4.9) 0.1 (4.1) (8.9)
At 31 December 2014 137.5 11.9 168.0 317.4
Accumulated depreciation and impairment
At 1 January 2013 33.1 6.8 101.7 141.6 Charge for the year 3.8 1.1 13.2 18.1 Disposals (0.1) (0.3) (11.7) (12.1) Foreign exchange difference 0.6 (0.3) 0.5 0.8
At 31 December 2013 37.4 7.3 103.7 148.4 Charge for the year 3.8 0.9 13.5 18.2 Impairment 1.3 – – 1.3 Disposals (0.4) (0.5) (7.0) (7.9) Foreign exchange difference (2.1) 0.2 (3.2) (5.1)
At 31 December 2014 40.0 7.9 107.0 154.9
Carrying amount
At 31 December 2014 97.5 4.0 61.0 162.5
At 31 December 2013 101.3 3.5 54.2 159.0
The amount recognised in the carrying amount of items of plant and equipment in the course of its construction was £3.7m (2013: £3.0m).
No borrowing costs met the required criteria for capitalisation during the year (2013: £nil).
13. Inventories 2014 2013 £m £m
Raw materials 65.4 60.0 Work in progress 27.1 26.1 Finished goods 83.2 75.9
175.7 162.0
In the ordinary course of business, the Group makes provision for slow-moving, excess and obsolete inventory to write it down to its net realisable value based on an assessment of technological and market developments specific to that business, and an analysis of historic and projected usage on an individual item or product line basis.
Inventory is stated after charging £14.3m (2013: £8.9m) in respect of inventory provisions and crediting £6.0m (2013: £3.1m) relating to the reversal of previously recognised provisions.
Inventory carried at fair value less cost to sell is £1.6m (2013: £nil) due to the acquisitions described in Note 24.
Raw materials and changes in finished goods and work in progress recognised within cost of sales amounted to £312.1m (2013: £323.9m).

Strategic Report 01–41 Governance 42–74 Financial Statements 75–131
102Spectris plc Annual Report and Accounts 2014
Notes to the Accounts continued
14. Trade and other receivables 2014 2013 £m £m
Trade receivables 198.5 181.0 Prepayments and accrued income 13.8 14.7 Other receivables 20.3 20.1
232.6 215.8
Included within prepayments and accrued income and other receivables are amounts receivable in more than one year of £5.0m (2013: £4.2m).
Trade receivables are non-interest bearing. Standard credit terms provided to customers differ according to business and country, and are typically between 30 and 60 days. Trade receivables and other receivables are stated after the recognition of provisions for impairment of £5.5m (2013: £3.6m) and the reversal of previously recognised provisions for impairment of £5.0m (2013: £5.0m).
The maximum exposure to credit risk for trade receivables at 31 December by geographic region was: 2014 2013 £m £m
UK 9.7 8.3 Germany 18.9 17.4 France 10.0 11.0 Rest of Europe 39.2 36.9 USA 52.0 44.2 Rest of North America 8.7 6.4 Japan 12.7 9.9 China 15.3 12.5 South Korea 5.8 5.4 Rest of Asia Pacific 16.7 16.4 Rest of the world 9.5 12.6
198.5 181.0
Impairment lossesA provision for impairment of trade receivables is established when there is objective evidence that the Group will not be able to collect amounts due from customers according to the original terms of sale.
The ageing of trade receivables and related provisions for impairment at 31 December was: 2014 2013
Gross Impairment Gross Impairment £m £m £m £m
Not past due 145.5 0.5 133.2 0.3 One month past due 32.5 – 31.6 0.6 Two months past due 11.7 0.1 10.5 0.5 Three months past due 7.8 0.1 5.2 0.5 Over three months past due 10.5 8.8 10.2 7.8
208.0 9.5 190.7 9.7
The movement in the provision for impairment in respect of trade receivables during the year was as follows: 2014 2013 £m £m
Balance at 1 January 9.7 11.7 Impairment loss recognised 5.5 3.6 Impairment loss utilised (0.6) (0.5) Impairment loss released (5.0) (5.0) Foreign exchange difference (0.1) (0.1)
Balance at 31 December 9.5 9.7
An impairment provision has been recorded against the trade receivables that the Group believes may not be recoverable. All trade receivables past due for more than 120 days have been fully provided for in line with the Group’s credit risk policy.
The fair value of trade and other receivables approximates to its carrying amount due to the short-term maturities associated with these items. There is no impairment risk identified with regards to prepayments and accrued income or other receivables where no amounts are past due.

Strategic Report 01–41 Governance 42–74 Financial Statements 75–131
103Spectris plc Annual Report and Accounts 2014
Notes to the Accounts continued
15. Cash and cash equivalents 2014 2013 Analysis of balances of cash and cash equivalents Note £m £m
Cash balances 34.8 43.8 Bank overdrafts 16 (2.5) (2.2)
Cash and cash equivalents in the Consolidated Statement of Cash Flows 32.3 41.6
The Group’s exposure to interest rate risk and a sensitivity analysis for financial assets and liabilities is disclosed in Note 27.
16. Borrowings Effective Earlier of repricing 2014 2013 Current interest rate date or maturity date £m £m
Bank overdrafts 2.5 2.2 Bank loans unsecured – $75.6m 3.12% 10 September 2015 48.4 –
50.9 2.2
Effective Earlier of repricing 2014 2013 Non-current interest rate date or maturity date £m £m
Bank loans – unsecured 0.86% 30 October 2019 35.9 21.1 Bank loans unsecured – $75.6m 3.12% 10 September 2015 – 45.7 Bank loans unsecured – €94.8m 2.56% 14 October 2020 73.6 78.9
Total unsecured borrowings 109.5 145.7
At 31 December 2014, the Group had available £316.8m (2013: £311.0m) of undrawn committed borrowing facilities in respect of which all conditions precedent had been met. 2014 2013 Analysis of net debt Note £m £m
Bank overdrafts 2.5 2.2 Bank loans – unsecured 157.9 145.7
Total borrowings 160.4 147.9 Cash balances 15 (34.8) (43.8)
Net debt 125.6 104.1
17. Trade and other payables 2014 2013 Current £m £m
Trade payables 78.0 74.8 Accruals 70.2 71.6 Deferred income 27.2 24.7 Other non-trade payables 25.6 22.9
201.0 194.0
Non-current
Other non-trade payables 21.6 14.8
The fair value of trade and other payables approximates to their carrying amount due to the short-term maturities associated with these items.

Strategic Report 01–41 Governance 42–74 Financial Statements 75–131
104Spectris plc Annual Report and Accounts 2014
Notes to the Accounts continued
18. Provisions Legal, Product contractual Reorganisation warranty and other Total £m £m £m £m
At 1 January 2014 0.6 10.6 9.8 21.0 Additional provision in the year 0.5 5.8 1.4 7.7 Acquired on acquisition – 0.6 – 0.6 Utilised during the year (0.1) (4.9) (0.3) (5.3) Released during the year (0.3) (1.4) (4.4) (6.1) Foreign exchange difference – (0.3) 0.1 (0.2)
At 31 December 2014 0.7 10.4 6.6 17.7
Provisions are all presented as current liabilities.
ReorganisationReorganisation provisions relate to committed restructuring plans in place within the business. Costs are expected to be incurred within one year and there is little judgement in determining the amount.
Product warrantyProduct warranty provisions reflect commitments made to customers on the sale of goods in the ordinary course of business and included within the Group’s standard terms and conditions. Warranty commitments typically apply for a 12-month period, but can extend to 36 months. These extended warranties are not significant.
Legal, contractual and otherLegal, contractual and other provisions mainly comprise amounts provided against open legal and contractual disputes arising from trade. The Company has on occasion been required to take legal or other actions to protect its intellectual property rights, to enforce commercial contracts or otherwise and similarly to defend itself against proceedings brought by other parties. Provisions are made for the expected costs associated with such matters, based on past experience of similar items and other known factors, taking into account professional advice received, and represent management’s best estimate of the most likely outcome. The timing of utilisation of these provisions is frequently uncertain, reflecting the complexity of issues and the outcome of various court proceedings and negotiations. Contractual and other provisions represent the Directors’ best estimate of the cost of settling future obligations although there is a higher degree of judgement involved. The reduction in the provision during the year is due to a lower legal risk profile in the Group. Unless specific evidence exists to the contrary, these provisions are shown as current.
No provision is made for proceedings which have been or might be brought by other parties against Group companies unless management, taking into account professional advice received, assess that it is more likely than not that such proceedings may be successful. Contingent liabilities associated with such proceedings have been identified, but the Directors are of the opinion that any associated claims that might be brought can be resisted successfully and, therefore, the possibility of any material outflow in settlement is assessed as remote.
19. Retirement benefit schemes
Spectris plc operates funded defined benefit and defined contribution pension plans for the Group’s qualifying employees in the UK. In addition, 12 overseas subsidiaries (2013: 11 overseas subsidiaries) in three overseas countries provide defined benefit plans. Other UK and overseas subsidiaries have their own defined contribution plans invested in independent funds.
Defined benefit plansThe UK, German, Dutch and Swiss plans provide pensions in retirement, death and in some cases disability benefits to members. The pension benefit is linked to members’ final salary at retirement and their service life. Since 31 December 2009, the UK plan has been closed to new members.
The UK plan is administered by a pension fund, but the overseas plans are held by several insurance companies that are legally separated from the Group. The UK plan is managed by a Board of Trustees that represents both employees and employer, who are required to act in the best interest of the plans’ participants and are responsible for setting certain policies (e.g. investment, contribution and indexation policies) of the various funds.
The UK plan exposes the Group to actuarial risks, such as longevity risk, currency risk, interest rate risk and market (investment) risk, but the risk of the overseas plans is limited as the benefits have been reinsured with various insurance companies. Inflation and interest rate hedges are taken out to mitigate against risks arising on the UK plan.

Strategic Report 01–41 Governance 42–74 Financial Statements 75–131
105Spectris plc Annual Report and Accounts 2014
Notes to the Accounts continued
19. Retirement benefit schemes continued
The overseas plans are funded by the Group’s overseas subsidiaries, and the UK plan has been funded in the past by both the Group’s UK subsidiaries and the Company. The investments of the UK plan are invested in accordance with Section 40 of the Pensions Act 1995. Although the Act permits 5% of the plan’s assets to be invested in ‘employer-related investments’, the Trustees have elected that none of the plan assets are to be invested directly in Spectris plc shares.
The funding requirements are based on the individual funds’ actuarial measurement framework set out in the funding policies of the various plans. Employees are not required to contribute to the plans and the German plan is unfunded.
The Group has determined that, in accordance with the terms and conditions of the defined benefit plans, and in accordance with statutory requirements (including minimum funding requirements) of the plans of the respective jurisdictions, the present value of the refunds or reductions in future contributions is not lower than the balance of the total fair value of the plan assets less the total present value of obligations. This determination has been made on a plan-by-plan basis. As such, no decrease in the defined benefit asset was necessary at 31 December 2014 and December 2013.
The last full actuarial valuation for the UK plan was 31 December 2011 and an updated valuation is being done at 31 December 2014; for the German and Swiss plans it was 31 December 2013 and for the Dutch plans it was 31 December 2012. Where applicable, the valuations were updated to 31 December 2014 for IAS 19 (Revised) ‘Employee Benefits’ purposes by qualified independent actuaries.
The total Company contributions made to the defined benefit plans during the year ended 31 December 2014 were £1.5m (2013: £1.5m). Contributions for 2015 are expected to be £0.6m for the German plan and £1.0m for the Swiss plan.
The above contribution rates are subject to review at future valuations and periodic certifications of the schedule of contributions. Contributions to the Spectris Pension Plan (UK) ceased from 1 July 2012.
The assumptions used by the actuary to value the liabilities of the defined benefit plans were: 2014 2013
UK plans Overseas plans UK plans Overseas plans % p.a. % p.a. % p.a. % p.a.
Discount rate 3.7 1.4 – 3.5 4.3 2.3 – 3.5 Salary increases 4.7 1.0 – 3.0 5.0 1.0 – 3.0 Pension increases in payment 2.2 – 3.6 0.0 – 2.0 2.3 – 3.8 0.0 – 2.0 Pension increases in deferment 2.3 – 3.2 2.6 – 3.5 Inflation assumption 2.3 – 3.2 1.0 – 2.0 2.6 – 3.5 1.0 – 2.0 Interest credit rate 0.0 – 1.4 0.0 – 2.3
The weighted average duration of the defined benefit obligation at 31 December 2014 was 15.3 years (2013: 15.4 years).
Pensioner life expectancy assumed in the 31 December 2014 valuation is based on the following tables.
UK plan 92% S1PMA/96% S1PFA centred in 2006, future improvements in line with CMI_2011 with a long-term rate of improvement of 1% per annum German plans Dr K Heubeck pension tables 2005 G Dutch plans A.G. Prognosetafel 2012–2062 tables Swiss plan BVG 2010 Generational
Samples of the ages which pensioners are assumed to live to are as follows: Male Female
Pensioners aged 65 in 2014 83.9 – 87.0 87.9 – 89.5 Pensioners aged 65 in 2024 85.2 – 88.4 88.6 – 91.1

Strategic Report 01–41 Governance 42–74 Financial Statements 75–131
106Spectris plc Annual Report and Accounts 2014
Notes to the Accounts continued
19. Retirement benefit schemes continued UK plans Overseas plans Total Amounts recognised in the Consolidated 2014 2013 2014 2013 2014 2013 Income Statement £m £m £m £m £m £m
Current service cost – – 1.2 1.1 1.2 1.1 Net interest (income)/cost (0.3) (0.2) 0.4 0.4 0.1 0.2 Administrative cost 0.2 0.3 0.1 0.1 0.3 0.4
(0.1) 0.1 1.7 1.6 1.6 1.7
The current and past service costs are recognised solely in administrative expenses in the Consolidated Income Statement. The net interest cost on the net defined benefit obligation is recognised in finance costs in the Consolidated Income Statement. Actuarial losses or gains are recognised in the Consolidated Statement of Comprehensive Income.
During the year, insurance premiums for death-in-service benefits amounting to £0.4m (2013: £0.4m) were paid.
The total return on scheme assets in the year was £8.1m (2013: £15.9m). UK plans Overseas plans Total Amounts recognised in the Consolidated 2014 2013 2014 2013 2014 2013 Statement of Comprehensive Income £m £m £m £m £m £m
Actuarial (losses)/gains recognised in the current year (3.7) 3.4 (2.8) 0.3 (6.5) 3.7 Foreign exchange gains/(losses) in the current year – – 0.9 (0.3) 0.9 (0.3)
Total (losses)/gains recognised in the current year (3.7) 3.4 (1.9) – (5.6) 3.4
Cumulative actuarial losses since 1 January 2004 (30.5) (26.8) (10.2) (8.3) (40.7) (35.1)
UK plans Overseas plans Total Amounts recognised in the Consolidated 2014 2013 2014 2013 2014 2013 Statement of Financial Position £m £m £m £m £m £m
Present value of defined benefit obligations (118.7) (112.2) (38.4) (36.2) (157.1) (148.4) Fair value of scheme assets 122.3 119.4 20.8 20.8 143.1 140.2
Net surplus/(deficit) in schemes 3.6 7.2 (17.6) (15.4) (14.0) (8.2)
UK plans Overseas plans Total
2014 2013 2014 2013 2014 2013 Reconciliation of movement in net deficit £m £m £m £m £m £m
At 1 January 7.2 3.9 (15.4) (15.3) (8.2) (11.4) Current service cost – – (1.2) (1.1) (1.2) (1.1) Net interest income/(cost) 0.3 0.2 (0.4) (0.4) (0.1) (0.2) Scheme administrative cost (0.2) (0.3) (0.1) (0.1) (0.3) (0.4) Liabilities acquired in business combinations – – (0.1) – (0.1) – Contributions from sponsoring company – – 1.5 1.5 1.5 1.5 Actuarial (losses)/gains (3.7) 3.4 (2.8) 0.3 (6.5) 3.7 Foreign exchange difference – – 0.9 (0.3) 0.9 (0.3)
At 31 December 3.6 7.2 (17.6) (15.4) (14.0) (8.2)

Strategic Report 01–41 Governance 42–74 Financial Statements 75–131
107Spectris plc Annual Report and Accounts 2014
Notes to the Accounts continued
19. Retirement benefit schemes continued UK plans Overseas plans Total Analysis of movement in the present 2014 2013 2014 2013 2014 2013 value of the defined benefit obligation £m £m £m £m £m £m
At 1 January 112.2 105.3 36.2 33.3 148.4 138.6 Current service cost – – 1.2 1.1 1.2 1.1 Interest cost 4.7 4.4 0.8 0.7 5.5 5.1 Liabilities acquired in business combinations – – 0.1 – 0.1 – Contributions from scheme members – – 0.9 0.8 0.9 0.8 Actuarial gains/(losses) – financial 6.7 8.2 4.1 (1.2) 10.8 7.0 Actuarial losses – demographic – – (0.4) – (0.4) – Actuarial (losses)/ gains – experience – (0.6) (1.1) 0.8 (1.1) 0.2 Benefits paid (4.9) (5.1) (1.3) 0.1 (6.2) (5.0) Foreign exchange difference – – (2.1) 0.6 (2.1) 0.6
At 31 December 118.7 112.2 38.4 36.2 157.1 148.4
Analysed as:
Present value of unfunded defined benefit obligation – – 6.9 6.6 6.9 6.6 Present value of funded defined benefit obligation 118.7 112.2 31.5 29.6 150.2 141.8
UK plans Overseas plans Total Reconciliation of movement 2014 2013 2014 2013 2014 2013 in fair value of plan assets £m £m £m £m £m £m
At 1 January 119.4 109.2 20.8 18.0 140.2 127.2 Return on plan assets 5.0 4.6 0.4 0.3 5.4 4.9 Scheme administration cost (0.2) (0.3) (0.1) (0.1) (0.3) (0.4) Contributions from sponsoring company – – 1.0 1.5 1.0 1.5 Contributions from scheme members – – 0.9 0.8 0.9 0.8 Actuarial gains/(losses) 3.0 11.0 (0.2) (0.1) 2.8 10.9 Benefits paid (4.9) (5.1) (0.8) 0.1 (5.7) (5.0) Foreign exchange difference – – (1.2) 0.3 (1.2) 0.3
At 31 December 122.3 119.4 20.8 20.8 143.1 140.2
Analysis of plan assets UK plans Overseas plans Total
2014 2013 2014 2013 2014 2013 Fair value of assets £m £m £m £m £m £m
Equity instruments 10.5 29.0 – – 10.5 29.0 Corporate bonds 109.1 77.4 – – 109.1 77.4 Government bonds 5.5 8.1 – – 5.5 8.1 Cash and financial derivatives (net) (2.8) 4.9 – – (2.8) 4.9 Insurance policies – – 20.8 20.8 20.8 20.8
122.3 119.4 20.8 20.8 143.1 140.2
Sensitivity analysisThe table below shows the sensitivity of the Consolidated Statement of Financial Position to changes in the significant pension assumptions: Change in assumption Impact on scheme liabilities
UK plans Overseas plans
2014 2014
Discount rate Increase by 1% Decrease by £17.9m Decrease by £5.6m Rate of price inflation (‘RPI’) Increase by 1% Increase by £13.0m Increase by £1.9m Assumed life expectancy at age 65 Increase by 1 year Increase by £3.5m Increase by £1.0m
Defined contribution plansThe total cost of the defined contribution plans for the year ended 31 December 2014 was £11.5m (2013: £11.2m). There were no outstanding or prepaid contributions to these plans as at 31 December 2014 or 31 December 2013.

Strategic Report 01–41 Governance 42–74 Financial Statements 75–131
108Spectris plc Annual Report and Accounts 2014
Notes to the Accounts continued
20. Deferred tax
The movement on the deferred tax account is shown below. 2014 2013 Note £m £m
At 1 January 22.0 19.4 Foreign exchange difference 1.6 (0.6) Acquisition of subsidiary undertakings 24 5.3 3.1 Other acquisition-related – (0.3) Deferred tax on changes in fair value of forward exchange contracts recognised in the Consolidated Statement of Comprehensive Income (0.2) 0.2 Deferred tax on re-measurement of net defined benefit liability recognised in the Consolidated Statement of Comprehensive Income (1.5) 0.9 Deferred tax on share-based payments recognised in equity 1.5 (0.2) Credited to the Consolidated Income Statement 8 (3.9) (0.5)
At 31 December 24.8 22.0
Comprising: Deferred tax liabilities 43.1 39.0 Deferred tax assets (18.3) (17.0)
24.8 22.0
The total deferred tax charge in 2013 of £0.5m recognised in the Consolidated Income Statement includes an amount of £1.0m which was charged in respect of deferred tax balances which were previously included within assets held for sale.
The movements in deferred tax assets and liabilities during the year are shown below. Deferred tax assets and liabilities are only offset where there is a legally enforceable right of offset and they relate to income taxes levied by the same taxation authority. Unrealised Goodwill Accelerated Accruals profit on and other tax and Tax inter-company Pension intangible 2014 depreciation provisions losses transactions schemes assets Other Total Net deferred tax (assets)/liabilities £m £m £m £m £m £m £m £m
At 1 January 2014 4.3 (14.6) (1.0) (5.1) (2.2) 43.1 (2.5) 22.0 Foreign exchange difference – – – – – 1.6 – 1.6 Acquisition of subsidiary undertakings – – (0.2) – – 5.5 – 5.3 Deferred tax on changes in fair value of forward exchange contracts recognised in the Consolidated Statement of Comprehensive Income – – – – – – (0.2) (0.2) Deferred tax on re-measurement of net defined benefit liability recognised in the Consolidated Statement of Comprehensive Income – – – – (1.5) – – (1.5) Deferred tax on share-based payments recognised in equity – – – – – – 1.5 1.5 (Credited)/charged to the Consolidated Income Statement (0.3) 0.9 0.8 (0.2) (0.1) (3.5) (1.5) (3.9)
At 31 December 2014 4.0 (13.7) (0.4) (5.3) (3.8) 46.7 (2.7) 24.8

Strategic Report 01–41 Governance 42–74 Financial Statements 75–131
109Spectris plc Annual Report and Accounts 2014
Notes to the Accounts continued
20. Deferred tax continued Unrealised Goodwill Accelerated Accruals profit on and other tax and Tax inter-company Pension intangible 2013 depreciation provisions losses transactions schemes assets Other Total Net deferred tax (assets)/liabilities £m £m £m £m £m £m £m £m
At 1 January 2013 5.2 (19.8) (0.9) (6.1) (3.4) 44.8 (0.4) 19.4 Foreign exchange difference – – – – – (0.6) – (0.6) Acquisition of subsidiary undertakings – – – – – 2.8 – 2.8 Deferred tax on changes in fair value of forward exchange contracts recognised in the Consolidated Statement of Comprehensive Income – – – – – – 0.2 0.2 Deferred tax on re-measurement of net defined benefit liability recognised in the Consolidated Statement of Comprehensive Income – – – – 0.9 – – 0.9 Deferred tax on share-based payments recognised in equity – – – – – – (0.2) (0.2) (Credited)/charged to the Consolidated Income Statement (0.9) 5.2 (0.1) 1.0 0.3 (3.9) (2.1) (0.5)
At 31 December 2013 4.3 (14.6) (1.0) (5.1) (2.2) 43.1 (2.5) 22.0
Unrecognised temporary differencesDeferred tax assets have not been recognised on the following temporary differences due to the degree of uncertainty over both the amount and utilisation of the underlying tax losses and deductions in certain jurisdictions. There is no expiry date associated with these tax losses. 2014 2013 £m £m
Tax losses 6.6 2.1 Other temporary differences 2.8 0.8
9.4 2.9
The UK corporation tax rate was reduced to 21% from 23% with effect from 1 April 2014. A further reduction in the UK tax rate to 20% effective from 1 April 2015 was substantively enacted in the UK Finance Act 2013.
It is likely that the unremitted earnings of overseas subsidiaries would qualify for the UK dividend exemption such that no UK tax would be due upon remitting these earnings to the UK. However, £42.4m (2013: £29.6m) of those earnings may still result in a tax liability, principally as a result of the dividend withholding taxes levied by the overseas tax jurisdictions in which those subsidiaries operate. These tax liabilities are not expected to exceed £2.3m (2013: £1.6m), of which only £0.4m (2013: £0.3m) has been provided as the Group is able to control the timing of the dividends. It is not expected that further amounts will crystallise in the foreseeable future.
21. Share capital and reserves 2014 2013
Number of Number of shares £m shares £m
Issued and fully paid: At 1 January 125.0 6.2 125.0 6.2
At 31 December 125.0 6.2 125.0 6.2
The Group has one class of ordinary voting shares which carries no right to fixed income.

Strategic Report 01–41 Governance 42–74 Financial Statements 75–131
110Spectris plc Annual Report and Accounts 2014
Notes to the Accounts continued
21. Share capital and reserves continued
Other reservesMovements in reserves are set out in the Consolidated Statement of Changes in Equity. The retained earnings reserve also includes own shares purchased by the Company and treated as treasury shares (see Note 22). The nature and purpose of other reserves forming part of equity are as follows:
translation reserveThe foreign currency translation reserve is used to record exchange differences arising from the translation of the Financial Statements of foreign subsidiaries, including gains or losses arising on net investment hedges.
Hedging reserveThis reserve records the cumulative net change in the fair value of forward exchange contracts where they are designated as effective cash flow hedge relationships.
Merger reserveThis reserve arose on the acquisition of Servomex Limited in 1999, a purchase satisfied substantially by the issue of share capital and therefore eligible for merger relief under the provisions of Section 612 of the Companies Act 2006.
Capital redemption reserveThis reserve records the historical repurchase of the Group’s own shares.
22. Treasury shares
At 31 December 2014, the Group held 6,054,835 treasury shares (2013: 6,344,254). During the year 289,419 of these shares were issued to satisfy options exercised by employees which were granted under the Group’s share schemes (2013: 1,268,125). No shares were repurchased by the Group during the year (2013: nil) and no shares were cancelled during the year (2013: nil).
23. Share-based payments
The Save As You Earn Share (‘SAYE’) Option Scheme was set up in order to provide executives and selected employees with options to purchase ordinary shares in the Company. Under the SAYE Option Scheme, equity shares are issued following a vesting period of three years. Options may be exercised during a six-month period following the vesting date, and exercise prices are determined according to the mid-market closing share price prevailing on the day before the date of grant. There are no performance criteria associated with options granted under the SAYE Option Scheme.
Under the Performance Share Plan (unapproved share options as defined by HMRC), the exercise price is the nominal cost of the Company’s shares. From 2014, awards to Spectris plc executives are subject to performance criteria: 33.33% of the award being based on fulfillment of an adjusted earnings growth (‘EPS’) target, 33.3% of the award subject to a total shareholder return (‘TSR’) target and 33.33% of the award being based on fulfillment of an economic profit target. Awards to Spectris plc executives in the years up to 2013 are subject to performance criteria: 50% of the award being based on fulfilment of an EPS target and 50% of the award subject to a TSR target. Awards to Spectris plc senior managers are still subject to this performance criteria. Awards made to executives and senior managers of the Group’s operating companies in 2008 and 2009 have performance criteria subject to EPS in respect of 50% of the award and operating company profit targets in respect of 50% of the award. For awards made subsequent to 2009, the performance criteria is EPS in respect of 33.33% of the award and operating company profit targets in respect of 66.67% of the award. Operating company manager awards up to 2013 were entirely subject to operating company profit targets and vest after a period of three years and must be exercised during the seven-year period following vesting. Except in respect of two Group operating companies, where performance criteria continue to apply, operating company manager awards made in 2014, under the Restricted Shares Plan, have no performance criteria.
Since 2011, Performance Share Plan options have also been granted to UK employees that are approved share options as defined by HMRC. The performance criteria and vesting conditions are consistent with the unapproved options granted described above.
The approved share options are linked to the unapproved share options in order to benefit from the tax-exempt status of approved share option grants to a value not exceeding £30,000. Should there be a gain on exercise under the approved options, such gain will cause a proportionate reduction in the number and value of the linked unapproved options. Should there be no gain on exercise under the approved options, these options are then forfeited and the linked unapproved options may be exercised in full, to the extent their performance criteria is met.

Strategic Report 01–41 Governance 42–74 Financial Statements 75–131
111Spectris plc Annual Report and Accounts 2014
Notes to the Accounts continued
23. Share-based payments continued
From 2014, operating company manager awards were made under the Restricted Shares Plan. Awards vest three years from grant and are cash-settled on vesting. The Restricted Shares Plan is subject to the same rules as the Performance Share Plan but gives flexibility as to whether or not awards are subject to performance criteria. Awards under the Restricted Shares Plan may be granted to an employee of any Group operating company, but may not be awarded to an Executive Director of Spectris plc.
Share options outstanding at the end of the year 2014 2013 Exercise price Contractual life Number Number SAYE – Year of grant £ of options Thousands Thousands
2010 10.19 Nil – 2 2011 13.81 1 year 8 29 2012 16.95 2 years 32 35 2013 22.45 3 years 20 23 2014 20.15 4 years 51 –
111 89
2014 2013 Exercise price Contractual life Number Number Performance Share Plan (unapproved) – Year of grant £ of options Thousands Thousands
2007 0.05 3 years 1 1 2008 0.05 4 years 8 8 2009 0.05 5 years 33 40 2010 0.05 6 years 77 113 2011 0.05 7 years 178 552 2012 0.05 8 years 511 552 2013 0.05 9 years 413 460 2014 0.05 10 years 489 –
1,710 1,726
2014 2013 Exercise price Contractual life Number Number Performance Share Plan (approved) – Year of grant £ of options Thousands Thousands
2011 11.30 7 years 3 7 2012 17.31 8 years 68 72 2013 23.78 9 years 24 26 2014 23.03 10 years 18 –
113 105
2014 2013 Exercise price Contractual life Number Number Restricted Shares Plan – Year of grant £ of options Thousands Thousands
2014 0.05 3 years 77 –
77 –

Strategic Report 01–41 Governance 42–74 Financial Statements 75–131
112Spectris plc Annual Report and Accounts 2014
Notes to the Accounts continued
23. Share-based payments continued
Movements in the year 2014 2013
Weighted Weighted average Value of average Value of Number exercise price shares Number exercise price shares SAYE Thousands £ £m Thousands £ £m
At 1 January 89 17.23 1.5 92 14.09 1.3 Granted 51 20.15 1.0 23 22.45 0.5 Exercised (22) 13.63 (0.3) (20) 9.52 (0.2) Forfeited (7) 19.08 (0.1) (6) 15.48 (0.1)
At 31 December 111 19.16 2.1 89 17.23 1.5
Exercisable at 31 December 8 13.81 0.12 2 10.19 0.02
2014 2013
Weighted Weighted average Value of average Value of Number exercise price shares Number exercise price shares Performance Share Plan (unapproved) Thousands £ £m Thousands £ £m
At 1 January 1,726 0.05 0.09 2,670 0.05 0.13 Shares granted 507 0.05 0.03 488 0.05 0.02 Addition of reinvested dividends 32 0.05 0.01 72 0.05 0.01 Exercised (283) 0.05 (0.02) (1,306) 0.05 (0.06) Forfeited (272) 0.05 (0.02) (198) 0.05 (0.01)
At 31 December 1,710 0.05 0.09 1,726 0.05 0.09
Exercisable at 31 December 120 0.05 0.01 162 0.05 0.01
2014 2013
Weighted Weighted average Value of average Value of Number exercise price shares Number exercise price shares Performance Share Plan (approved) Thousands £ £m Thousands £ £m
At 1 January 105 18.47 1.94 85 16.82 1.43 Shares granted 19 23.03 0.44 26 23.78 0.62 Forfeited (11) 17.10 (0.18) (6) 17.81 (0.11)
At 31 December 113 19.37 2.20 105 18.47 1.94
Exercisable at 31 December – – – – – –
2014
Weighted average Value of Number exercise price shares Restricted Shares Plan Thousands £ £m
At 1 January – – – Shares granted 81 0.05 – Forfeited (4) 0.05 –
At 31 December 77 0.05 –
Exercisable at 31 December – – –

Strategic Report 01–41 Governance 42–74 Financial Statements 75–131
113Spectris plc Annual Report and Accounts 2014
Notes to the Accounts continued
23. Share-based payments continued
Share-based payment expenseShare options are valued using the stochastic option pricing model (also known as the Monte Carlo model), with support from an independent remuneration consultant. The TSR performance condition was included in the calculation of fair value under the Performance Share Plan. For options granted in 2013 and 2014, the fair value of options granted and the assumptions used in the calculation are as follows: Performance Share Plan Performance Share Plan Restricted SAYE (unapproved) (approved) Shares Plan
2014 2013 2014 2013 2014 2013 2014
Weighted average share price at date of grant (£) 19.92 22.21 23.16 23.65 22.70 23.54 23.68 Weighted average exercise price (£) 20.15 22.45 0.05 0.05 23.03 23.78 0.05 Expected volatility 31.8% 33.2% n/a n/a 32.7% 33.0% n/a Expected life 3.45 yrs 3.45 yrs 3 yrs 3 yrs 3 yrs 3 yrs 3 yrs Risk-free rate 1.40% 0.9% 1.08% 0.4% 1.07% 0.4% n/a Expected dividends (expressed as a yield) 2.2 1.8% 0% 0% 1.9% 1.6% 0% Fair value per option (£) 3.61 4.25 Weighted average fair values at date of grant (£): Equity-settled (TSR condition) 12.25 14.69 4.44 4.58 Equity-settled (Profit condition) 23.55 23.26 4.37 4.63 Equity-settled (EPS condition) 22.97 23.43 4.47 4.64 Equity-settled (Economic profit condition) 22.26 – 4.61 – Cash-settled (TSR condition) 13.93 15.39 n/a Cash-settled (Profit condition) 23.64 23.52 23.64 Cash-settled (EPS condition) 23.64 23.50 23.64 Weighted average fair values at 31 December (£): Cash-settled (TSR condition) 8.08 12.99 n/a Cash-settled (Profit condition) 20.03 24.69 20.41 Cash-settled (EPS condition) 20.03 24.69 20.35
The expected volatility is based on historical volatility over the expected term. The expected life is the average expected period to exercise. The risk-free rate of return is the yield on zero-coupon UK government bonds of a term consistent with the assumed option life.
The weighted average share price at the date of exercise for unapproved share options exercised under the Performance Share Plan in 2014 was £22.18 (2013: £21.82). The weighted average fair value of cash-settled options outstanding at 31 December 2014 is £20.35 (2013: £25.07) for the EPS condition.
The Group recognised a total charge of £2.3m (2013: £3.1m) in the Consolidated Income Statement, of which £2.2m (2013: £2.3m) related to equity-settled share-based payment transactions.

Strategic Report 01–41 Governance 42–74 Financial Statements 75–131
114Spectris plc Annual Report and Accounts 2014
Notes to the Accounts continued
24. Acquisitions
On 16 June 2014, the Group acquired the trade and certain assets of La Corporation Scientifique Claisse (‘Claisse’), a company based in Canada, for a total consideration of £10.4m. This extends the Group’s capabilities in sample preparation for atomic spectroscopy, including X-Ray analysis. The excess of the fair value of the consideration paid over the fair value of net tangible assets acquired is represented by the following intangible assets: customer-related (customer relations), patents and contractual rights, trade name, technology and goodwill of £1.4m, £0.2m, £1.1m, £2.0m and £3.4m respectively. The goodwill arising is attributable to opportunities expected that will be generated from a deepening of the Group’s product offering within the sample preparation market, the leveraging of the customer base to optimise the sales potential of Claisse and Spectris’ products and benefits arising from improving the productivity of the combined sales and support channels. Goodwill includes an amount of £0.3m representing the requirement to recognise a deferred tax liability on the fair value adjustments. The business is being integrated into the Materials Analysis segment.
On 22 July 2014, the Group acquired the trade and certain assets of MicroCal, a US business, for a total consideration of £28.7m. This extends the Group’s capabilities in life science analytical solutions. The excess of the fair value of the consideration paid over the fair value of net tangible assets acquired is represented by the following intangible assets: customer-related (customer relations), trade name, technology and goodwill of £2.5m, £3.0m, £6.2m and £14.9m respectively. The goodwill arising is attributable to the acquired workforce, opportunities expected to be generated from enhancing the Group’s product portfolio in the large molecule space in life sciences and the ability to leverage the acquired technology into existing applications. The business is being integrated into the Materials Analysis segment.
On 23 July 2014, the Group acquired the trade and certain assets of Affinity Biosensors LLC, a US business, for a total consideration of £9.6m, including £0.7m contingent consideration which is based on 3% of sales over a threshold amount over the next six years. This extends the Group’s capabilities in particle measurement within the life science sector. The excess of the fair value of the consideration paid over the fair value of net tangible assets acquired is represented by the following intangible assets: contractual rights, technology and goodwill of £2.5m, £2.4m and £4.7m respectively. The goodwill arising is attributable to the opportunities expected from the commercialisation of the acquired technology within the biopharmaceutical market. The business is being integrated into the Materials Analysis segment.
On 4 September 2014, the Group acquired the trade and certain assets of Sudo Premium Engineering Company, a South Korean distributor, for a total consideration of £5.9m, including £1.5m contingent consideration which is based on 2.5% of annual sales up to a threshold and 7.5% over this threshold over the next five years. The excess of the fair value of the consideration paid over the net fair value of tangible assets acquired is represented by the following intangible assets: customer-related and technology of £5.2m and £0.7m respectively. The business is being integrated into the Materials Analysis segment.
On 1 October 2014, the Group acquired 100% of the share capital of Fibersensing – Sistemas Avancados de Monitorizacao S.A., a company based in Portugal, for a total consideration of £5.1m (£6.1m net of debt acquired), including £2.5m contingent consideration which is based on 50% of sales over a threshold amount over the next three years. This extends the Group’s capabilities in FBG (Fiber Bragg Grating) measurement and monitoring systems for critical physical assets. The excess of the fair value of the consideration paid over the fair value of net tangible assets acquired is represented by the following intangible assets: customer-related (customer relations), patents and contractual rights, technology and goodwill of £2.0m, £0.1m, £1.6m and £3.1m respectively. The goodwill arising is attributable to opportunities expected from the extension of the Group’s optical product offering and expertise combined with greater access to the optical sensing market. Goodwill includes an amount of £0.5m representing the requirement to recognise a deferred tax liability on the fair value adjustments. The business is being integrated into the Test and Measurement segment.
On 10 December 2014, the Group acquired 100% of the share capital of Engineering Seismology Group, a company based in Canada, for a total consideration of £44.1 (£42.2m net of cash acquired), including £6.9m contingent consideration which is based on 50% of the year-on-year sales growth over the next three years above certain thresholds. The excess of the fair value of the consideration paid over the fair value of net tangible assets acquired is represented by the following intangible assets: customer-related, technology and goodwill of £10.3m, £6.3m and £22.4m respectively. The company is a leading provider of microseismic monitoring equipment and analysis solutions primarily to the oil, gas and mining industries. The goodwill arising is considered to represent the value of the acquired workforce, and the opportunities expected as the business is integrated into the Group where it will benefit from leveraging the Group’s wider customer base and sales and marketing channels, together with sharing capabilities and technology in core sensors, software and data analysis with other operating companies. Goodwill includes an amount of £4.5m representing the requirement to recognise a deferred tax liability on the fair value adjustments. The business is part of the Test and Measurement segment.
The assets and liabilities acquired arising from the above acquisitions, together with the aggregate purchase consideration, are summarised in the table below. The revenue and operating profit contribution from the acquisitions in the year to the Group’s results for the year were £12.8m and £3.5m, respectively. Group revenue and operating profit would have been £1,206.6m and £171.7m (adjusted operating profit: £204.1m), respectively, had each of these acquisitions taken place on the first day of the financial year.
The following fair value tables are provisional, reflecting the timing of the acquisitions, and are expected to be finalised within 12 months of the acquisition date.

Strategic Report 01–41 Governance 42–74 Financial Statements 75–131
115Spectris plc Annual Report and Accounts 2014
Notes to the Accounts continued
24. Acquisitions continued
The following fair value tables are provisional, reflecting the timing of the acquisitions, and are expected to be finalised within 12 months of the acquisition date. 2014 Book value Adjustments Fair value Net assets acquired under 2014 acquisitions £m £m £m
Intangible fixed assets 1.2 46.3 47.5 Tangible fixed assets 7.1 0.1 7.2 Inventories 7.3 (0.2) 7.1 Trade and other receivables 4.9 (0.1) 4.8 Trade and other payables (6.2) 0.2 (6.0) Provisions – (0.6) (0.6) Retirement benefit obligation (0.1) – (0.1) Current tax (0.2) – (0.2) Deferred tax liabilities – (5.3) (5.3) Net cash 0.9 – 0.9
Net assets acquired 14.9 40.4 55.3 Goodwill 48.5
Total consideration in respect of 2014 acquisitions 103.8
Total consideration 103.8 Adjustment for net cash acquired (0.9)
Net consideration in respect of 2014 acquisitions 102.9
Analysis of cash outflow in Consolidated Statement of Cash Flows
Total consideration in respect of 2014 acquisitions 103.8 Adjustment for net cash acquired on 2014 acquisitions (0.9) Deferred and contingent consideration on 2014 acquisitions to be paid in future years (11.6)
Cash paid in 2014 in respect of 2014 acquisitions 91.3
Acquisitions prior to 2014
Deferred and contingent consideration in relation to prior years’ acquisitions: – accrued at 31 December 2013 0.3
Cash paid in 2014 in respect of prior years’ acquisitions 0.3
2014 net cash outflow relating to acquisitions 91.6
Due to their contractual due dates, the fair value of receivables acquired approximates to the gross contractual amounts receivable. The amount of gross contractual receivables not expected to be recovered is immaterial.
There are no material contingent liabilities recognised in accordance with IFRS 3 (Revised).

Strategic Report 01–41 Governance 42–74 Financial Statements 75–131
116Spectris plc Annual Report and Accounts 2014
Notes to the Accounts continued
24. Acquisitions continued
Net assets acquired for significant 2014 acquisitions 2014 Book value Adjustments Fair value Net assets acquired for Engineering Seismology Group £m £m £m
Intangible fixed assets – 16.6 16.6 Tangible fixed assets 4.7 0.2 4.9 Inventories 0.6 0.2 0.8 Trade and other receivables 3.8 (0.1) 3.7 Trade and other payables (1.5) – (1.5) Current tax (0.2) – (0.2) Deferred tax liabilities – (4.5) (4.5) Cash 1.9 – 1.9
Net assets acquired 9.3 12.4 21.7 Goodwill 22.4
Total consideration 44.1
Total consideration 44.1 Adjustment for cash acquired (1.9)
Net consideration 42.2
Analysis of cash outflow in Consolidated Statement of Cash Flows
Total consideration 44.1 Adjustment for cash acquired (1.9) Deferred and contingent consideration to be paid in future years (6.9)
Cash paid in 2014 35.3
The following tables represent the finalisation of the fair values relating to the 2013 acquisitions: 2013 Book value Adjustments Fair value Net assets acquired under 2013 acquisitions £m £m £m
Intangible fixed assets – 15.0 15.0 Tangible fixed assets 0.1 – 0.1 Deferred tax asset 0.1 – 0.1 Inventories 0.5 0.1 0.6 Trade and other receivables 1.2 – 1.2 Trade and other payables (1.1) – (1.1) Deferred tax liabilities – (3.2) (3.2) Cash 1.8 – 1.8
Net assets acquired 2.6 11.9 14.5 Goodwill 3.2
Total consideration in respect of 2013 acquisitions 17.7
Total consideration 17.7 Adjustment for cash acquired (1.8)
Net consideration in respect of 2013 acquisitions 15.9

Strategic Report 01–41 Governance 42–74 Financial Statements 75–131
117Spectris plc Annual Report and Accounts 2014
Notes to the Accounts continued
24. Acquisitions continued 2013 Fair value Analysis of cash outflow in Consolidated Statement of Cash Flows £m
Total consideration in respect of 2013 acquisitions 17.7 Adjustment for cash acquired on 2013 acquisitions (1.8) Deferred and contingent consideration on 2013 acquisiti ons to be paid in future years (0.5)
Cash paid in 2013 in respect of 2013 acquisitions 15.4
Acquisitions prior to 2013
Purchase price adjustment in relation to prior year acquisition 0.1 Deferred and contingent consideration in relation to prior years’ acquisitions: – accrued at 31 December 2012 1.4
Cash paid in 2013 in respect of prior years’ acquisitions 1.5
Net cash outflow relating to acquisitions 16.9
25. Disposal of businessesIn line with the agreement signed on 18 December 2012, on 31 January 2013, the Group disposed of the Fusion UV business, part of the In-line Instrumentation segment, for a final consideration of US$175m. 2013 Effect of disposal on the financial position of the Group £m
Other intangible assets 0.3 Property, plant and equipment 0.9 Deferred tax assets 0.5 Inventory 5.1 Trade and other receivables 8.1 Cash 1.8 Trade and other payables (5.6) Current tax liabilities (0.6) Provisions (0.2)
Net assets divested 10.3
Consideration received, satisfied in cash 110.2 Cash disposed of (1.8) Transaction expenses (3.1)
Net cash inflow 105.3
Cash received net of transaction expenses 107.1 Net assets disposed of (10.3) Currency translation differences transferred from translation reserve 1.5
Profit on disposal of businesses 98.3
The sale of the Fusion UV business did not meet the definition of a discontinued operation given in IFRS 5 ‘Non-Current Assets Held for Sale and Discontinued Operations’ and, therefore, no disclosures in relation to discontinued operations have been made.
During 2014, the Group released a provision of £2.4m relating to exposures under certain indemnities and warranties provided to the buyers of the Fusion UV business which had lapsed. This amount is shown in the Consolidated Income Statement within ‘Profit on disposal of businesses’. No businesses were disposed of during 2014.
Disposal of associateOn 19 February 2013, the Group acquired certain trade and other assets that resulted in a deemed disposal of its 31.2% associate investment in Naneum Limited for £0.7m in cash. The Group’s share of the associate’s results up to the date of the disposal and the gain/(loss) on disposal were not considered material.

Strategic Report 01–41 Governance 42–74 Financial Statements 75–131
118Spectris plc Annual Report and Accounts 2014
Notes to the Accounts continued
26. Financial risk management
The Group’s multinational operations and debt financing expose it to a variety of financial risks. In the course of its business, the Group is exposed to foreign currency risk, interest rate risk, liquidity risk and credit risk. Financial risk management is an integral part of the way the Group is managed. Financial risk management policies are set by the Board of Directors. These policies are implemented by a central treasury department that has formal procedures to manage foreign exchange risk, interest rate risk and liquidity risk, including, where appropriate, the use of derivative financial instruments. The Group has clearly defined authority and approval limits. The central treasury department operates as a service centre to the Group and not as a profit centre.
In accordance with its treasury policy, the Group does not hold or use derivative financial instruments for trading or speculative purposes. Such instruments are only used to manage the risks arising from operating or financial assets or liabilities or highly probable future transactions. The quantitative analysis of financial risk is included in Note 27.
Foreign currency riskForeign currency risk arises both where sale or purchase transactions are undertaken in currencies other than the respective functional currencies of Group companies (transactional exposures) and where the results of overseas companies are consolidated into the Group’s reporting currency of Sterling (translational exposures). The Group has operations around the world which record their results in a variety of different local functional currencies. In countries where the Group does not have operations, it invariably has some customers or suppliers that transact in a foreign currency. The Group is therefore exposed to the changes in foreign currency exchange rates between a number of different currencies but the Group’s primary exposures relate to the US Dollar, Euro, Danish Krone, Swiss Franc and Japanese Yen. Where appropriate, the Group manages its foreign currency exposures using derivative financial instruments.
The Group manages its transactional exposures to foreign currency risks through the use of forward exchange contracts. Forward exchange contracts are used to hedge highly probable transactions which can be forecast to occur typically up to 18 months into the future.
The Group’s translational exposures to foreign currency risks can relate both to the Consolidated Income Statement and net assets of overseas subsidiaries. The Group’s policy is not to hedge the translational exposure that arises on consolidation of the Consolidated Income Statement of overseas subsidiaries. The Group finances overseas company investments partly through the use of foreign currency borrowings in order to provide a natural hedge of foreign currency risk arising on translation of the Group’s foreign currency subsidiaries. The quantitative analysis of foreign currency risk is included in Note 27.
Interest rate riskInterest rate risk comprises both the interest rate price risk that results from borrowing at fixed rates of interest and also the interest cash flow risk that results from borrowing at variable rates. Where appropriate, interest rate swaps are used to manage the Group’s interest rate profile.
As at 31 December 2014, the majority of the Group’s borrowings attract fixed rates of interest linked to LIBOR and therefore the Group’s principal interest rate risk is a fair value risk. The quantitative analysis of interest rate risk is included in Note 27.
Liquidity riskLiquidity risk represents the risk that the Group will not be able to meet its financial obligations as they fall due. The Group’s approach to managing this risk is to ensure, as far as possible, that it will always have sufficient liquidity to meet its liabilities when due, under both normal and stressed conditions, without incurring unacceptable losses or risking damage to the Group’s reputation. The Group manages this risk through the use of regularly updated cash flow and covenant compliance forecasts and a liquidity headroom analysis which is used to determine funding requirements. Adequate committed lines of funding are maintained from high quality investment grade lenders. The facilities committed to the Group as at 31 December 2014 are set out in Note 16.

Strategic Report 01–41 Governance 42–74 Financial Statements 75–131
119Spectris plc Annual Report and Accounts 2014
Notes to the Accounts continued
26. Financial risk management continued
Credit riskCredit risk arises because a counterparty may fail to perform its obligations. The Group is exposed to credit risk on financial assets such as cash balances, derivative financial instruments, trade and other receivables.
The Group’s credit risk is primarily attributable to its trade receivables. The amounts recognised in the Consolidated Statement of Financial Position are net of appropriate allowances for doubtful receivables, estimated by the Group’s management based on prior experience and their assessment of the current economic environment. Trade receivables are subject to credit limits and control and approval procedures in the operating companies. Due to its large geographic base and number of customers, the Group is not exposed to material concentrations of credit risk on its trade receivables. The quantitative analysis of credit risk to receivables is included in Note 14.
Credit risk associated with cash balances and derivative financial instruments is managed centrally by transacting with existing relationship banks with strong investment grade ratings. Accordingly, the Group’s associated credit risk is limited. The Group has no significant concentration of credit risk.
The Group’s maximum exposure to credit risk is represented by the carrying amount of each financial asset, including derivative financial instruments, as shown in Note 27.
Capital managementThe Board considers equity shareholders’ funds, together with committed debt facilities, as capital for the purposes of funding the Group’s operations. Total managed capital at 31 December is: 2014 2013 £m £m
Equity shareholders’ funds 916.0 844.1 Committed debt facilities (Note 16) 474.7 456.7
1,390.7 1,300.8
Ordinary shares are classified as equity. Incremental costs directly attributable to the issue of ordinary shares and share options are recognised as a deduction from equity, net of any tax effects.
The Board’s policy is to maintain a strong capital base so as to maintain investor, creditor and market confidence and to sustain the future development of the business. The Board of Directors monitors both the demographic spread of shareholders and the level of dividends to ordinary shareholders.
The Board encourages employees to hold shares in the Company. This is carried out through a Save As You Earn option scheme in the UK, as well as performance share plans. Full details of these schemes are given in Note 23.
The Board seeks to maintain a balance between the higher returns that might be possible with higher levels of borrowings, the advantages and security afforded by a sound capital position, and the benefits of an implied investment grade credit rating.
The main financial covenants in the Company’s debt facilities are the ratio of net debt to adjusted earnings before interest, tax, depreciation and amortisation and the ratio of finance charges to adjusted earnings before interest, tax and amortisation. Covenant testing is completed twice a year based on the half-year and year-end Financial Statements. At 31 December 2014, the Company had, and is expected to continue to have, significant headroom under these financial covenant ratios.
From time to time the Group purchases its own shares in the market; the timing of these purchases depends on market prices. Buy and sell decisions are made on a specific transaction basis by the Board.
There were no changes to the Group’s approach to capital management during the year.
Neither the Company nor any of its subsidiaries are subject to externally imposed capital requirements.

Strategic Report 01–41 Governance 42–74 Financial Statements 75–131
120Spectris plc Annual Report and Accounts 2014
Notes to the Accounts continued
27. Financial instruments 2014
Level 2 Level 3 Carrying fair value fair value amount Fair value and carrying amount of financial instruments £m £m £m
Trade and other receivables excluding prepayments and accrued income 218.8 Trade and other payables excluding deferred income (12.2) (195.4) Cash and cash equivalents 34.8 Floating rate borrowings (38.4) Fixed rate borrowings (130.0) (122.0) Forward exchange contracts (0.3) (0.3)
(102.5)
Included within the above carrying amount of financial instruments, is an amount of £12.2m (2013: £0.6m) relating to contingent consideration arising from acquisitions, of which £11.6m has arisen on acquisitions completed during 2014 (see Note 24). 2013 Level 2 Carrying fair value amount Fair value and carrying amount of financial instruments £m £m
Trade and other receivables excluding prepayments 201.1 Trade and other payables excluding deferred income (184.1) Cash and cash equivalents 43.8 Floating rate borrowings (23.3) Fixed rate borrowings (124.8) (124.6) Forward exchange contracts 3.6 3.6
(83.5)
The above tables show the fair value measurement of financial instruments by level following the fair value hierarchy:
•Level 1 – quoted prices (unadjusted) in active markets for identical assets and liabilities;
•Level 2 – inputs other than quoted prices included within level 1 that are observable for the asset or liability, either directly (i.e. as prices) or indirectly (i.e. derived from prices); and
•Level 3 – inputs for the assets and liabilities that are not based on observable market data (i.e. unobservable inputs). The fair value of the contingent consideration liability of £12.2m has been determined by discounting the expected payments to their present value based on forecast sales using risk-adjusted discount rates specific to the acquisition. The significant unobservable inputs are the level of forecast sales and the risk-adjusted discount rate. The estimated fair value would increase if the forecast sales were higher or the risk-adjusted discount rate was lower.
There were no movements between the fair value hierarchy in the year.
The fair value of cash and cash equivalents, receivables and payables approximates to the carrying amount because of the short maturity of these instruments.
The fair value of floating rate borrowings approximates to the carrying amount because interest rates are at floating rates where payments are reset to market rates at intervals of less than one year.
The fair value of fixed rate borrowings are estimated by discounting the future contracted cash flow, using appropriate yield curves, to the net present values.
The fair value of forward exchange contracts and the cross-currency interest rate swaps are determined using discounted cash flow techniques based on readily available market data.
The fair value of forward exchange contracts outstanding as at 31 December 2014 is a net liability of £0.3m (2013: net asset of £3.6m), of which £0.3m has been debited to the hedging reserve (2013: £2.9m credit) and £nil credited to the Consolidated Income Statement (2013: £0.7m credit). These contracts mature over periods typically not exceeding 18 months. A summary of the movements in the hedging reserve during the year is presented below. In accordance with IFRS, all of the cash flow hedges in 2014 and 2013 were deemed to be effective.

Strategic Report 01–41 Governance 42–74 Financial Statements 75–131
121Spectris plc Annual Report and Accounts 2014
Notes to the Accounts continued
27. Financial instruments continued 2014 2013 Analysis of movements in hedging reserve net of tax £m £m
At 1 January (0.2) (0.8) Amounts removed from the Consolidated Statement of Changes in Equity and included in the Consolidated Income Statement during the year (2.0) (3.5) Amounts recognised in the Consolidated Statement of Changes in Equity during the year (0.8) 4.1
At 31 December (3.0) (0.2)
The amount included in the Consolidated Income Statement is split between revenue and administrative expenses depending on the nature of the hedged item.
The following table shows the total outstanding contractual forward exchange contracts hedging designated transactional exposures split by the currencies which have been sold back into the functional currency of the underlying business. These contracts typically mature in the next 18 months and, therefore, the cash flows and resulting effect on profit and loss are expected to occur within this time period. Forward exchange contracts at 31 December 2014 2013
Foreign currency sale amount (£m) 91.7 97.0 Percentage of total: US Dollar 42% 38% Euro 39% 40% Japanese Yen 15% 19% Other 4% 3%
A maturity profile of the gross cash flows related to financial liabilities is: 2014 2013
Bank loans Bank loans and Unsecured and Unsecured overdrafts loans Total overdrafts loans Total Maturity of financial liabilities £m £m £m £m £m £m
Due within one year 2.5 52.2 54.7 2.2 3.8 6.0 Due between one and two years – 2.6 2.6 – 49.5 49.5 Due between two and five years – 44.7 44.7 – 27.8 27.8 Due in more than five years – 75.5 75.5 – 82.9 82.9
2.5 175.0 177.5 2.2 164.0 166.2
Trade and other payables (Note 17) are substantially due within one year.
It is not expected that the cash flows described above could occur significantly earlier or at substantially different amounts. 2014 Financial assets Financial liabilities Net financial Fixed Floating Non-interest Fixed Floating assets/ Interest rate exposure of financial rate rate bearing Total rate rate Total (liabilities) assets and liabilities by currency £m £m £m £m £m £m £m £m
Sterling – 0.3 2.4 2.7 – – – 2.7 Euro – 7.3 4.0 11.3 (73.6) – (73.6) (62.3) US Dollar – 4.2 4.2 8.4 (48.4) (36.6) (85.0) (76.6) Other 0.1 4.5 7.8 12.4 – (1.8) (1.8) 10.6
0.1 16.3 18.4 34.8 (122.0) (38.4) (160.4) (125.6)
2013 Financial assets Financial liabilities Net financial Fixed Floating Non-interest Fixed Floating assets/ Interest rate exposure of financial rate rate bearing Total rate rate Total (liabilities) assets and liabilities by currency £m £m £m £m £m £m £m £m
Sterling – 0.4 1.7 2.1 – – – 2.1 Euro – 6.5 3.7 10.2 (78.9) – (78.9) (68.7) US Dollar – 12.5 3.9 16.4 (45.7) (22.1) (67.8) (51.4) Other 0.8 4.5 9.8 15.1 – (1.2) (1.2) 13.9
0.8 23.9 19.1 43.8 (124.6) (23.3) (147.9) (104.1)

Strategic Report 01–41 Governance 42–74 Financial Statements 75–131
122Spectris plc Annual Report and Accounts 2014
Notes to the Accounts continued
27. Financial instruments continued
Sensitivity analysisThe tables below show the Group’s sensitivity to foreign exchange rates and interest rates. The US Dollar, Euro/Danish Krone and Swiss Franc represent the main foreign exchange translational exposures for the Group. The Group’s borrowings are primarily in US Dollars and Euros. 2014 2013
Decrease Decrease Decrease in profit Decrease in profit in equity before tax in equity before tax Impact on foreign exchange translational exposures against Sterling £m £m £m £m
10% weakening in the US Dollar 73.6 5.8 67.3 6.2 10% weakening in the Euro/Danish Krone 50.7 5.4 61.1 5.1 10% weakening in the Swiss Franc 2.6 1.7 3.0 2.0 Impact of interest rate movements
1% (100 basis points) increase in interest rates 0.2 0.2 – –
28. Contingent liabilities
Royal Bank of ScotlandSpectris plc and its UK subsidiaries are party to a cross guarantee arrangement to support trade finance facilities provided by the bank. They are also party to a cross guarantee arrangement that allows individual subsidiaries to borrow from the bank on overdraft within the overall borrowing limit agreed with the bank. Spectris plc has provided a Parent Company guarantee to support trade finance facilities provided by the bank to its subsidiaries in various countries outside the UK and USA. Spectris plc has also provided a Parent Company guarantee to support overdraft and intra-day facilities provided by the bank to its subsidiaries who participate in the cross-border Euro zero balance pooling arrangement. An amount of £11.3m (2013: £12.5m) was outstanding at 31 December 2014.
Other banksGroup companies have, in the normal course of business, provided bonds and guarantees through local banking arrangements amounting to £5.5m (2013: £5.0m).
29. Operating lease arrangements 2014 2013
Property Other Property Other Total commitments under non-cancellable operating leases £m £m £m £m
Not later than one year 11.0 4.5 10.5 4.5 Later than one year and not later than five years 15.8 4.7 20.3 5.0 Later than five years 4.5 – 4.9 –
31.3 9.2 35.7 9.5
Group companies are party to a number of operating leases for plant and machinery, motor vehicles and property rentals. The arrangements do not impose any significant restrictions on the Group.
During the year £15.3m (2013: £14.4m) was recognised in the Consolidated Income Statement in respect of operating lease rental payments.

Strategic Report 01–41 Governance 42–74 Financial Statements 75–131
123Spectris plc Annual Report and Accounts 2014
Notes to the Accounts continued
30. Capital commitments
At 31 December 2014, the Group had entered into contractual commitments for the acquisition of property, plant and equipment and software amounting to £ 1.5m (2013: £1.6m) which have not been accrued.
31. Related party transactions
Key management personnel are defined for the purpose of disclosure under IAS 24 ‘Related Party Disclosures’ as the members of the Board of Directors as identified on pages 42 and 43. It is the Board of Directors who have responsibility for planning, directing and controlling the activities of the Group. Details of the Directors’ remuneration are included in the Directors’ Remuneration Report on page 68. There are no other related party transactions.
32. Subsidiary undertakings
The following are the Group’s principal subsidiary undertakings. They operate mainly in the countries of incorporation. All of the subsidiaries are involved in the manufacture and sale of materials analysis systems, test and measurement equipment, in-line instrumentation and industrial controls.
Spectris plc holds 100% of the ordinary share capital of all the subsidiaries either directly or indirectly through intermediate holding companies. Country of incorporation
Brüel & Kjær Sound & Vibration Measurement A/S Denmark Brüel & Kjær Vibro A/S Denmark Hottinger Baldwin Messtechnik GmbH Germany BTG Eclépens SA Switzerland PANalytical BV The Netherlands Malvern Instruments Limited UK Servomex Group Limited UK Microscan Systems Inc USA NDC Infrared Engineering Inc USA Particle Measuring Systems Inc USA Red Lion Controls Inc USA Omega Engineering Inc USA Engineering Seismology Group Canada Inc Canada
33. Post balance sheet events
On 22 January 2015, the Group acquired 100% of the share capital of ReliaSoft Corporation Inc, a company based in the US, for a total consideration of £28.0m. The company is a leading provider of reliability engineering software and will be integrated into the Test and Measurement segment.

Strategic Report 01–41 Governance 42–74 Financial Statements 75–131
124Spectris plc Annual Report and Accounts 2014
Company Balance SheetAs at 31 December 2014
2014 2013 Note £m £m
Fixed assets Intangible fixed assets 36 0.6 0.7 Tangible fixed assets 37 2.9 3.1 Fixed asset investments 38 512.5 431.6
516.0 435.4
Current assets Debtors 39 311.0 397.1 Cash at bank 1.3 2.9 Derivative financial instruments 0.3 –
312.6 400.0
Creditors: due within one year Other creditors 40 (282.0) (210.1)
Net current assets 30.6 189.9
Debtors: due after more than one year Debtors 41 633.1 145.6
Total assets less current liabilities 1,179.7 770.9
Creditors: due after more than one year Borrowings 42 (228.3) (216.0) Derivative financial instruments – (0.1)
(228.3) (216.1)
Net assets 951.4 554.8
Capital and reserves Called up share capital 43 6.2 6.2 Share premium account 44 231.4 231.4 Merger reserve 44 3.1 3.1 Capital redemption reserve 44 0.3 0.3 Special reserve 44 34.1 34.1 Profit and loss account 44 676.3 279.7
Equity shareholders’ funds 951.4 554.8
The Financial Statements on pages 124 to 131 were approved by the Board of Directors on 27 February 2015 and were signed on its behalf by:
Clive WatsonGroup Finance Director Company Registration No. 2025003

Strategic Report 01–41 Governance 42–74 Financial Statements 75–131
125Spectris plc Annual Report and Accounts 2014
Notes to the Company Accounts
34. Accounting policies
The separate Financial Statements of the Company are presented as required by the Companies Act 2006. As permitted by that Act, the separate Financial Statements have been prepared in accordance with applicable accounting standards in the United Kingdom. In accordance with the exemption provided by Section 408 of the Companies Act 2006, the Company has not presented its own profit and loss account.
The Company has taken the exemption available in respect of the requirements of FRS 29 ‘Financial Instruments: Disclosures’.
Basis of accountingThe accounts are prepared on the historical cost basis, except that derivative financial instruments are stated at fair value as described below.
Derivative financial instrumentsThe Company uses derivative financial instruments to hedge the Group’s exposure to foreign exchange and interest rate risks arising from operating and financing activities. In accordance with its treasury policy, it does not hold or use derivative financial instruments for trading or speculative purposes.
Financial guaranteesWhere the Company enters into financial guarantee contracts to guarantee the indebtedness of other companies within its Group, the Company considers these to be insurance arrangements and accounts for them as such. In this respect, the Company treats the guarantee contract as a contingent liability until such time as it becomes probable that the Company will be required to make a payment under the guarantee.
Foreign currenciesTransactions in foreign currencies are translated at the foreign exchange rate ruling at the date of the transaction. Monetary assets and liabilities denominated in foreign currencies at the balance sheet date are translated at the exchange rate ruling at that date with any exchange differences arising on retranslation being recognised in the profit and loss account. Non-monetary assets and liabilities that are measured in terms of historical cost in a foreign currency are translated using the exchange rate at the date of the transaction.
Tangible fixed assets and depreciationTangible fixed assets are stated at historic cost.
Depreciation is provided to write off the difference between the cost or valuation of fixed assets and their residual value over their estimated useful economic lives on a straight-line basis. Freehold land is not depreciated. Estimated useful economic lives are as follows:
•Freehold property – 20 to 40 years
•Office equipment – 3 to 5 years
Intangible fixed assets and amortisationIntangible fixed assets purchased by the Company are capitalised at their cost.
Amortisation of intangible assets is charged to administrative expenses in the profit and loss account on a straight-line basis over the estimated useful economic lives of intangible assets. The estimated useful economic lives are as follows:
•Software – 3 to 5 years
Fixed asset investmentsInvestments in subsidiaries are stated at cost less, where appropriate, provisions for impairment.

Strategic Report 01–41 Governance 42–74 Financial Statements 75–131
126Spectris plc Annual Report and Accounts 2014
Notes to the Company Accounts continued
34. Accounting policies continued
Trade and other receivablesTrade and other receivables are initially recognised at fair value and subsequently measured at their amortised cost, reduced by appropriate allowances for estimated irrecoverable amounts.
Trade and other payablesTrade and other payables are initially recognised at fair value and are subsequently measured at amortised cost.
TaxationThe charge for taxation is based on the profit for the year and takes into account taxation deferred because of timing differences between the treatment of certain items for taxation and accounting purposes. Deferred tax is recognised, without discounting, in respect of all timing differences between the treatment of certain items for taxation and accounting purposes which have arisen but not reversed by the balance sheet date, except as otherwise required by FRS 19 ‘Deferred Tax’.
LeasingAnnual payments under operating leases are charged to the profit and loss account on an accruals basis over the lease period.
Post-retirement benefitsThe Company participates in Group operated defined contribution and defined benefit pension schemes. The assets of the schemes are held separately from those of the Company in independently administered funds. The Company is unable to identify its share of the Group defined benefit scheme’s underlying assets and liabilities and therefore accounts for it as a defined contribution scheme. The amounts charged against profits represent contributions payable to the schemes in respect of the accounting year.
Share-based paymentsThe fair value of the options granted is measured using an option pricing model, taking into account the terms and conditions upon which the options were granted. The amount recognised as an expense is adjusted to reflect the actual number of awards for which the related service and non-market vesting conditions are expected to be met, such that the amount ultimately recognised as an expense is based on the number of awards that do meet the related service and non-market performance conditions at the vesting date. For share-based payment awards with non-vesting conditions, the grant date fair value of the share-based payment is measured to reflect such conditions and there is no true-up for differences between expected and actual outcomes.
Where the Company grants options over its own shares to the employees of its subsidiaries, it recognises an increase in the cost of investment in its subsidiaries equivalent to the equity-settled share-based payment charge recognised in the subsidiary’s Financial Statements with the corresponding credit being recognised directly in equity. In cases where a subsidiary is recharged for the share-based payment expense, no such increase in investment is recognised.
Cash flow statementThe Company has not presented a separate cash flow statement in accordance with the exemption provided by FRS 1 (Revised) ‘Cash Flow Statements’, as its cash flows are included within the Consolidated Statement of Cash Flows, as set out on page 82.

Strategic Report 01–41 Governance 42–74 Financial Statements 75–131
127Spectris plc Annual Report and Accounts 2014
Notes to the Company Accounts continued
35. Employee costs and other information
Employee costs, including Directors’ remuneration, comprise: 2014 2013 Employee costs, including Directors’ remuneration £m £m
Wages and salaries 5.6 6.2 Social security costs 1.3 2.1 Defined contribution pension plans 0.2 0.2 Share-based payment expense 1.2 1.1
8.3 9.6
2014 2013 Number Number
Average number of employees 41 39
Directors’ remunerationFurther details of Directors’ remuneration and share options are given in Note 6 to the Group Consolidated Financial Statements and in the Directors’ Remuneration Report on pages 61 to 74.
Auditor’s feesDetails regarding the remuneration of the Company’s auditor are included in Note 5 to the Group Consolidated Financial Statements under ‘Fees payable to the Company’s auditor for the audit of the Company’s Annual Accounts’.
36. Intangible fixed assets Software Cost £m
At 1 January 2014 3.5 Additions 0.1
At 31 December 2014 3.6
Amortisation
At 1 January 2014 2.8 Charge for the year 0.2
At 31 December 2014 3.0
Net book value
At 31 December 2014 0.6
At 31 December 2013 0.7

Strategic Report 01–41 Governance 42–74 Financial Statements 75–131
128Spectris plc Annual Report and Accounts 2014
37. Tangible fixed assets Freehold Office property equipment Total Cost £m £m £m
At 1 January 2014 3.3 0.5 3.8
At 31 December 2014 3.3 0.5 3.8
Depreciation
At 1 January 2014 0.3 0.4 0.7 Charge for the year 0.2 – 0.2
At 31 December 2014 0.5 0.4 0.9
Net book value
At 31 December 2014 2.8 0.1 2.9
At 31 December 2013 3.0 0.1 3.1
38. Fixed asset investments Investments in subsidiary undertakings Cost £m
At 1 January 2014 501.2 Additions 80.9
At 31 December 2014 582.1
Provision for impairment
At 1 January 2014 69.6
At 31 December 2014 69.6
Net book value
At 31 December 2014 512.5
At 31 December 2013 431.6
The additions during the year were part of a Group-wide reorganisation.
Further details regarding the investments in subsidiaries are given in Note 32 to the Group Consolidated Financial Statements.
Notes to the Company Accounts continued

Strategic Report 01–41 Governance 42–74 Financial Statements 75–131
129Spectris plc Annual Report and Accounts 2014
Notes to the Company Accounts continued
39. Debtors 2014 2013 Amounts falling due within one year £m £m
Amounts owed by Group undertakings 303.8 390.2 Other debtors 0.2 0.6 Prepayments and accrued income 1.1 1.7 Corporation tax 5.4 4.0 Deferred tax asset 0.5 0.6
311.0 397.1
40. Creditors: due within one year 2014 2013 £m £m
Amounts owed to Group undertakings 229.7 205.7 Accruals and deferred income 3.9 4.4 Unsecured bank loans 48.4 –
282.0 210.1
41. Debtors: due after more than one year 2014 2013 £m £m
Amounts owed by Group undertakings 631.3 145.6 Prepayments and accrued income 1.8 –
633.1 145.6
Amounts owed by Group undertakings are interest bearing and the re-translation of foreign currency balances used to acquire foreign operations is taken to reserves (see Note 44).
42. Creditors: due after more than one year 2014 2013 £m £m
Borrowings: Amounts owed to Group undertakings 118.8 70.3 Unsecured bank loans 109.5 145.7
228.3 216.0
Further details regarding the Company’s borrowings are set out in Note 16 of the Group Consolidated Financial Statements.

Strategic Report 01–41 Governance 42–74 Financial Statements 75–131
130Spectris plc Annual Report and Accounts 2014
43. Share capital 2014 2013
Number of Number of shares shares Million £m Million £m
Issued and fully paid: At 1 January 125.0 6.2 125.0 6.2
At 31 December 125.0 6.2 125.0 6.2
No ordinary shares were issued upon exercise under share option schemes during the year (2013: nil).
Share options have been granted to subscribe for ordinary shares of Spectris plc. Full details of share options currently in issue, including those issued during the year, together with information regarding the basis of calculation of the share-based payment expense, is contained in Note 23 to the Group Consolidated Financial Statements.
The Company recognised total expenses of £1.2m related to equity-settled share-based payment transactions in 2014 (2013: £1.1m). In addition, the Company recognised a charge of £1.0m (2013: £1.2m) related to equity-settled share-based transactions for certain employees of other Group companies.
44. Reserves Share Capital Profit and premium Merger redemption Special loss account reserve reserve reserve account Total £m £m £m £m £m £m
At 1 January 2014 231.4 3.1 0.3 34.1 279.7 548.6 Profit for the year – – – – 437.1 437.1 Equity dividends paid – – – – (52.3) (52.3) Share-based payments – – – – 2.2 2.2 Share options exercised from own shares (treasury) purchased – – – – 0.3 0.3 Exchange gain on net investment hedging of foreign operations – – – – 9.3 9.3
At 31 December 2014 231.4 3.1 0.3 34.1 676.3 945.2
The purpose of the merger reserve and capital redemption reserve is detailed in Note 21 of the Group Consolidated Financial Statements. The special reserve was created historically following the cancellation of an amount of share premium for the purpose of writing off goodwill. The special reserve is not distributable.
45. Reconciliation of movement in equity shareholders’ funds 2014 2013 £m £m
Profit for the year 437.1 143.6 Equity dividends paid in the year (52.3) (47.7) Share-based payments 2.2 2.3 Share options exercised from own shares (treasury) purchased 0.3 0.3 Exchange gain on net investment hedging of foreign operations 9.3 –
Net increase/(decrease) in equity shareholders’ funds 396.6 98.5 Opening equity shareholders’ funds 554.8 456.3
Closing equity shareholders’ funds 951.4 554.8
Notes to the Company Accounts continued
Strategic Report 01–41 Governance 42–74 Financial Statements 75–131
131Spectris plc Annual Report and Accounts 2014
Notes to the Company Accounts continued
46. Pensions
The Company operates the Spectris Pension Plan, a UK defined benefit pension plan that is closed to new members. Further details of the Spectris Pension Plan are contained in Note 19 to the Group Consolidated Financial Statements. The Company is unable to identify its share of the Plan’s underlying assets and liabilities and therefore accounts for the Plan as a defined contribution scheme. Contributions paid in the year to the Spectris Pension Plan were £nil (2013: £nil). Contributions paid in the year to defined contribution plans were £0.2m (2013: £0.2m).
47. Related party disclosuresThe Company has taken advantage of the exemption under FRS 8 ‘Related Party Disclosures’ not to disclose related party transactions between the Company and wholly-owned subsidiaries.
There are no material transactions with Directors and other related parties of the Company except those relating to remuneration and share dealing disclosed in the Directors’ Remuneration Report within this Annual Report.
48. Contingent liabilities
There are no contingent liabilities as at the year end. The cross guarantee arrangements to support trade finance facilities are stated in Note 28 of the Group Consolidated Financial Statements.

Strategic Report 01–41 Governance 42–74 Financial Statements 75–131
132Spectris plc Annual Report and Accounts 2014
Shareholder Information
Financial calendar
Annual General Meeting24 April 2015
Record date for 2014 final dividend29 May 2015
2014 final dividend payable26 June 2015
2015 interim results30 July 2015
2015 preliminary resultsFebruary 2016
Company SecretaryR J Stephens, FCIS
Head of Corporate AffairsMatt Jones
Email: [email protected]
Registered officeSpectris plc Heritage House Church Road Egham Surrey TW20 9QD England
Tel: +44 (0)1784 470470 Email: [email protected]
Company registered in England, No. 2025003
AuditorsKPMG LLP
BankersRoyal Bank of Scotland Plc
SolicitorsMacfarlanes LLP
BrokersJefferies Hoare Govett J P Morgan Cazenove
Financial PR advisersFTI Consulting
RegistrarsEquiniti Limited Aspect House Spencer Road Lancing West Sussex BN99 6DA
The registrars provide a range of shareholder services online at www.shareview.co.uk
Share price informationThe Company’s ordinary shares are listed on the London Stock Exchange. The latest share price is available via the Company’s website at www.spectris.com
Email news serviceTo receive details of press releases and other announcements as they are issued, register with the email alert service on the Company’s website at www.spectris.com

‘Spectris’ is a trademark of Spectris plc and is protected by registration in the United Kingdom and other jurisdictions. Other product names referred to in this Annual Report are registered or unregistered trademarks or registered names of Spectris plc or its subsidiary companies and are similarly protected.
Printed on Revive 50:50 Silk, a recycled paper containing 50% recycled waste and 50% virgin fibre which is manufactured at a mill certified with ISO 14001 environmental management standard. The pulp used in this product is bleached using an elemental chlorine free process (‘ECF’).
© Spectris plc March 2015
Report designed and produced by Bostock and Pollitt Limited, London
Print production by ArbiterDrucken

Spectris plcHeritage House Church Road Egham Surrey TW20 9QD England
T: +44 (0)1784 470470 F: +44 (0)1784 470848 [email protected] www.spectris.com
For more information or to download an interactive PDF of this report, visit www.spectris.com