senior plc annual report & accounts 2017/media/files/s/senior-plc/report… · ·...
TRANSCRIPT
SENIOR PLCANNUAL REPORT & ACCOUNTS 2017

Senior is an international, market-leading, engineering solutions provider with 33 operations in 14 countries.
Senior designs, manufactures and markets high-technology components and systems for the principal original equipment producers in the worldwide aerospace, defence, land vehicle and energy markets.
The Group is split into two divisions, Aerospace and Flexonics, servicing five key sectors.
To find out more visit seniorplc.com
Cautionary statementThe Annual Report & Accounts 2017 contains certain forward-looking statements. Such statements are made by the Directors in good faith based on the information available to them at the date of this Report and they should be treated with caution due to the inherent uncertainties underlying any such forward-looking statements.
(1) A reconciliation of adjusted profit before tax to profit before tax is shown in Note 9.(2) A reconciliation of adjusted earnings per share to basic earnings per share is shown in Note 12.(3) See Notes 32b and 32c for the derivation of free cash flow and of net debt respectively.(4) Adjusted operating margin is the ratio of adjusted operating profit to revenue. A reconciliation of adjusted
operating profit to operating profit is shown in Note 9.(5) See page 34 for the derivation of return on capital employed.
The Group’s principal exchange rate for the US Dollar applied in the translation of revenue, profit and cash flow items at average rates for 2017 was $1.29 (2016 – $1.36). The US Dollar exchange rate applied to the balance sheet at 31 December 2017 was $1.35 (2016 –$1.24).
SENIOR PLC ANNUAL REPORT & ACCOUNTS 2017 1
ST
RA
TE
GIC
RE
PO
RT
GO
VE
RN
AN
CE
FINA
NC
IAL S
TAT
EM
EN
TS
AD
DIT
ION
AL IN
FOR
MA
TIO
N
WHO WE ARE FINANCIAL HIGHLIGHTS
FREE CASH
FLOW(3)
£58.3m(2016 – £48.5m)
NET DEBT(3)
£155.3m(2016 – £198.1m)
+20%
REVENUE
£1,023.4m(2016 – £917.0m)
ADJUSTED OPERATING MARGIN(4)
8.1%(2016 – 9.3%)
+12% -1.2ppts
ADJUSTED PROFIT
BEFORE TAX(1)
£73.1m(2016 – £75.3m)
PROFIT
BEFORE TAX
£52.2m(2016 – £55.5m)
-3% -6%
ADJUSTED EARNINGS
PER SHARE(2)
14.39p(2016 – 14.37p)
BASIC EARNINGS PER SHARE
14.39p(2016 – 10.84p)
nil +33%
DIVIDENDS PER SHARE
6.95p(2016 – 6.57p)
RETURN ON CAPITAL EMPLOYED(5)
11.9%(2016 – 12.9%)
+6% -1.0ppt
STRATEGIC REPORT1 Financial Highlights2 Group at a Glance3 Where We Operate4 2017 at a Glance6 Chairman’s Statement8 Chief Executive’s Statement11 Investment Case12 Market Overview14 Our Business Model16 Strategic Priorities18 2017 Performance20 Financial Review24 Risks and Uncertainties30 Corporate Responsibility34 Key Performance Indicators
GOVERNANCE36 Board of Directors38 Executive and HSE Committees40 Report of the Directors 42 Corporate Governance Report45 Nominations Committee Report46 Audit Committee Report51 Remuneration Report: Annual Statement53 2017 Remuneration Report at a Glance55 Remuneration Report: Policy61 Annual Report on Remuneration71 Statement of Directors’ Responsibilities72 Independent Auditor’s Report to the
Members of Senior plc
FINANCIAL STATEMENTS76 Consolidated Income Statement76 Consolidated Statement of
Comprehensive Income77 Consolidated Balance Sheet78 Consolidated Statement of Changes
in Equity79 Consolidated Cash Flow Statement80 Notes to the Consolidated
Financial Statements113 Company Balance Sheet114 Company Statement of Changes in Equity115 Notes to the Company Financial
Statements120 Five-year Summary
ADDITIONAL INFORMATION121 Group Undertakings124 Additional Shareholder InformationIBC 2018 Financial CalendarIBC Officers and Advisers

(1) At constant currency
(2) A reconciliation of adjusted operating profit to operating profit is shown in Note 9.
(3) Adjusted operating margin is the ratio of adjusted operating profit (2) to revenue.
SENIOR PLC ANNUAL REPORT & ACCOUNTS 2017 3
ST
RA
TE
GIC
RE
PO
RT
GO
VE
RN
AN
CE
FINA
NC
IAL S
TAT
EM
EN
TS
AD
DIT
ION
AL IN
FOR
MA
TIO
N
2 SENIOR PLC ANNUAL REPORT & ACCOUNTS 2017
STRATEGIC REPORT
6.7%(3)
£20.0m (-10%)(2)
2,766
29%
£298.8m (+12%)(1)
ADJUSTEDOPERATINGPROFIT(2)
ADJUSTEDOPERATINGMARGIN(3)
EMPLOYEESWORLDWIDE
REVENUE
GROUPREVENUE
GROUP AT A GLANCE
The Group aims to create long-term sustainable growth in shareholder value through a culture of empowerment of autonomous and collaborative operations working within an effective control framework. Our vision is to be a trusted and collaborative high value-added engineering and manufacturing company producing sustainable growth in operating profit, cash flow and shareholder value.
7,696EMPLOYEES
33WORLDWIDE OPERATIONS
14COUNTRIES WE OPERATE IN
AEROSPACEServing both the commercial aerospace and defence markets with a range of products and systems for structures, fluid conveyance, and gas turbine engines.
MARKETS CUSTOMERS
STRUCTURES• Precision-machined airframe
components and assemblies
FLUID CONVEYANCE SYSTEMS• High-pressure and low-pressure engineered
ducting systems (metal and composite)
• Engineered control bellows, sensors and assemblies
GAS TURBINE ENGINES• Precision-machined and fabricated engine
components (rotating and structural)
• Fluid systems ducting and control products
71%AEROSPACE DIVISION
MARKETS CUSTOMERS
LAND VEHICLE EMISSION CONTROL• Exhaust gas recycling coolers
• Fuel mixing and distribution systems
• Flexible couplings
INDUSTRIAL PROCESS CONTROL• Engineered expansion joints, dampers and diverters
• Flexible hose assemblies and control bellows
• Fuel cells and heat exchangers
• Precision-machined components
AEROSPACE/ FLEXONICS
North America 10 4Brazil 1Continental Europe 3 3UK 4 2South Africa 1India 1Malaysia 1 1Thailand 1China 1
FLEXONICSServing markets with products for land vehicle emission control and industrial process control applications.
29%FLEXONICS DIVISION
WHERE WE OPERATE
45% Large Commercial Aircraft
12% Military/Defence Aerospace
7% Regional & Business Jets
2% Space & Non-Military Helicopter
5% Other Aerospace Division
11% Rolls-Royce
10% Boeing
10% Spirit
3% UTC
3% Lockheed Martin
3% Safran
2% Airbus
2% Bombardier
2% GKN
23% Other Aerospace Division
1% GE
1% Honeywell
10% Truck & Off-Highway
6% Oil & Gas
5% Passenger Vehicles
3% Power & Energy
1% Heating, Ventilation & Solar
4% Other Industrial
4% Other Land Vehicle
2% Schlumberger
1% Emerson
11% Other Industrial & Aerospace
4% Cummins
3% Caterpillar
1% Renault
1% Faurecia
1% Sauer Danfoss
1% PSA
71%
10.6%(3)
£725.3m (+4%)(1)
£76.6m (-2%)(2)
4,893
ADJUSTEDOPERATING
PROFIT(2)
ADJUSTEDOPERATING
MARGIN(3)
EMPLOYEESWORLDWIDE
REVENUE
GROUPREVENUE

SENIOR PLC ANNUAL REPORT & ACCOUNTS 2017 5
ST
RA
TE
GIC
RE
PO
RT
AD
DIT
ION
AL IN
FOR
MA
TIO
NFIN
AN
CIA
L STA
TE
ME
NT
SG
OV
ER
NA
NC
E
SENIOR PLC ANNUAL REPORT & ACCOUNTS 2017 5
STRATEGIC REPORT
4 SENIOR PLC ANNUAL REPORT & ACCOUNTS 2017
2017 AT A GLANCE
During 2017, the Group made good progress in the six areas of strategic priorities. Here is a selection of highlights from the year. Further details on our 2017 achievements and our plans for 2018 are on pages 16 to 17.
BWT INTRODUCES RT2i™Senior Aerospace BWT in Cheshire, UK opened a dedicated RT2i™ Composites Ducting Development Centre focused on a new generation of thermoplastic composite products using RT2i™ technology. This technology targets cost and weight reductions using net-shape dry fibre textiles incorporating complex 3D design features and has the potential for numerous applications across many market sectors.
SENIOR DOUBLES CAPACITY IN CZECH REPUBLICAs part of Senior’s cost competitive country strategy, Senior opened a 45,000 sq. feet expansion in December 2017 at its highly efficient Senior Flexonics Olomouc facility. This strategic investment of £3.5m supports organic growth, new business opportunities in land vehicle markets and optimises production flow for operational excellence.
T-DUCT COLLABORATIONIn 2017 a new high pressure ‘’T Duct’’ was installed on the A330 Neo Pylon for the Bleed Air System. This product is a great example of the collaboration between Senior operating businesses. It was designed by Calorstat (France), received engineering support from SSP (USA-California) and manufactured by both Calorstat (France) and Bosman (Netherlands). The whole assembly will be supplied directly to Airbus when in production.
SENIOR OPERATING SYSTEM LAUNCHED2017 was a year of Operational Excellence advancement at Senior. The Senior Operating System was launched in the Aerospace Structures division. This was complemented by five regional Senior Operating System lean bootcamps which enhanced the collaborative approach that is at the core of Seniors operations. This intensive training focused on developing site expertise in a variety of lean manufacturing tools and sharing this across the Group. Using the standardised tools within the Senior Operating System, all divisions of Senior will benefit through a more collaborative approach. The main benefits from the Senior Operating System will lower costs, improve margins and reduce inventory.

SENIOR PLC ANNUAL REPORT & ACCOUNTS 2017 7
ST
RA
TE
GIC
RE
PO
RT
GO
VE
RN
AN
CE
FINA
NC
IAL S
TAT
EM
EN
TS
AD
DIT
ION
AL IN
FOR
MA
TIO
NSTRATEGIC REPORT
CHAIRMAN’S STATEMENT
2017 PERFORMANCESenior delivered revenue of £1,023.4m, up 11.6% over the prior year, or 6.3% up on a constant currency basis, driven by sales growth across both Aerospace and Flexonics Divisions. Adjusted profit before tax decreased to £73.1m, down 2.9%, or 8.6% on a constant currency basis, over the prior year. As anticipated, Aerospace Division margins were impacted by the transition from more mature to new aircraft production programmes and margins in the Flexonics Division reflected some of the challenging market conditions in the higher margin segments of the Division. Adjusted earnings per share increased by 0.1% to 14.39 pence.
Group cash generation continued to be healthy, with free cash flow of £58.3m for the year resulting in a strong financial position for the Group at the end of 2017.
DIVIDENDThe Board is proposing a final dividend of 4.90 pence per share which would bring total dividends, paid and proposed, for 2017 to 6.95 pence per share. The increase of 5.8% over 2016 reflects the Group’s encouraging prospects and dividend cover of 2.1 times adjusted earnings per share.
GOVERNANCEThe Board, in recognising the importance of setting the right tone from the top of the organisation, implemented a governance framework encompassing Group Policies, the Code of Conduct and delegated authorities appropriate to the Group’s strategy and the Board’s risk appetite. During 2017, the Group continued with Anti-Bribery and Corruption Act training. The Board has continued to maintain oversight of capital allocation, performance and risk management. During 2017, further improvements were made to enhance the robustness of the Group’s risk management process, including the introduction of a common risk list and closer tracking of closure of mitigating actions. These have been explained on pages 24 to 29 of this Annual Report.
SAFETYAs a Board we are committed to the safety and well-being of our employees. Our goal is to eliminate occupational injury and illness through our Zero Harm strategy so everyone returns home safely at the end of the day. The Board has established ambitious 2020 targets for improvements in safety and environmental impact. In 2017 we made substantial progress towards these goals with a 28% reduction in our lost time injury rate and a 23% reduction in our total recordable injury rate. In addition we established a bespoke behavioural safety standard applicable to all employees called our “Essential Behaviours for health and safety”.
SUSTAINABILITYEnvironmental stewardship and corporate responsibility are increasingly important to our investors, customers and employees. Operating with integrity in an ethical, environmentally and socially sustainable manner is core to the future success of the Group. During 2017 we made substantial progress towards our 2020 Sustainability targets with a reduction in our tonnes of carbon emitted by 18% and more than 90% of the waste generated by our whole business is now recycled. Further details can be found on pages 30 to 33 of this Annual Report.
THE BOARDAs previously announced, Bindi Foyle joined the Board on 3 May 2017 and became Group Finance Director on 1 July 2017 following the departure of Derek Harding from the Board on 30 June 2017. Prior to this, Bindi was the Director of Investor Relations and Corporate Communications, having previously been the Group Financial Controller since joining Senior in 2006.
On 13 November this year, the Board announced the forthcoming appointment of Ian King as Chairman of the Group upon my retirement. Ian brings extensive experience of the aerospace and defence sector and possesses the right skills, industry experience and values to lead the Board through the next phase of the Group’s development. He joined the Board as a non-executive Director on 13 November 2017, with the intention of taking over as Chairman at the conclusion of the Group’s next Annual General Meeting in April 2018.
OUR PEOPLESenior’s continued strength is a reflection of the quality of the people within the Group. At the end of 2017, Senior employed 7,696 people with 3,202 located in North America, 2,647 in Europe, 1,530 in Asia and 317 in the rest of the world reflecting the global footprint of the Group. The Board and Executive strongly believe that wide diversity and inclusion is vital to a healthy business. We are proud of our diverse workforce and have set ambitious goals to improve gender diversity in the Senior population. On behalf of the Board, I would like to thank all of the Group’s employees for their substantial contribution to Senior over the past year.
STRATEGYThe Group’s primary objective is to create long-term sustainable growth in shareholder value. We aim to achieve this through a culture of empowerment of autonomous and collaborative operations working within an effective control framework. Senior’s high value-added engineering manufacturing companies operate within its five market sector framework: three in the Aerospace Division (Fluid Conveyance Systems, Gas Turbine Engines and Structures) and two in the Flexonics Division (Land Vehicle Emission Control and Industrial Process Control), with each market sector offering deliverable growth opportunities.
The Group’s strategy, whilst retaining flexibility as market conditions change, continues to provide a solid foundation for Senior’s future growth aspirations.
Finally, it has been a privilege to serve as Chairman of your Board for the last six years and I wish the Company every success in the future.
Charles Berry Chairman
SOLID PERFORMANCE IN 2017 WHICH CONTINUES TO POSITION SENIOR FOR FUTURE GROWTH
DIVIDEND GROWTH
6%Increase in paid and proposed dividends.
SAFETY IMPROVEMENT
28%Improvement in lost time incident rate.
EMPLOYEES
7,696Employees worldwide.
OUR CULTURE AND VALUESOur culture is one of autonomous collaboration.
This means that we encourage and retain an entrepreneurial spirit whilst operating within a strong control framework with disciplined governance. Importantly, the empowerment we devolve to divisions and operating businesses comes with clear accountability. This is all underpinned by our values and our “tell it as it is” philosophy along with openness and transparency in our interactions with all stakeholders.
CHARLES BERRY CHAIRMAN
VALUES
SAFETYWe operate safely, protecting people and the environment
INTEGRITYWe operate with integrity and in an ethical manner
CUSTOMER FOCUSWe put the customer at the heart of everything we do
RESPECT AND TRUSTWe work together with mutual respect and trust
ACCOUNTABILITYWe do what we say
EXCELLENCEWe continually strive to do better in every aspect of our business
SENIOR PLC ANNUAL REPORT & ACCOUNTS 2017 9
ST
RA
TE
GIC
RE
PO
RT
GO
VE
RN
AN
CE
FINA
NC
IAL S
TAT
EM
EN
TS
AD
DIT
ION
AL IN
FOR
MA
TIO
NSTRATEGIC REPORT
CHIEF EXECUTIVE’S STATEMENT
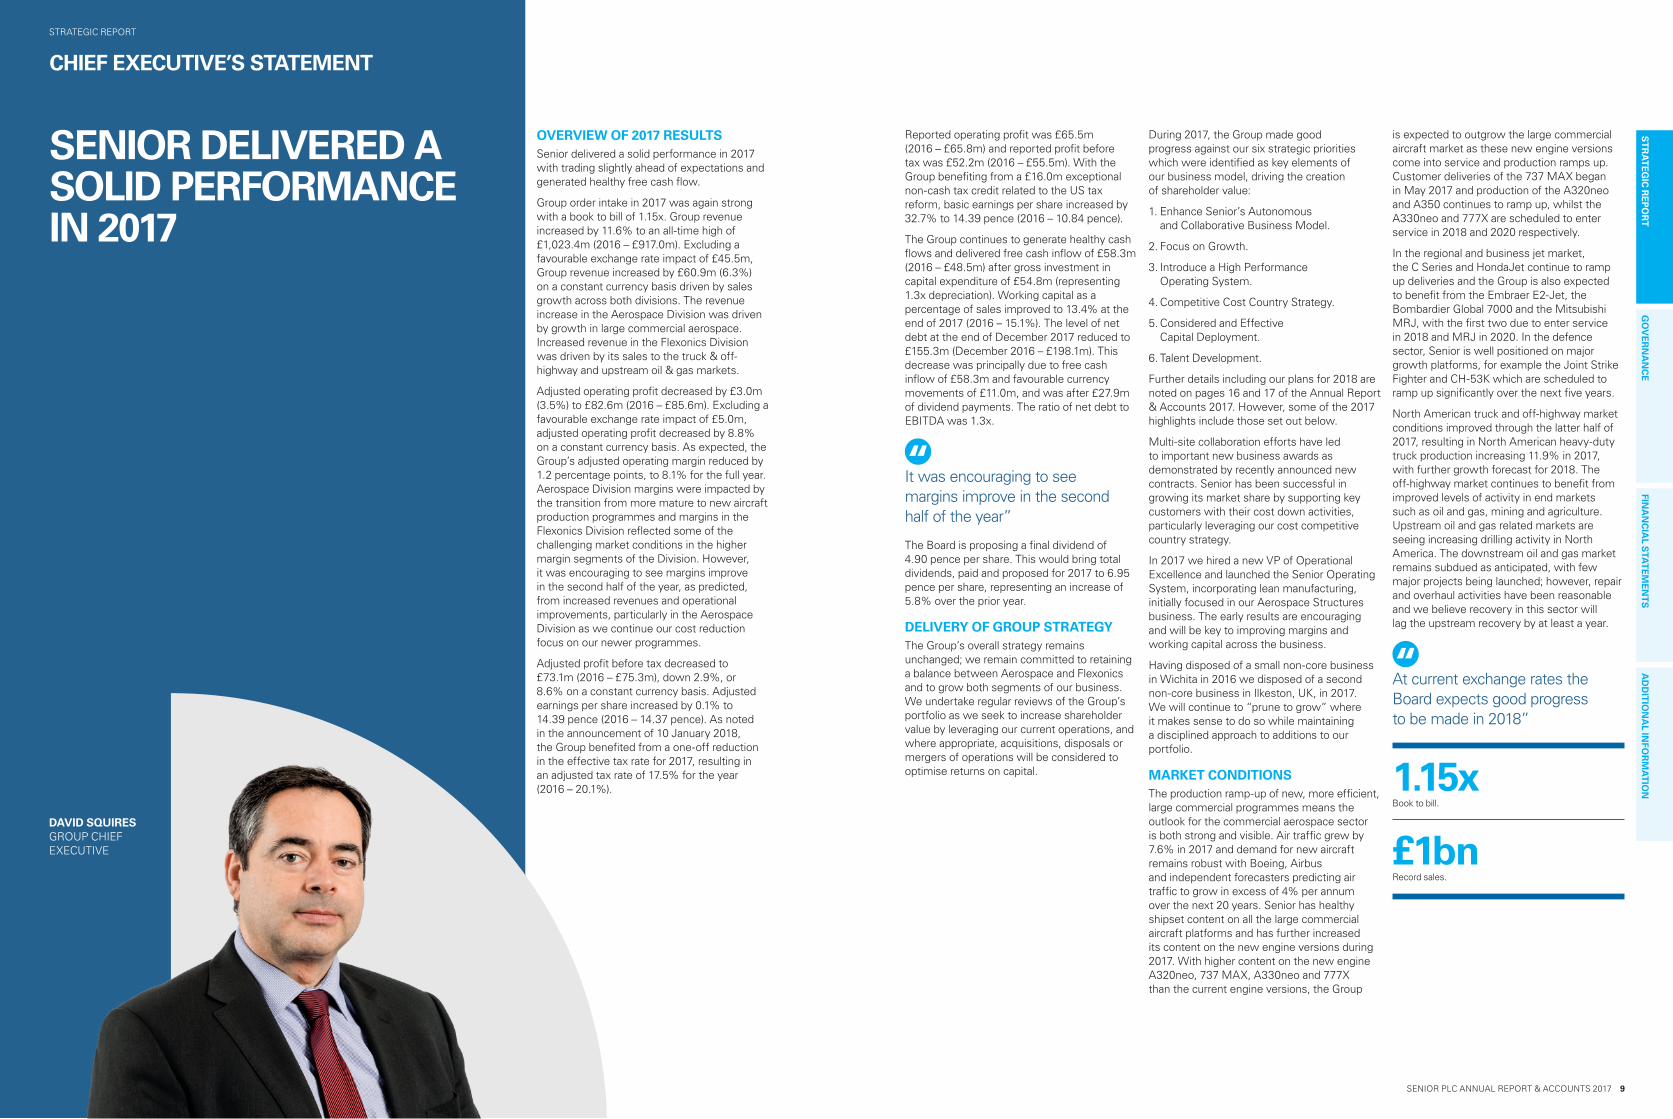
DAVID SQUIRES GROUP CHIEF EXECUTIVE
SENIOR DELIVERED A SOLID PERFORMANCE IN 2017
Reported operating profit was £65.5m (2016 – £65.8m) and reported profit before tax was £52.2m (2016 – £55.5m). With the Group benefiting from a £16.0m exceptional non-cash tax credit related to the US tax reform, basic earnings per share increased by 32.7% to 14.39 pence (2016 – 10.84 pence).
The Group continues to generate healthy cash flows and delivered free cash inflow of £58.3m (2016 – £48.5m) after gross investment in capital expenditure of £54.8m (representing 1.3x depreciation). Working capital as a percentage of sales improved to 13.4% at the end of 2017 (2016 – 15.1%). The level of net debt at the end of December 2017 reduced to £155.3m (December 2016 – £198.1m). This decrease was principally due to free cash inflow of £58.3m and favourable currency movements of £11.0m, and was after £27.9m of dividend payments. The ratio of net debt to EBITDA was 1.3x.
It was encouraging to see margins improve in the second half of the year”
The Board is proposing a final dividend of 4.90 pence per share. This would bring total dividends, paid and proposed for 2017 to 6.95 pence per share, representing an increase of 5.8% over the prior year.
DELIVERY OF GROUP STRATEGYThe Group’s overall strategy remains unchanged; we remain committed to retaining a balance between Aerospace and Flexonics and to grow both segments of our business. We undertake regular reviews of the Group’s portfolio as we seek to increase shareholder value by leveraging our current operations, and where appropriate, acquisitions, disposals or mergers of operations will be considered to optimise returns on capital.
During 2017, the Group made good progress against our six strategic priorities which were identified as key elements of our business model, driving the creation of shareholder value:
1. Enhance Senior’s Autonomous and Collaborative Business Model.
2. Focus on Growth.
3. Introduce a High Performance Operating System.
4. Competitive Cost Country Strategy.
5. Considered and Effective Capital Deployment.
6. Talent Development.
Further details including our plans for 2018 are noted on pages 16 and 17 of the Annual Report & Accounts 2017. However, some of the 2017 highlights include those set out below.
Multi-site collaboration efforts have led to important new business awards as demonstrated by recently announced new contracts. Senior has been successful in growing its market share by supporting key customers with their cost down activities, particularly leveraging our cost competitive country strategy.
In 2017 we hired a new VP of Operational Excellence and launched the Senior Operating System, incorporating lean manufacturing, initially focused in our Aerospace Structures business. The early results are encouraging and will be key to improving margins and working capital across the business.
Having disposed of a small non-core business in Wichita in 2016 we disposed of a second non-core business in Ilkeston, UK, in 2017. We will continue to “prune to grow” where it makes sense to do so while maintaining a disciplined approach to additions to our portfolio.
MARKET CONDITIONSThe production ramp-up of new, more efficient, large commercial programmes means the outlook for the commercial aerospace sector is both strong and visible. Air traffic grew by 7.6% in 2017 and demand for new aircraft remains robust with Boeing, Airbus and independent forecasters predicting air traffic to grow in excess of 4% per annum over the next 20 years. Senior has healthy shipset content on all the large commercial aircraft platforms and has further increased its content on the new engine versions during 2017. With higher content on the new engine A320neo, 737 MAX, A330neo and 777X than the current engine versions, the Group
OVERVIEW OF 2017 RESULTSSenior delivered a solid performance in 2017 with trading slightly ahead of expectations and generated healthy free cash flow.
Group order intake in 2017 was again strong with a book to bill of 1.15x. Group revenue increased by 11.6% to an all-time high of £1,023.4m (2016 – £917.0m). Excluding a favourable exchange rate impact of £45.5m, Group revenue increased by £60.9m (6.3%) on a constant currency basis driven by sales growth across both divisions. The revenue increase in the Aerospace Division was driven by growth in large commercial aerospace. Increased revenue in the Flexonics Division was driven by its sales to the truck & off-highway and upstream oil & gas markets.
Adjusted operating profit decreased by £3.0m (3.5%) to £82.6m (2016 – £85.6m). Excluding a favourable exchange rate impact of £5.0m, adjusted operating profit decreased by 8.8% on a constant currency basis. As expected, the Group’s adjusted operating margin reduced by 1.2 percentage points, to 8.1% for the full year. Aerospace Division margins were impacted by the transition from more mature to new aircraft production programmes and margins in the Flexonics Division reflected some of the challenging market conditions in the higher margin segments of the Division. However, it was encouraging to see margins improve in the second half of the year, as predicted, from increased revenues and operational improvements, particularly in the Aerospace Division as we continue our cost reduction focus on our newer programmes.
Adjusted profit before tax decreased to £73.1m (2016 – £75.3m), down 2.9%, or 8.6% on a constant currency basis. Adjusted earnings per share increased by 0.1% to 14.39 pence (2016 – 14.37 pence). As noted in the announcement of 10 January 2018, the Group benefited from a one-off reduction in the effective tax rate for 2017, resulting in an adjusted tax rate of 17.5% for the year (2016 – 20.1%).
is expected to outgrow the large commercial aircraft market as these new engine versions come into service and production ramps up. Customer deliveries of the 737 MAX began in May 2017 and production of the A320neo and A350 continues to ramp up, whilst the A330neo and 777X are scheduled to enter service in 2018 and 2020 respectively.
In the regional and business jet market, the C Series and HondaJet continue to ramp up deliveries and the Group is also expected to benefit from the Embraer E2-Jet, the Bombardier Global 7000 and the Mitsubishi MRJ, with the first two due to enter service in 2018 and MRJ in 2020. In the defence sector, Senior is well positioned on major growth platforms, for example the Joint Strike Fighter and CH-53K which are scheduled to ramp up significantly over the next five years.
North American truck and off-highway market conditions improved through the latter half of 2017, resulting in North American heavy-duty truck production increasing 11.9% in 2017, with further growth forecast for 2018. The off-highway market continues to benefit from improved levels of activity in end markets such as oil and gas, mining and agriculture. Upstream oil and gas related markets are seeing increasing drilling activity in North America. The downstream oil and gas market remains subdued as anticipated, with few major projects being launched; however, repair and overhaul activities have been reasonable and we believe recovery in this sector will lag the upstream recovery by at least a year.
At current exchange rates the Board expects good progress to be made in 2018”
1.15xBook to bill.
£1bnRecord sales.

ST
RA
TE
GIC
RE
PO
RT
GO
VE
RN
AN
CE
FINA
NC
IAL S
TAT
EM
EN
TS
AD
DIT
ION
AL IN
FOR
MA
TIO
N
10 SENIOR PLC ANNUAL REPORT & ACCOUNTS 2017
STRATEGIC REPORT
SENIOR PLC ANNUAL REPORT & ACCOUNTS 2017 11
CHIEF EXECUTIVE’S STATEMENT CONTINUED
OPERATIONAL REVIEWWe are continuing to invest in capacity in our existing cost competitive country locations for both our Flexonics and Aerospace businesses to enable us to meet increasing order levels from our customers and to ensure we remain competitive and profitable. In December 2017 we opened an extension to our highly efficient Flexonics plant in the Czech Republic to support organic growth and new business opportunities. As a direct consequence of winning new commercial aerospace business, work has commenced on adding a new Aerospace factory in Malaysia, close to our existing operations, and is anticipated to be completed towards the end of 2018. Additionally, we are reviewing capacity plans in our Flexonics India business and our Flexonics JV in China as both these facilities have continued to win new long-term business. We plan to relocate our Crumlin South Wales operation to a smaller high-tech facility with building commencing in 2018 and completing in 2019. The new facility will focus on design, development, test and qualification of new products, which will be built around the world in our existing cost competitive locations. In North America, our Aerospace Fluid Systems Metal Bellows business continues to perform well and we will be expanding their facility in Massachusetts for planned growth.
Good progress has been made in 2017 to further reduce costs, particularly in reducing both labour and material costs on some of our largest new aerospace programmes. Cost reductions are being achieved through our lean manufacturing programme and through the use of the state-of-the-art high speed and high performance equipment that we have been investing in. We launched our Senior Operating System in our Aerospace Structures businesses and held targeted performance improvement workshops. The early benefits of these actions, together with increased revenue, delivered improved margins in the second half of 2017 for the Group. We will continue to see the benefits of these actions incrementally helping margins in 2018 and beyond.
OUTLOOK2018 trading has started in line with expectations. Order books across most of our businesses are strong. Although our Flexonics businesses, which are exposed to downstream oil and gas and power and energy markets, remain at subdued levels, we expect to see improved performance in both divisions. Overall, at current exchange rates, the Board expects good progress to be made in 2018 with performance slightly weighted to the second half.
Looking further ahead, Senior expects to continue to make good progress as new programmes and products continue to ramp up, and as the benefits of the implementation of the high performance Senior Operating System and cost saving actions continue to be delivered. Senior is competitively positioned with exposure to strong growing end markets which enable it to grow organically on a sustainable basis. Furthermore, Senior’s cash-generative nature and robust financial position provide a solid platform from which the Group can continue to pursue growth opportunities to complement its existing portfolio.
David Squires Group Chief Executive
A DIFFERENTIATED BUSINESS MODEL • Design, manufacture and market high-technology
components and systems for principal original equipment manufacturers (OEM’s)
• Specialists in providing engineering solutions to customers for fluid systems and structural products and systems
• Integrated global footprint operating in the aerospace, defence, land vehicle and energy markets
• Autonomous and collaborative culture enables entrepreneurial approach within a strong control framework
• Strong and enduring relationships with key customers built on technical innovation and excellent operational performance
READ MORE ON PAGES 14 AND 15
INVESTMENT CASE
Engineering solutions provider with a solid platform for sustainable growth in profitability, cash flow and shareholder value.
LEADING POSITIONS IN ATTRACTIVE MARKETS Focus on attractive, growing end markets:
• Commercial aerospace – Long-term growth trends from increasing air traffic
driving need for new and replacement aircraft
• US military aerospace – Defence remains a priority for the US,
key positions on major funded programmes
• Land vehicle – Demand driven by tightening global emission
control regulations for truck, off-highway and passenger vehicles
• Petrochem, Power and Energy – Market leader of complex fluid systems
and products
READ MORE ON PAGES 12 AND 13
STRATEGIC PRIORITIES• Focus on growth through innovation and operational
excellence for our customers
• Implement and embed high performance operating system across the Group to optimise profitability and returns on capital
• Established global cost competitive country strategy
• Continuously invest in the best leadership talent
READ MORE ON PAGES 16 AND 17
LONG-TERM GROWTH AND VALUE CREATION• Primary strategic objective to create long-term
sustainable growth in shareholder value
• Considered and effective capital deployment to maximise returns
• Robust financial platform and cash-generative nature
• Actively manage the portfolio; disciplined acquisition and ‘prune to grow’ strategy
READ MORE ON PAGES 14 TO 17

SENIOR PLC ANNUAL REPORT & ACCOUNTS 2017 13
ST
RA
TE
GIC
RE
PO
RT
GO
VE
RN
AN
CE
FINA
NC
IAL S
TAT
EM
EN
TS
AD
DIT
ION
AL IN
FOR
MA
TIO
N
12 SENIOR PLC ANNUAL REPORT & ACCOUNTS 2017
STRATEGIC REPORT
SHIPSET VALUE(1) PROGRESSION – LARGE COMMERCIAL AIRCRAFT
ESTIMATED ANNUAL PROD UCTION GLOBAL EMISSIONS STANDARDS OIL PRICE AND US RIG COUNT
WORLD AIR TRAFFIC WORLD ENERGY DEMAND
LAND VEHICLE PRODUCTION FORECAST
0
50
100
150
200
250
300
350
SOURCE: ACT Research
20172016
Thou
sand
s
202020192018
North American Class 8 Trucks
0
100
200
300
400
500
600
700
800
900
1,000
Share of T1000 adjusted to 50%
737 MAX A320neo A350787 A330neo777X
+8%
+93% -2%
+6%
+11%
+26%
(1) Average based on programme share and estimated engine variant
$000
s
Dec 06Dec 07
Dec 08Dec 09
Dec 10
Dec 11Dec 12Dec 13
Dec 14Dec 15
Dec 16Dec 17
% CAGR
0
100
200
300
400
500
600
700
800
SOURCE: Customers, Teal Group and internal estimates(1) Estimates include 737 MAX and A320neo respectively
20182017 2019 2020
737(1)
787A320(1)
A350
+29%+26%
+6%+73%
Num
ber o
f airc
raft
ICAO total traffic
Air traffic is forecast to double in the next 15 years
Airbus GMF 2017:4.4% growth p.a.
x2
SOURCE: ICAO, Airbus GMF 2017
Wor
ld a
nnua
l tra
ffic
(trill
ion
RP
Ks)
1996 2001 20061976 1981 1986 1991 2011 2016 2021 2026 2031 2036
x2
x2
0
2
4
6
8
10
12
16
14
18
0
20
40
60
80
100
120
SOURCE: Rig count data from Baker Hughes
2014
Inde
x
Oil price
US rig count
2015 2016 2017
0
2
4
6
8
10
12
14
16
18
20
SOURCE: BP Energy Outlook 2035
19951990
Bill
ion
tonn
es o
f oil
equi
vale
nt
OECDAfrica and Middle East
China India Rest of Asia
2000 20102005 20352015 2020 2025 2030
Other
MARKET OVERVIEW
Senior designs, manufactures and markets high-technology components and systems for the principal original equipment producers in the worldwide aerospace, defence, land vehicle and energy markets.
AEROSPACE KEY MARKETSLarge Commercial Aircraft (45% of Group)Senior continues to benefit from strong demand in the large commercial aircraft sector due to healthier global air traffic growth. At current build rates, Boeing and Airbus order books represent over eight years’ production. Senior maintains a healthy shipset content on all the key large commercial aircraft platforms and will continue to benefit from expected increases in build rates of all the key platforms. Senior has managed to secure significantly higher content on the new engine versions of the leading narrow-bodied aircraft than the current versions. This allows the Group to outgrow the market, as these new engine versions come into service and production ramps up.
FLEXONICS KEY MARKETSLand Vehicles (15% of Group)The increasingly stringent global requirements for reduced carbon emissions influences the demand for the majority of the Group’s products in the land vehicles market which arises in the form of reduction targets for emissions from cars, trucks and off-highway vehicles and through increased fuel efficiency from their engines. The chart below highlights the deployment of emissions standards in major geographies.
In the truck and off-highway sector (10% of Group), Senior’s revenue arises predominantly from North America, where the heavy-duty truck and off-highway markets are seeing some improved activity. Production of North
The chart below illustrates the growth in Senior’s shipset values over the past 12 years and the estimated annual production volumes of the major platforms.
Forecast annual growth in global passenger air traffic is a significant driver of demand for new commercial aircraft, and hence for many of Senior’s core aerospace products. Boeing and Airbus are predicting air traffic to grow in excess of 4% per annum over the next 20 years.
Regional and Business Jets (7% of Group)Senior has significantly higher shipset content on new regional jet platforms such as the Bombardier CSeries, Mitsubishi MRJ and Embraer E2-Jet than legacy regional jets; therefore, the Group’s regional jet market (3% of Group) revenue is expected to benefit in the medium term.
In the regional and business jet market, the C-Series and Honda Jet continue to ramp up deliveries and the Group is also expected to
American heavy-duty trucks is anticipated to improve in the medium to longer term as demand for replacement capacity is driven by regulatory changes. The off-highway market continues to benefit from improved levels of activity in end markets such as oil and gas, mining and agriculture.
In the passenger car sector (5% of Group), Senior’s revenue arises predominantly from European markets. This market sector is forecast to remain stable in the medium term.
In the medium to longer term, as a result of growth in GDP and as emissions regulations continue to tighten demand for the Group’s products in the land vehicle sectors is anticipated to increase, particularly in geographies outside of North America and Europe. Senior is developing solutions for the next generation of more efficient internal combustion engines, as well as electrified land vehicle applications.
benefit from the Embraer E2-Jet, the Bombardier Global 7000 and the Mitsubishi MRJ, with the first two due to enter service in 2018 and MRJ in 2020.
Military Aerospace (12% of Group)European and US defence budgets are growing as a result of increased geopolitical tensions and Senior’s revenue from the military and defence sector is expected to benefit from the F-35 Joint Strike Fighter and CH53-K, which is scheduled to ramp up significantly over the next five years. Production of the Black Hawk helicopter is expected to decrease over the short to medium term as the global helicopter market remains weak.
Industrial (13% of Group)Senior designs and manufactures products for global industrial process control markets including petrochemical, HVAC and power and energy markets, to meet an increasingly stringent regulatory environment. In the upstream oil and gas market we are continuing to see improved activity. However, downstream oil and gas market remains subdued as anticipated, with few major projects being launched; however, repair and overhaul activities have been reasonable and we believe recovery in this sector will lag the upstream recovery by at least a year.
Over the longer term, projected increases in global energy usage, tightening emissions control regulations and emerging changes in power generation will drive increased global demand for the Group’s industrial products.
REGION 2017 2018 2019 2020
Light-Duty Engines – Car & Truck
CHINA China 4 China 5 China 6
EUROPE Euro 6
INDIA BS IV
US Tier 3
Heavy – Duty Engines – On Highway
CHINA China V China VI
EUROPE Euro VI
INDIA BS IV BS V
US EPA2013
Engines – Off Road
CHINA Stage III
EUROPE Stage IV Stage V
INDIA BS III
US Tier 4

SENIOR PLC ANNUAL REPORT & ACCOUNTS 2017 15
ST
RA
TE
GIC
RE
PO
RT
GO
VE
RN
AN
CE
FINA
NC
IAL S
TAT
EM
EN
TS
AD
DIT
ION
AL IN
FOR
MA
TIO
N
14 SENIOR PLC ANNUAL REPORT & ACCOUNTS 2017
STRATEGIC REPORT
HOW WE CREATE VALUESenior’s primary strategic objective is to create long-term sustainable growth in shareholder value.This is achieved through a culture of empowerment of autonomous and collaborative operations working within an effective control framework. The major elements of value creation for the Group can be classified as follows:
OUR BUSINESS MODEL
CUSTOMER ALIGNMENTWorking with our customers to provide innovative market-leading solutions.
Effective customer alignment means:
STRONG CUSTOMER RELATIONSHIPSThe Group seeks to deliver competitive products utilising its engineering expertise to optimise customer value and exceed expectations whilst continuing to meet performance objectives. This is achieved through advanced process engineering and excellent operational execution, leading to market differentiation and continued growth in organic revenue, operating margins and cash flow delivery.
BEING ON THE RIGHT PLATFORMSInvestment is targeted in new product development, technologies and geographic regions as these markets have higher than average growth potential, which will further enhance organic growth opportunities. Many of the Group’s products are developed to help customers achieve their objectives for improved operating costs, particularly fuel efficiency in aircraft platforms and land vehicle engine applications, and to meet increasingly stringent global emission regulations.
EXPANDING CAPABILITIESThe Group’s customers increasingly operate on a global basis and it is important that Senior is able to support them across the world. In industries where customers have choices with whom they do business, Senior’s on-time delivery and quality record and its cost competitiveness are key to the Group gaining market share.
Developing our portfolio of autonomous and collaborative operations. The Senior portfolio provides:
OUR DIVERSIFIED BUSINESS MODELOur business model is diversified by geography, customer, product and market, giving us a key strategic advantage.
OPERATIONAL EXCELLENCEBeing passionate about operational excellence, driving continuous improvement.
Effective operational excellence results in:
ETHICS AND SAFETYSenior is committed to conducting its business with integrity, honesty and fairness and operating with the highest ethical standards in everything it does. Governance procedures are designed to allow each operation to embrace and manage operational excellence effectively, and to comply with all legal and regulatory requirements, without imposing an unnecessary administrative burden. They also aim to ensure that employees act safely at all times, with integrity and in an ethical manner.
CONTINUOUS IMPROVEMENTDriving value creation through the implementation of operational excellence initiatives based around Lean principles and sustained superior performance in the eyes of its customers. Success through delivering operational improvements as part of the annual planning cycle, using Kaizen events and other Lean practices to reduce costs, improve product flow and velocity and optimise use of resources.
REDUCING ENVIRONMENTAL IMPACTReducing the Group’s environmental impact helps to reduce cost and to improve efficiencies and make us more agile. The Group’s main impacts on the environment are: energy consumption (and associated CO2 emissions), waste generation and recycling, and water consumption. All of the Group’s operations develop energy conservation projects, tailored to their main energy consumption, and regularly monitor performance through energy usage. Senior’s Lean programme also continues to help reduce energy demand by improving the efficiency of how the Group manufactures and streamlines the process to eliminate waste.
STRATEGIC PRIORITIES
1
AUTONOMOUS AND COLLABORATIVE BUSINESS MODEL
2
FOCUS ON GROWTH
3
HIGH PERFORMANCE OPERATING SYSTEM
4
COMPETITIVE COST COUNTRY STRATEGY
5
CONSIDERED AND EFFECTIVE CAPITAL DEPLOYMENT
6
TALENT DEVELOPMENT
READ MORE ON PAGES 16–17
GEOGRAPHYWe sell in 14 countries
CUSTOMERWe sell to all major aerospace and flexonics manufacturers
PRODUCTWe offer 14 major categories of product lines
MARKETOur products serve 12+ markets
PEOPLE
Ongoing investment in personal
development at all levels throughout
the business
Maintaining a safe and
healthy workplace
Investing in local
communities
Integrity and high
ethical standards
Developing strong customer
relationships
Empowerment of local management, within a well-defined
control framework
“Tell it as it is” philosophy
33 operations in 14 countries covering five
market sectors
Financial strength supporting
investment and innovation for
customer benefit
The opportunity
to share best practices
Leverage of customer relationships
Complementary capabilities
A culture of collaborative
autonomy
PORTFOLIO
An integrated global footprint,
providing customer proximity and cost competitiveness
OUR ASSETS OUR APPROACH
Recruiting and developing our people, to deliver sustainable growth. Our people make the difference. They operate in a culture of:

SENIOR PLC ANNUAL REPORT & ACCOUNTS 2017 17
ST
RA
TE
GIC
RE
PO
RT
GO
VE
RN
AN
CE
FINA
NC
IAL S
TAT
EM
EN
TS
AD
DIT
ION
AL IN
FOR
MA
TIO
N
16 SENIOR PLC ANNUAL REPORT & ACCOUNTS 2017
STRATEGIC REPORT
The following six strategic priorities were identified as key elements of our business model, which will drive the creation of shareholder value. They will receive specific attention and focus over the coming years.
1 ENHANCE SENIOR’S AUTONOMOUS AND COLLABORATIVE BUSINESS MODEL
2 FOCUS ON GROWTH 3 INTRODUCE A HIGH PERFORMANCE OPERATING SYSTEM
WH
AT
IT IS
Senior’s business model is one of empowering and holding accountable our businesses, operating within a clearly defined divisional structure, to develop and deliver business plans in line with overall Group strategy. Increasing collaboration amongst businesses in the Group is a priority to ensure economies of scale are realised whilst maintaining the autonomous business structure. Business leaders throughout Senior are actively embracing collaboration activities with priorities set at Group level in consultation with the businesses.
Senior’s end markets grow naturally at around 4% through the cycle. We believe it is possible to outgrow our end markets and we seek to do that both organically and through acquisition by:
• Growing market share, particularly with key customers;
• Focusing on innovation;• Geographical expansion; and• Seeking out and exploiting adjacent
opportunities organically and through acquisition.
Senior is implementing a high performance operating system of its own, drawing on the many excellent practices from across the Group. The key elements of this system include:
• An operational toolkit incorporating best practice processes such as lean and continuous improvement techniques; supplier management; new product introduction; 5/6S methodology; factory visual management systems; risk and financial management; and
• A strengthened business review process utilising a balanced scorecard incorporating KPIs with focus on performance, growth, operational excellence and talent development.
WH
AT
WE
’VE
DO
NE
• Multi-site collaboration efforts have led to important new business awards;
• Customer Relationship Managers appointed for key customers;
• Launched Senior Health & Safety Essential Behavioural Standard across the Group;
• Brought together three Aerospace businesses in Pacific Northwest under one leadership team; and
• Brought together Southern California Aerospace Structures businesses (Jet Products and Ketema) under one leadership team.
• Customer Relationship Managers appointed for key customers;
• Continued to win more new business in China, India, Malaysia and Thailand;
• Opened a Thermoplastic Composites Development Centre in the UK; and
• Secured first development contracts for electric vehicle applications.
• Launched the Senior Operating System in Aerospace Structures;
• Held targeted performance improvement workshops focused on margin; and
• Delivered a more comprehensive operational excellence leadership development programme.
OU
R P
LAN
S F
OR
201
8
• Continue to focus front end collaboration efforts on multi-site business opportunities;
• Deliver supply chain savings from Procurement Council collaboration; and
• Accelerate collaboration between Asian and North American businesses to achieve increased market share.
• Commence build of a new high-tech facility in Crumlin South Wales, focused on design, development, test and qualification of new Flexonics products; and
• Establish Senior Aerospace Additive Manufacturing Technology Centre.
• Launch the Senior Operating System in Aerospace Fluid Systems; and
• Undertake targeted performance workshops in businesses with biggest improvement opportunities.
4 COMPETITIVE COST COUNTRY STRATEGY
5 CONSIDERED AND EFFECTIVE CAPITAL DEPLOYMENT
6 TALENT DEVELOPMENT
Enhance Senior’s global footprint to ensure our businesses stay competitive at a capability and cost level, with key investments in Thailand, Malaysia, China, India, Mexico and the Czech Republic to help ensure we meet our customers’ cost and price challenges whilst protecting margins. We are actively moving products and establishing increasingly sophisticated capabilities in these competitive cost economies to free up capacity in our European and North American factories, which is needed to satisfy anticipated increasing levels of demand.
Senior understands the importance of considered and effective capital deployment in the interest of maximising the creation of shareholder value. All significant investments undertaken by Senior are assessed using a rigorous investment appraisal process and are supported by a business case. The Group has a financial objective to maintain an overall return on capital employed in excess of the Group’s cost of capital and to target a pre-tax return in excess of 15%.
Senior has a skilled workforce and some highly experienced entrepreneurial business leaders. We are bringing renewed focus to further developing leadership talent and upgrading functional capability across the Group. We are ensuring robust succession plans are in place across our businesses. We are working with capable external partners to deliver tailored training and development programmes for Senior’s top talent.
• Ramping up new Aerospace programmes in Thailand and Malaysia;
• Continued to win more new business in China, India, Malaysia and Thailand;
• Transferred Aerospace Fluid Systems work packages to Aerospace Mexico; and
• Expanded in the Czech Republic by doubling manufacturing capacity.
• Sold Aerospace BWT Ilkeston site;• Invested £54.8m in organic capital
expenditure to support growth programmes;
• Dividend increased by 5.8% to 6.95 pence per share (total paid and proposed); and
• Working capital reduced to 13.4% of revenue at the end of the year.
• Delivered a more comprehensive operational excellence leadership development programme;
• Implemented phase 1 of Group-wide Performance Development Review process for senior managers; and
• Appointed VP Operational Excellence to lead implementation of Senior Operating System.
• Successfully launch new Aerospace programmes in Thailand and Malaysia;
• Expand footprint in Malaysia to support new Aerospace programmes;
• Ramp up cooler production in India; and• Expand footprint of China JV to support
new Flexonics programmes.
• Continue to invest in organic capital expenditure to support future growth;
• Continue to pay a progressive dividend;• Maintain the level of working capital as
a percentage of revenue; and• Continue to review performance of
existing portfolio against returns on capital targets and take action as required.
• Further roll out of Group-wide Performance Development Review process; and
• Improve gender diversity in succession plans for senior leadership team.
STRATEGIC PRIORITIES

SENIOR PLC ANNUAL REPORT & ACCOUNTS 2017 19
ST
RA
TE
GIC
RE
PO
RT
GO
VE
RN
AN
CE
FINA
NC
IAL S
TAT
EM
EN
TS
AD
DIT
ION
AL IN
FOR
MA
TIO
N
18 SENIOR PLC ANNUAL REPORT & ACCOUNTS 2017
STRATEGIC REPORT
AEROSPACE
REVENUE
£725.3m2016:(1) £695.6m. Change: +4.3%.
ADJUSTED OPERATING PROFIT
£76.6m2016:(1) £78.4m. Change: -2.3%.
ADJUSTED OPERATING MARGIN
10.6%2016:(1) 11.3%. Change: -0.7ppts.
FLEXONICS
REVENUE
£298.8m2016:(1) £267.2m. Change: +11.8%.
ADJUSTED OPERATING PROFIT
£20.0m2016:(1) £22.2m. Change: -9.9%.
ADJUSTED OPERATING MARGIN
6.7%2016:(1) 8.3%. Change: -1.6ppts.
(1) 2016 results translated using 2017 average exchange rates – constant currency.
A B C D E F
£m
A 2016 revenue(1)
B Large commercialC Regional & business jets
D MilitaryE OtherF 2017 revenue
29.9 0.2
(8.5)
8.1 725.3
695.6
A B C D E F
£m
A 2016 revenue(1)
B Truck and off-highwayC Passenger vehicles
D IndustrialE OtherF 2017 revenue
19.8 1.68.7 1.5 298.8
267.2
(1) 2016 results translated using 2017 average exchange rates – constant currency.
Around 9% of the Aerospace Division’s revenue was derived from other markets such as space, non-military helicopters, power and energy, medical and semi-conductor equipment, where the Group manufactures products using very similar technology to that used for certain aerospace products. Revenue derived from these markets increased by 13.5%, mainly due to strong demand for Senior’s proprietary products for the semi-conductor equipment market.
The Divisional adjusted operating margin declined by 0.7 percentage points to 10.6% (2016 – 11.3%). As anticipated, margins were impacted by the year-on-year volume reductions on mature programmes such as the 777, A380, and the current engine versions of the 737 and A320, and costs associated with the ramp-up of new aircraft production programmes such as the 737 MAX, A320neo and C Series. However, it was encouraging to see margins improve in the second half of the year (H1 2017 – 9.5%; H2 2017 – 11.6%) from operational improvements, as we continue our focus in reducing both labour and material costs on some of our newer programmes.
During 2017, Senior successfully won additional content on 737 MAX (+11%), A320neo (+13%) and A330neo (+19%) all of which are forecasting significant increases in production over the coming years. Significant additional content was also won on the 777X (+51%), which is scheduled to enter service in 2020.
Overall, the future prospects for the Group’s Aerospace Division are visible and strong.
DIVISIONAL REVIEWThe Aerospace Division represents 71% (2016 – 73%) of Group revenue and consists of 19 operations. These are located in North America (ten), the United Kingdom (four), continental Europe (three), Thailand and Malaysia. This Divisional review is on a constant currency basis, whereby 2016 results have been translated using 2017 average exchange rates and excludes the impact of amortisation of intangible assets from acquisitions. The Division’s operating results on a constant currency basis are summarised left.
Divisional revenue increased by £29.7m (4.3%) to £725.3m (2016 – £695.6m) whilst adjusted operating profit decreased by £1.8m (2.3%) to £76.6m (2016 – £78.4m).
The Division’s most important market is large commercial aircraft where Boeing and Airbus collectively delivered 1,481 aircraft in 2017, 3.1% more than the prior year. Senior’s sales in the large commercial aircraft sector increased by 6.9% during the year. The Group benefited from increased production of the A350, A320neo and 737 MAX, which began customer deliveries in May 2017; however, these increases were partly offset by decreased production of the 777, A380, and the current engine versions of the 737 and A320.
The Division’s sales to the regional and business jet markets were flat year-on-year as increased production of Bombardier’s C Series and HondaJet was offset by lower production of legacy jets.
Revenue from the military and defence sector decreased by 6.4% in the year, primarily due to reduced A400M sales due to lower levels of inventory being held in the supply chain, lower Joint Strike Fighter content and fewer B variants, and the anticipated Black Hawk build rate reductions.
DIVISIONAL REVIEWThe Flexonics Division represents 29% (2016 – 27%) of Group revenue and consists of 14 operations which are located in North America (four), continental Europe (three), the United Kingdom (two), South Africa, India, Brazil, Malaysia and China where the Group also has a 49% equity stake in a land vehicle product joint venture. This Divisional review is on a constant currency basis, whereby 2016 results have been translated using 2017 average exchange rates and excludes the impact of amortisation of intangible assets from acquisitions. The Division’s operating results on a constant currency basis are summarised left.
Divisional revenue increased by £31.6m (11.8%) to £298.8m (2016 – £267.2m) and adjusted operating profit declined by £2.2m (9.9%) to £20.0m (2016 – £22.2m).
Group sales to truck and off-highway markets increased by 23.7%. Senior’s sales to the North American truck and off-highway market increased by £13.6m (22.0%), primarily due to the launch of new off-highway EGR cooler programmes and improved replacement demand. Sales to European truck and off-highway markets grew by £2.1m (13.1%), due to the launch of new programmes and the Group benefited by £4.1m (71.9%) increased sales from new truck and off-highway programmes in India and China.
Group sales to passenger vehicle markets increased by 3.0% in the year, benefiting from the launch of new European programmes.
Sales from the Group’s industrial markets increased by 7.0%. Sales to oil and gas markets were up £13.6m (28.4%) primarily due to upstream oil and gas related markets seeing increasing drilling activity in North America. Sales to power and energy markets decreased by £1.8m (5.1%) due to continued weakness in North American coal and gas fired power generation markets. Sales from other industrial markets decreased by £3.1m (7.4%) due to lower sales to renewables and medical markets.
The adjusted operating margin declined by 1.6 percentage points to 6.7% (2016 – 8.3%) principally due to volume reductions in the higher margin segments, particularly downstream oil and gas and power and energy, as well as a change in mix of passenger vehicles. Although the Group benefited from higher volumes from truck and off-highway and upstream oil and gas, this was primarily from lower margin and newer products. As a result, overall margins for the Division decreased year-on-year. The Group continues to focus on cost management and efficiency initiatives.
Production of North American heavy-duty trucks is forecast to improve further in 2018 and the off-highway market continues to benefit from improved levels of activity in end markets such as oil and gas, mining and agriculture. Upstream oil and gas related markets are seeing increasing drilling activity in North America. The downstream oil and gas market remains subdued as anticipated, with few major projects being launched; however, repair and overhaul activities have been reasonable and we believe recovery in this sector will lag the upstream recovery by at least a year.
Overall, we expect modest growth in our Flexonics top line in 2018 compared to 2017 with the emphasis on improving margins faster than sales in this Division.
Looking further ahead, global emissions standards and environmental legislation continues to tighten, which coupled with projected increases in global energy usage, will drive increased demand for many of the Flexonics Division’s products. Senior is developing solutions for the next generation of more efficient internal combustion engines, as well as electrified land vehicle applications. As a result of its global footprint, technical innovation and customer relationships, the Group remains well positioned for the future as new Flexonics programmes and products enter production.
REVENUE RECONCILIATION REVENUE RECONCILIATION
2017 PERFORMANCE

SENIOR PLC ANNUAL REPORT & ACCOUNTS 2017 21
ST
RA
TE
GIC
RE
PO
RT
GO
VE
RN
AN
CE
FINA
NC
IAL S
TAT
EM
EN
TS
AD
DIT
ION
AL IN
FOR
MA
TIO
N
20 SENIOR PLC ANNUAL REPORT & ACCOUNTS 2017
STRATEGIC REPORT
SENIOR DELIVERED HEALTHY FREE CASH FLOW OF £58.3M
FINANCIAL REVIEW
FINANCIAL DETAILRevenueGroup revenue increased by 11.6% to £1,023.4m (2016 – £917.0m). Excluding a favourable exchange rate impact of £45.5m, Group revenue increased by £60.9m (6.3%) on a constant currency basis driven by sales growth across both divisions. In 2017, 59% of revenue originated from North America, 16% from the UK, 12% from the Rest of Europe and 13% from the Rest of the World.
Operating profitOperating profit was £65.5m (2016 – £65.8m). Adjusted operating profit decreased by £3.0m (3.5%) to £82.6m (2016 – £85.6m). Excluding a favourable exchange rate impact of £5.0m, adjusted operating profit decreased by 8.8% on a constant currency basis. As expected, the Group’s adjusted operating margin reduced by 1.2 percentage points, to 8.1% for the full year, as Aerospace Division margins were impacted by the transition from more mature to new aircraft production programmes and margins in the Flexonics Division reflected some of the challenging market conditions in the higher margin segments of the Division.
Central costs increased to £14.7m (2016 – £10.6m) due to dilapidation costs relating to the sub-lease of a legacy site in the UK, the effects of strengthening the Group HR and Health, Safety & Environmental capabilities, legal costs incurred related to actions as described in Note 36 of the Financial Statements, and adverse foreign exchange movements on translation of non-Sterling costs.
Finance costsTotal finance costs, net of investment income of £0.2m (2016 – £0.2m) decreased to £9.5m (2016 – £10.3m) mainly due to lower interest rates on private placement loans. The net IAS 19 pension finance charge of £0.2m remained consistent with 2016.
Profit before taxAdjusted profit before tax decreased to £73.1m (2016 – £75.3m), down 2.9%, or 8.6% on a constant currency basis. Reported profit before tax decreased £3.3m to £52.2m (2016 – £55.5m). The reconciling items between adjusted and reported profit before tax are shown in Note 9 to the Financial Statements.
FINANCIAL SUMMARYA summary of the Group’s operating results (at reported currency) is set out in the table below. Further detail on the performance of each Division is set out in the Divisional Review.
RevenueAdjusted
operating profit(1) Margin
2017 £m
2016 £m
2017 £m
2016 £m
2017 %
2016 %
Aerospace 725.3 665.2 76.6 74.8 10.6 11.2Flexonics 298.8 252.1 20.0 20.7 6.7 8.2Share of results of joint
venture – – 0.7 0.7 – –Inter-segment sales (0.7) (0.3) – – – –Central costs – – (14.7) (10.6) – –Group total 1,023.4 917.0 82.6 85.6 8.1 9.3
(1) See table below for reconciliation of adjusted operating profit to reported operating profit.
Adjusted operating profit may be reconciled to the operating profit that is shown in the Consolidated Income Statement as follows:
2017 £m
2016 £m
Adjusted operating profit 82.6 85.6Amortisation of intangible assets from acquisitions (17.1) (19.8)Operating profit per Financial Statements 65.5 65.8
Tax chargeThe adjusted tax rate for the year was 17.5% (2016 – 20.1%), being a tax charge of £12.8m (2016 – £15.1m) on adjusted profit before tax of £73.1m (2016 – £75.3m). The reduction in rate is attributed to prior year adjustments following the completion of tax audits in the US as well as the geographic mix of profits in the year.
The reported tax rate was 15.5% credit (2016 – 18.2% charge), being a tax credit of £8.1m (2016 – £10.1m charge) on reported profit before tax of £52.2m (2016 – £55.5m). The reported tax credit for the year included the tax effect of items excluded from adjusted operating profit of £4.9m (2016 – £5.0m), and an exceptional non-cash tax credit related to US tax reform of £16.0m (2016 – £nil).
Following the enactment of the US Tax Cuts and Jobs Act in December 2017, Senior expects that the benefit from a reduction in the US Federal corporate income tax rate from 1 January 2018 will be largely offset by a widening of the tax base as a result of new US tax measures also introduced in this Act.
Further guidance on the Group’s expected tax rate over the medium term will be provided once we have completed our review of the full impact of changes ensuing from tax reforms in the US, UK and other jurisdictions we operate in.
Cash tax paid was £4.9m (2016 – £2.7m) and is stated net of refunds received of £1.9m (2016 – £3.5m) of tax paid in prior periods. The rate of cash tax paid is lower than our adjusted tax rate in both years due to accelerated tax relief for capital expenditure in the US, the availability of tax losses and tax deductible items that do not affect adjusted profit.
Tax policyThe Group acts with integrity in all tax matters, in accordance with the Group’s ethics and business conduct programme. It is the Group’s obligation to pay the amount of tax legally due and to observe all applicable rules and regulations in the jurisdictions in which it operates. While meeting this obligation, the Group also has a responsibility to manage and control the costs of our business including the taxes we pay for the benefit of all our stakeholders. The Group seeks to achieve this by conducting business affairs in a way that is efficient from a tax perspective, including maintaining appropriate levels of debt in the countries we operate in and claiming available tax reliefs and incentives. The Group is committed to building and maintaining constructive working relationships with the tax authorities of the countries in which it operates. Further details on our approach to tax may be found on Senior’s website at seniorplc.com.
Earnings per shareThe weighted average number of shares, for the purposes of calculating undiluted earnings per share, increased to 418.9 million (2016 – 418.8 million). The increase arose principally due to vesting of share awards. Adjusted earnings per share increased by 0.1% to 14.39 pence (2016 – 14.37 pence). Basic earnings per share increased by 32.7% to 14.39 pence (2016 – 10.84 pence). See Note 12 to the Financial Statements for details of the basis of these calculations.
Research and developmentThe Group’s expenditure on research and development increased to £25.6m during 2017 (2016 – £18.7m). Expenditure was incurred mainly on funded and unfunded development work, which relates to designing and engineering products in accordance with individual customer specifications and developing specific manufacturing processes for their production. The Group also incurs costs on general manufacturing improvement processes. Unfunded costs in the year have been expensed, consistent with the prior year, as they did not meet the strict criteria required for capitalisation.
Exchange ratesA high proportion of the Group’s operating profit in 2017 was generated outside the UK and consequently, foreign exchange rates, principally the US Dollar against Sterling, can significantly affect the Group’s results.
The 2017 average exchange rate for the US Dollar applied in the translation of income statement and cash flow items was $1.29 (2016 – $1.36). The exchange rate for the US Dollar applied to the translation of Balance Sheet items at 31 December 2017 was $1.35 (31 December 2016 – $1.24).
Using 2017 average exchange rates would have increased 2016 revenue by £45.5m and increased 2016 adjusted operating profit by £5.0m. A 10 cents movement in the £:$ exchange rate is estimated to affect forward full-year revenue by £45m, adjusted operating profit by £5m and net debt by £8m.
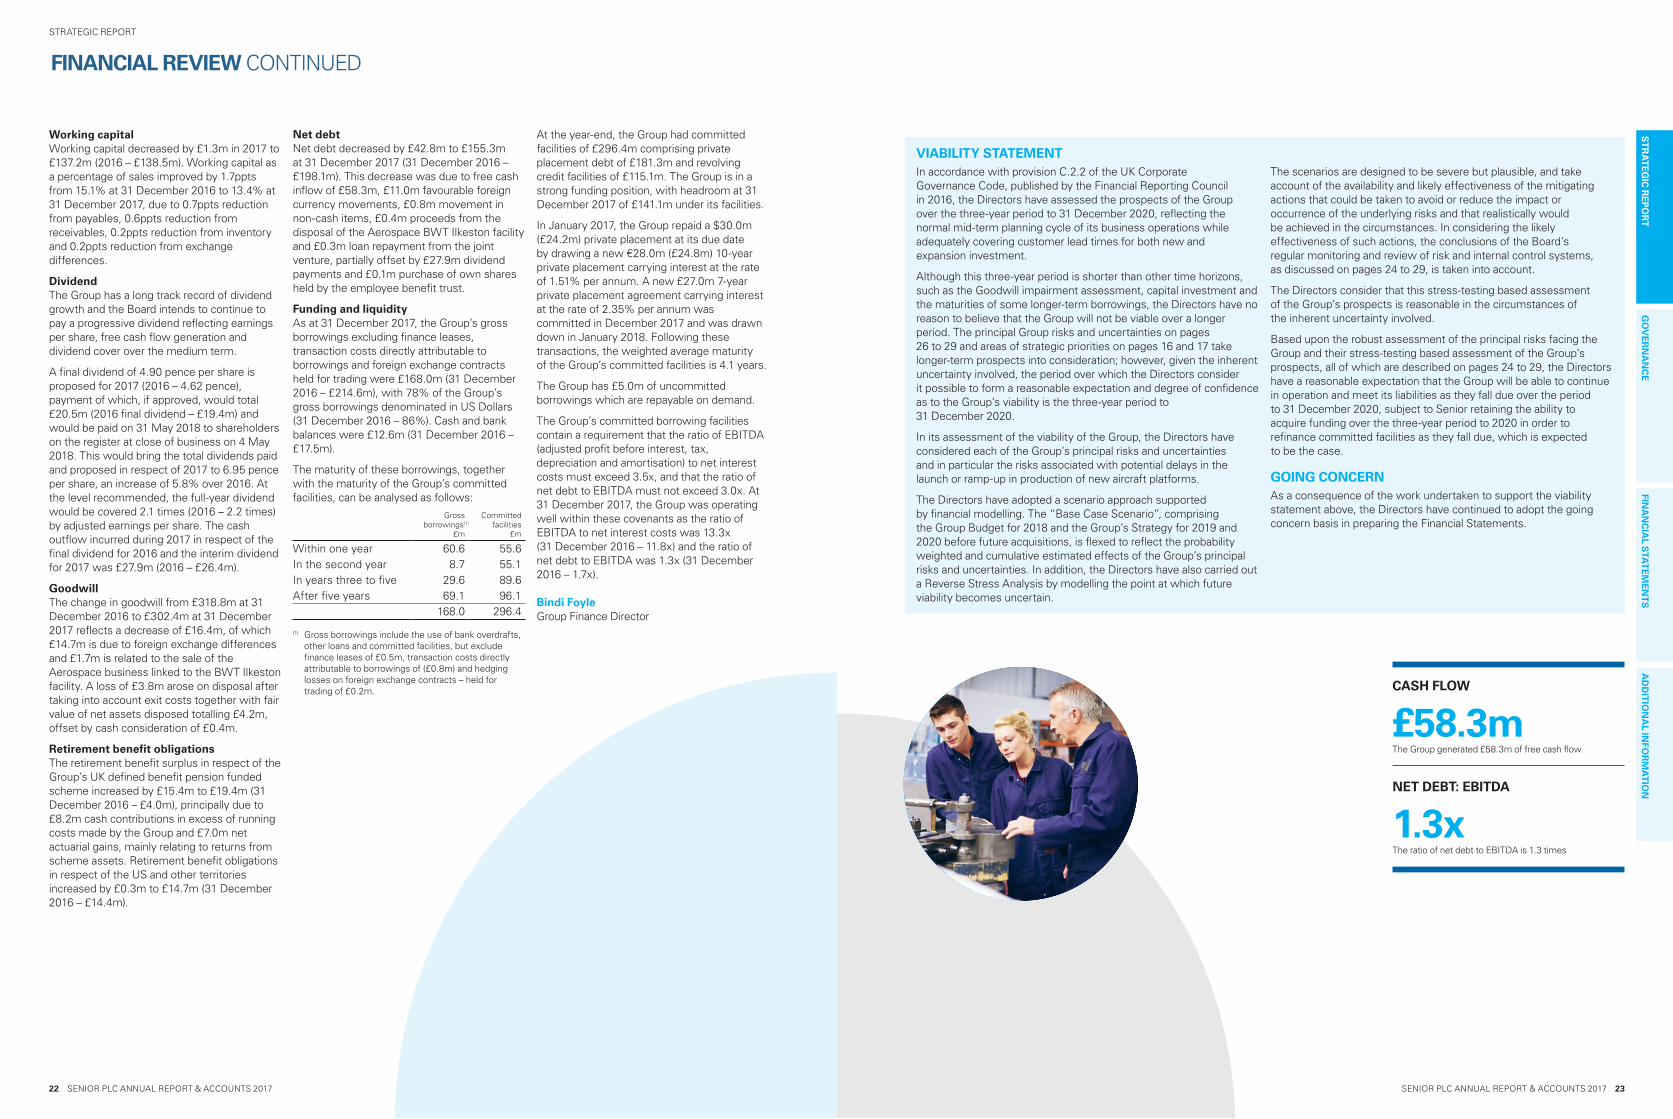
Cash flowThe Group generated healthy free cash flow of £58.3m in 2017 (2016 – £48.5m) as set out in the table below:
2017 £m
2016 £m
Operating profit 65.5 65.8Depreciation and
amortisation 57.9 54.0Share of joint venture (0.7) (0.7)Working capital
movement 12.4 (0.4)Pension payments
above service cost (9.7) (8.8)Other items 0.4 3.3Cash generated by
operations 125.8 113.2Interest paid (net) (9.6) (10.0)Income tax paid (4.9) (2.7)Capital expenditure (54.8) (52.8)Sale of fixed assets 1.8 0.8Free cash flow 58.3 48.5Dividends (27.9) (26.4)Proceeds on disposals 0.4 1.3Loan to joint venture 0.3 0.5Purchase of shares
held by employee benefit trust (0.1) (1.1)
Foreign exchange variations 11.0 (26.3)
Movement in non-cash items 0.8 –
Opening net debt (198.1) (194.6)Closing net debt (155.3) (198.1)
Capital expenditureGross capital expenditure increased by 3.8% in 2017 to £54.8m (2016 – £52.8m), principally due to investment in future growth programmes. The Group’s operations remain well capitalised. The disposal of assets raised £1.8m (2016 – £0.8m). Capital expenditure is anticipated to be higher in 2018, as investments continue to support future growth programmes already won.
BINDI FOYLE GROUP FINANCE DIRECTOR
REVENUE GROWTH
11.6%Group revenue increased by 11.6% to £1,023.4m
EARNINGS PER SHARE
14.39 penceAdjusted earnings per share increased by 0.1% to 14.39 pence
SENIOR PLC ANNUAL REPORT & ACCOUNTS 2017 23
ST
RA
TE
GIC
RE
PO
RT
GO
VE
RN
AN
CE
FINA
NC
IAL S
TAT
EM
EN
TS
AD
DIT
ION
AL IN
FOR
MA
TIO
N
22 SENIOR PLC ANNUAL REPORT & ACCOUNTS 2017
STRATEGIC REPORT
Working capitalWorking capital decreased by £1.3m in 2017 to £137.2m (2016 – £138.5m). Working capital as a percentage of sales improved by 1.7ppts from 15.1% at 31 December 2016 to 13.4% at 31 December 2017, due to 0.7ppts reduction from payables, 0.6ppts reduction from receivables, 0.2ppts reduction from inventory and 0.2ppts reduction from exchange differences.
DividendThe Group has a long track record of dividend growth and the Board intends to continue to pay a progressive dividend reflecting earnings per share, free cash flow generation and dividend cover over the medium term.
A final dividend of 4.90 pence per share is proposed for 2017 (2016 – 4.62 pence), payment of which, if approved, would total £20.5m (2016 final dividend – £19.4m) and would be paid on 31 May 2018 to shareholders on the register at close of business on 4 May 2018. This would bring the total dividends paid and proposed in respect of 2017 to 6.95 pence per share, an increase of 5.8% over 2016. At the level recommended, the full-year dividend would be covered 2.1 times (2016 – 2.2 times) by adjusted earnings per share. The cash outflow incurred during 2017 in respect of the final dividend for 2016 and the interim dividend for 2017 was £27.9m (2016 – £26.4m).
GoodwillThe change in goodwill from £318.8m at 31 December 2016 to £302.4m at 31 December 2017 reflects a decrease of £16.4m, of which £14.7m is due to foreign exchange differences and £1.7m is related to the sale of the Aerospace business linked to the BWT Ilkeston facility. A loss of £3.8m arose on disposal after taking into account exit costs together with fair value of net assets disposed totalling £4.2m, offset by cash consideration of £0.4m.
Retirement benefit obligationsThe retirement benefit surplus in respect of the Group’s UK defined benefit pension funded scheme increased by £15.4m to £19.4m (31 December 2016 – £4.0m), principally due to £8.2m cash contributions in excess of running costs made by the Group and £7.0m net actuarial gains, mainly relating to returns from scheme assets. Retirement benefit obligations in respect of the US and other territories increased by £0.3m to £14.7m (31 December 2016 – £14.4m).
Net debtNet debt decreased by £42.8m to £155.3m at 31 December 2017 (31 December 2016 – £198.1m). This decrease was due to free cash inflow of £58.3m, £11.0m favourable foreign currency movements, £0.8m movement in non-cash items, £0.4m proceeds from the disposal of the Aerospace BWT Ilkeston facility and £0.3m loan repayment from the joint venture, partially offset by £27.9m dividend payments and £0.1m purchase of own shares held by the employee benefit trust.
Funding and liquidityAs at 31 December 2017, the Group’s gross borrowings excluding finance leases, transaction costs directly attributable to borrowings and foreign exchange contracts held for trading were £168.0m (31 December 2016 – £214.6m), with 78% of the Group’s gross borrowings denominated in US Dollars (31 December 2016 – 86%). Cash and bank balances were £12.6m (31 December 2016 – £17.5m).
The maturity of these borrowings, together with the maturity of the Group’s committed facilities, can be analysed as follows:
Grossborrowings(1)
£m
Committed facilities
£m
Within one year 60.6 55.6In the second year 8.7 55.1In years three to five 29.6 89.6After five years 69.1 96.1
168.0 296.4
(1) Gross borrowings include the use of bank overdrafts, other loans and committed facilities, but exclude finance leases of £0.5m, transaction costs directly attributable to borrowings of (£0.8m) and hedging losses on foreign exchange contracts – held for trading of £0.2m.
At the year-end, the Group had committed facilities of £296.4m comprising private placement debt of £181.3m and revolving credit facilities of £115.1m. The Group is in a strong funding position, with headroom at 31 December 2017 of £141.1m under its facilities.
In January 2017, the Group repaid a $30.0m (£24.2m) private placement at its due date by drawing a new €28.0m (£24.8m) 10-year private placement carrying interest at the rate of 1.51% per annum. A new £27.0m 7-year private placement agreement carrying interest at the rate of 2.35% per annum was committed in December 2017 and was drawn down in January 2018. Following these transactions, the weighted average maturity of the Group’s committed facilities is 4.1 years.
The Group has £5.0m of uncommitted borrowings which are repayable on demand.
The Group’s committed borrowing facilities contain a requirement that the ratio of EBITDA (adjusted profit before interest, tax, depreciation and amortisation) to net interest costs must exceed 3.5x, and that the ratio of net debt to EBITDA must not exceed 3.0x. At 31 December 2017, the Group was operating well within these covenants as the ratio of EBITDA to net interest costs was 13.3x (31 December 2016 – 11.8x) and the ratio of net debt to EBITDA was 1.3x (31 December 2016 – 1.7x).
Bindi Foyle Group Finance Director
VIABILITY STATEMENTIn accordance with provision C.2.2 of the UK Corporate Governance Code, published by the Financial Reporting Council in 2016, the Directors have assessed the prospects of the Group over the three-year period to 31 December 2020, reflecting the normal mid-term planning cycle of its business operations while adequately covering customer lead times for both new and expansion investment.
Although this three-year period is shorter than other time horizons, such as the Goodwill impairment assessment, capital investment and the maturities of some longer-term borrowings, the Directors have no reason to believe that the Group will not be viable over a longer period. The principal Group risks and uncertainties on pages 26 to 29 and areas of strategic priorities on pages 16 and 17 take longer-term prospects into consideration; however, given the inherent uncertainty involved, the period over which the Directors consider it possible to form a reasonable expectation and degree of confidence as to the Group’s viability is the three-year period to 31 December 2020.
In its assessment of the viability of the Group, the Directors have considered each of the Group’s principal risks and uncertainties and in particular the risks associated with potential delays in the launch or ramp-up in production of new aircraft platforms.
The Directors have adopted a scenario approach supported by financial modelling. The “Base Case Scenario”, comprising the Group Budget for 2018 and the Group’s Strategy for 2019 and 2020 before future acquisitions, is flexed to reflect the probability weighted and cumulative estimated effects of the Group’s principal risks and uncertainties. In addition, the Directors have also carried out a Reverse Stress Analysis by modelling the point at which future viability becomes uncertain.
The scenarios are designed to be severe but plausible, and take account of the availability and likely effectiveness of the mitigating actions that could be taken to avoid or reduce the impact or occurrence of the underlying risks and that realistically would be achieved in the circumstances. In considering the likely effectiveness of such actions, the conclusions of the Board’s regular monitoring and review of risk and internal control systems, as discussed on pages 24 to 29, is taken into account.
The Directors consider that this stress-testing based assessment of the Group’s prospects is reasonable in the circumstances of the inherent uncertainty involved.
Based upon the robust assessment of the principal risks facing the Group and their stress-testing based assessment of the Group’s prospects, all of which are described on pages 24 to 29, the Directors have a reasonable expectation that the Group will be able to continue in operation and meet its liabilities as they fall due over the period to 31 December 2020, subject to Senior retaining the ability to acquire funding over the three-year period to 2020 in order to refinance committed facilities as they fall due, which is expected to be the case.
GOING CONCERNAs a consequence of the work undertaken to support the viability statement above, the Directors have continued to adopt the going concern basis in preparing the Financial Statements.
FINANCIAL REVIEW CONTINUED
CASH FLOW
£58.3mThe Group generated £58.3m of free cash flow
NET DEBT: EBITDA
1.3xThe ratio of net debt to EBITDA is 1.3 times
SENIOR PLC ANNUAL REPORT & ACCOUNTS 2017 25
ST
RA
TE
GIC
RE
PO
RT
GO
VE
RN
AN
CE
FINA
NC
IAL S
TAT
EM
EN
TS
AD
DIT
ION
AL IN
FOR
MA
TIO
N
24 SENIOR PLC ANNUAL REPORT & ACCOUNTS 2017
STRATEGIC REPORT
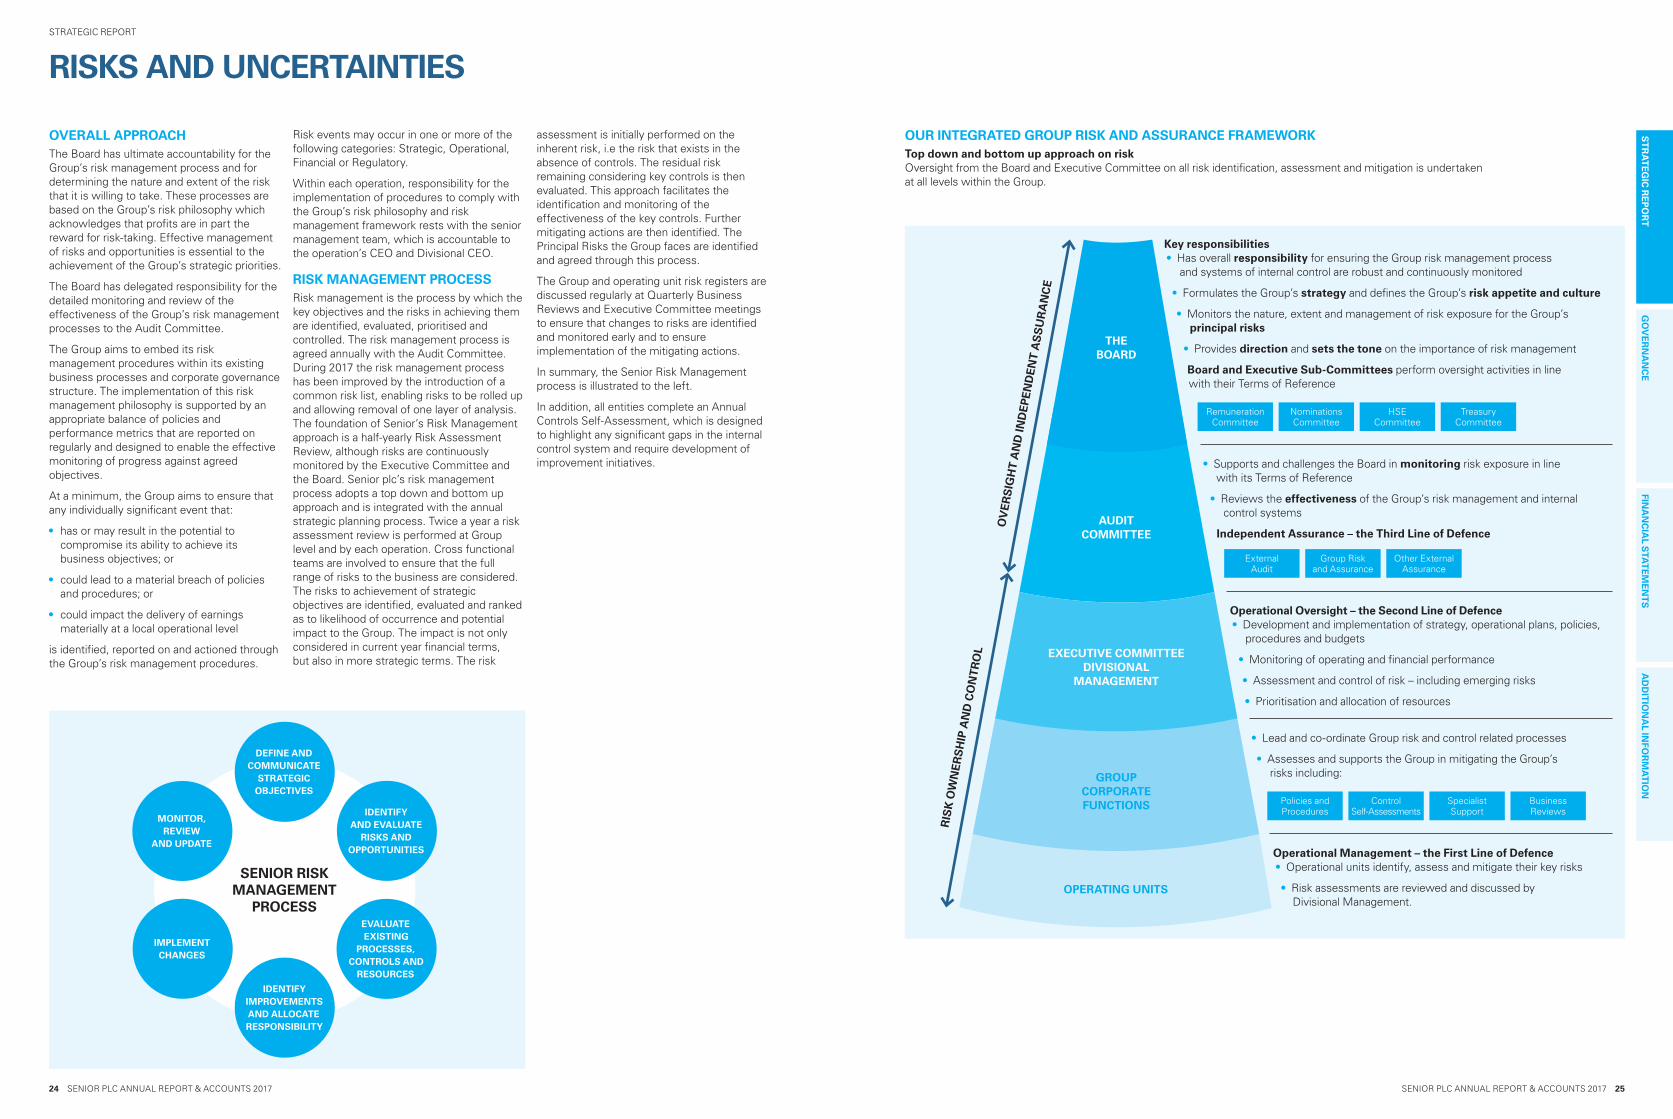
SENIOR RISK MANAGEMENT
PROCESS
DEFINE AND COMMUNICATE
STRATEGIC OBJECTIVES
IDENTIFY AND EVALUATE
RISKS AND OPPORTUNITIES
EVALUATE EXISTING
PROCESSES, CONTROLS AND
RESOURCES
IDENTIFY IMPROVEMENTS AND ALLOCATE RESPONSIBILITY
IMPLEMENT CHANGES
MONITOR, REVIEW
AND UPDATE
RISKS AND UNCERTAINTIES
OVERALL APPROACHThe Board has ultimate accountability for the Group’s risk management process and for determining the nature and extent of the risk that it is willing to take. These processes are based on the Group’s risk philosophy which acknowledges that profits are in part the reward for risk-taking. Effective management of risks and opportunities is essential to the achievement of the Group’s strategic priorities.
The Board has delegated responsibility for the detailed monitoring and review of the effectiveness of the Group’s risk management processes to the Audit Committee.
The Group aims to embed its risk management procedures within its existing business processes and corporate governance structure. The implementation of this risk management philosophy is supported by an appropriate balance of policies and performance metrics that are reported on regularly and designed to enable the effective monitoring of progress against agreed objectives.
At a minimum, the Group aims to ensure that any individually significant event that:
• has or may result in the potential to compromise its ability to achieve its business objectives; or
• could lead to a material breach of policies and procedures; or
• could impact the delivery of earnings materially at a local operational level
is identified, reported on and actioned through the Group’s risk management procedures.
Risk events may occur in one or more of the following categories: Strategic, Operational, Financial or Regulatory.
Within each operation, responsibility for the implementation of procedures to comply with the Group’s risk philosophy and risk management framework rests with the senior management team, which is accountable to the operation’s CEO and Divisional CEO.
RISK MANAGEMENT PROCESSRisk management is the process by which the key objectives and the risks in achieving them are identified, evaluated, prioritised and controlled. The risk management process is agreed annually with the Audit Committee. During 2017 the risk management process has been improved by the introduction of a common risk list, enabling risks to be rolled up and allowing removal of one layer of analysis. The foundation of Senior’s Risk Management approach is a half-yearly Risk Assessment Review, although risks are continuously monitored by the Executive Committee and the Board. Senior plc’s risk management process adopts a top down and bottom up approach and is integrated with the annual strategic planning process. Twice a year a risk assessment review is performed at Group level and by each operation. Cross functional teams are involved to ensure that the full range of risks to the business are considered. The risks to achievement of strategic objectives are identified, evaluated and ranked as to likelihood of occurrence and potential impact to the Group. The impact is not only considered in current year financial terms, but also in more strategic terms. The risk
assessment is initially performed on the inherent risk, i.e the risk that exists in the absence of controls. The residual risk remaining considering key controls is then evaluated. This approach facilitates the identification and monitoring of the effectiveness of the key controls. Further mitigating actions are then identified. The Principal Risks the Group faces are identified and agreed through this process.
The Group and operating unit risk registers are discussed regularly at Quarterly Business Reviews and Executive Committee meetings to ensure that changes to risks are identified and monitored early and to ensure implementation of the mitigating actions.
In summary, the Senior Risk Management process is illustrated to the left.
In addition, all entities complete an Annual Controls Self-Assessment, which is designed to highlight any significant gaps in the internal control system and require development of improvement initiatives.
OUR INTEGRATED GROUP RISK AND ASSURANCE FRAMEWORK Top down and bottom up approach on risk Oversight from the Board and Executive Committee on all risk identification, assessment and mitigation is undertaken at all levels within the Group.
THE BOARD
AUDIT COMMITTEE
GROUP CORPORATE FUNCTIONS
OPERATING UNITS
OV
ER
SIG
HT
AN
D IN
DE
PEN
DE
NT
AS
SU
RA
NC
E
RIS
K O
WN
ER
SH
IP A
ND
CO
NT
RO
L
Key responsibilities• Has overall responsibility for ensuring the Group risk management process
and systems of internal control are robust and continuously monitored
• Formulates the Group’s strategy and defines the Group’s risk appetite and culture
• Monitors the nature, extent and management of risk exposure for the Group’s principal risks
• Provides direction and sets the tone on the importance of risk management
Board and Executive Sub-Committees perform oversight activities in line with their Terms of Reference
Remuneration Committee
HSE Committee
Nominations Committee
Treasury Committee
• Supports and challenges the Board in monitoring risk exposure in line with its Terms of Reference
• Reviews the effectiveness of the Group’s risk management and internal control systems
Independent Assurance – the Third Line of Defence
External Audit
Group Risk and Assurance
Other External Assurance
Operational Oversight – the Second Line of Defence • Development and implementation of strategy, operational plans, policies,
procedures and budgets
• Monitoring of operating and financial performance
• Assessment and control of risk – including emerging risks
• Prioritisation and allocation of resources
• Lead and co-ordinate Group risk and control related processes
• Assesses and supports the Group in mitigating the Group’s risks including:
Policies and Procedures
Control Self-Assessments
Specialist Support
Business Reviews
Operational Management – the First Line of Defence • Operational units identify, assess and mitigate their key risks
• Risk assessments are reviewed and discussed by Divisional Management.
EXECUTIVE COMMITTEE DIVISIONAL
MANAGEMENT

SENIOR PLC ANNUAL REPORT & ACCOUNTS 2017 27
ST
RA
TE
GIC
RE
PO
RT
GO
VE
RN
AN
CE
FINA
NC
IAL S
TAT
EM
EN
TS
AD
DIT
ION
AL IN
FOR
MA
TIO
N
26 SENIOR PLC ANNUAL REPORT & ACCOUNTS 2017
STRATEGIC REPORT
PRINCIPAL GROUP RISKSDuring 2017 the principal risks and uncertainties faced by the Group have been reassessed. Following this review two risks identified as principal risks in the 2016 Annual Report & Accounts are no longer considered to be principal risks and two have been added. The two risks which are no longer considered to be principal risks are:
• Employee Retention – Improvements in the Group’s succession planning process, together with ongoing in-house development programmes has reduced both the likelihood, and resulting impact, of not being able to attract, develop and retain high quality individuals.
• Strategy – The Group has strengthened the strategic planning process, thereby reducing the likelihood of the Group’s strategy not being appropriately formulated, communicated and effectively executed.
The principal potential risks and uncertainties, together with actions that are being taken to mitigate each risk, are:
RISKS AND UNCERTAINTIES CONTINUED
RISK MANAGEMENT ACTIONS TO MITIGATE RISK
NEW AIRCRAFT PLATFORM DELAYS 2 3
Significant shipset content has been secured on a number of new aircraft platforms currently under development or in initial phases of production. These include the Airbus A350, A320neo, the Boeing 737 MAX and Bombardier’s CSeries regional jet. Delays in the launch or ramp-up in production of these platforms could have a material adverse impact on the Group’s rate of organic growth.
• The Group monitors programme development and launch timing of new aircraft platforms very closely, utilising internal customer relationships and market intelligence.
• A cautious approach is taken to both capital investment in new programmes, to minimise the time between installation and utilisation of new capital equipment, and to the projected build rates and associated revenue in financial projections.
• The growing breadth of Senior’s exposure to a comprehensive and diverse range of aerospace and land vehicle platforms, together with its broad exposure in global industrial markets, means that the Group’s future organic growth profile is not overly dependent on any individual new aircraft platform.
IMPORTANCE OF EMERGING MARKETS 2 3 4 5
Customers’ desire to move manufacture of components to lower-cost countries could render the Group’s operations uncompetitive and have an adverse impact on profitability. In addition, certain customers require global programme support as they respond to increasing domestic demand in a number of these emerging markets.
• The Group’s strategy of developing a portfolio of high value-added engineering manufacturing companies has meant that over time it has generally evolved away from products where the direct threat of lower-cost country manufacture is significant.
• The Group successfully employs a strategy of retaining commercial and engineering expertise close to customers’ locations, principally in North America and Europe. This enables effective support to be readily given to its customers, whilst increasing manufacturing at above-average growth rates in lower-cost country locations where it makes sense to do so and with customer agreement.
• The Group has an increasing presence in emerging markets via its facilities in Mexico, Thailand, the Czech Republic, South Africa, Brazil, India, Malaysia and China.
• Each of these operations, individually and in combination, has a healthy number of viable opportunities for further expansion either to supply domestic markets or to support customers’ increasingly global needs.
• In 2017 the Mexico facility has been reshaped as a focus factory; capacity expansion is underway in Malaysia and has just been completed in Czech Republic.
RISK MANAGEMENT ACTIONS TO MITIGATE RISK
PRICE-DOWN PRESSURES 1 3 4
Customer pricing pressure is an ongoing challenge within our industries, driven by the expectations of airlines, land vehicle operators and governments seeking to purchase more competitively priced products in the future. This could continue to put pressure on the Group’s future operating margins.
• The Group works closely with its customers to find innovative ways to produce products at a lower cost, thus helping them to meet pricing challenges.
• The Group is able to consider bundles of products that in total help achieve customer pricing challenges.
• Where appropriate, the Group will actively pass work to some of its cost competitive facilities such as Mexico, Thailand, the Czech Republic, South Africa, Brazil, India, China and Malaysia with a view to helping satisfy customer challenges.
ACQUISITIONS 2 5
Failure to execute an effective acquisition and integration programme would have a significant impact on the Group’s ability to generate long-term value for shareholders.
• M&A opportunities continue to be evaluated and discussed at the Board’s strategic review. Processes are in place to ensure that the Group will be aware of emerging acquisition opportunities.
• The Group has a well-established acquisition framework that includes proven valuation, due diligence and integration processes.
• Consistently strong free cash flow generation gives the Group capacity to execute a targeted acquisition programme.
• Post-acquisition reviews are conducted as appropriate.
PROGRAMME PARTICIPATION 31 2 4
Long-term growth in demand, including participation in future development programmes in the Group’s major markets, is an essential foundation for future growth. Failure to secure profitable new programme wins could have a severe impact on the Group’s long-term performance.
• The Group has developed a portfolio of businesses that are exposed to markets which exhibit fundamental long-term growth characteristics.
• Customer value is driven through constructive and co-operative relationships with key customers in each market, providing innovative customer solutions and quality products delivered on time and in line with specifications.
• The Group ensures that its operations are sufficiently well capitalised to be able to bid competitively on new programme opportunities, and maintains close control over operating costs to ensure that operations remain competitive on existing programmes.
• The Group utilises an internal contract approval process, comprising both financial and non-financial analyses, to ensure that bids are submitted and won at acceptable margin levels. This Policy will be updated in 2018 as part of our continuous improvement initiative.
Increased risk Decreased risk Risk unchanged N New risk
1 2 3 4 5 6
Areas of strategic priorities as described on pages 16 and 17.
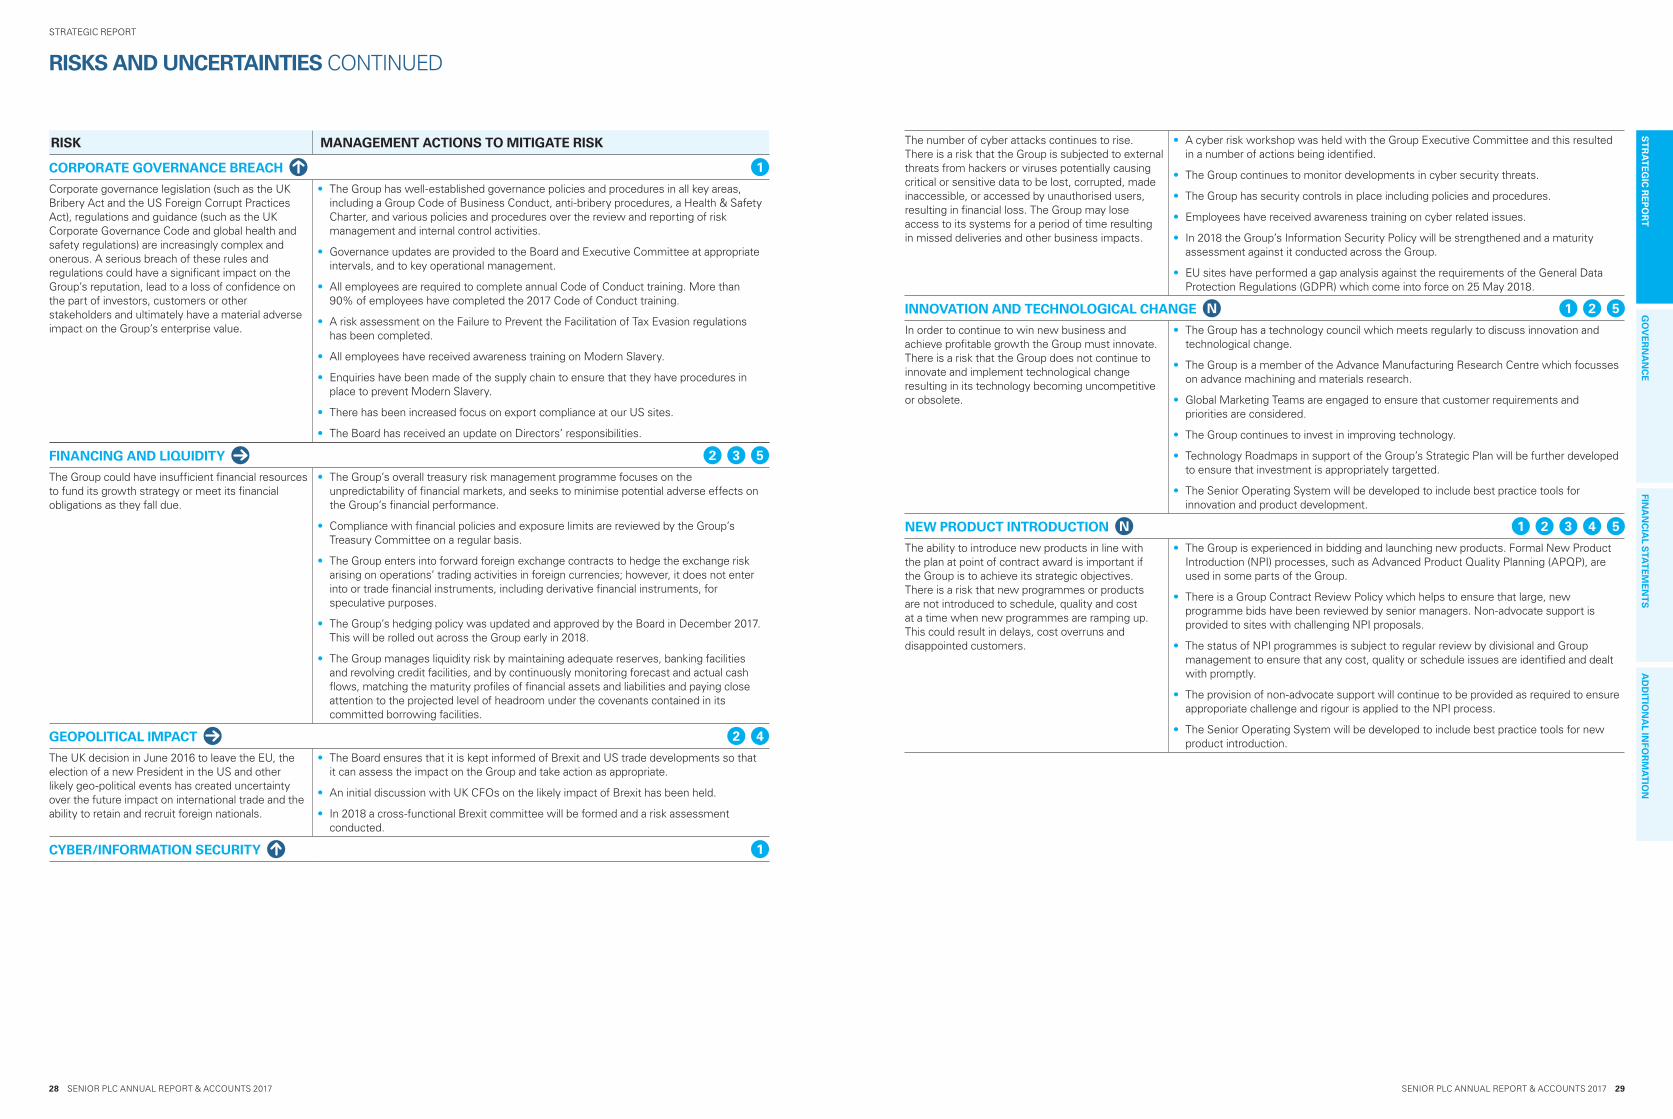
SENIOR PLC ANNUAL REPORT & ACCOUNTS 2017 29
ST
RA
TE
GIC
RE
PO
RT
GO
VE
RN
AN
CE
FINA
NC
IAL S
TAT
EM
EN
TS
AD
DIT
ION
AL IN
FOR
MA
TIO
N
28 SENIOR PLC ANNUAL REPORT & ACCOUNTS 2017
STRATEGIC REPORT
RISK MANAGEMENT ACTIONS TO MITIGATE RISK
CORPORATE GOVERNANCE BREACH 1
Corporate governance legislation (such as the UK Bribery Act and the US Foreign Corrupt Practices Act), regulations and guidance (such as the UK Corporate Governance Code and global health and safety regulations) are increasingly complex and onerous. A serious breach of these rules and regulations could have a significant impact on the Group’s reputation, lead to a loss of confidence on the part of investors, customers or other stakeholders and ultimately have a material adverse impact on the Group’s enterprise value.
• The Group has well-established governance policies and procedures in all key areas, including a Group Code of Business Conduct, anti-bribery procedures, a Health & Safety Charter, and various policies and procedures over the review and reporting of risk management and internal control activities.
• Governance updates are provided to the Board and Executive Committee at appropriate intervals, and to key operational management.
• All employees are required to complete annual Code of Conduct training. More than 90% of employees have completed the 2017 Code of Conduct training.
• A risk assessment on the Failure to Prevent the Facilitation of Tax Evasion regulations has been completed.
• All employees have received awareness training on Modern Slavery.
• Enquiries have been made of the supply chain to ensure that they have procedures in place to prevent Modern Slavery.
• There has been increased focus on export compliance at our US sites.
• The Board has received an update on Directors’ responsibilities.
FINANCING AND LIQUIDITY 2 3 5
The Group could have insufficient financial resources to fund its growth strategy or meet its financial obligations as they fall due.
• The Group’s overall treasury risk management programme focuses on the unpredictability of financial markets, and seeks to minimise potential adverse effects on the Group’s financial performance.
• Compliance with financial policies and exposure limits are reviewed by the Group’s Treasury Committee on a regular basis.
• The Group enters into forward foreign exchange contracts to hedge the exchange risk arising on operations’ trading activities in foreign currencies; however, it does not enter into or trade financial instruments, including derivative financial instruments, for speculative purposes.
• The Group’s hedging policy was updated and approved by the Board in December 2017. This will be rolled out across the Group early in 2018.
• The Group manages liquidity risk by maintaining adequate reserves, banking facilities and revolving credit facilities, and by continuously monitoring forecast and actual cash flows, matching the maturity profiles of financial assets and liabilities and paying close attention to the projected level of headroom under the covenants contained in its committed borrowing facilities.
GEOPOLITICAL IMPACT 2 4
The UK decision in June 2016 to leave the EU, the election of a new President in the US and other likely geo-political events has created uncertainty over the future impact on international trade and the ability to retain and recruit foreign nationals.
• The Board ensures that it is kept informed of Brexit and US trade developments so that it can assess the impact on the Group and take action as appropriate.
• An initial discussion with UK CFOs on the likely impact of Brexit has been held.
• In 2018 a cross-functional Brexit committee will be formed and a risk assessment conducted.
CYBER/INFORMATION SECURITY 1
RISKS AND UNCERTAINTIES CONTINUED
The number of cyber attacks continues to rise. There is a risk that the Group is subjected to external threats from hackers or viruses potentially causing critical or sensitive data to be lost, corrupted, made inaccessible, or accessed by unauthorised users, resulting in financial loss. The Group may lose access to its systems for a period of time resulting in missed deliveries and other business impacts.
• A cyber risk workshop was held with the Group Executive Committee and this resulted in a number of actions being identified.
• The Group continues to monitor developments in cyber security threats.
• The Group has security controls in place including policies and procedures.
• Employees have received awareness training on cyber related issues.
• In 2018 the Group’s Information Security Policy will be strengthened and a maturity assessment against it conducted across the Group.
• EU sites have performed a gap analysis against the requirements of the General Data Protection Regulations (GDPR) which come into force on 25 May 2018.
INNOVATION AND TECHNOLOGICAL CHANGE N 1 2 5
In order to continue to win new business and achieve profitable growth the Group must innovate. There is a risk that the Group does not continue to innovate and implement technological change resulting in its technology becoming uncompetitive or obsolete.
• The Group has a technology council which meets regularly to discuss innovation and technological change.
• The Group is a member of the Advance Manufacturing Research Centre which focusses on advance machining and materials research.
• Global Marketing Teams are engaged to ensure that customer requirements and priorities are considered.
• The Group continues to invest in improving technology.
• Technology Roadmaps in support of the Group’s Strategic Plan will be further developed to ensure that investment is appropriately targetted.
• The Senior Operating System will be developed to include best practice tools for innovation and product development.
NEW PRODUCT INTRODUCTION N 1 2 3 4 5
The ability to introduce new products in line with the plan at point of contract award is important if the Group is to achieve its strategic objectives. There is a risk that new programmes or products are not introduced to schedule, quality and cost at a time when new programmes are ramping up. This could result in delays, cost overruns and disappointed customers.
• The Group is experienced in bidding and launching new products. Formal New Product Introduction (NPI) processes, such as Advanced Product Quality Planning (APQP), are used in some parts of the Group.
• There is a Group Contract Review Policy which helps to ensure that large, new programme bids have been reviewed by senior managers. Non-advocate support is provided to sites with challenging NPI proposals.
• The status of NPI programmes is subject to regular review by divisional and Group management to ensure that any cost, quality or schedule issues are identified and dealt with promptly.
• The provision of non-advocate support will continue to be provided as required to ensure approporiate challenge and rigour is applied to the NPI process.
• The Senior Operating System will be developed to include best practice tools for new product introduction.

SENIOR PLC ANNUAL REPORT & ACCOUNTS 2017 31
ST
RA
TE
GIC
RE
PO
RT
GO
VE
RN
AN
CE
FINA
NC
IAL S
TAT
EM
EN
TS
AD
DIT
ION
AL IN
FOR
MA
TIO
N
30 SENIOR PLC ANNUAL REPORT & ACCOUNTS 2017
STRATEGIC REPORT
20/20 OBJECTIVES In 2015, we launched our 20/20 vision for sustainability, a five-year strategy, following an assessment of materiality with our key stakeholders. Our vision has three core themes: Workplace, Environment and Community.
OPERATING IN AN ETHICAL, ENVIRONMENTALLY AND SOCIALLY SUSTAINABLE MANNER IS A KEY DRIVER IN VALUE CREATION
WORKPLACE
HEALTH & SAFETY ETHICS EMPLOYEE ENGAGEMENT
ObjectivesContinue towards our goal of zero harm through effective management systems, employee engagement and defining safe behaviours.
ProgressA 28% reduction in our Lost Time Injury Rate and a 23% reduction in our Total Recordable Injury Rate compared with 2016.
The Senior “Essential Behaviours for Health & Safety” have been developed and we are engaging with our leadership teams on implementing to all levels in our business.
ObjectivesAct in accordance with Senior’s business principles and values, upholding a zero tolerance approach to bribery and corruption.
ProgressRolled out advanced ethics and compliance programmes training across the Group.
ObjectivesDevelop a Group HR Framework with improvement objectives for learning, diversity and equality.
ProgressThe Group continues to partner with world class training providers to develop our leadership pipeline and capability. We have launched Perform, our new global performance management system to senior leaders. Through robust succession planning and talent management process we have identified high potentials; they have appropriate development plans in place. We actively appoint and develop local talent in all our global geographies to encourage diversity and inclusion across the Group.
COMMUNITY
COMMUNITY GIVING
ObjectivesEstablish positive and meaningful relationships with all the communities in which Senior operates and provide financial support to local charities and good causes.
ProgressOur businesses continue to interact in a positive way with communities local to the facility.
SUPPLY CHAIN
ObjectivesImplement a Responsible Supply Chain Management Policy and communicate it to all suppliers.
ProgressA Responsible Sourcing Policy has been adopted. Key suppliers have been included in the assessment process.
CORPORATE RESPONSIBILITY
ENVIRONMENT
CARBON EMISSIONS WATER CONSUMPTION WASTE RECYCLED CERTIFICATION
ObjectivesReduce carbon emissions through improved energy consumption and efficiency measures.
ProgressEmissions of CO2 (tonnes per £m revenue) have decreased from 81 in 2016 to 65 for 2017.
ObjectivesLimit the environmental impacts of our products and processes through more efficient water consumption.
ProgressWater consumption for 2017 was 0.26 Megalitres/£m turnover compared with 0.30 in 2016.
ObjectivesReduce the overall quantity of waste generated and improve proportion of materials reused and recycled.
ProgressFollowing a thorough review of waste streams and categorisation, we can report that 91% of our waste produced was recycled in 2017 compared to 81% in 2016.
ObjectivesEstablish formalised environmental management systems in all businesses to reduce the environmental impacts.
ProgressAll legacy Senior businesses now have certification under IS0 14001.
The remaining businesses are progressing well.
WORKPLACE
HEALTH & SAFETY
The health and safety of our employees continues to be of upmost priority and remains one of our key business objectives.
This year we have extended our Zero Harm programme with a behavioural element we have called the “Senior Essential Behaviours”.
To devise these behaviours a core team of staff received training to gather information from our global businesses through a series of workshops. These workshops generated a huge amount of data which was combined with our existing Zero Harm policies and experience from external research to generate a set of health and safety behaviours bespoke to Senior. To help us with this process we engaged a leading consultancy.
There are behaviours for three main groups of our staff; Everyone, Supervisors / Team Leaders, and Managers / Leadership. The behaviours fall into four main categories: Standard, Communication, Risk Management and Involvement. They are interconnected, for example: Everyone should Follow the Rules, but Supervisors also must ‘Ensure Compliance’. Managers must ‘Follow the Rules’ but also ‘Set High Standards’.
The Essential Behaviours are being communicated through workshops with the business leadership teams. Half of our businesses attended these workshops in 2017 with the remaining scheduled to be completed in the first half of 2018.
Our focus on machinery safety has continued with a concerted effort to ensure safety control systems are the best we can achieve on all our equipment regardless of age. The equipment designated as high priority (through risk assessment) has been completed and we are now at the point where the continuous risk assessment process is managing these risks.
Where we have a number of businesses situated together they have also been involved
in an internal auditing programme on contractor control and have shared learning. We plan to extend this approach in 2018.
The Group-wide safety of contractors’ management policy has been revised. Selection and approval procedures have been upgraded to ensure that all contractors working on Senior Operating Businesses are capable of working to the highest safety standards. All our businesses have reviewed contactor management against this revised policy and have completed actions to address any shortfalls.
During 2017 our Corporate Health and Safety review programme has been revised. The programme has been extended to give a numeric assessment of the implementation of our Zero Harm Golden Rules as well as a more in-depth review of current performance. All of the Senior businesses were subject to a Corporate Safety review in 2017, meaning we conducted 34 in total.
The combined focus on behavioural safety and our safety review programme have resulted in a positive effect on our injury rates for the Group as a whole. When compared to our 2016 annual figure the 2017 Total Recordable Injury Rate fell by 23% and the Lost Time Injury Rate reduced by 28%.
0.0
0.5
1.0
1.5
2.0
2.5
3.0
3.5
4.0
2014 201520132012
3.48
1.36
2.97
0.95
2.94
1.13
2.95
2.49
1.03 0.93
20172016
Rat
e pe
r 100
em
ploy
ees
Total Recordable Injury Rate
Lost Time Injury Rate
1.78
0.67
INJURY RATES

SENIOR PLC ANNUAL REPORT & ACCOUNTS 2017 33
ST
RA
TE
GIC
RE
PO
RT
GO
VE
RN
AN
CE
FINA
NC
IAL S
TAT
EM
EN
TS
AD
DIT
ION
AL IN
FOR
MA
TIO
N
32 SENIOR PLC ANNUAL REPORT & ACCOUNTS 2017
STRATEGIC REPORT
EveryoneTheme
Essential Behaviours for...
Supervisors & Team Leaders
Managers & Leadership
Follow Rules
Speak Up
Be Mindful
Get Involved
Standards
Communication
Risk Management
Involvement
Ensure Compliance
Encourage the Team
Promote Risk Awareness
Engage the Team
Set High Standards
Communicate Openly
Confront Risk
Involve the Workforce
p g
p p
g
g p y
ESSENTIAL BEHAVIOURS FOR...
Please refer to the Corporate Governance Report on pages 42 to 44 for further information on Corporate Ethics and the Code of Conduct.
2017 update • The 2017 Code of Conduct training
programme was completed by all employees
• Modern Slavery awareness training was delivered to all employees
• Work was undertaken with our supply chain to ensure that the risk of exposure to Modern Slavery is minimised
• We performed a gap analysis against the requirements of the General Data Protection Regulations (GDPR)
Our plans for 2018• We will update and reissue the Senior Code
of Conduct
• All employees will be required to complete the 2018 Code of Conduct training programme
• We will update and reissue the Group Responsible Sourcing Policy
• Training on the GDPR will be delivered to employees as appropriate
EMPLOYEE ENGAGEMENTIn our autonomous and collaborative structure our operating businesses actively engage via a range of activities that are culturally appropriate for the business; for example, regular meetings with employee representative bodies, long service awards, an employee App, holiday parties, and engagement surveys. As well as our annual Spring Roadshow when members of the Executive Team visit all our sites to present a business update, all our operations hold regular All-hands meetings. We have also created a global network of Communications Champions to share knowledge and best practice and support their local business with internal communications and engagement.
SUPPLY CHAINOur businesses have communicated the requirements of the Corporate Responsible Sourcing Policy to key suppliers.
CORPORATE RESPONSIBILITY CONTINUED
We believe that we have extended our Zero Harm strategy with a world class behavioural programme, our intention is to further develop this in 2018 and extend its reach further into our businesses.
ETHICSThe highest ethical standardSenior remains committed to the highest standard of ethics and a zero tolerance towards bribery and corruption. Our ethics and business conduct programme commits us to conducting business fairly, impartially and in compliance with local laws and regulations and to acting with integrity and honesty in our business relationships. The programme is underpinned by the Code of Conduct, which provides a clear framework on which to base decisions when conducting day-to-day business. It does this by:
• clearly setting out the behaviour expected of all employees;
• providing guidelines which help employees to apply our values; and
• enabling employees to raise a concern or ask a question if in doubt.
Acting ethically is an enabler of our business, providing competitive advantage by strengthening long-term relationships and protecting the Group’s reputation.
We use various forms of communication and training, both in-person and through electronic media, to embed the ethics and integrity requirement across the Group. We investigate any alleged violations or complaints and take the necessary action. A register of reported incidents is maintained by the Group Company Secretary and the Board receives regular updates.
The Group recognises that the use of third-party intermediaries can increase potential bribery and corruption risks within the markets in which we operate. All external sales agents working on behalf of Senior across the world are required to operate in compliance with the Code of Conduct. The Code requires a pre-appointment due diligence and risk assessment to be undertaken, prior to engaging or re-appointing any sales agent and requires them to be issued with the Code, ensuring that they understand, acknowledge and accept its requirements.
ENVIRONMENTWe continued to progress our environmental management programmes in 2017 with improvements across the Group in our energy intensity (megawatt hours per £m revenue) and waste recycling in particular. It is a requirement for all Senior businesses to attain an accreditation to ISO 14401; we have achieved this for all existing businesses with one business (a more recent acquisition) scheduling accreditation in 2018.
CARBON EMISSIONSOur Scope 1 and 2 emissions have been independently verified in accordance with the International Standard on Assurance Engagements 3410 ‘Assurance engagements on greenhouse gas statements’ (ISAE 3410).
CDP is a not-for-profit charity that runs the global disclosure system for investors, companies, cities, states and regions to manage their environmental impacts. Over the past 15 years they have created a system which is used by a broad spectrum of leading companies and institutions.
Senior submit data and information related to Climate Change on an annual basis to CDP. This means that we must detail how we manage our emissions of carbon and describe in detail how we consider carbon and the environment in the way we conduct our business and plan for the future.
Investors, businesses and policy makers use the data and insights from CDP to make better decisions, manage risk and capitalise on opportunities.
A panel of experts in CDP grade the submissions on a scale of A to F.
For 2017 Senior plc were graded as an A- putting us in the “Leadership” category. This means that we are in the leading group of our peer companies. This is an excellent achievement and vindication of the efforts of all our businesses and the corporate team.
WATER CONSUMPTIONWe continue to monitor and report on water usage. Businesses incorporate water saving initiatives as they continue to refine production processes; an example of this is Senior Flexonics Brazil where they have installed water treatment plant and equipment to re-use water and to ensure that the water that has been used can be returned back to local fresh water supply.
In 2017 some of our businesses have taken in-house some chemical processing which was previously outsourced. This has meant an increase in water usage at some of these facilities.
WASTE RECYCLEDIn 2016, we recycled 81% of our waste with a number of our businesses achieving zero waste to landfill where local conditions are favourable to recycling opportunities. In 2017 we have achieved a Group figure of 91% of waste recycled or recovered, achieving our 2020 target three years early. This is a result of a concerted effort by the businesses to examine waste stream categorisation and recycling opportunities. The total amount of waste produced by the Group in 2017 reduced by 18% compared to 2016.
60
65
70
75
80
85
90
20142013 2015 2016
CO2 to revenue (tonnes of CO2 emitted per £m revenue)
2017
86.1485.47 85.58
81.28
65.00
Thou
sand
s
CO2 TO TURNOVER
20142013
Thou
sand
s
2015 2016
Energy intensity(MWh/£m revenue)
2017
202204
194
184
171
210
205
200
195
190
185
180
175
170
165
160
ENERGY INTENSITY
20142013
Thou
sand
s
2015 2016
Water intensity(Megalitre/£m turnover)
2017
0.380.36
0.31 0.300.26
0.50
0.45
0.40
0.35
0.30
0.25
0.20
0.15
0.10
0.05
0.00
WATER CONSUMPTION
SUMMARY OF ENVIRONMENTAL PERFORMANCE2013 2014 2015 2016 2017
Energy intensity (MWh/£m revenue) 204 202 194 184 171Scope 1 GHG (tCO2e) 9,466 11,475 12,092 10,906 10,348Scope 2 GHG (tCO2e) 51,151 56,787 56,482 59,578 55,941Scope 3 GHG (tCO2e) 5,631 2,796 4,130 4,089 4,123Tonnes CO2 emitted per £m of revenue 85.47 86.14 85.58 81.28 65Water usage (in megalitres) 275 314 264 288 268Percentage of waste recycled or recovered 71% 81% 82% 81% 91%Water usage per £m of revenue 0.36 0.38 0.31 0.30 0.26
Leadership
A
A
B
B
C
C
D
D
Management
Awareness
Disclosure
This excellent result indicates Senior plc has implemented a range of actions to manage climate change, both in its own operations and beyond. Companies at Leadership level show evidence of at least one of the following: meaningful targets and emissions reduction activities and verified or assured emissions data.
DIVERSITY AND INCLUSIONSenior plc is committed to ensuring equal opportunities, fairness of treatment, dignity, work-life balance and the elimination of all forms of discrimination in the workplace for employees and job applicants. Senior aims to create a working environment in which all individuals can make best use of their skills, free from discrimination or harassment, and in which all decisions are based on merit.
The Group’s Equality, Diversity and Inclusion policy is contained within the Code of Conduct and requires Senior’s employees to treat everyone they meet in the course of business with respect, fairness and dignity. Employees are required to comply with the Code of Conduct and the policies included therein. During the year, all employees received training on the Code of Conduct.
In addition, Senior’s operating businesses adopted local policies as a means of helping to achieve these aims.
The table below shows the diversity of the Senior Group’s Board of Directors, Executive Committee and Operational Senior Management in 2017 by gender.
Gender
Male Female
Total Group 81% 19%Board of Directors 62% 38%Executive Committee 75% 25%Operational Senior Management 88% 12%
The Board seeks to ensure a diverse workforce that supports all employees, irrespective of age, disability, gender, race, religion or sexual orientation. We will not accept any form of unlawful discrimination against our colleagues or any third parties be they potential employees, customers, subcontractors, suppliers or members of the public. All employees have an equal chance to contribute and to achieve their potential. We strive to reflect the diversity of the communities at all levels within our workforce which Senior operates in. Senior plc is an equal opportunities employer.
In accordance with the Equality Act 2010 (Gender Pay Gap Information) Regulations 2017, which came into force in April 2017, Senior has undertaken a gender pay gap reporting exercise, the results of which will be published on the Company’s website in line with requirements.

SENIOR PLC ANNUAL REPORT & ACCOUNTS 2017 35
ST
RA
TE
GIC
RE
PO
RT
34 SENIOR PLC ANNUAL REPORT & ACCOUNTS 2017
STRATEGIC REPORTA
DD
ITIO
NA
L INFO
RM
AT
ION
FINA
NC
IAL S
TAT
EM
EN
TS
GO
VE
RN
AN
CE
KEY PERFORMANCE INDICATORS
The Group’s financial objectives are as follows:
• to achieve organic revenue growth (at constant exchange rates) in excess of the rate of inflation;
• to increase the Group’s return on revenue margin each year;
• to increase adjusted earnings per share on an annual basis by more than the rate of inflation;
• to generate sufficient cash to enable the Group to fund future growth and to follow a progressive dividend policy; and
• to maintain an overall return on capital employed in excess of the Group’s cost of capital and to target a pre-tax return in excess of 15%.
These financial objectives are supported by two non-financial objectives:
• to reduce the Lost Time Injury Rate (per 100 employees) to 0.5 by 2020; and
• to reduce the Group’s energy intensity (tonnes CO2 per £m revenue) to 77 by 2020.
The key performance indicators (KPIs) are determined as follows:
• Organic revenue growth is the rate of growth of Group revenue, at constant exchange rates, excluding the effect of acquisitions and discontinued activities.
• Return on revenue margin is the Group’s adjusted operating profit divided by revenue. Adjusted operating profit is defined in Note 9.
• Adjusted earnings per share are defined in Note 12.
• Net cash from operating activities is available from the Consolidated Cash Flow Statement.
• Return on capital employed is the Group’s adjusted operating profit divided by the average of the capital employed at the start and end of the period, capital employed being total equity plus net debt (defined in Note 32c).
• CO2 emissions/£m revenue is an estimate of the Group’s carbon dioxide emissions in tonnes divided by the Group’s revenue in £ millions.
• Lost time injury frequency rate is the number of OSHA (or equivalent) recordable injury and illness cases involving days away from work per 100 employees.
The Group collects its environmental data in accordance with the guidelines specified by the Global Reporting Initiative (GRI), to the extent that this is currently practicable, and has applied the greenhouse gas conversion factors contained within the GRI Guidelines and the Defra/DECC’s 2016 Conversion Factors for Company Reporting. The Group has used the financial control approach to define its organisational boundary and reports data from its wholly-owned or majority-owned operations. Billed or metered sources represent the basis of the majority of our greenhouse gas emissions.
Despite 2017 being a challenging year for the Group, three out of five financial targets were met. In addition, good progress was made towards the two non-financial objectives and the Group was pleased to see CO2 emissions and Lost Time Injury Rates decrease in 2017. The Group remains on track to meet its 2020 safety, energy and water usage improvement goals. Further details of the Group’s performance record in this regard, including its long-term performance trends, are shown on pages 30 to 33.
A summary of the year-on-year movements in these KPIs and the main drivers of the changes are described opposite.
ORGANIC REVENUE GROWTH (£M)
+6.3%
16 17
9621,023
The Group delivered strong organic revenue growth due to positive contribution from both divisions. In Aerospace, growth was primarily driven by increased build rates on large commercial aircraft programmes, partly offset partly by lower revenue from certain military programmes. Increased revenue in Flexonics was driven by revenue growth from truck and off-highway and upstream oil and gas markets.
NET CASH FROM OPERATING ACTIVITIES (£M)
+10.6%
15 16 17
99.4 100.3110.9
The Group’s net cash from operating activities has improved. The Group has been able to fund an increased level of capital expenditure of 1.3 times depreciation and proposes a 5.8% increase in the annual dividend. Capital expenditure is defined as purchase, net of disposal, of property, plant and equipment and intangible assets. Depreciation comprises depreciation of property, plant and equipment and amortisation of intangible assets excluding those from acquisitions.
ADJUSTED EARNINGS PER SHARE (P)
+0.1%
15 16 17
18.98
14.37 14.39
The Group benefited from a reduction in its adjusted tax rate (as defined on page 21) to 17.5% which offset the 3% reduction in adjusted profit before tax (defined in Note 9) and resulted in a 0.1% improvement in adjusted earnings per share.
CARBON DIOXIDE EMISSIONS (TONNES/£M REVENUE)
18% DECREASE
15 16 17
85.6 81.3
65.0
The Group has achieved an 18% reduction in carbon dioxide emissions (CO2e) per £m revenue. This has been realised in the main by the reduction in emission factors for electrical (scope 2) emissions in some of our operational regions (due to a different, less carbon intensive fuel mix). We are mindful that these could rise again in the future depending on commodity costs, fuel source availability and local policy objectives.
RETURN ON REVENUE MARGIN (%)
-1.2ppts
15 16 17
12.7
9.38.1
During the year, the Group experienced a number of factors that reduced the margin. Aerospace margins were impacted by volume reductions on mature programmes and the ramp-up of new aircraft production programmes. Margins in Flexonics were impacted by the mix of markets driving volume growth.
RETURN ON CAPITAL EMPLOYED (%)
-1.0ppts
15 16 17
18.9
12.9 11.9
The Group’s return on capital employed reduced in 2017 to 11.9% due to the impact of lower profits compounded by increased capital expenditure.
LOST TIME INJURY FREQUENCY RATE (INCIDENTS PER 100 EMPLOYEES P.A.)
28% DECREASE
15 16 17
1.030.93
0.67
The Group continued to focus on the Zero Harm programme with the addition of behavioural safety into our Zero Harm programme. In 2017 we achieved a 28% reduction in the Lost Time Injury Rate and a 23% reduction in the total Recordable Injury Rate. In 2018 the Zero Harm programme will continue to evolve as we embed our “Essential Behaviours for Health and Safety” into our safety management processes.
ApprovalThe Strategic Report from pages 1 to 35 was approved by the Board of Directors on 23 February 2018 and signed on its behalf by
David Squires Group Chief Executive
The Group highlights five financial and two non-financial metrics to measure progress in implementing its strategy.
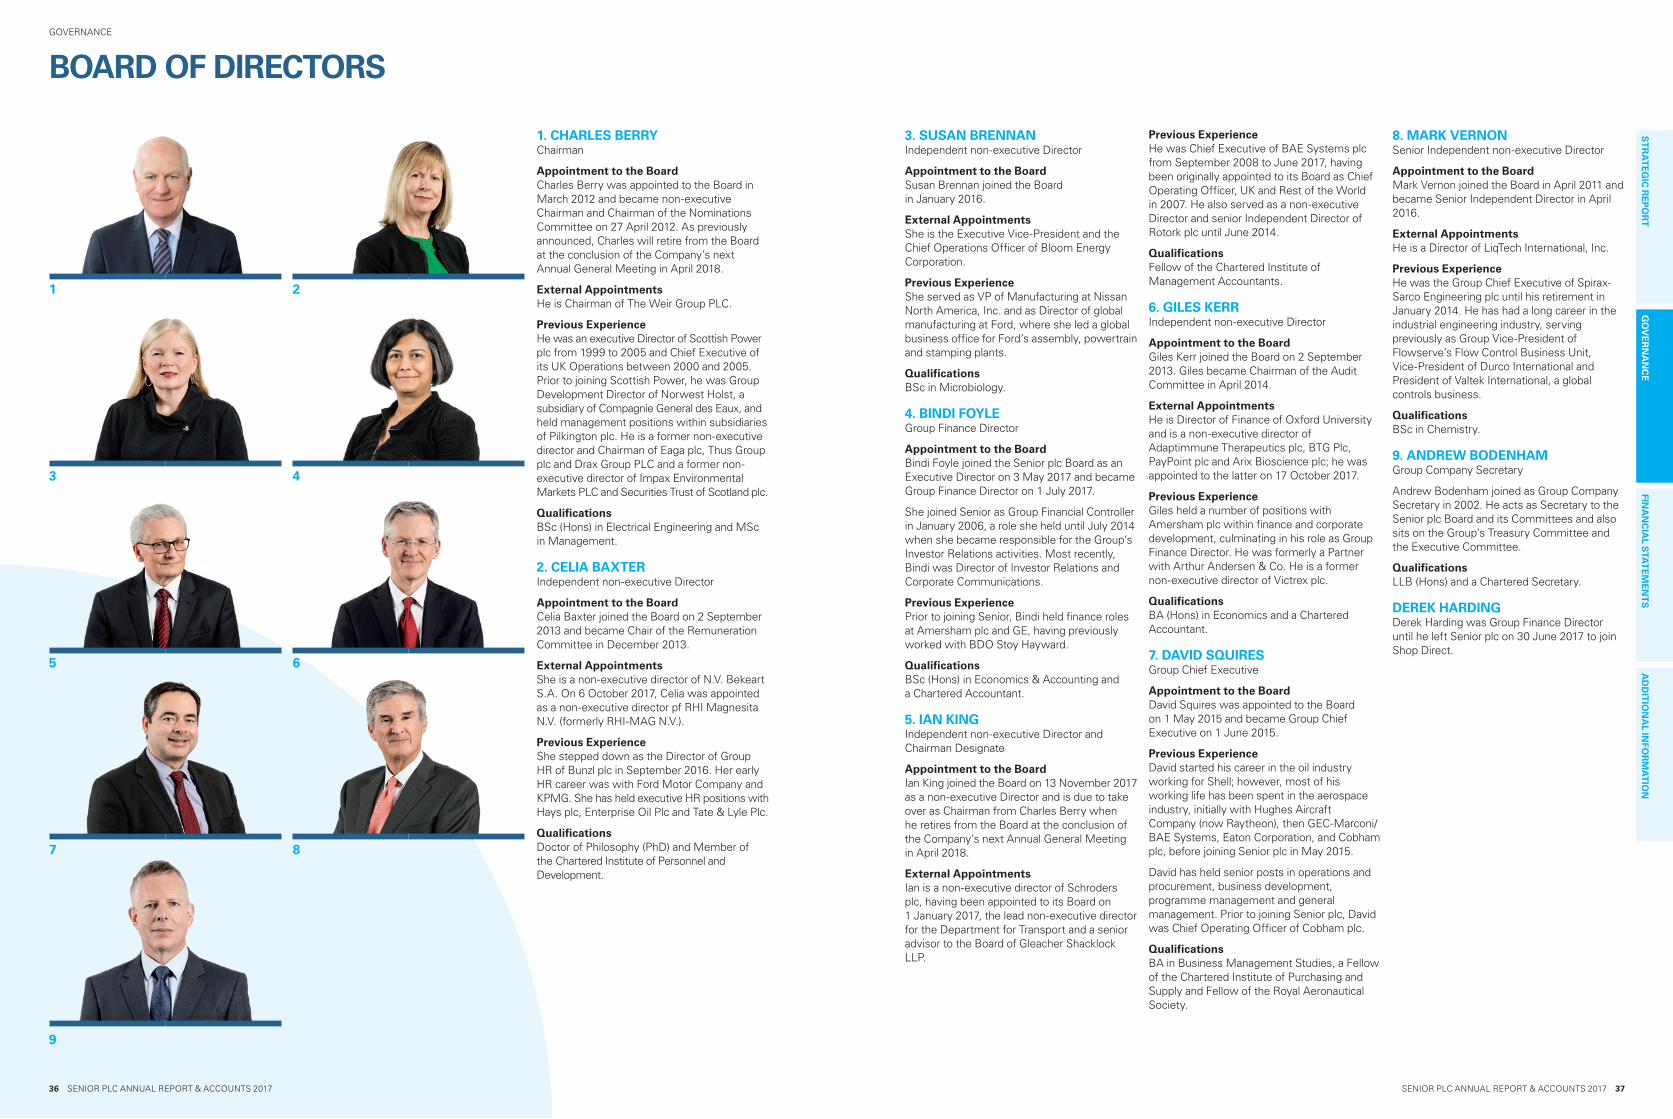
SENIOR PLC ANNUAL REPORT & ACCOUNTS 2017 37
FINA
NC
IAL S
TAT
EM
EN
TS
AD
DIT
ION
AL IN
FOR
MA
TIO
N
36 SENIOR PLC ANNUAL REPORT & ACCOUNTS 2017
GOVERNANCE
36 SENIOR PLC ANNUAL REPORT & ACCOUNTS 2017
ST
RA
TE
GIC
RE
PO
RT
GO
VE
RN
AN
CE
BOARD OF DIRECTORS
3. SUSAN BRENNAN Independent non-executive Director
Appointment to the BoardSusan Brennan joined the Board in January 2016.
External AppointmentsShe is the Executive Vice-President and the Chief Operations Officer of Bloom Energy Corporation.
Previous ExperienceShe served as VP of Manufacturing at Nissan North America, Inc. and as Director of global manufacturing at Ford, where she led a global business office for Ford’s assembly, powertrain and stamping plants.
QualificationsBSc in Microbiology.
4. BINDI FOYLE Group Finance Director
Appointment to the BoardBindi Foyle joined the Senior plc Board as an Executive Director on 3 May 2017 and became Group Finance Director on 1 July 2017.
She joined Senior as Group Financial Controller in January 2006, a role she held until July 2014 when she became responsible for the Group’s Investor Relations activities. Most recently, Bindi was Director of Investor Relations and Corporate Communications.
Previous ExperiencePrior to joining Senior, Bindi held finance roles at Amersham plc and GE, having previously worked with BDO Stoy Hayward.
QualificationsBSc (Hons) in Economics & Accounting and a Chartered Accountant.
5. IAN KINGIndependent non-executive Director and Chairman Designate
Appointment to the BoardIan King joined the Board on 13 November 2017 as a non-executive Director and is due to take over as Chairman from Charles Berry when he retires from the Board at the conclusion of the Company’s next Annual General Meeting in April 2018.
External AppointmentsIan is a non-executive director of Schroders plc, having been appointed to its Board on 1 January 2017, the lead non-executive director for the Department for Transport and a senior advisor to the Board of Gleacher Shacklock LLP.
Previous ExperienceHe was Chief Executive of BAE Systems plc from September 2008 to June 2017, having been originally appointed to its Board as Chief Operating Officer, UK and Rest of the World in 2007. He also served as a non-executive Director and senior Independent Director of Rotork plc until June 2014.
QualificationsFellow of the Chartered Institute of Management Accountants.
6. GILES KERRIndependent non-executive Director
Appointment to the BoardGiles Kerr joined the Board on 2 September 2013. Giles became Chairman of the Audit Committee in April 2014.
External AppointmentsHe is Director of Finance of Oxford University and is a non-executive director of Adaptimmune Therapeutics plc, BTG Plc, PayPoint plc and Arix Bioscience plc; he was appointed to the latter on 17 October 2017.
Previous ExperienceGiles held a number of positions with Amersham plc within finance and corporate development, culminating in his role as Group Finance Director. He was formerly a Partner with Arthur Andersen & Co. He is a former non-executive director of Victrex plc.
QualificationsBA (Hons) in Economics and a Chartered Accountant.
7. DAVID SQUIRESGroup Chief Executive
Appointment to the BoardDavid Squires was appointed to the Board on 1 May 2015 and became Group Chief Executive on 1 June 2015.
Previous ExperienceDavid started his career in the oil industry working for Shell; however, most of his working life has been spent in the aerospace industry, initially with Hughes Aircraft Company (now Raytheon), then GEC-Marconi/BAE Systems, Eaton Corporation, and Cobham plc, before joining Senior plc in May 2015.
David has held senior posts in operations and procurement, business development, programme management and general management. Prior to joining Senior plc, David was Chief Operating Officer of Cobham plc.
QualificationsBA in Business Management Studies, a Fellow of the Chartered Institute of Purchasing and Supply and Fellow of the Royal Aeronautical Society.
8. MARK VERNON Senior Independent non-executive Director
Appointment to the BoardMark Vernon joined the Board in April 2011 and became Senior Independent Director in April 2016.
External AppointmentsHe is a Director of LiqTech International, Inc.
Previous ExperienceHe was the Group Chief Executive of Spirax-Sarco Engineering plc until his retirement in January 2014. He has had a long career in the industrial engineering industry, serving previously as Group Vice-President of Flowserve’s Flow Control Business Unit, Vice-President of Durco International and President of Valtek International, a global controls business.
QualificationsBSc in Chemistry.
9. ANDREW BODENHAM Group Company Secretary
Andrew Bodenham joined as Group Company Secretary in 2002. He acts as Secretary to the Senior plc Board and its Committees and also sits on the Group’s Treasury Committee and the Executive Committee.
QualificationsLLB (Hons) and a Chartered Secretary.
DEREK HARDING Derek Harding was Group Finance Director until he left Senior plc on 30 June 2017 to join Shop Direct.
1. CHARLES BERRY Chairman
Appointment to the BoardCharles Berry was appointed to the Board in March 2012 and became non-executive Chairman and Chairman of the Nominations Committee on 27 April 2012. As previously announced, Charles will retire from the Board at the conclusion of the Company’s next Annual General Meeting in April 2018.
External AppointmentsHe is Chairman of The Weir Group PLC.
Previous ExperienceHe was an executive Director of Scottish Power plc from 1999 to 2005 and Chief Executive of its UK Operations between 2000 and 2005. Prior to joining Scottish Power, he was Group Development Director of Norwest Holst, a subsidiary of Compagnie General des Eaux, and held management positions within subsidiaries of Pilkington plc. He is a former non-executive director and Chairman of Eaga plc, Thus Group plc and Drax Group PLC and a former non-executive director of Impax Environmental Markets PLC and Securities Trust of Scotland plc.
QualificationsBSc (Hons) in Electrical Engineering and MSc in Management.
2. CELIA BAXTERIndependent non-executive Director
Appointment to the BoardCelia Baxter joined the Board on 2 September 2013 and became Chair of the Remuneration Committee in December 2013.
External AppointmentsShe is a non-executive director of N.V. Bekeart S.A. On 6 October 2017, Celia was appointed as a non-executive director pf RHI Magnesita N.V. (formerly RHI-MAG N.V.).
Previous ExperienceShe stepped down as the Director of Group HR of Bunzl plc in September 2016. Her early HR career was with Ford Motor Company and KPMG. She has held executive HR positions with Hays plc, Enterprise Oil Plc and Tate & Lyle Plc.
QualificationsDoctor of Philosophy (PhD) and Member of the Chartered Institute of Personnel and Development.
1 2
3 4
5 6
7 8
9

SENIOR PLC ANNUAL REPORT & ACCOUNTS 2017 39
FINA
NC
IAL S
TAT
EM
EN
TS
AD
DIT
ION
AL IN
FOR
MA
TIO
N
38 SENIOR PLC ANNUAL REPORT & ACCOUNTS 2017
GOVERNANCES
TR
AT
EG
IC R
EP
OR
TG
OV
ER
NA
NC
E
EXECUTIVE COMMITTEE
EXECUTIVE COMMITTEEThe Executive Committee, although not formally appointed as a Committee of the Board, oversees the running of all Senior Group operations.
The purpose of the Executive Committee is to assist the Group Chief Executive in the performance of his duties, including:
• the development and implementation of strategy, operational plans, policies, procedures and budgets;
• the monitoring of operating and financial performance;
• the assessment and control of risk;
• the prioritisation and allocation of resources; and
• the monitoring of competitive forces in each area of operation.
The Committee is also responsible for the consideration of all other matters not specifically reserved for consideration by the Board. A report on the activities of the Executive Committee is provided to the Board by the Group Chief Executive at each Board meeting.
The Committee is comprised of two members of the Board, David Squires and Bindi Foyle**, together with Launie Fleming (Chief Executive of Aerospace Fluid Systems), Joe Mockus* (Chief Executive of Aerospace Structures), Mike Sheppard (Chief Executive of Flexonics), David Beavan (Director of Business Development & Strategy), Andrew Bodenham (Group Company Secretary) and Jane Johnston (Group HR Director).
1. BINDI FOYLE**See biography on page 37.
2. DAVID SQUIRESSee biography on page 37.
3. LAUNIE FLEMINGA US citizen, he has worked for the Group for around 20 years. Launie joined the Executive Committee upon his appointment as Chief Executive of Aerospace Fluid Systems in September 2008. Prior to that appointment, he had been Chief Executive of Senior Aerospace SSP.
4. JOE MOCKUS*A US citizen, he joined the Group in October 2010 as the Chief Executive of Senior Flexonics Bartlett and subsequently added responsibility for the Senior Flexonics businesses in Mexico and India. He was appointed Chief Executive of Aerospace Structures in February 2017. Prior to joining Senior, Joe served as President and COO of Femco Holdings LLC.
5. MIKE SHEPPARD A US citizen, he has worked for the Group for over 30 years and is the Chief Executive of Flexonics. A qualified engineer, Mike’s previous positions within the Group included operational roles at the two largest Flexonics businesses, Pathway and Bartlett.
6. DAVID BEAVANDavid took up the role of Director of Business Development & Strategy (formerly the Head of Business Development) in April 2014. He joined the Group in 2004, when he was appointed the Chief Executive of Senior Aerospace BWT. Prior to joining Senior, David had general management experience within automotive and commercial aircraft 1st tier supplier industries.
HEALTH, SAFETY & ENVIRONMENT (HSE) COMMITTEEThe HSE committee is also not formally appointed as a Committee of the Board, but officially oversees all health, safety and environmental matters across the Group.
Throughout 2017, the members of this committee were: David Squires (Chairman of the committee), Mike Sheppard (Chief Executive of Flexonics), Joe Mockus* (Chief Executive of Aerospace Structures), Launie Fleming (Chief Executive of Aerospace Fluid Systems) and Mark Roden (Group HSE & Sustainability Director). The committee met three times during the year.
7. ANDREW BODENHAMSee biography on page 37.
8. JANE JOHNSTONJane joined the Group on 16 May 2016. A Fellow of the Chartered Institute of Personnel and Development, Jane has considerable experience heading up HR functions across a range of global geographies. She has worked in a number of different sectors including technology, drug development, construction, and professional services and, prior to joining Senior, was Group HR Director at Pace plc.
JERRY GOODWIN*Jerry was a member of the Executive Committee until he left Senior on 31 January 2017 to pursue other interests outside the Group.
DEREK HARDING**Derek was a member of the Executive Committee until he left Senior plc on 30 June 2017 to join Shop Direct.
* Jerry Goodwin was the Chief Executive of Aerospace Structures until he left the Group on 31 January 2017 and was succeeded by Joe Mockus on 1 February 2017.
** Derek Harding was the Group Finance Director until he left the Group on 30 June 2017 and was succeeded by Bindi Foyle on 1 July 2017. Bindi was a member of the Executive Committee prior to her appointment as Group Finance Director.
BOARD AND COMMITTEE MEMBERSHIPMembership and the attendance record of the full Board Meetings and its full Committee Meetings are shown in the table below:
Main Board Audit Committee Nominations Committee Remuneration Committee
Chair Charles Berry Giles Kerr Charles Berry Celia BaxterTotal number of meetings 7 3 4 4Charles Berry 6/7 – 2/4 3/4Celia Baxter 7/7 3/3 4/4 4/4Susan Brennan 7/7 3/3 4/4 4/4Bindi Foyle (1) 5/5 – – –Derek Harding (2) 3/3 – – –Giles Kerr 7/7 3/3 4/4 4/4Ian King(3) 1/1 – 1/1 1/1David Squires 7/7 – – –Mark Vernon 7/7 2/3 3/4 4/4
(1) Bindi Foyle – Executive Director joined the Board on 3 May 2017. (2) Derek Harding – Executive Director retired from the Board on 30 June 2017. (3) Ian King – Non-executive Director joined the Board on 13 November 2017.
1 2
3 4
5 6
7 8

SENIOR PLC ANNUAL REPORT & ACCOUNTS 2017 41
FINA
NC
IAL S
TAT
EM
EN
TS
AD
DIT
ION
AL IN
FOR
MA
TIO
N
40 SENIOR PLC ANNUAL REPORT & ACCOUNTS 2017
GOVERNANCES
TR
AT
EG
IC R
EP
OR
TG
OV
ER
NA
NC
E
REPORT OF THE DIRECTORS
The Directors present their Report and supplementary reports, together with the audited Financial Statements for the year ended 31 December 2017.ACTIVITIES AND BUSINESS REVIEWSenior plc is a holding company. The nature of the Group’s operations and its principal activities are set out in the Strategic Report on pages 1 to 19. Its Group undertakings are shown on pages 121 and 122. The Strategic Report includes details of the market overview; key growth drivers; Senior’s business model; strategic objectives; risks and uncertainties; key performance indicators and a summary of the Group’s 2017 performance.
ACQUISITIONS AND DISPOSALSOn 7 September 2017, the Group sold the business and assets of Senior Aerospace BWT’s facility based at Ilkeston, UK; the details can be found in Note 31 to the Consolidated Financial Statements.
RESULTS AND DIVIDENDSThe results for the year are shown in the Consolidated Income Statement on page 76.
An interim dividend of 2.05 pence per share (2016 – 1.95 pence) has already been paid and the Directors recommend a 2017 final dividend of 4.90 pence per share (2016 – 4.62 pence). The final dividend, if approved, will be payable on 31 May 2018 to shareholders on the register at the close of business on 4 May 2018. This would bring the total dividend for the year to 6.95 pence per share (2016 – 6.57 pence).
SHARE CAPITALThe Company has one class of ordinary shares, which carries no right to a fixed income. Each share carries the right to vote at general meetings of the Company. The Company issued 1,832 new shares in 2017, as shown in the table below:
Shares in issue at 1 January 2017 419,416,250
Senior plc Long-Term Incentive Plan 0
Senior plc Savings-Related Share Option Plan 1,832
Shares in issue at 31 December 2017 419,418,082
Further share capital details are given in Note 35.
Details of employee share plans are set out in Note 34.
There are no specific restrictions on the size of a holding nor on the transfer of shares, which are both governed by the general provisions of the Company’s Articles of Association and prevailing legislation. The Directors are not aware of any agreements between holders of the Company’s shares that may result in restrictions on the transfer of securities or on voting rights. No person has any special rights of control over the Company’s share capital, and all issued shares are fully paid.
With regard to the appointment and replacement of Directors, the Company is governed by its Articles of Association, the UK Corporate Governance Code, the Companies Act 2006 and related legislation. The Articles may be amended by special resolution of the shareholders. The powers of Directors are described in the Matters Reserved for the Senior plc Board, which may be found on the Company’s website. Each year, shareholder approval is sought to renew the Board’s authority to allot relevant securities.
There are also a number of other agreements that take effect, alter or terminate upon a change of control of the Company, such as commercial contracts, bank loan agreements, property lease arrangements, and employee share plans. None of these are considered to be significant in terms of their likely impact on the business of the Group as a whole. Furthermore, the Directors are not aware of any agreements between the Company and its Directors or employees that provide for compensation for loss of office or employment that occurs because of a takeover bid.
FINANCIAL INSTRUMENTSNote 20 contains disclosures on financial instruments.
DIRECTORSDetails of the Directors who served throughout the year can be found on pages 36 and 37. The Directors’ interests in the shares of the Company are included in the Directors’ Remuneration Report on page 67. No Director has any interest in contracts with the Company or its subsidiary undertakings. As shown on page 37, Susan Brennan is Executive Vice President and the Chief Operations Officer of Bloom Energy Corporation. Note 52 provides details of the contract Bloom Energy has with a Group subsidiary. Procedures have been adopted by Bloom Energy which mean Susan Brennan has no involvement in this contract.
The provisions of the UK Corporate Governance Code require that all Directors of FTSE 350 companies should be subject to annual election by shareholders. Celia Baxter, Susan Brennan, Giles Kerr, David Squires and Mark Vernon will all stand for re-election at the AGM to be held in April 2018. Ian King and Bindi Foyle, who were appointed Directors during 2017, will each stand for election at the 2018 AGM. Charles Berry is to retire from the Board at the conclusion of the 2018 AGM, as previously announced, and so will not stand for re-election.
BOARD DIVERSITYSenior remains committed to all aspects of Board diversity including gender, experience, background and personal attributes and will keep under review its balance and composition. The appointments of Celia Baxter to the Board in 2013, Susan Brennan in 2016 and Bindi Foyle in 2017, mean that Senior now has strong female representation on its Board.
DIRECTORS’ INDEMNITIESQualifying third-party indemnity provisions for the benefit of the Directors were renewed by the Company during the year and remain in force at the date of this Report.
RESEARCH AND DEVELOPMENTIn 2017, the Group incurred £25.6m (2016 – £18.7m) on research and development. Product development and improving manufacturing processes represent the primary focus of the Group’s research and development activities.
POLITICAL DONATIONSNo political donations were made by the Group during the year.
EMPLOYEESThe Group promotes the dissemination of relevant information, so that employees are kept regularly advised of Group and local operation developments. Where appropriate, local briefing sessions are held concerning such matters as Group development, corporate ethics, health and safety, pension plans and healthcare benefits.
GREENHOUSE GAS EMISSIONSThe Group has followed the reporting requirements on greenhouse gas emissions, contained in the Companies Act 2006 (Strategic Report and Directors’ Report) Regulations 2013; details of the Group’s greenhouse gas emissions can be found on page 33.
MAJOR SHAREHOLDINGSThe Company had been notified that the following shareholders were interested in 3% or more of the issued share capital of the Company:
07.02.18%
Aberdeen Standard Investments 6.96Allianz Global Investors 6.46BlackRock 4.85Fidelity International 4.57Heronbridge Investment Management 4.36Fidelity Management & Research 3.91Janus Henderson Investors 3.84Legal & General Investment Management 3.81Aberforth Partners 3.41Mensarius 3.30
So far as is known, no other shareholder had a notifiable interest amounting to 3% or more of the issued share capital of the Company, and the Directors believe that the close company provisions of the Income and Corporation Taxes Act 1988 (as amended) do not apply to the Company.
COMPLIANCE WITH THE UK CORPORATE GOVERNANCE CODEThe statement of compliance with the provisions of the UK Corporate Governance Code 2016 issued by the Financial Reporting Council is set out on page 42.
REMUNERATION REPORT AND POLICYThe Directors’ Remuneration Policy was approved by shareholders at the 2017 AGM. The Board has undertaken an extensive review of the Policy and the updated Directors’ Remuneration Policy, which is highlighted in the Remuneration Report on pages 55 to 60, is to be put to shareholder vote at the 2018 AGM.
The Annual Report on Remuneration is also to be put to shareholder vote at the forthcoming AGM.
ANNUAL GENERAL MEETINGThe Notice of Meeting describes the business to be considered at the AGM to be held at 11.30 am on Friday 27 April 2018 at Glazier’s Hall, 9 Montague Close, London Bridge, London SE1 9DD.
ACQUISITION OF THE COMPANY’S OWN SHARESThe Company purchased no ordinary shares of 10p each in the capital of the Company during the year. £0.1m shares were purchased by the Senior plc Employee Benefit Trust in the year to satisfy the future vesting of executive share awards. At the end of the year, the Directors had authority, under the shareholders’ resolutions dated 21 April 2017, to make market purchases of the Company’s shares up to an aggregate nominal amount of £42m, which represented approximately 10% of the issued share capital of the Company. A resolution to renew this authority will be proposed at the forthcoming AGM.
AUDITOR• Each of the persons who is a Director of
the Company at the date of approval of this Annual Report confirms that so far as the Director is aware, there is no relevant audit information of which the Company’s Auditor is unaware; and
• the Director has taken all steps that he/she ought to have taken as a Director in order to make himself/herself aware of any relevant audit information and to establish that the Company’s Auditor is aware of that information.
This information is given and should be interpreted in accordance with the provisions of Section 418 of the Companies Act 2006.
In 2016, the Group undertook a formal tender process for its external audit function, with a selected number of audit firms receiving an invitation to tender. Deloitte LLP, the Group’s external auditor from 2000 to 2016, was not invited to tender due to the longevity of its appointment. Following conclusion of the tender process, the Board recommended that KPMG LLP be appointed as the Group’s external acuditor for the financial year commencing 1 January 2017; this was approved by shareholders at the 2017 AGM.
By Order of the Board
Andrew Bodenham Group Company Secretary 23 February 2018

SENIOR PLC ANNUAL REPORT & ACCOUNTS 2017 43
FINA
NC
IAL S
TAT
EM
EN
TS
AD
DIT
ION
AL IN
FOR
MA
TIO
N
42 SENIOR PLC ANNUAL REPORT & ACCOUNTS 2017
GOVERNANCES
TR
AT
EG
IC R
EP
OR
TG
OV
ER
NA
NC
E
CORPORATE GOVERNANCE REPORT
CORPORATE GOVERNANCE REPORTThis Corporate Governance Report describes the manner in which the Company has applied the Main Principles of the UK Corporate Governance Code 2016 (the Corporate Governance Code).
STATEMENT OF COMPLIANCE WITH THE CORPORATE GOVERNANCE CODEThe Company has been in compliance with the Principles set out in Sections A to E of the Corporate Governance Code throughout 2017.
APPLICATION OF THE PRINCIPLES OF THE CORPORATE GOVERNANCE CODEThe Principles of good corporate governance are detailed in the Corporate Governance Code under five areas. These Principles have each been reviewed by the Directors and are commented upon as follows:
Section A: LeadershipThe Board is structured under a non-executive Chairman, and currently includes two executive Directors and five independent non-executive Directors, who were selected for appointment because of their wide industrial and commercial experience. In addition, the Company has an Executive Committee, chaired by the Group Chief Executive, comprising the executive Directors and other key executives within the Group. Details of the members of the Board and of the Executive Committee are summarised on pages 36 to 39.
The Directors consider that an effective Board is in place which leads and controls the Group, with clear divisions of responsibility between the running of the Board and the running of the Group’s businesses.
The Board is responsible for strategic decisions affecting the Group, including the setting of commercial strategy and the approval of Group budgets and financial statements. It also approves significant financial and contractual commitments made by the Group. The Board’s Terms of Reference more fully describe the responsibilities of the Board and may be found on the Company’s website.
The Board delegates a certain number of its responsibilities to the Audit, Remuneration, Nominations, and Health, Safety & Environment Committees. The Group Chief Executive, together with the Executive Committee, is responsible for the implementation of the decisions made by the Board and for the day-to-day conduct of the Group’s operations.
The Board meets formally on a regular basis, seven times in 2017; in addition, there were three meetings of the Audit Committee in 2017, together with four meetings of the Remuneration Committee and four meetings of the Nominations Committee. A table showing Board and Committee meeting
CHAIRMAN’S LETTERI am pleased to present the Group’s Corporate Governance Report for 2017 on behalf of the Board. This report is intended to provide shareholders with a clear and meaningful explanation of what governance means to the Board and how this guides its decision-making process. Good corporate governance is taken seriously across the Group; the Board sets the tone and takes the lead on all governance matters.
I am pleased to confirm that the Board reviewed the requirements of the UK Corporate Governance Code 2016 in 2017 and I confirm that the Company complies, and will continue to do so. The Board notes that in December 2017, the FRC published proposals for a revised UK Corporate Governance Code, and associated revised Guidance on Board Effectiveness, to reflect the changing business environment and help UK companies achieve the highest levels of governance. The Board is committed to ensuring the long-term sustainable growth of the Group, which is key to the updated set of Principles set out in the proposed revised Code.
Charles Berry Chairman
membership and attendance is shown on page 39. Other Committees are appointed by the Board to deal with treasury matters, disclosure matters and specific issues such as acquisitions and disposals.
The minutes arising from all Committee meetings are made available to the Board. Procedures are in place to ensure that all Directors are properly briefed, so that decisions taken by the Board are based on the fullest, up-to-date, available information. The non-executive Directors are encouraged to visit the Group’s operations to meet the local management teams and discuss any issues that they may face. At every Board meeting, there are reviews of health, safety and environmental performance, and operational, financial and administrative matters; social and ethical issues, the agreement of budgets and levels of insurance cover are reviewed whenever appropriate.
There is a procedure by which all Directors can obtain independent professional advice at the Company’s expense in furtherance of their duties, if required.
Section B: EffectivenessThe Company’s Nominations Committee leads the process for Board appointments, and supervises management development and succession planning. It also makes recommendations to the Board on all new Board appointments and re-appointments, further details of which can be found on page 45. The Committee, which consists entirely of non-executive Directors, is chaired by Charles Berry; its composition is shown on page 39, and its Terms of Reference may be found on the Company’s website. The Board considers all non-executive Directors of the Company to be independent, having taken into account a list of relationships and circumstances that may appear relevant in determining independence, in accordance with the Corporate Governance Code.
When appointing new Directors, the Nominations Committee is fully cognisant of the benefits of diversity; the Board’s policy on diversity and inclusion is described on page 32.
Recruitment processes with external consultants were undertaken in 2017, leading to Bindi Foyle being appointed to the Board in May 2017 and Ian King in November 2017. The Nominations Committee, chaired by Mark Vernon, managed the succession planning process to appoint a new Chairman; Charles Berry had no involvement in this process. For details of their recruitment and appointment procedure, please see the Nominations Committee Report on page 45. A summary of the Directors’ biographies appears on pages 36 and 37. All Directors receive induction upon joining the Board and are encouraged to update their knowledge and skills on a frequent basis. In 2017, all Directors received training on statutory matters.
To enable the members of the Board and its Committees to discharge their duties effectively, the Group Company Secretary seeks to ensure that all relevant information is provided to the Directors in a timely manner in advance of meetings.
In 2017, a self-assessment evaluation of the Board and its Committees was undertaken, assisted by Independent Audit Limited. The evaluation findings showed that the Board operated effectively throughout the period and made some suggestions for additional focus. The findings will be used to help support the development of the Board as the Group continues with its strategy to grow profitability, both organically and by acquisition. Independent Audit Limited has no other connection with the Company.
As in prior years, in 2017 the Chairman undertook a review of the performance of all the Directors, with the exception of Ian King, as he had only joined the Board on 13 November 2017; this process involved individual appraisal interviews. The results of the evaluation process are used to improve Board performance and to determine the training needs of each of the Directors. Mark Vernon, in consultation with the other Directors, undertook an evaluation of the Chairman’s performance, and concluded that Charles Berry provided effective leadership of the Board. Based on the results of the performance evaluation process, the Chairman considers that all members of the Board, the Board collectively, and its Committees, continue to contribute effectively to the running of the Company.
In compliance with the Corporate Governance Code, all Directors offered themselves for re-election at the Company’s 2017 AGM. At the 2018 AGM, with the exception of myself, all Directors will again offer themselves for election or re-election. As previously announced, I shall be retiring from the Board at the conclusion of the 2018 AGM, having completed six years’ service as a Director of the Company.
Section C: AccountabilityThe Board determines the nature and extent of the significant actions necessary to achieve its strategic objectives and maintains a sound system of internal control. The Company’s Audit Committee reports to and, for certain matters, advises the Board of Directors. The Audit Committee Report on pages 46 to 50 describes the role and activities of the Audit Committee, together with the significant issues that it considered in relation to the 2017 Financial Statements and its relationship with the internal and external auditors.
The Group undertook a formal tender process for its external audit service, with a selected number of audit firms receiving an invitation to tender. Deloitte LLP, the Group’s external auditor from 2000 to 2016, was not invited
to tender due to the longevity of its appointment. Following conclusion of the tender process, the Board recommended that KPMG LLP be appointed as the Group’s external auditor for the financial year commencing 1 January 2017; this was approved by shareholders at the 2017 AGM. With effect from 6 July 2017, Deloitte resigned as the Group’s external auditor; in accordance with Section 519 of the Companies Act 2006, Deloitte confirmed that it was not aware of any circumstances that needed to be brought to the attention of the Company’s shareholders and creditors. On 13 July 2017, the Company published a regulatory news announcement and, in accordance with Section 520(2) of the Companies Act 2006, wrote to all shareholders informing them of Deloitte’s resignation and providing a copy of its Statement of Circumstances, stating that the Company had undertaken a competitive tender process for the position of statutory auditor and the Company had decided not to re-appoint Deloitte LLP.
At the 2018 AGM, the Board will be seeking shareholder approval for a revised Directors’ Remuneration Policy, details of which can be found on pages 55 to 60. In accordance with good practice, towards the end of 2017, the Remuneration Committee sought the views of the Company’s largest shareholders regarding the potential changes it might make to the Remuneration Policy.
Communicating the Code of Conduct and operating with integrityIn 2016, the executive Directors published a booklet for issue to all employees and third parties, explaining the Group’s revised Code of Conduct (the Code) and Senior’s Values, which can be found on page 10. The booklet includes a message from the Group Chief Executive, explaining that it is his unshakeable belief that how you do business is as important as what you do in business. The booklet contains work-related scenarios, together with a selection of questions and answers, to help employees to understand the Code and relate it to their individual roles and working environment. Copies of the Code are issued to all new employees and reissued periodically to ongoing employees to remind them of the required level of conduct.
Senior trains its employees on the requirements of its Code upon induction, educating them on what they can and cannot do, and how to address any ethical dilemmas they may face. The Group’s ethical procedures and Code were reviewed in the light of the UK Bribery Act 2010; an enhanced Code of Conduct training programme was rolled out across the Group to all employees in 2016 and subsequently to all new employees. Also in 2016, Preventing Bribery & Corruption training was provided to employees who had outward-facing roles in management, finance, procurement, sales and human resources.
In 2017, an advanced Code of Conduct training course, together with ‘Ethical Behaviour: Acting with Integrity’ training, were rolled out to all employees across the Group. Between them, the Group Chief Executive, the Group Finance Director and the rest of the Executive Committee visit all of the Group’s operations on an annual basis and make presentations to local senior management, reinforcing the Code and the importance of maintaining an absolute commitment to the highest standards of ethics and a zero tolerance towards bribery and corruption. The Board verifies compliance with the Code through its internal audit programme, ensuring that employees have received the mandatory training and that the Group’s businesses operate with integrity at all times and in compliance with the Code.
Operating with integrity and in an ethical manner builds trust with customers and other stakeholders and underpins the Board’s strategic objectives.
Human rightsThe Group recognises the importance of the Universal Declaration of Human Rights and adheres to the core principles and values defined within it. The majority of countries in which Senior operates have their own laws banning child labour and promoting human rights. Senior monitors the ages of its workforce across the world to ensure compliance and identify any potential succession issues.
Senior is committed to preventing slavery and human trafficking in its corporate activities and throughout its supply chain. In 2017, in order to raise awareness of modern slavery issues, all employees received training on ‘Supporting Human Rights: Modern Slavery Act’ to help identify and prevent slavery and human trafficking. Additional work was undertaken during the year with our supply chain to further reduce the potential exposure.
Senior does not restrict any of its employees in any of the countries in which it operates from joining a trade union if they wish to do so. Senior also works closely with its suppliers to ensure that they at least meet internationally recognised minimum requirements for workers’ welfare and conditions of employment.
Reporting and investigating concerns and whistle-blowingThe Company encourages its employees to discuss any ethical concerns that they may have with local management, or at Group level if more appropriate.
As part of its internal control procedures, the Company has a Whistle-blowing Policy that is communicated throughout the Group. This policy provides employees with the opportunity to report suspected unethical or illegal corporate conduct confidentially and anonymously. All reports of suspected unethical or illegal corporate conduct are
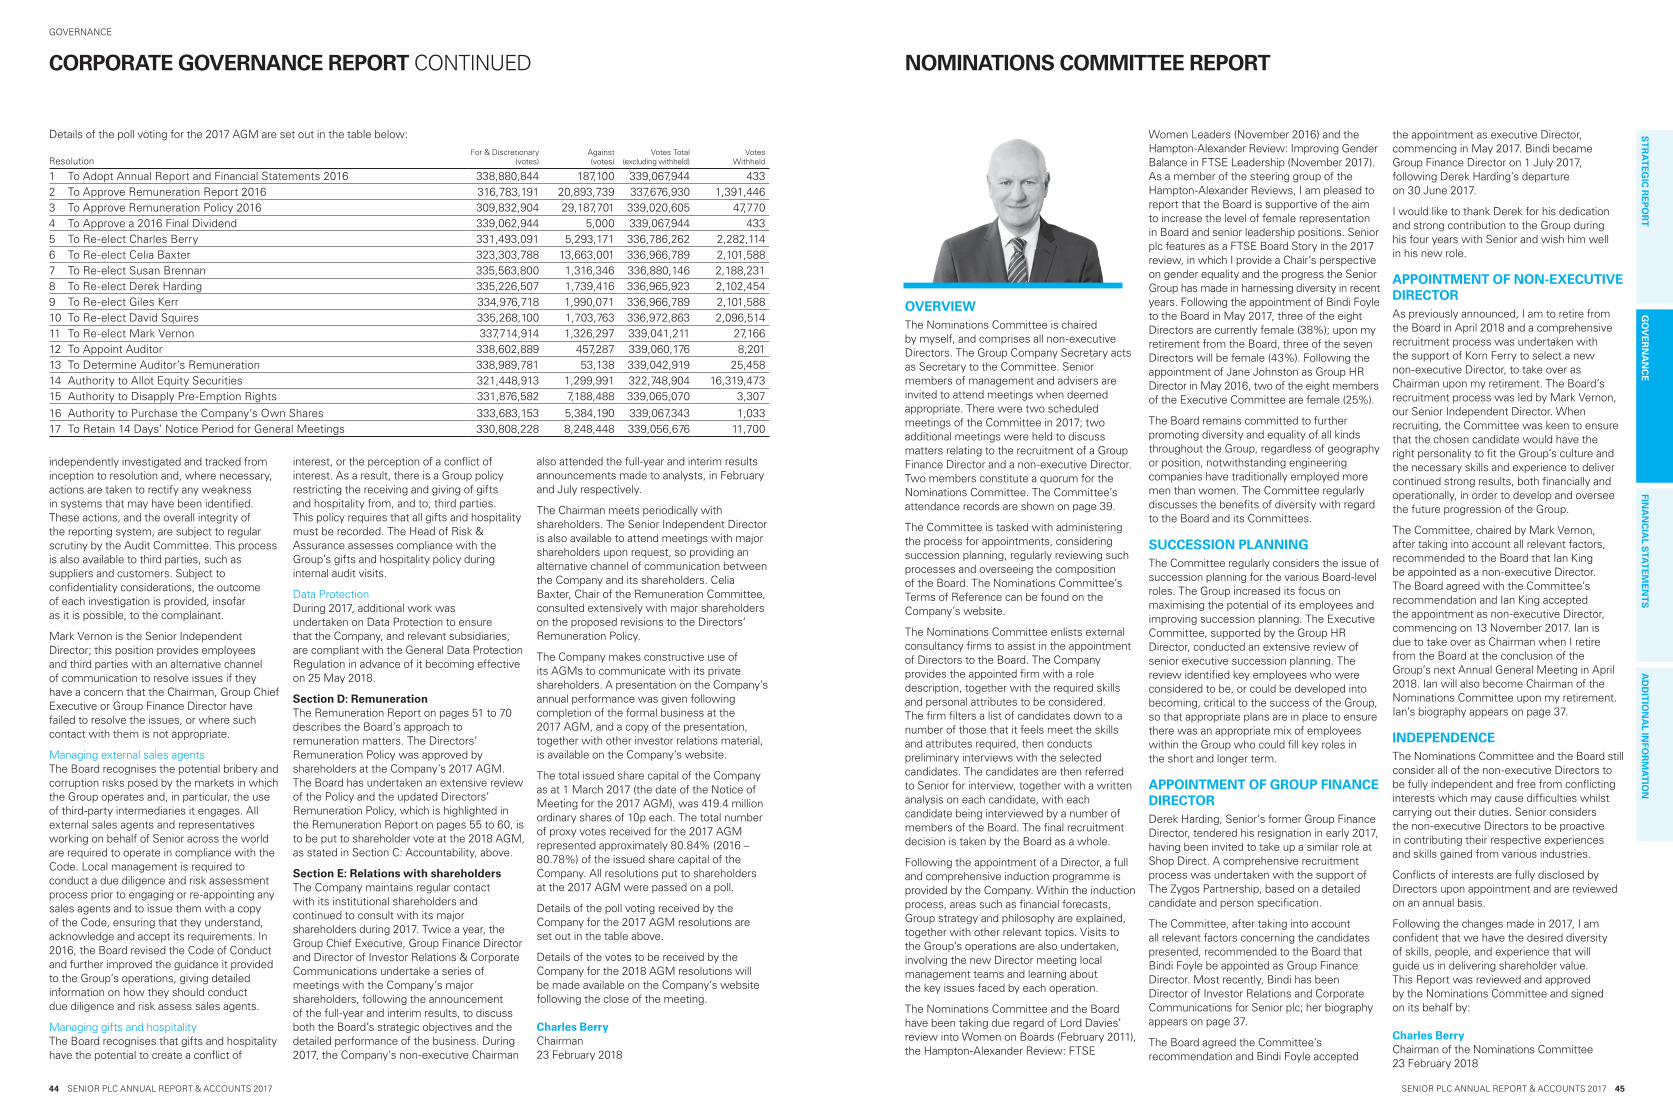
SENIOR PLC ANNUAL REPORT & ACCOUNTS 2017 45
FINA
NC
IAL S
TAT
EM
EN
TS
AD
DIT
ION
AL IN
FOR
MA
TIO
N
44 SENIOR PLC ANNUAL REPORT & ACCOUNTS 2017
GOVERNANCES
TR
AT
EG
IC R
EP
OR
TG
OV
ER
NA
NC
E
CORPORATE GOVERNANCE REPORT CONTINUED
independently investigated and tracked from inception to resolution and, where necessary, actions are taken to rectify any weakness in systems that may have been identified. These actions, and the overall integrity of the reporting system, are subject to regular scrutiny by the Audit Committee. This process is also available to third parties, such as suppliers and customers. Subject to confidentiality considerations, the outcome of each investigation is provided, insofar as it is possible, to the complainant.
Mark Vernon is the Senior Independent Director; this position provides employees and third parties with an alternative channel of communication to resolve issues if they have a concern that the Chairman, Group Chief Executive or Group Finance Director have failed to resolve the issues, or where such contact with them is not appropriate.
Managing external sales agentsThe Board recognises the potential bribery and corruption risks posed by the markets in which the Group operates and, in particular, the use of third-party intermediaries it engages. All external sales agents and representatives working on behalf of Senior across the world are required to operate in compliance with the Code. Local management is required to conduct a due diligence and risk assessment process prior to engaging or re-appointing any sales agents and to issue them with a copy of the Code, ensuring that they understand, acknowledge and accept its requirements. In 2016, the Board revised the Code of Conduct and further improved the guidance it provided to the Group’s operations, giving detailed information on how they should conduct due diligence and risk assess sales agents.
Managing gifts and hospitalityThe Board recognises that gifts and hospitality have the potential to create a conflict of
interest, or the perception of a conflict of interest. As a result, there is a Group policy restricting the receiving and giving of gifts and hospitality from, and to, third parties. This policy requires that all gifts and hospitality must be recorded. The Head of Risk & Assurance assesses compliance with the Group’s gifts and hospitality policy during internal audit visits.
Data ProtectionDuring 2017, additional work was undertaken on Data Protection to ensure that the Company, and relevant subsidiaries, are compliant with the General Data Protection Regulation in advance of it becoming effective on 25 May 2018.
Section D: RemunerationThe Remuneration Report on pages 51 to 70 describes the Board’s approach to remuneration matters. The Directors’ Remuneration Policy was approved by shareholders at the Company’s 2017 AGM. The Board has undertaken an extensive review of the Policy and the updated Directors’ Remuneration Policy, which is highlighted in the Remuneration Report on pages 55 to 60, is to be put to shareholder vote at the 2018 AGM, as stated in Section C: Accountability, above.
Section E: Relations with shareholdersThe Company maintains regular contact with its institutional shareholders and continued to consult with its major shareholders during 2017. Twice a year, the Group Chief Executive, Group Finance Director and Director of Investor Relations & Corporate Communications undertake a series of meetings with the Company’s major shareholders, following the announcement of the full-year and interim results, to discuss both the Board’s strategic objectives and the detailed performance of the business. During 2017, the Company’s non-executive Chairman
also attended the full-year and interim results announcements made to analysts, in February and July respectively.
The Chairman meets periodically with shareholders. The Senior Independent Director is also available to attend meetings with major shareholders upon request, so providing an alternative channel of communication between the Company and its shareholders. Celia Baxter, Chair of the Remuneration Committee, consulted extensively with major shareholders on the proposed revisions to the Directors’ Remuneration Policy.
The Company makes constructive use of its AGMs to communicate with its private shareholders. A presentation on the Company’s annual performance was given following completion of the formal business at the 2017 AGM, and a copy of the presentation, together with other investor relations material, is available on the Company’s website.
The total issued share capital of the Company as at 1 March 2017 (the date of the Notice of Meeting for the 2017 AGM), was 419.4 million ordinary shares of 10p each. The total number of proxy votes received for the 2017 AGM represented approximately 80.84% (2016 – 80.78%) of the issued share capital of the Company. All resolutions put to shareholders at the 2017 AGM were passed on a poll.
Details of the poll voting received by the Company for the 2017 AGM resolutions are set out in the table above.
Details of the votes to be received by the Company for the 2018 AGM resolutions will be made available on the Company’s website following the close of the meeting.
Charles Berry Chairman 23 February 2018
Details of the poll voting for the 2017 AGM are set out in the table below:
ResolutionFor & Discretionary
(votes)Against(votes)
Votes Total (excluding withheld)
Votes Withheld
1 To Adopt Annual Report and Financial Statements 2016 338,880,844 187,100 339,067,944 4332 To Approve Remuneration Report 2016 316,783,191 20,893,739 337,676,930 1,391,4463 To Approve Remuneration Policy 2016 309,832,904 29,187,701 339,020,605 47,7704 To Approve a 2016 Final Dividend 339,062,944 5,000 339,067,944 4335 To Re-elect Charles Berry 331,493,091 5,293,171 336,786,262 2,282,1146 To Re-elect Celia Baxter 323,303,788 13,663,001 336,966,789 2,101,5887 To Re-elect Susan Brennan 335,563,800 1,316,346 336,880,146 2,188,2318 To Re-elect Derek Harding 335,226,507 1,739,416 336,965,923 2,102,4549 To Re-elect Giles Kerr 334,976,718 1,990,071 336,966,789 2,101,58810 To Re-elect David Squires 335,268,100 1,703,763 336,972,863 2,096,51411 To Re-elect Mark Vernon 337,714,914 1,326,297 339,041,211 27,16612 To Appoint Auditor 338,602,889 457,287 339,060,176 8,20113 To Determine Auditor’s Remuneration 338,989,781 53,138 339,042,919 25,45814 Authority to Allot Equity Securities 321,448,913 1,299,991 322,748,904 16,319,47315 Authority to Disapply Pre-Emption Rights 331,876,582 7,188,488 339,065,070 3,30716 Authority to Purchase the Company’s Own Shares 333,683,153 5,384,190 339,067,343 1,03317 To Retain 14 Days’ Notice Period for General Meetings 330,808,228 8,248,448 339,056,676 11,700
NOMINATIONS COMMITTEE REPORT
OVERVIEWThe Nominations Committee is chaired by myself, and comprises all non-executive Directors. The Group Company Secretary acts as Secretary to the Committee. Senior members of management and advisers are invited to attend meetings when deemed appropriate. There were two scheduled meetings of the Committee in 2017; two additional meetings were held to discuss matters relating to the recruitment of a Group Finance Director and a non-executive Director. Two members constitute a quorum for the Nominations Committee. The Committee’s attendance records are shown on page 39.
The Committee is tasked with administering the process for appointments, considering succession planning, regularly reviewing such processes and overseeing the composition of the Board. The Nominations Committee’s Terms of Reference can be found on the Company’s website.
The Nominations Committee enlists external consultancy firms to assist in the appointment of Directors to the Board. The Company provides the appointed firm with a role description, together with the required skills and personal attributes to be considered. The firm filters a list of candidates down to a number of those that it feels meet the skills and attributes required, then conducts preliminary interviews with the selected candidates. The candidates are then referred to Senior for interview, together with a written analysis on each candidate, with each candidate being interviewed by a number of members of the Board. The final recruitment decision is taken by the Board as a whole.
Following the appointment of a Director, a full and comprehensive induction programme is provided by the Company. Within the induction process, areas such as financial forecasts, Group strategy and philosophy are explained, together with other relevant topics. Visits to the Group’s operations are also undertaken, involving the new Director meeting local management teams and learning about the key issues faced by each operation.
The Nominations Committee and the Board have been taking due regard of Lord Davies’ review into Women on Boards (February 2011), the Hampton-Alexander Review: FTSE
Women Leaders (November 2016) and the Hampton-Alexander Review: Improving Gender Balance in FTSE Leadership (November 2017). As a member of the steering group of the Hampton-Alexander Reviews, I am pleased to report that the Board is supportive of the aim to increase the level of female representation in Board and senior leadership positions. Senior plc features as a FTSE Board Story in the 2017 review, in which I provide a Chair’s perspective on gender equality and the progress the Senior Group has made in harnessing diversity in recent years. Following the appointment of Bindi Foyle to the Board in May 2017, three of the eight Directors are currently female (38%); upon my retirement from the Board, three of the seven Directors will be female (43%). Following the appointment of Jane Johnston as Group HR Director in May 2016, two of the eight members of the Executive Committee are female (25%).
The Board remains committed to further promoting diversity and equality of all kinds throughout the Group, regardless of geography or position, notwithstanding engineering companies have traditionally employed more men than women. The Committee regularly discusses the benefits of diversity with regard to the Board and its Committees.
SUCCESSION PLANNINGThe Committee regularly considers the issue of succession planning for the various Board-level roles. The Group increased its focus on maximising the potential of its employees and improving succession planning. The Executive Committee, supported by the Group HR Director, conducted an extensive review of senior executive succession planning. The review identified key employees who were considered to be, or could be developed into becoming, critical to the success of the Group, so that appropriate plans are in place to ensure there was an appropriate mix of employees within the Group who could fill key roles in the short and longer term.
APPOINTMENT OF GROUP FINANCE DIRECTORDerek Harding, Senior’s former Group Finance Director, tendered his resignation in early 2017, having been invited to take up a similar role at Shop Direct. A comprehensive recruitment process was undertaken with the support of The Zygos Partnership, based on a detailed candidate and person specification.
The Committee, after taking into account all relevant factors concerning the candidates presented, recommended to the Board that Bindi Foyle be appointed as Group Finance Director. Most recently, Bindi has been Director of Investor Relations and Corporate Communications for Senior plc; her biography appears on page 37.
The Board agreed the Committee’s recommendation and Bindi Foyle accepted
the appointment as executive Director, commencing in May 2017. Bindi became Group Finance Director on 1 July 2017, following Derek Harding’s departure on 30 June 2017.
I would like to thank Derek for his dedication and strong contribution to the Group during his four years with Senior and wish him well in his new role.
APPOINTMENT OF NON-EXECUTIVE DIRECTORAs previously announced, I am to retire from the Board in April 2018 and a comprehensive recruitment process was undertaken with the support of Korn Ferry to select a new non-executive Director, to take over as Chairman upon my retirement. The Board’s recruitment process was led by Mark Vernon, our Senior Independent Director. When recruiting, the Committee was keen to ensure that the chosen candidate would have the right personality to fit the Group’s culture and the necessary skills and experience to deliver continued strong results, both financially and operationally, in order to develop and oversee the future progression of the Group.
The Committee, chaired by Mark Vernon, after taking into account all relevant factors, recommended to the Board that Ian King be appointed as a non-executive Director. The Board agreed with the Committee’s recommendation and Ian King accepted the appointment as non-executive Director, commencing on 13 November 2017. Ian is due to take over as Chairman when I retire from the Board at the conclusion of the Group’s next Annual General Meeting in April 2018. Ian will also become Chairman of the Nominations Committee upon my retirement. Ian’s biography appears on page 37.
INDEPENDENCEThe Nominations Committee and the Board still consider all of the non-executive Directors to be fully independent and free from conflicting interests which may cause difficulties whilst carrying out their duties. Senior considers the non-executive Directors to be proactive in contributing their respective experiences and skills gained from various industries.
Conflicts of interests are fully disclosed by Directors upon appointment and are reviewed on an annual basis.
Following the changes made in 2017, I am confident that we have the desired diversity of skills, people, and experience that will guide us in delivering shareholder value. This Report was reviewed and approved by the Nominations Committee and signed on its behalf by:
Charles Berry Chairman of the Nominations Committee 23 February 2018

SENIOR PLC ANNUAL REPORT & ACCOUNTS 2017 47
FINA
NC
IAL S
TAT
EM
EN
TS
AD
DIT
ION
AL IN
FOR
MA
TIO
N
46 SENIOR PLC ANNUAL REPORT & ACCOUNTS 2017
GOVERNANCES
TR
AT
EG
IC R
EP
OR
TG
OV
ER
NA
NC
E
(1) The Group engaged the services of PwC to perform certain internal audit procedures during 2016.
DEAR SHAREHOLDERThe Audit Committee has been established by the Board and consists entirely of independent non-executive Directors. The primary role of the Audit Committee is to maintain the integrity of the financial reporting of the Group and to ensure appropriate risk management and internal control procedures. To enable the Audit Committee to fulfil this role, its main responsibilities include:
• considering and making recommendations to the Board, and ultimately shareholders for approval, of the appointment of the external auditor, the audit fee, initiating tender processes in accordance with regulatory requirements, and any questions relating to the resignation or dismissal of the external auditor;
• assessing annually the independence and objectivity of the external auditor, its compliance with regulatory requirements and authorising the provision, if any, of non-audit services;
• monitoring the integrity of the half-year and annual Accounts and related formal Company announcements, and reviewing significant financial reporting judgements contained within them, before their submission to the Board;
• reviewing the Company’s statement on the Annual Report & Accounts prior to endorsement by the Board, that taken as a whole the Annual Report & Accounts is fair, balanced and understandable and provides the information necessary to assess the business model, strategy and performance;
• discussing with the external auditor issues and reservations, if any, arising from the interim review and final audit and any other matters the external auditor may raise;
• reviewing and approving the terms of the management representation letter addressed to the external auditor;
• reviewing the longer term viability of the Group;
• reviewing the effectiveness of the internal audit function; considering the major findings of internal audit activities and management’s response; ensuring co-ordination between the internal audit function and the external auditor and ensuring that the former is adequately resourced and has appropriate standing within the Group;
• reviewing the effectiveness of the Group’s internal controls and risk management systems ensuring that the process is active and dynamic;
• understanding the strategy at both Group and operational levels to ensure that business risks and other relevant issues are effectively identified and communicated to the Board;
• ensuring the Company’s corporate ethics, anti-bribery and compliance procedures are up to date in terms of addressing the potential risks of fraud and misconduct;
• assessing the Audit Committee’s capabilities in relation to diversity, risk experience and the financial expertise of its members;
• understanding the implications of forthcoming changes to accounting standards, including the new revenue and financial instrument standards, to be implemented from 2018, and the new leasing standard to be implemented no later than 2019;
• assessing potential IT, cyber security and social media issues in order to manage the Company’s reputational and business continuity risks;
• reviewing the Group’s Whistle-blowing Policy, to ensure that appropriate procedures are in place for employees to raise, in confidence, any concerns that they may have relating to suspected malpractice, illegal acts, omissions or other unethical corporate conduct, regarding financial or other matters; and ensuring that arrangements are in place for investigation of such matters and follow-up action; and
• considering any other topics specifically delegated to the Committee by the Board from time to time.
The Audit Committee is required to report its findings to the Board, identifying any matters where it considers that action or improvement is needed, and to make recommendations as to the steps taken.
COMPOSITION OF THE AUDIT COMMITTEEMember Appointment date
Giles Kerr (Committee Chair)
2 September 2013
Celia Baxter 2 September 2013Susan Brennan 1 January 2016Mark Vernon 22 April 2016
For the attendance record, please see page 39.
Two members constitute a quorum for the Audit Committee. The Group Company Secretary acts as Secretary to the Audit Committee.
Collectively, the members of the Audit Committee have significant commercial and financial experience at a senior management level. Giles Kerr has the recent and relevant financial experience required by the UK Corporate Governance Code to chair the Audit Committee. For details of the qualifications of members of the Audit Committee, please refer to the Board of Directors’ biographies shown on pages 36 and 37.
AUDIT COMMITTEE’S TERMS OF REFERENCEThe Board expects the Audit Committee to have an understanding of:
• the principles, contents and developments in financial reporting, including the applicable accounting standards and statements of recommended practice;
• the key aspects of the Group’s operations, including corporate policies, its products and services, Group financing, and systems of internal control;
• the matters that could influence or distort the presentation of accounts and key figures;
• the principles of, and developments in, company law, sector-specific laws and other relevant corporate legislation;
• the roles of internal and external auditing and risk management; and
• the regulatory framework for the Group’s businesses.
The full Terms of Reference of the Audit Committee may be found on the Company’s website.
ACTIVITIES OF THE AUDIT COMMITTEEThe Audit Committee met on 23 February 2017 to consider the 2016 year-end report and during the subsequent 12 months conducted the following business on the meeting dates indicated below:
Meeting date 25 July 2017 19 October 2017 21 February 2018
Items • Received and considered an Internal Audit Report including Risk & Assurance and Mapping reports presented by the Group’s Head of Risk & Assurance.
• Reviewed key accounting judgements for the half-year ended 30 June 2017.
• Reviewed and agreed the basis for going concern to be adopted for the 2017 Interim Results.
• Reviewed the Tax Memorandum for the half-year ended 30 June 2017.
• Discussed first impressions from audit transition with the external auditor.
• Considered the external auditor’s Interim Review for the half-year ended 30 June 2017.
• Reviewed and approved the terms of the management representation letter addressed to the external auditor.
• Discussed the Group’s draft Announcement of the 2017 Interim Results together with the draft slides for the analysts’ presentation.
• Approved the external audit strategy.• Held a private meeting with the external
auditor, without executive management being present.
• Received and discussed an update on audit transition from the external auditor.
• Discussed and approved the updated external auditor’s audit strategy report for the 2017 audit, including significant risks, other areas of audit focus, the audit cycle and scoping.
• Agreed with the auditor’s proposal to set materiality at 5% of profit before tax.
• Discussed scope-related changes to the audit fee since the audit tender proposal
• Received a technical update from the external auditor on accounting, reporting and corporate governance developments.
• Received and reviewed an accounting update on the UK Reporting on Payment Practices and Performance Regulations and on IFRS changes.
• Received an update to the Group Treasury Policy.
• Received and reviewed the draft “Senior plc Group’s Approach to Tax” policy statement.
• Considered the Group’s Risk & Assurance Strategic Plan and a preliminary view of the 2018 assurance activity.
• Noted a co-source relationship with Deloitte LLP had been established to undertake the internal audit service.
• Received an update on the assessment of Cyber risk and on 2017 Code of Conduct training.
• Noted preparations for the General Data Protection Regulation
• Noted the external performance evaluation of the Audit Committee which was to be undertaken by Independent Audit Limited.
• Agreed the Audit Committee Terms of Reference to remain appropriate, subject to minor amendment.
• Reviewed the Group Whistle-blowing Policy and agreed no changes were required.
• Reviewed the FRC’s Audit Quality Review of Deloitte LLP’s 2016 audit of the Group.
• Reviewed key accounting judgements for the year ended 31 December 2017, including consideration of those significant risks outlined on page 48.
• Reviewed the longer-term viability of the Group and agreed the viability statement on page 23.
• Reviewed and agreed the going concern basis to be adopted for the 2017 Accounts.
• Reviewed the Tax Memorandum for the year ended 31 December 2017.
• Reviewed and accepted the Report to the Audit Committee on the 2017 audit made by the external auditor.
• Approved the Audit Committee Report for 2017.
• Reviewed the effectiveness of the Group’s risk management and internal control systems and disclosures made in the Annual Report & Accounts 2017.
• Reviewed the draft Annual Report & Accounts 2017.
• Discussed the Group’s draft Announcement of the 2017 Final Results together with the draft slides for the analysts’ presentation.
• Reviewed the Notice of Meeting for the 2018 AGM and the Proxy Form for the 2018 AGM.
• Received and considered a report presented by the Group Finance Director, which included the proposed 2018 internal audit plan, and noted progress against the Group’s risk and assurance strategic objectives.
• Held a separate private meeting with the external auditor, without executive management being present.
AUDIT COMMITTEE REPORT

SENIOR PLC ANNUAL REPORT & ACCOUNTS 2017 49
FINA
NC
IAL S
TAT
EM
EN
TS
AD
DIT
ION
AL IN
FOR
MA
TIO
N
48 SENIOR PLC ANNUAL REPORT & ACCOUNTS 2017
GOVERNANCES
TR
AT
EG
IC R
EP
OR
TG
OV
ER
NA
NC
E
AUDIT COMMITTEE REPORT CONTINUED
SIGNIFICANT RISKS CONSIDERED BY THE AUDIT COMMITTEE
Significant risks considered by the Committee How the risk was addressed by the Committee
Inventory net realisable valueInventory held covers a wide range of products in both the Aerospace and Flexonics Divisions. The ability of the Group to sell this inventory at a value above its carrying value in the future can be adversely affected by many factors.
The Audit Committee recognises the risk that the Group may not recover the full cost of inventory via future sales, and may not hold appropriate provisions against obsolete and slow moving inventory.
In addition, a significant change in production costs or in the execution to deliver planned cost savings in relation to specific work packages could result in unavoidable costs associated with one or more work packages to exceed the economic benefits expected to be achieved. This is a key area of judgement and as such the Audit Committee carefully considers executive management’s assumptions relating to the achievability of these plans.
These were further discussed with the external auditor.
The Audit Committee believes there are no reportable issues arising from this significant area.
Other provisionsProvisions or accruals are held where management considers there is an obligation, payment is probable and the amount payable can be reliably estimated.
Provisions held by the Group include but are not limited to:
• those held against legal claims or product warranties; and• central tax provisions.
The Audit Committee considered the basis upon which management had made its accounting judgements to determine the level of other provisions. These were further discussed with the external auditor.
The Audit Committee believes there are no reportable issues arising from these significant areas.
EXTERNAL AUDIT Independence of the external auditor and policy on non-audit servicesTo fulfil its responsibility regarding the independence of the external auditor, the Audit Committee reviewed:
• a report from the external auditor describing the arrangements that had been made to identify, report and manage any conflicts of interest and to maintain its independence; and
• the FRC’s Audit Inspection Unit public report on KPMG LLP.
The Audit Committee’s policy in respect of services provided by the external auditor is as follows:
• the external auditor is invited to provide services which, in its position as auditor, it must or is best placed to undertake. This includes formalities relating to borrowings, shareholder and other circulars, various other regulatory reports and certain work in respect of larger acquisitions and disposals;
• the auditor may provide tax compliance and advice where it is best suited. In all material cases, such work is put out to tender; and
• other services may not be provided where precluded by ethical standards or where the Audit Committee believes that it would compromise audit independence and objectivity.
All proposed contracts for services to be provided by the auditor in excess of £25,000 require the Audit Committee’s approval.
Fees to the external auditor for audit related services undertaken in the year were £0.04m and for other non-audit work were £nil.
In 2017, the Audit Committee considered that it was beneficial for the Company to retain Deloitte LLP for non-audit work services, because of the firm’s expertise in this area and knowledge of the Group. The Audit Committee continues to closely monitor the nature and level of such non-audit work.
Policy on tenderingIn order to maintain auditor independence and comply with FRC and EU guidance on audit tendering, the Group undertook a formal tender of its external audit during the first half of 2016, led by the Audit Committee. A selected number of audit firms received an invitation to tender; Deloitte LLP was not invited to tender due to the longevity of its appointment. The appointment of KPMG LLP as the Group external auditor for the financial year commencing 1 January 2017 received approval by shareholders at the Annual General Meeting held in April 2017. The Board extends its appreciation to Deloitte for its contribution over many years. The Committee reviews annually whether it is appropriate to put the audit out to tender.
Assessment of external audit effectivenessThe Audit Committee reviews the effectiveness of the external auditor at its October meeting. Given the appointment of KPMG LLP during 2017 as the new external auditor (who had not yet concluded the audit), it was not appropriate to perform that evaluation in the financial year ended 31 December 2017. We intend to return to the normal evaluation cycle in the financial year ending 31 December 2018.
On 19 May 2017, the Chairman of the Audit Committee together with the Group Finance Director and the Group Financial Controller also met with the Group external auditor, KPMG LLP following its formal appointment at the Annual General Meeting held in April 2017. During the meeting, the external auditor presented and discussed their audit strategy for the year ending 31 December 2017 which included significant risks, other areas of audit focus, materiality, scoping, audit cycle and changes to the audit fee since the audit tender proposal. An update on audit transition was also discussed. This presentation was subsequently also shared and reviewed with the Audit Committee at its meeting on 19 October 2017.
The Audit Committee normally invites the non-executive Chairman, Group Chief Executive, Group Finance Director, Group Financial Controller, the Group’s Head of Tax and senior representatives of the internal audit function and the external audit firm to attend its meetings, although it reserves the right to request any of these individuals to withdraw from any meeting.
The Audit Committee also holds separate discussions with the Head of Risk & Assurance and the external auditor without executive management being present. In addition, the Chairman of the Audit Committee holds separate meetings with the internal and external auditor during the course of the year to discuss both routine and business-relevant matters.
Periodically, the Audit Committee’s Terms of Reference are reviewed to take into account current views on good practice and any recent amendments to the UK Corporate Governance Code.
In its assessment of risks, the Audit Committee resolved that Goodwill was no longer to be considered a significant risk in terms of a material misstatement, given the available headroom (the extent to which recoverable amount exceeds carrying amount) in the context of the in-year performance, future forecasts and market conditions.

SENIOR PLC ANNUAL REPORT & ACCOUNTS 2017 51
FINA
NC
IAL S
TAT
EM
EN
TS
AD
DIT
ION
AL IN
FOR
MA
TIO
N
50 SENIOR PLC ANNUAL REPORT & ACCOUNTS 2017
GOVERNANCES
TR
AT
EG
IC R
EP
OR
TG
OV
ER
NA
NC
E
AUDIT COMMITTEE REPORT CONTINUED REMUNERATION REPORT: ANNUAL STATEMENT FROM THE CHAIR OF THE REMUNERATION COMMITTEE
INTERNAL AUDITThe Audit Committee is required to assist the Board in fulfilling its responsibilities relating to the effectiveness, resourcing and plans of the Group internal audit function.
In 2017, as set out on pages 24 to 29, the Group further strengthened its risk management procedures and these have been reviewed by the Audit Committee. Risk has been assessed on a top down and bottom up basis. A risk based programme of internal audit has been conducted in the year. This has been delivered internally and, from July 2017, with the assistance of a new co-source partner, Deloitte LLP. To support the effectiveness of the internal audit programme a software tool has been implemented which tracks actions resulting from internal audits. The same tool has also been implemented during the year for the annual control self assessment which all sites complete. Progress has been made in 2017 against the Group Risk & Assurance Strategic Plan developed by the Head of Risk & Assurance in 2016.
The Chairman and non-executive Directors are actively encouraged to visit the Group’s operating businesses unaccompanied by executive Directors. This enables them to meet the local management teams and employees and also undertake site tours to review matters including production methods, health and safety and the status of internal audit findings. In 2017, a total of 19 site visits were undertaken by the Chairman and non-executive Directors. These visits by the Chairman and non-executive Directors are viewed by the Audit Committee as making a positive contribution to the internal control framework.
CONCLUSIONAs a result of its work during the year, the Audit Committee has concluded that it has acted in accordance with its Terms of Reference. At its meeting held on 21 February 2018, the Audit Committee considered each section of the Annual Report & Accounts 2017, and the document as a whole, as proposed by the Company; it reached a conclusion and advised the Board that it considered the Annual Report & Accounts 2017 to be fair, balanced and understandable and that it provided the information necessary for shareholders to assess the Company’s business model and strategy. The Chairman of the Audit Committee will be available at the 2018 AGM to answer any questions about the work of the Committee.
APPROVALThis Report was reviewed and approved by the Audit Committee and signed on its behalf by:
Giles Kerr Chairman of the Audit Committee 23 February 2018
DEAR SHAREHOLDERI am pleased to present the Report of the Remuneration Committee for the financial year ended 31 December 2017. This statement sets out the work of the Committee during the year, provides the context for the decisions taken and also explains the changes we intend to make for 2018.
Senior’s performance during 2017Senior’s vision is to be a trusted and collaborative high value-added engineering and manufacturing company producing sustainable growth in operating profit, cash flow and shareholder value.
Our remuneration policy and practices support this vision with our bonus plans incentivising earnings growth and cash flow and our long-term plans rewarding both the creation of shareholder value and earnings growth.
As explained in the Chairman’s Statement and the Chief Executive’s Review, Senior delivered a solid performance during the year under review after a challenging 2016:
• Group revenue increased to an all-time high;
• Aerospace Division margins were impacted by the transition from more mature to new aircraft production programmes; and
• Margins in Flexonics Division reflected some of the challenging market conditions in the higher-margin segments of the division.
However margins improved in the second half of the year from increased revenues and operational improvements as we continued our cost reduction focus on newer programmes.
The Group continues to generate healthy cash flows and the level of net debt has decreased.
Review of incentive schemes and proposed changes to Senior’s Remuneration PolicyThe performance of the business has formed the backdrop to the Remuneration Committee’s work during 2017. We spent a significant amount of time undertaking a full review of Senior’s incentive programmes. In my statement introducing last year’s Annual Report on Remuneration I noted that the Committee had delayed this review in 2016 due to the recruitment of a new Group HR Director and a review of the Company’s
performance management system. In 2017, with the support of the Group HR Director and the Committee’s new external advisers, we reviewed all aspects of the short- and long-term incentives.
A central conclusion of this review was that the incentives remain broadly fit for purpose and support Senior’s primary strategic objective of creating long-term sustainable growth in shareholder value. The performance metrics in place – EPS, free cash flow and relative TSR – are well understood internally and are also measures used by the investment community to assess Senior’s performance.
We do not, therefore, intend to make radical changes to the structure of incentives or use different performance metrics. However, we intend to make a number of amendments to improve the operation of the incentive schemes:
• In the Annual Bonus Plan, from 2018 onwards we will move to measuring EPS on a constant currency basis in order to reduce the impact of short-term exchange rate movements on annual bonus outcomes. We will also simplify the operation of the Plan by removing the practice of requiring year-on-year EPS growth for a small proportion of the bonus, although the proportion of bonus earned for achieving EPS targets versus free cash flow will remain unchanged. The Adjusted EPS measure within the LTIP with continue to measure year-on-year performance at actual currency rates. Free cash flow will also be retained as a performance condition for a portion of the bonus scheme.
• In the Long-Term Incentive Plan (LTIP), for the award to be granted in early 2018, we will retain the current 50/50 weighting of adjusted EPS and relative TSR performance metrics but we will broaden the TSR comparator group to the FTSE 350, excluding certain sectors with limited direct relevance to Senior and those exhibiting high volatility.
• For the EPS element of the LTIP, we have set a different target range for the award to be granted in early 2018, recognising market conditions as well as internal and external expectations of performance over the next three years:
• Target, where 25% of the award vests, will move from 10% growth in adjusted earnings per share over the performance period to 15%;
• Maximum vesting of 100% of the award will move from 25% to 30% growth in adjusted earnings per share over the performance period.
The Committee considered the inclusion of a return on capital measure in the LTIP. Whilst Senior has an internal ROCE KPI, we have not included this within the remuneration targets as we feel this could cause conflicts between making the right long-term investments versus meeting shorter-term remuneration targets.
Further details of the targets to be set for the 2018 LTIP awards are set out in the Annual Report on Remuneration.
As part of our review, we also considered whether any changes were required to the Remuneration Policy approved by shareholders at last year’s AGM. Our conclusion was that it would be appropriate to ask shareholders to approve a new Policy this year to ensure that we can provide our incentives through an up-to-date pay framework. The key changes we wish to introduce are set out below:
• We propose to increase the shareholding guidelines for the Executive Directors from 100% to 200% of basic salary.
• A two-year post-vesting holding period will be applied to LTIP awards, creating a five-year period between the grant of the awards and their final release. We will also apply the holding period to the LTIP awards to be granted in early 2018, even though this precedes the date of approval of the new policy.
• To drive performance and to support the current momentum in the business, we wish to increase the individual award opportunity under the Annual Bonus Plan from 105% of basic salary to 125% of basic salary to ensure appropriate levels of incentivisation for increased performance. This higher bonus level will apply from 2018 onwards, and we confirm that the increase to the maximum bonus level has been accompanied by an increase in the performance targets required to be met to achieve the maximum payout level. Bonus targets will continue to be disclosed on a retrospective basis in the Annual Report on Remuneration.
• The new policy explicitly states that the Remuneration Committee will have the discretion to adjust bonus targets or outcomes if deemed appropriate, where the bonus outcome feels perverse. This discretion, which is common practice in other companies, is intended to give the Committee an appropriate level of flexibility to deal with exceptional circumstances if and when they arise.

80%
BelowTarget
Target Max. Actual BelowTarget
Target Max. Actual
Group Chief Executive Finance Director
0
525
1,050
1,575
2,100
£000
s20%
628
1,083
24.5%
11.5%
17.5%
6%
31%
38%
46.5%
2,017
12%
40%
1,047
48%25% 86%
14%394
698
25.5%
8% 4%
32%
8%
18%
38%
48.5%
1,324
42%
675
50%26%
Salary
Benefits and Pension
Annual Bonus
Long-Term Share Awards
SENIOR PLC ANNUAL REPORT & ACCOUNTS 2017 53
FINA
NC
IAL S
TAT
EM
EN
TS
AD
DIT
ION
AL IN
FOR
MA
TIO
N
52 SENIOR PLC ANNUAL REPORT & ACCOUNTS 2017
GOVERNANCES
TR
AT
EG
IC R
EP
OR
TG
OV
ER
NA
NC
E
The Committee consulted Senior’s major shareholders and leading proxy advisory bodies in late 2017 on the terms of the new policy as well as the changes we plan to make to the operation of the incentive schemes. I am pleased to say that the majority of those who responded to our consultation were supportive of our proposals.
The new policy is set out in full on pages 55 to 60. Shareholders will be asked to approve the policy at the Annual General Meeting to be held in April 2018. Other than in the event of exceptional circumstances, the Committee does not intend to revert to shareholders with a new Remuneration Policy before the end of the three-year policy period in 2021.
Incentive scheme outcomes for the yearThe Committee spent time after the end of the financial year reviewing the extent to which the targets under the Annual Bonus Plan and LTIP had been met, taking into account performance during 2017.
For the Annual Bonus Plan, we set EPS and cash flow targets at the start of the year which were viewed as challenging but achievable in the context of Senior’s situation coming out of a difficult period. The targets are disclosed in the Annual Report on Remuneration. Awards for the year at 79.05% of maximum reflect the progress the Company has made during the year against the targets set.
Awards made under the LTIP in 2015 were subject to EPS and TSR performance measured over three years up to the end of 2017. Unfortunately, the targets were not achieved and the awards therefore lapsed in full.
The Committee is satisfied that the above outcomes were a fair reflection of the performance of the Company over the relevant performance periods for the incentive schemes.
Review of the Group Chief Executive’s basic salaryAs mentioned in my statement last year, the Committee noted the request of the Group Chief Executive and the then Group Finance Director for no increase to their basic salary to be applied on 1 January 2017. This request was acknowledged by the Committee, but with an intention to review the salaries later in 2017. In last year’s Annual Report on Remuneration, we said that the Committee and the Board would be minded to apply an increase in 2017 if the Group’s financial performance was seen to improve during H1 2017. As a consequence, during the year the Committee reviewed the salary of the Group Chief Executive. The salary for the new Group Finance Director was set at the time of her appointment to the Board in May 2017, and so no further review was undertaken.
We were pleased with progress for H1 2017, including a healthy cash performance for the business. Overall trading for the period was in line with expectations and, in recognition of the underlying strength of the business and its future prospects, the Board approved an interim dividend of 2.05p for H1 2017, an increase of 5% over H1 2016. The market response to the Company’s progress was very positive, with the share price from January to September 2017 (when we reviewed the CEO’s base pay) rising by 40% compared to 3.4% growth for the wider FTSE 350.
Against this backdrop, we applied a 3.2% basic salary increase to the Group Chief Executive with effect from 1 July 2017. We recognise that a mid-year increase is unusual, but we are comfortable that this was the right decision in light of the improvement in Senior’s performance during the first half of the year. We also took into account the fact that the increase for the Group Chief Executive was at a similar level to that enjoyed by employees across the Group more widely, albeit such increases were received from 1 January 2017.
REMUNERATION REPORT: ANNUAL STATEMENT FROM THE CHAIR OF THE REMUNERATION COMMITTEE CONTINUED
2017 REMUNERATION REPORT AT A GLANCE
OVERVIEW OF OUR REMUNERATION FRAMEWORKElement of remuneration Key features
Salary and employment benefits Market competitive to attract and retain high quality executives (including fully expensed car, private medical insurance, life insurance and defined contribution retirement benefits)
Annual bonus:Adjusted EPSFree cash flow
Rewards achievement against annual performance objectives:• Maximum bonus is 105% of salary• 1⁄3 of any award is paid in shares, deferred for three years• Group Chief Executive and Group Finance Director target: 52.5% of salary
Long-Term Incentive Plan:Adjusted EPS (50%)TSR (50%)
Supports the Company’s longer-term strategic aims to create sustainable growth in shareholder value and to incentivise, motivate and retain senior talent:
• Maximum award is 200% of salary but normal awards are 150% of salary• 25% vesting at ‘threshold’
Shareholding requirements Equivalent to 100% of executive Directors’ salaryClawback and malus provisions Unvested Deferred Bonus Award subject to clawback
Long-Term Incentive Plan subject to clawback and malus during the period of three years following the date of vesting
PERFORMANCE HIGHLIGHTS AND INCENTIVE OUTCOMES
Annual bonus Target Actual
Achieved (% of
maximum)
Performance conditionFree cash flow
Full year £38.78m £58.3m 100%Adjusted EPS
Full year internal target 13.59p 14.39p 79.45%Year-on-year growth 14.37p 14.39p 52.00%
Bonus award to Group Chief Executive and Group Finance Director: 79.05% of maximum
Long-Term Incentive Plan (2015 award) Targets (threshold – stretch) Actual
Adjusted EPS (50%) 4% – 10% compound annual average growth above RPI over three years
−11.82% (below threshold)
Total Shareholder Return (50%) TSR ranking: 6.3 (maximum threshold) 15.0 (minimum threshold)
22 ranking (below threshold)
No awards vesting
APPLICATION OF REMUNERATION POLICYThe chart below shows how the composition of each of the executive Directors’ packages varies at different levels of performance under the proposed 2018 Remuneration Policy. The assumptions noted for ‘target’ performance in the graph below are provided for illustration purposes only.
This chart is based on the following assumptions:
Threshold Target Maximum
Fixed pay Salary is the 2018 basic salary
The value of Benefits and Pension is taken from the single total figure of remuneration for 2017
Annual bonus
Nil 52.5% of 2018 basic salary
125% of 2018 basic salary
Long-term share awards
Nil 25% vesting under the LTIP (i.e. 25% of (150% x 2018 basic salary)) and set out at face value, with no share price growth or dividend assumptions
100% vesting under the LTIP (i.e. 100% of (150% x 2018 basic salary)) and set out at face value, with no share price growth or dividend assumptions
Implementation of the Remuneration Policy for 2018The basic salaries of the Group Chief Executive and Group Finance Director have been increased by 3% and 4% respectively with effect from 1 January 2018, broadly in line with the increase applied to the wider workforce.
Subject to shareholder approval of the new remuneration policy, the executive Directors will be eligible for a maximum bonus equivalent to 125% of basic salary. Bonuses will be payable subject to the satisfaction of performance targets linked to EPS and cash flow targets.
As noted above, LTIP awards will be granted to both executive Directors subject to the satisfaction of challenging three-year targets linked to EPS growth and relative TSR, with the application of a two-year holding period on vested awards. Awards will be granted at a level of 150% of basic salary, the same as in previous years.
More information is provided in the Annual Report on Remuneration on pages 61 to 70.
At the AGM in April 2018, shareholders will be asked to approve the Annual Report on Remuneration as well as the new Remuneration Policy. I hope the decisions the Committee has taken in respect of 2017 and the changes we propose to make for 2018 will have your support.
Celia Baxter Chair of the Remuneration Committee
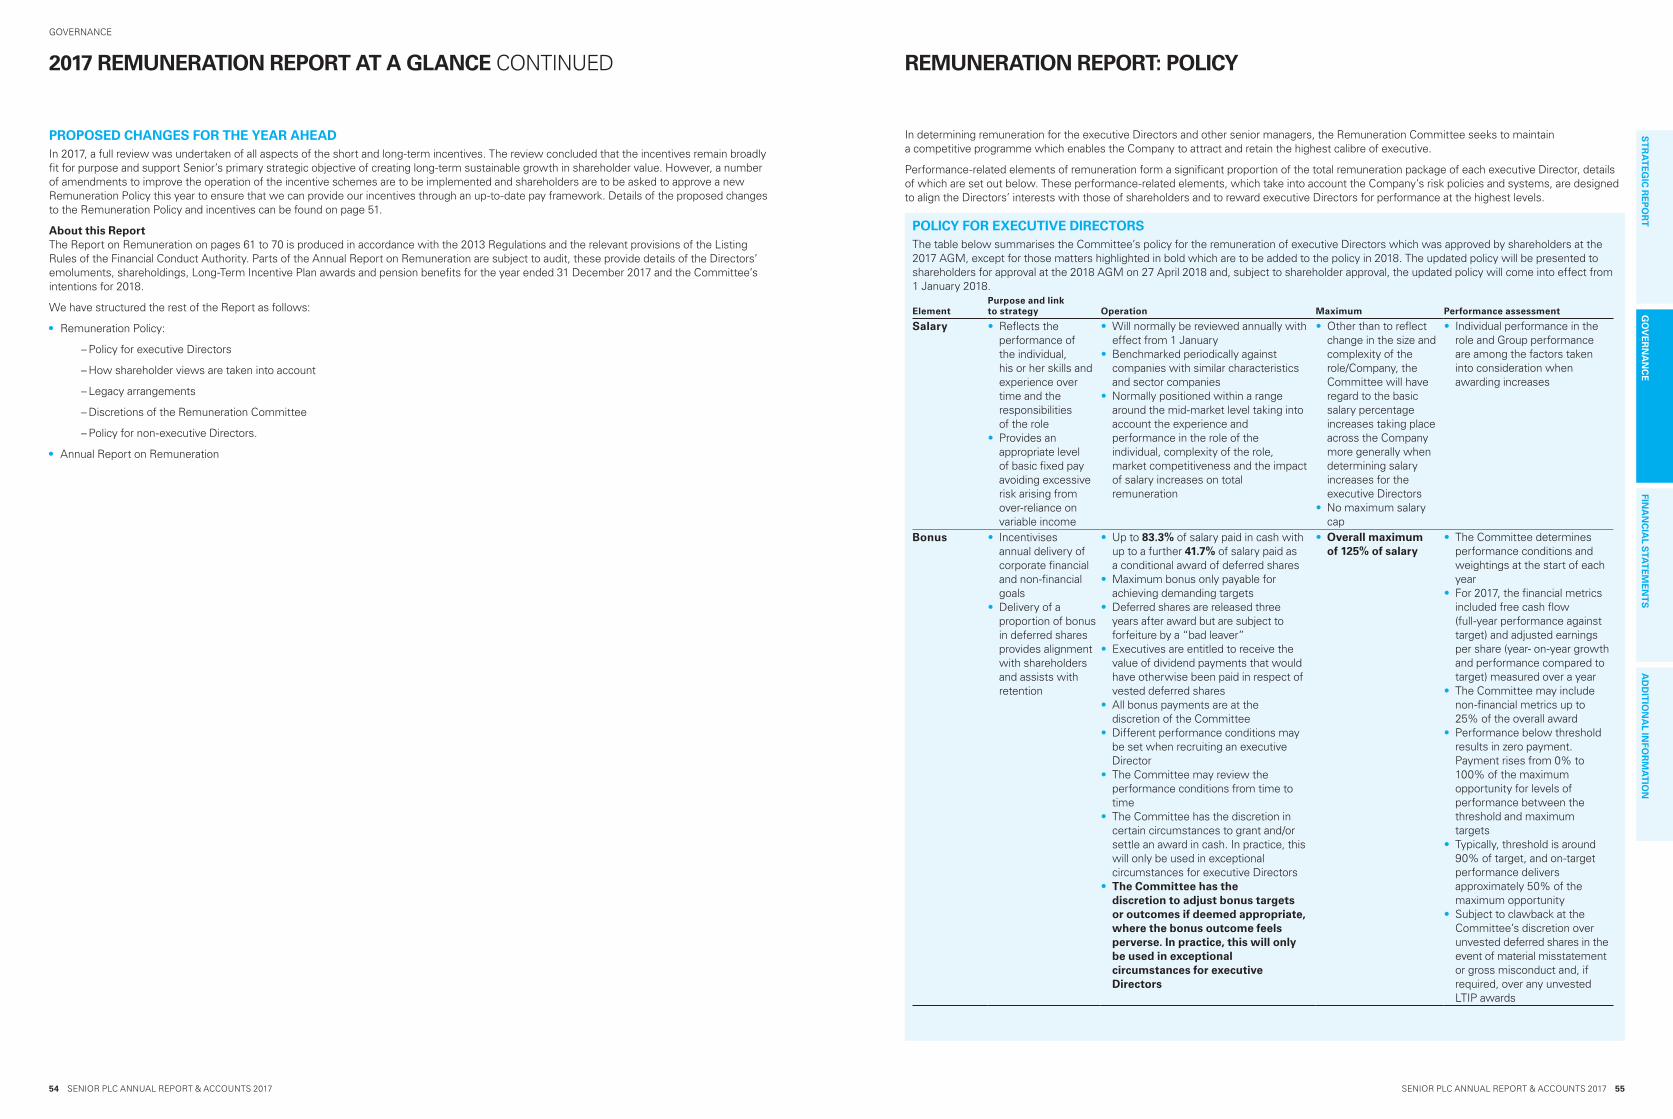
SENIOR PLC ANNUAL REPORT & ACCOUNTS 2017 55
FINA
NC
IAL S
TAT
EM
EN
TS
AD
DIT
ION
AL IN
FOR
MA
TIO
N
54 SENIOR PLC ANNUAL REPORT & ACCOUNTS 2017
GOVERNANCES
TR
AT
EG
IC R
EP
OR
TG
OV
ER
NA
NC
E
PROPOSED CHANGES FOR THE YEAR AHEADIn 2017, a full review was undertaken of all aspects of the short and long-term incentives. The review concluded that the incentives remain broadly fit for purpose and support Senior’s primary strategic objective of creating long-term sustainable growth in shareholder value. However, a number of amendments to improve the operation of the incentive schemes are to be implemented and shareholders are to be asked to approve a new Remuneration Policy this year to ensure that we can provide our incentives through an up-to-date pay framework. Details of the proposed changes to the Remuneration Policy and incentives can be found on page 51.
About this ReportThe Report on Remuneration on pages 61 to 70 is produced in accordance with the 2013 Regulations and the relevant provisions of the Listing Rules of the Financial Conduct Authority. Parts of the Annual Report on Remuneration are subject to audit, these provide details of the Directors’ emoluments, shareholdings, Long-Term Incentive Plan awards and pension benefits for the year ended 31 December 2017 and the Committee’s intentions for 2018.
We have structured the rest of the Report as follows:
• Remuneration Policy:
– Policy for executive Directors
– How shareholder views are taken into account
– Legacy arrangements
– Discretions of the Remuneration Committee
– Policy for non-executive Directors.
• Annual Report on Remuneration
2017 REMUNERATION REPORT AT A GLANCE CONTINUED REMUNERATION REPORT: POLICY
In determining remuneration for the executive Directors and other senior managers, the Remuneration Committee seeks to maintain a competitive programme which enables the Company to attract and retain the highest calibre of executive.
Performance-related elements of remuneration form a significant proportion of the total remuneration package of each executive Director, details of which are set out below. These performance-related elements, which take into account the Company’s risk policies and systems, are designed to align the Directors’ interests with those of shareholders and to reward executive Directors for performance at the highest levels.
POLICY FOR EXECUTIVE DIRECTORSThe table below summarises the Committee’s policy for the remuneration of executive Directors which was approved by shareholders at the 2017 AGM, except for those matters highlighted in bold which are to be added to the policy in 2018. The updated policy will be presented to shareholders for approval at the 2018 AGM on 27 April 2018 and, subject to shareholder approval, the updated policy will come into effect from 1 January 2018.
ElementPurpose and link to strategy Operation Maximum Performance assessment
Salary • Reflects the performance of the individual, his or her skills and experience over time and the responsibilities of the role
• Provides an appropriate level of basic fixed pay avoiding excessive risk arising from over-reliance on variable income
• Will normally be reviewed annually with effect from 1 January
• Benchmarked periodically against companies with similar characteristics and sector companies
• Normally positioned within a range around the mid-market level taking into account the experience and performance in the role of the individual, complexity of the role, market competitiveness and the impact of salary increases on total remuneration
• Other than to reflect change in the size and complexity of the role/Company, the Committee will have regard to the basic salary percentage increases taking place across the Company more generally when determining salary increases for the executive Directors
• No maximum salary cap
• Individual performance in the role and Group performance are among the factors taken into consideration when awarding increases
Bonus • Incentivises annual delivery of corporate financial and non-financial goals
• Delivery of a proportion of bonus in deferred shares provides alignment with shareholders and assists with retention
• Up to 83.3% of salary paid in cash with up to a further 41.7% of salary paid as a conditional award of deferred shares
• Maximum bonus only payable for achieving demanding targets
• Deferred shares are released three years after award but are subject to forfeiture by a “bad leaver”
• Executives are entitled to receive the value of dividend payments that would have otherwise been paid in respect of vested deferred shares
• All bonus payments are at the discretion of the Committee
• Different performance conditions may be set when recruiting an executive Director
• The Committee may review the performance conditions from time to time
• The Committee has the discretion in certain circumstances to grant and/or settle an award in cash. In practice, this will only be used in exceptional circumstances for executive Directors
• The Committee has the discretion to adjust bonus targets or outcomes if deemed appropriate, where the bonus outcome feels perverse. In practice, this will only be used in exceptional circumstances for executive Directors
• Overall maximum of 125% of salary
• The Committee determines performance conditions and weightings at the start of each year
• For 2017, the financial metrics included free cash flow (full-year performance against target) and adjusted earnings per share (year- on-year growth and performance compared to target) measured over a year
• The Committee may include non-financial metrics up to 25% of the overall award
• Performance below threshold results in zero payment. Payment rises from 0% to 100% of the maximum opportunity for levels of performance between the threshold and maximum targets
• Typically, threshold is around 90% of target, and on-target performance delivers approximately 50% of the maximum opportunity
• Subject to clawback at the Committee’s discretion over unvested deferred shares in the event of material misstatement or gross misconduct and, if required, over any unvested LTIP awards

SENIOR PLC ANNUAL REPORT & ACCOUNTS 2017 57
FINA
NC
IAL S
TAT
EM
EN
TS
AD
DIT
ION
AL IN
FOR
MA
TIO
N
56 SENIOR PLC ANNUAL REPORT & ACCOUNTS 2017
GOVERNANCES
TR
AT
EG
IC R
EP
OR
TG
OV
ER
NA
NC
E
RECRUITMENT OF EXECUTIVE DIRECTORSSalaries for newly appointed Directors will be set to reflect their skills and experience, the Company’s intended pay positioning and the market rate for the role.
Where it is appropriate to offer a below median salary initially, the Committee will have the discretion to allow phased salary increases over time for newly appointed Directors, even though this may involve increases in excess of the rate for the wider workforce and inflation.
Benefits will be provided in line with those offered to other employees, with national or international relocation expenses/arrangements (e.g. schooling, tax equalisation) provided for if necessary.
The aggregate incentive offered to new recruits will be no higher than that outlined in the Policy report on pages 55 and 56. The Remuneration Committee has flexibility to grant share awards of up to 200% of salary upon recruitment. Different performance measures may be set initially for the annual bonus and LTIP, taking into account the responsibilities of the individual, and the point in the financial year that they joined.
Current entitlements (benefits, bonus, share schemes) may be bought out on terms that are no more favourable than a like-for-like basis (with a comparable time horizon, fair value and subject to performance conditions). Existing incentive arrangements will be used to the fullest extent possible, although awards may also be granted outside these schemes if necessary and as permitted under the Listing Rules. In the case of an internal hire, any outstanding variable pay awarded in relation to the previous role will be allowed to pay out according to its terms of grant (adjusted as relevant to take into account the Board appointment).
RATIONALE BEHIND PERFORMANCE METRICS AND TARGETSThe performance-related elements take into account the Company’s risk policies and systems and are designed to align the Directors’ interests with those of shareholders. Variable pay elements aim to reward executive Directors for performance at the highest levels and, as such, the Committee aims to set targets that are both stretching and achievable. All targets are set on a sliding scale. The Committee reviews the annual bonus measures set for all the Company’s senior executives (not only the executive Directors) every year in order to ensure that they are aligned with the Company’s strategy and annual goals and to ensure that bonus arrangements amongst the Company’s senior executive team are consistent.
The annual bonus may include a mix of financial and non-financial measures reflecting the key annual priorities of the Group. The financial metrics currently include two of the Company’s KPIs: free cash flow, which is a key measure of the business’s ability to fund future acquisitions; and Adjusted EPS, which will reflect the Group’s ability to expand into new regions and product markets and increase the profitability of the existing operations. From 2018, Adjusted EPS will be measured on a constant currency basis to reduce the impact of exchange rate movements on bonus outcomes. If non-financial measures are selected, these may include reference to the Group’s environmental, safety and organisational goals.
The measures currently used in the LTIP are Adjusted EPS and relative TSR. Adjusted EPS is a measure of the Company’s overall financial success and TSR provides an external assessment of the Company’s performance against its competitors. It also aligns the rewards received by executives with the returns received by shareholders. The Committee will review the choice of performance measures and the appropriateness of the performance targets prior to each LTIP grant.
In particular, the Adjusted EPS targets are reviewed prior to each grant by taking account of internal and external expectations of future Adjusted EPS growth for the business. The Committee reserves the discretion to set different targets for future awards, without consulting with shareholders, providing that, in the opinion of the Committee, the new targets are no less challenging in light of the circumstances at the time than those used previously. The targets for awards granted under this Remuneration Policy are set out in the Annual Report on Remuneration.
RELATIONSHIP BETWEEN EXECUTIVE DIRECTOR AND EMPLOYEE PAYThe Remuneration Policy for the executive Directors is designed with regard to the policy for employees across the Group as a whole. There are some differences in the structure of the Remuneration Policy for the executive Directors and other senior employees, which the Remuneration Committee believes are necessary to reflect the different levels of responsibility of employees across the Company and reflect different market norms for different roles. The key differences in remuneration policy between the executive Directors and employees across the Group are the increased emphasis on performance-related pay and the inclusion of a share-based long-term incentive plan for executive Directors.
Executive Directors are provided with a competitive package of benefits that includes (depending on role) participation in the Group’s occupational pension arrangements, provision of a fully expensed car or car allowance, private medical insurance, life insurance and income protection.
The majority of Senior’s managers are eligible to participate in annual bonus arrangements with challenging targets tied to the performance of their employing entity, Division and, for the most senior executives, the Group’s performance. A collaboration bonus is also available to senior management, who contribute to the Group’s performance due to callaboration between the Group’s autonomous business units.
Long-term incentives are provided to the most senior executives and those anticipated as having the greatest potential to influence performance levels within the Company. A lower aggregate incentive quantum operates at below executive level with levels driven by the impact of the role and market comparatives.
In 2017, the Board adopted a new share plan, the Restricted Share Award Plan, a deferred share award plan without performance conditions. Awards under this Plan are made to selected individuals who were not in receipt of other long-term incentives but are considered to have significant potential or are key contributors.
In order to encourage wider employee share ownership, the Company operates a Sharesave Plan in which employees in the UK, North America and continental Europe, including executive Directors, may participate.
REMUNERATION REPORT: POLICY CONTINUED
ElementPurpose and link to strategy Operation Maximum Performance assessment
Long-Term Incentive Plan (LTIP)
• Incentivises sustained performance over the longer term
• The use of longer-term performance targets and delivery of awards in shares rewards the achievement of the Company’s strategic goals and increases in shareholder value
• Annual grants of performance shares which vest subject to performance measured over three years and continued service
• Executives are entitled to receive the value of dividend payments that would have otherwise been paid in respect of vested deferred shares
• All awards are subject to the discretions contained in the plan rules
• The Committee may review the performance conditions from time to time
• The Committee has the discretion in certain circumstances to grant and/or settle an award in cash. In practice, this will only be used in exceptional circumstances for executive Directors
• A two-year post-vesting holding period will be applied to LTIP awards, creating a five-year period between the grant of the awards and their final release. This revised holding period policy shall apply to LTIP awards to be granted in early 2018, even though this precedes the date of approval of the new policy
• 150% of salary• 200% of salary in
exceptional circumstances, such as upon recruitment
• The Committee determines performance conditions and weightings at the start of each year, providing that the targets are not materially less challenging
• For 2017, the awards were based on a mix of: – Relative Total Shareholder Return (50% of the award); and
– Group adjusted earnings growth targets (50% of the award)
• In respect of each performance element, performance below the threshold target results in zero vesting. Vesting of each performance element starts at the 25% threshold and rises to 100% for maximum level of performance
• Subject to clawback at the Committee’s discretion during the period of three years following the date of vesting
All-Employee Share Schemes
• Employees including executive Directors are encouraged to become shareholders through the operation of the Sharesave Plan, the HMRC-approved all-employee share plans
• The Sharesave Plan has standard terms under which participants can normally enter a savings contract in return for which they are granted options to acquire shares at the market value of the shares at the start of the performance period
• The rules for this plan were first approved by shareholders at the 2006 AGM and the updated rules were approved at the 2016 AGM
• Employees can normally elect for a three-year savings contract under standard terms and within HMRC limits
• The option price for Sharesave awards can be set at a discount of up to 20% to the market value of the shares at the start of the savings contract, although no awards granted under the 2006 Sharesave Plan have been set at a discount
• N/A
Pension • Provides competitive retirement benefits for the Group’s employees
• The executive Directors may participate in the Senior plc Group Flexible Retirement Plan (Senior GFRP), a contract-based, money purchase pension plan and/or receive cash allowances
• Bonuses are not included in calculating retirement benefits
• 20% of basic salary either as a Company contribution to Senior GFRP or as salary in lieu of pension
• N/A
Other benefits
• Provides a competitive package of benefits that assists with recruitment and retention
• Benefits include provision of a fully expensed car or car allowance, private medical insurance, life insurance and income protection, tax equalisation and relocation benefits
• Any reasonable business-related expenses (including tax thereon) can be reimbursed
• The value of benefits is based on the cost to the Company and is not predetermined
• There is no monetary cap on other benefits
• N/A
ElementPurpose and link to strategy Operation Maximum Performance assessment
Shareholding guidelines
• Aligns executive Directors’ interests with those of other shareholders in the Company
• Executive Directors to retain at least 50% of the shares that vest under the LTIP and Deferred Bonus Award, after allowing for tax liabilities, until a shareholding equivalent in value to 200% of base salary is built up
• N/A • N/A

SENIOR PLC ANNUAL REPORT & ACCOUNTS 2017 59
FINA
NC
IAL S
TAT
EM
EN
TS
AD
DIT
ION
AL IN
FOR
MA
TIO
N
58 SENIOR PLC ANNUAL REPORT & ACCOUNTS 2017
GOVERNANCES
TR
AT
EG
IC R
EP
OR
TG
OV
ER
NA
NC
E
POLICY ON PAYMENT FOR DEPARTURE FROM OFFICEOn termination of an executive Director’s service contract, the Committee will take into account the departing executive Director’s duty to mitigate his or her loss when determining the amount of compensation. The Committee’s policy in respect of the treatment of executive Directors leaving the Group is described below and is designed to support a smooth transition from the Company, taking into account the interests of shareholders:
Component of pay
Voluntary resignation or termination for cause
Death, ill health, disability, retirement excluding redundancy
Departure on agreed terms
Base salary, pension and benefits
Paid for the proportion of the notice period worked
Paid up to the date of death or leaving, including any untaken holidays prorated to such date. In the case of ill health, a payment in lieu of notice may be made and, according to circumstances, may be subject to mitigation. In such circumstances, some benefits such as company car or medical insurance may be retained until the end of the notice period
Treatment will normally fall between the two treatments described in the previous columns, subject to the discretion of the Committee and the terms of any termination agreement
Annual bonus cash
Cessation of employment during a bonus year will normally result in no cash bonus being paid
Cessation of employment during a bonus year or after the year-end but prior to the normal bonus payment date will result in cash and deferred bonus being paid and prorated for the relevant portion of the financial year worked and performance achieved
Annual bonus deferred shares
Unvested deferred share awards will lapse
In the case of the death of an executive Director, all deferred shares will be transferred to the estate as soon as possible after death. In all other cases, subject to the discretion of the Committee, unvested deferred shares will be transferred to the individual on a date determined by the Committee
LTIP share awards
Unvested LTIP share awards will lapse
Subject to the discretion of the Committee, unvested LTIP share awards will remain subject to the relevant performance conditions and normally be measured at the original vesting date. The awards will normally be prorated for the relevant proportion of the performance period worked. However, in the case of the death of an executive Director, the Committee will determine the extent of vesting within 12 months of the date of death
Options under Sharesave
As per HMRC regulations
As per HMRC regulations
Other None Statutory payments and disbursements such as any legal costs and outplacement fees
Notes a) The Committee will have the authority to settle any legal claims against the Company e.g. for unfair dismissal etc that might arise on termination.b) There are no enhanced provisions in relation to a change of control.
REMUNERATION REPORT: POLICY CONTINUED
HOW EMPLOYEES’ PAY IS TAKEN INTO ACCOUNT WHEN SETTING EXECUTIVE DIRECTOR REMUNERATIONThe Committee also reviews the salaries of corporate, divisional and senior operational managers and therefore is fully cognisant of pay levels in the Group when determining the pay of the executive Directors.
In addition, the Committee’s policy is that salary increases for the executive Directors and senior executives should not normally be greater than the general level of increases awarded to other senior managers in Europe and North America, other than when an executive changes role or when it is necessary in order to ensure levels of remuneration remain market competitive. Increases for the general workforce in Europe and North America for 2018 were approximately 3.7% (2017 – approximately 3.4%).
The Company did not consult with employees when drawing up the Directors’ Remuneration Policy set out in this part of the Remuneration Report.
POLICY ON OUTSIDE APPOINTMENTSThe Remuneration Committee believes that it is beneficial both for the individual and the Company for an executive Director to take up one external non-executive appointment. Fees paid for the appointment may be retained by the executive.
EXECUTIVE DIRECTORS’ SERVICE AGREEMENTS AND LOSS OF OFFICE PAYMENTSThe table below summarises the key provisions of each executive Director’s contract:
Provision Detailed terms
Employment contract dates David Squires – 5 January 2015 Bindi Foyle – 3 May 2017
Notice period 12 months from both the Company and the executive DirectorTermination payment Contracts may be terminated without notice by the payment of a sum equal to the sum of salary due for
the unexpired notice period, and the value of pension contributions and other benefits such as use of company car, life cover and private healthcare
There are no provisions in the agreements, or otherwise, for additional termination payments
Payments may be made in monthly instalments and, in these circumstances, there is a requirement for the Director to mitigate loss
Change of control There are no enhanced provisions in relation to a change of control
Copies of the executive Directors’ service contracts are available from the Group Company Secretary at the Company’s Registered Office during normal business hours. The Committee’s policy in the event of early termination of employment is set out on the following page.
HOW SHAREHOLDER VIEWS ARE TAKEN INTO ACCOUNTThe Remuneration Committee considers shareholder feedback received in relation to the AGM each year and guidance from shareholder representative bodies more generally. Shareholders were consulted in 2013 when formulating the Remuneration Policy, and in 2016 and 2017 when updating the Policy. Consultation with shareholders was constructive and did not result in any significant changes being made to the Remuneration Policy.
The Committee consults proactively with its major shareholders and intends to continue working closely with shareholders in future.
LEGACY ARRANGEMENTSFor the avoidance of doubt, having received shareholder approval at the 2014 AGM of this Policy Report, authority was given to the Company to honour any commitments entered into with current or former Directors (such as the payment of a pension or the unwinding of legacy share schemes) that have been disclosed to shareholders in previous remuneration reports.
DISCRETIONS OF THE REMUNERATION COMMITTEEThe Committee operates the Group’s various incentive plans according to their respective rules and in accordance with HMRC rules where relevant. To ensure the efficient administration of these plans, the Committee may apply certain operational discretions. These include the following:
• selecting the participants for the annual bonus plan and LTIP awards;
• determining the timing of grants and/or payments;
• determining the quantum of grants and/or payments (within the limits set out in the policy table commencing on page 55);
• adjusting the constituents of the TSR comparator group;
• determining the extent of vesting based on the assessment of performance;
• determining “good leaver” status and the extent of vesting in the case of the LTIP and deferred shares;
• determining the extent of vesting in the case of the LTIP in the event of a change of control;
• making the appropriate adjustments required in certain circumstances (e.g. rights issues, corporate restructuring events, variation of capital and special dividends); and
• undertaking the annual review of weighting of performance measures, and setting targets for the annual bonus plan and LTIP from year to year.

SENIOR PLC ANNUAL REPORT & ACCOUNTS 2017 61
FINA
NC
IAL S
TAT
EM
EN
TS
AD
DIT
ION
AL IN
FOR
MA
TIO
N
60 SENIOR PLC ANNUAL REPORT & ACCOUNTS 2017
GOVERNANCES
TR
AT
EG
IC R
EP
OR
TG
OV
ER
NA
NC
E
SUMMARY OF THE COMMITTEE’S TERMS OF REFERENCEThe Terms of Reference of the Remuneration Committee, available in full on the Company’s website, are summarised below:
• determine and agree with the Board the framework or broad policy for the remuneration of the Chairman of the Board, the executive Directors and other members of the executive management as it is designated to consider;
• within the terms of the agreed policy and in consultation with the Chairman and/or Group Chief Executive, as appropriate, determine the total individual remuneration package of the Chairman, each executive Director, and other designated senior executives including bonuses, incentive payments and share options or other share awards;
• approve the design of, and determine targets for, any performance-related pay plans operated by the Company and approve the total annual payments made under such plans;
• review the design of all share incentive plans for approval by the Board and shareholders. For any such plans, determine each year whether awards will be made and, if so, the overall amount of such awards, the individual awards to executive Directors, and other designated senior executives and the performance targets to be used;
• determine the policy for, and scope of, pension arrangements for each executive Director and other designated senior executives;
• ensure that contractual terms on termination, and any payments made, are fair to the individual and the Company, that failure is not rewarded and that the duty to mitigate loss is recognised; and
• oversee any major changes in employee benefits structures throughout the Group.
MEMBERSThe Remuneration Committee consists entirely of non-executive Directors.
Member
Number of meetings
during term
Number of meetings attended
Celia Baxter – Chair(1) 4 4Charles Berry(1) 4 3Susan Brennan 4 4Giles Kerr 4 4Ian King(2) 4 1Mark Vernon 4 4
(1) The full Committee met four times in 2017. In addition, authority was delegated to two members of the Committee, Celia Baxter and Charles Berry, to hold four additional meetings to confirm the grant and vesting of share awards.
(2) Ian King joined the Committee upon appointment to the Board on 13 November 2017. He attended the only Committee meeting that was held in 2017 following his appointment.
OTHER ATTENDEES AT REMUNERATION COMMITTEE MEETINGSThe Group Chief Executive and Group HR Director attend meetings by invitation and the Group Company Secretary acts as secretary to the Committee but no executive Director or other employee is present during discussions relating to his or her own remuneration.
ADVISERSBefore recommending proposals for Board approval, the Remuneration Committee may seek advice from external remuneration consultants to ensure that it is fully aware of comparative external remuneration practice as well as shareholder, legislative and regulatory developments. The Committee also considers publicly available sources of information relating to executive remuneration.
All advisers to the Remuneration Committee are appointed and instructed by the Committee. During the year, the Committee was advised by New Bridge Street (part of Aon plc) in relation to producing the Restricted Share Award Plan rules and ad hoc remuneration matters, Slaughter and May in relation to advice on salary sacrifice and employee benefits, and by Korn Ferry in relation to the revision of the Remuneration Policy. During 2017, the Company incurred fees of £13,004 from New Bridge Street, of £16,500 from Korn Ferry and of £4,560 from Slaughter and May, and these costs were based on a combination of hourly rates and fixed fees for specific items of work. New Bridge Street and Slaughter and May have no other connection with the Company. In addition to Korn Ferry’s work on the revision of the Remuneration Policy, it assisted the Company in the recruitment of Chairman-designate. In addition to Slaughter and May’s advice to the Remuneration Committee, it provided advice to the Company on the Group’s financing arrangements.
The Committee does not have a formal policy of subjecting its remuneration consultants to a regular fixed-term rotation, although the Committee remains cognisant of the need to achieve objective advice and good value whilst also benefiting from the consultants’ knowledge of the Company. The Committee is satisfied that the advice it has received during 2017 has been objective and independent.
REMUNERATION REPORT: POLICY CONTINUED REMUNERATION REPORT: ANNUAL REPORT ON REMUNERATION
POLICY FOR NON-EXECUTIVE DIRECTORS
ElementPurpose and link to strategy Operation Maximum
Performance assessment
Non-executive Directors and Chairman fees
• Takes account of recognised practice and set at a level that is sufficient to attract and retain high calibre non-executive Directors
• The Chairman is paid a single fee for all his responsibilities as determined by the Remuneration Committee. The non-executive Directors are paid a basic fee. The Senior Independent Director and the Chairs of the Audit and Remuneration Committees receive additional fees to reflect their extra responsibilities
• When reviewing fee levels, account is taken of market movements in non-executive Director fees, Board Committee responsibilities, ongoing time commitments and the general economic environment
• Fee increases, if applicable, are normally effective from 1 January
• The Chairman and non-executive Directors do not participate in any pension, bonus, share incentive or other share option plans
• The remuneration of the non-executive Directors is determined by the Board of Directors. The non-executive Directors do not participate in any discussion or decisions relating to their own remuneration
• Any reasonable business-related expenses (including tax thereon) can be reimbursed
• Other than when a non-executive Director changes role or where benchmarking indicates fees require realignment, fee increases will not normally exceed the general level of increases for the Group’s employees
• N/A
NON-EXECUTIVE DIRECTORS’ LETTERS OF APPOINTMENTThe Chairman and non-executive Directors do not have service agreements but the terms of their appointment, including the time commitment expected, are recorded in letters of appointment. The Chairman’s appointment may be terminated on providing 12 months’ notice by either party. The appointments of the other non-executive Directors may be terminated by the Company or non-executive Director on providing one month’s notice. Copies of the Chairman’s and non-executive Directors’ letters of appointment are available from the Company Secretary at the Company’s Registered Office during normal business hours.
NON-EXECUTIVE DIRECTORS’ TERMS OF APPOINTMENT
NameDate original
term commenced
Date current term commenced
Expected expiry date of current term
Charles Berry (Chairman) Joined the Board March 2012 and became Chairman in April 2012
– –
Celia Baxter September 2013 September 2016 September 2019Susan Brennan January 2016 – December 2021(1)
Giles Kerr September 2013 September 2016 September 2019Ian King Joined the Board November 2017 and will become Chairman in April 2018 – –Mark Vernon April 2011 April 2018(1) April 2019
(1) The first three-year term of appointment of Susan Brennan expires in December 2018. In February 2018, the Nominations Committee agreed to extend her appointment for a further three-year term, expiring in December 2021.
(2) The second three-year term of appointment of Mark Vernon expired in April 2017. In February 2017, his appointment was extended for another 12 months, expiring in April 2018. In February 2018, the Nominations Committee agreed to extend his appointment for a further 12 months, expiring in April 2019.
The Committee may vary the performance conditions to apply to LTIP awards if an event occurs which causes the Committee to consider that it would be appropriate to amend the performance conditions, provided the Committee considers the varied conditions are fair and reasonable and not materially less challenging than the original conditions would have been but for the event in question.
From 2018, the Committee proposes that it be explicitly be provided with the discretion to adjust bonus target outcomes if deemed appropriate, for example to take account of material M&A activity or other exceptional circumstances when they arise.
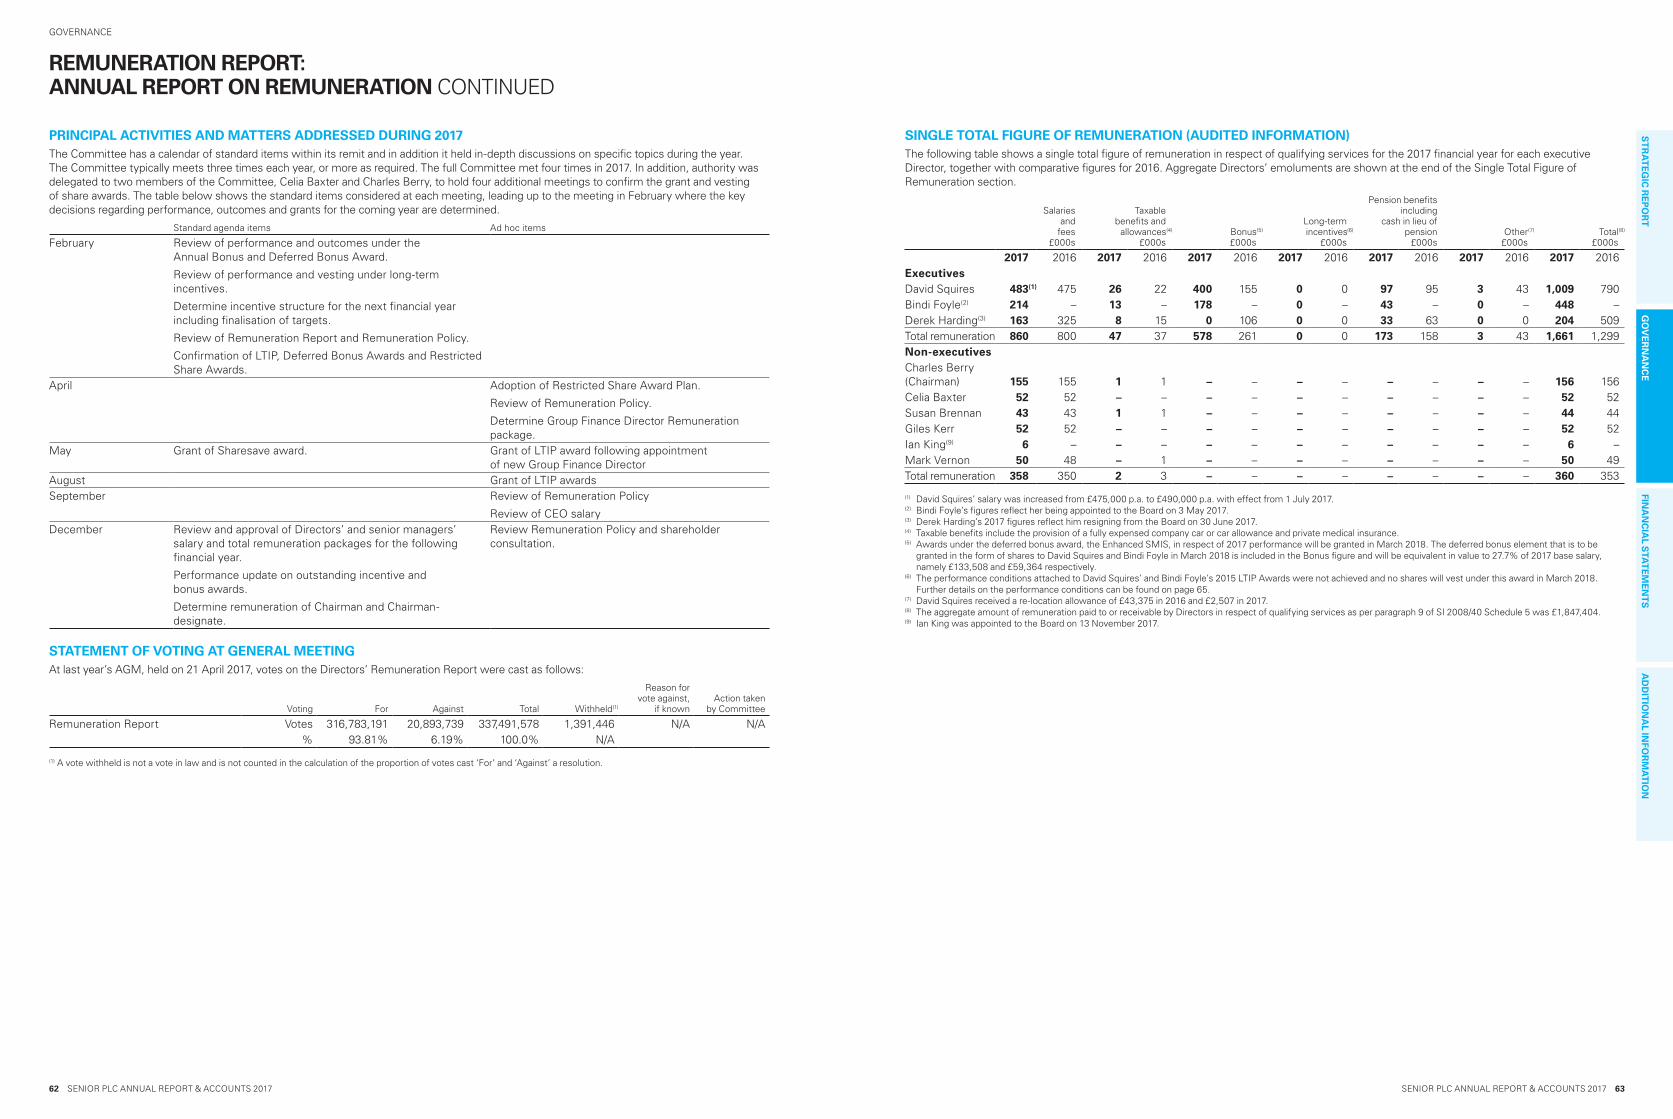
SENIOR PLC ANNUAL REPORT & ACCOUNTS 2017 63
FINA
NC
IAL S
TAT
EM
EN
TS
AD
DIT
ION
AL IN
FOR
MA
TIO
N
62 SENIOR PLC ANNUAL REPORT & ACCOUNTS 2017
GOVERNANCES
TR
AT
EG
IC R
EP
OR
TG
OV
ER
NA
NC
E
REMUNERATION REPORT: ANNUAL REPORT ON REMUNERATION CONTINUED
PRINCIPAL ACTIVITIES AND MATTERS ADDRESSED DURING 2017The Committee has a calendar of standard items within its remit and in addition it held in-depth discussions on specific topics during the year. The Committee typically meets three times each year, or more as required. The full Committee met four times in 2017. In addition, authority was delegated to two members of the Committee, Celia Baxter and Charles Berry, to hold four additional meetings to confirm the grant and vesting of share awards. The table below shows the standard items considered at each meeting, leading up to the meeting in February where the key decisions regarding performance, outcomes and grants for the coming year are determined.
Standard agenda items Ad hoc items
February Review of performance and outcomes under the Annual Bonus and Deferred Bonus Award.
Review of performance and vesting under long-term incentives.
Determine incentive structure for the next financial year including finalisation of targets.
Review of Remuneration Report and Remuneration Policy.
Confirmation of LTIP, Deferred Bonus Awards and Restricted Share Awards.
April Adoption of Restricted Share Award Plan.
Review of Remuneration Policy.
Determine Group Finance Director Remuneration package.
May Grant of Sharesave award. Grant of LTIP award following appointment of new Group Finance Director
August Grant of LTIP awardsSeptember Review of Remuneration Policy
Review of CEO salaryDecember Review and approval of Directors’ and senior managers’
salary and total remuneration packages for the following financial year.
Performance update on outstanding incentive and bonus awards.
Determine remuneration of Chairman and Chairman-designate.
Review Remuneration Policy and shareholder consultation.
STATEMENT OF VOTING AT GENERAL MEETINGAt last year’s AGM, held on 21 April 2017, votes on the Directors’ Remuneration Report were cast as follows:
Voting For Against Total Withheld(1)
Reason for vote against,
if knownAction taken
by Committee
Remuneration Report Votes 316,783,191 20,893,739 337,491,578 1,391,446 N/A N/A% 93.81% 6.19% 100.0% N/A
(1) A vote withheld is not a vote in law and is not counted in the calculation of the proportion of votes cast ‘For’ and ‘Against’ a resolution.
SINGLE TOTAL FIGURE OF REMUNERATION (AUDITED INFORMATION)The following table shows a single total figure of remuneration in respect of qualifying services for the 2017 financial year for each executive Director, together with comparative figures for 2016. Aggregate Directors’ emoluments are shown at the end of the Single Total Figure of Remuneration section.
Salaries and
fees £000s
Taxable benefits and
allowances(4)
£000sBonus(5)
£000s
Long-termincentives(6)
£000s
Pension benefits including
cash in lieu of pension
£000sOther(7)
£000sTotal(8)
£000s
2017 2016 2017 2016 2017 2016 2017 2016 2017 2016 2017 2016 2017 2016ExecutivesDavid Squires 483(1) 475 26 22 400 155 0 0 97 95 3 43 1,009 790Bindi Foyle(2) 214 – 13 – 178 – 0 – 43 – 0 – 448 –Derek Harding(3) 163 325 8 15 0 106 0 0 33 63 0 0 204 509Total remuneration 860 800 47 37 578 261 0 0 173 158 3 43 1,661 1,299Non-executivesCharles Berry (Chairman) 155 155 1 1 – – – – – – – – 156 156Celia Baxter 52 52 – – – – – – – – – – 52 52Susan Brennan 43 43 1 1 – – – – – – – – 44 44Giles Kerr 52 52 – – – – – – – – – – 52 52Ian King(9) 6 – – – – – – – – – – – 6 –Mark Vernon 50 48 – 1 – – – – – – – – 50 49Total remuneration 358 350 2 3 – – – – – – – – 360 353
(1) David Squires’ salary was increased from £475,000 p.a. to £490,000 p.a. with effect from 1 July 2017. (2) Bindi Foyle’s figures reflect her being appointed to the Board on 3 May 2017. (3) Derek Harding’s 2017 figures reflect him resigning from the Board on 30 June 2017.(4) Taxable benefits include the provision of a fully expensed company car or car allowance and private medical insurance. (5) Awards under the deferred bonus award, the Enhanced SMIS, in respect of 2017 performance will be granted in March 2018. The deferred bonus element that is to be
granted in the form of shares to David Squires and Bindi Foyle in March 2018 is included in the Bonus figure and will be equivalent in value to 27.7% of 2017 base salary, namely £133,508 and £59,364 respectively.
(6) The performance conditions attached to David Squires’ and Bindi Foyle’s 2015 LTIP Awards were not achieved and no shares will vest under this award in March 2018. Further details on the performance conditions can be found on page 65.
(7) David Squires received a re-location allowance of £43,375 in 2016 and £2,507 in 2017.(8) The aggregate amount of remuneration paid to or receivable by Directors in respect of qualifying services as per paragraph 9 of SI 2008/40 Schedule 5 was £1,847,404.(9) Ian King was appointed to the Board on 13 November 2017.
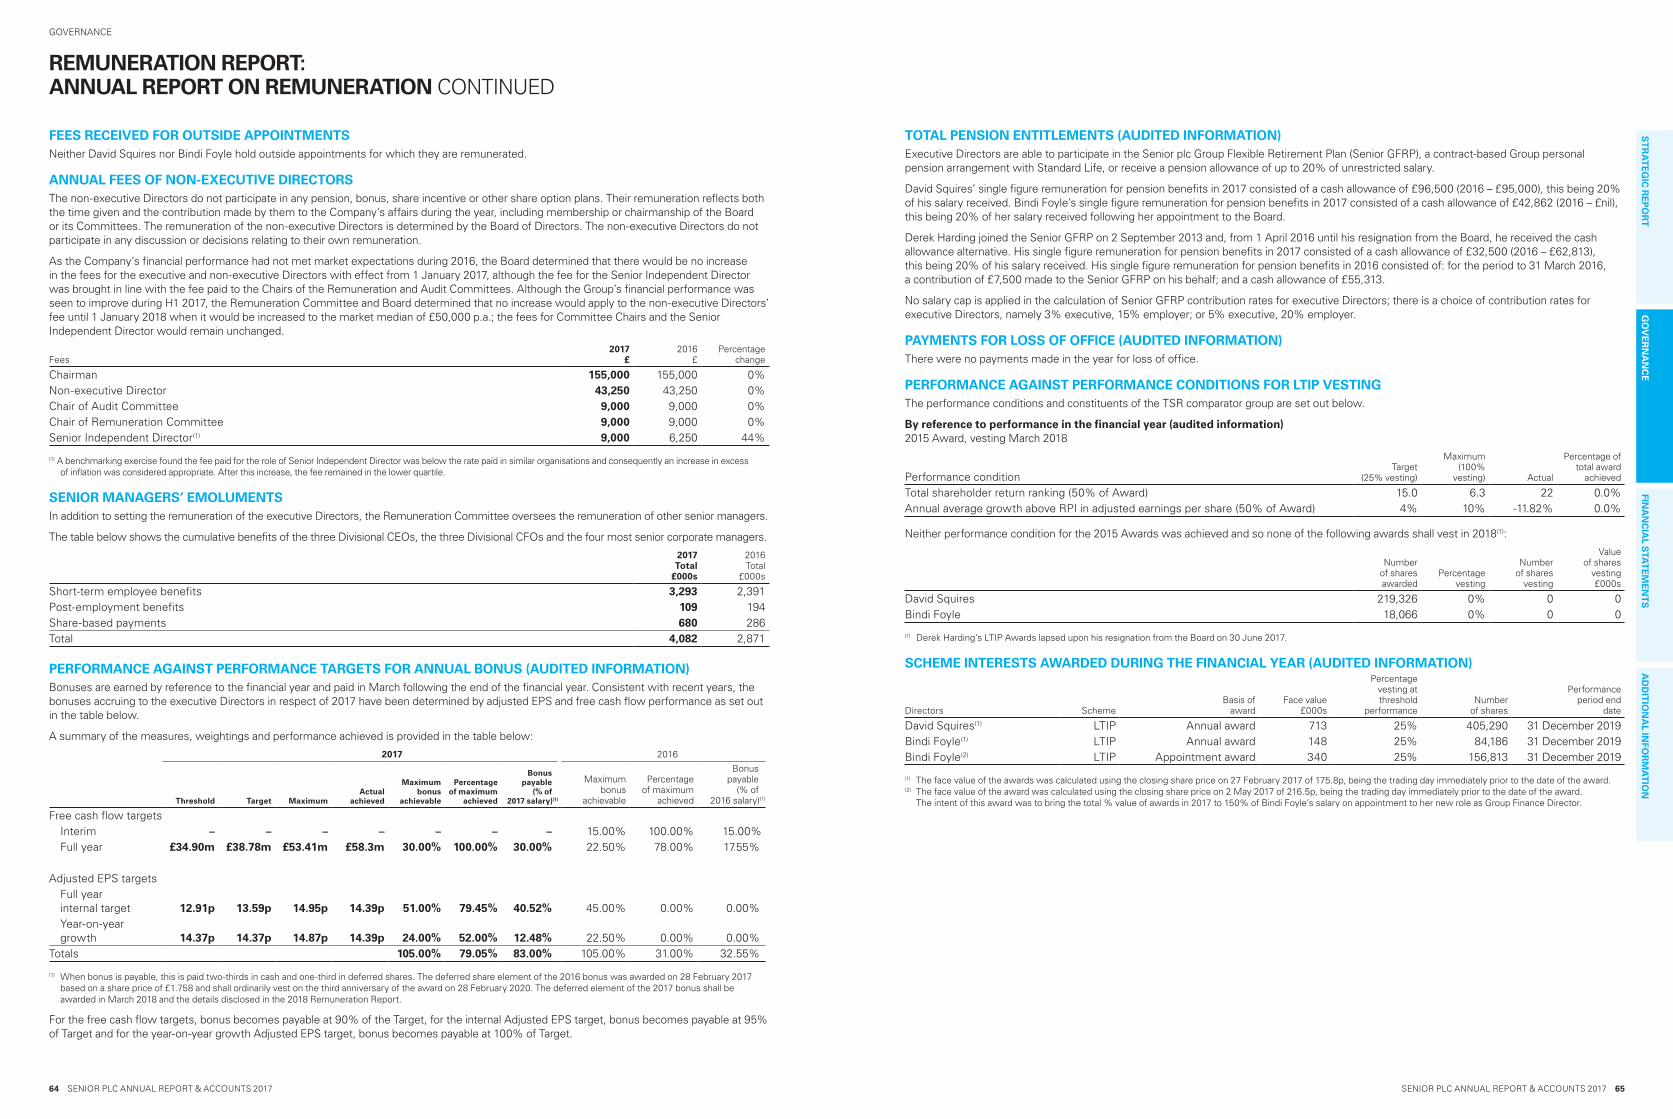
SENIOR PLC ANNUAL REPORT & ACCOUNTS 2017 65
FINA
NC
IAL S
TAT
EM
EN
TS
AD
DIT
ION
AL IN
FOR
MA
TIO
N
64 SENIOR PLC ANNUAL REPORT & ACCOUNTS 2017
GOVERNANCES
TR
AT
EG
IC R
EP
OR
TG
OV
ER
NA
NC
E
FEES RECEIVED FOR OUTSIDE APPOINTMENTSNeither David Squires nor Bindi Foyle hold outside appointments for which they are remunerated.
ANNUAL FEES OF NON-EXECUTIVE DIRECTORSThe non-executive Directors do not participate in any pension, bonus, share incentive or other share option plans. Their remuneration reflects both the time given and the contribution made by them to the Company’s affairs during the year, including membership or chairmanship of the Board or its Committees. The remuneration of the non-executive Directors is determined by the Board of Directors. The non-executive Directors do not participate in any discussion or decisions relating to their own remuneration.
As the Company’s financial performance had not met market expectations during 2016, the Board determined that there would be no increase in the fees for the executive and non-executive Directors with effect from 1 January 2017, although the fee for the Senior Independent Director was brought in line with the fee paid to the Chairs of the Remuneration and Audit Committees. Although the Group’s financial performance was seen to improve during H1 2017, the Remuneration Committee and Board determined that no increase would apply to the non-executive Directors’ fee until 1 January 2018 when it would be increased to the market median of £50,000 p.a.; the fees for Committee Chairs and the Senior Independent Director would remain unchanged.
Fees2017
£2016
£Percentage
change
Chairman 155,000 155,000 0%Non-executive Director 43,250 43,250 0%Chair of Audit Committee 9,000 9,000 0%Chair of Remuneration Committee 9,000 9,000 0%Senior Independent Director(1) 9,000 6,250 44%
(1) A benchmarking exercise found the fee paid for the role of Senior Independent Director was below the rate paid in similar organisations and consequently an increase in excess of inflation was considered appropriate. After this increase, the fee remained in the lower quartile.
SENIOR MANAGERS’ EMOLUMENTSIn addition to setting the remuneration of the executive Directors, the Remuneration Committee oversees the remuneration of other senior managers.
The table below shows the cumulative benefits of the three Divisional CEOs, the three Divisional CFOs and the four most senior corporate managers.
2017 Total
£000s
2016 Total
£000s
Short-term employee benefits 3,293 2,391Post-employment benefits 109 194Share-based payments 680 286Total 4,082 2,871
PERFORMANCE AGAINST PERFORMANCE TARGETS FOR ANNUAL BONUS (AUDITED INFORMATION)Bonuses are earned by reference to the financial year and paid in March following the end of the financial year. Consistent with recent years, the bonuses accruing to the executive Directors in respect of 2017 have been determined by adjusted EPS and free cash flow performance as set out in the table below.
A summary of the measures, weightings and performance achieved is provided in the table below:
2017 2016
Threshold
Target MaximumActual
achieved
Maximumbonus
achievable
Percentageof maximum
achieved
Bonuspayable
(% of2017 salary)(1)
Maximumbonus
achievable
Percentageof maximum
achieved
Bonuspayable
(% of2016 salary)(1)
Free cash flow targetsInterim – – – – – – – 15.00% 100.00% 15.00%Full year £34.90m £38.78m £53.41m £58.3m 30.00% 100.00% 30.00% 22.50% 78.00% 17.55%
Adjusted EPS targetsFull year internal target 12.91p 13.59p 14.95p 14.39p 51.00% 79.45% 40.52% 45.00% 0.00% 0.00%Year-on-year growth 14.37p 14.37p 14.87p 14.39p 24.00% 52.00% 12.48% 22.50% 0.00% 0.00%
Totals 105.00% 79.05% 83.00% 105.00% 31.00% 32.55%
(1) When bonus is payable, this is paid two-thirds in cash and one-third in deferred shares. The deferred share element of the 2016 bonus was awarded on 28 February 2017 based on a share price of £1.758 and shall ordinarily vest on the third anniversary of the award on 28 February 2020. The deferred element of the 2017 bonus shall be awarded in March 2018 and the details disclosed in the 2018 Remuneration Report.
For the free cash flow targets, bonus becomes payable at 90% of the Target, for the internal Adjusted EPS target, bonus becomes payable at 95% of Target and for the year-on-year growth Adjusted EPS target, bonus becomes payable at 100% of Target.
TOTAL PENSION ENTITLEMENTS (AUDITED INFORMATION)Executive Directors are able to participate in the Senior plc Group Flexible Retirement Plan (Senior GFRP), a contract-based Group personal pension arrangement with Standard Life, or receive a pension allowance of up to 20% of unrestricted salary.
David Squires’ single figure remuneration for pension benefits in 2017 consisted of a cash allowance of £96,500 (2016 – £95,000), this being 20% of his salary received. Bindi Foyle’s single figure remuneration for pension benefits in 2017 consisted of a cash allowance of £42,862 (2016 – £nil), this being 20% of her salary received following her appointment to the Board.
Derek Harding joined the Senior GFRP on 2 September 2013 and, from 1 April 2016 until his resignation from the Board, he received the cash allowance alternative. His single figure remuneration for pension benefits in 2017 consisted of a cash allowance of £32,500 (2016 – £62,813), this being 20% of his salary received. His single figure remuneration for pension benefits in 2016 consisted of: for the period to 31 March 2016, a contribution of £7,500 made to the Senior GFRP on his behalf; and a cash allowance of £55,313.
No salary cap is applied in the calculation of Senior GFRP contribution rates for executive Directors; there is a choice of contribution rates for executive Directors, namely 3% executive, 15% employer; or 5% executive, 20% employer.
PAYMENTS FOR LOSS OF OFFICE (AUDITED INFORMATION)There were no payments made in the year for loss of office.
PERFORMANCE AGAINST PERFORMANCE CONDITIONS FOR LTIP VESTINGThe performance conditions and constituents of the TSR comparator group are set out below.
By reference to performance in the financial year (audited information)2015 Award, vesting March 2018
Performance conditionTarget
(25% vesting)
Maximum (100%
vesting) Actual
Percentage of total award
achieved
Total shareholder return ranking (50% of Award) 15.0 6.3 22 0.0%Annual average growth above RPI in adjusted earnings per share (50% of Award) 4% 10% -11.82% 0.0%
Neither performance condition for the 2015 Awards was achieved and so none of the following awards shall vest in 2018(1):
Number of shares awarded
Percentage vesting
Number of shares
vesting
Value of shares
vesting £000s
David Squires 219,326 0% 0 0Bindi Foyle 18,066 0% 0 0
(1) Derek Harding’s LTIP Awards lapsed upon his resignation from the Board on 30 June 2017.
SCHEME INTERESTS AWARDED DURING THE FINANCIAL YEAR (AUDITED INFORMATION)
Directors SchemeBasis of
awardFace value
£000s
Percentage vesting at threshold
performanceNumber
of shares
Performance period end
date
David Squires(1) LTIP Annual award 713 25% 405,290 31 December 2019Bindi Foyle(1) LTIP Annual award 148 25% 84,186 31 December 2019Bindi Foyle(2) LTIP Appointment award 340 25% 156,813 31 December 2019
(1) The face value of the awards was calculated using the closing share price on 27 February 2017 of 175.8p, being the trading day immediately prior to the date of the award.(2) The face value of the award was calculated using the closing share price on 2 May 2017 of 216.5p, being the trading day immediately prior to the date of the award.
The intent of this award was to bring the total % value of awards in 2017 to 150% of Bindi Foyle’s salary on appointment to her new role as Group Finance Director.
REMUNERATION REPORT: ANNUAL REPORT ON REMUNERATION CONTINUED

SENIOR PLC ANNUAL REPORT & ACCOUNTS 2017 67
FINA
NC
IAL S
TAT
EM
EN
TS
AD
DIT
ION
AL IN
FOR
MA
TIO
N
66 SENIOR PLC ANNUAL REPORT & ACCOUNTS 2017
GOVERNANCES
TR
AT
EG
IC R
EP
OR
TG
OV
ER
NA
NC
E
STATEMENT OF DIRECTORS’ SHAREHOLDING AND SHARE INTERESTS (AUDITED INFORMATION)The Remuneration Committee encourages Directors to own shares in the Company and, in support of this policy, it expects executive Directors to retain at least 50% of the shares that vest under the LTIP, after allowing for tax liabilities, until a shareholding equivalent in value to 100% of base salary is built up. Based on the executive Directors’ base salaries at 31 December 2017, David Squires had a holding of 38.0% of base salary and Bindi Foyle had a holding of 49.2% of base salary in the Company’s shares.
Deferred share awards are not taken into account for these purposes. Shares are valued using the Company’s closing share price on 31 December 2017 of 260.7p. No options under the Sharesave Plan were exercised by the executive Directors during the year.
The table below shows how each Director complies with this requirement.
Executive Directors
Number of shares required to be
held (equivalent to 100% of
basic salary at 31 December
2017)
Number of shares owned outright
(including connected
persons) at 31 December
Share ownership requirements
met
Additional shares not counting towards shareholding guidelines
Unvested awards, subject to performance conditions
Unvested awards, not subject to performance conditions
LTIP award(1) SharesaveDeferred
share award
David Squires 187,956 71,410 No – 38.0% 959,123 4,054 36,513Bindi Foyle 124,665 61,389 No – 49.2% 324,792 7,978 23,820
Number of shares owned outright
(including connected persons) at
1 JanuaryShares vested
during 2017
Shares retained from 2017
vested shares
Number of shares owned outright
(including connected persons) at
31 December
Executive DirectorsDavid Squires 21,410 0 N/A 71,410Derek Harding 118,719 7,653 7,653 126,372(2)
Bindi Foyle 52,894 8,495 8,495 61,389Non-executive DirectorsCharles Berry 10,000 – – 10,000Celia Baxter 10,000 – – 10,000Susan Brennan 0 – – 0Giles Kerr 10,000 – – 10,000Ian King(3) – – – 0Mark Vernon 18,200 – – 18,200
(1) Neither performance condition attached to David Squires’ or Bindi Foyle’s 2015 LTIP award over 219,326 shares, and 18,066 shares respectively (included within their respective LTIP award figures above) were achieved; these awards (that were due to vest in March 2018) shall lapse in full. All Derek Harding’s LTIP awards lapsed upon his resignation from the Board on 30 June 2017.
(2) Derek Harding’s shareholding when he retired from the Board on 30 June 2017 was 126,372.(3) Ian King was appointed to the Board on 13 November 2017.
CURRENT POSITION ON OUTSTANDING LTIP AWARDS (NON-AUDITED INFORMATION)The following tables show the current position against performance targets for LTIP awards outstanding from 2016 and 2017.
Conditional share awards in 2017 Conditional share awards in 2016
Performance conditionTarget
(25% vesting)Maximum
(100% vesting) Actual to dateTarget
(25% vesting)Maximum
(100% vesting) Actual to date
Total shareholder return ranking 15 7.75 7 15 6.3 21Growth in adjusted earnings per share over performance period(2) 10% 25% 0.1%(1) 10% 25% -24.2%(2)
(1) Actual to date figure of 0.1% represents the growth in the Adjusted EPS during the first year of the three-year performance period for the 2017 LTIP award.(2) Actual to date figure of -24.2% represents the growth in the Adjusted EPS during the first two years of the three-year performance period for the 2016 LTIP award.
The TSR comparator group applicable to the 2017 LTIP award consists of manufacturing companies within the following FTSE All Share sectors: Aerospace & Defence; Automobiles & Parts; Electronic & Electrical Equipment; and Industrial Engineering. The constituent comparator companies for the 2017 award, broadly similar to those used for each year of award from 2009 onwards, are listed below:
Avon Rubber GKN Qinetiq Group Ultra ElectronicsBAE Systems Halma Renishaw Vitec GroupBodycote Hill & Smith Rolls-Royce Group VolexChemring Group IMI Rotork Weir GroupCobham Meggitt Severfield-Rowen XaarDialight Melrose Spectrise2v technologies Morgan Advanced Materials Spirax-SarcoFenner Oxford Instruments TT Electronics
TSR is averaged over three months prior to the start and end of the performance period.
SHAREHOLDER DILUTIONPercentage of issued shares
The Company complies with the dilution guidelines contained within The Investment Association Principles of Executive Remuneration.
At 31 December 2017, awards outstanding and shares issued in the previous 10 years under all share plans (the Senior plc 2005 Long-Term Incentive Plan (the 2005 LTIP), the Senior plc 2014 Long-Term Incentive Plan (the 2014 LTIP), and the 2006 Savings-Related Share Option Plan (the Sharesave Plan)) amounted to 6.73% of the issued ordinary share capital of the Company. At 31 December 2017, awards outstanding and shares issued in the previous 10 years under executive (discretionary) plans (the LTIP) amounted to 3.27% of the issued ordinary share capital of the Company.
During 2017, all share awards were satisfied using market-purchased shares, except for 1,832 shares issued to satisfy the vesting of a Sharesave award. The Remuneration Committee monitors the flow rates of the Company’s share plans, in particular before new share awards are made, to ensure the flow rates remain within the Investment Association dilution guidelines.
3.28% 1.72%Discretionary
schemes(maximum 5%)
All schemes(maximum 10%) 6.73% 3.27%
Shares awarded as % of issued sharesHeadroom
REMUNERATION REPORT: ANNUAL REPORT ON REMUNERATION CONTINUED
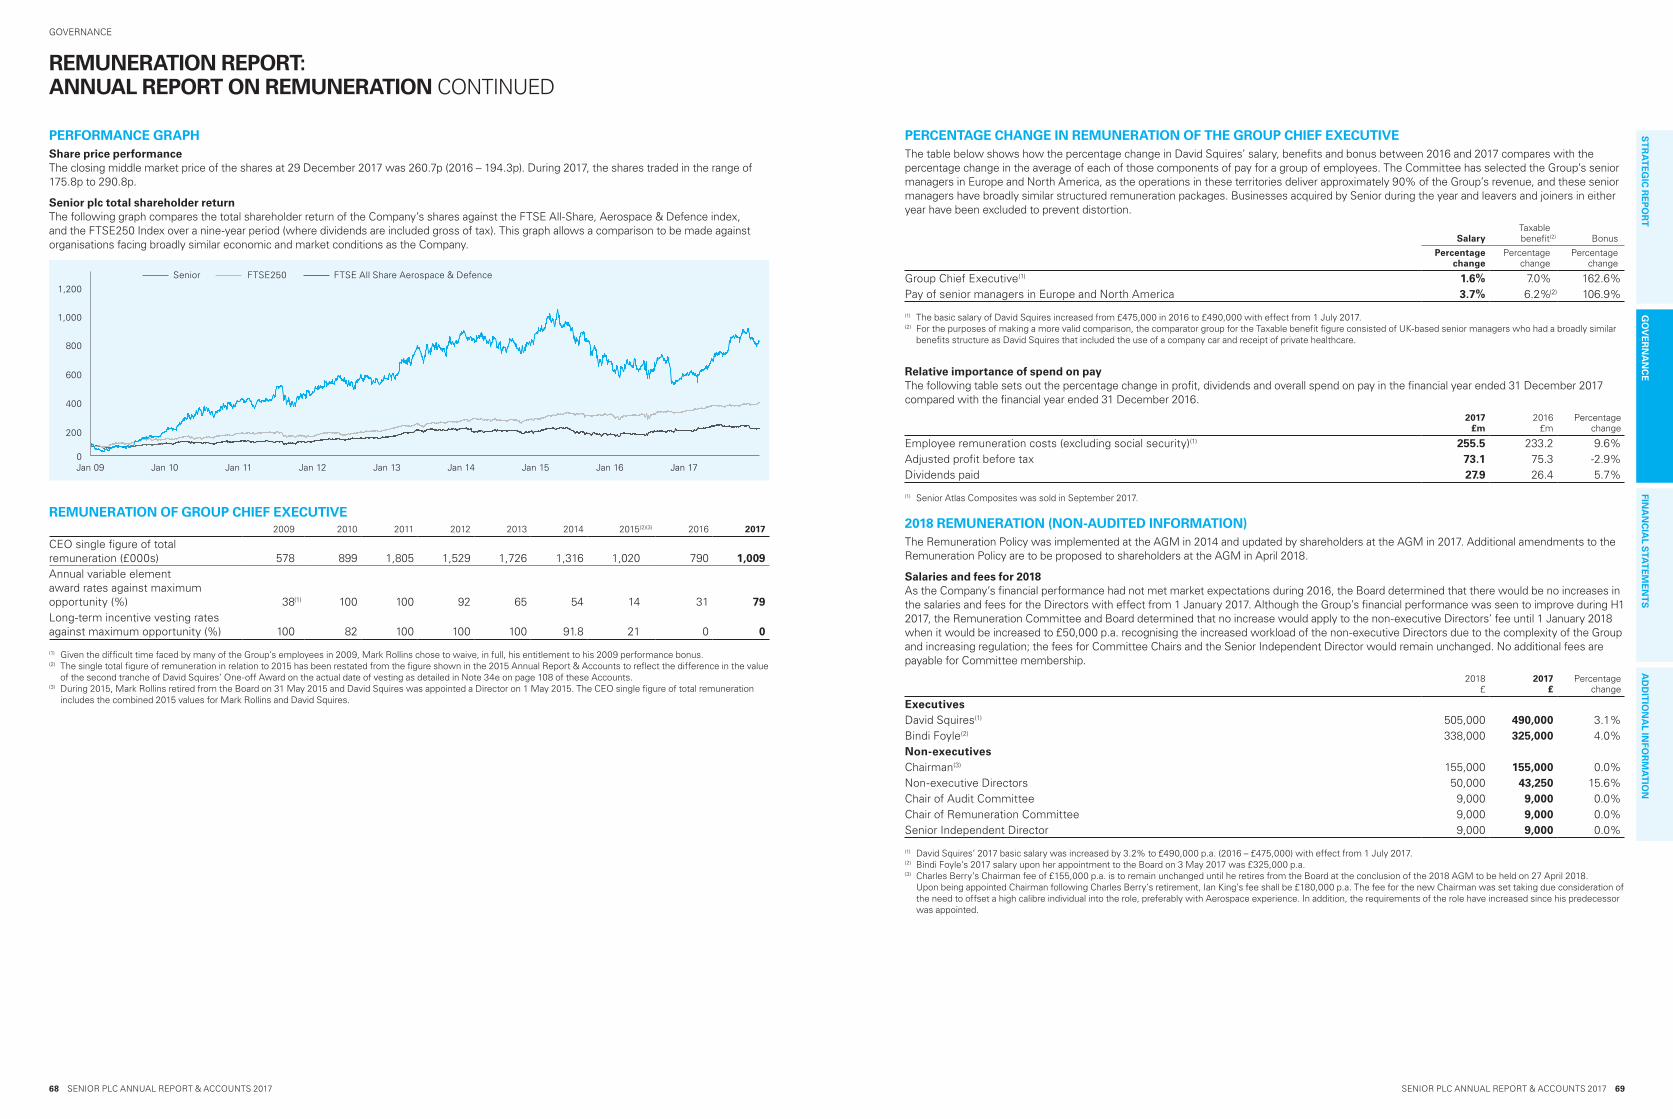
SENIOR PLC ANNUAL REPORT & ACCOUNTS 2017 69
FINA
NC
IAL S
TAT
EM
EN
TS
AD
DIT
ION
AL IN
FOR
MA
TIO
N
68 SENIOR PLC ANNUAL REPORT & ACCOUNTS 2017
GOVERNANCES
TR
AT
EG
IC R
EP
OR
TG
OV
ER
NA
NC
E
PERFORMANCE GRAPHShare price performanceThe closing middle market price of the shares at 29 December 2017 was 260.7p (2016 – 194.3p). During 2017, the shares traded in the range of 175.8p to 290.8p.
Senior plc total shareholder returnThe following graph compares the total shareholder return of the Company’s shares against the FTSE All-Share, Aerospace & Defence index, and the FTSE250 Index over a nine-year period (where dividends are included gross of tax). This graph allows a comparison to be made against organisations facing broadly similar economic and market conditions as the Company.
0
200
400
600
800
1,000
1,200
Jan 10 Jan 11Jan 09 Jan 12 Jan 13 Jan 15Jan 14
FTSE All Share Aerospace & Defence Senior FTSE250
Jan 16 Jan 17
REMUNERATION OF GROUP CHIEF EXECUTIVE2009 2010 2011 2012 2013 2014 2015(2)(3) 2016 2017
CEO single figure of total remuneration (£000s) 578 899 1,805 1,529 1,726 1,316 1,020 790 1,009Annual variable element award rates against maximum opportunity (%) 38(1) 100 100 92 65 54 14 31 79Long-term incentive vesting rates against maximum opportunity (%) 100 82 100 100 100 91.8 21 0 0
(1) Given the difficult time faced by many of the Group’s employees in 2009, Mark Rollins chose to waive, in full, his entitlement to his 2009 performance bonus.(2) The single total figure of remuneration in relation to 2015 has been restated from the figure shown in the 2015 Annual Report & Accounts to reflect the difference in the value
of the second tranche of David Squires’ One-off Award on the actual date of vesting as detailed in Note 34e on page 108 of these Accounts.(3) During 2015, Mark Rollins retired from the Board on 31 May 2015 and David Squires was appointed a Director on 1 May 2015. The CEO single figure of total remuneration
includes the combined 2015 values for Mark Rollins and David Squires.
PERCENTAGE CHANGE IN REMUNERATION OF THE GROUP CHIEF EXECUTIVEThe table below shows how the percentage change in David Squires’ salary, benefits and bonus between 2016 and 2017 compares with the percentage change in the average of each of those components of pay for a group of employees. The Committee has selected the Group’s senior managers in Europe and North America, as the operations in these territories deliver approximately 90% of the Group’s revenue, and these senior managers have broadly similar structured remuneration packages. Businesses acquired by Senior during the year and leavers and joiners in either year have been excluded to prevent distortion.
SalaryTaxablebenefit(2) Bonus
Percentage change
Percentage change
Percentage change
Group Chief Executive(1) 1.6% 7.0% 162.6%Pay of senior managers in Europe and North America 3.7% 6.2%(2) 106.9%
(1) The basic salary of David Squires increased from £475,000 in 2016 to £490,000 with effect from 1 July 2017.(2) For the purposes of making a more valid comparison, the comparator group for the Taxable benefit figure consisted of UK-based senior managers who had a broadly similar
benefits structure as David Squires that included the use of a company car and receipt of private healthcare.
Relative importance of spend on payThe following table sets out the percentage change in profit, dividends and overall spend on pay in the financial year ended 31 December 2017 compared with the financial year ended 31 December 2016.
2017 £m
2016 £m
Percentage change
Employee remuneration costs (excluding social security)(1) 255.5 233.2 9.6%Adjusted profit before tax 73.1 75.3 -2.9%Dividends paid 27.9 26.4 5.7%
(1) Senior Atlas Composites was sold in September 2017.
2018 REMUNERATION (NON-AUDITED INFORMATION)The Remuneration Policy was implemented at the AGM in 2014 and updated by shareholders at the AGM in 2017. Additional amendments to the Remuneration Policy are to be proposed to shareholders at the AGM in April 2018.
Salaries and fees for 2018As the Company’s financial performance had not met market expectations during 2016, the Board determined that there would be no increases in the salaries and fees for the Directors with effect from 1 January 2017. Although the Group’s financial performance was seen to improve during H1 2017, the Remuneration Committee and Board determined that no increase would apply to the non-executive Directors’ fee until 1 January 2018 when it would be increased to £50,000 p.a. recognising the increased workload of the non-executive Directors due to the complexity of the Group and increasing regulation; the fees for Committee Chairs and the Senior Independent Director would remain unchanged. No additional fees are payable for Committee membership.
2018 £
2017 £
Percentage change
ExecutivesDavid Squires(1) 505,000 490,000 3.1%Bindi Foyle(2) 338,000 325,000 4.0%Non-executivesChairman(3) 155,000 155,000 0.0%Non-executive Directors 50,000 43,250 15.6%Chair of Audit Committee 9,000 9,000 0.0%Chair of Remuneration Committee 9,000 9,000 0.0%Senior Independent Director 9,000 9,000 0.0%
(1) David Squires’ 2017 basic salary was increased by 3.2% to £490,000 p.a. (2016 – £475,000) with effect from 1 July 2017.(2) Bindi Foyle’s 2017 salary upon her appointment to the Board on 3 May 2017 was £325,000 p.a.(3) Charles Berry’s Chairman fee of £155,000 p.a. is to remain unchanged until he retires from the Board at the conclusion of the 2018 AGM to be held on 27 April 2018.
Upon being appointed Chairman following Charles Berry’s retirement, Ian King’s fee shall be £180,000 p.a. The fee for the new Chairman was set taking due consideration of the need to offset a high calibre individual into the role, preferably with Aerospace experience. In addition, the requirements of the role have increased since his predecessor was appointed.
REMUNERATION REPORT: ANNUAL REPORT ON REMUNERATION CONTINUED
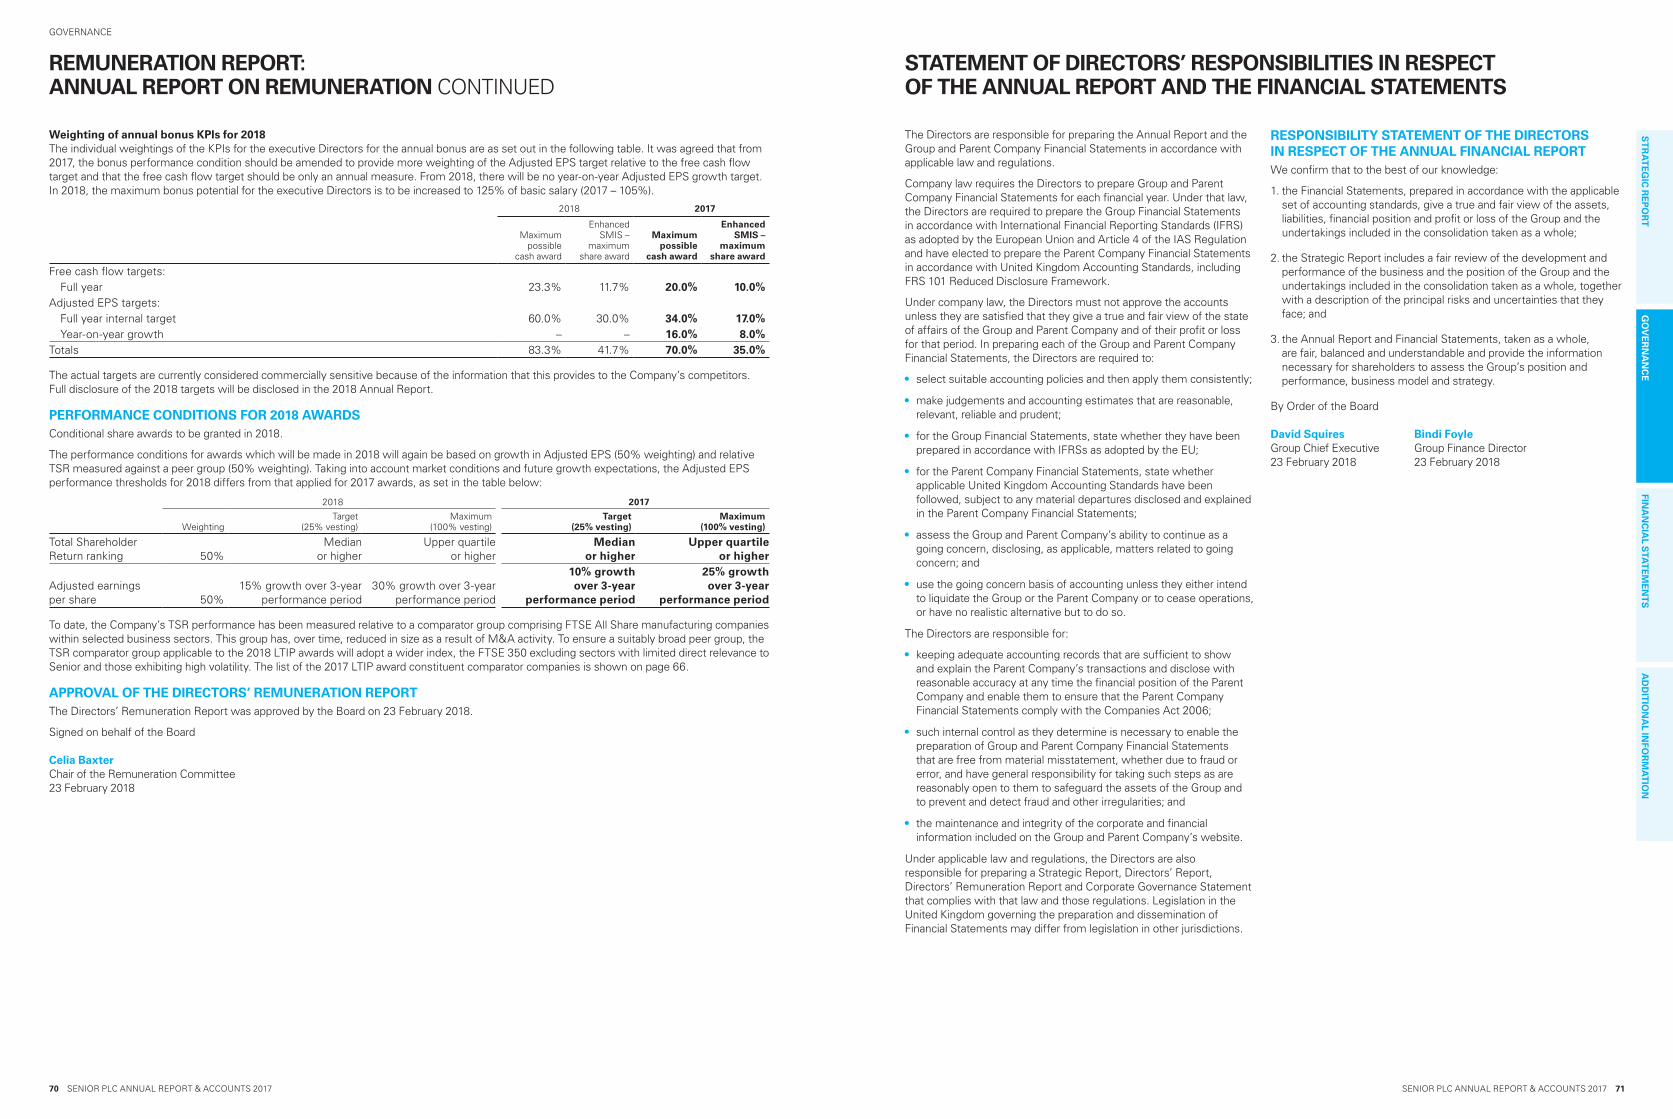
SENIOR PLC ANNUAL REPORT & ACCOUNTS 2017 71
FINA
NC
IAL S
TAT
EM
EN
TS
AD
DIT
ION
AL IN
FOR
MA
TIO
N
70 SENIOR PLC ANNUAL REPORT & ACCOUNTS 2017
GOVERNANCES
TR
AT
EG
IC R
EP
OR
TG
OV
ER
NA
NC
E
REMUNERATION REPORT: ANNUAL REPORT ON REMUNERATION CONTINUED
Weighting of annual bonus KPIs for 2018The individual weightings of the KPIs for the executive Directors for the annual bonus are as set out in the following table. It was agreed that from 2017, the bonus performance condition should be amended to provide more weighting of the Adjusted EPS target relative to the free cash flow target and that the free cash flow target should be only an annual measure. From 2018, there will be no year-on-year Adjusted EPS growth target. In 2018, the maximum bonus potential for the executive Directors is to be increased to 125% of basic salary (2017 – 105%).
2018 2017
Maximum possible
cash award
Enhanced SMIS –
maximum share award
Maximum possible
cash award
Enhanced SMIS –
maximum share award
Free cash flow targets:Full year 23.3% 11.7% 20.0% 10.0%
Adjusted EPS targets:Full year internal target 60.0% 30.0% 34.0% 17.0%Year-on-year growth – – 16.0% 8.0%
Totals 83.3% 41.7% 70.0% 35.0%
The actual targets are currently considered commercially sensitive because of the information that this provides to the Company’s competitors. Full disclosure of the 2018 targets will be disclosed in the 2018 Annual Report.
PERFORMANCE CONDITIONS FOR 2018 AWARDSConditional share awards to be granted in 2018.
The performance conditions for awards which will be made in 2018 will again be based on growth in Adjusted EPS (50% weighting) and relative TSR measured against a peer group (50% weighting). Taking into account market conditions and future growth expectations, the Adjusted EPS performance thresholds for 2018 differs from that applied for 2017 awards, as set in the table below:
2018 2017
WeightingTarget
(25% vesting)Maximum
(100% vesting)Target
(25% vesting)Maximum
(100% vesting)
Total Shareholder Return ranking 50%
Median or higher
Upper quartile or higher
Median or higher
Upper quartile or higher
Adjusted earnings per share 50%
15% growth over 3-year performance period
30% growth over 3-year performance period
10% growth over 3-year
performance period
25% growth over 3-year
performance period
To date, the Company’s TSR performance has been measured relative to a comparator group comprising FTSE All Share manufacturing companies within selected business sectors. This group has, over time, reduced in size as a result of M&A activity. To ensure a suitably broad peer group, the TSR comparator group applicable to the 2018 LTIP awards will adopt a wider index, the FTSE 350 excluding sectors with limited direct relevance to Senior and those exhibiting high volatility. The list of the 2017 LTIP award constituent comparator companies is shown on page 66.
APPROVAL OF THE DIRECTORS’ REMUNERATION REPORTThe Directors’ Remuneration Report was approved by the Board on 23 February 2018.
Signed on behalf of the Board
Celia Baxter Chair of the Remuneration Committee 23 February 2018
STATEMENT OF DIRECTORS’ RESPONSIBILITIES IN RESPECT OF THE ANNUAL REPORT AND THE FINANCIAL STATEMENTS
The Directors are responsible for preparing the Annual Report and the Group and Parent Company Financial Statements in accordance with applicable law and regulations.
Company law requires the Directors to prepare Group and Parent Company Financial Statements for each financial year. Under that law, the Directors are required to prepare the Group Financial Statements in accordance with International Financial Reporting Standards (IFRS) as adopted by the European Union and Article 4 of the IAS Regulation and have elected to prepare the Parent Company Financial Statements in accordance with United Kingdom Accounting Standards, including FRS 101 Reduced Disclosure Framework.
Under company law, the Directors must not approve the accounts unless they are satisfied that they give a true and fair view of the state of affairs of the Group and Parent Company and of their profit or loss for that period. In preparing each of the Group and Parent Company Financial Statements, the Directors are required to:
• select suitable accounting policies and then apply them consistently;
• make judgements and accounting estimates that are reasonable, relevant, reliable and prudent;
• for the Group Financial Statements, state whether they have been prepared in accordance with IFRSs as adopted by the EU;
• for the Parent Company Financial Statements, state whether applicable United Kingdom Accounting Standards have been followed, subject to any material departures disclosed and explained in the Parent Company Financial Statements;
• assess the Group and Parent Company’s ability to continue as a going concern, disclosing, as applicable, matters related to going concern; and
• use the going concern basis of accounting unless they either intend to liquidate the Group or the Parent Company or to cease operations, or have no realistic alternative but to do so.
The Directors are responsible for:
• keeping adequate accounting records that are sufficient to show and explain the Parent Company’s transactions and disclose with reasonable accuracy at any time the financial position of the Parent Company and enable them to ensure that the Parent Company Financial Statements comply with the Companies Act 2006;
• such internal control as they determine is necessary to enable the preparation of Group and Parent Company Financial Statements that are free from material misstatement, whether due to fraud or error, and have general responsibility for taking such steps as are reasonably open to them to safeguard the assets of the Group and to prevent and detect fraud and other irregularities; and
• the maintenance and integrity of the corporate and financial information included on the Group and Parent Company’s website.
Under applicable law and regulations, the Directors are also responsible for preparing a Strategic Report, Directors’ Report, Directors’ Remuneration Report and Corporate Governance Statement that complies with that law and those regulations. Legislation in the United Kingdom governing the preparation and dissemination of Financial Statements may differ from legislation in other jurisdictions.
RESPONSIBILITY STATEMENT OF THE DIRECTORS IN RESPECT OF THE ANNUAL FINANCIAL REPORT We confirm that to the best of our knowledge:
1. the Financial Statements, prepared in accordance with the applicable set of accounting standards, give a true and fair view of the assets, liabilities, financial position and profit or loss of the Group and the undertakings included in the consolidation taken as a whole;
2. the Strategic Report includes a fair review of the development and performance of the business and the position of the Group and the undertakings included in the consolidation taken as a whole, together with a description of the principal risks and uncertainties that they face; and
3. the Annual Report and Financial Statements, taken as a whole, are fair, balanced and understandable and provide the information necessary for shareholders to assess the Group’s position and performance, business model and strategy.
By Order of the Board
David Squires Bindi Foyle Group Chief Executive Group Finance Director 23 February 2018 23 February 2018

SENIOR PLC ANNUAL REPORT & ACCOUNTS 2017 73
FINA
NC
IAL S
TAT
EM
EN
TS
AD
DIT
ION
AL IN
FOR
MA
TIO
N
72 SENIOR PLC ANNUAL REPORT & ACCOUNTS 2017
GOVERNANCES
TR
AT
EG
IC R
EP
OR
TG
OV
ER
NA
NC
E
INDEPENDENT AUDITOR’S REPORT TO THE MEMBERS OF SENIOR PLC
1. OUR OPINION IS UNMODIFIEDWe have audited the financial statements of Senior plc (“the Company”) for the year ended 31 December 2017 which comprise the Consolidated Income Statement, Consolidated Statement of Comprehensive Income, Consolidated and Company Balance Sheet, Consolidated and Company Statement of changes in Equity, Consolidated Cash Flow Statement, and the related notes, including the significant accounting policies in Note 2.
In our opinion:
• the financial statements give a true and fair view of the state of the Group’s and of the Parent Company’s affairs as at 31 December 2017 and of the Group’s profit for the year then ended;
• the Group financial statements have been properly prepared in accordance with International Financial Reporting Standards as adopted by the European Union;
• the Parent Company financial statements have been properly prepared in accordance with UK accounting standards, including FRS 101 Reduced Disclosure Framework; and
• the financial statements have been prepared in accordance with the requirements of the Companies Act 2006 and, as regards the Group financial statements, Article 4 of the IAS Regulation.
Basis for opinionWe conducted our audit in accordance with International Standards on Auditing (UK) (“ISAs (UK)”) and applicable law. Our responsibilities are described below. We believe that the audit evidence we have obtained is a sufficient and appropriate basis for our opinion. Our audit opinion is consistent with our report to the Audit Committee.
We were appointed as auditor by the shareholders of Senior plc at the Annual General Meeting on 21 April 2017 therefore the year ended 31 December 2017 is our first year acting as auditors.
We have fulfilled our ethical responsibilities under, and we remain independent of the Group in accordance with, UK ethical requirements including the FRC Ethical Standard as applied to listed public interest entities. No non-audit services prohibited by that standard were provided.
OVERVIEWMateriality: Group financial statements as a whole £2.6m 5% of Group profit before tax from continuing operations
Coverage• 84% of Group revenue• 92% of Group profit before tax• 91% of Group total assets
Risks of material misstatement
Recurring risks for the Group • Carrying value of work-in-progress and finished goods
• Provisions for uncertain tax positions
Recurring risks for the Parent company
• Recoverability of the Parent Company’s investment in subsidiaries
2. KEY AUDIT MATTERS: OUR ASSESSMENT OF RISKS OF MATERIAL MISSTATEMENTKey audit matters are those matters that, in our professional judgement, were of most significance in the audit of the financial statements and include the most significant assessed risks of material misstatement (whether or not due to fraud) identified by us, including those which had the greatest effect on: the overall audit strategy; the allocation of resources in the audit; and directing the efforts of the engagement team. We summarise on the page opposite the key audit matters, in decreasing order of audit significance, in arriving at our audit opinion above, together with our key audit procedures to address those matters and, as required for public interest entities, our results from those procedures. These matters were addressed, and our results are based on procedures undertaken, in the context of, and solely for the purpose of, our audit of the financial statements as a whole, and in forming our opinion thereon, and consequently are incidental to that opinion, and we do not provide a separate opinion on these matters.
RISKS OF MATERIAL MISSTATEMENT
OUR RESPONSE
Carrying value of work-in-progress and finished goods
(£105.8m)
Refer to the Audit Committee Report in the Governance section, Note 2 (significant accounting policies) and Note 17 (inventories).
Subjective estimateThe Group is engaged to manufacture goods that are specific to customers’ requirements, and most items are built to order. The markets that the Group serves are very price competitive, and new products attract production learning curves that impact manufacturing costs during the early stages of a product’s life cycle. As a consequence, there is a risk that products may cost more than expected to produce compared to the projected cost when the original sales prices were set. This would result in products being sold at amounts lower than cost and accordingly there is a risk that the carrying value of certain items of inventory (both work-in-progress and finished goods) are carried at in excess of net realisable value.
Our procedures included the following: • Test of detail: For a sample of work-in-progress and
finished goods we assessed whether the projected cost of inventories (including cost to complete for work-in-progress items) were in excess of their net realisable value and whether an appropriate write down to net realisable value had been recognised.
• Test of detail: From identified inventories with negative gross margins, we selected a sample and assessed the appropriateness of the level of provision.
• Assessing transparency: Assessing the adequacy of the Group’s disclosures in respect of inventories.
Our results • We found the valuation of work-in-progress and finished
goods to be acceptable.
Provision for uncertain tax positions
(£17.6m)
Refer to the Audit Committee Report in the Governance section, Note 2 (significant accounting policies) and Note 21 (tax balance sheet).
Subjective valuationThe Group operates in a number of different tax jurisdictions and judgement is required to determine tax provisions across the Group principally in the US.
Determination of provisions for tax uncertainties is subject to judgement in assessing the probable outflow of taxes that will be borne by the entity relating to matters where the relevant tax authority’s final assessment of the tax treatment is uncertain.
The transfer pricing tax risk provision held is a key risk due to its size and the subjective nature of the arm’s length basis to which the pricing should adhere to.
There is a risk that the provisions for tax uncertainties recorded are over or under stated.
Our procedures included: • Our tax expertise: Use of our own tax specialists to
assess the Group’s tax positions, its correspondence with the relevant tax authorities, and to analyse and challenge the assumptions used to determine provisions for tax uncertainties based on our knowledge and experiences of the application of the tax legislation. We also assessed the impact of changes in US tax legislation on the Group.
• Assessing transparency: Assess the adequacy of the Group’s disclosures in respect of tax and uncertain tax positions.
Our results • We found the level of provisions for tax uncertainties to be
acceptable.
Recoverability of the Parent Company’s investment in its subsidiary
(£259.9m)
Refer to Note 37 (accounting policies) and Note 39 (investments in subsidiaries) and Company Balance Sheet.
Low risk, high valueThe carrying amount of the Parent Company’s investment in its subsidiary represents 60% of its total assets. Its recoverability is not at a high risk of significant misstatement or subject to significant judgement. However, due to its materiality in the context of the Parent Company financial statements, this is considered to be the area that had the greatest effect on our overall Parent Company audit.
Our procedures included:• Carrying value: We compared the carrying amount of the
investment with the subsidiary’s draft statutory balance sheet to identify whether its net assets, being an approximation of its minimum recoverable amount, was in excess of its carrying amount and assessed whether the subsidiary has historically been profit-making.
Our results• We found the Parent Company’s assessment of the
recoverability of the investment in subsidiaries to be acceptable.
GROUP REVENUE GROUP PROFIT BEFORE TAX* GROUP TOTAL ASSETS
Grouprevenue
16%
84%
*Arises from total profits and losses that made up Group profit before tax
Grouptotal assets
9%
91%
Group profitbefore tax
8%
92%
Full scope for Group audit purposes 2017
Residual components

SENIOR PLC ANNUAL REPORT & ACCOUNTS 2017 75
FINA
NC
IAL S
TAT
EM
EN
TS
AD
DIT
ION
AL IN
FOR
MA
TIO
N
74 SENIOR PLC ANNUAL REPORT & ACCOUNTS 2017
GOVERNANCES
TR
AT
EG
IC R
EP
OR
TG
OV
ER
NA
NC
E
INDEPENDENT AUDITOR’S REPORT TO THE MEMBERS OF SENIOR PLC CONTINUED
3. OUR APPLICATION OF MATERIALITY AND AN OVERVIEW OF THE SCOPE OF OUR AUDIT The materiality for the Group financial statements as a whole was set at £2.6m determined with reference to a benchmark of Group profit before tax from continuing operations, of which it represents 5%.
Materiality for the Parent Company financial statements as a whole was capped at £2.3m, determined with reference to a benchmark of Company total assets, and then capped at 90% of the overall Group materiality.
We agreed to report to the Audit Committee any corrected or uncorrected identified misstatements exceeding £130,000 in addition to other identified misstatements that warranted reporting on qualitative grounds.
Of the Group’s 34 reporting components (excluding the Parent Company), we subjected 23 components to full scope audits for Group purposes.
The components within the scope of our work, including the Parent Company, accounted for the percentages illustrated on page 72.
The remaining 16% of total Group revenue, 8% of Group profit before tax and 9% of total Group assets is represented by 11 reporting components, none of which individually represented more than 5% of any of total Group revenue, Group profit before tax or total Group assets. For these residual components, we performed analysis at an aggregated Group level to re-examine our assessment that there were no significant risks of material misstatement within these.
The Group team instructed component auditors as to the significant areas to be covered, including the relevant risks detailed above and the information to be reported back. The Group team approved the component materialities, which ranged from £0.2m to £1.0m, (excluding the component materiality for the Parent Company, which was set at £2.3m), having regard to the mix of size and risk profile of the Group across the components. The work on 14 of the 23 components was performed by component auditors and the rest, including the audit of the Parent Company, was performed by the Group team.
The Group team visited 7 component locations in the US, Malaysia and Thailand to assess the audit risk and strategy. Video and telephone conference meetings were also held with these component auditors and all others that were not physically visited. At these visits and meetings, the findings reported to the Group team were discussed in more detail, and any further work required by the Group team was then performed by the component auditor.
GROUP PROFIT BEFORE TAX
£52.2m
£2.6mWhole financialstatements materiality
PBT
Group materiality
£0.2m–£1.0mRange of materiality at 23 components
£0.13mMisstatements reported to the Audit Committee
4. WE HAVE NOTHING TO REPORT ON GOING CONCERNWe are required to report to you if:
• we have anything material to add or draw attention to in relation to the Directors’ statement in Note 2 to the financial statements on the use of the going concern basis of accounting with no material uncertainties that may cast significant doubt over the Group and Parent Company’s use of that basis for a period of at least 12 months from the date of approval of the financial statements; or
• the related statement under the Listing Rules set out on page 23 is materially inconsistent with our audit knowledge.
We have nothing to report in these respects.
5. WE HAVE NOTHING TO REPORT ON THE OTHER INFORMATION IN THE ANNUAL REPORTThe Directors are responsible for the other information presented in the Annual Report together with the financial statements. Our opinion on the financial statements does not cover the other information and, accordingly, we do not express an audit opinion or, except as explicitly stated below, any form of assurance conclusion thereon.
Our responsibility is to read the other information and, in doing so, consider whether, based on our financial statements audit work, the information therein is materially misstated or inconsistent with the financial statements or our audit knowledge. Based solely on that work we have not identified material misstatements in the other information.
Strategic report and Directors’ reportBased solely on our work on the other information:
• we have not identified material misstatements in the Strategic Report and the Directors’ report;
• in our opinion the information given in those reports for the financial year is consistent with the financial statements; and
• in our opinion those reports have been prepared in accordance with the Companies Act 2006.
Directors’ remuneration reportIn our opinion the part of the Directors’ Remuneration Report to be audited has been properly prepared in accordance with the Companies Act 2006.
Disclosures of principal risks and longer-term viabilityBased on the knowledge we acquired during our financial statements audit, we have nothing material to add or draw attention to in relation to:
• the Directors’ confirmation within the viability statement on page 23 that they have carried out a robust assessment of the principal risks facing the Group, including those that would threaten its business model, future performance, solvency and liquidity;
• the principal risks disclosures describing these risks and explaining how they are being managed and mitigated; and
• the Directors’ explanation in the viability statement of how they have assessed the prospects of the Group, over what period they have done so and why they considered that period to be appropriate, and their statement as to whether they have a reasonable expectation that the Group will be able to continue in operation and meet its liabilities as they fall due over the period of their assessment, including any related disclosures drawing attention to any necessary qualifications or assumptions.
Under the Listing Rules we are required to review the viability statement. We have nothing to report in this respect.
Corporate governance disclosuresWe are required to report to you if:
• we have identified material inconsistencies between the knowledge we acquired during our financial statements audit and the Directors’ statement that they consider that the Annual Report and financial statements taken as a whole is fair, balanced and understandable and provides the information necessary for shareholders to assess the Group’s position and performance, business model and strategy; or
• the section of the Annual Report describing the work of the Audit Committee does not appropriately address matters communicated by us to the Audit Committee.
We are required to report to you if the Corporate Governance Statement does not properly disclose a departure from the eleven provisions of the UK Corporate Governance Code specified by the Listing Rules for our review.
We have nothing to report in these respects.
6. WE HAVE NOTHING TO REPORT ON THE OTHER MATTERS ON WHICH WE ARE REQUIRED TO REPORT BY EXCEPTIONUnder the Companies Act 2006, we are required to report to you if, in our opinion:
• adequate accounting records have not been kept by the Parent Company, or returns adequate for our audit have not been received from branches not visited by us; or
• the Parent Company financial statements and the part of the Directors’ Remuneration Report to be audited are not in agreement with the accounting records and returns; or
• certain disclosures of Directors’ remuneration specified by law are not made; or
• we have not received all the information and explanations we require for our audit.
We have nothing to report in these respects.
7. RESPECTIVE RESPONSIBILITIESDirectors’ responsibilities As explained more fully in their statement set out on page 71, the Directors are responsible for: the preparation of the financial statements including being satisfied that they give a true and fair view; such internal control as they determine is necessary to enable the preparation of financial statements that are free from material misstatement, whether due to fraud or error; assessing the Group and Parent Company’s ability to continue as a going concern, disclosing, as applicable, matters related to going concern; and using the going concern basis of accounting unless they either intend to liquidate the Group or the Parent Company or to cease operations, or have no realistic alternative but to do so.
Auditor’s responsibilities Our objectives are to obtain reasonable assurance about whether the financial statements as a whole are free from material misstatement, whether due to fraud or other irregularities (see below), or error, and to issue our opinion in an auditor’s report. Reasonable assurance is a high level of assurance, but does not guarantee that an audit conducted in accordance with ISAs (UK) will always detect a material misstatement when it exists. Misstatements can arise from fraud, other irregularities or error and are considered material if, individually or in aggregate, they could reasonably be expected to influence the economic decisions of users taken on the basis of the financial statements.
A fuller description of our responsibilities is provided on the FRC’s website at frc.org.uk/auditorsresponsibilities.
Irregularities – ability to detectOur audit aimed to detect non-compliance with relevant laws and regulations (irregularities) that could have a material effect on the financial statements. In planning and performing our audit, we considered the impact of laws and regulations in the specific areas of anti-bribery and corruption. We identified these areas through discussion with the Directors and other management (as required by auditing standards), from our sector experience, and from inspection of the Group’s legal correspondence. In addition we had regard to laws and regulations in other areas including financial reporting, and company and taxation legislation.
We considered the extent of compliance with those laws and regulations that directly affect the financial statements, being anti-bribery and corruption, as part of our procedures on the related financial statement items. For the remaining laws and regulations, we made enquiries of Directors and other management (as required by auditing standards), and inspected legal correspondence.
We communicated identified laws and regulations throughout our team and remained alert to any indications of non-compliance throughout the audit. This included communication from the Group to component audit teams of relevant laws and regulations identified at Group level, with a request to report on any indications of potential existence of irregularities in these areas, or other areas directly identified by the component team.
As with any audit, there remained a higher risk of non-detection of irregularities, as these may involve collusion, forgery, intentional omissions, misrepresentations, or the override of internal controls.
8. THE PURPOSE OF OUR AUDIT WORK AND TO WHOM WE OWE OUR RESPONSIBILITIESThis report is made solely to the Company’s members, as a body, in accordance with Chapter 3 of Part 16 of the Companies Act 2006. Our audit work has been undertaken so that we might state to the Company’s members those matters we are required to state to them in an auditor’s report and for no other purpose. To the fullest extent permitted by law, we do not accept or assume responsibility to anyone other than the Company and the Company’s members, as a body, for our audit work, for this report, or for the opinions we have formed.
Robert Brent (Senior Statutory Auditor) for and on behalf of KPMG LLP, Statutory Auditor Chartered Accountants 15 Canada Square London E14 5GL 23 February 2018

76 SENIOR PLC ANNUAL REPORT & ACCOUNTS 2017 SENIOR PLC ANNUAL REPORT & ACCOUNTS 2017 77
AD
DIT
ION
AL IN
FOR
MA
TIO
NG
OV
ER
NA
NC
EFIN
AN
CIA
L STA
TE
ME
NT
SS
TR
AT
EG
IC R
EP
OR
T
FINANCIAL STATEMENTS
Notes
Year ended 2017
£m
Year ended 2016
£m
Revenue 3 1,023.4 917.0Trading profit 64.8 65.1 Share of joint venture profit 15 0.7 0.7 Operating profit(1) 5 65.5 65.8 Investment income 7 0.2 0.2 Finance costs 8 (9.7) (10.5)Loss on disposal 31 (3.8) – Profit before tax(2) 52.2 55.5 Tax credit/(charge) 10 8.1 (10.1)Profit for the period 60.3 45.4 Attributable to:Equity holders of the parent 60.3 45.4 Earnings per shareBasic(3) 12 14.39p 10.84pDiluted(4) 12 14.30p 10.83p
(1) Adjusted operating profit 9 82.6 85.6(2) Adjusted profit before tax 9 73.1 75.3(3) Adjusted earnings per share 12 14.39p 14.37p(4) Adjusted and diluted earnings per share 12 14.30p 14.36p
CONSOLIDATED STATEMENT OF COMPREHENSIVE INCOMEFor the year ended 31 December 2017
Notes
Year ended 2017
£m
Year ended 2016
£m
Profit for the period 60.3 45.4 Other comprehensive income:Items that may be reclassified subsequently to profit or loss:Gains/(losses) on foreign exchange contracts – cash flow hedges during the period 12.9 (9.8)Reclassification adjustments for (profits)/losses included in profit (1.4) 0.7 Gains/(losses) on foreign exchange contracts – cash flow hedges 28 11.5 (9.1)Foreign exchange gain recycled to the Income Statement on disposal – (0.4)Exchange differences on translation of overseas operations 28 (18.2) 62.6 Tax relating to items that may be reclassified 10 (2.3) 2.1
(9.0) 55.2 Items that will not be reclassified subsequently to profit or loss:Actuarial gains/(losses) on defined benefit pension schemes 35 5.2 (5.1)Tax relating to items that will not be reclassified 10 0.7 0.5
5.9 (4.6)Other comprehensive (expense)/income for the period, net of tax (3.1) 50.6 Total comprehensive income for the period 57.2 96.0 Attributable to:Equity holders of the parent 57.2 96.0
Notes
Year ended 2017
£m
Year ended 2016
£m
Non-current assetsGoodwill 13 302.4 318.8 Other intangible assets 14 41.6 60.5 Investment in joint venture 15 2.4 1.7 Property, plant and equipment 16 256.1 254.2 Deferred tax assets 21 1.6 6.6 Loan to joint venture 15 0.3 0.9 Retirement benefits 35 19.4 4.0 Trade and other receivables 18 0.5 0.3 Total non-current assets 624.3 647.0 Current assetsInventories 17 154.5 154.4 Loan to joint venture 15 0.2 – Current tax receivables 21 1.0 0.7 Trade and other receivables 18 154.3 152.5 Cash and bank balances 32c 12.6 17.5 Assets classified as held for sale 31 3.9 4.2 Total current assets 326.5 329.3 Total assets 950.8 976.3 Current liabilitiesTrade and other payables 23 173.0 164.8 Current tax liabilities 21 21.2 21.5 Obligations under finance leases 22 0.3 0.5 Bank overdrafts and loans 19 60.5 44.9 Provisions 24 5.5 3.6 Total current liabilities 260.5 235.3 Non-current liabilitiesBank and other loans 19 106.7 169.7 Retirement benefits 35 14.7 14.4 Deferred tax liabilities 21 34.3 55.2 Obligations under finance leases 22 0.2 0.5 Provisions 24 0.2 – Others 2.6 0.7 Total non-current liabilities 158.7 240.5 Total liabilities 419.2 475.8 Net assets 531.6 500.5
EquityIssued share capital 25 41.9 41.9 Share premium account 26 14.8 14.8 Equity reserve 27 3.9 3.0 Hedging and translation reserve 28 33.3 42.3 Retained earnings 29 438.8 400.0 Own shares 30 (1.1) (1.5)Equity attributable to equity holders of the parent 531.6 500.5 Total equity 531.6 500.5
The Financial Statements of Senior plc (registered number 282772) were approved by the Board of Directors and authorised for issue on 23 February 2018. They were signed on its behalf by:
David Squires Bindi FoyleDirector Director
CONSOLIDATED INCOME STATEMENTFor the year ended 31 December 2017
CONSOLIDATED BALANCE SHEETAs at 31 December 2017
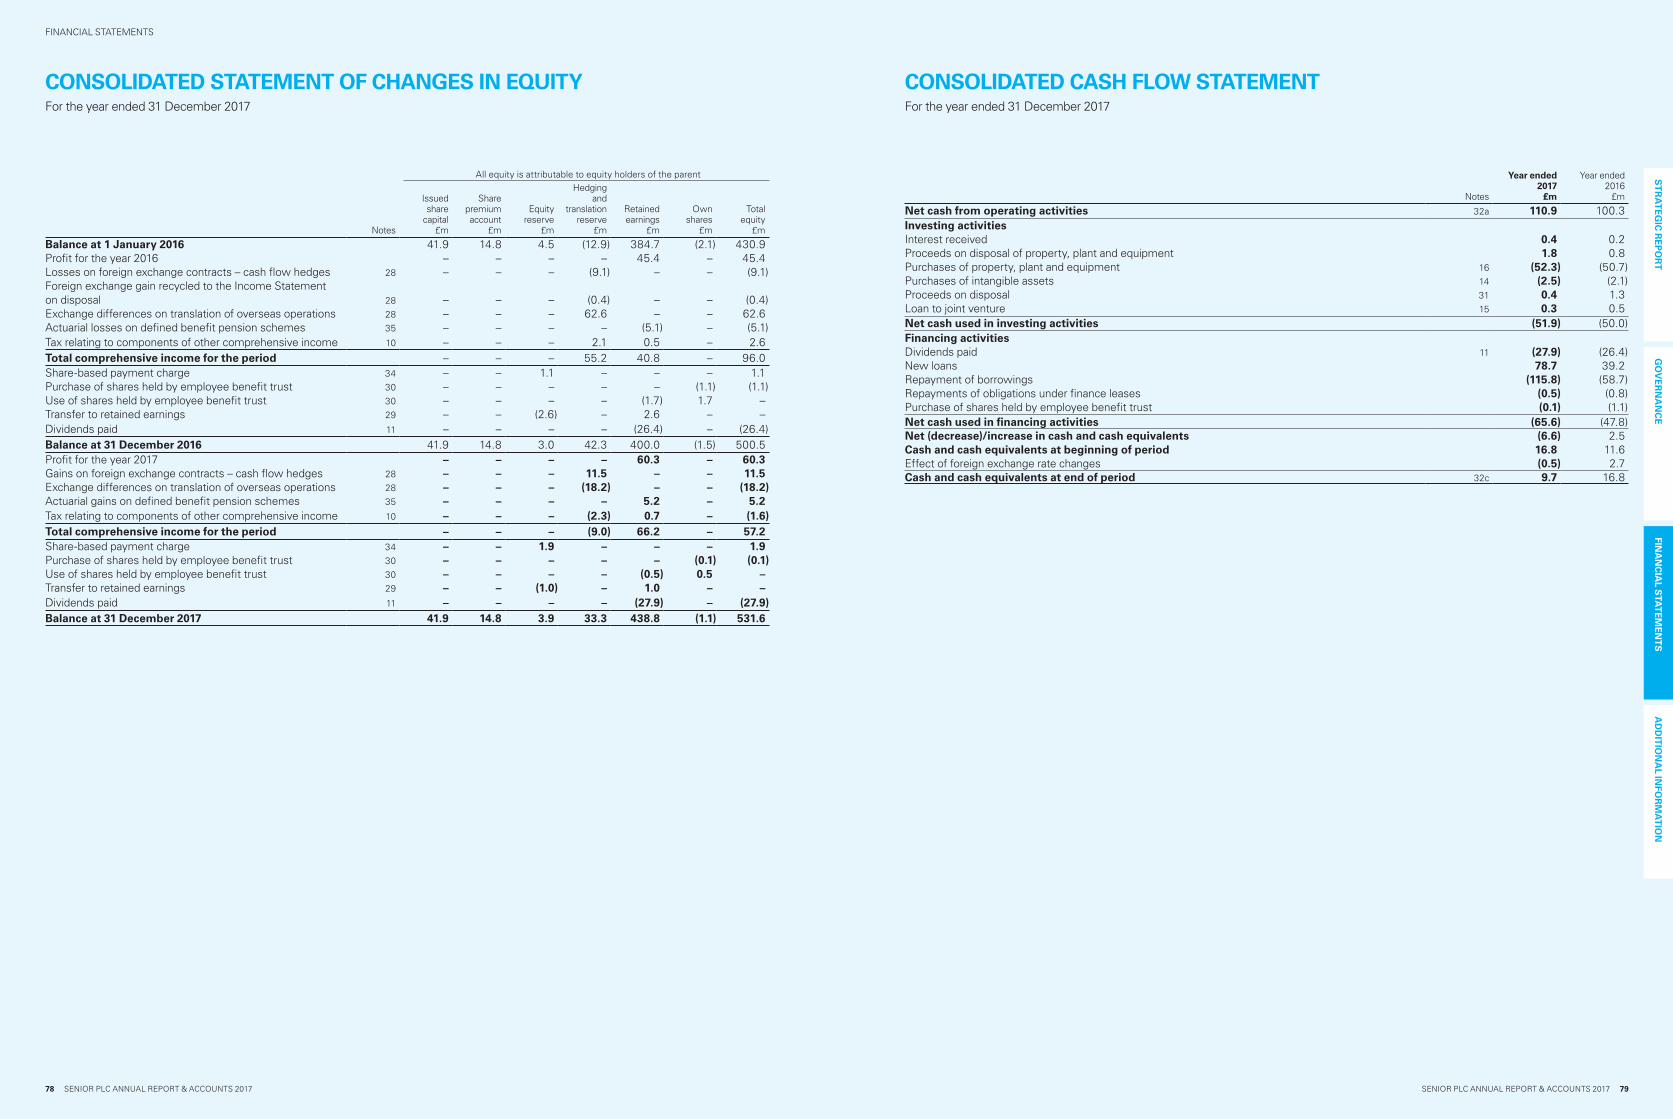
78 SENIOR PLC ANNUAL REPORT & ACCOUNTS 2017 SENIOR PLC ANNUAL REPORT & ACCOUNTS 2017 79
AD
DIT
ION
AL IN
FOR
MA
TIO
NG
OV
ER
NA
NC
EFIN
AN
CIA
L STA
TE
ME
NT
SS
TR
AT
EG
IC R
EP
OR
T
FINANCIAL STATEMENTS
All equity is attributable to equity holders of the parent
Notes
Issued share
capital £m
Share premium account
£m
Equity reserve
£m
Hedging and
translation reserve
£m
Retained earnings
£m
Own shares
£m
Total equity
£m
Balance at 1 January 2016 41.9 14.8 4.5 (12.9) 384.7 (2.1) 430.9 Profit for the year 2016 – – – – 45.4 – 45.4 Losses on foreign exchange contracts – cash flow hedges 28 – – – (9.1) – – (9.1)Foreign exchange gain recycled to the Income Statement on disposal 28 – – – (0.4) – – (0.4)Exchange differences on translation of overseas operations 28 – – – 62.6 – – 62.6 Actuarial losses on defined benefit pension schemes 35 – – – – (5.1) – (5.1)Tax relating to components of other comprehensive income 10 – – – 2.1 0.5 – 2.6 Total comprehensive income for the period – – – 55.2 40.8 – 96.0 Share-based payment charge 34 – – 1.1 – – – 1.1 Purchase of shares held by employee benefit trust 30 – – – – – (1.1) (1.1)Use of shares held by employee benefit trust 30 – – – – (1.7) 1.7 – Transfer to retained earnings 29 – – (2.6) – 2.6 – – Dividends paid 11 – – – – (26.4) – (26.4)Balance at 31 December 2016 41.9 14.8 3.0 42.3 400.0 (1.5) 500.5 Profit for the year 2017 – – – – 60.3 – 60.3 Gains on foreign exchange contracts – cash flow hedges 28 – – – 11.5 – – 11.5 Exchange differences on translation of overseas operations 28 – – – (18.2) – – (18.2)Actuarial gains on defined benefit pension schemes 35 – – – – 5.2 – 5.2 Tax relating to components of other comprehensive income 10 – – – (2.3) 0.7 – (1.6)Total comprehensive income for the period – – – (9.0) 66.2 – 57.2 Share-based payment charge 34 – – 1.9 – – – 1.9 Purchase of shares held by employee benefit trust 30 – – – – – (0.1) (0.1)Use of shares held by employee benefit trust 30 – – – – (0.5) 0.5 – Transfer to retained earnings 29 – – (1.0) – 1.0 – – Dividends paid 11 – – – – (27.9) – (27.9)Balance at 31 December 2017 41.9 14.8 3.9 33.3 438.8 (1.1) 531.6
Notes
Year ended 2017
£m
Year ended 2016
£m
Net cash from operating activities 32a 110.9 100.3 Investing activitiesInterest received 0.4 0.2 Proceeds on disposal of property, plant and equipment 1.8 0.8 Purchases of property, plant and equipment 16 (52.3) (50.7)Purchases of intangible assets 14 (2.5) (2.1)Proceeds on disposal 31 0.4 1.3 Loan to joint venture 15 0.3 0.5 Net cash used in investing activities (51.9) (50.0)Financing activitiesDividends paid 11 (27.9) (26.4)New loans 78.7 39.2 Repayment of borrowings (115.8) (58.7)Repayments of obligations under finance leases (0.5) (0.8)Purchase of shares held by employee benefit trust (0.1) (1.1)Net cash used in financing activities (65.6) (47.8)Net (decrease)/increase in cash and cash equivalents (6.6) 2.5 Cash and cash equivalents at beginning of period 16.8 11.6 Effect of foreign exchange rate changes (0.5) 2.7 Cash and cash equivalents at end of period 32c 9.7 16.8
CONSOLIDATED STATEMENT OF CHANGES IN EQUITYFor the year ended 31 December 2017
CONSOLIDATED CASH FLOW STATEMENTFor the year ended 31 December 2017
80 SENIOR PLC ANNUAL REPORT & ACCOUNTS 2017 SENIOR PLC ANNUAL REPORT & ACCOUNTS 2017 81
AD
DIT
ION
AL IN
FOR
MA
TIO
NG
OV
ER
NA
NC
EFIN
AN
CIA
L STA
TE
ME
NT
SS
TR
AT
EG
IC R
EP
OR
T
FINANCIAL STATEMENTS
1. GENERAL INFORMATIONSenior plc is a company incorporated in England and Wales under the Companies Act. The address of the registered office is given on the inside back cover. The nature of the Group’s operations and its principal activities are set out in Note 4 and on pages 1 to 35.
Items included in the financial statements of each of the Group’s entities are measured using the currency of the primary economic environment in which the entity operates (the functional currency). These Financial Statements are presented in Pounds Sterling, which is the Company’s functional and the Group’s presentation currency.
2. SIGNIFICANT ACCOUNTING POLICIESBasis of accountingThese Financial Statements have been prepared in accordance with International Financial Reporting Standards (IFRS) adopted by the European Union and they therefore comply with Article 4 of the EU IAS Regulation. They have been prepared on the historical cost basis, except for the revaluation of certain financial instruments and retirement benefit costs measured in accordance with IAS 19. They have also been prepared on the going concern basis as set out in the Financial review on pages 20 to 22. The Directors have, at the time of approving these Financial Statements, a reasonable expectation that the Group and Company have adequate resources to continue in operational existence for the foreseeable future. Therefore they continue to adopt the going concern basis of accounting in preparing these Financial Statements.
Changes in accounting policiesDuring the year, no new accounting standards or amendments to existing standards became effective which had a material impact on these Financial Statements. At the date of authorisation of these Financial Statements, a number of new standards and amendments to existing standards have been issued but are not yet effective. They have not been adopted early in these Financial Statements. A summary of the impact review performed on each standard is given below. None of these changes will have an effect on net cash from operating activities nor on free cash flow (see Note 32b).
a) IFRS 9 Financial instruments. Effective for annual periods beginning 1 January 2018
This standard covers the classification, measurement, impairment and derecognition of financial assets and financial liabilities together with a new hedge accounting model. It will replace IAS 39 Financial Instruments. The Group does not expect the transition to this standard to have a material impact on the Financial Statements.
b) IFRS 15 Revenue from Contracts with Customers. Effective for annual periods beginning 1 January 2018
This standard requires the separation of performance obligations within contracts with customers and the contractual value to be allocated to each of the performance obligations. Revenue is then recognised as each performance obligation is satisfied. This standard will replace existing revenue recognition standards.
Retrospective application in the comparative year ending 31 December 2017 is optional. The Group has not taken this optional application and will apply the standard from the transitional date using the cumulative effect method. This involves calculating the relevant adjustments required for contracts not completed as at the transition date of 1 January 2018.
The Group has now completed the implementation of IFRS 15. As expected, the cumulative impact on adoption of IFRS 15 is not material to either the Group’s reported revenue or profit before tax. Emerging market practice and industry interpretations of the standard indicate that the Group does not require an adjustment for customer contribution of
2. SIGNIFICANT ACCOUNTING POLICIES CONTINUEDThe results of subsidiaries acquired or disposed of during the year are included in the Consolidated Income Statement from the effective date of acquisition or up to the effective date of disposal, as appropriate.
The results of joint ventures are accounted for using the equity accounting method.
Where necessary, adjustments are made to the financial statements of subsidiaries to bring the accounting policies used in line with those used by the Group.
All intra-group transactions, balances, income and expenses are eliminated on consolidation.
GoodwillGoodwill arising on consolidation is measured as the excess of the consideration transferred, the amount of any non-controlling interest in the acquiree and the acquisition date fair value of any previous equity interest in the acquiree over the fair value of the Group’s share of the identifiable net assets acquired. It is recognised as an asset and reviewed for impairment at least annually and will be reviewed for indicators of impairment at the Balance Sheet date. Any impairment is recognised immediately through the Consolidated Income Statement and is not subsequently reversed.
If the consideration transferred, the amount of any non-controlling interest in the acquiree and the acquisition date fair value of any previous equity interest in the acquiree is less than the fair value of the net assets acquired (i.e. bargain purchase), the difference is credited to the Consolidated Income Statement in the period of acquisition.
Goodwill acquired in a business combination is allocated, at aquisition, to the group of cash-generating units (CGU groups) that are expected to benefit from that business combination. CGU groups to which goodwill has been allocated are tested for impairment annually or more frequently when there is an indication that the CGU group may be impaired. The recoverable amount of the CGU group is determined by applying a pre-tax discount rate to its pre-tax future cash flows. If the recoverable amount of the CGU group is less than its carrying amount, the impairment loss is allocated first to reduce the carrying amount of any goodwill allocated to the CGU group and then to the other assets of the CGU group pro rata on the basis of the carrying amount of each asset in the CGU group. An impairment loss recognised for goodwill is not reversed in a subsequent period.
On disposal of a subsidiary or part thereof, the attributable amount of goodwill is included in the determination of the profit or loss on disposal.
Goodwill arising on acquisitions prior to the date of transition to IFRS has been retained at the previous UK GAAP amount subject to being tested for impairment at that date. Goodwill written off to reserves under UK GAAP prior to 1998 has not been reinstated and is not included in determining any subsequent profit or loss on disposal.
Revenue recognitionRevenue is measured at the fair value of the consideration received or receivable and represents amounts receivable for goods provided in the normal course of business, net of discounts, VAT and other sales-related taxes.
Revenue from the sales of goods is recognised on delivery or when available for collection, in accordance with the terms and conditions of sale, which is when the significant risks and rewards of ownership and effective control of the goods has passed to the customer, recovery of the consideration is probable, and the amount of revenue and associated costs can be measured reliably.
NOTES TO THE CONSOLIDATED FINANCIAL STATEMENTS
goods to facilitate the Group’s fulfilment of the customer contracts. The Group will continue to monitor the market practice and will re-evaluate the accounting position if there are any significant developments which indicate a different treatment should be taken.
c) IFRS 16 Leases. Effective for annual periods beginning 1 January 2019
This standard, which will replace IAS 17, requires lessees to recognise assets and liabilities for all leases, unless the lease term is 12 months or less or the underlying asset is low value. As at 31 December 2017, the Group holds a significant number of operating leases which currently, under IAS 17, are expensed on a straight-line basis over the lease term (see Note 33).
Retrospective application in the comparative year ending 31 December 2018 is optional. The Group expects that it will not take this optional application and will apply the standard from the transitional date using the modified retrospective approach, adjusting opening retained earnings and not re-stating comparatives. This involves calculating the right-of-use asset and lease liability based on the present value of remaining lease payments on all applicable lease contracts as at the transition date.
The Group has collated the operating lease information across all the Divisions and head office in order to assess the updated cumulative adjustment on transition. If the new requirements were adopted in 2017, profit before tax would change by an immaterial amount, whilst lease liabilities and property, plant and equipment are estimated to increase between £50m and £70m (2016 – £50m and £70m). This is expected to result in an increase of the Group’s principal lending covenant, the ratio of net debt to EBITDA by 0.2x to 0.5x (2016 – 0.2x to 0.5x), except where it is determined at constant accounting standards. The ranges disclosed reflect the sensitivity of the adjustment to a +/-3 percentage point movement in the discount rate used to calculate the present value of the future cash flow commitments. The discount rate, the renewal of and changes to the lease portfolio and exchange rates on translation of financial statements of non-Sterling operations are all subject to change in future years, which will impact the actual transitional adjustment as at the expected transition date.
The Group will continue to monitor the impact until the transition date, providing further quantitative and qualitative measures as progress is made on implementation planning.
d) None of the amendments to existing standards are expected to have a significant impact on the Financial Statements when they are adopted.
Basis of consolidationThe Consolidated Financial Statements incorporate the Financial Statements of Senior plc and the entities controlled by it (its subsidiaries) made up to 31 December 2017. Control is achieved when Senior plc has the power to govern the financial and operating policies of an invested entity so as to obtain benefits from its activities.
Acquisitions of subsidiaries and businesses are accounted for using the acquisition method. The consideration transferred for each acquisition is the aggregate of the fair values (at the date of exchange) of assets transferred, liabilities incurred or assumed, and equity interests issued by the Group. The consideration transferred includes the fair value of any asset or liability resulting from a contingent consideration arrangement. Acquisition-related costs are expensed as incurred. Identifiable assets acquired and liabilities and contingent liabilities assumed are measured initially at their fair values at the acquisition date. On an acquisition-by-acquisition basis, the Group recognises any non-controlling interest in the acquiree either at fair value or at the non-controlling interest’s proportionate share of the acquiree’s net assets.
Funded development revenue is recognised based upon fair value of work performed to the Balance Sheet date and assessed with reference to completed contract milestones which have been accepted by the customer.
Dividend income from investments is recognised when the shareholders’ legal rights to receive payment have been established.
InterestInterest receivable/payable is credited/charged to the Income Statement using the effective interest method.
LeasingLeases are classified as finance leases whenever the terms of the lease substantially transfer all the risks and rewards of ownership to the lessee. All other leases are classified as operating leases.
Assets held under finance leases are recognised as assets of the Group at their fair value or, if lower, at the present value of the minimum lease payments, each determined at the inception of the lease. The corresponding liability to the lessor is included in the Balance Sheet as a finance lease obligation. Lease payments are apportioned between finance charges and a reduction of the lease obligation in order to achieve a constant rate of interest on the remaining balance of the liability. Finance charges are charged directly to the Income Statement.
Rentals payable under operating leases are expensed on a straight-line basis over the term of the relevant lease.
Benefits received and receivable as incentives to enter into an operating lease are also spread on a straight-line basis over the lease term.
Foreign currenciesTransactions in currencies other than the functional currency are recorded at the rates of exchange prevailing on the date of the transaction. At each Balance Sheet date, monetary assets and liabilities that are denominated in foreign currencies are retranslated at the rates prevailing on the Balance Sheet date. Non-monetary items carried at fair value that are denominated in foreign currencies are translated at the rates prevailing at the date when the fair value was determined. Non-monetary items that are measured at historical cost in a foreign currency are not retranslated. Gains and losses arising on retranslation are included in profit or loss for the period, except for exchange differences arising on non-monetary assets and liabilities where the changes in fair value are recognised directly in equity, subject to meeting the requirements under IAS 21.
In order to hedge its exposure to certain foreign exchange risks, the Group enters into forward exchange contracts (see section below on derivative financial instruments and hedging for details of the Group’s accounting policies in respect of such derivative financial instruments).
On consolidation, the assets and liabilities of the Group’s overseas operations are translated at exchange rates prevailing on the Balance Sheet date. Income and expense items are translated at the average exchange rates for the period. Exchange rate differences arising, if any, are classified as equity and transferred to the Group’s translation reserve. Such translation differences are recognised as income or expense in the period in which the operation is disposed of.
Goodwill and fair value adjustments arising on the acquisition of a foreign entity are treated as assets and liabilities of the foreign entity and translated at the closing rate on the relevant Balance Sheet date.
82 SENIOR PLC ANNUAL REPORT & ACCOUNTS 2017 SENIOR PLC ANNUAL REPORT & ACCOUNTS 2017 83
AD
DIT
ION
AL IN
FOR
MA
TIO
NG
OV
ER
NA
NC
EFIN
AN
CIA
L STA
TE
ME
NT
SS
TR
AT
EG
IC R
EP
OR
T
FINANCIAL STATEMENTS
2. SIGNIFICANT ACCOUNTING POLICIES CONTINUEDThe exchange rates for the major currencies applied in the translation of results were as follows:
Average rates 2017
Average rates 2016
Year-end rates 2017
Year-end rates 2016
US Dollar 1.29 1.36 1.35 1.24
Government grantsGovernment grants received for items of a revenue nature are recognised as income over the period necessary to match them with the related costs and are deducted in reporting the related expense.
Government grants relating to investment in property, plant and equipment are deducted from the initial carrying value of the related capital asset.
Retirement benefit costsPayments to defined contribution retirement plans are charged as an expense as they fall due. Payments made to state-managed retirement benefit plans are dealt with as payments to defined contribution plans where the Group’s obligations under the plans are equivalent to those arising in a defined contribution retirement plan.
For defined benefit retirement plans, the cost of providing benefits is determined using the Projected Unit Method, with full actuarial valuations being carried out on a triennial basis, and updated at each Balance Sheet date. Actuarial gains and losses are recognised in full in the period in which they occur. They are recognised outside the Income Statement and are presented in the Statement of Comprehensive Income.
Past service cost is recognised as an expense at the earlier of a plan amendment, curtailment, or restructuring.
The retirement benefit obligation recognised in the Balance Sheet represents the present value of the defined benefit obligation, and as reduced by the fair value of scheme assets. Any net asset resulting from this calculation is limited to the past service cost plus the present value of available refunds and reductions in future contributions to the plan.
TaxationCurrent tax payable is based on taxable profit for the year. Taxable profit differs from profit before tax as reported in the Income Statement because it excludes items of income or expense that are taxable or deductible in other years and it further excludes items that are never taxable or deductible. The Group’s liability for current tax is calculated using tax rates that have been enacted or substantively enacted by the Balance Sheet date.
Provisions for tax uncertainties are included within current tax liabilities on the Balance Sheet. There are transactions and activities that the Group engages in where the ultimate tax determination is uncertain and a provision may be made against the tax benefit. For example, the Group seeks to price transactions between Group companies as if they were unrelated parties in compliance with OECD transfer pricing principles and the laws of the relevant jurisdictions and this involves a degree of uncertainty. Provisions against uncertainties are established based on management judgement of the range of likely tax outcomes in open years and in consideration of the strength of technical arguments and are based on amounts that the company expect to pay following this assessment. When making this assessment, the Group utilises specialist in-house tax knowledge and experience and takes into consideration specialist tax advice from third party advisers on specific items.
Deferred tax is the tax expected to be payable or recoverable on differences between the carrying amounts of assets and liabilities in the Financial Statements and the corresponding tax bases used in the computation of taxable profit, and is accounted for using the Balance Sheet liability method. Deferred tax liabilities are generally recognised for all taxable temporary differences and deferred tax assets are recognised to the extent it is probable that taxable profits will be available against which deductible temporary differences can be utilised. Such assets and liabilities are not recognised if the temporary difference arises from goodwill or from the initial recognition (other than in a business combination) of other assets and liabilities in a transaction that affects neither the Group’s taxable profit nor its accounting profit.
Deferred tax liabilities are recognised for taxable temporary differences arising on investments in subsidiaries and associates, and interests in joint ventures, except where the Group is able to control the reversal of the temporary difference and it is probable that the temporary difference will not reverse in the foreseeable future.
The carrying value of deferred tax assets is reviewed at each Balance Sheet date and reduced to the extent it is no longer probable that sufficient taxable profits will be available to allow all or part of the deferred tax asset to be recovered.
Deferred tax is calculated at the tax rates that are expected to apply in the period when the liability is settled or the asset is realised based on tax laws and rates that have been enacted at the Balance Sheet date. Deferred tax is charged or credited in the Income Statement, except when it relates to items charged or credited to Other Comprehensive Income or directly to equity, in which case the deferred tax is also dealt with in Other Comprehensive Income or equity.
Property, plant and equipmentLand and buildings held for use in the production or supply of goods or services, or for administrative purposes, are stated in the Balance Sheet at their historical cost, or at modified historical cost, being a revaluation undertaken in 1988 which has been taken as the effective cost on transition to IFRS. Land and buildings were revalued to fair value at the date of revaluation.
The Group does not intend to conduct annual revaluations.
Fixtures, plant and equipment are stated at cost less accumulated depreciation and any recognised impairment loss.
Depreciation is charged to write off the cost of an asset on a straight-line basis over the estimated useful life of the asset, and is charged from the time an asset becomes available for its intended use. Annual rates are as follows:
Freehold land NilFreehold buildings 2%Leasehold buildings over their expected useful lives on the same
basis as owned assets or, where shorter, over the lease term
Plant and equipment 5% – 33%
The gain or loss arising on the disposal or retirement of an asset is determined as the difference between the sale proceeds and the carrying amount of the asset at disposal and is recognised in the Income Statement.
2. SIGNIFICANT ACCOUNTING POLICIES CONTINUEDInternally generated intangible assets – research and development expenditureAn intangible asset arising from unfunded development work shall be recognised if the following can be demonstrated:
i. the asset can be separately identified.
ii. it is probable that the asset created will generate future economic benefits.
iii. the development cost of the asset can be measured reliably during its development.
iv. it is technically feasible to complete the asset so that it will be available for use or sale.
v. there is intention to complete the asset and use or sell it.
vi. the Group has ability to use or sell the asset.
vii. the Group has availability of adequate technical, financial and other resources to complete the development work and to use or sell the asset.
Internally generated intangible assets are amortised on a straight-line basis over their useful lives.
Costs incurred in relation to funded development work are accumulated in inventory and are recognised when the related billings are made. Any amounts held in inventory are subject to normal inventory valuation principles.
Other expenditure on research and development activities, that do not meet the capitalisation criteria above, is recognised as an expense in the period in which it is incurred.
Other intangible assetsOther intangible assets include computer software and intangible assets acquired as part of a business combination.
The cost of acquiring computer software (including associated implementation and development costs where applicable) is classified as an intangible asset. Costs associated with maintaining computer software programs are recognised as an expense as incurred. Capitalised computer software is amortised over its estimated useful life of between three and five years on a straight-line basis, and is stated at cost less accumulated amortisation and impairment losses.
Intangible assets acquired as part of a business combination principally comprise customer relationships, contracts and trade names. They are shown at fair value at the date of acquisition less accumulated amortisation at the rates of between three and five years on a straight-line basis.
Impairment of tangible and intangible assets excluding goodwillAt each Balance Sheet date, the Group reviews the carrying amounts of its tangible and intangible assets to determine whether there is any indication that those assets have suffered an impairment loss. If any such indication exists, the recoverable amount of the asset is estimated in order to determine the extent of the impairment loss (if any). Where the asset does not generate cash flows that are independent from other assets, the Group estimates the recoverable amount of the cash-generating unit to which the asset belongs.
The recoverable amount is the higher of the fair value less the costs to sell and the value in use. In assessing the value in use, the estimated future cash flows are discounted to their present value using a pre-tax discount rate that reflects current market assessments of the time value of money and the risks specific to the asset for which the estimates of future cash flows have not been adjusted.
If the recoverable amount of an asset is estimated to be less than its carrying amount, the carrying amount of the asset is reduced to its recoverable amount. An impairment loss is recognised as an expense immediately, unless the relevant asset is carried at a revalued amount, in which case the impairment loss is treated as a revaluation decrease.
Where an impairment loss subsequently reverses, the carrying amount of the asset is increased to the revised estimate of its recoverable amount, so that the increased carrying amount does not exceed the carrying amount that would have been determined had no impairment loss been recognised for the asset in prior years. A reversal of an impairment loss is recognised as income immediately, unless the relevant asset is carried at a revalued amount, in which case the reversal of the impairment loss is treated as a revaluation increase.
InventoriesInventories are stated at the lower of cost and net realisable value. Costs comprise direct materials and, where applicable, direct labour costs and an appropriate allocation of production overheads. Cost is calculated using the first-in, first-out method. Net realisable value represents the estimated selling price less the estimated costs of completion and the costs to be incurred in marketing, selling and distribution.
Financial instrumentsFinancial assets and liabilities are recognised when the Group becomes a party to the contractual provisions of the relevant instrument and derecognised when it ceases to be a party to such provisions.
Financial instruments are classified as cash and cash equivalents, bank overdrafts and loans, obligations under finance leases, trade receivables, trade payables, deferred consideration receivable, other receivables and other payables, as appropriate.
Non-derivative financial assets are categorised as ”Financial assets at amortised cost” and non-derivative financial liabilities are categorised as “Financial liabilities at amortised cost”. Derivative financial assets and liabilities that are not designated and effective as hedging instruments are categorised as “financial assets at fair value through profit or loss” and “financial liabilities at fair value through profit or loss”, respectively. The classification depends on the nature and purpose of the financial assets and liabilities and is determined at the time of initial recognition.
Trade receivablesTrade receivables do not carry any interest and are stated at their nominal value as reduced by appropriate allowances for estimated irrecoverable amounts. These are recognised in the Income Statement when there is objective evidence that the asset is impaired. Significant financial difficulties of the debtor, probability that the debtor will enter bankruptcy or financial reorganisation, and default or delinquency in payments are considered indicators that the asset is impaired. The carrying amount of the asset is reduced through the use of an allowance account. When a trade receivable is considered uncollectible, it is written off against the allowance account. Subsequent recoveries of amounts previously written off are credited against the allowance account. Changes in the carrying amount of the allowance account are recognised in the Income Statement. Trade receivables are derecognised when factored, without recourse, through third party financial institutions (the Factors). The risks and rewards of ownership and right to receive cash flows of the trade receivables are transferred to the Factors.
NOTES TO THE CONSOLIDATED FINANCIAL STATEMENTS CONTINUED

84 SENIOR PLC ANNUAL REPORT & ACCOUNTS 2017 SENIOR PLC ANNUAL REPORT & ACCOUNTS 2017 85
AD
DIT
ION
AL IN
FOR
MA
TIO
NG
OV
ER
NA
NC
EFIN
AN
CIA
L STA
TE
ME
NT
SS
TR
AT
EG
IC R
EP
OR
T
FINANCIAL STATEMENTS
2. SIGNIFICANT ACCOUNTING POLICIES CONTINUEDCash and cash equivalentsCash and cash equivalents comprise cash at bank and other short-term highly liquid investments that are readily convertible to a known amount of cash and are subject to an insignificant risk of changes in value.
Non-derivative financial liabilitiesNon-derivative financial liabilities are stated at amortised cost using the effective interest method. The effective interest method is a method of calculating the amortised financial liability and of allocating interest over the relevant period. The effective interest rate is the rate that exactly discounts estimated future cash payments through the expected life of the financial liability, or, where appropriate, a shorter period, to the net carrying amount on initial recognition. For borrowings, their carrying value includes accrued interest payable, as well as unamortised issue costs.
Equity instrumentsEquity instruments issued by the Company are recorded at the value of the proceeds received, net of direct transaction costs.
Derivative financial instruments and hedgingThe Group’s activities expose it primarily to the financial risks of changes in foreign currency exchange rates and interest rates. The Group uses foreign exchange contracts and, on occasion, interest rate swap contracts to hedge these exposures. The use of financial derivatives is governed by the Group’s Treasury Policies as approved by the Board of Directors, which provides written principles on the use of derivatives. The Group does not use derivative financial instruments for speculative purposes.
Certain derivative instruments do not qualify for hedge accounting. These are categorised as at “fair value through profit or loss” and are stated at fair value, with any resultant gain or loss recognised in the Income Statement.
The Group designates certain hedging instruments in respect of foreign currency risk as cash flow hedges. At the inception of the hedge relationship, the Group documents the relationship between the hedging instrument and the hedged item, along with its risk management objectives and strategy for undertaking various hedging transactions. The Group also documents, both at hedge inception and on an ongoing basis, whether the hedging instrument that is used in a hedging relationship is highly effective in offsetting changes in fair values or cash flows of the hedged item.
Changes in the fair value of derivative financial instruments that are designated and are effective as a cash flow hedge are recognised directly in equity and the ineffective portion is recognised immediately in the Income Statement. If the cash flow hedge of a firm commitment or forecasted transaction results in the recognition of an asset or a liability, then, at the time the asset or liability is recognised, the associated gains or losses on the derivative that had previously been recognised in equity are included in the initial measurement of the asset or liability. For hedges that do not result in the recognition of an asset or a liability, amounts deferred in equity are recognised in the Income Statement in the same period in which the hedged item affects profit or loss.
For an effective hedge of an exposure to changes in fair value, the hedged item is adjusted for changes in fair value attributable to the risk being hedged with the corresponding entry in the Income Statement. Gains or losses from remeasuring the derivative are also recognised in the Income Statement. If the hedge is effective, these entries will offset in the Income Statement.
Changes in the fair value of derivative financial instruments that do not qualify for hedge accounting are recognised in the Income Statement as they arise.
Hedge accounting is discontinued when the hedging instrument expires or is sold, terminated, exercised, or no longer qualifies for hedge accounting. At that time, any cumulative gain or loss on the hedging instrument recognised in equity is retained in equity until the forecasted transaction occurs. If a hedged transaction is no longer expected to occur, the net cumulative gain or loss recognised in equity is transferred to the Income Statement for the period.
Gains and losses accumulated in equity are recognised in the Income Statement on disposal of the overseas operation.
Assets and disposal groups held for saleAssets are classified as held for sale if their carrying amount will be recovered by sale rather than by continuing use in the business. Where a group of assets and their directly associated liabilities are to be disposed of in a single transaction, such disposal groups are also classified as held for sale. For this to be the case, the asset or disposal group must be available for immediate sale in its present condition, and management must be committed to and have initiated a plan to sell the asset or disposal group which, when initiated, was expected to result in a completed sale within 12 months. Assets that are classified as held for sale are not depreciated. Assets or disposal groups that are classified as held for sale are measured at the lower of their carrying amount and fair value less costs to sell.
ProvisionsProvisions are recognised when the Group has a present obligation (legal or constructive) as a result of a past event, it is probable that the Group will be required to settle that obligation and a reliable estimate can be made of the amount of the obligation. Provisions are measured at the Directors’ best estimate of the expenditure required to settle the obligation at the Balance Sheet date, taking into account the risks and uncertainties (such as timing or amount) surrounding the obligation. They are not discounted to present value if the effect is not material.
Provisions for restructuring costs are recognised when the Group has a detailed formal plan for the restructuring and the plan has been communicated to the affected parties. Provisions for the expected cost for warranty obligations under local sale of goods legislation are recognised at the date of sale of the relevant products.
Share-based paymentsThe Group has applied the requirements of IFRS 2 Share-based payments.
The Group has issued equity-settled share-based payments to certain employees. The fair value (excluding the effect of non-market-related conditions), as determined at the grant date, is expensed on a straight-line basis over the vesting period, based on the Group’s estimate of the number of shares that will eventually vest and adjusted for the effect of non-market-related conditions.
Fair value is measured by use of a Black-Scholes model for the share option plans, and a binomial model for the share awards under the 2005 Long-Term Incentive Plan.
The liability in respect of equity-settled amounts is included in equity.
2. SIGNIFICANT ACCOUNTING POLICIES CONTINUEDCritical accounting judgementsIAS requires disclosure of the judgements management makes when applying its significant accounting policies and that have the most significant effect on amounts that are recognised in the Group’s Financial Statements. In the course of preparing the Financial Statements, no significant critical judgements have been made in the process of applying the Group’s accounting policies, other than those involving estimations, which are dealt with separately below. Management makes other judgements in the normal course of conducting business, such as those in relation to contractual matters and legal costs (see Note 24 for further details).
Key sources of estimation and uncertaintyWhen applying the Group’s accounting policies, management must make assumptions and estimates concerning the future that affect the carrying amounts of assets and liabilities at the Balance Sheet date and the amounts of revenue and expenses recognised during the period. Such assumptions are based upon factors including historical experience, the observance of trends in the industries in which the Group operates, and information available from the Group’s customers and other external sources. The key sources of estimation and uncertainty at the Balance Sheet date that have a significant risk of causing a material adjustment to the carrying amounts of assets and liabilities within the next financial year and beyond include:
Income taxesIn determining the Group provisions for income tax and deferred tax, it is necessary to consider transactions in a small number of key tax jurisdictions for which the ultimate tax determination is uncertain. To the extent that the final outcome differs from the tax that has been provided, adjustments will be made to income tax and deferred tax provisions held in the period the determination is made. The carrying amount of net current tax liability and deferred tax liability at 31 December 2017 was £20.2m (2016 – £20.8m) and £32.7m (2016 – £48.6m), respectively. Further details on these estimates are set out in Notes 10 and 21.
Inventory net realisable valueManagement assesses the carrying value of inventory to ensure that it is held at lower of cost and net realisable value. Where necessary, management makes an estimate to write down inventory to its net realisable value. The Group held a net inventory balance at the year-end of £154.5m (2016 – £154.4m). In determining an estimate of net realisable value, management has made assumptions in respect of the durability, quality, specificity and order cover, which provide some protection against adverse market conditions, and competitor product development and pricing activity. Inventory held is typically built on a demand basis and is customer specific.
The Group holds a number of customer work packages in the Aerospace Division, which are tested for onerous conditions at each Balance Sheet date. A significant change in production costs or in the execution to deliver planned cost savings in the next financial year could result in unavoidable costs associated with one or more of these work packages to exceed the economic benefits expected to be received over their life. In such cases a provision for the resulting present obligation would be recognised. To date no such provisions have been required.
Retirement benefitsManagement makes assumptions and estimates, for the next financial year and beyond, which affect the value of the carrying amount of the UK Plan retirement benefit obligation at 31 December 2017. The UK Plan retirement benefit obligation is discounted at a rate set by reference to market yields at the end of the reporting period on high quality corporate
bonds. Estimation is required when setting the criteria for bonds to be included in the population from which the yield curve is derived. The most significant criteria considered for the selection of bonds include the issue size of the corporate bonds, quality of the bonds and the identification of outliers which are excluded. Management follows actuarial advice from a third party when determining these estimates. The carrying amount of the UK Plan’s retirement benefits at 31 December 2017 was a surplus of £19.4m (2016 – surplus of £4.0m), being the present value of the defined benefit obligations of £301.8m (2016 – £297.4m) and fair value of plan assets of £321.2m (2016 – £301.4m). Further details and sensitivities from changes in estimates are set out in Note 35g.
GoodwillDuring the year, management has reviewed the carrying value of goodwill and available headroom (the extent to which recoverable amount exceeds carrying amount) in the context of the in-year performance, future forecasts and market conditions. Based on this assessment, management has resolved that the carrying value of goodwill is no longer considered a significant risk in terms of a material misstatement. The carrying value of goodwill and sensitivities are set out in Note 13.
3. REVENUEAn analysis of the Group’s revenue is as follows:
Year ended 2017
£m
Year ended 2016
£m
Sale of goods 1,023.4 917.0
4. SEGMENT INFORMATIONThe Group reports its segment information as two operating Divisions according to the market segments they serve, Aerospace and Flexonics, which is consistent with the oversight employed by the Executive Committee. The chief operating decision maker, as defined by IFRS 8, is the Executive Committee. For management purposes, the Aerospace Division is managed as two sub-divisions, Aerostructures and Fluid Systems; however, these are aggregated as one reporting segment as they service similar markets and customers in accordance with IFRS 8. The Flexonics Division is managed as a single division.
The accounting policies of the reportable segments are the same as the Group’s accounting policies described in Note 2 and the sales between segments are carried out at arm’s length. Adjusted operating profit, as described in Note 9, is the key measure reported to the Group’s Executive Committee for the purpose of resource allocation and assessment of segment performance. Investment income, finance costs and tax are not allocated to segments, as this type of activity is driven by the central tax and treasury function.
Segment assets include directly attributable computer software assets, property, plant and equipment, working capital assets, goodwill and intangible assets from acquisitions. Cash, deferred and current tax and other financial assets (except for working capital) are not allocated to segments for the purposes of reporting financial performance to the Group’s Executive Committee.
Segment liabilities include directly attributable working capital liabilities. Debt, finance leases, retirement benefits, deferred and current tax and other financial liabilities (except for working capital) are not allocated to segments for the purposes of reporting financial performance to the Group’s Executive Committee.
Central costs, assets and liabilities are corporate items not allocated to segments, which is consistent with the format used by the chief operating decision maker.
NOTES TO THE CONSOLIDATED FINANCIAL STATEMENTS CONTINUED

86 SENIOR PLC ANNUAL REPORT & ACCOUNTS 2017 SENIOR PLC ANNUAL REPORT & ACCOUNTS 2017 87
AD
DIT
ION
AL IN
FOR
MA
TIO
NG
OV
ER
NA
NC
EFIN
AN
CIA
L STA
TE
ME
NT
SS
TR
AT
EG
IC R
EP
OR
T
FINANCIAL STATEMENTS
NOTES TO THE CONSOLIDATED FINANCIAL STATEMENTS CONTINUED
4. SEGMENT INFORMATION CONTINUEDSegment information for revenue, operating profit and a reconciliation to entity and profit after tax is presented below:
Aerospace Year ended
2017 £m
Flexonics Year ended
2017 £m
Eliminations/ central
costs Year ended
2017 £m
Total Year ended
2017 £m
Aerospace Year ended
2016 £m
Flexonics Year ended
2016 £m
Eliminations/ central
costs Year ended
2016 £m
Total Year ended
2016 £m
External revenue 724.7 298.7 – 1,023.4 665.1 251.9 – 917.0 Inter-segment revenue 0.6 0.1 (0.7) – 0.1 0.2 (0.3) – Total revenue 725.3 298.8 (0.7) 1,023.4 665.2 252.1 (0.3) 917.0 Adjusted trading profit 76.6 20.0 (14.7) 81.9 74.8 20.7 (10.6) 84.9 Share of joint venture profit – 0.7 – 0.7 – 0.7 – 0.7 Adjusted operating profit 76.6 20.7 (14.7) 82.6 74.8 21.4 (10.6) 85.6 Amortisation of intangible assets from acquisitions (8.5) (8.6) – (17.1) (11.3) (8.5) – (19.8)Operating profit 68.1 12.1 (14.7) 65.5 63.5 12.9 (10.6) 65.8 Investment income 0.2 0.2 Finance costs (9.7) (10.5)Loss on disposal (3.8) – Profit before tax 52.2 55.5 Tax 8.1 (10.1)Profit after tax 60.3 45.4
Trading profit and adjusted trading profit is operating profit and adjusted operating profit respectively before share of joint venture profit. See Note 9 for the derivation of adjusted operating profit.
Segment information for assets, liabilities, additions to non-current assets and depreciation and amortisation is presented below:
Assets
Year ended 2017
£m
Year ended 2016
£m
Aerospace 667.8 693.9 Flexonics 244.2 248.0 Segment assets for reportable segments 912.0 941.9 UnallocatedCentral 3.7 3.8 Cash 12.6 17.5 Deferred and current tax 2.6 7.3 Retirement benefits 19.4 4.0 Others 0.5 1.8 Total assets per Balance Sheet 950.8 976.3
Liabilities
Year ended 2017
£m
Year ended 2016
£m
Aerospace 120.3 117.4 Flexonics 48.1 41.6 Segment liabilities for reportable segments 168.4 159.0 UnallocatedCentral 11.0 6.8 Debt 167.2 214.6 Finance leases 0.5 1.0 Deferred and current tax 55.5 76.7 Retirement benefits 14.7 14.4 Others 1.9 3.3 Total liabilities per Balance Sheet 419.2 475.8
4. SEGMENT INFORMATION CONTINUEDAdditions to non-current
assets Year ended
2017 £m
Additions to non-current
assets Year ended
2016 £m
Depreciation and
amortisation Year ended
2017 £m
Depreciation and
amortisation Year ended
2016 £m
Aerospace 41.0 40.1 36.2 34.8 Flexonics 13.4 12.2 21.5 19.0 Sub-total 54.4 52.3 57.7 53.8 Central 0.4 0.5 0.2 0.2 Total 54.8 52.8 57.9 54.0
The Group’s revenues from its major products are presented below:
Year ended 2017
£m
Year ended 2016
£m
Aerospace – Structures 416.9 379.8 Aerospace – Fluid Systems 307.8 285.3 Aerospace total 724.7 665.1 Land vehicles 157.8 127.2 Industrial and others 140.9 124.7 Flexonics total 298.7 251.9 Group total 1,023.4 917.0
Revenue of approximately £119.6m (2016 – £99.6m) arose from sales to the Group’s largest customer and revenue of approximately £102.6m (2016 – £110.2m) arose from sales to the Group’s second largest customer.
Geographical informationThe Group’s operations are located principally in North America and Europe.
The following table provides an analysis of the Group’s sales by geographical market, irrespective of the origin of the goods. The carrying values of segment non-current assets are analysed by the geographical area in which the assets are located.
Sales revenue
Year ended 2017
£m
Sales revenue
Year ended 2016
£m
Segment non-current
assets Year ended
2017 £m
Segment non-current
assets Year ended
2016 £m
USA 478.2 448.4 318.8 360.5 UK 161.0 175.7 147.1 141.6 Rest of the World 384.2 292.9 156.8 138.3 Sub-total 1,023.4 917.0 622.7 640.4 Unallocated amounts – – 1.6 6.6 Total 1,023.4 917.0 624.3 647.0
The unallocated amounts on non-current assets relate to deferred tax assets.
5. OPERATING PROFITOperating profit can be analysed as follows:
Year ended 2017
£m
Year ended 2016
£m
Revenue 1,023.4 917.0 Cost of sales (805.2) (716.5)Gross profit 218.2 200.5 Distribution costs (7.6) (5.3)Administrative expenses (146.0) (130.1)Profit on sale of fixed assets 0.2 – Share of joint venture profit 0.7 0.7 Operating profit 65.5 65.8

88 SENIOR PLC ANNUAL REPORT & ACCOUNTS 2017 SENIOR PLC ANNUAL REPORT & ACCOUNTS 2017 89
AD
DIT
ION
AL IN
FOR
MA
TIO
NG
OV
ER
NA
NC
EFIN
AN
CIA
L STA
TE
ME
NT
SS
TR
AT
EG
IC R
EP
OR
T
FINANCIAL STATEMENTS
5. OPERATING PROFIT CONTINUEDOperating profit for the period has been arrived at after charging:
Year ended 2017
£m
Year ended 2016
£m
Net foreign exchange losses 1.8 1.5 Research and development costs 25.6 18.7 Depreciation of property, plant and equipment 38.8 32.5 Amortisation of intangible assets included in administration expenses 19.1 21.5 Cost of inventories recognised as expense 805.2 716.5 Provision for impairment of doubtful receivables 1.3 1.4
Staff costs are disclosed in Note 6.
The majority of research and development costs incurred during the year have been expensed in line with Note 2 Significant Accounting Policies.
The analysis of the Auditor’s remuneration is as follows:
Year ended 2017
£m
Year ended 2016
£m
Fees payable to the Company’s Auditor and their associates for the audit of the Company’s annual accounts 0.2 0.2
Fees payable to the Company’s Auditor and their associates for other services to the Group
– The audit of the Company’s subsidiaries 0.8 0.7
Total audit fees 1.0 0.9
Fees payable to Company’s Auditor and their associates for non-audit services to the Company are not required to be disclosed because the Consolidated Financial Statements are required to disclose such fees on a consolidated basis.
The Group paid £0.04m (2016 – £0.04m) to the Company’s Auditor for audit related services and £nil (2016 – £0.3m) for other taxation advisory services provided to the Group during 2017.
Details of the Company’s policy on the use of auditors for non-audit services, the reasons why the Auditor was used rather than another supplier and how the Auditor’s independence and objectivity were safeguarded were set out in the Audit Committee Report on pages 46 to 50. No services were provided pursuant to contingent fee arrangements.
6. STAFF COSTSThe average monthly number of employees (including Directors) was:
Year ended 2017
Number
Year ended 2016
Number
Production 6,634 6,419 Distribution 69 45 Sales 314 279 Administration 641 654 Total 7,658 7,397
Year ended 2017
£m
Year ended 2016
£m
Their aggregate remuneration comprised:Wages and salaries 255.5 233.2 Social security costs 30.0 27.5 Other pension costs – defined contribution (see Note 35a) 10.3 9.2 Other pension costs/(credits) – defined benefit (see Note 35e) 0.9 (0.1)Share based payments (see Note 34) 2.1 1.1 Aggregate remuneration 298.8 270.9
7. INVESTMENT INCOMEYear ended
2017 £m
Year end 2016
£m
Interest on bank deposits 0.1 0.1 Other interest income 0.1 0.1 Total income 0.2 0.2
8. FINANCE COSTSYear ended
2017 £m
Year end 2016
£m
Interest on bank overdrafts and loans 1.2 1.4 Interest on other loans 8.3 8.8 Interest on finance leases – 0.1 Net finance cost of retirement benefits (Note 35e) 0.2 0.2 Total finance costs 9.7 10.5
9. ADJUSTED OPERATING PROFIT AND ADJUSTED PROFIT BEFORE TAXThe provision of adjusted operating profit and adjusted profit before tax measures, derived in accordance with the table below, have been included to identify the performance of the Group prior to the impact of amortisation of intangible assets from acquisitions and loss on disposal of the BWT Ilkeston facility.
These items have been excluded from the adjusted measures in order to show the underlying current business performance of the Group in a consistent manner. This also reflects how the business is managed on a day-to-day basis.
Notes
Year ended 2017
£m
Year end 2016
£m
Operating profit 65.5 65.8 Amortisation of intangible assets from acquisitions 17.1 19.8 Adjusted operating profit 82.6 85.6Profit before tax 52.2 55.5 Adjustments to profit as above before tax 17.1 19.8 Loss on disposal 31 3.8 – Adjusted profit before tax 73.1 75.3
10. TAXATIONYear ended
2017 £m
Year ended 2016
£m
Current tax:Current year 11.8 10.8 Adjustments in respect of prior periods (5.7) (4.2)
6.1 6.6 Deferred tax (Note 21):Current year (15.5) 3.8 Adjustments in respect of prior periods 1.3 (0.3)
(14.2) 3.5 Total tax (credit)/charge (8.1) 10.1
The Finance (No.2) Act 2015 and Finance Act 2016 provide for reductions in the main rate of Corporation Tax from 20% to 19% for the financial year beginning 1 April 2017 and to 17% for the financial year beginning 1 April 2020. UK deferred tax at the Balance Sheet date has been calculated at enacted tax rates that are expected to apply to the period when assets are realised or liabilities are settled.
UK Corporation Tax is calculated at an effective rate of 19.25% (2016 – 20.00%) of the estimated assessable profit for the year. Included within the total tax charge is £2.0m (2016 – £0.1m) in respect of current year UK Corporation Tax. Taxation for other jurisdictions is calculated at the rates prevailing in the respective jurisdictions.
NOTES TO THE CONSOLIDATED FINANCIAL STATEMENTS CONTINUED

90 SENIOR PLC ANNUAL REPORT & ACCOUNTS 2017 SENIOR PLC ANNUAL REPORT & ACCOUNTS 2017 91
AD
DIT
ION
AL IN
FOR
MA
TIO
NG
OV
ER
NA
NC
EFIN
AN
CIA
L STA
TE
ME
NT
SS
TR
AT
EG
IC R
EP
OR
T
FINANCIAL STATEMENTS
10. TAXATION CONTINUEDThe total tax charge for 2017 includes a one-off net credit arising in the US following the US Tax Cuts and Jobs Act being brought into law on 22 December 2017. The net credit of £16.0m comprises a £16.7m credit and a charge of £0.7m. The £16.7m credit is recognised as a result of certain US net deferred tax liabilities being revalued at the Balance Sheet date to reflect the future tax rate they are likely to be realised at following the reduction of the US Federal corporate income tax rate from 35% to 21%. The net liabilities revalued largely comprise timing differences in respect of goodwill and the tax relief for capital expenditure and as such are considered to be non-cash tax items. The tax charge of £0.7m has been recognised in respect of the one-off Transition Tax on unremitted earnings of foreign subsidiaries of our US Group. The £16.0m net credit has been recognised in full in the Consolidated Income Statement as a current year item.
Prior year adjustments totalling £4.4m arise primarily from adjustments to amounts provided following the filing of tax returns and as a result of the expiration of statutes of limitations and closure of tax authority audits.
The total charge for the year can be reconciled to the profit before tax per the Consolidated Income Statement as follows:
Year ended 2017
£m
Year ended 2017
%
Year ended 2016
£m
Year ended 2016
%
Profit before tax 52.2 55.5Expected tax at the UK standard corporation tax rate 19.25%/20.00% 10.0 11.1Amounts recognised in the period arising from US tax reform (16.0) –Effect of different statutory rates of overseas jurisdictions 3.2 3.3Tax incentives and credits (1.6) (2.1)Non-tax deductible expenses including acquisition costs 1.1 0.8Deferred tax impact of unrecognised timing differences including losses 1.2 2.1Derecognition of tax losses on which a deferred tax asset was previously provided – 1.7Impact of share options 0.5 0.4Effect of difference in treatment of financing activities between jurisdictions (3.5) (5.5)Other permanent differences 1.0 2.6Non-tax deductible goodwill 0.3 – Withholding taxes 0.2 0.3Effect of taxation of associates and joint ventures reported within operating profit (0.1) (0.1)Adjustments in respect of prior periods (4.4) (4.5)Tax (credit)/charge and effective tax rate for the year (8.1) (15.5%) 10.1 18.2%
In addition to the amount charged to the Consolidated Income Statement, the following amounts relating to tax have been recognised directly in other comprehensive income:
Year ended 2017
£m
Year ended 2016
£m
Deferred tax:Items that will not be reclassified subsequently to profit and lossTax on actuarial losses 0.7 0.5 Items that may be reclassified subsequently to profit or lossTax on foreign exchange contracts – cash flow hedges (2.3) 2.1 Total tax (charge)/credit recognised directly in other comprehensive income (1.6) 2.6
Deferred tax (Note 21) (1.6) 2.6
During the year, there were no tax items recognised directly in the Equity reserve (2016 – £nil).
11. DIVIDENDSYear ended
2017 £m
Year ended 2016
£m
Amounts recognised as distributions to equity holders in the period:Final dividend for the year ended 31 December 2016 of 4.62p (2015 – 4.36p) per share 19.4 18.3 Interim dividend for the year ended 31 December 2017 of 2.05p (2016 – 1.95p) per share 8.5 8.1
27.9 26.4 Proposed final dividend for the year ended 31 December 2017 of 4.90p (2016 – 4.62p) per share 20.5 19.4
The proposed final dividend is subject to approval by shareholders at the Annual General Meeting for 2017 on 27 April 2018 and has not been included as a liability in these Financial Statements.
12. EARNINGS PER SHAREThe calculation of the basic and diluted earnings per share is based on the following data:
Number of shares
Year ended 2017
Million
Year ended 2016
Million
Weighted average number of ordinary shares for the purposes of basic earnings per share 418.9 418.8 Effect of dilutive potential ordinary shares:Share options 2.9 0.5 Weighted average number of ordinary shares for the purposes of diluted earnings per share 421.8 419.3
Year ended 2017 Year ended 2016
Earnings and earnings per share NotesEarnings
£mEPS
penceEarnings
£mEPS
pence
Profit for the period 60.3 14.39 45.4 10.84 Adjust:Amortisation of intangible assets from acquisitions net of tax of £4.5m (2016 – £5.0m) 12.6 3.01 14.8 3.53 Loss on disposal net of tax of £0.4m (2016 – £nil) 3.4 0.81 – – Exceptional non-cash tax credit (2016 – £nil) 10 (16.0) (3.82) – – Adjusted earnings after tax 60.3 14.39 60.2 14.37 Earnings per share– basic 14.39p 10.84p– diluted 14.30p 10.83p– adjusted 14.39p 14.37p– adjusted and diluted 14.30p 14.36p
The effect of dilutive shares on the earnings for the purposes of diluted earnings per share is £nil (2016 – £nil).
The denominators used for all basic, diluted and adjusted earnings per share are as detailed in the table above.
The provision of adjusted earnings per share, derived in accordance with the table above, has been included to identify the performance of the Group prior to the impact of amortisation of intangible assets from acquisitions, loss on disposal of the BWT Ilkeston facility and exceptional non-cash tax credit.
These items have been excluded from the adjusted measures in order to show the current business performance of the Group in a consistent manner, reflecting how the business is managed on a day-to-day basis.
13. GOODWILLYear ended
2017 £m
Year ended 2016
£m
CostAt 1 January 378.4 336.3 Exchange differences (18.8) 42.1 Disposal (1.7) – At 31 December 357.9 378.4 Accumulated impairment lossesAt 1 January 59.6 51.8 Exchange differences (4.1) 7.8 At 31 December 55.5 59.6 Carrying amount at 31 December 302.4 318.8
Goodwill is allocated to the group of CGUs (CGU groups) within the two Aerospace sub-divisions (Aerostructures and Fluid Systems) and Flexonics, reflecting the lowest level at which management exercises oversight and monitors the Group’s performance. The table below highlights the carrying amount of goodwill allocated to these CGU groups, all of which are considered significant in comparison with the total carrying amount of goodwill.
NOTES TO THE CONSOLIDATED FINANCIAL STATEMENTS CONTINUED

92 SENIOR PLC ANNUAL REPORT & ACCOUNTS 2017 SENIOR PLC ANNUAL REPORT & ACCOUNTS 2017 93
AD
DIT
ION
AL IN
FOR
MA
TIO
NG
OV
ER
NA
NC
EFIN
AN
CIA
L STA
TE
ME
NT
SS
TR
AT
EG
IC R
EP
OR
T
FINANCIAL STATEMENTS
13. GOODWILL CONTINUEDYear ended
2017 £m
Year ended 2016
£m
Aerostructures 154.6 164.4 Fluid Systems 72.1 75.8 Flexonics 75.7 78.6 Total 302.4 318.8
The Group tests goodwill annually for impairment or more frequently if there are indications that goodwill might be impaired. The 2017 goodwill impairment review was undertaken as at 30 September 2017 to coincide with the board review of the most recent financial strategy. The recoverable amounts are determined from value in use calculations. The key assumptions on which the value in use calculations are based relate to business performance over the next five years, long-term growth rates beyond 2022 and the discount rates applied. The key estimates are the level of revenue and operating margins anticipated and the proportion of operating profit converted into cash flow in each year. The forecast compound annual growth rate in revenue to 2022 are in the range from 5% to 8%.
Forecasts used in the cash flow are based on the most recent financial strategy, as approved by management for the next three years to 2020 and supplemented by forecasts of performance for a further two years. These estimates up to 2022, where appropriate, take account of the current economic environment as set out in the Strategic Report on page 1 to 35.
Cash flows after 2022 have been extrapolated based on estimated long-term growth rates into perpetuity, which has been determined by the lower of the long-term market growth rates and the historical forecast compound annual growth in revenue to 2022. For Aerostructures and Fluid Systems, the long-term market growth rates are 3.1% per annum, which do not exceed the long-term average growth rate forecasts for the aerospace market as included in market outlooks from Boeing, Airbus and Bombardier. For Flexonics, the long-term market growth rates are 1.7% per annum, which are based on world long-term forecast GDP growth for advanced economies.
The pre-tax discount rates applied to discount the pre-tax cash flows for Aerostructures, Fluid Systems and Flexonics are 10.4%, 9.8% and 11.5% respectively (2016 – 10.3%, 10.3% and 11.1%; these discount rates include CGU group specific risk adjustments) which are the measurements used by management in assessing investment appraisals specific to each CGU group.
Sensitivities have also been considered for each CGU group in relation to the value in use calculations: the long-term growth rate assumption was reduced to 1 percentage point and the discount rate was increased by a 1 percentage point. This did not result in the carrying amount of the CGU groups exceeding their recoverable amount.
14. OTHER INTANGIBLE ASSETS
Intangible
assets from
acquisitionsYear ended
2017 £m
Computer software
and othersYear ended
2017 £m
Total Year ended
2017 £m
Intangible
assets from
acquisitionsYear ended
2016 £m
Computer software
and othersYear ended
2016 £m
Total Year ended
2016 £m
CostAt 1 January 136.1 17.3 153.4 122.1 13.4 135.5 Additions – 2.5 2.5 – 2.1 2.1 Disposals – (0.2) (0.2) – (0.2) (0.2)Disposed on disposal of subsidiaries – – – – (0.6) (0.6)Exchange differences (5.8) (0.3) (6.1) 14.0 2.6 16.6 At 31 December 130.3 19.3 149.6 136.1 17.3 153.4 AmortisationAt 1 January 81.4 11.5 92.9 54.2 9.2 63.4 Charge for the year 17.1 2.0 19.1 19.8 1.7 21.5 Disposals – (0.2) (0.2) – (0.2) (0.2)Disposed on disposal of subsidiaries – – – – (0.6) (0.6)Exchange differences (3.8) – (3.8) 7.4 1.4 8.8 At 31 December 94.7 13.3 108.0 81.4 11.5 92.9 Carrying amount at 31 December 35.6 6.0 41.6 54.7 5.8 60.5
As at 31 December 2017, the carrying amount of intangible assets from acquisitions consists of £19.5m for customer relationships (2016 – £31.3m), £11.4m for customer contracts (2016 – £16.5m) and £4.7m for trade names (2016 – £6.9m).
15. INVESTMENT IN JOINT VENTUREThe Group has a 49% interest in Senior Flexonics Technologies (Wuhan) Limited, a jointly controlled entity incorporated in China, which was set up in 2012. Senior Flexonics Technologies (Wuhan) Limited is a precision manufacturer of automotive components.
The results of the joint venture are accounted for using equity accounting.
The Group’s investment of £2.4m represents the Group’s share of the joint venture’s net assets as at 31 December 2017.
The following amounts represent the aggregate amounts relating to the revenue and expenses and assets and liabilities of Senior Flexonics Technologies (Wuhan) Limited for the years ended 31 December 2017 and December 2016.
2017 £m
2016 £m
Revenue 10.9 7.8 Expenses (9.5) (6.5)Profit 1.4 1.3
Total assets 9.4 7.4 Total liabilities (4.4) (4.0)Net assets 5.0 3.4
Group’s share of profit 0.7 0.7 Group’s share of net assets 2.4 1.7
At the year end the Group had provided loans of £0.5m (2016 – £0.9m) to the joint venture, £0.2m (2016 – £nil) is reported as a current asset and £0.3m (2016 – £0.9m) as a non-current asset.
During the year, £0.3m of the loans were repaid (2016 – £0.5m repaid), with £0.1m of foreign exchange losses.
16. PROPERTY, PLANT AND EQUIPMENT
Freehold land and
buildingsYear ended
2017 £m
Leasehold buildings
Year ended 2017
£m
Plant
and equipmentYear ended
2017 £m
Total Year ended
2017 £m
Freehold land and buildings
Year ended 2016
£m
Leasehold
buildingsYear ended
2016 £m
Plant
and equipmentYear ended
2016 £m
Total Year ended
2016 £m
Cost or valuationAt 1 January 96.9 4.3 453.3 554.5 87.6 3.6 356.4 447.6 Additions 4.3 0.1 47.9 52.3 2.9 0.2 47.6 50.7 Exchange differences (3.6) (0.3) (20.1) (24.0) 15.2 0.5 63.0 78.7 Disposals (1.9) (0.1) (12.1) (14.1) – – (13.7) (13.7)Reclassified as held for sale – – – – (8.8) – – (8.8)At 31 December 95.7 4.0 469.0 568.7 96.9 4.3 453.3 554.5 Accumulated depreciation and impairmentAt 1 January 24.7 2.7 272.9 300.3 22.4 2.0 216.6 241.0 Charge for the year 1.8 0.3 36.7 38.8 2.4 0.3 29.8 32.5 Exchange differences (0.7) (0.2) (13.8) (14.7) 4.5 0.4 39.4 44.3 Eliminated on disposals (0.8) (0.1) (10.9) (11.8) – – (12.9) (12.9)On assets reclassified as held for sale – – – – (4.6) – – (4.6)At 31 December 25.0 2.7 284.9 312.6 24.7 2.7 272.9 300.3 Carrying amount at 31 December 70.7 1.3 184.1 256.1 72.2 1.6 180.4 254.2
The carrying amount of the Group’s land and buildings and plant and equipment includes an amount of £1.6m (2016 – £1.4m) in respect of assets held under finance leases.
At 31 December 2017, the Group had entered into contractual commitments for the acquisition of property, plant and equipment amounting to £6.9m (2016 – £4.9m).
17. INVENTORIESYear ended
2017 £m
Year ended 2016
£m
Raw materials 48.7 46.3 Work-in-progress 72.7 76.7 Finished goods 33.1 31.4 Total 154.5 154.4
Inventory write-downs recognised as an expense in 2017 were £2.9m (2016 – £1.4m).
NOTES TO THE CONSOLIDATED FINANCIAL STATEMENTS CONTINUED

94 SENIOR PLC ANNUAL REPORT & ACCOUNTS 2017 SENIOR PLC ANNUAL REPORT & ACCOUNTS 2017 95
AD
DIT
ION
AL IN
FOR
MA
TIO
NG
OV
ER
NA
NC
EFIN
AN
CIA
L STA
TE
ME
NT
SS
TR
AT
EG
IC R
EP
OR
T
FINANCIAL STATEMENTS
18. TRADE AND OTHER RECEIVABLESTrade and other receivables at 31 December comprise the following:
Year ended 2017
£m
Year ended 2016
£m
Non-current assetsOther receivables 0.5 0.3
0.5 0.3
Current assetsTrade receivables 137.8 133.5 Value added tax 3.1 2.1 Foreign exchange contracts 3.7 1.5 Prepayments 8.1 12.3 Other receivables 1.6 3.1
154.3 152.5 Total trade and other receivables 154.8 152.8
Credit riskThe Group’s principal financial assets are bank balances and cash and trade receivables. The credit risk on liquid funds and derivative financial instruments is limited because the counterparties are banks with high credit ratings assigned by international credit rating agencies.
The Group’s credit risk is primarily attributable to its trade receivables. The amounts presented in the Balance Sheet are net of allowances for doubtful receivables. There are no other credit or impairment losses for other classes of financial assets.
Further disclosures on credit risk are included in Note 20.
The average credit period taken on sales of goods is 55 days (2016 – 54 days). An allowance has been made for estimated irrecoverable amounts from the sale of goods of £2.0m (2016 – £2.2m). In determining the recoverability of trade receivables, the Group considers any change in the credit quality of the trade receivable from the date credit was initially granted up to the reporting date. Of the trade receivables balance at the end of the year, £19.6m (2016 – £20.6m) is due from the Group’s largest customer and £3.8m (2016 – £4.9m) is due from the Group’s second largest customer. The Group has no other significant concentration of credit risk, with exposure spread over a large number of counterparties and customers. Accordingly, the Directors believe that there is no further credit provision risk in excess of the allowance for doubtful receivables.
Year ended 2017
£m
Year ended 2016
£m
Movements in allowance for doubtful receivables:At 1 January 2.2 1.4 Provision for impairment 1.3 1.4 Amounts written off as uncollectible (1.4) (0.4)Amounts recovered (0.2) (0.2)Exchange differences 0.1 – At 31 December 2.0 2.2
Ageing analysis of past due but not impaired trade receivables:Up to 30 days past due 13.9 13.8 31 to 60 days past due 2.6 3.1 61 to 90 days past due 1.1 1.4 91 to 180 days past due 1.4 1.0 Total past due but not impaired 19.0 19.3 Not past due 118.8 114.2 Total current trade receivables 137.8 133.5
There are no items past due in any other class of financial assets except for trade receivables.
The Directors consider that the carrying amount of trade and other receivables approximates their fair value. The maximum exposure to credit risk at the reporting date is the fair value of each class of receivable above. The Group does not hold any collateral as security.
19. BANK OVERDRAFTS AND LOANSYear ended
2017 £m
Year ended 2016
£m
Bank overdrafts 2.9 0.7 Bank loans 8.1 48.6 Other loans 156.2 165.3
167.2 214.6
The borrowings are repayable as follows:On demand or within one year 60.5 44.9 In the second year 8.7 79.1 In the third to fifth years inclusive 29.0 26.1 After five years 69.0 64.5
167.2 214.6 Less: amount due for settlement within 12 months(shown under current liabilities) (60.5) (44.9)Amount due for settlement after 12 months 106.7 169.7
Analysis of borrowings by currency31 December 2017
Total £m
Pound Sterling
£mEuros
£m
US Dollars
£mOthers
£m
Bank overdrafts 2.9 4.8 (0.7) (2.1) 0.9 Bank loans 8.1 4.4 – 3.7 – Other loans 156.2 – 26.8 129.4 –
167.2 9.2 26.1 131.0 0.9
31 December 2016
Total £m
Pound Sterling
£mEuros
£m
US Dollars
£mOthers
£m
Bank overdrafts 0.7 – – – 0.7 Bank loans 48.6 30.0 – 18.6 – Other loans 165.3 – – 165.3 –
214.6 30.0 – 183.9 0.7
The weighted average interest rates paid were as follows:
Year ended 2017
%
Year ended 2016
%
Bank loans and overdrafts 1.62 1.25 Other loans 4.78 5.47
Bank overdrafts include credit balances (Euros and US Dollars) that have a legally enforceable right of offset with debit balances.
Bank loans and overdrafts of £11.0m (2016 – £49.3m) are arranged at floating rates, thus exposing the Group to cash flow interest rate risk. Other borrowings are mainly arranged at fixed interest rates and expose the Group to fair value interest rate risk. No interest rate swaps were taken out in 2016 or 2017.
The Directors estimate the fair value of the Group’s borrowings to be as follows:
Year ended 2017
£m
Year ended 2016
£m
Bank loans and overdrafts 11.0 49.3 Other loans 159.1 172.9
170.1 222.2
The fair value of Other loans has been determined by applying a make-whole calculation using the prevailing treasury bill yields plus the applicable credit spread for the Group (level 2 of the fair value hierarchy as defined in Note 20).
NOTES TO THE CONSOLIDATED FINANCIAL STATEMENTS CONTINUED
96 SENIOR PLC ANNUAL REPORT & ACCOUNTS 2017 SENIOR PLC ANNUAL REPORT & ACCOUNTS 2017 97
AD
DIT
ION
AL IN
FOR
MA
TIO
NG
OV
ER
NA
NC
EFIN
AN
CIA
L STA
TE
ME
NT
SS
TR
AT
EG
IC R
EP
OR
T
FINANCIAL STATEMENTS
19. BANK OVERDRAFTS AND LOANS CONTINUEDThe other principal features of the Group’s borrowings are as follows:
Bank overdrafts are repayable on demand. The effective interest rates on bank overdrafts are determined based on appropriate LIBOR rates plus applicable margin.
The Group’s main loans are unsecured guaranteed loan notes in the US private placement market, revolving credit facilities and term loans.
a) Loan notes of $95m, 2017 (£70.4m) (2016 – £76.6m) were taken out in October 2008. Notes of $75m carry interest at the rate of 6.84% and are due for repayment in October 2018. Notes of $20m carry interest at the rate of 6.94% and are due for repayment in October 2020.
b) Loan notes of $30m, (2016 – £24.2m) were taken out in January 2007 and were repaid in January 2017. The loan notes carried interest at the rate of 5.85% per annum. These loan notes were replaced by new €28m (2017 – £24.8m) loan notes maturing on 1 February 2027, carrying interest at the rate of 1.51% per annum.
c) Loan notes of $20m, 2017 £14.8m (2016 – £16.1m) were taken out in October 2015 and are due for repayment in October 2022. The loan notes carry interest at the rate of 3.42% per annum.
d) Loan notes of $60m, 2017 £44.3m (2016 – £48.4m) were taken out in October 2015 and are due for repayment in October 2025. The loan notes carry interest at the rate of 3.75% per annum.
Transaction costs of £0.2m, directly attributable to the Euro notes (£0.1m) and the US Dollar notes (£0.1m), have been deducted from their carrying value.
A new facility of £27.0m was entered into in December 2017. The loan notes have been drawn down in January 2018, carry interest at a rate of 2.35% and are due for repayment in January 2025.
The Group also has three revolving credit facilities.
A committed £60m five-year syndicated multi-currency facility was entered into in November 2014, and amended and extended in October 2016 for five years. There were no amounts drawn under this facility at either 31 December 2017 or 31 December 2016.
A committed $50m single bank (£37.0m) loans and letter of credit facility was amended in May 2017 and matures in June 2019. There were $5.0m (£3.7m) loans drawn under the facility on 31 December 2017 and $23.1m (£18.6m) loans drawn on 31 December 2016 and there were letters of outstanding credit of $2.6m (£1.9m) (2016 – £3.2m).
A committed £20m two-year syndicated sterling facility was entered into in March 2015. This facility was amended and extended in October 2016 and matures in March 2019. As at 31 December 2017, £5.0m (2016 – £10m) was drawn under this facility.
Transaction costs of £0.6m, directly attributable to the £60m revolving credit facility, have been deducted from its carrying value.
The Group also had two term loans which were taken out in March 2015, a £20m one-year term loan and a £5m one-year term loan. The £20m loan was extended in March 2016 for a further year and repaid in March 2017 and the £5m loan was repaid in March 2016.
As at 31 December 2017, the Group had available £133.4m (2016 – £88.5m) of undrawn committed borrowing facilities in respect of which all conditions precedent had been met.
20. FINANCIAL INSTRUMENTSCapital risk managementThe Group manages its capital structure to safeguard its ability to continue as a going concern whilst maximising the return to stakeholders through the optimisation of the balance between debt and equity. In considering the appropriate level of net debt, the Group pays close attention to its level as compared to the cash generation potential of the Group, measured by adjusted profit before interest, tax, depreciation and amortisation (“EBITDA”). The Group also monitors capital on the basis of a gearing ratio. This ratio is calculated as net debt divided by total capital. Net debt is calculated as the total of bank and other loans and obligations under finance leases, less cash and cash equivalents (see Note 32). Total capital is the equity shown in the Consolidated Balance Sheet.
All of the Group’s external borrowing facilities have a requirement for the ratio of net debt to EBITDA to be less than 3.0x. Internally the Group aims for this ratio to be between 0.5x and 1.5x. At 31 December 2017, net debt was 1.3x the Group’s level of EBITDA (31 December 2016 – 1.7x). In addition, all borrowing facilities contain the requirement for EBITDA interest cover (the number of times net interest is covered by the Group’s EBITDA) to be in excess of 3.5x. At 31 December 2017 EBITDA was 13.3x the level of net interest (31 December 2016 – 11.8x). Therefore, the Group currently has considerable funding headroom.
The Group’s strategy in respect of gearing is to target a long-term gearing ratio within the range of 30% to 60%. The gearing ratio for the Group at the end of 2017 was 29% (2016 – 40%).
Financial risk managementThe Group’s activities expose it to a variety of financial risks including foreign exchange risk, interest rate risk, credit risk and liquidity risk. The Group’s overall treasury risk management programme focuses on the unpredictability of financial markets, and seeks to minimise potential adverse effects on the Group’s financial performance.
The Group uses derivative financial instruments to hedge certain risk exposures. The use of financial derivatives is governed by the Group’s policies approved by the Board, which provide written principles on foreign exchange risk, interest rate risk, credit risk, the use of financial derivatives and non-derivative financial instruments, and the investment of excess liquidity. Compliance with policies and exposures limits is reviewed by the Group’s Treasury Committee on a regular basis. The Group does not enter into or trade financial instruments including derivative financial instruments for speculative purposes.
Foreign exchange risk managementThe Group enters into forward foreign exchange contracts to hedge the exchange risk arising on the operations’ trading activities in foreign currencies. Where commented on below, the sensitivity analysis of the Group’s exposure to foreign currency risk at the reporting date has been determined based on the change taking place at the beginning of the financial year and left unchanged throughout the reporting period, with all other variables held constant (such as interest rates). The sensitivity assumptions are based on analysis reviewed by the Group’s Treasury Committee.
Translation riskThe Group derived 84% of its revenue from businesses outside the United Kingdom, with 59% relating to operations in North America. Fluctuations in the value of the US Dollar and other currencies in relation to Pound Sterling have had, and may continue to have, a significant impact on the results of the Group’s operations when reported in Pound Sterling. The Group decided not to hedge this translation risk. In addition, the majority of assets are denominated in foreign currency, particularly in US Dollars. In order to provide a hedge against volatility in the value of these assets compared to the Group’s earnings, and hence provide a natural hedge against the Group’s principal lending covenant (the ratio of net debt to EBITDA), the Group aims to borrow in foreign currencies in similar proportions to its generation of foreign currency EBITDA, where practical and economic. A 10% appreciation (or depreciation) of all other currencies against the Pound Sterling would have increased (or decreased) 2017 Group operating profit by £8.4m (£5.3m of which would have been due to the US Dollar movement) and would have increased (or decreased) equity by £38.8m (£22.2m of which would have been due to the US Dollar movement).
Transaction riskThe Group has a number of transaction-related foreign currency exposures, particularly between the US Dollar and the Pound Sterling, Thai Baht and Malaysian Ringgit. The Group seeks to hedge transaction-related exposures mainly on a rolling 15 to 18-month forward basis, but in some cases for periods of up to 60 months and applies hedge accounting where the forwards can be designated in a qualifying cash flow hedge relationship. Based on the net of the annual sales and purchase-related exposures, all transaction-related foreign currency exposures to Group profit after hedging in existence at 31 December 2017 are immaterial. The impact on equity is determined by the unrecognised portion of open forward contracts at the year-end. A 10% appreciation (or depreciation) of the US Dollar against the Pound Sterling, Thai Baht and the Malaysian Ringgit would have decreased (or increased) equity by £7.0m, £3.1m and £1.0m, respectively.
Interest rate risk managementThe Group has a policy of maintaining approximately 60% of its borrowing costs at fixed interest rates. The Group generally borrows long-term in fixed rates but at times may borrow at floating rates and swap into fixed depending on credit market conditions. Occasionally a portion of fixed debt interest is swapped into floating rates. The combination of maintaining an acceptable balance of fixed and floating rate debt, and the Group’s policy of borrowing in foreign currency in proportion to its generation of foreign currency earnings, provides an effective hedge against the impact of interest rate and foreign currency volatility on total interest costs. As at year end 2017, the percentage of debt at fixed interest was 92% (2016 – 77%).
NOTES TO THE CONSOLIDATED FINANCIAL STATEMENTS CONTINUED

98 SENIOR PLC ANNUAL REPORT & ACCOUNTS 2017 SENIOR PLC ANNUAL REPORT & ACCOUNTS 2017 99
AD
DIT
ION
AL IN
FOR
MA
TIO
NG
OV
ER
NA
NC
EFIN
AN
CIA
L STA
TE
ME
NT
SS
TR
AT
EG
IC R
EP
OR
T
FINANCIAL STATEMENTS
NOTES TO THE CONSOLIDATED FINANCIAL STATEMENTS CONTINUED
20. FINANCIAL INSTRUMENTS CONTINUEDThe following sensitivity analysis of the Group’s exposure to interest rate risk in 2017 has been retrospectively determined based on the exposure to applicable interest rates on financial assets and liabilities held throughout the financial year, with all other variables held constant (such as foreign exchange rates). The sensitivity assumptions are based on analysis reviewed by the Group’s Treasury Committee. If variable interest rates had been 0.5% lower (or higher), the Group’s profit before tax would have increased (or decreased) by £0.2m. Any fixed interest debt is held to maturity and not fair value adjusted through the Income Statement. An increase (or decrease) of 0.5% in the market interest rate for the fixed rate debt held up to maturity would have decreased (or increased) the fair value of the Group’s borrowings by £3.3m. The Group’s sensitivity to interest rates has remained broadly consistent with prior period due to the high proportion of fixed debt.
Credit risk managementThe Group’s credit risk is primarily attributable to its trade receivables. The credit quality of customers is assessed taking into account their financial position, past experience and other factors. Further details on determining the recoverability of trade receivables is provided in Note 18. The Group is guarantor under the lease of one building in the UK, which arose on the disposal of a former Group-owned subsidiary in 2001.
Credit risk on liquid funds and derivative financial instruments is limited because the counterparties are financial institutions with high credit ratings assigned by international credit rating agencies. The carrying amount of financial assets recorded in the Financial Statements, which is net of impairment losses, represents the Group’s maximum exposure to credit risk. The Group derecognises trade receivables through non-recourse factoring arrangements, which were £23.1m at 31 December 2017 (31 December 2016 – £17.8m).
Liquidity risk managementLiquidity risk reflects the risk that the Group will have insufficient resources to meet its financial liabilities as they fall due. The Group manages liquidity risk by maintaining adequate reserves, banking facilities and revolving credit facilities, by continuously monitoring forecast and actual cash flows and matching the maturity profiles of financial assets and liabilities. Cash flow forecasts are produced monthly, together with appropriate capacity planning and scenario analysis, to ensure that bank covenant and liquidity targets will be met. The Directors also regularly assess the balance of capital and debt funding of the Group, as part of a process to satisfy the Group’s long-term strategic funding requirements.
As noted in the Financial Review on pages 20 to 22, the Group is currently in a well-funded position, with significant headroom under its committed borrowing facilities. It is considered unlikely that the Group will face any significant funding issues in the foreseeable future.
Categories of financial instruments
Year ended 2017
£m
Year ended 2016
£m
Carrying value of financial assets:Cash and cash equivalents 12.6 17.5 Trade receivables 137.8 133.5 Other receivables 2.1 3.4 Financial assets at amortised cost 152.5 154.4 Foreign exchange contracts – cash flow hedges 3.7 1.5 Total financial assets 156.2 155.9
Carrying value of financial liabilities:Bank overdrafts and loans 167.2 214.6 Obligations under finance leases 0.5 1.0 Trade payables 101.9 87.2 Other payables 56.6 54.1 Financial liabilities at amortised cost 326.2 356.9 Foreign exchange contracts – cash flow hedges 4.9 15.6 Foreign exchange contracts – held for trading 0.2 0.2 Total financial liabilities 331.3 372.7
Undiscounted contractual maturity of financial liabilities at amortised cost:Amounts payable:On demand or within one year 226.5 195.6 In the second to fifth years inclusive 50.1 122.9 After five years 75.9 72.3
352.5 390.8 Less: future finance charges (26.3) (33.9)Financial liabilities at amortised cost 326.2 356.9
The carrying amount is a reasonable approximation of fair value for the financial assets and liabilities noted above except for bank overdrafts and loans, disclosure of which are included within Note 19.
An ageing analysis of trade receivables is disclosed within Note 18.
20. FINANCIAL INSTRUMENTS CONTINUEDForward foreign exchange contractsThe Group enters into forward foreign exchange contracts to hedge the exchange risk arising on the operation’s trading activities in foreign currencies. At the Balance Sheet date, total notional amounts and fair values of outstanding forward foreign exchange contracts that the Group have committed are given below:
Year ended 2017
£m
Year ended 2016
£m
Notional amounts:Foreign exchange contracts – cash flow hedges 154.8 187.9 Foreign exchange contracts – held for trading 22.2 23.8 Total 177.0 211.7
Less: amounts maturing within 12 months (76.4) (85.7)Amounts maturing after 12 months 100.6 126.0
Contractual maturity:Cash flow hedges balances due within one year:Outflow 92.4 81.5 Inflow (93.4) (77.0)
Cash flow hedges balances due between one and two years:Outflow 23.3 28.4 Inflow (21.9) (25.2)
Cash flow hedges balances due between two and five years:Outflow 42.0 59.3 Inflow (39.5) (50.4)
Held for trading balances due within one year:Outflow 22.2 23.9 Inflow (22.2) (23.8)
Fair values:Foreign exchange contracts – cash flow hedges (1.2) (14.1)Foreign exchange contracts – held for trading (0.2) (0.2)Total liability (1.4) (14.3)
These fair values are based on market values of equivalent instruments at the Balance Sheet date, comprising £3.7m (2016 – £1.5m) assets included in trade and other receivables and £5.1m (2016 – £15.8m) included in trade and other payables. The fair value of currency derivatives that are designated and effective as cash flow hedges amounting to £1.3m loss (2016 – £12.9m loss) has been deferred in equity.

100 SENIOR PLC ANNUAL REPORT & ACCOUNTS 2017 SENIOR PLC ANNUAL REPORT & ACCOUNTS 2017 101
AD
DIT
ION
AL IN
FOR
MA
TIO
NG
OV
ER
NA
NC
EFIN
AN
CIA
L STA
TE
ME
NT
SS
TR
AT
EG
IC R
EP
OR
T
FINANCIAL STATEMENTS
NOTES TO THE CONSOLIDATED FINANCIAL STATEMENTS CONTINUED
20. FINANCIAL INSTRUMENTS CONTINUEDFair valuesThe following table presents an analysis of financial instruments that are measured subsequent to initial recognition at fair value, grouped into Levels 1–3 based on the degree to which the fair value is observable:
Level 1 those fair values derived from quoted prices (unadjusted) in active markets for identical assets or liabilities;
Level 2 those fair values derived from inputs other than quoted prices included within Level 1 that are observable for the asset or liability, either directly (i.e. as prices) or indirectly (i.e. derived from prices); and
Level 3 those fair values derived from valuation techniques that include inputs for the asset or liability that are not based on observable market data (unobservable inputs).
There has not been any transfer of assets or liabilities between levels. There are no non-recurring fair value measurements. Level 2 fair values are derived from future cash flows, of open forward contracts at 31 December, translated by the difference between contractual rates and observable forward exchange rates.
31 December 2017Level 1
£mLevel 2
£mLevel 3
£mTotal
£m
AssetsForeign exchange contracts – cash flow hedges – 3.7 – 3.7 Total assets – 3.7 – 3.7
LiabilitiesForeign exchange contracts – cash flow hedges – 4.9 – 4.9 Foreign exchange contracts – held for trading – 0.2 – 0.2 Total liabilities – 5.1 – 5.1
31 December 2016Level 1
£mLevel 2
£mLevel 3
£mTotal
£m
AssetsForeign exchange contracts – cash flow hedges – 1.5 – 1.5 Total assets – 1.5 – 1.5
LiabilitiesForeign exchange contracts – cash flow hedges – 15.6 – 15.6 Foreign exchange contracts – held for trading – 0.2 – 0.2 Total liabilities – 15.8 – 15.8
An amount of £1.4m gain (2016 – £0.7m loss) has been transferred to the Consolidated Income Statement, and is included within operating profit. There was no ineffectiveness to be recorded from foreign exchange cash flow hedges. A loss of £0.2m (2016 – £nil) has been recognised in the Consolidated Income Statement in respect of foreign exchange contracts held for trading.
The hedged forecast transactions denominated in foreign currency are expected to occur at various dates during the next 60 months. Amounts deferred in equity are recognised in the Income Statement in the same period in which the hedged items affect profit or loss, which is generally within 12 months from the Balance Sheet date.
21. TAX BALANCE SHEETCurrent taxThe current tax receivable of £1.0m (2016 – £0.7m) includes excess tax paid to tax authorities that is expected to be recovered within 12 months by way of offset against future tax liabilities or refund as well as research and development tax credits receivable.
The majority of the Group’s taxable profits arise in countries, including the US, where the estimated tax liabilities are paid in on-account instalments during the year to which they relate and are largely paid at the Balance Sheet date. The current tax liability of £21.2m (2016 – £21.5m) represents £3.6m (2016 – £1.8m) tax due on profits of the current and prior years as well as £17.6m (2016 – £19.7m) provisions for tax uncertainties that represent amounts expected to be paid but by their nature, there is uncertainty over timing and eventual settlement. The provision for tax uncertainties has decreased during the year due to the effects of exchange translation and the release of provisions following tax authority audits.
The Group recognises provisions in respect of tax for items which are considered to have a range of possible tax outcomes. These uncertainties exist due to a number of factors including differing interpretations of local tax laws and the determination of appropriate arm’s length pricing in accordance with OECD transfer pricing principles on internal transactions and financing arrangements. In calculating the carrying amount of provisions, management estimates the tax which could become payable as a result of differing interpretations and decisions by tax authorities in respect of transactions and events whose treatment for tax purposes is uncertain and establish provisions based on an assessment of the expected outcome.
Deferred tax liabilities and assetsThe following are the major deferred tax liabilities and (assets) recognised by the Group and movements thereon during the current and prior reporting period:
Accelerated tax
depreciation £m
Unrealised FX
gains £m
Goodwill and intangible
amortisation £m
Retirement benefits
£m
Other temporary
differences £m
Tax losses
£mTotal
£m
At 1 January 2016 21.0 0.6 38.5 (4.0) (12.4) (3.5) 40.2 (Credit)/charge to income statement (1.2) (0.5) (0.6) 1.4 0.9 3.5 3.5 (Credit) to other comprehensive income – (2.1) – (0.5) – – (2.6)Exchange differences 4.2 0.2 6.0 (0.7) (2.2) – 7.5 At 1 January 2017 24.0 (1.8) 43.9 (3.8) (13.7) – 48.6 (Credit)/charge to income statement (6.1) (0.1) (13.3) 3.9 4.2 (2.8) (14.2)Charge/(credit) to other comprehensive income – 2.3 – (0.7) – – 1.6 Exchange differences (3.6) – (2.4) 0.1 2.4 0.2 (3.3)As at 31 December 2017 14.3 0.4 28.2 (0.5) (7.1) (2.6) 32.7
Other temporary differences include balances arising from temporary differences in relation to provisions, accruals, deferred compensation and share-based payments.
Certain deferred tax assets and liabilities have been offset. The following is the analysis of the deferred tax balances (after offset) for financial reporting purposes:
Year ended 2017
Year ended 2016
Deferred tax liabilities 34.3 55.2 Deferred tax assets (1.6) (6.6)
32.7 48.6
At the Balance Sheet date, the Group has unused tax losses of £33.5m (2016 – £26.7m) available for offset against future profits and a deferred tax asset has been recognised in respect of £6.5m (2016 – £nil) of such losses arising in the year. Due to the unpredictability of future taxable profit streams, tax losses of £27.8m (2016 – £26.7m) have not been recognised. Included in unrecognised tax losses are losses of £4.3m (2016 – £3.1m) that will expire over a period of one to nine years. Other losses may be carried forward indefinitely.
At the Balance Sheet date a deferred tax liability of £0.1m (2016 – £0.3m) has been recognised in respect of the aggregate amount of temporary differences associated with undistributed earnings of subsidiaries expected to reverse in the forseeable future. No temporary difference has been recognised in respect of £34.4m (2016 – £24.4m) of undistributed earnings, which may be subject to a withholding tax, as the Group is in a position to control the timing of the reversal of the temporary differences and it is not probable that such differences will reverse in the foreseeable future.
In addition, at the Balance Sheet date the Group has deductible temporary differences, in respect of share-based payments of £nil (2016 – £0.1m) for which no deferred tax asset has been recognised. Deferred tax assets have not been recognised in respect of these differences due to the unpredictability of future profit streams in the entities concerned.
At the Balance Sheet date, the Group had £5.0m (2016 – £5.0m) of surplus Advanced Corporation Tax (‘ACT’), previously written off, for which no deferred tax asset has been recognised as it is unlikely to be recovered in the foreseeable future due to the UK earnings profile. The Group also has £16.6m (2016 – £16.1m) of unused capital losses, as reduced by gains rolled over, available for offset against future capital gains for which no deferred tax asset has been recognised as no such capital gains are anticipated to arise in the foreseeable future.
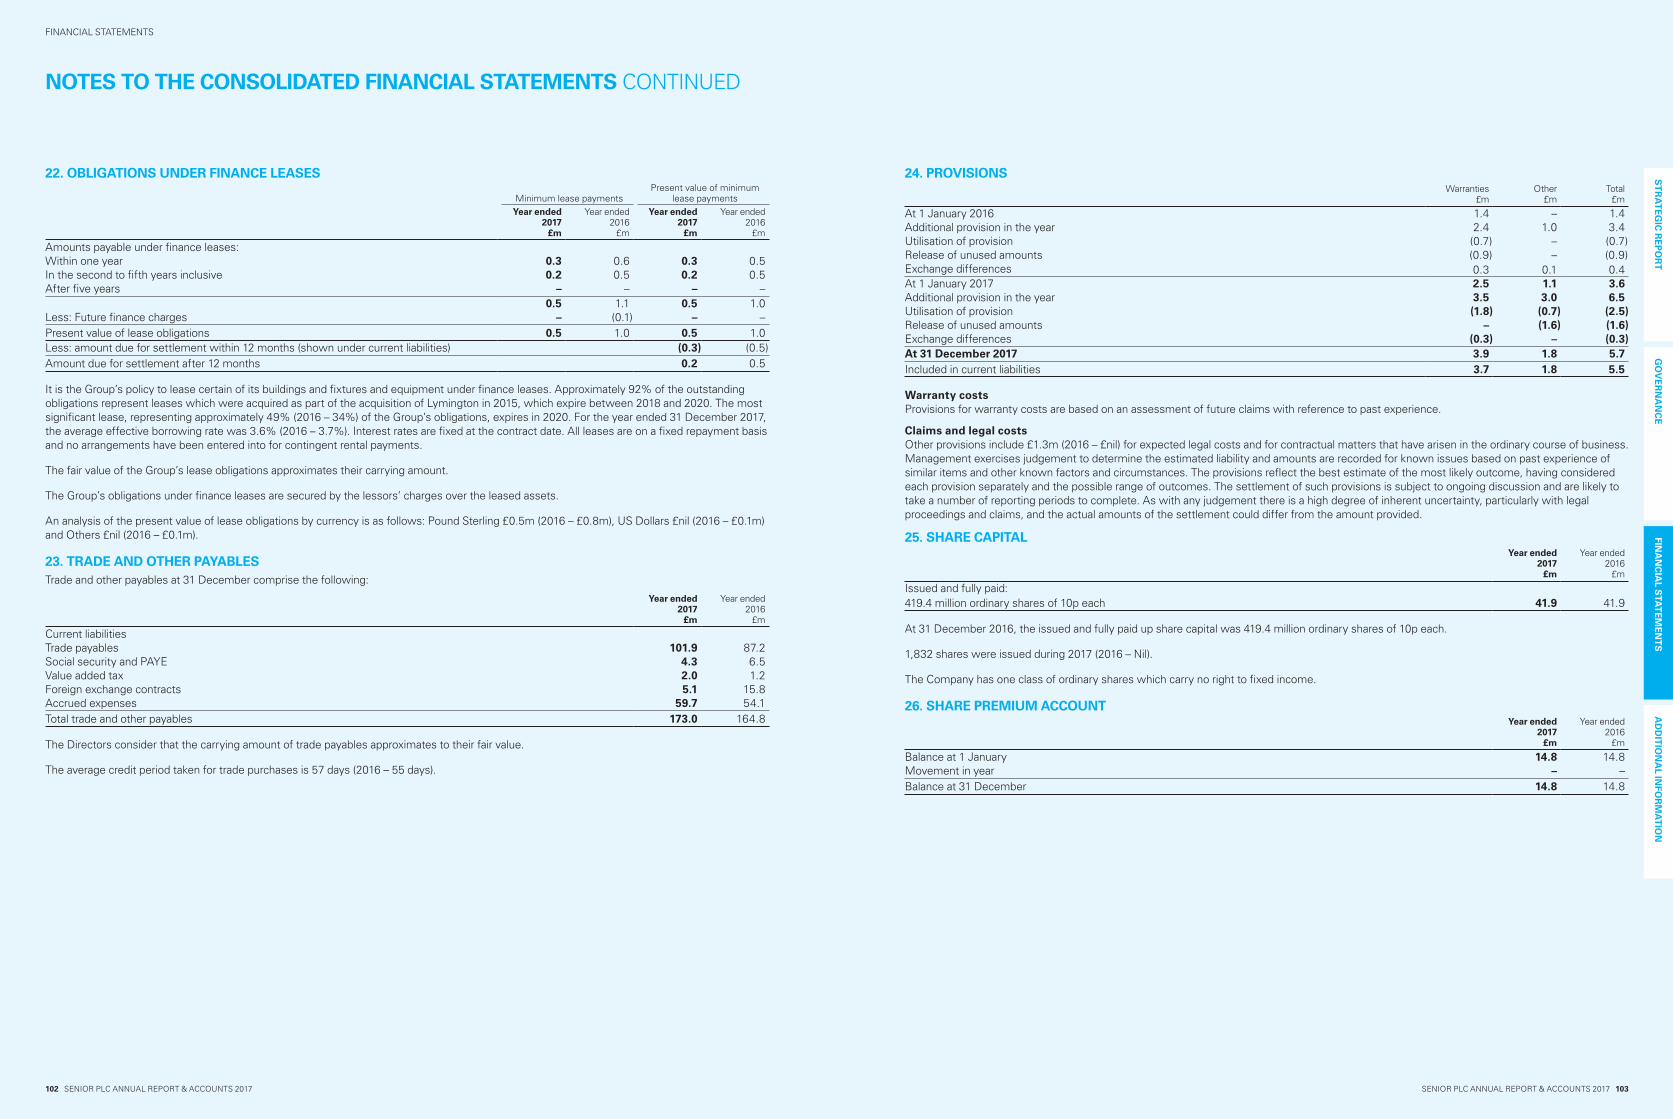
102 SENIOR PLC ANNUAL REPORT & ACCOUNTS 2017 SENIOR PLC ANNUAL REPORT & ACCOUNTS 2017 103
AD
DIT
ION
AL IN
FOR
MA
TIO
NG
OV
ER
NA
NC
EFIN
AN
CIA
L STA
TE
ME
NT
SS
TR
AT
EG
IC R
EP
OR
T
FINANCIAL STATEMENTS
NOTES TO THE CONSOLIDATED FINANCIAL STATEMENTS CONTINUED
22. OBLIGATIONS UNDER FINANCE LEASES
Minimum lease paymentsPresent value of minimum
lease paymentsYear ended
2017 £m
Year ended 2016
£m
Year ended 2017
£m
Year ended 2016
£m
Amounts payable under finance leases:Within one year 0.3 0.6 0.3 0.5 In the second to fifth years inclusive 0.2 0.5 0.2 0.5 After five years – – – –
0.5 1.1 0.5 1.0 Less: Future finance charges – (0.1) – – Present value of lease obligations 0.5 1.0 0.5 1.0 Less: amount due for settlement within 12 months (shown under current liabilities) (0.3) (0.5)Amount due for settlement after 12 months 0.2 0.5
It is the Group’s policy to lease certain of its buildings and fixtures and equipment under finance leases. Approximately 92% of the outstanding obligations represent leases which were acquired as part of the acquisition of Lymington in 2015, which expire between 2018 and 2020. The most significant lease, representing approximately 49% (2016 – 34%) of the Group’s obligations, expires in 2020. For the year ended 31 December 2017, the average effective borrowing rate was 3.6% (2016 – 3.7%). Interest rates are fixed at the contract date. All leases are on a fixed repayment basis and no arrangements have been entered into for contingent rental payments.
The fair value of the Group’s lease obligations approximates their carrying amount.
The Group’s obligations under finance leases are secured by the lessors’ charges over the leased assets.
An analysis of the present value of lease obligations by currency is as follows: Pound Sterling £0.5m (2016 – £0.8m), US Dollars £nil (2016 – £0.1m) and Others £nil (2016 – £0.1m).
23. TRADE AND OTHER PAYABLESTrade and other payables at 31 December comprise the following:
Year ended 2017
£m
Year ended 2016
£m
Current liabilitiesTrade payables 101.9 87.2 Social security and PAYE 4.3 6.5 Value added tax 2.0 1.2 Foreign exchange contracts 5.1 15.8 Accrued expenses 59.7 54.1 Total trade and other payables 173.0 164.8
The Directors consider that the carrying amount of trade payables approximates to their fair value.
The average credit period taken for trade purchases is 57 days (2016 – 55 days).
24. PROVISIONSWarranties
£mOther
£mTotal
£m
At 1 January 2016 1.4 – 1.4 Additional provision in the year 2.4 1.0 3.4 Utilisation of provision (0.7) – (0.7)Release of unused amounts (0.9) – (0.9)Exchange differences 0.3 0.1 0.4 At 1 January 2017 2.5 1.1 3.6 Additional provision in the year 3.5 3.0 6.5 Utilisation of provision (1.8) (0.7) (2.5)Release of unused amounts – (1.6) (1.6) Exchange differences (0.3) – (0.3)At 31 December 2017 3.9 1.8 5.7 Included in current liabilities 3.7 1.8 5.5
Warranty costsProvisions for warranty costs are based on an assessment of future claims with reference to past experience.
Claims and legal costsOther provisions include £1.3m (2016 – £nil) for expected legal costs and for contractual matters that have arisen in the ordinary course of business. Management exercises judgement to determine the estimated liability and amounts are recorded for known issues based on past experience of similar items and other known factors and circumstances. The provisions reflect the best estimate of the most likely outcome, having considered each provision separately and the possible range of outcomes. The settlement of such provisions is subject to ongoing discussion and are likely to take a number of reporting periods to complete. As with any judgement there is a high degree of inherent uncertainty, particularly with legal proceedings and claims, and the actual amounts of the settlement could differ from the amount provided.
25. SHARE CAPITALYear ended
2017 £m
Year ended 2016
£m
Issued and fully paid:419.4 million ordinary shares of 10p each 41.9 41.9
At 31 December 2016, the issued and fully paid up share capital was 419.4 million ordinary shares of 10p each.
1,832 shares were issued during 2017 (2016 – Nil).
The Company has one class of ordinary shares which carry no right to fixed income.
26. SHARE PREMIUM ACCOUNTYear ended
2017 £m
Year ended 2016
£m
Balance at 1 January 14.8 14.8 Movement in year – – Balance at 31 December 14.8 14.8

104 SENIOR PLC ANNUAL REPORT & ACCOUNTS 2017 SENIOR PLC ANNUAL REPORT & ACCOUNTS 2017 105
AD
DIT
ION
AL IN
FOR
MA
TIO
NG
OV
ER
NA
NC
EFIN
AN
CIA
L STA
TE
ME
NT
SS
TR
AT
EG
IC R
EP
OR
T
FINANCIAL STATEMENTS
NOTES TO THE CONSOLIDATED FINANCIAL STATEMENTS CONTINUED
27. EQUITY RESERVEYear ended
2017 £m
Year ended 2016
£m
Balance at 1 January 3.0 4.5 Transfer to retained earnings reserve (1.0) (2.6)Movement in year 1.9 1.1 Balance at 31 December 3.9 3.0
The transfer to retained earnings reserve is in respect of equity-settled share-based payments that vested during the year.
The movement in the year is £1.9m (2016 – £1.1m) in respect of the share-based payment charge for the year.
28. HEDGING AND TRANSLATION RESERVESHedging reserve
Year ended 2017
£m
Translation reserve
Year ended 2017
£m
Total Year ended
2017 £m
Hedging reserve
Year ended 2016
£m
Translation reserve
Year ended 2016
£m
Total Year ended
2016 £m
Balance at 1 January (50.5) 92.8 42.3 (41.4) 28.5 (12.9)Exchange differences on translation of overseas operations – (18.2) (18.2) – 62.6 62.6 Foreign exchange gain recycled to the Income Statement on disposal – – – – (0.4) (0.4)Change in fair value of hedging derivatives 11.5 – 11.5 (9.1) – (9.1)Tax on foreign exchange contracts – cash flow hedges (2.3) – (2.3) – 2.1 2.1 Balance at 31 December (41.3) 74.6 33.3 (50.5) 92.8 42.3
29. RETAINED EARNINGSYear ended
2017 £m
Year ended 2016
£m
Balance at 1 January 400.0 384.7 Dividends paid (27.9) (26.4)Profit for the year 60.3 45.4 Pension actuarial gain/(loss) 5.2 (5.1)Transfer from equity reserve 1.0 2.6 Transfer from own share reserve (0.5) (1.7)Tax on deductible temporary differences 0.7 0.5 Balance at 31 December 438.8 400.0
30. OWN SHARESYear ended
2017 £m
Year ended 2016
£m
Balance at 1 January (1.5) (2.1)Transfer to retained earnings reserve 0.5 1.7 Purchase of new shares (0.1) (1.1)Balance at 31 December (1.1) (1.5)
The own shares reserve represents the cost of shares purchased in the market and held by the Senior plc Employee Benefit Trust to satisfy options under the Group’s share option schemes (see Note 34).
31. DISPOSAL AND ASSETS HELD FOR SALEOn 9 September 2017, the Group sold the BWT Ilkeston facility. The sale enabled management to have greater focus on opportunities in its core activities. A loss of £3.8m arose on disposal after taking into account exit costs together with fair value of net assets disposed (£4.2m including £0.9m of inventories and £0.7m of property, plant and equipment and £1.7m of goodwill), offset by cash consideration of £0.4m.
The Group is in an advanced stage of negotiating a sale agreement to dispose of a property (land and building) in the Senior Flexonics Bartlett operation, which is classified as held for sale and presented separately in the Balance Sheet, consisting of property, plant and equipment of £3.9m as at 31 December 2017 (31 December 2016 – £4.2m).
32. NOTES TO THE CASH FLOW STATEMENTa) Reconciliation of operating profit to net cash from operating activities
Year ended 2017
£m
Year ended 2016
£m
Operating profit 65.5 65.8 Adjustments for:Depreciation of property, plant and equipment 38.8 32.5 Amortisation of intangible assets 19.1 21.5 Profit on sale of fixed assets (0.2) – Share options 1.9 1.1 Pension payments in excess of service cost (9.7) (8.8)Costs on disposal (0.8) (0.3)Pension curtailment gain – (1.0)Share of joint venture (0.7) (0.7)Operating cash flows before movements in working capital 113.9 110.1 Increase in inventories (7.9) (6.4)(Increase)/decrease in receivables (7.6) 7.3 Increase/(decrease) in payables and provisions 27.9 (1.3)Working capital currency movements (0.5) 3.5 Cash generated by operations 125.8 113.2 Income taxes paid (4.9) (2.7)Interest paid (10.0) (10.2)Net cash from operating activities 110.9 100.3
b) Free cash flowFree cash flow, a non-statutory item, enhances the reporting of the cash-generating ability of the Group prior to corporate activity such as acquisitions, disposals, financing and transactions with shareholders. It is derived as follows:
Year ended 2017
£m
Year ended 2016
£m
Net cash from operating activities 110.9 100.3 Interest received 0.4 0.2 Proceeds on disposal of property, plant and equipment 1.8 0.8 Purchases of property, plant and equipment (52.3) (50.7)Purchase of intangible assets (2.5) (2.1)Free cash flow 58.3 48.5
c) Analysis of net debt
At 1 January
2017 £m
Cash £m
Non-cashitems
£m
Exchange movement
£m
At 31 December
2017 £m
Cash 17.5 (4.4) – (0.5) 12.6 Overdrafts (0.7) (2.2) – – (2.9)Cash and cash equivalents 16.8 (6.6) – (0.5) 9.7 Debt due within one year (44.2) 41.8 (60.5) 5.3 (57.6)Debt due after one year (169.7) (4.7) 61.3 6.4 (106.7)Finance leases (1.0) 0.5 – – (0.5)Foreign exchange contracts – held for trading – – – (0.2) (0.2)Total (198.1) 31.0 0.8 11.0 (155.3)
Year ended 2017
£m
Year ended 2016
£m
Cash and cash equivalents comprise:Cash 12.6 17.5 Bank overdrafts (2.9) (0.7)Total 9.7 16.8
Cash and cash equivalents (which are presented as a single class of assets on the face of the Balance Sheet) comprise cash at bank and other short-term highly liquid investments with a maturity of three months or less. The Directors consider that the carrying amount of cash and cash equivalents approximates to their fair value.

106 SENIOR PLC ANNUAL REPORT & ACCOUNTS 2017 SENIOR PLC ANNUAL REPORT & ACCOUNTS 2017 107
AD
DIT
ION
AL IN
FOR
MA
TIO
NG
OV
ER
NA
NC
EFIN
AN
CIA
L STA
TE
ME
NT
SS
TR
AT
EG
IC R
EP
OR
T
FINANCIAL STATEMENTS
NOTES TO THE CONSOLIDATED FINANCIAL STATEMENTS CONTINUED
33. OPERATING LEASE ARRANGEMENTSThe Group as lessee
Year ended 2017
£m
Year ended 2016
£m
Minimum lease payments under operating leases recognised in the Consolidated Income Statement for the year 10.4 9.8
The Group also received £0.6m under sub-leases recognised in the Consolidated Income Statement for the year (2016 – £0.5m).
At 31 December, the Group had outstanding commitments for future minimum lease payments under non-cancellable operating leases, which fall due as follows:
Year ended 2017
£m
Year ended 2016
£m
Within one year 9.2 9.7 In the second to fifth years inclusive 26.6 24.8 After five years 12.1 15.0
47.9 49.5
The total of future minimum sub-lease payments expected to be received by the Group under non-cancellable sub-leases at the end of 2017 was £0.4m (2016 – £0.6m).
Operating lease payments principally represent rentals payable by the Group for certain of its manufacturing properties. The four most significant leases, representing 40% (2016 – 38%) of the Group’s commitment, expire in 2027, 2026 and two in 2024.
34. SHARE-BASED PAYMENTSThe Group recognised total expenses of £2.1m (2016 – £1.1m) related to share-based payments, of which £1.9m (2016 – £1.1m) related to equity-settled share-based payments, and £0.2m (2016 – £nil) related to social security costs on share-based payments. As at 31 December 2017, the Group had a liability of £0.2m (2016 – £nil) arising from share-based payments relating to social security costs.
a) 2005 Long-Term Incentive PlanEquity-settled Long-Term Incentive PlansOn 28 February 2017, 2,447,931 shares were awarded under the 2005 Long-Term Incentive Plan. On 3 May 2017, a further 156,813 shares were awarded. On 1 August 2017, a further 42,370 shares were awarded. Awards under this plan have a three-year vesting period, subject to earnings per share (EPS) and total shareholder return (TSR) performance conditions being met. Half the awards have an attaching performance target for EPS growth over the three-year performance period of at least 4% per annum above RPI. The other half of the awards begin to vest if the Group’s TSR falls in the top half of a comparator group at the end of the three-year performance period. Vesting levels increase with higher performance. The awards are settled by delivering shares to the participants.
The estimated fair value for the awards granted in the year with EPS conditions is 175.80p, 216.50p and 248.40p, which is the share price at the date of grant. The estimated fair value for the awards granted in the year with TSR conditions is 82.80p, 101.97p and 116.99p per share reflecting an adjustment of 53% to the fair value of the awards with EPS conditions due to the stringent TSR condition.
These fair values were calculated by applying a binomial option pricing model. This model incorporates a technique called “bootstrapping”, which models the impact of the TSR condition. The model inputs at the date of grant were the share price (175.80p for the main award), expected volatility of 28% per annum, and the performance conditions as noted above. Expected volatility was determined by calculating the historical volatility of the Group’s share price over the previous three years.
The following share awards were outstanding as at 31 December 2017 and 2016:
Year ended 2017
Number of shares
Year ended 2016
Number of shares
Outstanding at 1 January 3,696,386 3,105,711 Granted 2,647,114 2,026,905 Exercised – (247,967)Forfeited (1,486,132) (1,188,263)Outstanding at 31 December 4,857,368 3,696,386
34. SHARE-BASED PAYMENTS CONTINUEDb) Enhanced SMIS Deferred Share AwardOn 28 February 2017, 247,156 shares were awarded under the Enhanced SMIS Deferred Share Award. Shares earned under this award have a three-year deferral period and would be subject to forfeiture by a “bad leaver” over that deferral period. There are no performance criteria for this award. The awards are settled by delivering shares to the participants.
The estimated fair value for the awards granted in the year is 175.80p per share, which is the share price at the date of grant.
The following share awards were outstanding as at 31 December 2017 and 2016:
Year ended 2017
Number of shares
Year ended 2016
Number of shares
Outstanding at 1 January 500,728 646,338 Granted 247,156 193,573 Exercised (185,587) (278,543)Forfeited (77,921) (60,640)Outstanding at 31 December 484,376 500,728
c) Savings-Related Share Option PlanThe Company operates a Savings-Related Share Option Plan for eligible employees across the Group. There are no performance criteria for this arrangement and options are issued to all participants in accordance with the HM Revenue & Customs rules for such savings plans. Savings-Related Share Options were last issued on 2 May 2017.
The following options were outstanding as at 31 December 2017 and 2016:
Year ended 2017 Year ended 2016
Number of share
options
Weighted average exercise
price
Number of share
options
Weighted average exercise
price
Outstanding at 1 January 4,133,402 244.43p 3,099,863 283.24pGranted 2,182,727 207.20p 3,120,489 222.00pExercised (1,832) 219.57p – – Forfeited (1,217,975) 245.85p (2,068,318) 268.76pExpired (553,697) 244.40p (18,632) 244.40pOutstanding at 31 December 4,542,625 226.17p 4,133,402 244.43pExercisable at 31 December – – 553,697 244.40p
1,832 shares were exercised in 2017. No share options were exercised in 2016. The weighted average share price at the date of exercise for share options exercised during 2017 was 269.65p. The options outstanding at 31 December 2017 had an exercise price of 207.20p, 222.00p and 335.80p per share, and a weighted average remaining contractual life of 2.3 years. The options outstanding at 31 December 2016 had exercise prices of 222.00p, 335.80p and 244.40p per share, and a weighted average remaining contractual life of 2.4 years.
d) One-off share awardOn 3 September 2013, a one-off award over 82,720 shares was granted under the terms of a share award agreement agreed in connection with Derek Harding’s recruitment as Group Finance Director, in order partly to compensate him for forgoing entitlements from his previous employer. During 2016, 2/9ths of the one-off award vested, with 3/9ths having vested in 2015 and 4/9ths having vested in 2014.
The following share awards were outstanding as at 31 December 2017 and 2016:
Year ended 2017
Number of shares
Year ended 2016
Number of shares
Outstanding at 1 January – 18,383 Granted – – Exercised – (18,383)Forfeited – – Outstanding at 31 December – –

108 SENIOR PLC ANNUAL REPORT & ACCOUNTS 2017 SENIOR PLC ANNUAL REPORT & ACCOUNTS 2017 109
AD
DIT
ION
AL IN
FOR
MA
TIO
NG
OV
ER
NA
NC
EFIN
AN
CIA
L STA
TE
ME
NT
SS
TR
AT
EG
IC R
EP
OR
T
FINANCIAL STATEMENTS
34. SHARE-BASED PAYMENTS CONTINUEDe) Other share awardsOn 1 May 2015, one-off awards over 96,770 shares were granted to David Squires in connection with his appointment as Group Chief Executive comprising an award over 4,770 shares that was exercised on appointment and two long-term incentive awards over 32,000 and 60,000 shares that mirror the rules and performance conditions attaching to the LTIP awards made to other Senior executives on 25 March 2013 and 21 March 2014 respectively under the Senior plc 2005 Long-Term Incentive Plan. For the 32,000 share award, 6,640 shares vested on 25 March 2016; the remaining 60,000 share award lapsed during 2017.
The following share awards were outstanding as at 31 December 2017 and 2016:
Year ended 2017
Number of shares
Year ended 2016
Number of shares
Outstanding at 1 January 60,000 92,000 Granted – – Exercised – (6,640)Forfeited (60,000) (25,360)Outstanding at 31 December – 60,000
f) Restricted share awardsDuring the year, the Board approved the creation of the Restricted Share Award plan. On 1 August 2017, 25,000 shares were awarded under this plan. Shares granted under this award have a three-year deferral period and would be subject to forfeiture by a “bad leaver” over that deferral period. There are no performance criteria for this award. The awards are settled by delivering shares to the participants.
The estimated fair value for the awards granted in the year is 248.4p per share, which is the share price at the date of grant.
The following share awards were outstanding as at 31 December 2017 and 2016:
Year ended 2017
Number of shares
Year ended 2016
Number of shares
Outstanding at 1 January – – Granted 25,000 – Exercised – – Forfeited – – Outstanding at 31 December 25,000 –
35. RETIREMENT BENEFIT SCHEMESThe Group operates a number of pension plans in the UK, North America and Europe. These include both defined contribution arrangements and defined benefit arrangements. The Senior plc Pension Plan (“the UK Plan”), which is a funded scheme in the UK and closed to future accrual at the end of 6 April 2014, has the largest pension obligation in the Group and Company. This plan provides benefits based on final pensionable emoluments for the employees of the Group and Company. The latest full actuarial valuation was carried out as at 5 April 2016 and, for the purposes of accounting under IAS19, this valuation has been rolled forward to 31 December 2017.
In addition, the Group operates two defined benefit plans in the US, one of which was closed to future accrual from October 2009. The second plan was closed to future participants from September 2013, and the Executive section was also closed to future accruals from December 2013. Separate disclosure is made for the funded UK and US defined benefit arrangements. In both the UK and US, the assets of funded plans are held in separate trustee administered funds managed by independent financial institutions and have pension costs assessed by consulting actuaries using the Projected Unit Method. The Trustees are required to act in the best interests of the plans’ beneficiaries.
The Group also has a small number of unfunded post-retirement plans, including a closed healthcare scheme in the US. Separate disclosure is provided for these arrangements.
Further details on the arrangement of the UK Plan are given below.
The Trustee of the UK Plan is Senior Trustee Limited. The appointment of the Directors to the Board is determined by the articles of association of Senior Trustee Limited. There is a policy that at least one-third of all Directors should be nominated by members of the UK Plan. Currently, there is one member-nominated Director and a process is underway to appoint a new member-nominated Director following retirement of the second Director. There are four Directors who have been nominated by the Company of which the Chairman and one other Director are viewed as independent.
35. RETIREMENT BENEFIT SCHEMES CONTINUEDThe UK Plan exposes the Company to a number of risks. In particular:
• Uncertainty in benefit payments – the value of the obligations will ultimately depend on the amount of benefits paid out. This in turn will depend on the level of inflation and how long individuals live.
• Volatility in asset values – the value of the assets held to meet future benefit payments is volatile due to changes in stock markets and interest rates.
• Uncertainty in cash funding – movements in the value of the UK Plan’s obligations or assets may result in the Company being required to provide higher levels of cash funding.
The investment strategy for the UK Plan is decided by the Trustee in consultation with Senior plc. The primary investment objective is for the plan to be able to meet benefit payments as they fall due. The UK Plan’s average duration is around 16 years and benefits are expected to be paid for the next 60 to 70 years. These cash flow payments are expected to reach a peak around 2028, and gradually decline thereafter as the membership matures. In setting this strategy, the Trustee considers a wide range of asset classes, the risk and rewards of a number of possible asset allocation options, the sustainability of each asset class within each strategy, and the need for appropriate diversification between different asset classes. The primary investment objective is implemented by setting strategic asset allocations using a “linear de-risking” approach. Under this approach, the scheme’s current asset strategy of 70% invested in low-risk matching assets, such as ‘liability driven investments’ (LDI) and bonds, and 30% in higher-risk return seeking assets, such as equities, is expected to be linearly moved into 100% matching assets over the period from April 2021 to April 2036. LDI’s help to mitigate investment risk for the UK Plan by minimising the fluctuations in the UK Plan’s funding levels due to changes in the value of the liabilities. This is achieved through hedging movements in the funding liabilities caused by changes in interest rates and inflation expectations. The Trustee continues to review it’s investment strategy and has also implemented a switching mechanism to secure any outperformances of equities relative to bonds, by selling equities to buy bonds.
While the UK Plan was in a deficit position of £37.4m as at 5 April 2016 when measured on the Trustee’s funding basis, the UK Plan is in a surplus position of £19.4m as at 31 December 2017 (2016 – £4m surplus, 2015 – £0.6m deficit) when measured on an IAS 19 basis. The difference between the triennial funding and annual IAS 19 valuation relates to the assumptions used. For example, the funding discount rate is based on the UK Plan’s stated investment strategy, as opposed to the yields available on corporate bonds for the IAS 19 discount rate.
The IAS 19 surplus position on the UK Plan is recognised as an asset on the Company Balance Sheet, with no requirement to recognise an additional liability on the UK Plan, on the grounds that the Company has an unconditional right to a refund, assuming the gradual settlement of Plan liabilities over time until all members have left. In considering this, the Company has taken into account that the Trustees do not have unilateral powers to wind up the Plan or modify benefits. The IASB is considering amendments to pension accounting (IFRIC 14) as published in an exposure draft in June 2015. If implemented by the IASB, some of these amendments could result in derecognition of the UK Plan’s IAS 19 surplus, or recognition of additional liabilities. The Group will reconsider the implications of any amendment to IFRIC 14 and IAS 19 if and when it has been finalised and published.
Cash contributions to the UK Plan are set by agreement between the Company and the Trustee of the UK Plan. These are set in accordance with legislation and take account of the intention to further reduce the risk associated with the UK Plan’s investment strategy, as set out above. The contributions were last reviewed as at 5 April 2016 and were based on a forecast deficit at that time, as part of the 2016 triennial funding valuation. The Company has agreed with the Trustee of the UK Plan to make scheduled contributions over a five year period from April 2016 to March 2021. Annual cash funding contributions of £8.1m are expected over this period, subject to review and amendment as appropriate, at the next funding valuation in 2019. The estimated contributions expected to be paid during 2018 in the US funded plans is £2.2m (2016 – £2.1m).
The Group is ultimately responsible for making up any shortfall in the UK Plan over a period agreed with the Trustees. To the extent that actual experience is different from that assumed, the funding position will be better or worse than anticipated. As such, the contributions required by the Group could vary in the future.
a) Defined contribution schemesThe Group has a number of different defined contribution and government-sponsored arrangements in place in the countries in which it operates. None of these are individually material to the Group and the aggregate cost of such schemes for the period was £10.3m (2016 – £9.2m).
NOTES TO THE CONSOLIDATED FINANCIAL STATEMENTS CONTINUED

110 SENIOR PLC ANNUAL REPORT & ACCOUNTS 2017 SENIOR PLC ANNUAL REPORT & ACCOUNTS 2017 111
AD
DIT
ION
AL IN
FOR
MA
TIO
NG
OV
ER
NA
NC
EFIN
AN
CIA
L STA
TE
ME
NT
SS
TR
AT
EG
IC R
EP
OR
T
FINANCIAL STATEMENTS
NOTES TO THE CONSOLIDATED FINANCIAL STATEMENTS CONTINUED
35. RETIREMENT BENEFIT SCHEMES CONTINUEDb) Defined benefit schemesThe amount included in the Balance Sheet arising from the Group’s obligations in respect of its defined benefit plans is set out below.
31 December 2017 31 December 2016UK plans
funded £m
US plans funded
£m
Unfunded plans
£mTotal
£m
UK plans funded
£m
US plans funded
£m
Unfunded plans
£mTotal
£m
Present value of defined benefit obligations (301.8) (54.3) (7.9) (364.0) (297.4) (54.5) (7.0) (358.9)Fair value of plan assets 321.2 47.1 0.4 368.7 301.4 47.1 – 348.5 Plan surplus/(deficit) per Balance Sheet 19.4 (7.2) (7.5) 4.7 4.0 (7.4) (7.0) (10.4)
c) Movements in the present value of defined benefit obligations were as follows:
31 December 2017 31 December 2016UK plans
funded £m
US plans funded
£m
Unfunded plans
£mTotal
£m
UK plans funded
£m
US plans funded
£m
Unfunded plans
£mTotal
£m
At 1 January 297.4 54.5 7.0 358.9 256.0 48.5 5.5 310.0 Current service costs – 0.4 0.5 0.9 – 0.4 0.5 0.9 Interest cost 7.5 2.1 0.2 9.8 9.3 2.1 0.1 11.5 Experience on benefit obligations 4.1 0.9 – 5.0 (6.9) (0.3) – (7.2)Actuarial losses/(gains) – financial 7.6 3.6 – 11.2 57.6 0.3 0.2 58.1 Actuarial losses/(gains) – demographic (3.2) (0.4) – (3.6) (5.8) 2.8 – (3.0)Benefits paid (11.6) (2.3) – (13.9) (12.8) (2.4) (0.3) (15.5)Curtailment credit – – – – – (5.7) – (5.7)Exchange differences – (4.5) 0.2 (4.3) – 8.8 1.0 9.8 At 31 December 301.8 54.3 7.9 364.0 297.4 54.5 7.0 358.9
d) Movements in the fair value of plan assets were as follows:
31 December 2017 31 December 2016UK plans
funded £m
US plans funded
£m
Unfunded plans
£mTotal
£m
UK plans funded
£m
US plans funded
£m
Unfunded plans
£mTotal
£m
At 1 January 301.4 47.1 – 348.5 255.4 42.0 – 297.4 Interest on plan assets 7.7 1.8 0.1 9.6 9.4 1.9 – 11.3 Actual return on plan assets less interest 15.5 2.3 – 17.8 41.4 1.4 – 42.8 Contributions from employer 8.6 2.2 0.3 11.1 8.7 1.5 – 10.2 Curtailment charge – – – – – (4.7) – (4.7)Benefits paid (11.6) (2.3) – (13.9) (12.8) (2.4) – (15.2)Running costs (0.4) (0.1) – (0.5) (0.7) (0.1) – (0.8)Exchange differences – (3.9) – (3.9) – 7.5 – 7.5 At 31 December 321.2 47.1 0.4 368.7 301.4 47.1 – 348.5
e) Amounts recognised in the Income Statement in respect of these defined benefit schemes are as follows:
31 December 2017 31 December 2016UK plans
funded £m
US plans funded
£m
Unfunded plans
£mTotal
£m
UK plans funded
£m
US plans funded
£m
Unfunded plans
£mTotal
£m
Current service cost included within operating profit – 0.4 0.5 0.9 – 0.4 0.5 0.9 Running costs 0.4 0.1 – 0.5 0.7 0.1 – 0.8 Curtailment credit – – – – – (1.0) – (1.0)Charge/(credit) included within operating profit 0.4 0.5 0.5 1.4 0.7 (0.5) 0.5 0.7 Included within finance costs (0.2) 0.3 0.1 0.2 (0.1) 0.2 0.1 0.2 Amount recognised in the Income Statement 0.2 0.8 0.6 1.6 0.6 (0.3) 0.6 0.9
The curtailment gain of £nil (2016 – £1.0m) relates to the part closure of both US funded plans.
35. RETIREMENT BENEFIT SCHEMES CONTINUEDf) Amounts recognised in other comprehensive income are as follows:
31 December 2017 31 December 2016UK plans
funded £m
US plans funded
£m
Unfunded plans
£mTotal
£m
UK plans funded
£m
US plans funded
£m
Unfunded plans
£mTotal
£m
Net actuarial gain/(losses) in the year due to:– Change in financial assumptions (7.6) (3.6) – (11.2) (57.6) (0.3) (0.2) (58.1)– Change in demographic
assumptions 3.2 0.4 – 3.6 5.8 (2.8) – 3.0 – Experience adjustments on benefit
obligations (4.1) (0.9) – (5.0) 6.9 0.3 – 7.2 Actual return on plan assets less interest on benefit obligations 15.5 2.3 – 17.8 41.4 1.4 – 42.8 Gains/(losses) recognised in other comprehensive income 7.0 (1.8) – 5.2 (3.5) (1.4) (0.2) (5.1)
Actuarial gains of £5.2m (2016 – £5.1m losses) have been recognised in the Statement of Comprehensive Income. The cumulative amount of actuarial losses recognised in the Statement of Comprehensive Income as at 31 December 2017 is £48.2m (2016 – £53.4m).
g) Assets and assumptions in funded plans
UK plans funded US plans funded2017
£m2016
£m2017
£m2016
£m
Fair value of plan assetsEquities 61.8 78.5 – – Bonds 91.8 99.5 47.1 47.1 Gilts 135.6 120.0 – – Cash and net current assets 32.0 3.4 – – Total 321.2 301.4 47.1 47.1
Actual return on plan assets 23.2 50.8 4.1 3.3
The UK Plan’s assets are invested in pooled funds, which are invested exclusively within instruments with quoted market prices in an active market, with the exception of the Plan’s holdings in insurance annuity policies, valued at £6.7m (2016 – £7.2m). The value of the invested assets has been measured at bid value and the value of the insurance annuity policies has been set equal to the value of the corresponding obligations.
The Plan’s equities are broadly split equally between UK and overseas companies. The UK equities are passively invested in line with the FTSE All-Share Index and the overseas equities are passively invested in line with the FTSE World ex-UK GBP Hedged Index. Therefore, the Plan is exposed to a typical breakdown of industries within those equity indices. The Plan’s bonds are actively invested in investment grade UK corporate bonds, and are exposed to a fairly typical range of UK businesses. The majority of the Plan’s gilts are passively invested in a range of UK index-linked government bonds, with the remainder actively invested in a range of swap instruments linked to movements in government bond prices. The risks associated with the Plan’s bond and gilt investments are largely offset by corresponding risks present within the pricing of the Plan’s benefit obligations.
The UK Plan does not invest directly in property occupied by the Company or in financial securities issued by the Company.
UK plans funded US plans funded2017 2016 2017 2016
Major assumptions (per annum %)Inflation 3.10% 3.20% N/A N/AIncrease in salaries N/A N/A N/A N/AIncrease in pensions 3.00% 3.00% 0.00% 0.00%Increase in deferred pensions 3.10% 3.20% 0.00% 0.00%Rate used to discount plan liabilities 2.40% 2.60% 3.50% 4.00%
Life expectancy of a male aged 65 at the year-end 21.9 22.0 20.7 20.8 Life expectancy of a male aged 65, 20 years after the year-end 23.3 23.7 22.3 22.5
Benefits under the US funded plans are not linked to inflation.

112 SENIOR PLC ANNUAL REPORT & ACCOUNTS 2017 SENIOR PLC ANNUAL REPORT & ACCOUNTS 2017 113
AD
DIT
ION
AL IN
FOR
MA
TIO
NG
OV
ER
NA
NC
EFIN
AN
CIA
L STA
TE
ME
NT
SS
TR
AT
EG
IC R
EP
OR
T
FINANCIAL STATEMENTS
35. RETIREMENT BENEFIT SCHEMES CONTINUED
For the UK Plan, the estimated impact on the plan deficit at 31 December 2017 for changes in assumptions is as follows:
Increase in plan deficit
£m
0.5% decrease in the discount rate 25.0 One-year increase in life expectancy 9.0 0.5% increase in inflation 15.0
These sensitivities have been calculated to show the movement in the defined benefit obligation in isolation, and assuming no other changes in market conditions at the accounting date. This is unlikely in practice – for example, a change in discount rate is unlikely to occur without any movement in the value of the assets held by the Plan.
h) Other post-retirement liabilitiesThis balance comprises an unfunded German pension plan of £3.7m (2016 – £3.6m), unfunded closed pension and post-retirement healthcare plans in the USA of £0.4m (2016 – £0.4m), a provision for post-retirement payments in France of £3.4m (2016 – £2.9m) and an immaterial provision for post-retirement payments in Thailand.
The closed pension and post-retirement healthcare plans in the US have been valued on a Projected Unit Method using a discount rate of 3.5%. As at 31 December 2017, no more participants were eligible for medical benefits under the plan. The German plan has been subject to formal actuarial valuation on a Projected Unit Method with the following assumptions: discount rate 1.8%, salary growth 0.0% and pension increase 1.6%. In France, the provision arises from a legal obligation to make payments to retirees in the first two years post-retirement. Hence, it is not subject to discounting to the same extent as the other longer-term post-retirement liabilities.
36. CONTINGENT LIABILITIESContingent liabilities exist in respect of guarantees provided by the Group in the ordinary course of business for product delivery, performance and reliability. Various Group undertakings are parties to legal actions or claims which arise in the ordinary course of business, some of which could be for substantial amounts. In May 2015, Senior Aerospace Ketema was named as co-defendant in a putative class action lawsuit and a related lawsuit alleging property damage filed against Ametek, Inc. in the USA. On 25 January 2017, 27 March 2017 and 1 February 2018, Senior Aerospace Ketema was named as a co-defendant in similar lawsuits filed by additional plaintiffs. Each of the lawsuits claim that Ametek had polluted the groundwater during its tenure as owners of the site where Senior Aerospace Ketema is currently located, allegedly causing harm to neighbouring properties and/or creating health risks. While the outcome of some of these matters cannot precisely be foreseen, the Directors do not expect any of these arrangements, legal actions or claims, after allowing for provisions already made where appropriate, to result in significant loss to the Group.
NOTES TO THE CONSOLIDATED FINANCIAL STATEMENTS CONTINUED COMPANY BALANCE SHEETAs at 31 December 2017
Notes
Year ended 2017
£m
Year ended2016
Restated*£m
Non-current assetsInvestment in subsidiaries 39 259.9 259.9 Property, plant and equipment 40 0.3 0.4 Other intangible assets 38 0.3 0.4 Debtors: amounts due after more than one year 41 28.9 28.4 Pension surplus asset 51 19.4 4.0 Total non-current assets 308.8 293.1 Current assetsDebtors: amounts due within one year 41 122.6 149.5 Cash at bank and in hand 48 – 1.5 Total current assets 122.6 151.0 Total assets 431.4 444.1 Creditors: amounts falling due within one yearTrade and other creditors 43 74.0 65.0 Borrowings 42 60.8 49.5 Current tax – 0.2 Total creditors: amounts falling due within one year 134.8 114.7 Creditors: amounts falling due after more than one yearBorrowings 42 103.0 151.1 Deferred tax liability 2.9 0.4 Total creditors: amounts falling due after more than one year 105.9 151.5 Total liabilities 240.7 266.2 Net assets 190.7 177.9
Capital and reservesIssued share capital 44 41.9 41.9 Share premium account 14.8 14.8 Equity reserve 3.9 3.0 Hedging and translation reserve 45 (0.3) (0.3)Profit and loss account 46 131.5 120.0 Own shares 47 (1.1) (1.5)Total shareholders' funds 190.7 177.9
*See Note 37.
The Financial Statements of Senior plc (registered number 282772) were approved by the Board of Directors and authorised for issue on 23 February 2018. They were signed on its behalf by:
David Squires Bindi FoyleDirector Director

114 SENIOR PLC ANNUAL REPORT & ACCOUNTS 2017 SENIOR PLC ANNUAL REPORT & ACCOUNTS 2017 115
AD
DIT
ION
AL IN
FOR
MA
TIO
NG
OV
ER
NA
NC
EFIN
AN
CIA
L STA
TE
ME
NT
SS
TR
AT
EG
IC R
EP
OR
T
FINANCIAL STATEMENTS
COMPANY STATEMENT OF CHANGES IN EQUITYFor the year ended 31 December 2017
All equity is attributable to equity holders of the Company
Notes
Issued share
capital £m
Share premium account
£m
Equity reserve
£m
Hedging and
translation reserve
£m
Profit and loss
account £m
Own shares
£m
Total equity
£m
Balance at 1 January 2016 41.9 14.8 4.5 (0.3) 81.0 (2.1) 139.8 Profit for the year 2016 – – – – 68.0 – 68.0 Actuarial losses on defined benefit pension schemes – – – – (3.5) – (3.5)Total comprehensive income for the period – – – – 64.5 – 64.5 Share-based payment charge – – 1.1 – – – 1.1 Purchase of shares held by employee benefit trust 47 – – – – – (1.1) (1.1)Use of shares held by employee benefit trust 47 – – – – (1.7) 1.7 – Transfer to profit and loss account 46 – – (2.6) – 2.6 – – Dividends paid 11 – – – – (26.4) – (26.4)Balance at 31 December 2016 41.9 14.8 3.0 (0.3) 120.0 (1.5) 177.9 Profit for the year 2017 – – – – 31.9 – 31.9 Actuarial gains on defined benefit pension schemes – – – – 7.0 – 7.0 Total comprehensive income for the period – – – – 38.9 – 38.9 Share-based payment charge – – 1.9 – – – 1.9 Purchase of shares held by employee benefit trust 47 – – – – – (0.1) (0.1)Use of shares held by employee benefit trust 47 – – – – (0.5) 0.5 – Transfer to profit and loss account 46 – – (1.0) – 1.0 – – Dividends paid 11 – – – – (27.9) – (27.9)Balance at 31 December 2017 41.9 14.8 3.9 (0.3) 131.5 (1.1) 190.7
NOTES TO THE COMPANY FINANCIAL STATEMENTS
37. ACCOUNTING POLICIESBasis of accounting (Company only)The Company is incorporated in England and Wales under the Companies Act. The Company meets the definition of a qualifying entity under FRS 100 (Financial Reporting Standard 100) issued by the Financial Reporting Council. Accordingly, the Company has adopted FRS 101 (Financial Reporting Standard 101) Reduced Disclosure Framework as issued by the Financial Reporting Council.
As permitted by FRS 101, the Company has taken advantage of the disclosure exemptions available under that standard in relation to share-based payments, financial instruments, fair value measurements, capital management, presentation of a cash flow statement and disclosure of related party transactions.
The Financial Statements have been prepared on the historical cost basis. They have also been prepared on the going concern basis. The principal accounting policies adopted are the same as those set out in Note 2 to the Consolidated Financial Statements, except in respect of investments in subsidiaries, which are stated at cost less, where appropriate, provisions for impairment.
The restatement in 2016 relates to pension surplus (£4.0m) and amounts due from subsidiaries (£23.9m), both due more than one year, which have been reclassified from current assets to non-current assets. The restatement has no effect on profit or net assets.
38. OTHER INTANGIBLE ASSETSYear ended
2017 Computer software
£m
Year ended 2016
Computer software
£m
CostAt 1 January 0.8 0.5Additions – 0.3 At 31 December 0.8 0.8
AmortisationAt 1 January 0.4 0.3 Charge for the year 0.1 0.1 At 31 December 0.5 0.4 Carrying amount at 31 December 0.3 0.4
39. INVESTMENTS IN SUBSIDIARIESA list of the significant investments in subsidiaries, including the name, country of incorporation, and proportion of ownership interest is given on pages 121 to 123.
Year ended 2017
£m
Year ended 2016
£m
At 1 January 259.9 259.9 Additional investment in subsidiaries – – At 31 December 259.9 259.9
40. PROPERTY, PLANT AND EQUIPMENTYear ended
2017 Plant and
equipment £m
Year ended 2016
Plant and equipment
£m
CostAt 1 January 0.8 0.7 Additions – 0.1 At 31 December 0.8 0.8 Accumulated depreciationAt 1 January 0.4 0.3 Charge for the year 0.1 0.1 At 31 December 0.5 0.4 Carrying amount at 31 December 0.3 0.4

116 SENIOR PLC ANNUAL REPORT & ACCOUNTS 2017 SENIOR PLC ANNUAL REPORT & ACCOUNTS 2017 117
AD
DIT
ION
AL IN
FOR
MA
TIO
NG
OV
ER
NA
NC
EFIN
AN
CIA
L STA
TE
ME
NT
SS
TR
AT
EG
IC R
EP
OR
T
FINANCIAL STATEMENTS
41. DEBTORSTrade and other debtors at 31 December comprise the following:
Year ended 2017
£m
Year ended2016
Restated*£m
Debtors: amounts due more than one yearDue from subsidiaries 28.9 28.4
28.9 28.4
Debtors: amounts due within one yearValue added tax 0.1 0.1 Prepayments and accrued income 0.3 1.2 Due from subsidiaries 122.2 148.2
122.6 149.5 Total debtors 151.5 177.9
*See Note 37.
The Directors consider that the carrying amount of debtors approximates to their fair value. The maximum exposure to credit risk at the reporting date is the fair value of each class of debtor above. The Company does not hold any collateral as security.
The carrying amounts due from subsidiaries approximates to their fair value. There are no past due or impaired debtor balances (2016 – £0.1m).
As at 31 December 2017, debtors due in more than one year consist of debtors due in accordance with the vesting periods of share-based payments (£1.9m – see Note 34) and loans to subsidiaries, due to mature after 2018 at an interest rate of 6.9% (£2.2m) and an interest rate based on a 1% margin above EURIBOR (£24.8m).
42. BORROWINGSYear ended
2017 £m
Year ended 2016
£m
Bank overdrafts 5.3 5.3 Bank loans 4.4 30.0 Other loans 154.1 165.3
163.8 200.6
The borrowings are repayable as follows:On demand or within one year 60.8 49.5 In the second year 5.0 60.5 In the third to fifth years inclusive 29.0 26.1 After five years 69.0 64.5
163.8 200.6 Less: amount due for settlement within 12 months(shown under current liabilities) (60.8) (49.5)Amount due for settlement after 12 months 103.0 151.1
Analysis of borrowings by currency31 December 2017
Total £m
Pound Sterling
£mEuros
£m
US Dollars
£mOthers
£m
Bank overdrafts 5.3 5.3 – – – Bank loans 4.4 4.4 – – – Other loans 154.1 – 24.7 129.4 –
163.8 9.7 24.7 129.4 –
31 December 2016
Total £m
Pound Sterling
£mEuros
£m
US Dollars
£mOthers
£m
Bank overdrafts 5.3 5.3 – – – Bank loans 30.0 30.0 – – – Other loans 165.3 – – 165.3 –
200.6 35.3 – 165.3 –
NOTES TO THE COMPANY FINANCIAL STATEMENTS CONTINUED
42. BORROWINGS CONTINUEDThe weighted average interest rates paid were as follows:
Year ended 2017
%
Year ended 2016
%
Bank loans and overdrafts 1.62 1.25 Other loans 4.78 5.47
Bank loans and overdrafts of £9.7m (2016 – £35.3m) are arranged at floating rates, thus exposing the Company to cash flow interest rate risk. Other borrowings are mainly arranged at fixed interest rates and expose the Company to fair value interest rate risk. No interest rate swaps were taken out in 2016 or 2017.
The Directors estimate the fair value of the Company’s borrowings to be as follows:Year ended
2017 £m
Year ended 2016
£m
Bank loans and overdrafts 9.7 35.3 Other loans 157.0 172.9
166.7 208.2
43. TRADE AND OTHER CREDITORSTrade and other creditors at 31 December comprise the following:
Year ended 2017
£m
Year ended 2016
£m
Creditors: amounts falling due within one yearTrade creditors 0.2 0.4 Social security and PAYE 0.1 0.1 Other creditors and accruals 4.9 3.5 Foreign currency derivatives 0.2 0.2 Due to subsidiaries 68.6 60.8 Total trade and other creditors 74.0 65.0
The Directors consider that the carrying amount of trade creditors approximates to their fair value.
44. ISSUED SHARE CAPITALYear ended
2017 £m
Year ended 2016
£m
Issued and fully paid:419.4 million ordinary shares of 10p each 41.9 41.9
At 31 December 2016, the issued and fully paid up share capital was 419.4 million ordinary shares of 10p each.
1,832 shares were issued during 2017 (2016 – Nil).
The Company has one class of ordinary shares, which carry no right to fixed income.

118 SENIOR PLC ANNUAL REPORT & ACCOUNTS 2017 SENIOR PLC ANNUAL REPORT & ACCOUNTS 2017 119
AD
DIT
ION
AL IN
FOR
MA
TIO
NG
OV
ER
NA
NC
EFIN
AN
CIA
L STA
TE
ME
NT
SS
TR
AT
EG
IC R
EP
OR
T
FINANCIAL STATEMENTS
45. HEDGING AND TRANSLATION RESERVESHedging reserve
Year ended 2017
£m
Translation reserve
Year ended 2017
£m
Total Year ended
2017 £m
Hedging reserve
Year ended 2016
£m
Translation reserve
Year ended 2016
£m
Total Year ended
2016 £m
Balance at 1 January and 31 December – (0.3) (0.3) – (0.3) (0.3)
46. PROFIT AND LOSS ACCOUNTYear ended
2017 £m
Year ended 2016
£m
Balance at 1 January 120.0 81.0 Dividends paid (27.9) (26.4)Profit for the year 31.9 68.0 Pension actuarial gain/(loss) 7.0 (3.5)Transfer from equity reserve 1.0 2.6 Transfer from own share reserve (0.5) (1.7)Balance at 31 December 131.5 120.0
£7.5m (2016 – £7.5m) of the Company’s retained earnings are considered undistributable.
In accordance with Section 408 of the Companies Act 2006, the Company has not presented its own Statement of Comprehensive Income, including the Income Statement and related Notes.
47. OWN SHARESYear ended
2017 £m
Year ended 2016
£m
Balance at 1 January (1.5) (2.1)Transfer to profit and loss account 0.5 1.7 Purchase of new shares (0.1) (1.1)Balance at 31 December (1.1) (1.5)
The own shares reserve represents the cost of shares purchased in the market and held by the Senior plc Employee Benefit Trust to satisfy options under the Group’s share option schemes (see Note 34).
The nominal value of each share is £0.1 (2016 – £0.1). The total number of treasury shares at 31 December 2017 is 491,361 (2016 – 615,176).
48. CASH AT BANK AND IN HANDYear ended
2017 £m
Year ended 2016
£m
Cash and cash equivalents comprise:Cash – 1.5 Bank overdrafts (5.3) (5.3)Total (5.3) (3.8)
Cash at bank and in hand held by the Company (which are presented as a single class of assets on the face of the Balance Sheet) comprise cash at bank and other short-term highly liquid investments with a maturity of three months or less. The Directors consider that the carrying amount of cash and cash equivalents approximate to their face value.
NOTES TO THE COMPANY FINANCIAL STATEMENTS CONTINUED
49. OPERATING LEASE ARRANGEMENTSThe Company as lessee
Year ended 2017
£m
Year ended 2016
£m
Minimum lease payments under operating leases recognised in the Income Statement for the year 0.1 0.1
At 31 December, the Company had outstanding commitments for future minimum lease payments under non-cancellable operating leases, which fall due as follows:
Year ended 2017
£m
Year ended 2016
£m
Within one year 0.1 0.1 In the second to fifth years inclusive 0.5 0.5 After five years 0.7 0.8
1.3 1.4
As at the date of approving the accounts, the Company has guaranteed £1.0m (2016 – £1.0m) of annual lease commitments of certain current and previous subsidiary entities.
50. DEFERRED TAXThe following are the major deferred tax liabilties and (assets) recognised by the Company and movements thereon during the current and prior reporting period:
Accelerated tax
depreciation £m
Retirement benefits
£m
Share- based
payments £m
Total £m
At 1 January 2016 – – – – (Credit)/charge to income (0.2) 0.7 (0.1) 0.4 At 1 January 2017 (0.2) 0.7 (0.1) 0.4 Charge/(credit) to income – 2.6 (0.1) 2.5
As at 31 December 2017 (0.2) 3.3 (0.2) 2.9
Deferred tax assets and liabilities are offset where the Company has a legally enforceable right to do so. The following is the analysis of the deferred tax balances (after offset) for financial reporting purposes:
Year ended 2017
£m
Year ended 2016
£m
Deferred tax liabilities 2.9 0.4
At the Balance Sheet date, the Company has unusued capital losses of £15.6m (2016 – £15.6m) available for offset against future capital gains. No deferred tax asset has been recognised as no such capital gains are anticipated to arise in the foreseeable future.
51. RETIREMENT BENEFIT SCHEMESThe Company’s defined benefit schemes are shown in Note 35 in the “UK plans funded” column.
52. RELATED PARTY TRANSACTIONSThe remuneration of the Directors and Senior Managers, who are the key management personnel of the Group, is set out in the Remuneration Report on pages 51 to 70.
Bloom Energy Corporation is a related party of the Group as Susan Brennan, an independent non-executive Director of the Group, is its Executive Vice-President and Chief Operations Officer.
In 2017, the Group sold £2.4m (2016 – £1.4m) of components to Bloom Energy Corporation. The gross receivable position as at 31 December 2017 was £0.5m (31 December 2016 – £0.3m).
53. SHARE-BASED PAYMENTSThe Company has a number of share-based payment arrangements that existed during 2017, the details of which can be found in Note 34.
For the savings-related share option plan, no shares were exercised in 2017 or 2016. The options outstanding at 31 December 2017 had an exercise price of 207.20p, 222.00p and 335.80p per share, and a weighted average remaining contractual life of 2.5 years. The options outstanding at 31 December 2016 had exercise prices of 222.00p, 335.80p and 244.40p per share, and a weighted average remaining contractual life of 2.2 years.
Share-based payment costs relating to subsidiaries are recharged from the Company.

120 SENIOR PLC ANNUAL REPORT & ACCOUNTS 2017 SENIOR PLC ANNUAL REPORT & ACCOUNTS 2017 121
AD
DIT
ION
AL IN
FOR
MA
TIO
NFIN
AN
CIA
L STA
TE
ME
NT
SG
OV
ER
NA
NC
ES
TR
AT
EG
IC R
EP
OR
T
FINANCIAL STATEMENTS
FIVE-YEAR SUMMARY
Group income statement2017
£m2016
£m2015
£m2014
£m2013
£m
RevenueContinuing operations 1,023.4 917.0 849.5 820.8 775.1
Adjusted operating profitContinuing operations 82.6 85.6 107.8 111.6 107.6 Amortisation of intangible assets from acquisitions (17.1) (19.8) (12.2) (7.2) (4.2)Loss on sale and write-down of fixed assets – – (1.5) – – Goodwill impairment – – (18.8) (9.4) (12.7)Impairment of assets held for sale – – (1.8) – – Acquisition costs – – (1.2) (0.6) (0.4)Write down of L85 inventory – – – (1.8) – Restructuring costs – – – (1.5) (1.9)Exceptional pension (charge)/credit – – – (1.5) 1.1 Reversal of contingent consideration payable – – – – 3.8 Operating profit 65.5 65.8 72.3 89.6 93.3 Investment income/finance costs, net (9.3) (10.1) (8.0) (8.1) (8.1)Net finance cost of retirement benefits (0.2) (0.2) (0.5) (0.9) (1.4)Loss on disposal (3.8) – – – – Profit before tax 52.2 55.5 63.8 80.6 83.8 Tax 8.1 (10.1) (15.3) (17.1) (12.4)Profit for the year 60.3 45.4 48.5 63.5 71.4
Depreciation and amortisation of intangibles 57.9 54.0 40.0 32.1 26.5 Gross capital expenditure (including finance lease assets) 54.8 52.8 48.6 31.1 29.7 Basic earnings per share 14.39p 10.84p 11.59p 15.25p 17.22pDiluted earnings per share 14.30p 10.83p 11.47p 15.06p 17.00pAdjusted earnings per share 14.39p 14.37p 18.98p 19.84p 19.00pDividends in respect of years – per share 6.95p 6.57p 6.20p 5.63p 5.12p – value 29.0 27.5 26.0 23.5 21.3
Group Balance SheetNon-current assets 624.3 647.0 572.4 466.4 393.6 Net current assets 66.0 94.0 98.3 84.4 101.1 Non-current liabilities (158.7) (240.5) (239.8) (139.2) (133.2)Net assets 531.6 500.5 430.9 411.6 361.5 Net borrowings (155.3) (198.1) (194.6) (105.0) (59.2)
Group cash flowNet cash from operating activities 110.9 100.3 99.4 88.6 92.4 Interest received 0.4 0.2 0.2 0.1 0.2 Proceeds from disposal of property, plant and equipment 1.8 0.8 0.7 0.2 0.9 Purchase of property, plant and equipment – cash (52.3) (50.7) (46.4) (29.6) (28.7)Purchase of intangible assets (2.5) (2.1) (2.2) (1.5) (1.0)Free cash flow 58.3 48.5 51.7 57.8 63.8 Dividends paid (27.9) (26.4) (24.3) (21.9) (19.9)Acquisitions less disposals 0.4 1.3 (103.9) (60.1) (30.5)Investment in joint venture – – – – (0.5)Loan to joint venture 0.3 0.5 (0.1) (1.1) – Share issues – – – 1.1 0.1 Purchase of shares held by employee benefit trust (0.1) (1.1) (0.9) (0.7) (0.9)(Decrease)/increase in loans (37.1) (19.5) 81.7 (18.4) (0.2)Decrease in finance leases (0.5) (0.8) (0.6) (1.4) (0.5)(Decrease)/ increase in cash and cash equivalents (6.6) 2.5 3.6 (44.7) 11.4
Operating Companies Business Units LocationsCountry of Incorporation Registered Office
Senior UK Limited Senior Aerospace Bird Bellows Congleton England & Wales 59/61 High Street, Rickmansworth, Hertfordshire, WD3 1RH, UK
Senior Aerospace BWT MacclesfieldSenior Flexonics Crumlin CrumlinSenior Aerospace Weston ColneSenior Aerospace Thermal Engineering
Royston
Lymington Precision Engineers Co. Limited
Senior Flexonics Lymington Lymington England & Wales Gosport Street, Lymington, Hampshire, SO41 9EE, UK
Senior do Brasil Ltda Senior Flexonics São Paulo São Paulo, Brazil Brazil Praca Arquiteto Faustino Roncoroni, No 1 Rod. Castelo Branco, Km 54 Dist. Industrial Aracariguama, SP CEP 18147-00, C.P. 101001, Brazil
Senior Flexonics Czech s.r.o. Senior Flexonics Czech Olomouc, Czech Republic
Czech Republic Olomouc, Prómyslová 733/9, postcode 779 00, Czech Republic
Senior Aerospace Ermeto SAS Senior Aerospace Ermeto Blois, France France ZA Euro Val de Loire, 8 Rue du Clos Thomas, F-41330, Fosse, France
Senior Calorstat SAS Senior Aerospace Calorstat Dourdan, France France Z.I. La Gaudree, Rue des Soufflets, BP 58, F-91410, Dourdan, France
Senior Automotive Blois SAS Senior Automotive Blois Blois, France France 22 Boulevard de I’Industrie CS 13320, F-41033 Blois, France
Senior Flexonics GmbH Senior Flexonics Kassel Kassel, Germany Germany Frankfurter Strasse 199, 34121 Kassel, Germany
Senior India Private Limited Senior Flexonics New Delhi New Delhi, India India Plot No. 89, Secotr 8, IMT Manesar Gurgaon – 122050, Haryana, India
Senior Aerospace Bosman B.V. Senior Aerospace Bosman Rotterdam, Netherlands
Netherlands Bergen 6, 2993 LR Barendrecht, Netherlands
Senior Operations (Canada) Limited
Senior Flexonics Canada Brampton, Ontario Canada 134 Nelson Street West, Brampton, CA-Ontario L6X 1C9, Canada
Senior Flexonics SA (Pty) Limited Senior Flexonics Cape Town Cape Town, South Africa
South Africa 11 Thor Circle, Viking Place, Thornton 7460, Cape Town, South Africa
Senior Operations LLC Senior Aerospace Absolute Manufacturing
Arlington, Washington
USA Corporation Trust Center, 1209 Orange Street, Wilmington, DE 19801, USASenior Aerospace AMT Arlington,
WashingtonSenior Aerospace Jet Products San Diego, CaliforniaSenior Aerospace Ketema El Cajon, California Senior Aerospace Metal Bellows Sharon,
MassachusettsSenior Aerospace Damar Monroe, WashingtonSenior Aerospace SSP Burbank, CaliforniaSenior Aerospace Connecticut Enfield, ConnecticutSenior Flexonics Bartlett Bartlett, IllinoisSenior Flexonics GA Franklin, WisconsinSenior Flexonics Pathway New Braunfels, Texas
& Maine, DelawareSteico Industries, Inc. Senior Aerospace Steico
IndustriesOceanside, California USA 1814 Ord Way, Oceanside,
CA 92056, USA
GROUP UNDERTAKINGS

122 SENIOR PLC ANNUAL REPORT & ACCOUNTS 2017 SENIOR PLC ANNUAL REPORT & ACCOUNTS 2017 123
AD
DIT
ION
AL IN
FOR
MA
TIO
NFIN
AN
CIA
L STA
TE
ME
NT
SG
OV
ER
NA
NC
ES
TR
AT
EG
IC R
EP
OR
T
ADDITIONAL INFORMATION
Operating Companies Business Units LocationsCountry of Incorporation Registered Office
Senior Aerospace (Thailand) Limited
Senior Aerospace Thailand Chonburi, Thailand Thailand 789/115-116 Moo 1, Pinthong Industrial Estate, Sainhongkor-Lamchabang Road, Tambol Nhongkam, Amphur Sriracha, ChonBuri Province 20230, Thailand
Upeca Aerotech Sdn Bhd Senior Aerospace Upeca Selangor, Malaysia Malaysia 10th Floor, Menara Hap Seng, No.1 & 3 Jalan P. Ramlee, 50250 Kuala Lumpur, Malaysia
Upeca Flowtech Sdn Bhd Senior Flexonics Upeca Selangor, Malaysia Malaysia 10th Floor, Menara Hap Seng, No.1 & 3 Jalan P. Ramlee, 50250 Kuala Lumpur, Malaysia
Upeca Engineering (Tianjin) Co Ltd
Senior Flexonics Upeca (China) Tianjin, China China No.12 Quanhe Road, Wu Qing Development Area, Tianjin 301700, PR China
Flexonics Limited England & Wales 59/61 High Street, Rickmansworth, Hertfordshire, WD3 1RH, UK
Lymington Precision Engineering (LPE) Limited
England & Wales Gosport Street, Lymington, Hampshire, SO41 9EE, UK
Senior Aerospace LimitedSenior Americas One LimitedSenior Americas Two LimitedSenior Automotive LimitedAtlas Composites LimitedSenior Engineering Investments LimitedSenior Five LimitedSenior Finance Four LimitedSenior Finance Six LimitedSenior Finance Seven LimitedSenior Flexonics LimitedSenior Trustee LimitedThermal Engineering Holding LimitedThermal Engineering Limited
England & Wales 59/61 High Street, Rickmansworth, Hertfordshire, WD3 1RH, UK
Operating Companies Business Units LocationsCountry of Incorporation Registered Office
Senior France SAS France Zi la Gaudree, Rue des Soufflets, F-91410 Dourdan, France
Senior Investments (Deutschland) GmbHSenior Operations GmbH
Germany Frankfurter Strasse 199, 34121 Kassel, Germany
Senior Holdings LLC USA Corporation Trust Center, 1209 Orange Street, Wilmington, DE 19801, USA
Senior Aerospace GmbH Senior Investments GmbHSenior IP GmbH
Switzerland Fronwagplatz 10, CH-8200 Schaffhausen, Switzerland
Flexonics, Inc. USA Corporation Trust Center, 1209 Orange Street, Wilmington, DE 19801, USA
Senior Investments LLC USA Corporation Trust Center, 1209 Orange Street, Wilmington, DE 19801, USA
Senior US Holdings Inc USA Corporation Trust Center, 1209 Orange Street, Wilmington, DE 19801, USA
Upeca Engineering Sdn Bhd Malaysia 8.03, 8th Floor, Plaza First Nationwide, 161, Jalan Tun H.S. Lee, 50000 Kuala Lumpur, Malaysia
Upeca Technologies Sdn Bhd Malaysia 10th Floor, Menara Hap Seng, No.1 & 3 Jalan P. Ramlee, 50250 Kuala Lumpur, Malaysia
Upeca Valve Automation Sdn Bhd
Malaysia 8.03, 8th Floor, Plaza First Nationwide, 161, Jalan Tun H.S. Lee, 50000 Kuala Lumpur, Malaysia
Senior Aerospace and Flexonics Business Units in Mexico are operated by a third party under contract manufacturing agreements.
The Group has a 49% interest in Senior Flexonics Technologies (Wuhan) Limited, a jointly controlled entity incorporated in China.
All Group undertakings are wholly and directly owned by subsidiary undertakings of Senior plc, and in every case the principal country of operation is the country of incorporation.
GROUP UNDERTAKINGS CONTINUED

124 SENIOR PLC ANNUAL REPORT & ACCOUNTS 2017
ADDITIONAL INFORMATION
ANALYSIS OF SHAREHOLDERS AT 31 DECEMBER 2017Shareholders Issued shares
Number % Millions %
By categoryCorporate bodies 781 29.03 409.60 97.66Other shareholders 1,910 70.97 9.82 2.34
2,691 100.00 419.42 100.00By range of holdings1 – 24,999 2,298 85.40 8.15 1.9425,000 – 49,999 92 3.42 3.19 0.7650,000 – 249,999 132 4.91 15.40 3.67250,000 – 499,999 47 1.75 16.27 3.88500,000 – 999,999 42 1.56 31.42 7.491,000,000 – and over 80 2.96 344.99 82.26
2,691 100.00 419.42 100.00
The number of shares in issue at 31 December 2017 was 419,418,082.
Share RegistrarsAll shareholder records are maintained by Equiniti and all correspondence should be addressed to the Registrar, Senior plc at the Equiniti address shown on the inside back cover, quoting the reference number starting with 0228 detailed on your dividend vouchers. The registrar should be notified regarding changes to name or address, loss of share certificate, or request for, or change to, a dividend mandate.
Equiniti provides a range of shareholder information on-line. Shareholders can check their holdings, update details and obtain practical help on transferring shares at: shareview.co.uk.
Instead of payment by post to your registered address, dividends can be paid through the BACS system direct into a UK bank or building society account, with the dividend voucher still sent to your registered address. If you wish to use this facility and have not previously applied, please apply direct to Equiniti and request a dividend mandate form. Shareholders who are currently receiving duplicate sets of Company mailings, as a result of any inconsistency in name or address details, should write direct to Equiniti so holdings can be combined, if appropriate.
CREST proxy votingCREST members who wish to appoint a proxy or proxies through the CREST electronic proxy appointment service may do so for the Annual General Meeting to be held on 27 April 2018 and any adjournment(s) thereof by using the procedures described in the CREST manual. Further details relating to voting via CREST may be found on the 2018 AGM Notice of Meeting and Form of Proxy.
ADDITIONAL SHAREHOLDER INFORMATION
2018 FINANCIAL CALENDAR
OFFICERS AND ADVISERS
THE KEY EVENTS FOR SENIOR IN 2018 ARE SET OUT BELOWSome of the dates are indicative only and may be subject to change.
Monday 26 FebruaryAnnouncement of the 2017 Final Results.
Publication of the Annual Report & Accounts 2017 at www.seniorplc.com
Friday 9 MarchPublication of the Annual Report & Accounts 2017.
Friday 27 AprilAnnual General Meeting.
Thursday 3 MayShares ex-dividend for the 2017 final dividend.
Friday 4 MayRecord date for shareholders on register to receive 2017 final dividend.
SECRETARY AND REGISTERED OFFICEAndrew BodenhamSenior plc59/61 High Street, Rickmansworth, Hertfordshire WD3 1RH
Registered in England and Wales No. 00282772
REGISTRARSEquinitiAspect House, Spencer Road, Lancing, West Sussex BN99 6DA
AUDITORKPMG LLP15 Canada Square, London E14 5GL
SHAREGIFT If you have only a small number of shares which would cost more for you to sell than they are worth, you may wish to consider donating them to the charity ShareGift (Registered Charity 1052686) which specialises in accepting such shares as donations. The ShareGift Transfer Form may be obtained from Equiniti, the Company’s Registrars, at www.shareview.co.uk. There are no implications for Capital Gains Tax purposes (no gain or loss) on gifts of shares to charity and it is also possible to obtain income tax relief. Further information about ShareGift may be obtained on 020 7930 3737 or from www.ShareGift.org.
Thursday 31 MayPayment of the 2017 final dividend.
Monday 30 JulyAnnouncement of the 2018 interim results.
Thursday 1 NovemberShares ex-dividend for the 2018 interim dividend.
Friday 2 NovemberRecord date for shareholders on register to receive 2018 interim dividend.
Friday 30 NovemberPayment of the 2018 interim dividend.
SOLICITORSSlaughter and MayOne Bunhill Row, London EC1Y 8YY
PRINCIPAL UK CLEARING BANKERSLloyds Banking Group plc25 Gresham Street, London EC2V 7HN
FINANCIAL ADVISERSLazards & Co., Limited50 Stratton Street, London W1J 8LL
STOCKBROKERSJefferies Hoare GovettVintners Place68 Upper Thames StreetLondon EC4V 3BJ
Designed by Printed by Park Communications