semgroup earnings presentation q2 2015 (final)
TRANSCRIPT

SECOND QUARTER 2015 RESULTSEarnings Conference Call - August 7, 2015

Forward-looking InformationCertain matters contained in this presentation include "forward-looking statements" within the meaning of Section 27A of the Securities Act of 1933, asamended, and Section 21E of the Securities Exchange Act of 1934, as amended. We make these forward-looking statements in reliance on the safe harborprotections provided under the Private Securities Litigation Reform Act of 1995.
All statements, other than statements of historical fact, included in this presentation including the prospects of our industry, our anticipated financialperformance, our anticipated annual dividend growth rate, management's plans and objectives for future operations, planned capital expenditures, businessprospects, outcome of regulatory proceedings, market conditions and other matters, may constitute forward-looking statements. Although we believe that theexpectations reflected in these forward-looking statements are reasonable, we cannot assure you that these expectations will prove to be correct. Theseforward-looking statements are subject to certain known and unknown risks and uncertainties, as well as assumptions that could cause actual results to differmaterially from those reflected in these forward-looking statements. Factors that might cause actual results to differ include, but are not limited to, our ability togenerate sufficient cash flow from operations to enable us to pay our debt obligations or to fund our other liquidity needs; our ability to comply with thecovenants contained in the instruments governing our indebtedness and to maintain certain financial ratios required by our credit facilities; the effect of our debtlevel on our future financial and operating flexibility, including our ability to obtain additional capital; the ability of our subsidiary, Rose Rock Midstream L.P.(NYSE: RRMS), to make minimum quarterly distributions; the operations of NGL Energy Partners LP (NYSE: NGL), which we do not control; any sustainedreduction in demand for the petroleum products we gather, transport, process and store; our ability to obtain new sources of supply of petroleum products; ourfailure to comply with new or existing environmental laws or regulations or cross border laws or regulations; the possibility that the construction or acquisition ofnew assets may not result in the corresponding anticipated revenue increases; changes in currency exchange rates; cyber attacks involving our informationsystems and related infrastructure; the risks and uncertainties of doing business outside of the U.S., including political and economic instability and changes inlocal governmental laws, regulations and policies; and the possibility that our hedging activities may result in losses or may have a negative impact on ourfinancial results; as well as other risk factors discussed from time to time in each of our documents and reports filed with the SEC.
Readers are cautioned not to place undue reliance on any forward-looking statements contained in this presentation which reflect management's opinions onlyas of the date hereof. Except as required by law, we undertake no obligation to revise or publicly release the results of any revision to any forward-lookingstatements.
SemGroup and Rose Rock Midstream use their Investor Relations website and social media outlets as channels of distribution of material companyinformation. Such information is routinely posted and accessible on our Investor Relations websites at ir.semgroupcorp.com and ir.rrmidstream.com.
Both companies are present on Twitter and LinkedIn, follow us at the links below:
SemGroup Twitter and LinkedIn Rose Rock Midstream Twitter and LinkedIn
2

Non-GAAP Financial MeasuresSemGroupAdjusted EBITDA is presented in this presentation for certain periods. Adjusted EBITDA is not a U.S. generally accepted accounting principles (“GAAP”)measure and is not intended to be used in lieu of a GAAP presentation of net income (loss). Adjusted EBITDA is presented in this presentation becauseSemGroup believes it provides additional information with respect to its performance. Adjusted EBITDA represents earnings before interest, taxes, depreciationand amortization, adjusted for selected items that SemGroup believes impact the comparability of financial results between reporting periods. AlthoughSemGroup presents selected items that it considers in evaluating its performance, you should also be aware that the items presented do not represent all itemsthat affect comparability between the periods presented. Variations in SemGroup’s operating results are also caused by changes in volumes, prices, exchangerates, mechanical interruptions and numerous other factors. These types of variances are not separately identified in this presentation. Because all companiesdo not use identical calculations, SemGroup’s presentation of Adjusted EBITDA may be different from similarly titled measures of other companies, therebydiminishing its utility. Reconciliations of net income (loss) to Adjusted EBITDA for the periods presented are included in the appendix of this presentation.
Rose Rock Midstream
This presentation includes the non-GAAP financial measures of Adjusted gross margin, Adjusted EBITDA and distributable cash flow, which may be usedperiodically by management when discussing our financial results with investors and analysts. The appendix of this presentation provides reconciliations ofthese non-GAAP financial measures to their most directly comparable financial measures calculated and presented in accordance with GAAP. Adjusted grossmargin, Adjusted EBITDA and distributable cash flow are presented as management believes they provide additional information and metrics relative to theperformance of our business.
Operating income (loss) is the GAAP measure most directly comparable to Adjusted gross margin, net income (loss) and cash provided by (used in) operatingactivities are the GAAP measures most directly comparable to Adjusted EBITDA, and net income (loss) is the GAAP measure most directly comparable todistributable cash flow. Our non-GAAP financial measures should not be considered as alternatives to the most directly comparable GAAP financial measures.These non-GAAP financial measures have important limitations as analytical tools because they exclude some, but not all, items that affect the most directlycomparable GAAP financial measures. You should not consider Adjusted gross margin, Adjusted EBITDA or distributable cash flow in isolation or as substitutesfor analysis of our results as reported under GAAP. Because Adjusted gross margin, Adjusted EBITDA and distributable cash flow may be defined differently byother companies in our industry, our definitions of these non-GAAP financial measures may not be comparable to similarly titled measures of other companies,thereby diminishing their utility.
Management compensates for the limitation of Adjusted gross margin, Adjusted EBITDA and distributable cash flow as analytical tools by reviewing thecomparable GAAP measures, understanding the differences between Adjusted gross margin, Adjusted EBITDA and distributable cash flow, on the one hand,and operating income (loss), net income (loss) and net cash provided by (used in) operating activities, on the other hand, and incorporating this knowledge intoits decision-making processes. We believe that investors benefit from having access to the same financial measures that our management uses in evaluatingour operating results.
3

Adjusted EBITDA(1)
2Q 2015 1Q 2015 2015 GuidanceSemGroup(2) $80.0 million $70.0 million $320 - $360 millionRose Rock Midstream(3) $44.7 million $42.1 million $180 - $200 million
Second Quarter 2015 Results
(1) Non-GAAP Financial Data Reconciliations are included in the Appendix to this presentation(2) SemGroup includes fully consolidated Rose Rock Midstream (3) Prior period financial information has been recast to reflect the effects of the dropdown of the Wattenberg Oil Trunkline(4) CAGR is based on the midpoint of 2015 Adjusted EBITDA Guidance4
$400
$300
$200
$1002011 2012 2013 2014 2015E
SEMG Adjusted EBITDA(1)
(in millions)
31% CAGR(4)
$116$135
$189
$320-$360
$287
$200
$150
$100
$50
$02011 2012 2013 2014 2015E
RRMS Adjusted EBITDA(1)
(in millions)
53% CAGR(4)
$35 $40$69
$180-$200
$128

Business Segment Growth Update
5
Crude¬ Platteville truck unloading expansion
¬ White Cliffs Pipeline expansion - Expected completion October 2015– 65,000 bpd incremental capacity
¬ Isabel Pipeline - Expected completion 1Q 2016– 8-inch, 48 mile crude oil pipeline from Isabel Junction, KS to Alva, OK; connect Kansas barrels to Glass Mountain Pipeline
¬ Maurepas Pipeline - Expected completion 4Q 2016– 90% of planning process complete
– Majority of Right-of-Way acquired, permits in process and major equipment has been ordered– Pipeline construction scheduled to begin October 2015
SemGas¬ Rose Valley II plant - Completed July 2015
– 200 mmcf/d increase in processing capacity
SemCams ¬ Northwest Wapiti Pipeline Loop - Completed June 2015
– 8-inch, 21-mile pipeline terminating at SemCAMS' K3 plant supported by 10-year agreement with NuVista ¬ Wapiti Pipeline Compressor - Expected completion 2Q 2016
– 30 mmcf/d incremental capacity supported by 10-year agreement with NuVista¬ KA Plant condensate project - Duvernay production
– Finalizing contract terms
Prior to June 2015July 2015
4 Bay ExpansionOctober 2015
10 Bay ExpansionTotal truck unloading bays 16 Bays 20 Bays 30 BaysWhite Cliffs Pipeline committed volumes5-year take or pay contract - $5.20 per barrel 41,900 bpd(1) 48,500 bpd 72,000 bpd
(1) Initial contracts commenced August 2014

SemGroup Corporation 2015 Capital Expenditure Guidance
2015 Capital Expenditures – $775 million(1)
6
¬ More than 90% of capital expendituresare focused on growth capital
¬ Targeting EBITDA multiples of 5-8x onorganic growth projects in key assetplays
¬ Maintenance and regulatory capitalfocused on pipeline integrity andSemLogistics tank refurbishments
n Natural Gasn Cruden Other Growth Projectsn Maintenance and Regulatory
$450
34%
58%
1%
7%
$265
$5
$55
(1) Includes Rose Rock Midstream and approximately $70 million carry-over from 2014 related to timing of spendExcludes drop down transactions and potential future acquisitions
__

SemGroup Corporation 2015 Capital Expenditure Guidance
7
(1) Investment in affiliate; reflects our proportional capex
(in millions)
Total CapexSegment Description
Estimated Completion
Date 2015 Capex 2016 Capex
Crude-SEMG Maurepas Pipeline 4Q 2016 260 220 500
Crude-RRMS White Cliffs Pipeline capacity expansion(1) October 2015 35 5 40
Crude-RRMS Isabel Pipeline 1Q 2016 30 5 35
Crude-RRMS Platteville truck unloading expansion varies 30 — 30
Crude-RRMS Wattenberg Oil Trunkline extension 1Q 2015 30 — 30
SemGas Northern Oklahoma gas gathering & processing expansion varies 125 100 225
SemCAMS Wapiti Pipeline Expansion varies 45 10 55
SemCAMS K3 Plant projects varies 25 10 35
SemCAMS KA Plant projects varies 45 20 65
Other/undesignated growth projects varies 95 145
Maintenance, refurbishment & regulatory 55 35
Total $775 $500-$600
More than $1.3 Billion of Growth Capital in 2015-2016

SemGroup Second Quarter 2015 Results
(1) Non-GAAP Financial Data Reconciliations are included in the Appendix to this presentation(2) Crude segment includes fully consolidated Rose Rock Midstream
Key Highlights (2Q 2015 vs 1Q 2015)¬ Crude increased $2.2 million
– $6.4 million increase in marketing related to higher margins and volumes– $3.5 million decrease in equity earnings driven by lower volumes on White Cliffs Pipeline– $1.0 million increase in operating expenses net of field services
¬ SemGas increased $4.3 million– Increase from higher gathering and processing volumes was partially offset by higher operating expenses
¬ SemLogistics increased $1.2 million– Increase due to higher storage demand
Segment Adjusted EBITDA(1) (in millions, unaudited) 2Q 2015 1Q 2015Crude(2) $ 43.8 $ 41.6SemGas 19.4 15.1SemCAMS 8.5 8.4SemLogistics 2.2 1.0SemMaterials Mexico 5.3 5.3SemStream 4.5 5.0Corporate and Other (3.7) (6.4)
Total Adjusted EBITDA $ 80.0 $ 70.0
8

SemGroup Capitalization & Liquidity
9
Conservative leverage ratioprovides financial flexibility
Target consolidated NetDebt / Adjusted EBITDA of
3.5x or better
Available liquidity to fundfuture growth opportunities
(in millions, unaudited) June 30, 2015 December 31, 2014Total Consolidated Debt $ 1,044 $ 767Owner's Equity 1,272 1,219Total Book Capitalization $ 2,316 $ 1,986Consolidated Credit MetricsNet Debt $ 815 $ 726Total Debt/Capitalization 45% 39%Net Debt/Adjusted EBITDA LTM 2.6x 2.5xCommitted LiquidityCash and Cash Equivalents $ 229 $ 41Revolver Availability(1)
SemGroup 496 461Rose Rock Midstream 560 536
Total Liquidity $ 1,285 $ 1,038
(1) Availability reduced by outstanding letters of credit

Rose Rock Midstream Second Quarter 2015 Results
Key Highlights (2Q 2015 vs 1Q 2014)
Adjusted EBITDA increased $2.6 million
¬ $4.4 million increase in marketing related to higher margins and volumes
¬ $3.1 million increase in cash distributions from Glass Mountain Pipeline
¬ $3.6 million decrease in cash distributions from White Cliffs Pipeline
¬ $1.0 million increase in operating expenses net of field services
As Reported (in millions, unaudited) 2Q 2015 1Q 2015
Adjusted EBITDA(1) $ 44.7 $ 42.1
(1) Non-GAAP Financial Data Reconciliations are included in the Appendix to this presentation
10

Rose Rock Midstream 2015 Capital Expenditure Guidance
2015 Capital Expenditures – $185 million(1)
11
(1) Excludes any drop downs from SemGroup or other potential acquisitions(2) Investment in affiliate; reflects our proportional capex
(in millions) Estimated Completion
DateTotal
CapexDescription 2015 Capex 2016 Capex
White Cliffs Pipeline capacity expansion(2) October 2015 35 5 40
Isabel Pipeline 1Q 2016 30 5 35
Platteville truck unloading expansion varies 30 — 30
Wattenberg Oil Trunkline extension 1Q 2015 30 — 30
Other/undesignated growth projects 50 —
Maintenance 10 10
Total $185
n Growth
n Maintenance95%
$105%
$175

Rose Rock Midstream Capitalization & Liquidity
12
Available balance sheetcapacity to fund acquisitionsand drop down transactions
Net Debt / Adjusted EBITDAtarget of 4.0x or better
(in millions, unaudited) June 30, 2015 December 31, 2014(1)
Total Debt $ 744 $ 432Total Equity 271 308Total Book Capitalization $ 1,015 $ 740Credit MetricsNet Debt $ 676 $ 428Total Debt/Capitalization 73% 58%Net Debt/Adjusted EBITDA LTM(2) 4.1x 3.1xCommitted LiquidityCash and Cash Equivalents $ 68 $ 4
Revolver Availability(3) 560 536Total Liquidity $ 628 $ 540
(1) Prior period financial information has been recast to reflect the effects of the dropdown of the Wattenberg Oil Trunkline (2) June 30, 2015 includes EBITDA related to the dropdown of 50% interest in Glass Mountain Pipeline and both June 30, 2015
and December 31, 2014 include EBITDA related to the dropdown of the final one-third interest in SemCrude Pipeline(3) Availability reduced by outstanding letters of credit

Growing today with a focus for tomorrow
Safety
13
Crude StorageOklahoma
DisciplinedInvestment Execution Increase Equity
Holders Return
SemGas Rose Valley PlantOklahoma
SemCAMS K3 PlantsCanada

APPENDIX

SemGroup’s Fee-based Business Model
15
Margin Descriptions
¬ Fixed Fee– Storage fees– Transportation fees– Unloading fees– Gathering and processing fees
¬ Variable Fee– Gas processing – percent ofproceeds
¬ Marketing– Back-to-back marketingand blending transactions
(1) LTM June 30, 2015(2) SemGas 2Q 2015 margin contribution 70% fixed fee, 30% variable fee(3) Rose Rock Midstream includes White Cliffs cash distributions resulting from 51% ownership(4) Marketing margin reduced by intercompany trucking expense
Fixed Fee Variable Fee MarketingSemGas(2) 69% 31%SemCAMS 100%SemLogistics 100%SemMaterials Mexico 100%White Cliffs Pipeline 100%Rose Rock Midstream(3)(4) 85% 15%
Margin Contribution(1)
n Fixed Fee n Variable Fee n Marketing
88%
6%6%

320
240
160
80
0
4Q 1Q 2Q 3Q 4Q 1Q 2Q
57.1 67.3 64.9 65.2 71.8 65.3 69.1
77.4 72.7 74.1 98.5 118.4 139.2 121.3
43.7 61.761.1
65.264.9 71.8
2013 2014 2015
120
90
60
30
0
4Q 1Q 2Q 3Q 4Q 1Q 2Q
48.7 49.6 39.3 51.568.7 75.4
100.2
2013 2014 2015
100
75
50
25
0
4Q 1Q 2Q 3Q 4Q 1Q 2Q
30.9 42.7 46.175.0 85.6 76.8
93.2
2013 2014 2015
Crude Key Performance Metrics
16
(1) 100% of storage contract volumes are included in year of contract expiration(2) Pipeline volumes include KS/OK system, ND transportation and Tampa pipeline(3) White Cliffs Pipeline is owned 51% by RRMS; reflects 100% throughput(4) Glass Mountain Pipeline is owned 50% by RRMS; average volumes for 1Q 2014 for two months operational; reflects
100% throughput (5) Includes intercompany trucking volumes
Crude Transportation Volumes(Thousand Barrels per Day)
Crude Marketing Volumes(Thousand Barrels per Day)
8
6
4
2
0
2015 2016 2017 2018
n Pipeline Volumes(2) n White Cliffs PL(3) n Wattenberg Oil Trunkline n Glass Mountain PL(4)
Crude Cushing Storage 7.6 million Barrels Capacity
6.50 6.004.65
3.15
Field Services Transportation Volumes(5)
(Thousand Barrels per Day)
n Contracted(1) n Operational / Marketing n Uncontracted
1.10
1.101.10
1.103.35
1.85
0.50
28.526.611.031.2
35.245.8 50.0

SemCAMS Avg Throughput Volume (mmcf/d)
500
400
300
200
100
0
4Q 1Q 2Q 3Q 4Q 1Q 2Q
272.6 285.8148.2
274.2340.1 302.5 288.8
146.9 152.6
186.1
138.397.9
91.9 96.6
2013 2014 2015
SemGas Northern OK Avg Processed Volume (mmcf/d)
Capacity Processing Volumes
400
300
200
100
0
4Q 1Q 2Q 3Q 4Q 1Q 2Q
156.9 167.7251.4
315.9 355.9 369.0 384.2
2013 2014 2015
Natural Gas Business
17
n K3 Plant n KA Plant
419.5 438.4
334.3412.5 438.0
394.4 385.3

2015 Target Dividend Growth 50-60% year-over-year
$0.5500
$0.4500
$0.3500
$0.2500
$0.1500
4Q 1Q 2Q 3Q 4Q 1Q 2Q 4QE
$0.2200$0.2400
$0.2700$0.3000
$0.3400
$0.3800
$0.4200
SemGroup Corporation Dividend Growth(1)
Target 30-40% Annual Dividend Growth through 2017
18
¬ Current dividend policy is to passthrough the after-tax cashdistributions received from our MLPinvestments
Increased second quarter 2015dividend by approximately 11% overprior quarter
2013 2014 2015
(1) Assumes no further drop downs or acquisitions
¬
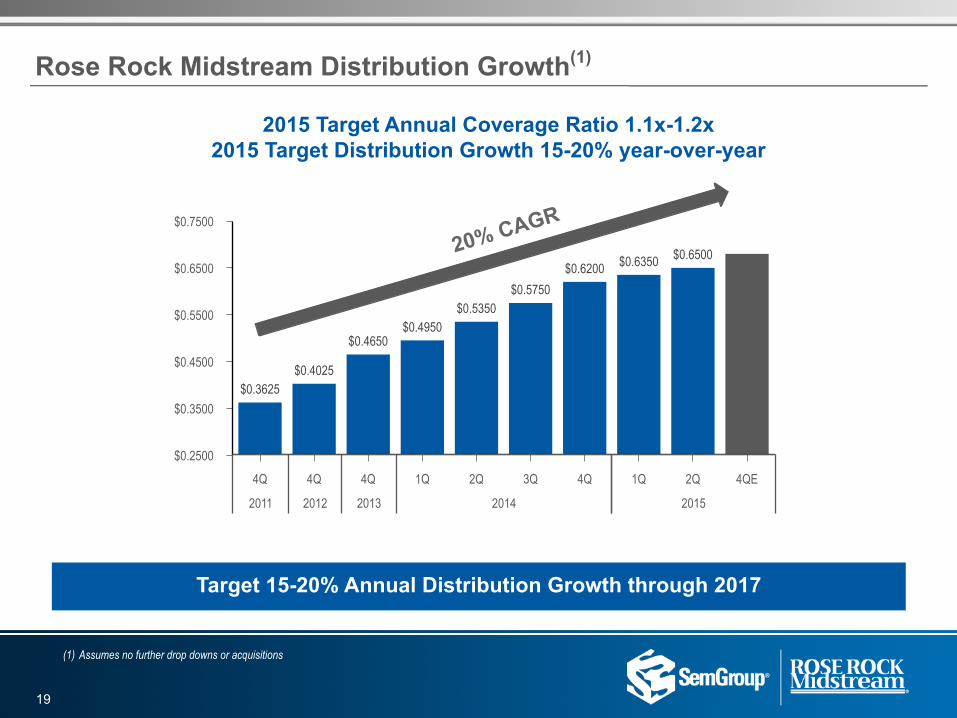
2015 Target Annual Coverage Ratio 1.1x-1.2x2015 Target Distribution Growth 15-20% year-over-year
$0.7500
$0.6500
$0.5500
$0.4500
$0.3500
$0.2500
4Q 4Q 4Q 1Q 2Q 3Q 4Q 1Q 2Q 4QE
$0.3625$0.4025
$0.4650$0.4950
$0.5350$0.5750
$0.6200 $0.6350 $0.6500
2011 2012 2013 2014 2015
Rose Rock Midstream Distribution Growth(1)
Target 15-20% Annual Distribution Growth through 2017
19
(1) Assumes no further drop downs or acquisitions
20% CAGR

SemGroup Consolidated Balance Sheets
20
(in thousands, unaudited, condensed) June 30, 2015
December 31, 2014
ASSETSCurrent assets $ 695,157 $ 479,280Property, plant and equipment, net 1,420,194 1,256,825Goodwill and other intangible assets 225,712 231,391Equity method investments 548,831 577,920Other noncurrent assets, net 59,495 44,386Total assets $ 2,949,389 $ 2,589,802
LIABILITIES AND OWNERS' EQUITYCurrent liabilities:
Current portion of long-term debt $ 44 $ 40Other current liabilities 420,101 391,622
Total current liabilities 420,145 391,662
Long-term debt, excluding current portion 1,044,339 767,092Other noncurrent liabilities 213,270 211,611Total liabilities 1,677,754 1,370,365
Total owners' equity 1,271,635 1,219,437Total liabilities and owners' equity $ 2,949,389 $ 2,589,802

SemGroup Consolidated Statements of Operations and Comprehensive Income
21
(in thousands, except per share amounts, unaudited) Three Months Ended Six Months EndedJune 30, March 31, June 30,
2015 2014 2015 2015 2014Revenues $ 377,226 $ 482,224 $ 298,310 $ 675,536 $ 981,107Expenses:
Costs of products sold, exclusive of depreciation and amortization shown below 244,158 368,527 192,072 436,230 753,640
Operating 60,800 59,424 53,090 113,890 110,202General and administrative 22,917 21,850 32,310 55,227 40,586Depreciation and amortization 24,674 22,062 23,734 48,408 45,699Loss on disposal or impairment of long-lived assets, net 1,372 19,315 1,058 2,430 19,257Total expenses 353,921 491,178 302,264 656,185 969,384
Earnings from equity method investments 23,903 19,187 20,559 44,462 34,149Gain on issuance of common units by equity method investee 5,897 — — 5,897 8,127Operating income 53,105 10,233 16,605 69,710 53,999Other expenses, net 9,809 29,489 6,087 15,896 36,986Income (loss) from continuing operations before income taxes 43,296 (19,256) 10,518 53,814 17,013Income tax expense (benefit) 14,861 (6,672) 4,742 19,603 9,854Income (loss)from continuing operations 28,435 (12,584) 5,776 34,211 7,159Loss from discontinued operations, net of income taxes (2) — — (2) (5)Net income (loss) 28,433 (12,584) 5,776 34,209 7,154
Less: net income attributable to noncontrolling interests 5,136 5,025 4,310 9,446 11,250Net income (loss) attributable to SemGroup Corporation $ 23,297 $ (17,609) $ 1,466 $ 24,763 $ (4,096)Net income (loss) attributable to SemGroup Corporation $ 23,297 $ (17,609) $ 1,466 $ 24,763 $ (4,096)Other comprehensive income (loss), net of income taxes 5,520 6,685 (9,060) (3,540) 3,713Comprehensive income (loss) attributable to SemGroup Corporation $ 28,817 $ (10,924) $ (7,594) $ 21,223 $ (383)
Net income (loss) per common shareBasic $ 0.53 $ (0.41) $ 0.03 $ 0.57 $ (0.10)Diluted $ 0.53 $ (0.41) $ 0.03 $ 0.56 $ (0.10)
Weighted average shares (thousands):Basic 43,798 42,682 43,717 43,758 42,657Diluted 44,013 42,682 43,940 43,975 42,657

SemGroup Non-GAAP Adjusted EBITDA Calculation
22
(in thousands, unaudited) Three Months Ended Six Months EndedJune 30, March 31, June 30,
Reconciliation of net income to Adjusted EBITDA: 2015 2014 2015 2015 2014Net income (loss) $ 28,433 $ (12,584) $ 5,776 $ 34,209 $ 7,154
Add: Interest expense 16,822 10,360 14,591 31,413 19,587Add: Income tax expense (benefit) 14,861 (6,672) 4,742 19,603 9,854Add: Depreciation and amortization expense 24,674 22,062 23,734 48,408 45,699
EBITDA 84,790 13,166 48,843 133,633 82,294Selected Non-Cash Items and
Other Items Impacting Comparability (4,764) 44,361 21,139 16,375 42,515Adjusted EBITDA $ 80,026 $ 57,527 $ 69,982 $ 150,008 $ 124,809
Selected Non-Cash Items andOther Items Impacting ComparabilityLoss on disposal or impairment of long-lived assets, net $ 1,372 $ 19,315 $ 1,058 $ 2,430 $ 19,257Loss from discontinued operations, net of income taxes 2 — — 2 5Foreign currency transaction (gain) loss (295) 167 (519) (814) (516)Remove NGL equity earnings including gain on issuance of common units (12,117) (4,968) 305 (11,812) (16,686)Remove gain on sale of NGL units (6,623) — (7,894) (14,517) —NGL cash distribution 4,468 5,671 5,015 9,483 11,012M&A transaction related costs — — 10,000 10,000 —Inventory valuation adjustments including equity method investees 48 — 1,187 1,235 —Employee severance expense 21 20 — 21 29Unrealized loss (gain) on derivative activities (1,415) (851) 2,645 1,230 (245)Change in fair value of warrants — 18,929 — — 17,949Depreciation and amortization included within
equity earnings 6,346 4,251 6,376 12,722 7,701Bankruptcy related expenses 2 661 189 191 877Recovery of receivables written off at emergence — (300) — — (664)Non-cash equity compensation 3,427 1,466 2,777 6,204 3,796Selected Non-Cash items and
Other Items Impacting Comparability $ (4,764) $ 44,361 $ 21,139 $ 16,375 $ 42,515

SemGroup 2015 Adjusted EBITDA Guidance
23
(1) Guidance is on a cash basis for equity investments in NGL, includes fully consolidated Rose Rock Midstream
(in millions, unaudited) 2015 Guidance(1)
Mid-point
Net income $ 97.5
Add: Interest expense 72.0
Add: Income tax expense 14.0
Add: Depreciation and amortization 109.0
EBITDA $ 292.5
Selected Non-Cash and Other Items Impacting Comparability 47.5Adjusted EBITDA $ 340.0
Selected Non-Cash and Other Items Impacting Comparability
Depreciation and amortization included within equity earnings 25.0
Non-cash equity compensation 12.5
M&A related transaction costs 10.0
Selected Non-Cash and Other Items Impacting Comparability $ 47.5

Crude Segment Adjusted EBITDA Calculation
24
(1) Crude segment includes fully consolidated Rose Rock Midstream
(in thousands, unaudited) Three Months Ended SIx Months EndedJune 30, March 31, June 30,
2015 2014 2015 2015 2014Net income(1) $ 13,954 $ 14,076 $ 9,662 $ 23,616 $ 28,232
Add: Interest expense 13,088 5,200 10,646 23,734 9,863Add: Depreciation and amortization expense 10,608 7,276 10,143 20,751 18,758
EBITDA 37,650 26,552 30,451 68,101 56,853Selected Non-Cash Items and
Other Items Impacting Comparability 6,134 3,731 11,150 17,284 8,542Adjusted EBITDA $ 43,784 $ 30,283 $ 41,601 $ 85,385 $ 65,395
Selected Non-Cash Items and Other Items Impacting Comparability
Loss (gain) on disposal of long-lived assets, net $ (79) $ (27) $ 152 $ 73 $ (61)Employee severance expense 21 — — 21 9Unrealized loss (gain) on derivative activities (1,415) (851) 2,645 1,230 (245)Depreciation and amortization included within
equity earnings 6,346 4,251 6,376 12,722 7,701Inventory valuation adjustments including equity method investees 48 — 1,187 1,235 —Non-cash equity compensation 1,213 358 790 2,003 1,138Selected Non-Cash items and
Other Items Impacting Comparability $ 6,134 $ 3,731 $ 11,150 $ 17,284 $ 8,542
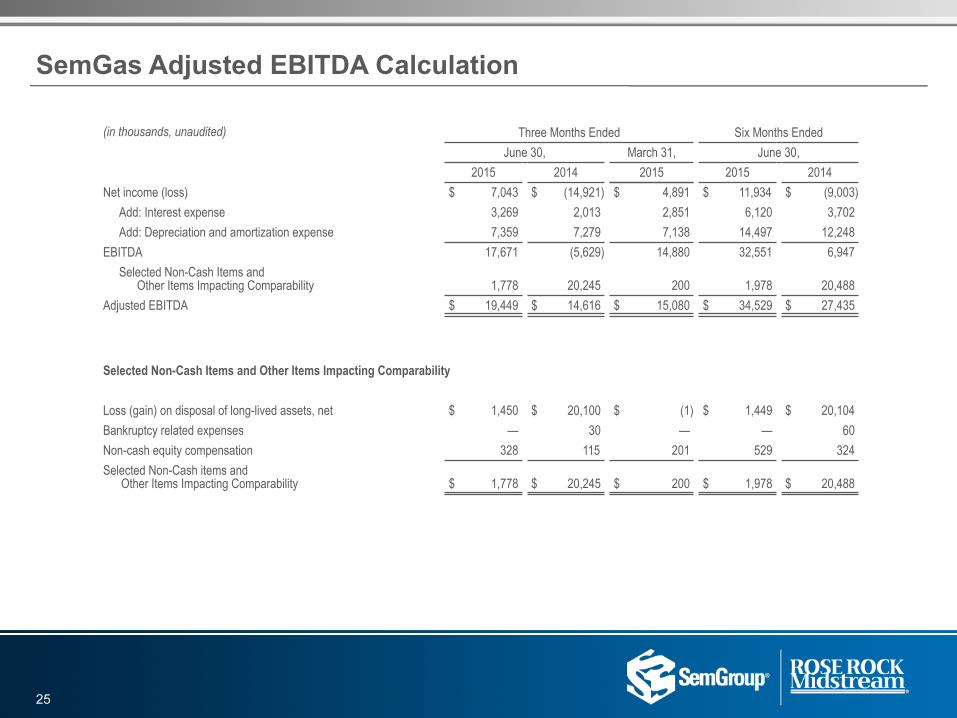
SemGas Adjusted EBITDA Calculation
25
(in thousands, unaudited) Three Months Ended Six Months EndedJune 30, March 31, June 30,
2015 2014 2015 2015 2014Net income (loss) $ 7,043 $ (14,921) $ 4,891 $ 11,934 $ (9,003)
Add: Interest expense 3,269 2,013 2,851 6,120 3,702Add: Depreciation and amortization expense 7,359 7,279 7,138 14,497 12,248
EBITDA 17,671 (5,629) 14,880 32,551 6,947Selected Non-Cash Items and
Other Items Impacting Comparability 1,778 20,245 200 1,978 20,488Adjusted EBITDA $ 19,449 $ 14,616 $ 15,080 $ 34,529 $ 27,435
Selected Non-Cash Items and Other Items Impacting Comparability
Loss (gain) on disposal of long-lived assets, net $ 1,450 $ 20,100 $ (1) $ 1,449 $ 20,104Bankruptcy related expenses — 30 — — 60Non-cash equity compensation 328 115 201 529 324Selected Non-Cash items and
Other Items Impacting Comparability $ 1,778 $ 20,245 $ 200 $ 1,978 $ 20,488

SemCAMS Adjusted EBITDA Calculation
26
(in thousands, unaudited) Three Months Ended Six Months EndedJune 30, March 31, June 30,
2015 2014 2015 2015 2014Net income $ 915 $ 4,812 $ 1,199 $ 2,114 $ 7,294
Add: Interest expense 3,117 3,761 3,112 6,229 7,951Add: Income tax expense (benefit) 616 (3,253) 551 1,167 (1,149)Add: Depreciation and amortization expense 3,187 3,079 3,066 6,253 5,908
EBITDA 7,835 8,399 7,928 15,763 20,004Selected Non-Cash Items and
Other Items Impacting Comparability 697 (413) 424 1,121 (360)Adjusted EBITDA $ 8,532 $ 7,986 $ 8,352 $ 16,884 $ 19,644
Selected Non-Cash Items and Other Items Impacting Comparability
Foreign currency transaction (gain) loss $ 145 $ 14 $ (44) $ 101 $ (22)Gain on disposal of long-lived assets, net — (915) — — (915)Recovery of receivables written off at emergence — (300) — — (664)Non-cash equity compensation 552 788 468 1,020 1,241Selected Non-Cash items and
Other Items Impacting Comparability $ 697 $ (413) $ 424 $ 1,121 $ (360)

SemLogistics Adjusted EBITDA Calculation
27
(in thousands, unaudited) Three Months Ended Six Months EndedJune 30, March 31, June 30,
2015 2014 2015 2015 2014Net income (loss) $ 103 $ 1,653 $ (1,926) $ (1,823) $ (42)
Add: Interest expense 443 362 465 908 711Add: Income tax expense (benefit) 167 (410) (369) (202) (527)Add: Depreciation and amortization expense 2,154 2,555 2,040 4,194 5,050
EBITDA 2,867 4,160 210 3,077 5,192Selected Non-Cash Items and
Other Items Impacting Comparability (674) (3,781) 805 131 (3,743)Adjusted EBITDA $ 2,193 $ 379 $ 1,015 $ 3,208 $ 1,449
Selected Non-Cash Items and Other Items Impacting Comparability
Loss from discontinued operations, net of income taxes $ — $ — $ — $ — $ 4Gain on disposal of long-lived assets, net — (3,634) — — (3,634)Foreign currency transaction (gain) loss (873) (277) 651 (222) (373)Non-cash equity compensation 199 130 154 353 260Selected Non-Cash items and
Other Items Impacting Comparability $ (674) $ (3,781) $ 805 $ 131 $ (3,743)

SemMaterials México Adjusted EBITDA Calculation
28
(in thousands, unaudited) Three Months Ended Six Months EndedJune 30, March 31, June 30,
2015 2014 2015 2015 2014Net income $ 3,199 $ 465 $ 3,011 $ 6,210 $ 3,050
Add: Interest expense 2 66 — 2 66Add: Income tax expense 764 1,040 990 1,754 2,042Add: Depreciation and amortization expense 1,037 1,456 1,053 2,090 2,883
EBITDA 5,002 3,027 5,054 10,056 8,041Selected Non-Cash Items and
Other Items Impacting Comparability 260 (4) 219 479 79Adjusted EBITDA $ 5,262 $ 3,023 $ 5,273 $ 10,535 $ 8,120
Selected Non-Cash Items and Other Items Impacting Comparability
Gain on disposal of long-lived assets, net $ — $ — $ (19) $ (19) $ (28)Foreign currency transaction loss (gain) 94 (70) 131 225 (60)Non-cash equity compensation 166 66 107 273 167Selected Non-Cash items and
Other Items Impacting Comparability $ 260 $ (4) $ 219 $ 479 $ 79

SemStream Adjusted EBITDA Calculation
29
(in thousands, unaudited) Three Months Ended Six Months EndedJune 30, March 31, June 30,
2015 2014 2015 2015 2014Net income $ 20,064 $ 6,297 $ 8,908 $ 28,972 $ 19,166
Add: Interest expense (1,336) (1,277) (1,322) (2,658) (2,541)EBITDA 18,728 5,020 7,586 26,314 16,625
Selected Non-Cash Items and Other Items Impacting Comparability (14,271) 692 (2,574) (16,845) (5,672)
Adjusted EBITDA $ 4,457 $ 5,712 $ 5,012 $ 9,469 $ 10,953
Selected Non-Cash Items and Other Items Impacting Comparability
Remove NGL equity earnings including gain on issuance ofcommon units $ (12,117) $ (4,968) $ 305 (11,812) (16,686)Remove gain on sale of NGL units (6,623) — (7,894) (14,517) —NGL cash distribution 4,468 5,671 5,015 9,483 11,012Non-cash equity compensation 1 (11) — 1 2Selected Non-Cash items and
Other Items Impacting Comparability $ (14,271) $ 692 $ (2,574) $ (16,845) $ (5,672)

SemGroup Corporate & Other Adjusted EBITDA Calculation
30
(in thousands, unaudited) Three Months Ended Six Months EndedJune 30, March 31, June 30,
2015 2014 2015 2015 2014
Net loss $ (16,845) $ (25,591) $ (19,969) $ (36,814) $ (41,543)Add: Interest expense (1,761) 235 (1,161) (2,922) (165)Add: Income tax expense (benefit) 13,314 (3,420) 3,570 16,884 9,488Add: Depreciation and amortization expense 329 417 294 623 852
EBITDA (4,963) (28,359) (17,266) (22,229) (31,368)
Selected Non-Cash Items and Other Items Impacting Comparability 1,312 23,891 10,915 12,227 23,181
Adjusted EBITDA $ (3,651) $ (4,468) $ (6,351) $ (10,002) $ (8,187)
Selected Non-Cash Items and Other Items Impacting Comparability
Loss from discontinued operations, net of income taxes $ 2 $ — $ — $ 2 $ 1Loss on disposal or impairment of long-lived assets, net 1 3,791 926 927 3,791Foreign currency transaction loss (gain) 339 500 (1,257) (918) (61)Employee severance expense — 20 — — 20M&A transaction related costs — — 10,000 10,000 —Change in fair value of warrants — 18,929 — — 17,949Bankruptcy related expenses 2 631 189 191 817Non-cash equity compensation 968 20 1,057 2,025 664
Selected Non-Cash items andOther Items Impacting Comparability $ 1,312 $ 23,891 $ 10,915 $ 12,227 $ 23,181

Rose Rock Midstream Consolidated Balance Sheet
31
(in thousands, unaudited, condensed) June 30, 2015
December 31,2014(1)
ASSETS
Current assets $ 408,520 $ 274,769
Property, plant and equipment, net 419,458 396,066
Equity method investment 426,058 269,635
Other noncurrent assets, net 69,802 65,793Total assets $ 1,323,838 $ 1,006,263
LIABILITIES AND PARTNERS' CAPITAL
Current liabilities $ 308,116 $ 265,682
Long-term debt 744,339 432,092
Total liabilities 1,052,455 697,774
Partners’ capital 271,383 308,489Total liabilities and partners' capital $ 1,323,838 $ 1,006,263
(1) Prior period financial information has been recast to reflect the effects of the dropdown of the Wattenberg Oil Trunkline
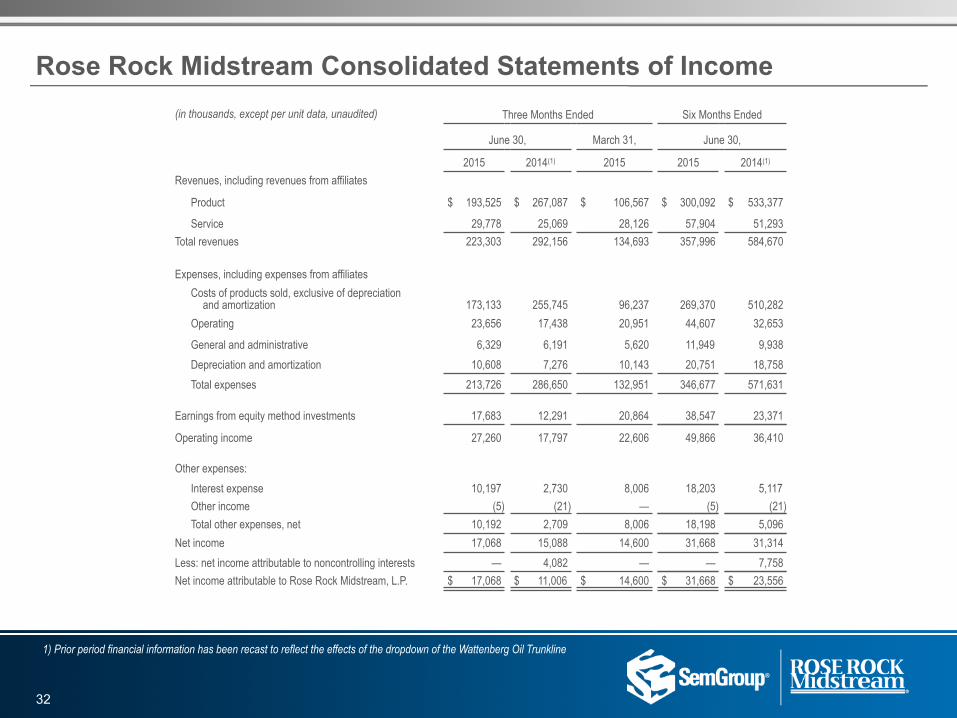
Rose Rock Midstream Consolidated Statements of Income
32
(in thousands, except per unit data, unaudited) Three Months Ended Six Months Ended
June 30, March 31, June 30,
2015 2014(1) 2015 2015 2014(1)
Revenues, including revenues from affiliates
Product $ 193,525 $ 267,087 $ 106,567 $ 300,092 $ 533,377
Service 29,778 25,069 28,126 57,904 51,293Total revenues 223,303 292,156 134,693 357,996 584,670
Expenses, including expenses from affiliatesCosts of products sold, exclusive of depreciation
and amortization 173,133 255,745 96,237 269,370 510,282Operating 23,656 17,438 20,951 44,607 32,653
General and administrative 6,329 6,191 5,620 11,949 9,938Depreciation and amortization 10,608 7,276 10,143 20,751 18,758Total expenses 213,726 286,650 132,951 346,677 571,631
Earnings from equity method investments 17,683 12,291 20,864 38,547 23,371
Operating income 27,260 17,797 22,606 49,866 36,410
Other expenses:Interest expense 10,197 2,730 8,006 18,203 5,117Other income (5) (21) — (5) (21)Total other expenses, net 10,192 2,709 8,006 18,198 5,096
Net income 17,068 15,088 14,600 31,668 31,314Less: net income attributable to noncontrolling interests — 4,082 — — 7,758Net income attributable to Rose Rock Midstream, L.P. $ 17,068 $ 11,006 $ 14,600 $ 31,668 $ 23,556
1) Prior period financial information has been recast to reflect the effects of the dropdown of the Wattenberg Oil Trunkline
(in thousands, except per unit data, unaudited) Three Months Ended Six Months Ended
June 30, March 31, June 30,2015 2014(1) 2015 2015 2014(1)
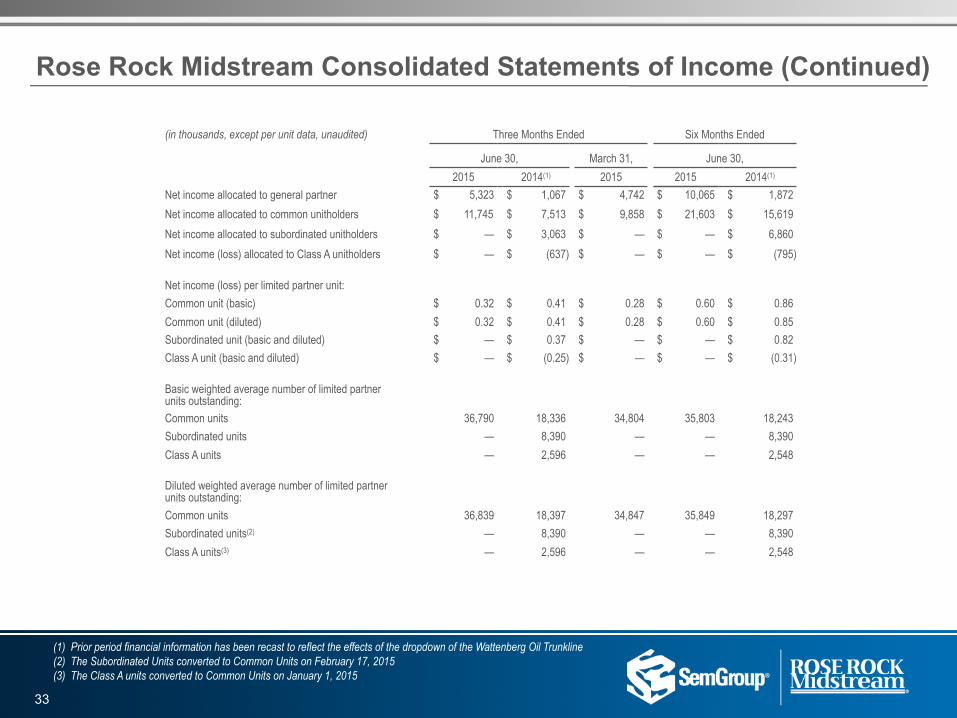
Net income allocated to general partner $ 5,323 $ 1,067 $ 4,742 $ 10,065 $ 1,872Net income allocated to common unitholders $ 11,745 $ 7,513 $ 9,858 $ 21,603 $ 15,619Net income allocated to subordinated unitholders $ — $ 3,063 $ — $ — $ 6,860Net income (loss) allocated to Class A unitholders $ — $ (637) $ — $ — $ (795)
Net income (loss) per limited partner unit:Common unit (basic) $ 0.32 $ 0.41 $ 0.28 $ 0.60 $ 0.86Common unit (diluted) $ 0.32 $ 0.41 $ 0.28 $ 0.60 $ 0.85Subordinated unit (basic and diluted) $ — $ 0.37 $ — $ — $ 0.82Class A unit (basic and diluted) $ — $ (0.25) $ — $ — $ (0.31)
Basic weighted average number of limited partnerunits outstanding:Common units 36,790 18,336 34,804 35,803 18,243Subordinated units — 8,390 — — 8,390Class A units — 2,596 — — 2,548
Diluted weighted average number of limited partnerunits outstanding:Common units 36,839 18,397 34,847 35,849 18,297Subordinated units(2) — 8,390 — — 8,390Class A units(3) — 2,596 — — 2,548
Rose Rock Midstream Consolidated Statements of Income (Continued)
33
(1) Prior period financial information has been recast to reflect the effects of the dropdown of the Wattenberg Oil Trunkline(2) The Subordinated Units converted to Common Units on February 17, 2015(3) The Class A units converted to Common Units on January 1, 2015

Rose Rock Midstream Non-GAAP Financial Data Reconciliations
34
(in thousands, unaudited) Three Months Ended Six Months EndedJune 30, March 31, June 30,
2015 2014(1) 2015 2015 2014(1)
Reconciliation of operating income to Adjusted gross margin:Operating income $ 27,260 $ 17,797 $ 22,606 $ 49,866 $ 36,410Add:
Operating expense 23,656 17,438 20,951 44,607 32,653General and administrative expense 6,329 6,191 5,620 11,949 9,938Depreciation and amortization expense 10,608 7,276 10,143 20,751 18,758
Less:Earnings from equity method investments 17,683 12,291 20,864 38,547 23,371Non-cash unrealized gain (loss) on derivatives, net 1,415 851 (2,531) (1,116) 245
Adjusted gross margin $ 48,755 $ 35,560 $ 40,987 $ 89,742 $ 74,143Reconciliation of net income to Adjusted EBITDA:
Net income $ 17,068 $ 15,088 $ 14,600 $ 31,668 $ 31,314Add:
Interest expense 10,197 2,730 8,006 18,203 5,117Depreciation and amortization expense 10,608 7,276 10,143 20,751 18,758Cash distributions from equity method investments 25,560 14,467 26,065 51,625 28,052Inventory valuation adjustment 48 — 1,187 1,235 —Non-cash equity compensation 357 130 298 655 390Loss (gain) on disposal of long-lived assets, net (22) (27) 152 130 (61)
Less:Earnings from equity method investments 17,683 12,291 20,864 38,547 23,371White Cliffs cash distributions attributable to noncontrolling interests — 4,822 — — 9,350Impact from derivative instruments:
Total loss on derivatives, net (2,202) (1,942) (644) (2,846) (2,749)Total realized loss (gain) (cash flow) on derivatives, net 3,617 2,793 (1,887) 1,730 2,994
Non-cash unrealized gain (loss) on derivatives, net 1,415 851 (2,531) (1,116) 245Adjusted EBITDA $ 44,718 $ 21,700 $ 42,118 $ 86,836 $ 50,604
Reconciliation of net cash provided by (used in) operating activities toAdjusted EBITDA:
Net cash provided by (used in) operating activities $ 26,941 $ 6,931 $ (7,070) $ 19,871 $ 25,118Less:
Changes in operating assets and liabilities, net (386) (14,945) (36,508) (36,894) (25,558)White Cliffs cash distributions attributable to noncontrolling interests — 4,822 — — 9,350
Add:Interest expense, excluding amortization of debt issuance costs 9,515 2,470 7,479 16,994 4,597Distributions from equity method investments in excess of equity inearnings 7,876 2,176 5,201 13,077 4,681
Adjusted EBITDA $ 44,718 $ 21,700 $ 42,118 $ 86,836 $ 50,604
(1) Prior period financial information has been recast to reflect the effects of the dropdown of the Wattenberg Oil Trunkline

Rose Rock Midstream 2015 Adjusted EBITDA Guidance
35
(in millions, unaudited) 2015 Guidance
Mid-point
Net income $ 82.0
Add: Interest expense 43.5
Add: Depreciation and amortization 43.0
EBITDA $ 168.5
Non-Cash and Other Adjustments 21.5
Adjusted EBITDA $ 190.0
Less:
Cash interest expense 40.0
Maintenance capital expenditures 10.0
Distributable cash flow $ 140.0
Non-Cash and Other Adjustments
Earnings from equity method investments $ (82.0)
Distributions from equity method investments (1) 102.0
Non-cash equity compensation 1.5
Non-Cash and Other Adjustments $ 21.5
(1) Distributions from equity method investment includes the cash distributions from White Cliffs and Glass Mountainattributable to Rose Rock

Rose Rock Midstream Distributable Cash Flow
36
(in thousands, unaudited) Three Months Ended Six Months EndedJune 30, March 31, June 30,
2015 2014(1) 2015 2015 2014(1)
Reconciliation of net income to distributable cash flow:Net income $ 17,068 $ 15,088 $ 14,600 $ 31,668 $ 31,314
Add:Interest expense 10,197 2,730 8,006 18,203 5,117Depreciation and amortization expense 10,608 7,276 10,143 20,751 18,758
EBITDA 37,873 25,094 32,749 70,622 55,189Add:
Loss (gain) on disposal of long-lived assets, net (22) (27) 152 130 (61)Cash distributions from equity method investments 25,560 14,467 26,065 51,625 28,052Inventory valuation adjustment 48 — 1,187 1,235 —Non-cash equity compensation 357 130 298 655 390
Less:Earnings from equity method investments 17,683 12,291 20,864 38,547 23,371White Cliffs cash distributions attributable to noncontrollinginterests — 4,822 — — 9,350Non-cash unrealized gain (loss) on derivatives, net 1,415 851 (2,531) (1,116) 245
Adjusted EBITDA $ 44,718 $ 21,700 $ 42,118 $ 86,836 $ 50,604Less:
Cash interest expense 9,764 2,309 7,454 17,218 4,298Maintenance capital expenditures 4,855 1,479 927 5,782 2,386
Distributable cash flow $ 30,099 $ 17,912 $ 33,737 $ 63,836 $ 43,920
Distribution declared $ 29,483 $ 16,718 $ 28,379 $ 57,862 $ 30,621
Distribution coverage ratio 1.02 x 1.07 x 1.19 x 1.10 x 1.43 x
(1) Prior period financial information has been recast to reflect the effects of the dropdown of the Wattenberg Oil Trunkline

(in thousands, unaudited) Year EndedDecember 31, 2014
Crude SemStream SemCAMS SemLogistics SemMexico SemGas Corporateand other Consolidated
Net income (loss) $ 57,495 $ 70,632 $ 14,318 $ (10,072) $ 5,900 $ 6,792 $ (93,008) $ 52,057Add: Interest expense 31,072 (5,140) 13,558 1,528 166 8,570 (710) 49,044Add: Income tax expense (benefit) — — 3,135 (2,231) 4,053 — 41,556 46,513Add: Depreciation and amortization expense 40,035 — 14,295 10,005 6,031 26,353 1,678 98,397EBITDA 128,602 65,492 45,306 (770) 16,150 41,715 (50,484) 246,011Selected Non-Cash Items and Other Items Impacting Comparability 28,159 (42,165) 590 (1,083) 621 21,053 34,255 41,430Adjusted EBITDA $ 156,761 $ 23,327 $ 45,896 $ (1,853) $ 16,771 $ 62,768 $ (16,229) $ 287,441
Selected Non-Cash Items and Other Items Impacting Comparability
Loss (gain) on disposal of long-lived assets, net $ 319 $ — $ (950) $ (2,490) $ (53) $ 20,092 $ 15,674 $ 32,592Loss (income) from discontinued operations, net of income taxes — — — (1) — — 2 1Foreign currency transaction (gain) loss — — 42 821 279 — (1,228) (86)Remove NGL equity earnings including gain on issuance of commonunits — (31,363) — — — — — (31,363)Remove gain on sale of NGL units (34,211) (34,211)NGL cash distribution — 23,404 — — — — — 23,404Employee severance expense 9 — 150 — — 41 20 220Unrealized gain on derivative activities (1,734) — — — — — — (1,734)Change in fair value of warrants — — — — — — 13,423 13,423Depreciation and amortization included within equity earnings 18,992 — — — — — — 18,992Inventory valuation adjustment including equity method investees 7,781 — — — — — — 7,781Recovery of receivables written off at emergence — — (664) — — — — (664)Bankruptcy related expenses — 1 — — — 150 1,159 1,310Charitable contributions — — — — — — 3,379 3,379Non-cash equity compensation 2,792 4 2,012 587 395 770 1,826 8,386Selected Non-Cash Items and Other Items Impacting Comparability $ 28,159 $ (42,165) $ 590 $ (1,083) $ 621 $ 21,053 $ 34,255 $ 41,430
SemGroup Reconciliation of Net Income to Adjusted EBITDA
37

(in thousands, unaudited) Year EndedDecember 31, 2013
Crude SemStream SemCAMS SemLogistics SemMexico SemGas Corporateand other Consolidated
Net income (loss) $ 57,228 $ 38,071 $ (3,136) $ (6,769) $ 5,377 $ 14,701 $ (39,660) $ 65,812Add: Interest expense 14,923 (4,810) 18,928 1,435 188 3,268 (8,790) 25,142Add: Income tax expense (benefit) — — 6,348 (5,699) 2,589 — (20,492) (17,254)Add: Depreciation and amortization expense 23,708 — 10,766 9,426 5,991 14,517 2,001 66,409EBITDA 95,859 33,261 32,906 (1,607) 14,145 32,486 (66,941) 140,109Selected Non-Cash Items and Other Items Impacting Comparability 10,764 (15,624) 1,180 111 (722) 1,221 51,979 48,909Adjusted EBITDA $ 106,623 $ 17,637 $ 34,086 $ (1,496) $ 13,423 $ 33,707 $ (14,962) $ 189,018
Selected Non-Cash Items and Other Items Impacting Comparability
Loss (gain) on disposal of long-lived assets, net $ (56) $ 6 $ — $ — $ (854) $ 665 $ — $ (239)Income from discontinued operations, net of income taxes — — — — — — (59) (59)Foreign currency transaction (gain) loss — — (23) (391) (177) — (1,042) (1,633)Remove NGL equity earnings — (33,996) — — — — — (33,996)NGL cash distribution — 18,321 — — — — — 18,321Mid-America Midstream Gas Services acquisition cost — — — — — — 3,600 3,600Employee severance expense 5 — — — — — 33 38Unrealized gain on derivative activities (974) — — — — — — (974)Change in fair value of warrants — — — — — — 46,434 46,434Depreciation and amortization included within equity in earnings of White Cliffs 9,520 — — — — — — 9,520Bankruptcy related expenses — — — — — — 567 567Non-cash equity compensation 2,269 45 1,203 502 309 556 2,446 7,330Selected Non-Cash Items and Other Items Impacting Comparability $ 10,764 $ (15,624) $ 1,180 $ 111 $ (722) $ 1,221 $ 51,979 $ 48,909
SemGroup Reconciliation of Net Income to Adjusted EBITDA
38

(in thousands, unaudited) Year EndedDecember 31, 2012
Crude SemStream SemCAMS SemLogistics SemMexico SemGas Corporateand other Consolidated
Net income (loss) $ 64,554 $ 4,919 $ 4,097 $ (3,552) $ 1,467 $ (264) $ (39,324) $ 31,897Add: Interest expense (409) (3,449) 18,727 2,486 314 1,461 (10,228) 8,902Add: Income tax expense (benefit) — — 720 (7,736) 2,285 — 2,653 (2,078)Add: Depreciation and amortization expense 12,131 — 10,589 9,780 6,171 7,043 2,496 48,210EBITDA 76,276 1,470 34,133 978 10,237 8,240 (44,403) 86,931Selected Non-Cash Items and Other Items Impacting Comparability 9,532 6,952 50 514 121 629 30,236 48,034Adjusted EBITDA $ 85,808 $ 8,422 $ 34,183 $ 1,492 $ 10,358 $ 8,869 $ (14,167) $ 134,965
Selected Non-Cash Items and Other Items Impacting Comparability
Loss (gain) on disposal of long-lived assets, net $ (3,501) $ 214 $ — $ — $ (290) $ 46 $ — $ (3,531)Loss (income) from discontinued operations, net of income taxes — (2,985) — 14 — — 32 (2,939)Foreign currency transaction (gain) loss — — 26 (370) 190 — 452 298Remove NGL equity earnings — 403 — — — — — 403NGL cash distribution — 9,218 — — — — — 9,218Employee severance expense — — — 159 — — 195 354Unrealized loss on derivative activities 1,196 — — — — — — 1,196Change in fair value of warrants — — — — — — 21,310 21,310Depreciation and amortization included within equity in earnings of White Cliffs 10,181 — — — — — — 10,181Defense costs — — — — — — 5,899 5,899Recovery of receivables written off at emergence — — (858) — — — — (858)Non-cash equity compensation 1,656 102 882 711 221 583 2,348 6,503Selected Non-Cash Items and Other Items Impacting Comparability $ 9,532 $ 6,952 $ 50 $ 514 $ 121 $ 629 $ 30,236 $ 48,034
SemGroup Reconciliation of Net Income to Adjusted EBITDA
39

(in thousands, unaudited) Year EndedDecember 31, 2011
Crude SemStream SemCAMS SemLogistics SemMexico SemGasCorporate and
other ConsolidatedNet income (loss) $ 39,241 $ 16,752 $ 2,868 $ (41,440) $ 2,430 $ 6,308 $ (23,347) $ 2,812Add: Interest expense 3,749 17,152 24,685 1,005 365 2,346 10,836 60,138Add: Income tax expense (benefit) — — 552 (3,331) 629 — (160) (2,310)Add: Depreciation and amortization expense 11,379 3,501 10,233 9,271 6,502 5,986 2,951 49,823EBITDA 54,369 37,405 38,338 (34,495) 9,926 14,640 (9,720) 110,463Selected Non-Cash Items and Other Items Impacting Comparability 8,293 (48,513) (2,296) 45,283 57 452 1,806 5,082Adjusted EBITDA $ 62,662 $ (11,108) $ 36,042 $ 10,788 $ 9,983 $ 15,092 $ (7,914) $ 115,545
Selected Non-Cash Items and Other Items Impacting Comparability
Loss (gain) on disposal of long-lived assets, net $ 64 $ (45,821) $ (8) $ 44,663 $ (200) $ 4 $ 1,599 $ 301Loss (income) from discontinued operations, net of income taxes (1) — 9,644 — 30 — — (126) 9,548Foreign currency transaction (gain) loss — 39 (2,674) 88 18 — (921) (3,450)Employee severance expense — — 3,855 131 — — 388 4,374Unrealized gain on derivative activities (787) (13,247) — — — — (80) (14,114)Change in fair value of warrants — — — — — — (5,012) (5,012)Reversal of allowance on goods and services tax receivable — — (4,144) — — — — (4,144)Depreciation and amortization included within equity in earnings of White Cliffs 10,630 — — — — — — 10,630Defense costs — — — — — — 1,000 1,000Recovery of receivables written off at emergence (2,692) — — — — — — (2,692)Non-cash equity compensation 1,078 872 675 371 239 448 4,958 8,641Selected Non-Cash Items and Other Items Impacting Comparability $ 8,293 $ (48,513) $ (2,296) $ 45,283 $ 57 $ 452 $ 1,806 $ 5,082
SemGroup Reconciliation of Net Income to Adjusted EBITDA
40
(1) SemStream Arizona has been reported as a discontinued operation at December 31, 2012.Prior periods have been recast to conform with the presentation.

(in thousands, unaudited) Year EndedDecember 31,
2014(1) 2013 2012 2011Net income $ 62,925 $ 37,515 $ 23,954 $ 23,235
Add:Interest expense 21,279 8,181 1,912 1,823Depreciation and amortization expense 40,035 23,708 12,131 11,379Distributions from equity method investment 66,768 16,999 — —Inventory valuation adjustment 5,667 — — —Non-cash equity compensation 943 806 308 —Loss (gain) on disposal of long-lived assets, net 319 (31) (1) 64Provision for (recovery of) uncollectible accounts receivable — — — (916)
Less:Earnings from equity method investment 57,378 17,571 — —White Cliffs cash distributions attributable to noncontrollinginterests 11,008 — — —Impact from derivative instruments:Total gain (loss) on derivatives, net 17,351 (1,593) 149 (386)Total realized (gain) loss (cash outflow) on derivatives, net (15,730) 2,567 (1,345) 1,173Non-cash unrealized gain (loss) on derivatives, net 1,621 974 (1,196) 787Adjusted EBITDA $ 127,929 $ 68,633 $ 39,500 $ 34,798
Rose Rock Reconciliation of Net Income to Adjusted EBITDA
41
(1) Prior period financial information has been recast to reflect the effects of the dropdown of the Wattenberg Oil Trunkline

Rose Rock Reconciliation of Net Cash Provided by Operating Activities toAdjusted EBITDA
(in thousands, unaudited) Year EndedDecember 31,
2014(1) 2013 2012 2011Net cash provided by operating activities $ 111,093 $ 72,528 $ 35,097 $ 51,085Less:Changes in operating assets and liabilities, net 1,296 11,265 (2,850) 18,082White Cliffs cash distributions attributable to noncontrolling interests 11,008 — — —Add:Interest expense, excluding amortization of debt issuance costs 19,750 7,370 1,553 1,795Distributions in excess of equity earnings of affiliates 9,390 — — —Adjusted EBITDA $ 127,929 $ 68,633 $ 39,500 $ 34,798
42
(1) Prior period financial information has been recast to reflect the effects of the dropdown of the Wattenberg Oil Trunkline