sell-side analyst visit zinc - glencore.com · 2 . forward looking statements . this document...
TRANSCRIPT

Sell-side analyst visit Zinc
1 October 2014

2
Forward looking statements
This document contains statements that are, or may be deemed to be, “forward looking statements” which are prospective in nature. These forward looking statements may be identified by the use of forward looking terminology, or the negative thereof such as "plans", "expects" or "does not expect", "is expected", "continues", "assumes", "is subject to", "budget", "scheduled", "estimates", "aims", "forecasts", "risks", "intends", "positioned", "predicts", "anticipates" or "does not anticipate", or "believes", or variations of such words or comparable terminology and phrases or statements that certain actions, events or results "may", "could", "should", “shall”, "would", "might" or "will" be taken, occur or be achieved. Such statements are qualified in their entirety by the inherent risks and uncertainties surrounding future expectations. Forward-looking statements are not based on historical facts, but rather on current predictions, expectations, beliefs, opinions, plans, objectives, goals, intentions and projections about future events, results of operations, prospects, financial condition and discussions of strategy.
By their nature, forward looking statements involve known and unknown risks and uncertainties, many of which are beyond Glencore’s control. Forward looking statements are not guarantees of future performance and may and often do differ materially from actual results. Important factors that could cause these uncertainties include, but are not limited to, those discussed under “Principal risks and uncertainties” of Glencore’s Annual Report 2013 and “Risks and uncertainties” in Glencore’s 2014 Half-Year Report.
Neither Glencore nor any of its associates or directors, officers or advisers, provides any representation, assurance or guarantee that the occurrence of the events expressed or implied in any forward-looking statements in this document will actually occur. You are cautioned not to place undue reliance on these forward-looking statements which only speak as of the date of this document. Other than in accordance with its legal or regulatory obligations (including under the UK Listing Rules and the Disclosure and Transparency Rules of the Financial Conduct Authority and the Rules Governing the Listing of Securities on the Stock Exchange of Hong Kong Limited and the Listing Requirements of the Johannesburg Stock Exchange Limited), Glencore is not under any obligation and Glencore and its affiliates expressly disclaim any intention, obligation or undertaking to update or revise any forward looking statements, whether as a result of new information, future events or otherwise. This document shall not, under any circumstances, create any implication that there has been no change in the business or affairs of Glencore since the date of this document or that the information contained herein is correct as at any time subsequent to its date.
No statement in this document is intended as a profit forecast or a profit estimate and no statement in this document should be interpreted to mean that earnings per Glencore share for the current or future financial years would necessarily match or exceed the historical published earnings per Glencore share.
This document does not constitute or form part of any offer or invitation to sell or issue, or any solicitation of any offer to purchase or subscribe for any securities. The making of this document does not constitute a recommendation regarding any securities.

Agenda
3
• Welcome – Senior Management Team
• Chris Eskdale – Head of Zinc Assets • Introduction and Global and Australian update
• Greg Ashe – Head of Zinc Assets Australia
• Denis Hamel – Executive General Manager, Mt Isa Operations
• Sam Strohmayr – McArthur River Mine General Manager
• Questions

Global zinc market

Sources of zinc supply ….
,0
1,000
2,000
3,000
4,000
5,000
6,00019
5019
5519
6019
6519
7019
7519
8019
8519
9019
9520
0020
0520
1020
1320
14e
Europe ChinaAsia (ex China) North AmericaSouth America AfricaAustralasia Former East Bloc
0%
10%
20%
30%
40%
50%
60%
70%
80%
90%
100%
1950
1955
1960
1965
1970
1975
1980
1985
1990
1995
2000
2005
2010
2013
2014
e
Former East Bloc AustralasiaAfrica South AmericaNorth America Asia (ex China)China Europe
5
Zinc mine supply (kt contained Zn) Regional share of annual mine production
China: 1950 - 0.2kt
2014e – 4,771kt 36% global supply
Source: Metallgesellschaft, Wood Mackenzie, Glencore estimates
North America: 1950 – c.50% global supply 2014e – c.14% global supply

,0
1,000
2,000
3,000
4,000
5,000
6,000
7,00019
5019
5519
6019
6519
7019
7519
8019
8519
9019
9520
0020
0520
1020
1320
14e
Europe ChinaAsia (ex China) AmericasAfrica AustralasiaFormer East Bloc
… and zinc demand are changing
6
Zinc demand (kt Zn) Regional share of annual consumption
Source: Metallgesellschaft, Wood Mackenzie, Glencore estimates
China: 1950 - 3kt
2014e – 6,504kt 47% global demand
Americas: 1950 – c.50% global demand 2014e – c.14% global demand
0%
10%
20%
30%
40%
50%
60%
70%
80%
90%
100%
1950
1955
1960
1965
1970
1975
1980
1985
1990
1995
2000
2005
2010
2013
2014
e
Former East Bloc AustralasiaAfrica AmericasAsia (ex China) ChinaEurope
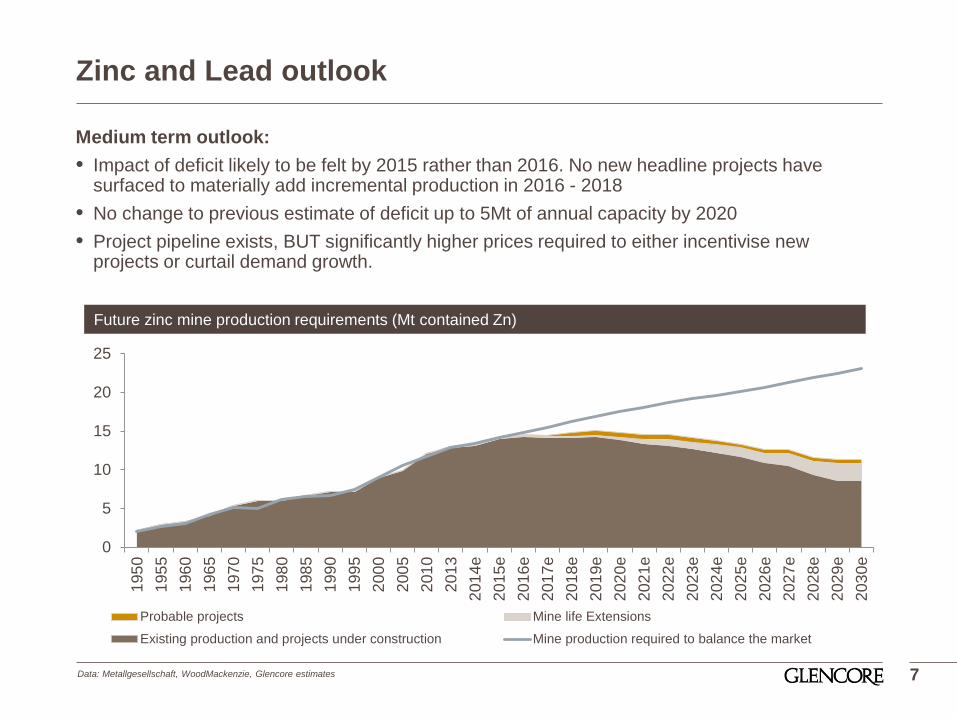
Zinc and Lead outlook
Medium term outlook: • Impact of deficit likely to be felt by 2015 rather than 2016. No new headline projects have
surfaced to materially add incremental production in 2016 - 2018 • No change to previous estimate of deficit up to 5Mt of annual capacity by 2020 • Project pipeline exists, BUT significantly higher prices required to either incentivise new
projects or curtail demand growth.
7
0
5
10
15
20
25
1950
1955
1960
1965
1970
1975
1980
1985
1990
1995
2000
2005
2010
2013
2014
e20
15e
2016
e20
17e
2018
e20
19e
2020
e20
21e
2022
e20
23e
2024
e20
25e
2026
e20
27e
2028
e20
29e
2030
e
Probable projects Mine life Extensions
Existing production and projects under construction Mine production required to balance the market
Future zinc mine production requirements (Mt contained Zn)
Data: Metallgesellschaft, WoodMackenzie, Glencore estimates

Zinc and Lead outlook
8
Growing consensus that zinc deficit is a reality AND likely to widen significantly over medium term
Selected indicators:
• Zinc price climbed well above last year’s levels, reflecting improving fundamentals
• Exchange stocks continue downward trend Zinc down -21% YTD September and Lead -2%
• Metal premia holding above last year’s levels
• China imported 444kt zinc in Jan-Aug 2014 26% above Jan-Aug 2013 • Highest recorded figures since 2009
• In 2013, first annual deficit in zinc since 2006, in lead since 2009
Announcements:
• Dec 2013: MMG announces closure of Century mid 2015 - a year earlier than previous estimates removes 3.5% of global mine supply
• Feb 2014: MMG announces Dugald River development likely to be held up by 12 months; first concentrate only end of 2016 removes 1.5% of global mine supply
• Sep 2014: ILZSG estimates a 248kt deficit already in the first 7 months of 2014. Mine supply growing only in China, contracting in the Rest of the World
• Similar picture in lead. WoodMackenzie forecasting 125kt deficit in 2014
• Zinc demand growing ~5% in 2014, no sign of material change going forward
Glencore zinc
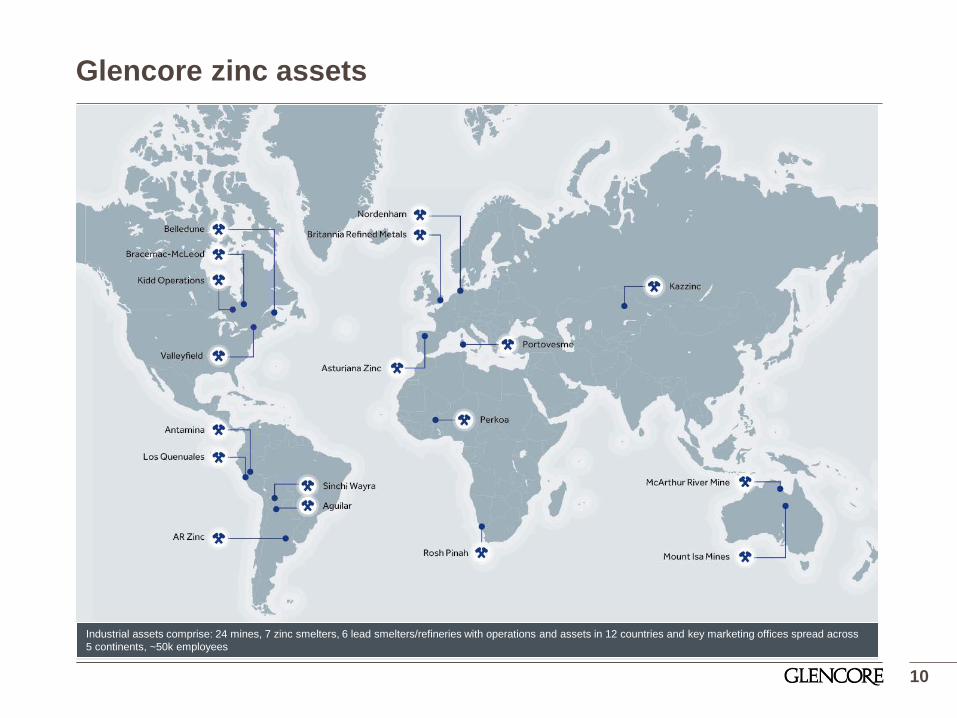
Glencore zinc assets
(global map from investor day presentation to come)
10
Industrial assets comprise: 24 mines, 7 zinc smelters, 6 lead smelters/refineries with operations and assets in 12 countries and key marketing offices spread across 5 continents, ~50k employees

Glencore zinc – key themes
Safe working environment and roll-out of Glencore’s SAFEWORK program
Management as single division • One pool of knowledge • Focused operational excellence across industrial assets • Sharing of best practices across global zinc assets and into trading book
Integration of leading industrial and marketing business • Mine output and 3rd party tonnage flowing to destination of optimal economic return • Market input guiding assets to produce economically optimal product mix wherever possible • One global concentrates book
Optimization of material flows • Focus on feeding qualities that give best economic return (smelter, recoveries, penalties, by-
products) • Concentrates bought from third parties filling global book if economics attractive
Leading zinc producer with the world’s largest resource base delivering growth projects and cost efficiencies at a key stage of the price cycle
11

Transformation of zinc asset cost structure
12 Q1 Q2 Q3 Q4
Improving our competitive position • Brownfield projects will sustainably reduce our average C1 costs • Move from current second quartile into the first quartile
C1 Zinc illustrative cash cost curve (c/lb)
Source: Glencore
2015 forecast mined zinc
2013 pro-forma mined zinc
2006
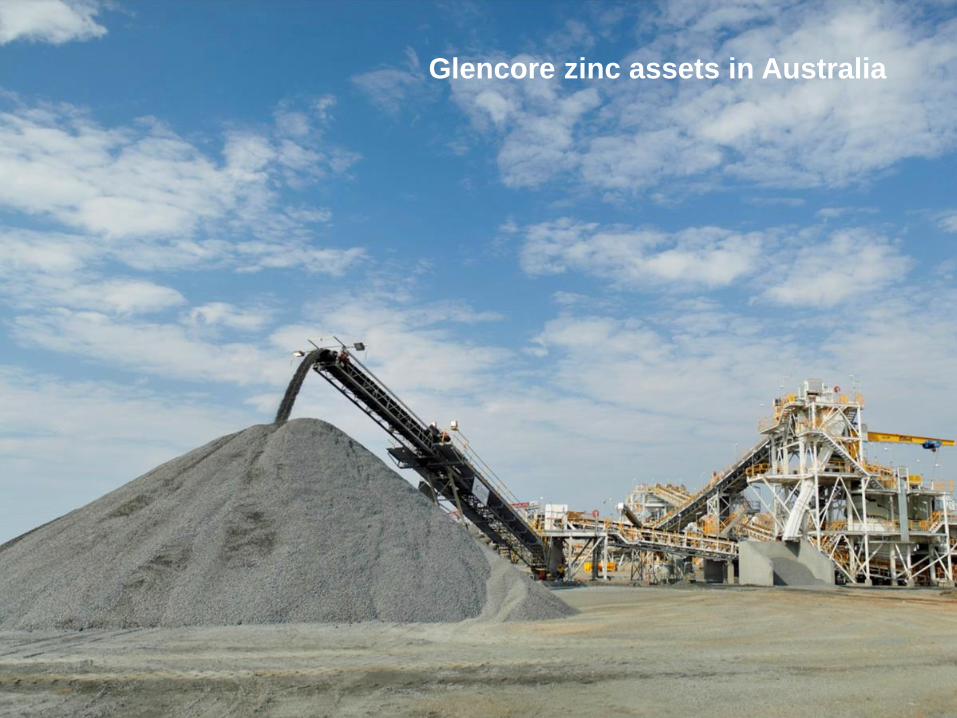
Glencore zinc assets in Australia
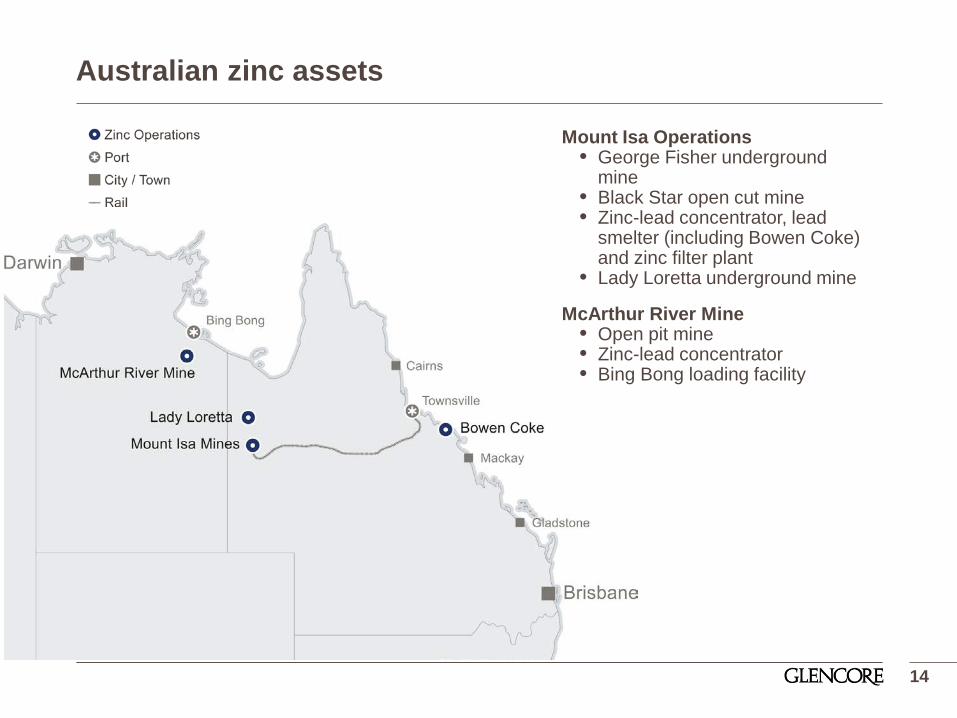
Australian zinc assets
14
Mount Isa Operations • George Fisher underground
mine • Black Star open cut mine • Zinc-lead concentrator, lead
smelter (including Bowen Coke) and zinc filter plant
• Lady Loretta underground mine
McArthur River Mine • Open pit mine • Zinc-lead concentrator • Bing Bong loading facility

'0 '20 '40
NevesCorvo
ShalkiyaRestart
Penasquito
Red Dog
Lanping
Antamina
Rampura-Agucha
McArthurRiver
Mt Isa
Australian Zinc – significance to Glencore
15
Glencore owns the world’s largest Zinc resource base and operates mines of industry-leading quality and scale
• Mt Isa operations contains the largest zinc resource at 35Mt
• MRM has the second largest at 19Mt • ~US$1Bn invested across the
Australian expansionary projects • Australian assets accounted for ~45%
of total Glencore Zinc production in 2013
Contained Zn Resources (Mt)
Data: Glencore, Brook Hunt Note: Antamina resource 100% - Glencore attributable interest in Antamina is 33.75%: Mt Isa operations include Lady Loretta resources

Health, Safety and Environmental performance
16
Key Performance Indicator 2011 2012 2013
# of
inci
dent
s Fatalities 0 0 0
High Potential Risk Incidents 10 4 6
Health and Safety fines, penalties or prosecutions 0 0 0
Glencore is committed to delivering world class health and safety performance
Senior leaders are promoting a site culture that values safety and demands a safe work environment
Currently rolling out a safety leadership program to drive our zero harm vision
Further adoption of SafeWork and a clear focus on identifying and controlling our critical and high-level risks
Mount Isa Operations

Mineralisation confirmed
Second mineralisation discovered 2km north (Hilton North, later renamed George Fisher Mine)
1981
History of zinc mining at Mt Isa Operations
18
Hilton ore bodies discovered
1947
Major drilling program
1948-57
GFM extension project: • 2012 – LE72 Surface Crusher and supporting infrastructure commissioned • 2013/2014 – Shaft sinking, underground infrastructure • Q1 2015 – Hoist commissioning
Operations commence
1969
Hilton begins ore production
1989
Hilton production slows, George Fisher Mine development ramps up
1998 2000
GFM officially opens
George Fisher Mine
Lady Loretta Mine 2011
Lady Loretta Greenfield project commences
2012
Ore production commences
1968 1969
Diamond drilling
Early shaft sink project
1980s Today
Ramp up to 1.6Mtpa
George Fisher Mine (GFM)
Lady Loretta

Mt Isa Operations – schematic overview
19

P49
20
L72 4.5Mtpa
• Opens up access to new 20Mt mining block • Expands ore production by 1Mtpa to 4.5Mtpa • Reduces operating costs
Mt Isa Operations – George Fisher extension overview
Mt Isa Operations – George Fisher extension status update
21
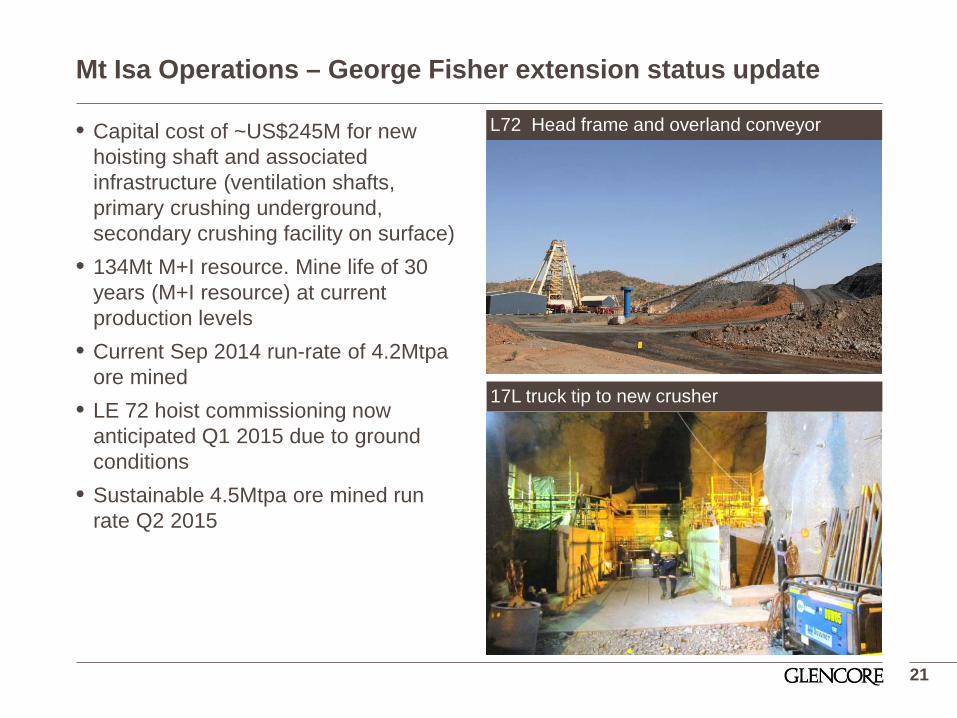
L72 Head frame and overland conveyor
17L truck tip to new crusher
• Capital cost of ~US$245M for new hoisting shaft and associated infrastructure (ventilation shafts, primary crushing underground, secondary crushing facility on surface)
• 134Mt M+I resource. Mine life of 30 years (M+I resource) at current production levels
• Current Sep 2014 run-rate of 4.2Mtpa ore mined
• LE 72 hoist commissioning now anticipated Q1 2015 due to ground conditions
• Sustainable 4.5Mtpa ore mined run rate Q2 2015
Mt Isa Operations – open pits
22
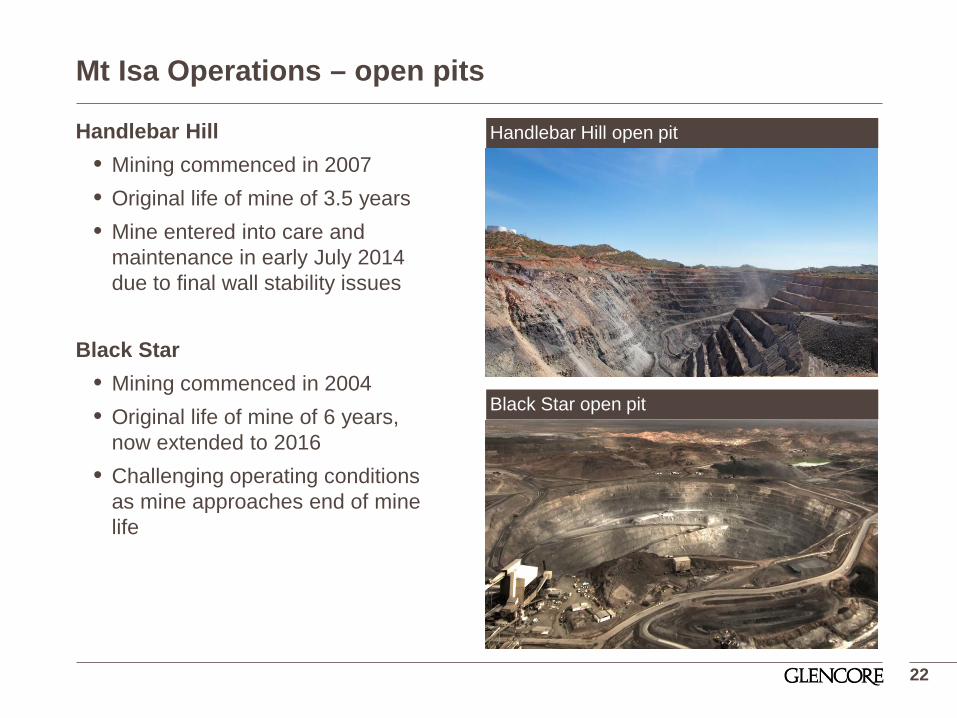
Handlebar Hill open pit
Black Star open pit
Handlebar Hill • Mining commenced in 2007 • Original life of mine of 3.5 years • Mine entered into care and
maintenance in early July 2014 due to final wall stability issues
Black Star • Mining commenced in 2004 • Original life of mine of 6 years,
now extended to 2016 • Challenging operating conditions
as mine approaches end of mine life

• High grade zinc (with lead and silver) deposit located 140km from Mt Isa
• 13Mt resource M+I @ 16% Zn, 5.7% Pb and 98 g/t Ag
• Mine life (full production) of 8 years M+I resource
• Capital cost of ~US$350M • Project on budget with production
ramping up to 1.6Mtpa by H2 2015 • 0.6Mt ore mined in 2013 • Current run-rate 1Mtpa ore mined
Lady Loretta - project update
Lady Loretta mine camp
Paste Plant Facility
23
McArthur River Mine

History of McArthur River Mine
25
Discovery of the “Here’s Your Chance” deposit
Underground in production
MRM changes to an open pit operation
Expansion of mine and processing facilities (commissioning from June 2014)
Production of three saleable products
1955 1995 2006 2012 today
Pilot Plant Trials to commercialise open pit
1978
Phase 1: • Underground • annual ore production
@1.5Mtpa • LoM 2010
Phase 2: • Open Pit • annual ore production
@2.5 Mtpa • LoM 2027
Phase 3: • Open Pit • annual ore production
@5.0 Mtpa • LoM 2036
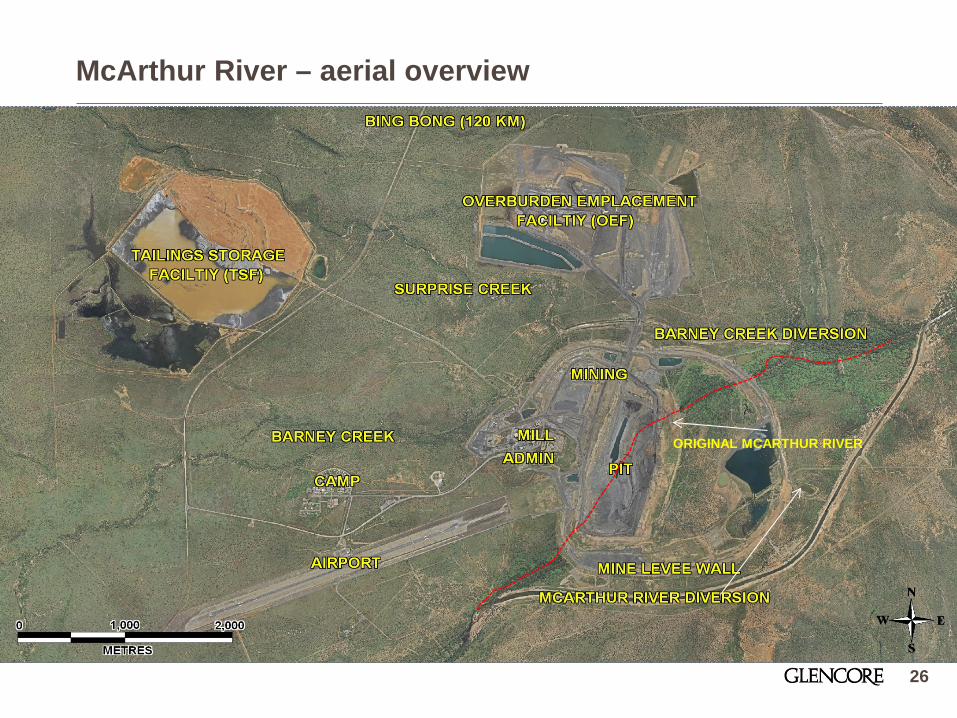
ORIGINAL MCARTHUR RIVER
McArthur River – aerial overview
26

McArthur River - mineral size - the fundamental challenge
27
Mt Isa
Broken Hill
40 micron (0.04mm) square
McArthur River – grinding to 7micron – power intensive, high reagent consumption, difficult pumping, thickening and filtration

McArthur River Phase 3 – expansion overview
Phase 3 Development Project approved in mid 2012: • Increases production to 5.0 - 5.5Mtpa ore (from 2.5Mtpa) and ~800ktpa of
concentrate (from 360ktpa) • Increases reserves to 109Mt (from 53Mt) and mine life to 2036 • Capex budget of ~US$360M
Project development includes:
• Expansion of the open pit from 210m to 420m deep (footprint increases from 145 hectares to 210 hectares)
• Expansion of the existing and construction of new overburden stockpiles • Upgrade and expansion of the mine water management system • Upgrade to the on-site ore processing facilities • Upgrade and expansion of site offices, workshop facilities, accommodation
village and other supporting infrastructure • Upgrade and expansion of the existing power supply (20MW to 45MW)
28

McArthur River Phase 3 ramp-up – current status
29
Crusher • Handed over to operations and commenced commissioning on schedule in H1 2014
• Mining, crushing, grinding and power infrastructure delivering design capacity
• Ramp-up challenges encountered during H2 2014 particularly in relation to flotation and dewatering circuits
• Remaining issues well understood and work plan in place to address
• Expecting annualized zinc production of 330kt contained metal by Dec 2014, representing >90% of design capacity
Processing Plant

McArthur River – channel regeneration
• Conversion to Open Pit mine required the diversion of the McArthur River • Significant progress in regeneration of habitat
30
MRM channel 2008 MRM channel 2013
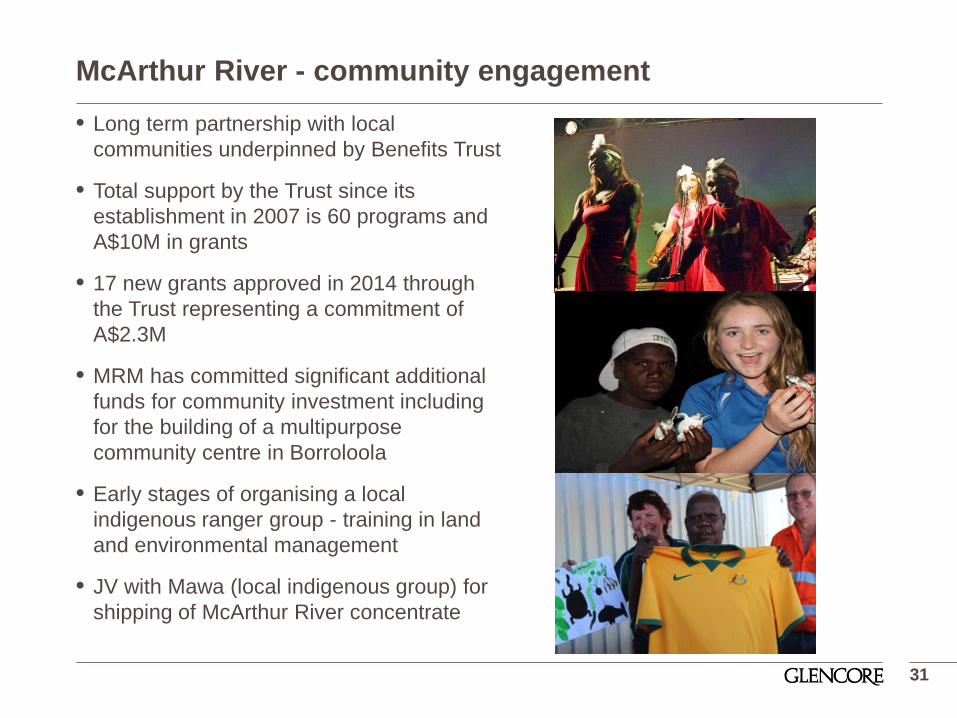
McArthur River - community engagement • Long term partnership with local
communities underpinned by Benefits Trust
• Total support by the Trust since its establishment in 2007 is 60 programs and A$10M in grants
• 17 new grants approved in 2014 through the Trust representing a commitment of A$2.3M
• MRM has committed significant additional funds for community investment including for the building of a multipurpose community centre in Borroloola
• Early stages of organising a local indigenous ranger group - training in land and environmental management
• JV with Mawa (local indigenous group) for shipping of McArthur River concentrate
31

McArthur River - indigenous employment
32
Driver training simulator
• Indigenous employment has consistently averaged 15 - 20% of total workforce
• Committed to at least maintaining these levels through:
• Additional hiring for roles throughout the mine, concentrator and administration
• Investment in self-sustaining projects such as rehabilitation and the rangers
Truck driver

Conclusion

Conclusion
• Zinc market fundamentals are strong and continue to improve
• Our industry leading zinc business combines world class zinc assets with our marketing reach and expertise • unique combination of mines and smelters in a single company • industrial assets fully integrated into global marketing flows
• Glencore’s key growth projects provide additional zinc units and cost efficiencies at a key stage of the price cycle
• Despite major mine closures and the ramp-up challenges encountered at our Australian projects, 2014 group mined zinc production is forecast around 2013 levels, with growth accelerating from 2015
34
Q&A