seismoacoustic coupling induced by the breakup of the 15
TRANSCRIPT

HAL Id: hal-00855474https://hal.archives-ouvertes.fr/hal-00855474
Submitted on 18 Nov 2013
HAL is a multi-disciplinary open accessarchive for the deposit and dissemination of sci-entific research documents, whether they are pub-lished or not. The documents may come fromteaching and research institutions in France orabroad, or from public or private research centers.
L’archive ouverte pluridisciplinaire HAL, estdestinée au dépôt et à la diffusion de documentsscientifiques de niveau recherche, publiés ou non,émanant des établissements d’enseignement et derecherche français ou étrangers, des laboratoirespublics ou privés.
Seismoacoustic coupling induced by the breakup of the15 February 2013 Chelyabinsk meteor
Benoit Tauzin, Eric Debayle, Cathy Quantin, Nicolas Coltice
To cite this version:Benoit Tauzin, Eric Debayle, Cathy Quantin, Nicolas Coltice. Seismoacoustic coupling induced bythe breakup of the 15 February 2013 Chelyabinsk meteor. Geophysical Research Letters, AmericanGeophysical Union, 2013, 40, pp.1-5. �10.1002/grl.50683�. �hal-00855474�

GEOPHYSICAL RESEARCH LETTERS, VOL. 40, 1–5, doi:10.1002/grl.50683, 2013
Seismoacoustic coupling induced by the breakup of the 15 February
2013 Chelyabinsk meteor
Benoit Tauzin,1 Eric Debayle,1 Cathy Quantin,1 and Nicolas Coltice1
Received 15 April 2013; revised 18 June 2013; accepted 18 June 2013.
[1] On 15 February 2013 around 03:20:00 UTC, thelargest meteor reported since the 1908 Tunguska eventwas observed as a fireball traveling through the Earth’satmosphere, exploding in an air burst near the city ofChelyabinsk, Russia. The rarity of such an event providesa unique window on the physics of meteoroid collision. Wereport the fine seismic detection of Rayleigh waves producedby the coupling of ground motion with the incident shockwave at distances up to 4000 km from the event. Combininginformation from seismic beam-forming analysis, recon-structed trajectory from casual video records, and remotesensing, we identify the Rayleigh waves as being initiated bythe shock wave produced by the main blast that occasioneddamages and injuries in Chelyabinsk. From the Rayleighwave observations, we report a magnitude Ms � 3.7seismic source. Citation: Tauzin, B., E. Debayle, C. Quantin, and
N. Coltice (2013), Seismoacoustic coupling induced by the breakup
of the 15 February 2013 Chelyabinsk meteor, Geophys. Res. Lett.,
40, doi:10.1002/grl.50683.
1. Introduction
[2] The Chelyabinsk meteor is the largest recorded objectthat entered the Earth’s atmosphere since the Tunguskaevent in 1908 [Ben-Menahem, 1975]. It generated on itsway multiple blast events due to meteor fragmentation. Thelargest was reported by the NASA Near-Earth Object Pro-gram (http://neo.jpl.nasa.gov) at about 23 km altitude and isthought to have caused injuries and damages within the cityof Chelyabinsk. Multiple fragments of the meteor have alsobeen reported to hit the ground, the largest in the region ofthe lake Chebarkul, 70 km west-south west of Chelyabinsk.These fragments, millimeters to centimeters in size, are how-ever likely too small to generate seismic waves that can bedetected a few hundred kilometers away [Edwards et al.,2007].
[3] Seismic waves are more commonly generated by thesonic shock wave associated with the meteor [Anglin andHaddon, 1987]. When a meteor enters the Earth’s atmo-sphere at hypersonic velocities, it produces a ballistic shockwave within a narrow Mach cone. The induced pressure
Additional supporting information may be found in the online versionof this article.
1Laboratoire de Géologie de Lyon: Terre, Planète, Environnement,CNRS UMR 5276, Université Lyon 1, Université de Lyon, Ecole NormaleSupérieure de Lyon, Villeurbanne, France.
Corresponding author: B. Tauzin, Laboratoire de Géologie de Lyon:Terre, Planète, Environnement, CNRS UMR 5276, Université Lyon 1, Uni-versité de Lyon, 2 rue Raphael Dubois, 69622 Villeurbanne Cedex, France.([email protected])
©2013. American Geophysical Union. All Rights Reserved.0094-8276/13/10.1002/grl.50683
wave propagates with a wavefront that can be approximatedas cylindrical [e.g., ReVelle, 1976]. Additional shock waveswith quasi-spherical wavefronts can also be produced by themeteor fragmentation. These shock waves, though experi-encing frequency-dependent attenuation as they propagate inthe atmosphere, could be detected in the case of Cheylabinskas infrasound waves recorded at sensors of the Comprehen-sive Nuclear Test Ban Treaty all over the world [Le Pichonet al., 2013]. These infrasounds impinge the Earth’s surfacewith sufficient energy to induce a measurable seismic signal[Edwards et al., 2007].
[4] In this study, we show that coupling between themeteor’s shock wave and ground motion produces Rayleighwaves that can be detected at distances up to 4000 kmfrom Chelyabinsk. These Rayleigh waves can be used toinfer the deep internal structure of the Earth. Such Rayleighwaves, precursory to the ground motion associated with themeteor’s shock wave, have so far been rarely observed.
2. Seismic Data Analysis
[5] We analyze 2016 three-component broadband seismo-grams recorded at seismic stations of the Global Seismo-graphic Network and the International Federation of DigitalSeismographic Networks (Figure 1). Among them, we use73 vertical components recorded at distances up to 4000km from the Chelyabinsk city (red stations in the map ofFigure 1). In Figure 1, these seismograms are sorted byincreasing distance and band-pass filtered in the period range20–60 s. The extraction of the seismic signal associatedwith the Chelyabinsk meteor is significantly blurred by thecoincidental interference with seismic waves of a magnitude5.8 earthquake that occurred 20 min earlier in the Tongaarchipelago (Figure 1). Figure S1 in the supporting informa-tion provides a zoomed image of the distance ranging from0 to 2000 km in Figure 1.
[6] The first arrivals in the seismograms are P phasesradiated by the Tonga earthquake. Travel times computedfor the IASP91 reference velocity model [Kennett andEngdahl, 1991] as well as synthetic seismograms computedin a 3-D Earth [Tromp et al., 2010] (Figure S2) indicatethe presence of core phases (PKP and PKIKP) as well asP phases reflected under the surface of the Earth (PP). Thestrongest signal is a dispersed wave train which is framedby the gray curves in Figure 1. This wave train can hardlybe explained by the earthquake. First, it is not modeledby the simulation in a realistic Earth’s model (Figure S2).Second, its arrival time t does not increase linearly withthe distance from the Tonga epicenter (Figure S3). Instead,it increases linearly with the distance d from Chelyabinsk(i.e., t = d/v with an apparent constant velocity v) sug-gesting that it is emitted in this region. It propagates in
1

TAUZIN ET AL.: THE CHELYABINSK METEOR
−500 0 500 1000 1500 2000
246
1651
1738
1893
2182
2598
2799
3051
3242
3392
3624
3683
3741
3837
3978dis
tance fro
m m
ete
or
event (k
m)
North
Chelyabinsk
20 m
in
time after Feb 15, 03:20:26 (s)
Arrivals from Tonga
PK
IKP
PP
3.5
km
/s
2.7
km
/s
Sd
iff
Arrivals from meteor
SW
P
S
su
rf
Tonga
Figure 1. Vertical component seismograms for stations located within ˙4000 km from the city of Chelyabinsk. Theseismograms are band-pass filtered between 20 and 60 s. The origin time is the time proposed for the main meteor blast(i.e. t0 = 03:20:36 UTC). Along the Y axis, the data are sorted by increasing distance from the reported burst point in thisstudy (54.82ıN, 61.24ıE). Note that distance is not increasing linearly along this axis. Body waves (PKIKP, PP, and Sdiff)from the Tonga earthquake are indicated with blue dots. The gray curves delineate inferred Rayleigh waves associated withthe Chelyabinsk meteor. They correspond to curves t = t0 + d/v with v = 3.5 and 2.7 km/s, respectively. Predicted traveltimes for P, S, surface waves, and shock waves (SW) induced by the meteor event are indicated with red dots. The map atthe top left shows the location of the city of Chelyabinsk (red star) with all broadband seismological stations within 4000km (red triangles) and away (black triangles). The North Pole is indicated with a double black circle. A 20 min travel timeisocontour for P waves emitted by the Tonga earthquake is indicated as a black small circle on the sphere.
2

TAUZIN ET AL.: THE CHELYABINSK METEOR
15 20 25 30 35 40 45 50 55 60
2.8
3
3.2
3.4
3.6
3.8
4
central period (s)
gro
up v
elo
city (
km
/s)
CUB
Ritzwoller & Levshin
Meteor
Figure 2. Dispersion curve (black lines) obtained fromnarrowband-pass filtering the data recorded within 4000 kmfrom Chelyabinsk at different central periods and applyingour “delay and sum” approach. The central thick black curveis the average dispersion curve va(T). The upper and lowerblack curves delimit the 95% confidence level. Group veloc-ity curves computed for the fundamental mode of Rayleighwaves propagating between each source receiver pairs in theCUB model [Shapiro and Ritzwoller, 2002] and observed forEurasian shields/platforms by Ritzwoller and Levshin [1998]are indicated as gray and blue lines, respectively.
the ground with an apparent velocity between 2.7 and 3.5km/s (Figure 1, gray curves). The wave train is unambigu-ously identified as Rayleigh waves by the dispersion ofthe signal with frequency and the recorded elliptical retro-grade ground motions occurring essentially in the verticalplane (Figure S4 in the supporting information). Waves fromTonga, although interfering, are weaker by 1 or 2 orders ofmagnitude (Figure S5). Our observations of absolute traveltimes, particle motion, and dispersion thus suggest that weisolated meteor-induced Rayleigh waves among waveformsassociated with the Tonga earthquake.
[7] We have extracted the average group velocity disper-sion for these Rayleigh waves (Figure 2). We band-passfilter the seismograms of Figure 1 from 15 to 60 s bystep of 5 s period. We take the envelope of the signalsand apply a “delay and sum” approach, i.e., stack theseenvelopes along linear curves of equation t = d/v + t0,with d the distance from Chelyabinsk. We test values of vwithin 2.5 km/s and 5 km/s. The result is a time-velocitydiagram (Figure S6) whose maximum indicates the origintime t0(T) and the group velocity v(T) for Rayleigh wavesat period T. We use a bootstrap resampling approach [Efronand Tibshirani, 1991] to estimate the average dispersionand its associated error. The obtained dispersion relation isclassical with longer wavelengths or periods arriving beforeshorter wavelengths (Figure 2). Indeed, the S wave veloc-ity generally increases with depth in the uppermost 100km of continents and Rayleigh waves measure a weightedaverage of the S wave structure over a depth interval thatincreases with period. Comparison with dispersion curvesfor the same region [Ritzwoller and Levshin, 1998; Shapiroand Ritzwoller, 2002] confirms that the measured disper-sion is typical of a fundamental Rayleigh mode propagatingwithin a Precambrian lithosphere (Figure 2). This is a niceexample of how a meteor-induced Rayleigh wave can beused to infer the internal structure of a planetary body withan atmosphere.
[8] We relocate the source emission of meteor-inducedRayleigh waves using the dispersion relation relating groupvelocity to frequency and a similar approach developed byLay [1987] to illuminate near-source structures from tele-seismic P waves generated by underground explosions. Weuse a spatial grid around Chelyabinsk of 1501 � 1501 kmwith �1 km wide cells. Assuming an origin time for themeteor event (with uncertainties t0(T) on this time consid-ered here), the amplitude at each predicted travel time from agiven grid point is taken on the envelope of the correspond-ing vertical component seismogram. These amplitudes arethen backprojected onto the corresponding grid points. By
(a) (b)
Figure 3. (a) Result of the beam stack migration of 15 s period envelopes of vertical component seismograms recordedat stations within 4000 km from Chelyabinsk. The city of Chelyabinsk, the lake Chebarkul, and the closest seismic stationARU are indicated with a triangle, a star, and an inverted triangle, respectively. The dashed square delineates the regiondepicted in Figure 3b. (b) Superimposition of contours obtained from the seismic beam-forming over the Meteosat-9 satelliteimage. The color code for beam contours is the same as in Figure 3a. The trajectory estimated from casual video records(IAU telegram) is indicated in yellow with the four successive flares as red dots. The main blast is indicated with a doubledot. Before projection, the satellite image has been rectified using altitudes giving a vapor trail trajectory collinear with theprobable impact site of the Chebarkul Lake. The trajectories inferred from satellite and video records are close to each other.Our maximum of beam amplitude is located at (54.82ıN, 61.24ıE).
3
TAUZIN ET AL.: THE CHELYABINSK METEOR
(a) (b)
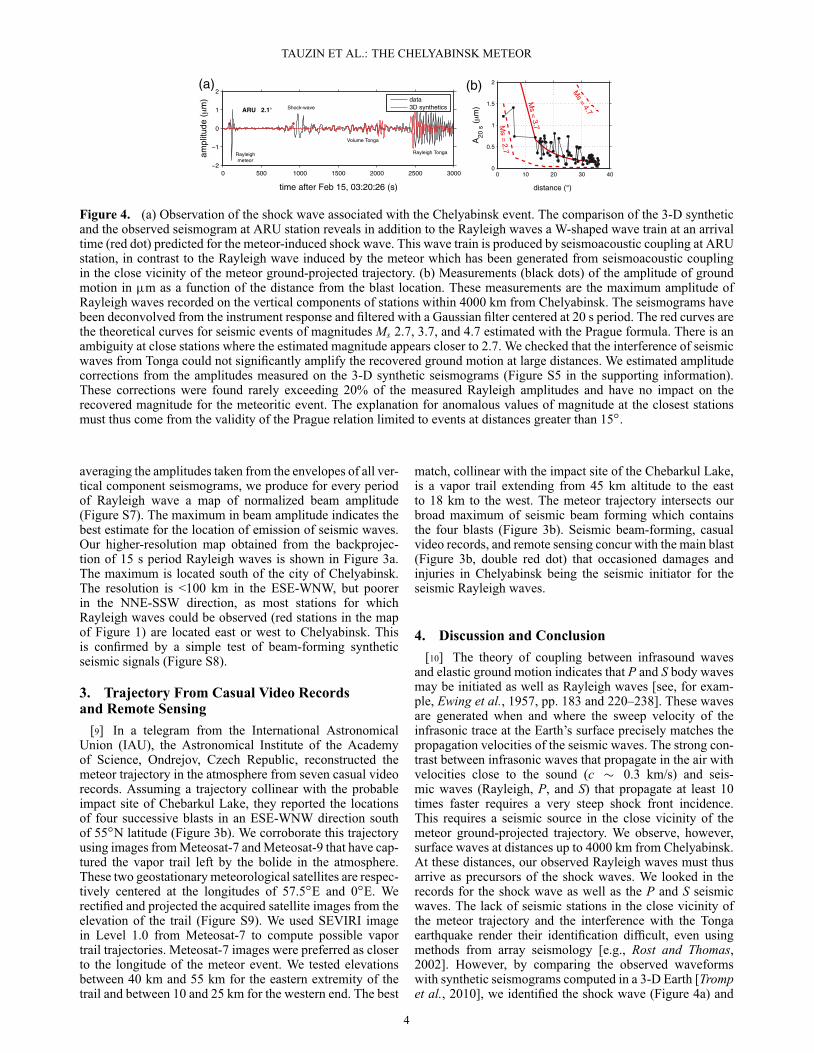
Figure 4. (a) Observation of the shock wave associated with the Chelyabinsk event. The comparison of the 3-D syntheticand the observed seismogram at ARU station reveals in addition to the Rayleigh waves a W-shaped wave train at an arrivaltime (red dot) predicted for the meteor-induced shock wave. This wave train is produced by seismoacoustic coupling at ARUstation, in contrast to the Rayleigh wave induced by the meteor which has been generated from seismoacoustic couplingin the close vicinity of the meteor ground-projected trajectory. (b) Measurements (black dots) of the amplitude of groundmotion in �m as a function of the distance from the blast location. These measurements are the maximum amplitude ofRayleigh waves recorded on the vertical components of stations within 4000 km from Chelyabinsk. The seismograms havebeen deconvolved from the instrument response and filtered with a Gaussian filter centered at 20 s period. The red curves arethe theoretical curves for seismic events of magnitudes Ms 2.7, 3.7, and 4.7 estimated with the Prague formula. There is anambiguity at close stations where the estimated magnitude appears closer to 2.7. We checked that the interference of seismicwaves from Tonga could not significantly amplify the recovered ground motion at large distances. We estimated amplitudecorrections from the amplitudes measured on the 3-D synthetic seismograms (Figure S5 in the supporting information).These corrections were found rarely exceeding 20% of the measured Rayleigh amplitudes and have no impact on therecovered magnitude for the meteoritic event. The explanation for anomalous values of magnitude at the closest stationsmust thus come from the validity of the Prague relation limited to events at distances greater than 15ı.
averaging the amplitudes taken from the envelopes of all ver-tical component seismograms, we produce for every periodof Rayleigh wave a map of normalized beam amplitude(Figure S7). The maximum in beam amplitude indicates thebest estimate for the location of emission of seismic waves.Our higher-resolution map obtained from the backprojec-tion of 15 s period Rayleigh waves is shown in Figure 3a.The maximum is located south of the city of Chelyabinsk.The resolution is <100 km in the ESE-WNW, but poorerin the NNE-SSW direction, as most stations for whichRayleigh waves could be observed (red stations in the mapof Figure 1) are located east or west to Chelyabinsk. Thisis confirmed by a simple test of beam-forming syntheticseismic signals (Figure S8).
3. Trajectory From Casual Video Recordsand Remote Sensing
[9] In a telegram from the International AstronomicalUnion (IAU), the Astronomical Institute of the Academyof Science, Ondrejov, Czech Republic, reconstructed themeteor trajectory in the atmosphere from seven casual videorecords. Assuming a trajectory collinear with the probableimpact site of Chebarkul Lake, they reported the locationsof four successive blasts in an ESE-WNW direction southof 55ıN latitude (Figure 3b). We corroborate this trajectoryusing images from Meteosat-7 and Meteosat-9 that have cap-tured the vapor trail left by the bolide in the atmosphere.These two geostationary meteorological satellites are respec-tively centered at the longitudes of 57.5ıE and 0ıE. Werectified and projected the acquired satellite images from theelevation of the trail (Figure S9). We used SEVIRI imagein Level 1.0 from Meteosat-7 to compute possible vaportrail trajectories. Meteosat-7 images were preferred as closerto the longitude of the meteor event. We tested elevationsbetween 40 km and 55 km for the eastern extremity of thetrail and between 10 and 25 km for the western end. The best
match, collinear with the impact site of the Chebarkul Lake,is a vapor trail extending from 45 km altitude to the eastto 18 km to the west. The meteor trajectory intersects ourbroad maximum of seismic beam forming which containsthe four blasts (Figure 3b). Seismic beam-forming, casualvideo records, and remote sensing concur with the main blast(Figure 3b, double red dot) that occasioned damages andinjuries in Chelyabinsk being the seismic initiator for theseismic Rayleigh waves.
4. Discussion and Conclusion
[10] The theory of coupling between infrasound wavesand elastic ground motion indicates that P and S body wavesmay be initiated as well as Rayleigh waves [see, for exam-ple, Ewing et al., 1957, pp. 183 and 220–238]. These wavesare generated when and where the sweep velocity of theinfrasonic trace at the Earth’s surface precisely matches thepropagation velocities of the seismic waves. The strong con-trast between infrasonic waves that propagate in the air withvelocities close to the sound (c � 0.3 km/s) and seis-mic waves (Rayleigh, P, and S) that propagate at least 10times faster requires a very steep shock front incidence.This requires a seismic source in the close vicinity of themeteor ground-projected trajectory. We observe, however,surface waves at distances up to 4000 km from Chelyabinsk.At these distances, our observed Rayleigh waves must thusarrive as precursors of the shock waves. We looked in therecords for the shock wave as well as the P and S seismicwaves. The lack of seismic stations in the close vicinity ofthe meteor trajectory and the interference with the Tongaearthquake render their identification difficult, even usingmethods from array seismology [e.g., Rost and Thomas,2002]. However, by comparing the observed waveformswith synthetic seismograms computed in a 3-D Earth [Trompet al., 2010], we identified the shock wave (Figure 4a) and
4

TAUZIN ET AL.: THE CHELYABINSK METEOR
possibly the P and S body waves (Figure S10) at the closeststations from Chelyabinsk.
[11] Few observations of precursory seismic waves tometeor-induced shock waves have been reported up to now.The closest to the Chelyabinsk event is probably the obser-vation of Rayleigh waves of the 1908 Tugunska event thatwere recorded as far as 5293 km away from its source region[Ben-Menahem, 1975]. Anglin and Haddon [1987] reportedprecursory Rayleigh waves associated with a meteoroidabove Yellowknife, Canada. Kanamori et al. [1991] and Sor-rells et al. [2002] also reported precursory waves to shockfronts but associated with the re-entry in the atmosphere ofthe Columbia space shuttle.
[12] The shock waves can have two main origins: ballis-tic within a narrow Mach cone or ablational due to meteorfragmentation. In these prior studies, Ben-Menahem [1975]invokes a combination of both, Anglin and Haddon [1987]used two orthogonal lines of stations in the vicinity of themeteor track to identify a ballistic shock wave. In the caseof the space shuttle studies, it is clear that the shock wavehas also a ballistic origin. For the Chelyabinsk meteor, wedo not have a dense network of stations near the meteortrack. However, there is no clear evidence for a cylindri-cal symmetry radiation pattern along the projected path ofthe bolide. As can be seen in Figure 3, the source is notelongated in the ESE-WSW direction of the meteor trackalthough our resolution is good in this direction. Figure 3would thus be in better agreement with a spherical sourcedue to fragmentation [Edwards et al., 2007].
[13] We estimate an equivalent surface wave magnitudeMs for the Chelyabinsk event (Figure 4b). Using the Praharelation [Karnik et al., 1962] Ms = log(A/T) + 1.66 �
log(�) + 3.30, where A is the amplitude of Rayleigh wavedisplacement on the vertical component in �m and � is theepicentral distance, we find a magnitude Ms = 3.7˙0.3. Thismagnitude, comparable to that (Ms �5) of the Tugunskaevent [Ben-Menahem, 1975], would correspond to a releaseof energy of � 2 � 1010 J from an equivalent �5 T TNT. TheNASA Near-Earth Object Program reported an approximateinitial diameter for the asteroid of 18 m and a rough esti-mation of the observed total radiated energy by the fireballof about 90 kT. A rough estimate of the ratio between theseismic energy and the energy released within the atmo-sphere is � 5 � 10–5. Such limited efficiency is consistentwith results from observations of coupling between aerialacoustic sources and ground motion [e.g., Brown et al.,2002] and similar to what is reported for the Tugunska event[Toon et al., 1997].
[14] Present results that use precursory Rayleigh wavesinduced by the atmospheric breakup of an asteroid to esti-mate an equivalent seismic source energy give interest-ing perspectives for planetary seismological missions. Forinstance, the NASA mission InSight (Interior Explorationusing Seismic Investigations, Geodesy, and Heat Transport)plans to land a seismometer on the surface of Mars to inves-tigate among others, the rate of meteorite impacts. Even ifthe present atmosphere of Mars is about 150 times thin-ner than the Earth’s, atmospheric breakup of interplanetarymeteoroids on Mars is predicted and even observed. Popovaet al. [2003] predicted atmospheric breakups for bolidessmaller than 20 cm in diameter. The recent inventory of freshMartian impact craters detected between two spacecraftsurveys highlights even more atmospheric breakup [Daubar
et al., 2013; Malin et al., 2006]. Clusters of impact cratersthat result from atmospheric breakup are widely observeduntil 35 m of equivalent crater diameters. Present resultsthus offer perspectives for impact rate survey on Mars by aseismological space mission.
[15] Acknowledgments. This work was supported by a Chaired’Excellence Fellowship from CNRS. The research has received fundingfrom European Research Council under the European Union’S SeventhFramework Program (PF7/2007-2013)/ERC grant agreement n280168. Wethank two anonymous reviewers for their constructive comments. We thankYanick Ricard for his review and Bertrand Trey for a discussion on present-day impact flux on planetary bodies. We thank the Princeton group forproviding 3-D synthetic seismograms calculated based upon the spectralelement method. The seismograms have been obtained from the GlobalShakeMovie portal (http://global.shakemovie.princeton.edu/). We thank theIRIS and Geoscope Data centers for providing seismological data.
[16] The Editor thanks two anonymous reviewers for their assistance inevaluating this paper.
References
Anglin, F., and R. Haddon (1987), Meteoroid sonic shock-wave-generated seismic signals observed at a seismic array, Nature, 328,607–609.
Ben-Menahem, A. (1975), Source parameters of the Siberian explosion ofJune 30, 1908, from analysis and synthesis of seismic signal at fourstations, Phys. Earth Planet. Inter., 11, 1–35.
Brown, P., D. ReVelle, E. Tagliaferri, and A. Hildebrand (2002), An entrymodel for the Tagish lake fireball using seismic, satellite and infrasoundrecords, Meteor. Planet. Sci., 37, 661–675.
Daubar, I., A. McEwen, S. Byrne, and C. Dundas (2013), The currentMartian cratering rate, Icarus, 225, 506–516.
Edwards, W., D. Eaon, and P. Brown (2007), Seismic observationsof meteors: Coupling theory and observations, Rev. Geoph., 46,1–21.
Efron, B., and R. Tibshirani (1991), Statistical data analysis in the computerage, Science, 253, 390–395.
Ewing, W., W. Jardetzky, and F. Press (1957), Elastic Waves in LayeredMedia, McGraw-Hill, New York.
Kanamori, H., J. Mori, D. Anderson, and T. Heaton (1991), Seis-mic excitation by the space shuttle Columbia, Nature, 349,781–782.
Karnik, V., N. Kondorskaya, J. Riznitchenko, E. Savarensky, S. Soloviev,N. Shebalin, J. Vanek, and A. Zatopek (1962), Standardization ofthe earthquake magnitude scale, Studia Geophysica et Geodaetica, 6,41–48.
Kennett, B., and E. Engdahl (1991), Travel times for global earth-quake location and phase identification, Geophys. J. Int., 105,429–465.
Lay, T. (1987), Analysis of near-source contributions to early P-wave codafor underground explosions. III. Inversion for isotropic scatterers, Bull.Seismol. Soc. Am., 77, 1767–1783.
Le Pichon, A., L. Ceranna, C. Pilger, P. Mialle, D. Brown, and P. Herry(2013), 2013 Russian Fireball largest ever detected by CTBTO infra-sound sensors, Geophys. Res. Lett., doi:10.1002/grl.50619.
Malin, M., K. Edgett, L. Posiolova, S. McColley, and E. Noe Dobrea(2006), Present impact cratering rate and the contemporary gully activityon Mars: Results of the Mars Global Surveyor extended mission, Science,314, 1573–1557.
Popova, O., I. Nemtchinov, and W. Hartmann (2003), Bolides in the presentand past martian atmosphere and effects on cratering processes, EarthPlanet. Sci. Lett., 38, 905–925.
ReVelle, D. (1976), On meteor generated infrasound, J. Geophys. Res., 81,1217–1229.
Ritzwoller, M., and A. Levshin (1998), Eurasian surface wave tomography:Group velocities, J. Geophys. Res., 103, 4839–4878.
Rost, S., and C. Thomas (2002), Array seismology: Methods and applica-tions, Rev. Geoph., 40, 1–27.
Shapiro, N., and M. Ritzwoller (2002), Monte Carlo inversion for a globalshear velocity model of the crust and upper mantle, Geophys. J. Int., 151,88–105.
Sorrells, G., J. Bonner, and E. Herrin (2002), Seismic precursors to spaceshuttle shock fronts, Pure Appl. Geophys., 159, 1153–1181.
Toon, O., K. Zahnle, D. Morrison, R. Turco, and C. Covey (1997), Envi-ronmental perturbations caused by the impacts of asteroids and comets,Rev. Geoph., 35, 41–78.
Tromp, J., et al. (2010), Near real-time simulations of global CMT earth-quakes, Geophys. J. Int., 183, 381–389.
5