seismic testing report - yma.gov.yk.ca
TRANSCRIPT
SEISMIC TESTING REPORT
Wade Creek PLg8774 7
. . NTS 115G
, I . , . , .
Prepared for
Owner: Paul Joseph 30 Balsam Crescent Whitehorse, Yukon
Y1A 4V7 and
Fieldsman: Scott Cone Box 964
Dawson City, Yukon YOB 1GO
Prepared by Ted Sandor
RR1 Site 20 Comp 121 Whitehorse, Yukon
Y1A 426 (PAonaf la~ 667- 6199 ,@09/)
Q)EcM&?R 22. 1991

This report has been exarniried 11 the Geological Evaluation Unit under Section 4 1 Yukon Placer Mining Ac: and is recommended as allowable representation work in the amount of $...! .,.. 4.0 a..:..o.o, ..................
Chief Geologist, Exploration and Geological Services Division, Northe .n Affairs Program for Commissioner cf Yukon Terr i t~ fy .
1. Introduction Location Map Figure A Location Map Figure B Claim Map Figure C
2. Survey 2.1 Location and Access 2.2 Claim Information
3. Personnel
4. Geology
5. Instrumentation
6. Theory Figure 1 Schematic of Seismic Refraction
Survey Figure 2 Schematic of Seismic Reflection
Survey Figure 2b Amplitudes of Reflected/
Refracted Compressional Waves Table 1A Speed of Propagation of Seismic
Waves in Subsurface Materials Table 2A Range of Velocities of Longitudinal
Waves for Representative Materials
7. Method
8. Data Processing and Presentation
9. Interpretation
10. Conclusion
11. Recommendation Seismic-Recording Printouts

Table of Contents Continued ...
12. Statement of Assessment Costs
13. Certification
14. References

ASSESSMENT REPORT
on December 22,1991
Seismic Survey
on Wade Creek
PL#8774
1. INTRODUCTION
On December 22,1991 a seismic survey was conducted on Wade Creek PLW774 for the owner Paul Joseph by fieldsman Scott Cone.
Scott Cone, using a compass and hip chain, located four (4) test sites on PLN3774. Test location was marked with flagging and labelled (See Fig.C).
The seismic consultant, Ted Sandor, processed field recordings and interpreted the data received.
Seismic Testing Report, PW87.74, h e m b e r 2g 1991 1

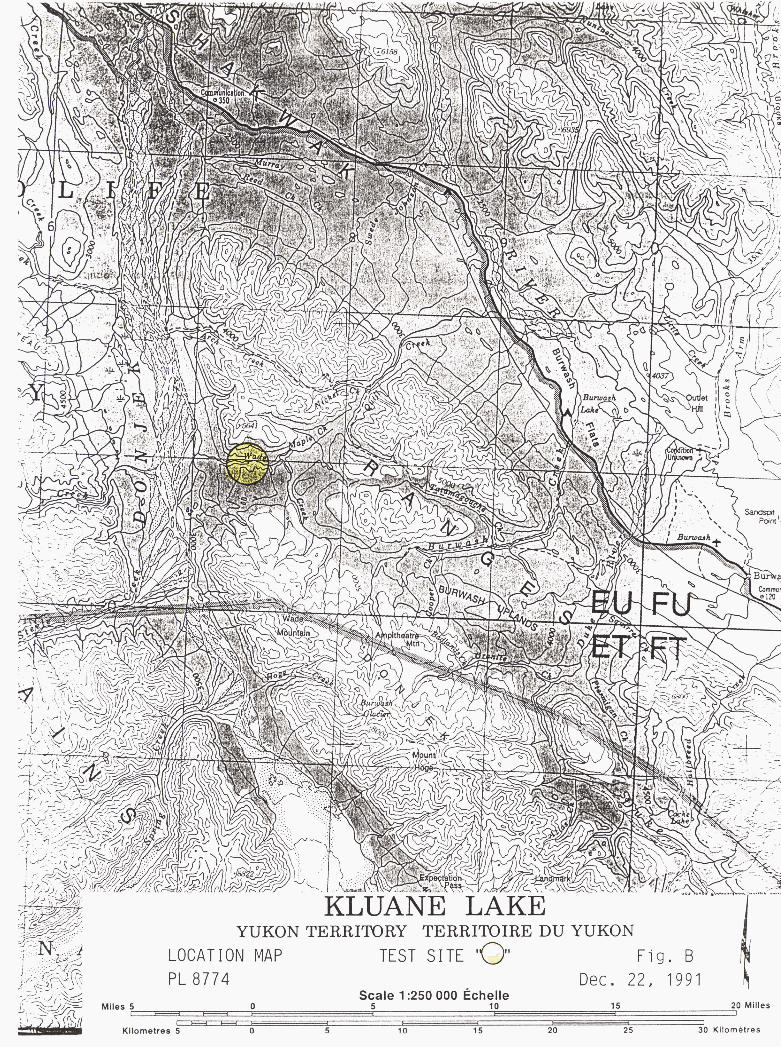
YUKON TERRITORY TERRITOIRE DU YUKON LOCAT ION MAP TEST S I T E '0' F i g . B PL 8774 Dec. 22, 1991 1
Scale 1 :250 000 kchelle - I 0 5 10 15 20 Milles
1 I - - , 1
Kilometres 5 0 5 10 15 20 25 30 Kilornbtres


2. SURVEY
2.1 Location and Access
Placer Lease #8774 is located 35 miles northwest of Burwash Landing.
Access to the test site was by 4x4 pickup on road. The last 15 miles was done by snowmobile. Testing was done on foot. (See Access Map Fig B)
2.2 Claim Information
Name Placer Claim Number Owner
N/A PLa8774 Paul Joseph
- -
Seismic Testing Report, PL #8774 December 22: 1991

3. PERSONNEL
Scott Cone surveyed, marked, measured, expedited and carried out the field work.
Ted Sandor supervised the quality, directed the data processing and prepared the report.
Seismic Ted i~g Report, PL 43774, December 22 1991

4. GEOLOGY
Unconsolidated glacial and alluvial deposits. Mineralization is evident. With NI., CU., Pt, Au and gyp. to the north, east and south the prospects look excellent. Being between 2 thrust faults anything could be possible.
Seismic Testing Report, PL #8774, December 22 1991 4
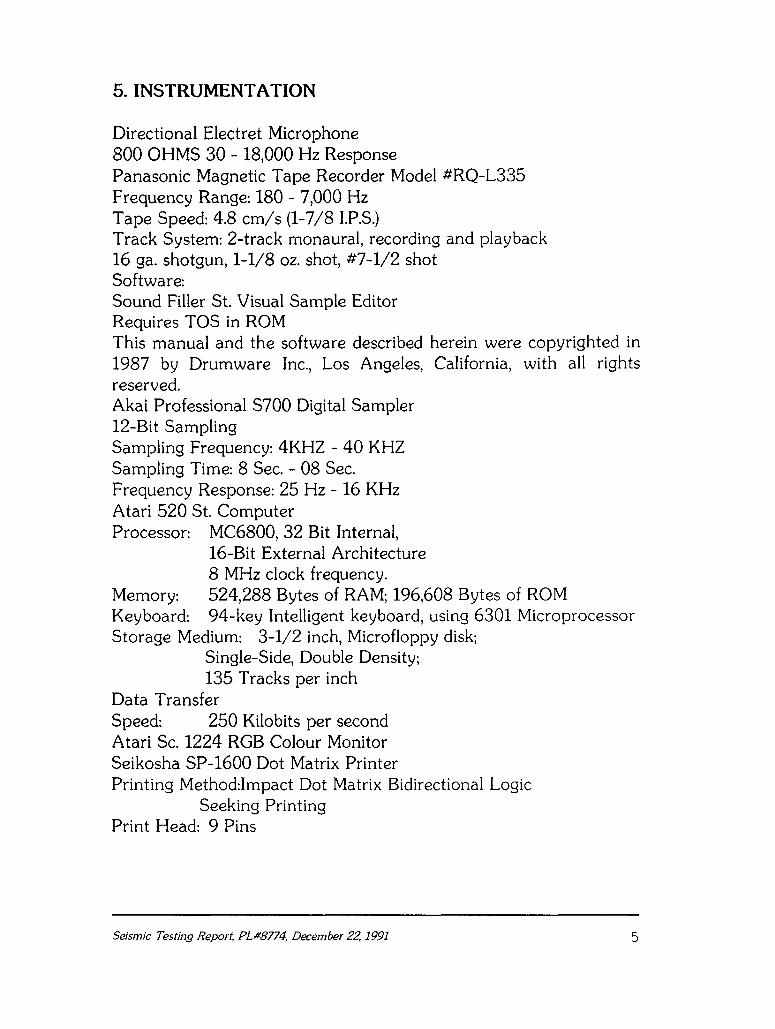
5. INSTRUMENTATION
Directional Electret Microphone 800 OHMS 30 - 18,000 Hz Response Panasonic Magnetic Tape Recorder Model #RQ-L335 Frequency Range: 180 - 7,000 Hz Tape Speed: 4.8 cm/s (1-7/8 I.P.S.) Track System: 2-track monaural, recording and playback 16 ga. shotgun, 1-1/8 oz. shot, #7-1/2 shot Software: Sound Filler St. Visual Sample Editor Requires TOS in ROM This manual and the software described herein were copyrighted in 1987 by Drumware Inc., Los Angeles, California, with all rights reserved. Akai Professional S700 Digital Sampler 12-Bit Sampling Sampling Frequency: 4KHZ - 40 KHz Sampling Time: 8 Sec. - 08 Sec. Frequency Response: 25 Hz - 16 KHz Atari 520 St. Computer Processor: MC6800,32 Bit Internal,
16-Bit External Architecture 8 MHz clock frequency.
Memory: 524,288 Bytes of RAM; 196,608 Bytes of ROM Keyboard: 94-key Intelligent keyboard, using 6301 Microprocessor Storage Medium: 3-1/2 inch, Microfloppy disk;
Single-Side, Double Density; 135 Tracks per inch
Data Transfer Speed: 250 Kilobits per second Atari Sc. 1224 RGB Colour Monitor Seikosha SP-1600 Dot Matrix Printer Printing Method:Impact Dot Matrix Bidirectional Logic
Seeking Printing Print Head: 9 Pins
Seismic Testing Report, PLM774, December 22 1991 5

6. THEORY
This report is intended as a guide to the application of seismic refraction and reflection techniques to shallow, subsurface exploration of engineering sites. Many civil engineers and geologists have some acquaintance with this basic geophysical tool, but few apply it frequently. The primary purpose of the report is to provide the reader with a working knowledge of the method, with a convenient reference, and further, with a basis to judge the applicability of the method and the results to his particular exploration problem.
Solid state electronics have improved the portability of engineering- type refraction and reflection instruments, but they operate fundamentally in the same way they did 50 years ago. The basic field practices and methods of interpreting the data have not changed with time, although specialized interpretational techniques have been proposed and developed for some difficult cases.
The conduct of refraction and reflection surveys and the interpretation of the data are well-established and reasonably straight forward, although they are not invariant. The user can change the field layout of his equipment and apply judgement and imagination in his handling of the raw data. In common with other indirect methods of subsurface exploration, there are no rigid inflexible approaches to making sense of the data, nor are there any handbooks that infallibly direct the engineer, geologist or geophysicist to the correct answer. The general case will require thought and care: ambiguities and uncertainties are not uncommon. Some foreknowledge of the site conditions and an understanding of what is geologically plausible will always assist in resolving the raw data into meaningful information.
Figure 1 shows a refraction survey. This method could be quite costly and require complicated data processing should multiple layers of soil and gravels be encountered.
Seismic Testing Report, PL #8774, December 22 1991 6

6. THEORY CONTINUED
b
Travel-times of first impulse
I 0
0 I I . I 1 I 1 1 0 100 200 300 400 500
Distance - ft &cording equipment , .
Exploriw chorga in shallow hole . .
Figure 1. Schematic of Seismic Refraction Survey
There is a definite relation between reflected and refracted energy which could be observed in Figure 2B. Using this principle and Tables A1 and A2 calculation is simplified, for the sound in a reflected survey only has to go down, turn around at point of geophone or microphone without going along the higher velocity layers and then back up. Seismic waves will bounce off of most surface with a lot of amplitude but not necessarily with a wide range of frequencies. The reflected seismic waves returning to the geophone with the strongest amplitude and frequencies should come from the layer with the highest velocity change which, in most cases, should be bedrock (solid rock) or from a gravel layer directly beneath an organic surface cover.
Seismic Testing Report, PL December 22 199I 7

6. THEORY CONTINUED
Figure 2. Schematic of Seismic Reflection Survey
The thicker line representing the reflected seismic wave from the bedrock to the microphone should be the wave with the highest amplitudes and the widest range of frequencies in Figure 2. The six foot distance from microphone to charge is to prevent damage to the delicate recording equipment. The error of this footage can usually be made up by averaging the total of the velocities a little higher to simplify interpretation. In this case "1,200 ft/sec." will be close enough.
Seismic Testing Report, PL #8774, Deem ber 2.1991 8

THEORY CONTINUED
C Refracted wave C Q)
m u a '3 C
u c 1.0- Q) * - - u. 0 ?; -
m > c == - 0 0
BT + - 0 f~ 0.5 2 >
0 e 3 C c - z 2 - Critical angle
2 u ur - of incidence 2 s I I J - * - k g (j Pg e 10 20 30 40
Angleofincidence-dog
Fig. 2b. Amplitudes of reflected and re- f racted compressional waves relative to incident waves as a function of angle of incidence.
Figure 2b Amplitudes of Reflected/ Refracted Compressional Waves
It may seem anomalous in Figure 2b that the sum of the amplitudes of the reflected and refracted pulses is greater than that of the incident wave (i.e., greater than 1.0). However, the energy of a pulse is proportional to the square of its amplitude, and the sum of the energies of the reflected and refracted waves is equal to the energy of the incident wave.
Seismic Testing Report, PL #8774, December 22 I991 9

Table A l . Speed of propagation of se i smic waves in subsurface mater ials .
L I G H T A N 0 D R Y
L b l S T , L O A M Y O R S I L T Y
C L A ~ E Y
R E D C L A Y I N C O L O R A O O ( *
S C M I . c o * s O L l o A T C o S A N O Y C L A Y
W E T L O A M ( 1 1
C L A Y . O C N S C A M 0 W E T O f ~ C Y O I N G O N O C P T U
RUIILL. OR C R A V C L ' ~ )
G L A C I A L U O R A I N E o c r o s l r . o a ~ . C ~ ~ ~ r o a w l ~ ( A
G L A C I A L U O R A I Y E D E P O S I T . S A T V R A T L O - C A L I T O R Y I A
C f ~ ~ c ~ r f o L A V A A G G L O Y C R A T L . CAL I~OIN IA "
L o o s c P O C K . T A L U S
N C A T ~ C ~ E O ANO F R A C T U R E D R O C K
C O L O ~ A O O . C O N T A l n l N G m C A T N C R L 0 S E A M S A N 0 s o r r A R C A S . ( A )
S v o i r .HILL RIVER K A N S & S
S A U O C T O U E C O N U D L 4 f R A T E ( 1
- -
F E E T PER
SECOND
F P I A ~ L E AND W I G ~ L Y D E C O M P O S C O
BADLY F ~ A C T U P C D AND P A R T L Y D C C O M P O S C O
8 4 0 ~ 1 B R O I C M A N D ~ L A T H E R C O : f R 1 O U C M T L Y O N L Y c n l r s AND IIAC'JCNTS O C C O V E I C D . SCUICNTS O f C O R C L O M G C I . I U T I f A - rn rn lno W A O P C N C T R A T E O ABOUT 114 lncn OM c rcn S I O C O f T H E J O I N T P L A N C S OW W H I C H A F I L M O f I t . SIOUAL C L A Y n r o r o n w r o
J O I N T P L A N E S S H O W I U T L I T T L C S ! G N o r . C A T n c R . ING. E V C M rnoucn T U E Y
A R E O P E N
E N T I R E L Y U N W E A T U C R E O A N 0 U N S C A U C O
F E E T P E
S E C O N C
( A 1 h p o r t c d t y C. A t . I r l l i a r x . U . S. B u r r o l Pvbl i c R o a d .
("iror Repor t o f I m p e r i a l C r o p h y r i c a l E x p e r i m e n t a l S u r v e y i n A u r t r a l i a
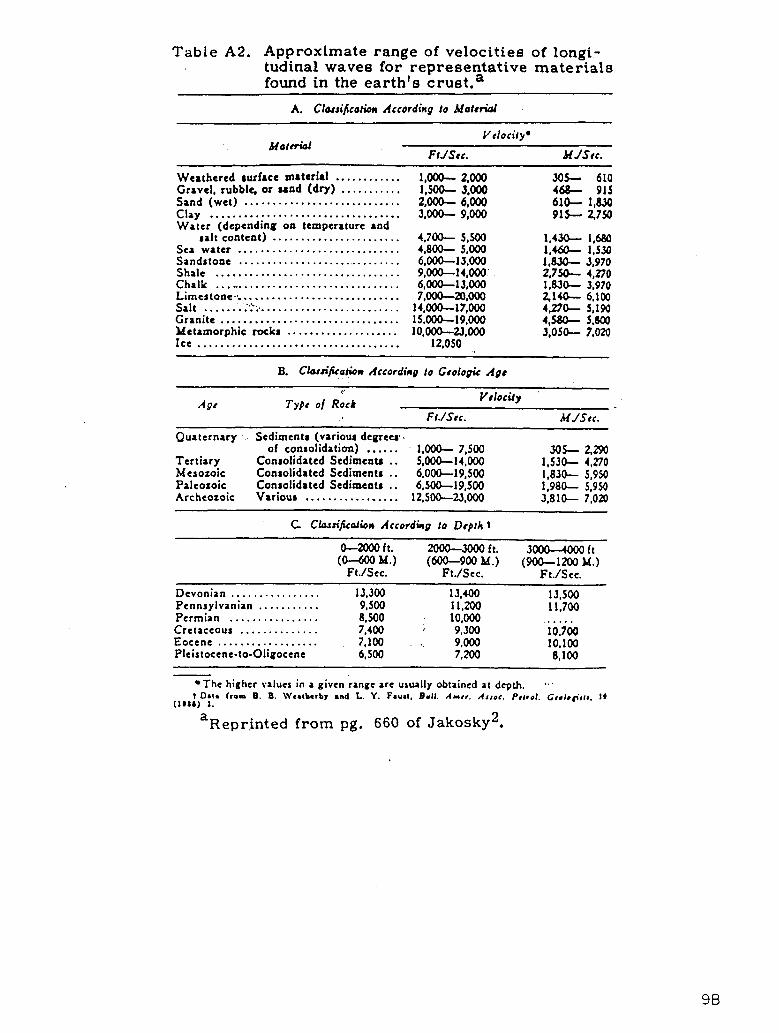
Table A2. Approximate range of velocities of longi- tudinal waves for representative materials found in the earth's crust.a
A. Clm;ificatim According to M o t e r i d
Ve loc i t y* Marrriol
F t J S t c . bf I S e c .
............ Weathered rur f rce material 1,000- 2,oO(J 30% 610 ........... Gravel, rubble, o r rand (dry) 1,500- 3,000 468- 915 Sand (wet) ............................ 2,000- 6,000 610- 1,830 Clay .................................. 3,000- 9,000 91% 2,750 Water (depending o n temperature and
....................... ra l t content) 4,700- 5,500 1.430- 1,680 ............................. Sea water 4,800- 5.000 1,- 1,530
Sandstone ............................. 6,000-33,000 1,830- 3,970 Shale ................................. 9,000-14,000 2,7% 4,no Chalk .. .-.. ........................... 6,000-13,000 1,830- 3,970 Lirnestone.r ............................ 7,000-20,000
..% 2, 1% 6,100
Salt .................................... 14,000-17,000 4,270- 5,190 Granite ................................ 15.000-39,000 4,- 5.W Metamorphic rockr .................... 10,000--23,000 3,050- 7,020 I c e .................................... 12,050
B. Chrn'fiath According to Geologic A g t
T y p e o f Rock Y e l o c a y '
A g e Ft . /Sec . M J S e c .
Quaternary Sedimentr (variour degreu.. o f consolidation) ...... 1,000- 7,500 3 0 6 2,290
Tert iary Consolidated Sedimentr . . 5,00e14,000 1,530- 4,270 Merozoic Consolidated Sediments . . 6,000-19,500 1,830- 5,950 Paleozoic Conrolidated Sediments . . 6,500-19,500 1,980- 5,950 Archeozoic Various ................. 12,500-3,000 3,810- 7,020
C Chrs i f ia t ion Accordmg to Deptk t
0-2000 f t. 2000-30OQft. 3000--4000ft (0600 M.1 (600-900 M.) (900-1200 M.)
Ft./Sec. Ft./Scc. Ft./See. - --
Devonian ................ 13.300 13,100 13,500 ........... Pennsylvanian 9,500 11.200 1 1.700
................ Permian 8,500 10,000 ..... .............. Cretaceous 7,400 I 9.300 10.700
Eocene .................. 7,100 .. 9.000 10.100 Pleistocene-to-Oligocene 6,500 7,200 8,100
The highcr ralucs in a givcn range arc usually obtained a t depth. a
t Oat. from 8. B. Wcathcrby and L. Y. FWSI. Ball. Amrr . Arroc. P81rol. GfoIegi j I ; . I @ ( r m r b ) 1.
a Reprinted from pg. 660 of ~ a k o s k ~ ~ .

7. METHOD
After the grid pattern is established on a given claim by the owner or party in charge, we mark each test with flagging. We clean loose debris to allow firm soil contact with the microphone. We then cover the microphone to lessen the surface noise. A small charge is fired (usually a 16 gauge shotgun) to generate a seismic wave six feet from the microphone. The wave going into the ground and the reflected signal coming out is recorded on a magnetic tape recorder. We also do a field test on a nearby area with similar conditions where bedrock depth is known by drilling or excavation to determine the velocity of the gravels.
Seismic Testing Report, PL #8n4, December 22 1991 10

8. DATA PROCESSING AND PRESENTATION
The recording is sent back to base camp and is transferred into the Akai S700 Digital Sampler by means of a coaxal cable with 6.3 mm phone plug jack. The Akai is coupled with the Atari 520 St. computer with Midi Interface. Other peripherals are connected with various other interface connections.
The seismic recording is now analyzed in various formats and then the best choice is printed out on a Seikosha SP-1600 Dot Matrix Printer. A report on the testing and the interpretation of the data is made out to finalize the survey, along with copies of the original Fourier Transform for 3-D wave form analysis.
- -
Seismic Testing Report, PL#8774, Deem ber 2g 1991

9. INTERPRETATION
In tests conducted in the past on Hunker Creek and the Klondike River, we determined that those frozen gravels had a velocity of 1500 ft/sec. (1.5 ft/ms). Based on this calculation the following formula is used:
Reflected milliseconds x 1.5 divided by 2 = feet to bedrock or the layer of interest.
6 milliseconds indicate Bedrock at 5 feet. 40 milliseconds return (30 ft. would indicate rock wall).
6 milliseconds indicate Bedrock at 5 feet. 42 milliseconds return (32 feet would indicate rock wall).
10 milliseconds indicate Bedrock at 8 feet.
6 milliseconds indicate Bedrock at 5 feet.
Seismic Testing Report, PL #8774, December 22 1991 1 2
10. CONCLUSION
For the many varying soil conditions in different geographical locations could alter the final results. For this fact, an actual excavation on one of the test sites is strongly recommended. The most shallow reading test site is the best suited for this purpose. More accurate results can be achieved in this manner.
Seismic Testing Report PLM774, December 2Z: 1991 13

11. RECOMMENDATION
This type of reflected seismic testing is ideal in shallow placer ground. Without drilling or excavating near the test sites to establish velocity, the contour of the subsurface profile could still be charted in a cross test of a given valley. Old stream beds are possible to locate this way, giving a target area for a drill. A re-analysis of the seismic data after a drill log can make these tests surprisingly accurate. A tighter grid pattern in the future may be of great value in a drilling or mining strategy program.
Seismic Testing Report, PL M774, December 22: 1991 14


.8 1 a80 3.61 5.42 7.22 9.03 10.84 12.64 14.45 16.26 18.06 frequency i n Khz
Sample Rate= 39555 H z /
A i File Rkai Vaice Wave P PL 8774 Tes t 2

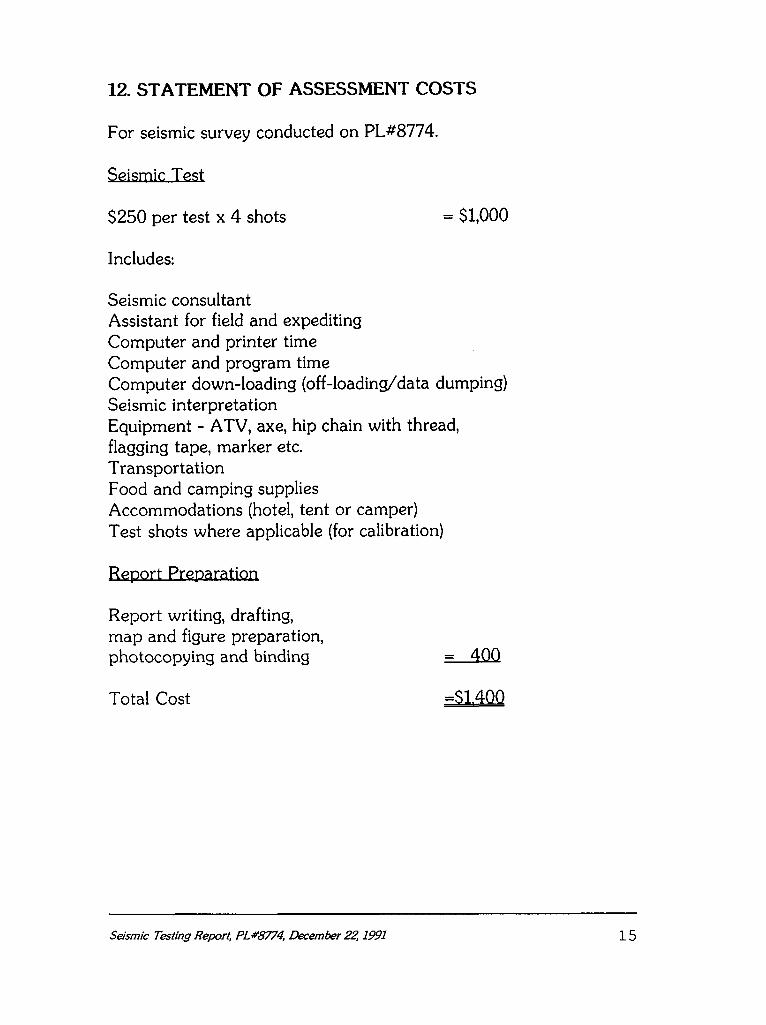
12. STATEMENT OF ASSESSMENT COSTS
For seismic survey conducted on PL#8774.
. . eismlc Test
$250 per test x 4 shots
Includes:
Seismic consultant Assistant for field and expediting Computer and printer time Computer and program time Computer down-loading (off-loadinddata dumping) Seismic interpretation Equipment - ATV, axe, hip chain with thread, flagging tape, marker etc. Transportation Food and camping supplies Accommodations (hotel, tent or camper) Test shots where applicable (for calibration)
Report writing, drafting, map and figure preparation, photocopying and binding
Total Cost
Seismic Testing Report, PL#8774, December 22 1991 1 5

9. 3 e d Sandor. 06 Whitehorse. y u h o n ger r i to ry certily that:
1. S hoed a gas and LAIC Wetd ing diptoma 6rom Jorthern d b e r t a
Snstitute 06 5ecknoPogy. gdmonton. LAPberta, and Lave been practising
~~n t i nuous t y since mid seventies in LArdco Sndustnies on oit 6iePd and
seismic retated equipment.
2. 9 am a Journeyman wetden. ticensed to practise in LAPberta. 5Jhe
geophysicat technotogy came lrom extensive (ietd worh in the oit patch. and
the very need to satis6y my own mining strategy since 1978.
9. 5JLe geophysical l i e td worh was conducted with assistance that may
change 6rom test to test. FJke report preparation and interpretation is done
by me personatty to beep up the highest quatity 06 this report.
4. 4 have based concQusions and recommendations contained in this report
on my hnowtedge 06 geophysics, my previous erperience and the resutts 06
the 6iePd worh conducted on the property.
5. CDirectty or indirectty 9 hotd no interest in this property other than
prolessionat lees. nOk do 9 expect any interest in the properly or any
other 06 the owner's Lotdings.
6. 5Jhe accuracy 06 the l i n d resuQts depends more on the cat ihat ion 06
the recording device and the computers tken on the quati6ication 06 the
operator.

13. REFERENCES
1. M.B. Dobrin, M o d u c t i o n to Gee- Prospecting (McGraw-Hill, New York. 1960)
2. J.J. Jakosky, E , x p h a b n G-. (Trija Publishing Co., Newport Beach, California. 1957)
3. Technical Report E-73-4 Seismic Refraction Exploration for Engineering Site Investigations. Bruce B. Redpath (May, 1973)
4. 1984 Open File, R.L. Debicki, Bedrock Geoloqy and on of the Klo e Area (West),
1150/14,15 and ll6B/2,3.
5. J.K. Mortensen, Geochemistry of W o n d i k e District, West Central, Revised, 1990.
Seismic Testing Report, PLW774, &ember 22: 1991 17