seismic qualification and time history shake-table testing ... · testing of high voltage surge...
TRANSCRIPT

Ullah et al., Cogent Engineering (2018), 5: 1431375https://doi.org/10.1080/23311916.2018.1431375
ELECTRICAL & ELECTRONIC ENGINEERING | RESEARCH ARTICLE
Seismic qualification and time history shake-table testing of high voltage surge arrester under seismic qualification level moderateNoman Ullah1*, Syed Mohammad Ali2, Rahman Shahzad3 and Faisal Khan1
Abstract: Earthquakes are one of the deadliest forces of nature that can shake structures to their limits. No comprehensive study has been done in Pakistan on seismic performance of electric supply substations and requires immediate at-tention as Pakistan is one of the highly seismic area in the world with potential of large earthquakes. Seismic qualification of electric supply substation equipment (132 kilo Volt surge arrester) by time history shake-table testing is presented in this paper. This equipment was tested under “Seismic Qualification Level Moderate” that is according to earthquake input requirements of this region. An artificial time history was generated that qualifies the Required Response Spectrum of Pakistan Electrical and Telecom Safety Code (PETSAC-2014) and IEEE Recommended Practice for Seismic Design of Substations (IEEE Std. 693-2005). Two types of measurements (displacement and acceleration) were recorded during time history shake-table test-ing at four different points using six accelerometers and four displacement trans-ducers. Seismic qualification of electric supply substation equipment is totally a new dimension in Pakistan’s electrical power system.
Subjects: Structural Mechanical Engineering; Structural Engineering; Georisk & Hazards; Life-Long Design; Power Engineering
Keywords: time history shake-table testing; required response spectrum; seismic qualification level moderate; pakistan electrical and telecom safety code; high voltage electrical equipment
*Corresponding author: Noman Ullah, Electrical Engineering Department, COMSATS Institute of Information Technology, Tobe Camp, Abbottabad, PakistanE-mail: [email protected]
Reviewing editor:Sérgio Cruz, University of Coimbra, Portugal
Additional information is available at the end of the article
ABOUT THE AUTHORSNoman Ullah is serving as lecturer at Electrical Engineering Department, COMSATS Institute of Information Technology, Abbottabad, Pakistan. He earned BS in Electrical (Power) Engineering from COMSATS Institute of Information Technology, Abbottabad, and Masters in Electrical (Power) Engineering from University of Engineering & Technology, Peshawar in 2012 and 2015, respectively. His research interest includes design, analysis, seismic testing, and seismic qualification of high voltage electrical equipment, their concrete foundations and supporting steel structures. In design process, while following guidelines illustrated in IEEE Std. 693-2005 can reduce fatal and nonfatal accidents and ensure safety of assets of the related entities.
PUBLIC INTEREST STATEMENT8 October 2005 earthquake was one of devastating earthquake in the history of Pakistan, seriously damaged electrical power transmission system, distribution systems, and hydropower generating stations with an estimated damage of Rs. 641.8 million. Objective of this research is to reduce fatal and nonfatal accidents of employees and general public and ensure safety of assets of the related entities. If electrical power system equipment ceases to fulfil its function and needs replacement then it would have two major impacts on the society; one would be direct cost related to power system equipment and second but most expensive and costly would be the indirect cost for the entire downtime. Thus accurate performance of power system is essential before, during and after natural disasters such as earthquakes.
Received: 06 October 2017Accepted: 18 January 2018First Published: 23 January 2018
© 2018 The Author(s). This open access article is distributed under a Creative Commons Attribution (CC-BY) 4.0 license.
Page 1 of 21
Noman Ullah

Page 2 of 21
Ullah et al., Cogent Engineering (2018), 5: 1431375https://doi.org/10.1080/23311916.2018.1431375
1. IntroductionSafety of employees and general public from electrocution and allied hazards, and safety of utility assets shall be top priority of all utility companies (transmission and distribution) in Pakistan (Pakistan Electrical & Telecom Safety Code [PETSAC], 2014). Electric supply substations are vital component of electrical power system. In case of a natural or manmade disaster, if electric supply substations cease to fulfil its function, it can further exacerbate an emergency situation and impede provision of much needed emergency services, such as, in hospitals and emergency shelters. Apart from their functional and strategic importance, electric supply substations are expensive infrastruc-ture assets whose survival in an extreme event is highly desirable, as replacement costs are high and social and economic costs during the downtime can be significant. Thus, ensuring safety of electrical power distribution network and facilities under extreme events is essential.
Earthquakes are one of the deadliest forces of nature that can shake structures to their limits. The term used to define the potential of earthquakes is “Seismic Hazard”. Different areas would have different seismic hazard based on the studies of past earthquakes by means of geological and seis-mological studies done by researchers dealing with earth sciences and seismology.
The IEEE Std. 693-2005 “Recommended Practices for Seismic Design of Substations” (IEEE Std. 693-2005, 2005) provide comprehensive set of guidelines for the seismic design of substation build-ings, structures, and equipment. IEEE Std. 693-2005 (2005) is intended to establish standard meth-ods of providing and validating the seismic withstand capability of electrical equipment. It provides detailed test and analysis methods for each type of major equipment. It establishes standard meth-ods of verifying seismic withstand capability, which gives the designer the ability to select equip-ment from various manufacturers, knowing that the seismic withstand rating of each manufacturer’s equipment is an equivalent measure. Significant portion of the guidelines is devoted to the require-ments for “Seismic Qualification” of substation equipment. “Seismic Qualification” of equipment may be defined as “A process which consists in establishing the appropriate withstand capabilities of an equipment against seismic forces that are considered appropriate for the class of equipment being considered, assuring that the equipment being qualified shall function after a seismic event and its service life is not compromised”.
The use of seismic response spectra as a means for qualifying equipment either by calculation or by test has become the most widely accepted and powerful method. The various methods recog-nized by IEEE Std. 693-2005 (2005) for carrying out seismic qualification of electrical equipment (Surge arrester) include qualification by: Inherently acceptable, static coefficient analysis, dynamic response spectrum analysis, and time history shake-table testing.
1.1. Inherently acceptableNeither a seismic report, a nameplate, nor a seismic outline drawing is required. However, calcula-tions that demonstrate the following anchorage requirements shall be provided to the user or user’s agent. The equipment anchorage shall be capable of withstanding at least 1.0 times the equipment weight applied in one horizontal direction combined with 0.8 times the weight applied in the vertical direction at the center of gravity of the equipment and support. The resultant load shall be combined with the maximum normal operating load and dead load to develop the greatest stress on the an-chorage. Both orthogonal directions shall be checked, and the greatest stresses shall be used in the design of the anchorage.
This is only valid for surge arrester having duty cycle voltage rating less than 35 kV DCV.
1.2. Static coefficient analysisThe acceleration response of the equipment shall be determined using the maximum peak of the Required Response Spectrum (RRS) at a damping value of 2%, unless a higher value for damping is justified by a test. The seismic forces on each component of the equipment are obtained by multiply-ing the values of the mass times the maximum peak of the RRS times the static coefficient. A static

Page 3 of 21
Ullah et al., Cogent Engineering (2018), 5: 1431375https://doi.org/10.1080/23311916.2018.1431375
coefficient of 1.0 or 1.5 shall be used, with 80% of the horizontal value being applied in the vertical axis. The resulting force shall be distributed over the components in a manner proportional to its mass distribution. The stress at any point in the equipment shall be determined by combining the three orthogonal directional stresses (at that particular point) by the square root of the sum of the squares (SRSS) method at that point and combining all dead and normal operating stresses in such a manner to obtain the greatest stress at the point.
This is only valid for surge arrester having duty cycle voltage rating greater than 35 kV DCV and less than 54 kV DCV.
1.3. Dynamic response spectrum analysisUsing dynamic analysis, the equipment and any support structure shall first be modelled as an as-semblage of discrete structural elements interconnected at a finite number of points called nodes. The number, location, and properties of elements and nodes shall be such that an adequate repre-sentation of the modelled item(s) is obtained in the context of a seismic analysis. The resulting sys-tem is called a finite element model. The finite element model shall be dynamically analyzed using a “modal spectrum analysis,” as described, for example, by Chopra (1980) and Gupta (1992). In general, the modal responses of the finite element model to the dynamic analysis shall have three translational and three rotational components in and about the defined orthogonal axes system.
This is only valid for surge arrester having duty cycle voltage rating greater than 54 kV DCV and less than 90 kV DCV.
1.4. Time history shake-table testingSeismic qualification by time-history testing of the equipment using a shake table is a rigorous test method which is considered to provide clear evidence of the capability of equipment to withstand seismic forces. Seismic qualification by time-history testing can be divided into two steps; namely, (1) Resonant frequency test (Free vibration test), and (2) Time history shake-table testing.
The resonant frequency search test is for determining the resonant frequencies and damping of equipment. The data obtained from the test are an essential part of an equipment qualification; however, the test does not constitute a seismic test qualification by itself. A sine sweep frequency search shall be conducted at a rate not greater than one octave per minute in the range for which the equipment has resonant frequencies, but at least from 1 Hz, in the two horizontal axes and the vertical axis to determine the resonant frequencies and the damping. The amplitude shall be no less than 0.05 g. It is suggested that an amplitude of 0.1 g be used. Damping may be found using the half-power bandwidth method. A frequency search above 33 Hz is not required. White noise may be used in lieu of the sine sweep, provided damping is found and the amplitude of the white noise input is not less than 0.25 g.
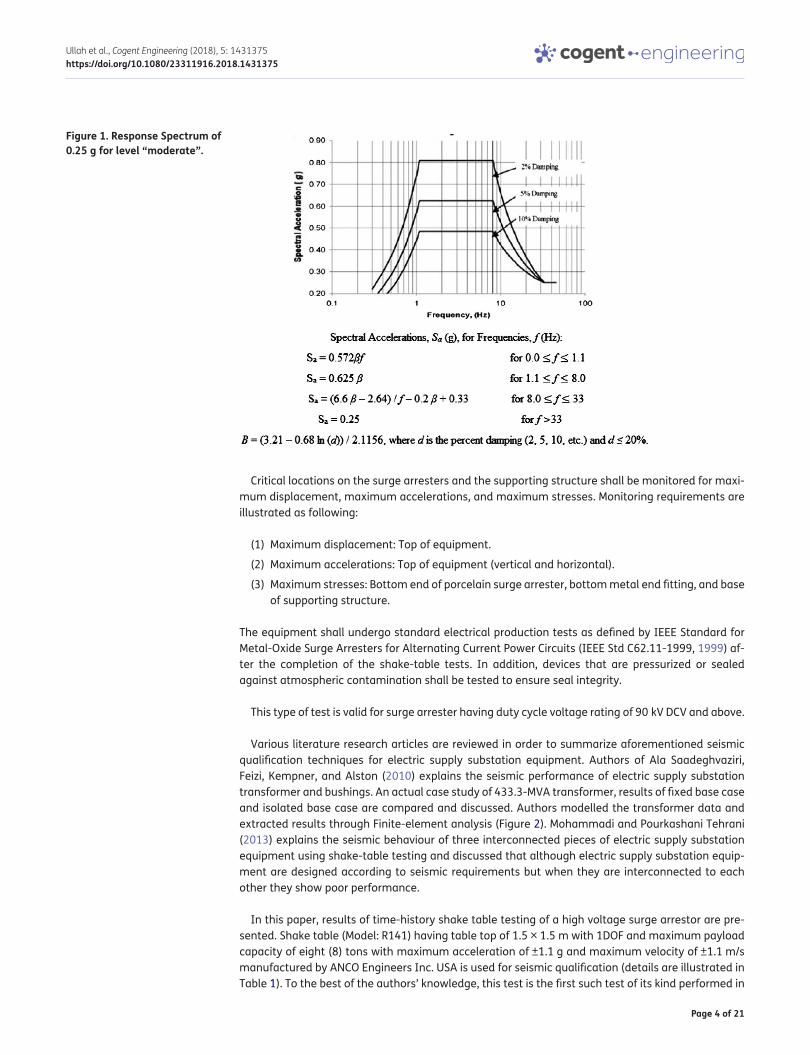
The equipment and supporting structure shall be subjected to at least one time history test. The input motion time history for Seismic Qualification Level Moderate shall satisfy the requirements of RRS shown in Figure 1. IEEE Std. 693-2005 (2005) principally uses response spectra to establish the characteristics of the time histories used to seismically qualify electric supply substation equipment. A time history may be such that its response spectrum envelops the RRS, but the energy content in certain frequency ranges will be low, so that equipment that has important natural frequencies in that range may not be adequately excited. This result can occur because of the design of the time history or the interaction of the equipment and the shake-table that is exciting it. There is a need to balance the concern that the equipment be adequately excited, with the desire to avoid over-testing equipment during its qualification. Although imposing a power spectral density requirement on the input time history can assure an acceptable distribution of energy over the frequency range of inter-est, this has proved problematic in attempting to address this issue (Kennedy, 2004). If the response spectrum of a time history is reasonably smooth, a reasonable distribution of the energy in the re-cord is also assured (Kennedy, 2004).
Page 4 of 21
Ullah et al., Cogent Engineering (2018), 5: 1431375https://doi.org/10.1080/23311916.2018.1431375
Critical locations on the surge arresters and the supporting structure shall be monitored for maxi-mum displacement, maximum accelerations, and maximum stresses. Monitoring requirements are illustrated as following:
(1) Maximum displacement: Top of equipment.
(2) Maximum accelerations: Top of equipment (vertical and horizontal).
(3) Maximum stresses: Bottom end of porcelain surge arrester, bottom metal end fitting, and base of supporting structure.
The equipment shall undergo standard electrical production tests as defined by IEEE Standard for Metal-Oxide Surge Arresters for Alternating Current Power Circuits (IEEE Std C62.11-1999, 1999) af-ter the completion of the shake-table tests. In addition, devices that are pressurized or sealed against atmospheric contamination shall be tested to ensure seal integrity.
This type of test is valid for surge arrester having duty cycle voltage rating of 90 kV DCV and above.
Various literature research articles are reviewed in order to summarize aforementioned seismic qualification techniques for electric supply substation equipment. Authors of Ala Saadeghvaziri, Feizi, Kempner, and Alston (2010) explains the seismic performance of electric supply substation transformer and bushings. An actual case study of 433.3-MVA transformer, results of fixed base case and isolated base case are compared and discussed. Authors modelled the transformer data and extracted results through Finite-element analysis (Figure 2). Mohammadi and Pourkashani Tehrani (2013) explains the seismic behaviour of three interconnected pieces of electric supply substation equipment using shake-table testing and discussed that although electric supply substation equip-ment are designed according to seismic requirements but when they are interconnected to each other they show poor performance.
In this paper, results of time-history shake table testing of a high voltage surge arrestor are pre-sented. Shake table (Model: R141) having table top of 1.5 × 1.5 m with 1DOF and maximum payload capacity of eight (8) tons with maximum acceleration of ±1.1 g and maximum velocity of ±1.1 m/s manufactured by ANCO Engineers Inc. USA is used for seismic qualification (details are illustrated in Table 1). To the best of the authors’ knowledge, this test is the first such test of its kind performed in
Figure 1. Response Spectrum of 0.25 g for level “moderate”.

Page 5 of 21
Ullah et al., Cogent Engineering (2018), 5: 1431375https://doi.org/10.1080/23311916.2018.1431375
Pakistan, as in the past it has been a practice to have such tests conducted abroad due to lack of testing facilities.
2. Technical background
2.1. Electric supply substationGeneral layout of step-down electric supply substation is shown in Figure 3. The high tension trans-mission line is received by isolator; isolator is a no-load operating device and can be only operated when the high tension transmission line is de-energized. After that current transformer is installed and is used for metering and protection purposes. Circuit breaker is the equipment that can be used to disconnect and isolate the circuit under loaded/energized conditions. Lightening/Surge arrester is used to protect the transformer from lightening and over-voltage damages. Transformer is the most important and costly equipment used in electric supply substation, it is used to step-down or step-up voltage level. Once the voltage level is decreased, the power circuit can be distributed through un-derground cables to the control panels of electric supply substation.
Figure 2. 230 kV bushing to bus connection (finite element model).
Table 1. Seismic simulator specificationName R141Manufacturer ANCO Engineers Inc. USA
Table Top 1.5 × 1.5 m
Type 1DOF
Maximum Payload Capacity 8 tons
At 4 tons
Acceleration ±1.1 g
Velocity ±1.1 m/s
Displacement ±125 mm
Frequency 0–50 Hz
Over turning movement capacity 10 ton-m

Page 6 of 21
Ullah et al., Cogent Engineering (2018), 5: 1431375https://doi.org/10.1080/23311916.2018.1431375
2.2. Seismic zones of PakistanBuilding Code of Pakistan – Seismic Provisions (2007) provides the seismic zoning map of Pakistan, which is shown in Figure 4. Pakistan has been divided into five zones. These zones are based on the peak ground acceleration ranges summarized in Table 2. The zoning map shows that significant area of Pakistan has moderate to high seismic hazard associated to it: the areas falling under Seismic Zone 2A are considered to be moderate seismic hazard areas, whereas, areas falling in Seismic Zone 2B or above are considered to be high seismic hazard areas. It is worth mentioning that the seismic zoning map of Pakistan as given in the Building Code of Pakistan (Figure 4) is based on a seismic event with a probability of exceedance of 10% in 50 years, which corresponds to an earthquake with a return period of 475 years.
2.3. Damages of earthquake and ground motionsThe most vulnerable elements in electric supply substation are bushings made by porcelain used for circuit breaker, disconnect switch, circuit switcher and lightning arrester (Takada, Bastami, Kuwata, & Javanbarg, 2004). Table 3 summarizes the damages to the substation equipment due to Bam Earthquake in Iran (Takada et al., 2004). 8 October 2005 Kashmir Earthquake was one of most dev-astating earthquake in the history of Pakistan. A damage assessment report (Asian Development Bank & World Bank, 2005) estimated that the damages just to the electricity production and distri-bution sector attributable to this earthquake were about Rs. 641.8 million.
A series of three earthquakes (Kwasinski, Eidinger, Tang, & Tudo-Bornarel, 2014) that occurred in New Zealand between 2010 and 2011. The first event (the Darfield event) of M 7.0 occurred on 4 September 2010, second M 6.1 event occurred on 22 February 2011 and third event of M 6.0 occurred on 13 June 2011. Figure 5 shows the power transmission infrastructure around Christchurch, Epicenters of three seismic events and surface rupture of 4 September 2010 earthquake. During the 4 September 2010 earthquake, a rapid increase in New Zealand’s South Island grid frequency was observed due to sudden load loss, frequency of New Zealand’s South Island grid briefly exceeded the prescribed upper limit of 50.75 Hz until power generation actuators were able to compensate.
2.4. Related work to seismic qualification of electrical equipmentShanfa, Meiying, Miaolin, Xiaofeng, and Jiyong (2009) investigated the seismic capacity of high-volt-age electric switchgear cabinet under a magnitude 8 earthquake by shake-table test. The high volt-age electrical switchgear cabinet was tested on a shake table by shaking in both X- and Y-directions.
Figure 3. General layout of step-down electric supply substation.

Page 7 of 21
Ullah et al., Cogent Engineering (2018), 5: 1431375https://doi.org/10.1080/23311916.2018.1431375
Figure 6 shows electrical switchgear cabinet fixed on the shake-table for seismic testing. Koliou, Filiatrault, and Reinhorn (2011) discussed seismic response of transformer bushing system in both mounted on rigid base and “as installed” situation. Parise et al. (2013) explains different seismic qualification categories of electrical equipment and also defined equipment seismic levels.
Figure 4. Seismic zoning map of Pakistan.
Table 2. Seismic zones of PakistanSeismic zone Peak horizontal ground acceleration1 0.05–0.08 g
2A 0.08–0.16 g
2B 0.16–0.24 g
3 0.24–0.32 g
4 >0.32 g
Table 3. Damage rate information of 230 kV substation—Bam earthquakeType of equipment Total/Equipment Damaged/Equipment Damage percentage (%)Current transformer 18 12 67
Disconnector 12 4 33
Surge arrester 18 2 11
Circuit breaker 24 6 25

Page 8 of 21
Ullah et al., Cogent Engineering (2018), 5: 1431375https://doi.org/10.1080/23311916.2018.1431375
2.5. Seismic qualification of electrical equipmentIn order to design structures and seismically qualify electrical equipment, three qualification levels are defined, which are: “low”, “moderate” and “high” (IEEE Std. 693-2005, 2005). Correlation of these seismic qualification levels to Building Code of Pakistan – Seismic Provisions (2007) is defined by Pakistan Electrical and Telecom Safety Code (2014) and are illustrated in Table 4.
Figure 5. Transmission infrastructure around Christchurch, epicenters and surface rapture of 4 September 2010.
Figure 6. Electrical switchgear cabinet fixed on the shake-table.

Page 9 of 21
Ullah et al., Cogent Engineering (2018), 5: 1431375https://doi.org/10.1080/23311916.2018.1431375
3. Description of test specimenThe electrical equipment selected for seismic qualification in the present investigation was a “132 kV Metal-Oxide Gapless Surge Arrester”, Type: Y10 W-120/295, manufactured by “Wenzhou Yikun Electric Company, Ltd, China”. According to IEEE standards, surge/lightning arrester is a protective device for limiting surge voltages on the equipment by diverting surge current and returning the device to its original status. Surge arresters are usually installed between phase and earth/neutral, parallel to the equipment that is to be protected against over-voltages. Surge arrester was selected for seismic qualification test because it is used to protect transformer; transformer is the most im-portant and costly equipment in electric supply substation.
The surge arrester unit is supported by a steel frame, composed of angle sections. Detailed draw-ing of steel structure is shown in Figure 7. Base steel plate of supporting structure is bolted at twelve points on the shake table. Figure 8 shows sketch of surge arrester mounted on the steel support
Table 4. Seismic zoning and corresponding qualification levels for substation equipment
aThese seismic zonings are taken from Table 2.2 Building Code of Pakistan-Seismic Provisions 2007.bThe owner shall decide the qualification level depending on the rating of substation.
Seismic zoninga Ground acceleration Qualification levelLow and medium voltage
High and extra high voltage
Zone-1 0.05–0.08 g Low Low
Zone-2A and Zone-2B 0.08–0.24 g Low/Moderateb Moderate
Zone-3 and Zone-4 0.24– > 0.32 g Low/Moderateb High
or
>0.24
Figure 7. Detail design of steel structure.

Page 10 of 21
Ullah et al., Cogent Engineering (2018), 5: 1431375https://doi.org/10.1080/23311916.2018.1431375
structure and locations for instrumentation. Approximate weight of steel support structure was about 200 kg (440 lbs.) and approximate weight of surge arrester unit was about 350 kg (770 lbs.).
The surge arrester assembly was fitted with six accelerometers at four points, namely Point A, Point B, Point C and Point D. Point A is located at the top of the surge arrester and two accelerome-ters are installed to examine force in both X-direction and Y-direction, point B is located at the mid-dle of the surge arrester, point C is located at the base of the surge arrester and two accelerometers are installed to examine accelerations in both X-direction and Y-direction, point D is located at the bottom-most part of the steel structure as shown in Figure 8. The surge arrester assembly was fitted with four displacement transducers at four different locations, namely Point A, Point B, Point C and Point D. Figure 9 shows surge arrester assembly mounted on the shake-table for seismic qualifica-tion test.
Figure 8. Sketch of surge arrester mounted on steel structure.

Page 11 of 21
Ullah et al., Cogent Engineering (2018), 5: 1431375https://doi.org/10.1080/23311916.2018.1431375
4. Analysis and equationsThree types of tests were performed on the surge arrester assembly. Free vibration test was con-ducted to find damping ratio and natural frequency of the assembly Chopra (2001). Natural fre-quency of assembly indicates the stiffness of structure. As explained by (1).
where
f is frequency of the structure
k is stiffness of the structure
m is mass of the structure.
Equation (1) can be written as,
Equation (2) illustrates that frequency is directly proportional to the square-root of the stiffness of the structure. If stiffness decreases frequency will decrease and vice versa. This type of test is con-ducted to examine the stiffness of the structure and ultimately examine its mechanical strength.
(1)f =1
2�×
√
k
m
(2)f�√
k
Figure 9. Surge arrester assembly mounted on shake- table for seismic qualification.

Page 12 of 21
Ullah et al., Cogent Engineering (2018), 5: 1431375https://doi.org/10.1080/23311916.2018.1431375
Any mechanical damage or loss of stiffness as a result of subsequent testing can be evaluated by comparing the natural frequency of the damaged system to the natural frequency of the undam-aged system.
For measurement of natural frequency and damping ratio, whole assembly is subjected to free vibration test and data of accelerometers was recorded. Natural frequency and damping ratio were calculated by using (3), (4) and (5).
where
T is time period
Xi+N is final value of X-axis (time in seconds)
Xi is initial value of X-axis (time in seconds)
N is the total number of peaks
Equation (4) is used to calculate natural frequency of the structure.
Equation (5) given below is used to calculate damping ratio of the structure.
where
� is damping ratio
Yi is initial value of Y-axis (Acceleration in g)
Yi + N is final value of Y-axis (Acceleration in g)
N is the total number of peaks
By utilizing these basic formulae and data of accelerometers, natural frequency and damping ra-tio is calculated as 2.5 Hz and 1% respectively.
4.1. Generation of response spectrum matched time-historyElectrical equipment is to be qualified for the Peshawar (Khyber Pakhtunkhwa, Pakistan) region, and is subjected to “Qualification Level Moderate”. According to PETSAC (2014), Required Response Spectrum for damping ratio of 1% is calculated and plotted, as shown in Figure 10. After many at-tempts and iterations a time history was finalized, shown in Figure 11 that has time span of thirty second and is matched to the Required Response Spectrum.
(3)T =
Xi+N − XiN
(4)f =1
T
(5)T =1
2�Nln
(
YiYi + N
)

Page 13 of 21
Ullah et al., Cogent Engineering (2018), 5: 1431375https://doi.org/10.1080/23311916.2018.1431375
The response-spectrum matched time-history was generated using Spectime Version 1.0 soft-ware, developed by ANCO Engineers USA. The response spectrum matched time-history was further validated by three types of tests to check whether the developed time-history indeed corresponded to the prescribed response spectrum. These tests are:
4.1.1. Seismo-signal softwareSeismo-Signal software was used to validate that developed time-history indeed corresponded to the prescribed response spectrum.
4.1.2. Bare shake table testsAccelerometers was installed on bare table top and the time history was run. Data of accelerome-ters was recorded and accordingly Response Spectrum was re-plotted and was found to be reason-able matched with Required Response Spectrum.
4.1.3. Validation test by installing concrete slab on shake tableIn order to further verify the generated time history, a weight of 1600Kgs was installed on shake table to ensure that table can simulate the desired time history in reasonable fashion. Again accel-erometers was installed on concrete slab and the time history was run. Data of accelerometers was recorded and accordingly Response Spectrum was re-plotted and was found to be reasonable matched with Required Response Spectrum.
The results of the above three tests validated that the developed time-history indeed correspond-ed to the Required Response Spectrum.
Figure 11. Response Spectrum Matched artificial earthquake time-history fulfilling required response spectrum of Pakistan Electrical and Telecom Safety Code (2014) (qualification level moderate).
Acc
eler
atio
n (g
)
Time (Sec)
Figure 10. Required response spectrum for damping ratio of 1%. 1
Spec
tral
Acc
eler
atio
n (g
)
Frequency (Hz)
Page 14 of 21
Ullah et al., Cogent Engineering (2018), 5: 1431375https://doi.org/10.1080/23311916.2018.1431375
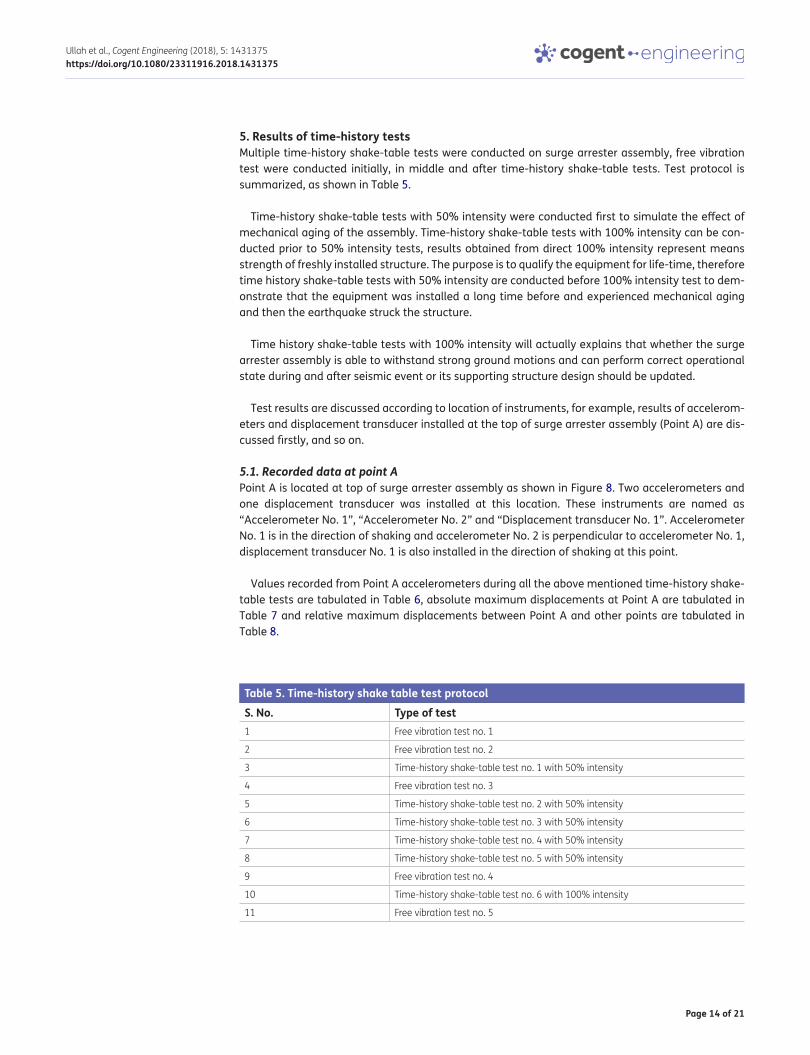
5. Results of time-history testsMultiple time-history shake-table tests were conducted on surge arrester assembly, free vibration test were conducted initially, in middle and after time-history shake-table tests. Test protocol is summarized, as shown in Table 5.
Time-history shake-table tests with 50% intensity were conducted first to simulate the effect of mechanical aging of the assembly. Time-history shake-table tests with 100% intensity can be con-ducted prior to 50% intensity tests, results obtained from direct 100% intensity represent means strength of freshly installed structure. The purpose is to qualify the equipment for life-time, therefore time history shake-table tests with 50% intensity are conducted before 100% intensity test to dem-onstrate that the equipment was installed a long time before and experienced mechanical aging and then the earthquake struck the structure.
Time history shake-table tests with 100% intensity will actually explains that whether the surge arrester assembly is able to withstand strong ground motions and can perform correct operational state during and after seismic event or its supporting structure design should be updated.
Test results are discussed according to location of instruments, for example, results of accelerom-eters and displacement transducer installed at the top of surge arrester assembly (Point A) are dis-cussed firstly, and so on.
5.1. Recorded data at point APoint A is located at top of surge arrester assembly as shown in Figure 8. Two accelerometers and one displacement transducer was installed at this location. These instruments are named as “Accelerometer No. 1”, “Accelerometer No. 2” and “Displacement transducer No. 1”. Accelerometer No. 1 is in the direction of shaking and accelerometer No. 2 is perpendicular to accelerometer No. 1, displacement transducer No. 1 is also installed in the direction of shaking at this point.
Values recorded from Point A accelerometers during all the above mentioned time-history shake-table tests are tabulated in Table 6, absolute maximum displacements at Point A are tabulated in Table 7 and relative maximum displacements between Point A and other points are tabulated in Table 8.
Table 5. Time-history shake table test protocolS. No. Type of test1 Free vibration test no. 1
2 Free vibration test no. 2
3 Time-history shake-table test no. 1 with 50% intensity
4 Free vibration test no. 3
5 Time-history shake-table test no. 2 with 50% intensity
6 Time-history shake-table test no. 3 with 50% intensity
7 Time-history shake-table test no. 4 with 50% intensity
8 Time-history shake-table test no. 5 with 50% intensity
9 Free vibration test no. 4
10 Time-history shake-table test no. 6 with 100% intensity
11 Free vibration test no. 5

Page 15 of 21
Ullah et al., Cogent Engineering (2018), 5: 1431375https://doi.org/10.1080/23311916.2018.1431375
Table 6. Point A acceleration valuesTest/Accelerometer Maximum
acceleration (g)Time of maximum
acceleration (s)Sustained maximum
acceleration (g)Test No. 1-Accelerometer
No. 10.52 14.40 0.50
Test No. 1-Accelerometer No. 2
0.13 26.33 0.12
Test No. 2-Accelerometer No. 1
0.47 18.95 0.45
Test No. 2-Accelerometer No. 2
0.13 20.27 0.12
Test No. 3-Accelerometer No. 1
0.50 26.22 0.46
Test No. 3-Accelerometer No. 2
0.15 20.32 0.14
Test No. 4-Accelerometer No. 1
0.50 26.25 0.42
Test No. 4-Accelerometer No. 2
0.14 14.01 0.13
Test No. 5-Accelerometer No. 1
0.50 26.32 0.44
Test No. 5-Accelerometer No. 2
0.14 15.06 0.13
Test No. 6-Accelerometer No. 1
0.80 20.15 0.66
Test No. 6-Accelerometer No. 2
0.24 26.60 0.22
Table 7. Absolute maximum displacement of Point ATest number Displacement transducer number Absolute maximum displacement (mm)1 1 54.05
2 1 60.13
3 1 58.97
4 1 63.72
5 1 60.84
6 1 140.34
Table 8. Relative maximum displacements between Point A and other pointsRelative maximum displacement (mm)Test number Point A − Point B Point A − Point C Point A − Point D1 7.77 14.76 23.80
2 10.11 18.46 27.96
3 8.84 15.73 24.98
4 8.41 16.37 25.64
5 9.37 17.38 27.27
6 21.03 43.19 77.22

Page 16 of 21
Ullah et al., Cogent Engineering (2018), 5: 1431375https://doi.org/10.1080/23311916.2018.1431375
5.2. Recorded data at point BPoint B is located at the middle of surge arrester as shown in Figure 8. One accelerometer and one displacement transducer is installed at this point. These instruments are named as “Accelerometer No. 3” and “Displacement transducer No. 2”, both of these instruments are installed in the direction of shaking at this point.
Values recorded from Point B accelerometer during all afore mentioned time history shake-table tests are tabulated in Table 9, absolute maximum displacements at Point B are tabulated in Table 10 and relative maximum displacements between Point B and other points are tabulated in Table 11.
5.3. Recorded data at point CPoint C is located at top of steel structure and at the base of surge arrester as shown in Figure 8. Two accelerometers and one displacement transducer is installed at this point. These instruments are named as “Accelerometer No. 4”, “Accelerometer No. 5” and “Displacement transducer No. 3”.
Table 9. Point B acceleration valuesTest/Accelerometer Maximum
acceleration (g)Time of maximum
acceleration (s)Sustained maximum
acceleration (g)Test No. 1-Accelerometer
No. 30.30 25.94 0.27
Test No. 2-Accelerometer No. 3
0.32 26.17 0.27
Test No. 3-Accelerometer No. 3
0.32 26.23 0.27
Test No. 4-Accelerometer No. 3
0.33 26.26 0.26
Test No. 5-Accelerometer No. 3
0.33 26.35 0.26
Test No. 6-Accelerometer No. 3
0.50 26.07 0.38
Table 10. Absolute maximum displacement of Point BTest number Displacement transducer number Absolute maximum displacement (mm)1 2 49.18
2 2 55.21
3 2 56.84
4 2 58.40
5 2 58.78
6 2 127.39
Table 11. Relative maximum displacements between Point B and other pointsRelative maximum displacement (mm)Test number Point B − Point C Point B − Point D1 8.41 17.66
2 8.80 18.18
3 9.18 18.35
4 8.72 18.37
5 8.73 18.44
6 22.71 56.71

Page 17 of 21
Ullah et al., Cogent Engineering (2018), 5: 1431375https://doi.org/10.1080/23311916.2018.1431375
Accelerometer No. 4 is in the direction of shaking and accelerometer No. 5 is perpendicular to ac-celerometer No. 4, displacement transducer No. 3 is also installed in the direction of shaking at this point.
Values recorded from Point C accelerometers during all afore mentioned time history shake-table tests are tabulated in Table 12, absolute maximum displacements at Point C are tabulated in Table 13 and relative maximum displacements between Point C and Point D are tabulated in Table 14.
Table 12. Point C acceleration valuesTest/Accelerometer Maximum
acceleration (g)Time of maximum
acceleration (s)Sustained maximum
acceleration (g)Test No. 1-Accelerometer No. 4 0.36 14.88 0.27
Test No. 1-Accelerometer No. 5 0.10 16.57 0.09
Test No. 2-Accelerometer No. 4 0.28 14.11 0.25
Test No. 2-Accelerometer No. 5 0.10 8.48 0.09
Test No. 3-Accelerometer No. 4 0.27 8.36 0.25
Test No. 3-Accelerometer No. 5 0.11 15.13 0.09
Test No. 4-Accelerometer No. 4 0.26 7.33 0.25
Test No. 4-Accelerometer No. 5 0.09 25.46 0.09
Test No. 5-Accelerometer No. 4 0.25 25.52 0.24
Test No. 5Accelerometer No. 5 0.10 8.47 0.09
Test No. 6-Accelerometer No. 4 0.66 26.00 0.48
Test No. 6Accelerometer No. 5 0.22 26.77 0.18
Table 13. Absolute maximum displacement of Point CTest number Displacement transducer number Absolute maximum displacement (mm)1 3 45.72
2 3 50.97
3 3 52.72
4 3 54.39
5 3 54.84
6 3 113.35
Table 14. Relative maximum displacements between Point C and Point DRelative maximum displacement (mm)Test number Point C − Point D1 9.57
2 9.96
3 10.06
4 10.38
5 10.36
6 34.33

Page 18 of 21
Ullah et al., Cogent Engineering (2018), 5: 1431375https://doi.org/10.1080/23311916.2018.1431375
5.4. Recorded data at point DPoint D is located at the base of surge arrester assembly as shown in Figure 8. One accelerometer and one displacement transducer is installed at this point. These instruments are named as “Accelerometer No. 6” and “Displacement transducer No. 4”, both of these instruments are installed in the direction of shaking at this point.
Values recorded from Point D accelerometer during all afore mentioned time history shake-table tests are tabulated in Table 15 and absolute maximum displacements at Point D are tabulated in Table 16.
Comparison of Required Response Spectrum, Response Spectrum recorded at accelerometer No. 6 location and the response spectrum associated with 100% intensity time-history shake table test (Test No. 6) is shown in Figure 12. Comparison of Required Response Spectrum, Response Spectrum recorded at accelerometer No. 6 location associated with 50% intensity time-history (Test No. 1 to Test No. 5) is shown in Figure 13 and illustrates that values of acceleration for 50% Intensity tests are lower than Required Response Spectrum for almost all the frequency range. This type of re-sponse is desired from 50% intensity tests because these tests are conducted to include the factor of mechanical aging.
Five free vibration test are conducted. They are conducted before, in middle and after time history shake-table tests. These tests are conducted to find natural frequency of the structure and helps us to evaluate the stiffness of the structure. Natural frequency of the structure is measured at the top of whole assembly (Point A).
Table 15. Point D acceleration valuesTest/Accelerometer Maximum
acceleration (g)Time of maximum
acceleration (s)Sustained maximum
acceleration (g)Test No. 1-Accelerometer No. 6
0.24 25.61 0.22
Test No. 2-Accelerometer No. 6
0.24 14.99 0.20
Test No. 3-Accelerometer No. 6
0.24 15.04 0.21
Test No. 4Accelerometer No. 6
0.23 25.92 0.21
Test No. 5-Accelerometer No. 6
0.24 26.00 0.21
Test No. 6-Accelerometer No. 6
0.36 25.64 0.30
Table 16. Absolute maximum displacement of Point DTest number Displacement transducer number Absolute maximum displacement (mm)1 4 39.66
2 4 44.45
3 4 46.19
4 4 47.64
5 4 48.06
6 4 96.92

Page 19 of 21
Ullah et al., Cogent Engineering (2018), 5: 1431375https://doi.org/10.1080/23311916.2018.1431375
6. Interpretation of test resultsTime history shake table testing using RRS for seismic qualification of high voltage electric supply equipment has become the most widely accepted and powerful method. Response spectrum of ar-tificial earthquake must satisfy RRS spectrum for specific electrical equipment (Test specimen: 132 kV Surge arrester) shown in Figure 12 throughout the frequency range and must be equal or above at value of natural frequency viz. 2.5 Hz for appropriate seismic qualification. As if researcher chose artificial earthquake that have overall response spectrum values greater that RRS, the test may fail due to overload at point of natural frequency.
While following test protocol, time history shake tables test results are analyzed. Acceleration values at bottom of whole structure is less than values at top which validates the theory proposed in Parise et al. (2013). Parise et al. (2013) explains that seismic accelerations produced by earthquake linearly increase along the height of the supporting structure. Measured values of accelerometers installed at orthogonal axes to motion are recorded as very low compared to values of accelerom-eters installed in parallel to the direction of motion. Absolute maximum displacement also follow decrement pattern while comparing top and bottom displacement transducer measurements, this type of behaviour is due to damping ratio and elastic nature of steel structure. Upon successful com-pletion of shake table test, free vibration test is conducted and natural frequency is calculated.
Figure 13. Comparison of required response spectrum and accelerometer No. 6 response spectrum (tests 1–5).
0
0.2
0.4
0.6
0.8
1
1.2
0.1 1 10 100
Spec
tral A
ccel
erat
ion
(g)
Frequency (Hz)
Test 4, ACC6 Response Spectrum Required Response Spectrum
Figure 12. Comparison of required response spectrum, accelerometer # 6 response spectrum and artificial earthquake response spectrum (test 6).
Spec
tral
Acc
eler
atio
n (g
)
Frequency (Hz)
Artficial earthquake Response Spectrum
Test 6, ACC6 Response Spectrum
Required Response Spectrum

Page 20 of 21
Ullah et al., Cogent Engineering (2018), 5: 1431375https://doi.org/10.1080/23311916.2018.1431375
Table 17 summarizes the natural frequency of the structure calculated from free vibration test’s data (conducted before, in middle, and after time history shake table test).
According to Table 17 slight change in frequency is observed which may be due to noise generated by the instrument or may be due to other electrical interferences. This slight change is in the accept-able limits and is neglected.
7. ConclusionSeismic qualification of electric supply substation equipment by time history shake-table testing was presented in this paper. Surge arrester was mounted on top of steel frame composed of angle sec-tions. Height of steel structure is 3.7 m and height of surge arrester equipment is 2.45 m. Design and height of the whole assembly was same as that of the installed equipment in the field. Surge arrester assembly was subjected to strong ground motions of “Seismic Qualification Level Moderate” be-cause this equipment was installed in Peshawar (Khyber Pakhtunkhwa, Pakistan) region and accord-ing to study about seismic qualification levels, electrical equipment of this voltage ratings that is to be installed in Peshawar (Khyber Pakhtunkhwa, Pakistan) region shall be seismically qualified under “Seismic Qualification Level Moderate”. Six accelerometers and four displacement transducers are used to measure acceleration and displacement during time history shake-table testing at four dif-ferent points.
No degradation or mechanical damage was observed visually in the whole surge arrester assembly. Moreover, free vibration test shows slight frequency variations that may be due to noise in the elec-trical circuit or other electrical interferences. This slight change is in the acceptable limits and is ne-glected. As the natural frequency of the surge arrester assembly is almost constant which means that stiffness of the structure is not changed and is same as it was before shake-table testing. This helps us to conclude that surge arrester assembly was perfectly intact with shake-table before and after time history shake-table testing. It is concluded that surge arrester assembly of this design is “Seismically Qualified” for “Seismic Qualification Level Moderate”.
AcknowledgmentsAuthors are thankful to University of Engineering & Technology Peshawar staff for their help and consistent support through-out the research period. Authors are also thankful to Pakistan Engineering Council, they have provided national platform for seismic qualification criteria through Pakistan Electric and Telecom Safety Code (PETSAC-2014).
FundingThe authors received no direct funding for this research.
Author detailsNoman Ullah1
E-mail: [email protected] ID: http://orcid.org/0000-0002-9506-7907Syed Mohammad Ali2
E-mail: [email protected] Shahzad3
E-mail: [email protected]
Faisal Khan1
E-mail: [email protected] Electrical Engineering Department, COMSATS Institute of
Information Technology, Tobe Camp, Abbottabad, Pakistan.2 Civil Engineering Department, University of Engineering &
Technology, Peshawar, Pakistan.3 National Engineering Services of Pakistan (NESPAK), Lahore,
Pakistan.
Citation informationCite this article as: Seismic qualification and time history shake-table testing of high voltage surge arrester under seismic qualification level moderate, Noman Ullah, Syed Mohammad Ali, Rahman Shahzad & Faisal Khan, Cogent Engineering (2018), 5: 1431375.
ReferencesAla Saadeghvaziri, M. A., Feizi, B., Kempner, L., & Alston, D.
(2010). On seismic response of substation equipment and application of base isolation to transformers. IEEE
Table 17. Summary of structure frequency through-out free vibration testsFree vibration test number Frequency (Hz)1 2.52
2 2.54
3 2.53
4 2.53
5 2.50

Page 21 of 21
Ullah et al., Cogent Engineering (2018), 5: 1431375https://doi.org/10.1080/23311916.2018.1431375
© 2018 The Author(s). This open access article is distributed under a Creative Commons Attribution (CC-BY) 4.0 license.You are free to: Share — copy and redistribute the material in any medium or format Adapt — remix, transform, and build upon the material for any purpose, even commercially.The licensor cannot revoke these freedoms as long as you follow the license terms.
Under the following terms:Attribution — You must give appropriate credit, provide a link to the license, and indicate if changes were made. You may do so in any reasonable manner, but not in any way that suggests the licensor endorses you or your use. No additional restrictions You may not apply legal terms or technological measures that legally restrict others from doing anything the license permits.
Cogent Engineering (ISSN: 2331-1916) is published by Cogent OA, part of Taylor & Francis Group. Publishing with Cogent OA ensures:• Immediate, universal access to your article on publication• High visibility and discoverability via the Cogent OA website as well as Taylor & Francis Online• Download and citation statistics for your article• Rapid online publication• Input from, and dialog with, expert editors and editorial boards• Retention of full copyright of your article• Guaranteed legacy preservation of your article• Discounts and waivers for authors in developing regionsSubmit your manuscript to a Cogent OA journal at www.CogentOA.com
Transactions on Power Delivery, 25(1), 177–186. https://doi.org/10.1109/TPWRD.2009.2033971
Asian Development Bank and World Bank. (2005). Pakistan 2005 earthquake, preliminary damage and needs assessment. Islamabad.
Building Code of Pakistan – Seismic Provisions. (2007). Islamabad: Pakistan Engineering Council.
Chopra, A. K. (1980). Dynamics of structures—A primer. Earthquake Engineering Research Institute, 73–88.
Chopra, A. K. (2001). Dynamics of structures theory and applications to earthquake engineering. Upper Saddle River: NJ: Prentice-Hall Inc.
Gupta, A. K. (1992). Response Spectrum method in seismic analysis and design of structures. Boca Raton, FL: CRC Press.
IEEE Std. 693-2005. (2005). IEEE recommended practice for seismic design of substations (IEEE Std. 693-2005).
IEEE Std C62.11-1999. (1999). IEEE Standard for Metal-Oxide Surge Arresters for Alternating Current Power Circuits (IEEE Std. C62.11-1999).
Kennedy, R. P. (2004). Personal communication regarding development of input motion requirements for the nuclear regulatory commission. RPK Structural Mechanics Consulting.
Koliou, M., Filiatrault, A., & Reinhorn, A. M. (2011). Seismic protection of electrical transformer-bushing systems
incorporating flexural stiffeners. In 8th international conference on structural dynamics (pp. 227–233). Leuven.
Kwasinski, A., Eidinger, J., Tang, A., & Tudo-Bornarel, C. (2014). Performance of electric power systems in the 2010–2011 Christchurch, New Zealand, earthquake sequence. Earthquake Spectra, 30(1), 205–230. https://doi.org/10.1193/022813EQS056M
Mohammadi, R. K., & Pourkashani Tehrani, A. (2013). An investigation on seismic behavior of three interconnected pieces of substation equipment. IEEE Transactions on Power Delivery, 29(4), 1613–1620.
Pakistan Electrical and Telecom Safety Code. (2014). Islamabad: Pakistan Engineering Council.
Parise, G., Martirano, L., Parise, L., De Angelis, M., Perno, S., & Reggio, A. (2013). Seismic qualification categories (EQC) of electrical equipment. In Industry applications society annual meeting (pp. 1–7). Lake Buena Vista, FL: IEEE.
Shanfa, R., Meiying, W., Miaolin, D., Xiaofeng, F., & Jiyong, Z. (2009). The study on a seismic test of high-voltage electrical switch cabinet. Power and Energy Engineering Conference, Asia-Pacific, Wuhan, 1, 1–6.
Takada, S., Bastami, M., Kuwata, Y., & Javanbarg, M. B. (2004). Performance of electric power systems during the Bam earthquake and its fragility analyses. Memoirs of Construction Engineering Research Institute, 46, 161–152.