seismic source zone characterization for the seismic hazard … · 2013-02-07 · abstract a...
TRANSCRIPT
AbstrAct
A comprehensive study of the seismic hazard related to the four NNP sites in NW switzerland was performed within the project PEGAsOs. to account for the epistemic uncertainties involved in the process of the characterization of seismic source zones in the frame of probabilistic seismic hazard assessments, four different expert teams have developed and defended their models in the frame of an intensive elicitation process.
Here, the results of one out of four expert groups are presented. the model of this team is based first of all on considerations regarding the large scale tectonics in the context of the Alpine collision, and neotectonic con-straints for defining seismic source zones. this leads to a large scale subdi-vision based on the structural ‘architectural’ considerations with little input from the present seismicity. Each of the eight large zones was characterized by the style of present-day faulting, fault orientation, and hypocentral depth distribution. A further subdivision of the larger zones is performed based on
information provided by the seismicity patterns. 58 small source zones have been defined in this way, each of them characterized by the available tectonic constrains, as well as the pros and cons of different existing geologic views connected to them. Of special concern in this respect were the discussion re-garding thin skinned vs. thick skinned tectonics, the tectonic origin of the 1356 basel earthquake, the role of the Permo-carboniferous graben structures, and finally the seismogenic orientation of faults with respect to the recent crustal stress field. the uncertainties connected to the delimitations of the small source zones have been handled in form of their regrouping, formalized by the logic tree technique.
the maximum magnitudes were estimated as discretized probability dis-tribution functions. After declustering the used EcOs earthquake catalogue and an analysis of data completeness as a function of time the parameters of the frequency-magnitude relations were derived within their uncertainties.
Introduction
the sites of the four nuclear power plants (NPP) in NW swit-zerland have been subject to a comprehensive analysis of seis-mic hazard evaluated in the frame of the PEGAsOs project (Abrahamson et al. 2004; coppersmith et al., this volume). the definition of seismic source zones (ssZ) and the deriva-tion of the parameters characterizing the seismic activity in each ssZ are integral parts of any probabilistic seismic hazard assessment. Here we present the results of one of the four expert groups (EG1b) responsible for the delineation of ssZ and determining the seismic activity parameters in the source zones.
the study area was set up as the envelope of the radii of 300 km around all sites studied. this guarantees that the study area encompasses all seismic sources which have a seismic in-fluence on the target sites. It extends well beyond the territory of switzerland, covering the southwestern parts of Germany,
the western parts of Austria, the adjacent parts of northern Italy and northeastern France. Here we describe the tectonic framework within the study area in the expert’s view and de-rive a corresponding large scale ssZ model, which was sub-divided into a small scale ssZ model to additionally account for the special distribution of seismicity. the small scale ssZ model is further subdivided by means of logic trees in alter-native source zone subdivisions for certain areas. the seismic activity rates and distributions of upper bound magnitudes and focal depths are derived for each single ssZ within this com-plex model. since the PEGAsOs project was performed in the years 2001 to 2003 the presented results are those arrived at the project phase. Nevertheless, we will refer to some subsequent publications as well.
Previous ssZ models, available during the project phase, were those for switzerland by sägesser and Mayer-rosa (1978), Italy by scandone et al. (1992), France by GEOtEr (1993), and Germany by Ahorner and rosenhauer (1978,
seismic source zone characterization for the seismic hazard assessment project PEGAsOs by the Expert Group 2 (EG1b)
Martin Burkhard 1, † & Gottfried Grünthal 2, *
Key words: seismic source zones, switzerland, PEGAsOs, hazard model, seismotectonics
1 Institut de Géologie, Université de Neuchâtel, rue Emile Argand 11, cH-2007 Neuchâtel, switzerland.2 GFZ German research centre for Geosciences, telegrafenberg, D-14473 Potsdam, Germany.*corresponding author: [email protected]
Published in Swiss Journal of Geosciences 102, issue 1, 149-189, 2009which should be used for any reference to this work
1
1986) and Grünthal et al. (1998). In the latter study, performed for the D-A-cH countries, i.e. Germany (D), Austria (A) and switzerland (cH), it was agreed to make use of the sägesser and Mayer-rosa (1978) model for the swiss territory. the ssZ model of the D-A-cH study was later used for the Global seismic Hazard Assessment Program GsHAP (Grünthal et al. 1999) and the European follow-up project sEsAME (Jimenez et al. 2003).
Seismotectonic framework
Large scale tectonics
the large scale tectonics in the study area represents the basic rational for our seismic source zone model and requires a few consideration at the outset.
the present-day architecture of the north-western Alpine foreland is largely the result of two geologically young (last 50 Million years), but contrasting events:
1. Alpine subduction and collision2. Oligocene extension and graben formation in the Northern
Alpine foreland
Interferences between the two events (collision and extension) are obvious both in time and space. the most complex interfer-ence zone runs through northern switzerland, i.e. through the central part of the study area.
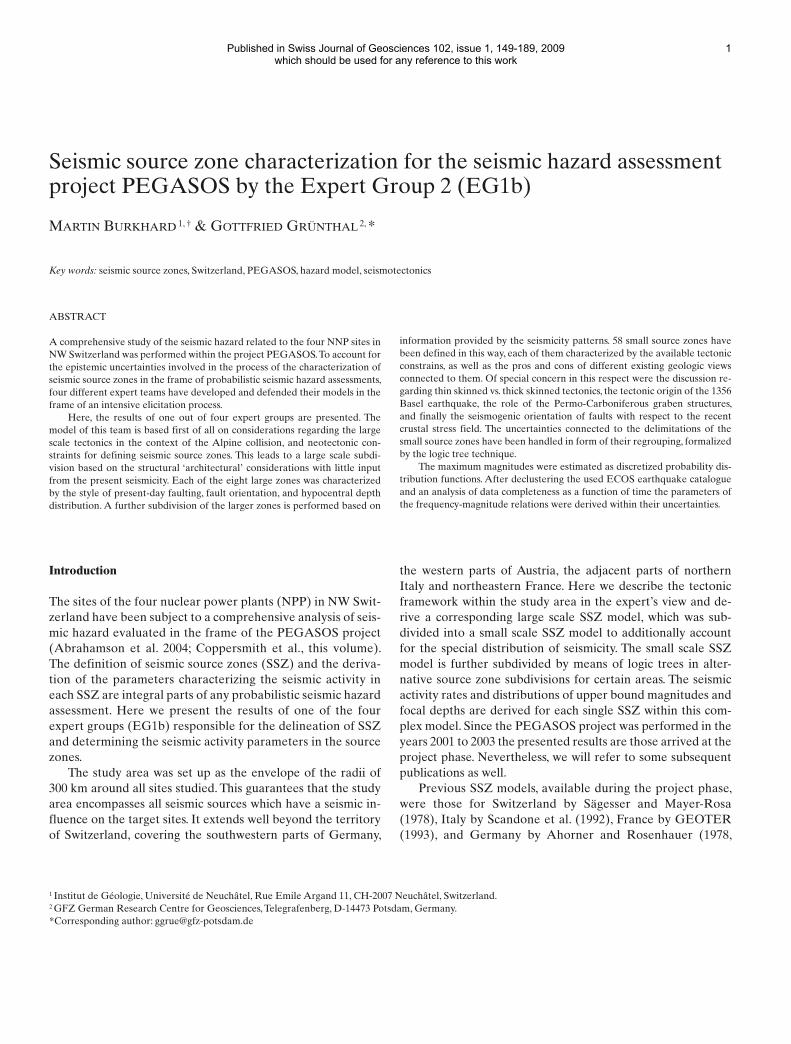
the Alpine subduction-collision event is responsible for the large scale architecture of the Alps, best visualized in the form of a time sequence of general NW–sE cross sections (Fig. 1). the northern European plate is subducted below the southern Apulian plate. the collision event led to the complex internal
structure of the Alps, dominated by stacks of both sedimentary and basement nappes, intense folding, and the formation of the Molasse- and Po plain foredeeps, the Jura fold-and-thrust belt, as well as the development of a suspected but ill-defined litho-spheric forebulge some 150 km in front of the topographic crest line of the Alps.
the Oligocene extension event led to the formation of the rhine-bresse Graben system within the European plate, im-mediately adjacent to the Alpine collision zone. We interpret the large-scale doming of the black Forest-, Vosges- and Mas-sif-central basement highs in terms of remaining thermal dom-ing and/or uplift shoulders associated with this extension event rather than being a direct result of Alpine collision. the rhine and bresse grabens are well defined by depressions in the pres-ent-day topography.
A sinistral transfer has to exist between the northern end of the bresse Graben and the southern end of the rhine Graben. there is not a single major transfer fault but a rather diffuse transfer zone, within which both rhenish (NNE–ssW) and conjugate (E–W) striking faults are present (Price & cosgrove 1990).
this transfer zone is overprinted by the Late Miocene Jura folding and thrusting event. the timing of the main ex-tension event is well documented as late Eocene to Oligocene. NNE–ssW striking extensional faults of the southern rhine Graben were demonstrably reactivated in sinistral strike-slip, most probably in the Late Miocene and in association with Jura folding (bergerat 1987). In the Jura fold-and-trust belt, paleo-stress-measurements provide evidence for several suc-cessive deformation phases, including the Oligocene extension event and the Miocene folding/thrusting event (Homberg et al. 1999).
Fig. 1. tectonic evolution of the Alps during the last 40 Million years. cartoon illustrates the gross horizontal NW–sE shortening based on balanc-ing estimates derived from thin skinned cover series on the NW side of the Alps (Jura, subal-pine Molasse, Helvetic nappes); modified from burkhard & sommaruga (1998).
2
Alpine collision
thrust system considerations
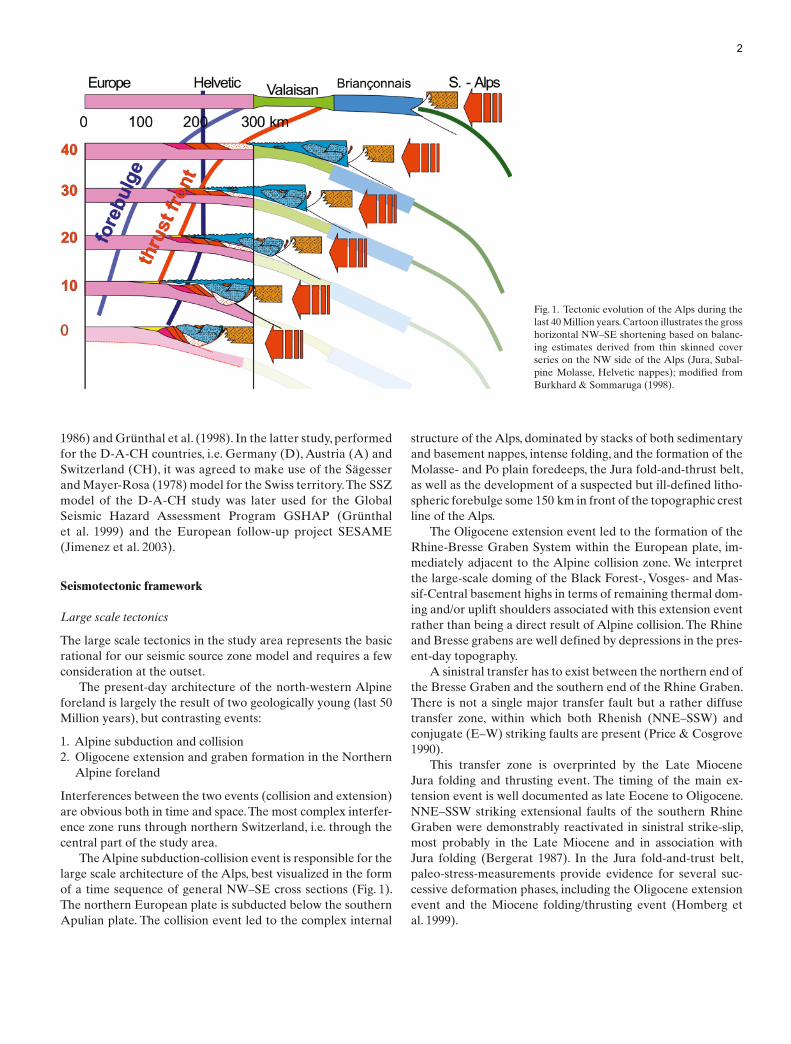
the exact geometry of the Alpine thrust system still is a matter of debate. Despite excellent outcrop conditions and more than one hundred years of mapping in this mountain chain, large inaccessible volumes below the Jura, the Molasse basin and in front of the External crystalline Massifs (EcM) leave some freedom in the linking of various parts of the Alpine thrust sys-tem. seismic reflection data partly fill this gap, but the most important constraints are provided by balancing and thrust sys-tem considerations. A schematic large-scale profile through the frontal Alps is shown in Figure 2.
the latest thick skinned thrust system, indicated in green, is not universally accepted to exist. Overlapping ages are not only due to uncertainties in age determinations, but also to simultaneous activity along higher and lower thrust systems. the Helvetic nappes can be considered as a large scale duplex structure, with a basal Helvetic floor thrust at the bottom and a simultaneously active (basal) Penninic roof thrust at the top (burkhard 1988; Pfiffner 1986).
In summary, our preferred interpretation of the Alpine thrust system at the NW border of the Alps is characterized by the following elements, which provide the structural frame-work within the study area:
– thin skinned Jura fold-and-thrust belt.– basal décollement in triassic evaporates.– No compressional basement inversion below Jura and Mo-
lasse basin.– “Piggy-back” involvement of Molasse basin and older,
higher thrust systems.– rooting of the Jura thrust below the External crystalline
basement Massifs (EcM).– EcM interpreted as a stack of crustal thrust slices.
– At least 30 km of total NW–sE convergence during the last 12 Ma, measured between the crest line of the EcM and the stable European foreland.
– this convergence is consumed by folding and thrusting in the Jura and/or most external subalpine Molasse.
this view of the Alpine frontal thrust system, initially proposed by boyer & Elliott (1982), is now adopted by many authors, including Laubscher (1992), and partly by Guellec et al. (1990), Philippe et al. (1996) and many non-alpine structural geologists. Alternative views exist in explicit form (Pavoni 1961; Pfiffner et al. 1997; Ziegler 1982) or are implicitly expressed in cross sections (schmid et al. 1997). It is important to note that a large majority of alpine sections drawn prior to about 1985 include ‘Autochthonous External crystalline Massifs’ (EcM), without an explicit link between the basal Jura décollement and the Al-pine thrusts.
Older, pre-Jura-folding Alpine thrust systems (40 to 12 Ma)
Exhumation and erosion allows deep insight into the Alpine nappe pile. there is a relatively good agreement about the ge-ometry and kinematics of these older thrust systems, namely the Helvetic and Penninic thrusts and nappe piles. With respect to the tectonics of the study area, these thrust systems are not as relevant as the Jura/EcM-link and the associated thin vs. thick skinned tectonics debate. Accordingly, we will not go into any details on the complex tectonic history of the central Alps here. there is general agreement that none of the older (Hel-vetic and Penninic) thrusts are active today, nor is there much evidence for inner Alpine thrusting younger than ca. 15 Ma. some reference will nevertheless be made to the classical tec-tonic subdivision of the Alps since many of the older structures have been reactivated in extension and/or strike slip. some of these structures seem to be seismically active today.
Fig. 2. Generic cross section through the NW Alpine front. thrust systems are color-coded ac-cording to their relative age from red, oldest, to blue, youngest (burkhard 1999).
3

the tectonic elements according to the classical subdivi-sion of the Alps (see also Figs. 1 and 2) have complex 3-D ge-ometries at depth, which makes their use as ‘zone boundaries’ problematic. As an example, the classic ‘front of the Alps’ as seen on tectonic maps corresponds to the most frontal posi-tion of either the Helvetic or Penninic (Prealps) nappes riding above subalpine Molasse units. Helvetic and Penninic nappes are present as klippen only, whereas their basal décollements are ‘rooted’ behind, i.e. southeast of the External crystalline Massif culminations. this geometry is particularly important for the delimitation of source zones: Helvetic and Penninic Klippen nappes have less than 3 km vertical thickness, and they mask the more relevant geometry within the basement below them.
Neotectonics
Neotectonic data are of utmost importance for seismic hazard assessments. therefore, we dedicate the following summary of the state of the art with respect to geodetic interpretations, the latest dated faults, the contribution of erosion rates towards conclusions regarding neotectonics, as well as the present day crustal stress regime.
triangulation, trilateration, GPs
On the scale of the north-western Alps and their surround-ings, relative movements between plates and ‘tectonic blocks’ are too slow to be accurately established with classical, ground-based methods of triangulation and trilateration. Up to 100 years of observations failed to pick up any significant signals of horizontal length changes (Kahle et al. 1997). the same is true for the more recent GPs measurements with up to 10 years of observation. According to several French authors, however, there seem to be significant block-move-ments within the Western Alps (calais et al. 2001; Vigny et al. 2002), indicating extension in a NW–sE direction in the inter-nal (French) Alps. these movements remain to be confirmed, their origin is a matter of debate. Geodesists agree, however, that there is no measurable movement between northern Italy and ‘stable Europe’ and across the Alps on a profile through western switzerland documented by GPs measurements of the last 5 years.
this situation leaves a portion of freedom in the interpreta-tion of the present-day ‘tectonic regime’ of the Alps and their forelands. two extreme views can be formulated as follows:
– the Alps are ‘dead’ and convergence has come to a com-plete halt (some 5 Ma ago?)
– the Alps are ‘alive’, convergence continues at a rate of < 5 mm/a (as measured between Apulia and Europe).
both interpretations have their advocates and followers in the geologic literature, arguments are mostly indirect. the more important points will be discussed below.
the youngest dated faults
the lack of ‘young’, i.e. Late Miocene and Pliocene, sediments north of the Alps is one of the main problems. the youngest Molasse sediments are well dated as serravallian to lower-most tortonian, ca. 12 to 10 Ma (berger 1996). such sediments are found below the frontal Jura thrust in the bresse Graben as well as folded into synclines in a few places of the swiss Jura (see berger 1996 for an exhaustive review). this clearly indicates that main Jura folding has to be younger than 12 Ma. A reorganization of the Alpine thrust system at this date is hold responsible for the end of sedimentation within the Mo-lasse basin, which is riding in piggy back fashion above the basal Jura-EcM thrust, leading to a general uplift and there-fore bypassing of this foredeep (burkhard & sommaruga 1998). the end of this thrust movement is not documented by any dated sealing sediments. some rare Pliocene sediments are present outside the Alpine thrust system, notably within the rhine and bresse Grabens and in the Po plain. Laubscher (1987) inferred a pre-Messinian (> 5 Ma) age for Jura fold-ing based on the subsurface observation of sealed folds and thrusts at the northern edge of the Apennines and below the Po plain. His postulate is based on the hypothesis that the two thrust systems, frontal Apennine and Jura, were time equiva-lent. this hypothesis is obviously questionable and ongoing Jura folding and thrusting cannot so easily be ruled out. If we consider the latest Alpine thrust system north of the Alps and if we assume a continuous and ongoing activity for the last 10 Million years, a total convergence rate of 30 km/10 Ma yields an average rate of 3 mm/a horizontal convergence to be consumed somewhere north of the crest line of the EcM, i.e. within the Jura fold-and-thrust belt and/or within the Mo-lasse basin. this rate is small enough to remain invisible given the currently available geodetic data sets. some indication for post-Pliocene folding and thrusting has been described in the most external Jura south of the rhine Graben (e.g., Meyer et al. 1994).
Leveling data: Alps – dead or alive?
In the absence of clear evidence for or against ongoing thrust faulting and folding, geologists and geophysicists have tried to use alternative data sets in order to evaluate the present-day state of the latest Alpine thrust system. One of the data sets of-ten quoted in favor of ongoing shortening are vertical motions determined from leveling data (Gubler et al. 1984).
the general idea has been most clearly expressed by Molnar (1987), who inverted the swiss vertical motion data in order to determine horizontal shortening rates. the underlying assump-tions in this paper are subject to discussion, however. On the crustal scale considered, Molnar’s ‘inversion’ method implicitly assumes that the entire thickening induced by horizontal con-vergence is pushing the land surface upward. two additional factors have to be considered, however, both of them have been neglected in Molnar’s ‘inversion’ approach. First, for reasons
4

of isostatic equilibrium, thickening in the absence of erosion should lead to a depression of the Moho, a factor several times larger than the upward growth of topography. second, in the absence of thickening, erosion should be just about compen-sated by vertical uplift as long as there remains an overthick-ened crust and topography.
Erosion-/exhumation- and cooling-rates of the Alps
Erosion rates are available for short time periods of the last one hundred years for many Alpine rivers (e.g., Jaeckli 1958); they vary from 0.1 to 0.6 mm/a, calculated from the accumulation of sediments in peri-Alpine lakes. Long-term rates for the last 15'000 years (post-Würm glaciation) yield values on the same order of magnitude (Hinderer 2001; schlunegger & Hinderer 2001). For the last several million years, exhumation rates of the Alps are well established from a large and coherent data set of apatite fission track data (see Hunziker et al. 1997 for references). Fission track ages are unanimously considered as cooling ages, documenting the time at which a rock is cooled below a critical ‘blocking temperature’. In the case of apatite this tcrit, is considered to be around 100 ± 20 °c. cooling may have many causes, but in the Alps, there is general agreement that the last increment of cooling from 150 °c down to zero is dominated by erosion. cooling assumed to be equal to erosion rates of 0.4 to 1.2 mm/a, vertical movement has been deter-mined from ‘3-D best-fitting’ of Ft-age data sets (rahn et al. 1997; burkhard 1999).
Interestingly, however, maximum geodetic present-day vertical uplift rates of 1.6 mm/a exceed all available estimates of erosion rates. this discrepancy could find an explanation in short term isostatic disequilibrium, induced by ice-loading/unloading during the last cycle of glaciation/deglaciation. the effects of isostatic rebound after the removal of an important alpine ice-load has been evaluated by Gudmundsson (1994). According to this model, such an effect could easily explain a large part of up to 1.2 mm/a or more of the present day uplift rate.
In summary, the geodetic vertical motion and GPs data for the swiss Alps do not provide any solid evidence in favor or against ongoing convergence and thrusting in the Alpine col-lision system.
Present day crustal stress regime
the orientation of the present-day crustal stresses and the prevailing crustal stress regimes are fairly well established for most of the study area, based on a large data set of focal plane mechanisms (Pavoni 1987; Deichmann 1992a; Grünthal & stromeyer 1992; Kastrup 2002; Pavoni et al. 1997). the type of faulting is predominantly strike slip. there are a few areas with dominant extensional mechanisms, and locally some thrusting is also observed. Along the arc of the Western Alps, a nice cor-relation seems to exist between topography and type of fault-ing. Normal faulting is found along the centre line of the Alps
while thrusting is found on either side of the Western Alps at the transition between high and low topography.
this correlation suggests a causal relationship between topographic load and seismicity; the relationships observed are reminiscent of ‘gravitational collapse’ (Avouac & burov 1996). some evidence for this phenomenon has been found in all ma-jor orogens of the world (Dewey 1988). but again, just as in the case of geodetic observations, this does not provide any evi-dence for, nor against, ongoing convergence between Europe and Italy across the Alps.
Also, in some places contradictory stress data are provided by in situ near surface stress determination methods such as borehole slotter (Jura Mountains), borehole break outs, hydro-fracs etc.
Thick skinned active Jura?
the idea of basement involvement below the Jura fold-and-thrust belt is not a new one (Aubert 1945) but it has become increasingly fashionable again in recent years. Extreme views are presented by Ziegler (1982) and Pfiffner et al. (1997) who propose that most of the cover shortening seen in the Jura fold belt is explained by thick skinned thrusting along a ‘basal dé-collement’ at several kilometers depth within the pre-triassic basement. We express the opinion that this idea is not substan-tiated by any tangible data.
similar, but more subtle views have been recently presented in a series of publications (Guellec et al. 1989, Mosar 1999, Philippe et al. 1996, Ustaszewski & schmid 2007) and by one of the sP1 expert groups (schmid & slejko, this volume). these authors all accept a thin skinned interpretation with a major triassic décollement to explain the gross shortening by folding and thrusting seen in the cover rocks of the Jura fold-and-thrust belt. but they also propose that thin skinned thrusting should have been recently replaced by a thick skinned compressional regime, leading to inverse faulting along pre-existing normal faults, mostly boundary faults of Permo-carboniferous gra-bens, which are proposed to be slightly inverted or just about to be inverted. One of the authors (M. b.) has the opinion that the entire scenario remains speculative, however, and that there is hardly any evidence in favor of inversion.
Seismic source definition
Large scale zones
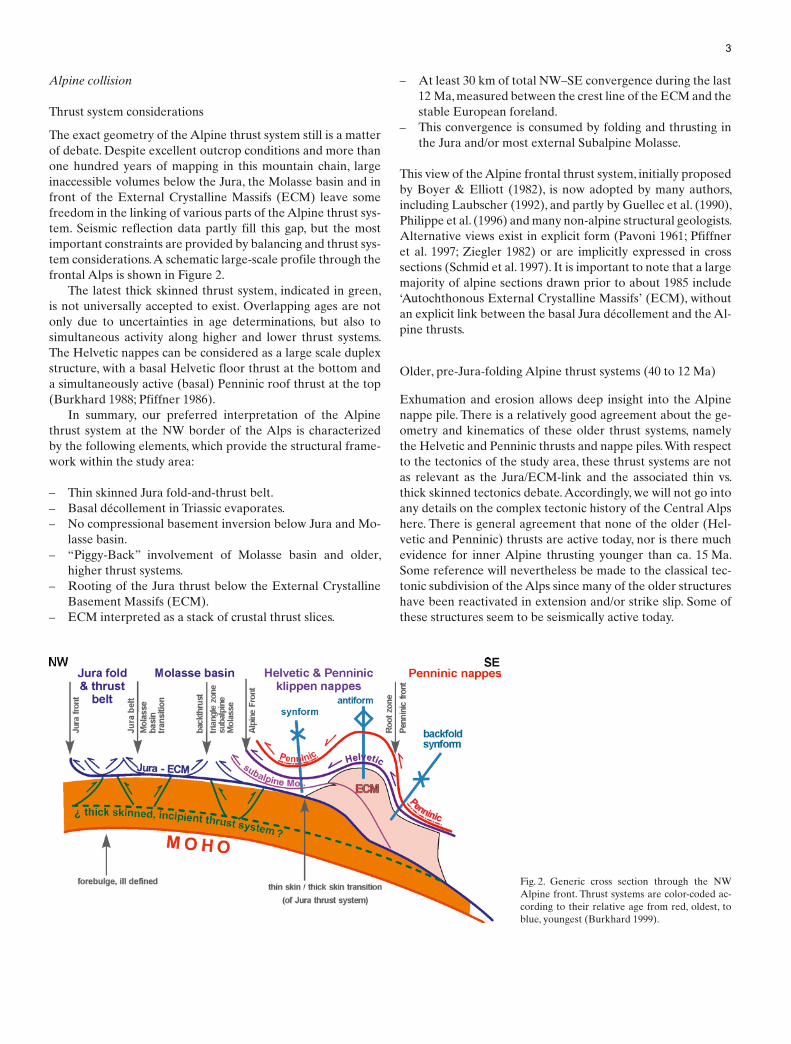
A first large scale subdivision of the study area is based on structural, ‘architectural’ considerations with little input from the present day seismicity. Our guiding philosophy was to dis-tinguish larger areas (shown in Fig. 3), which share common characteristics on a lithospheric and/or crustal scale – as seen on a Moho-map.
Limits between these large scale zones were drawn on a tectonic basemap, mostly following obvious and ‘classic’ tec-tonic boundaries. Most of our lines are not identical with these
5

boundaries, however. First, we opted for considerable smooth-ing in order to obtain simple zones boundaries. In general, we extended the ‘more active’ zones some 5 to 10 km outward on the expense of the neighboring ‘less active’ zones. Despite the complex 3-D structure of the Alps with many shallow dipping fault zones and nappe boundaries, all zone boundaries are kept vertical at depth for simplicity, however. Our rationale for the delimitation of the large-scale source zones (Fig. 3) will be given below.
East France (EF) and south Germany (sG) zones
both these two zones are considered as ‘stable European fore-land’ of the Alps. they are characterized by a normal crustal thickness on the order of 30 to 35 km (Ziegler & Dèzes 2006).
this foreland lithosphere lacks obvious signs of Alpine thrusting, folding and inversion. the most important large-scale tectonic elements are the Vosges and black Forest base-ment culminations, various small localized graben zones (with the exclusion of the major rhine and bresse Grabens) and fault zones along inherited ‘lineaments’ of known or suspected older, pre-triassic structures. reactivations are predominantly in strike slip mode. In bavaria, the lithosphere of the south Germany zone has been bent downward below the Alps lead-ing to the formation of the tertiary Molasse foredeep. Despite this involvement in ‘Alpine tectonics’, we opted to group this part of the Molasse basin with ‘stable foreland crust’. From pe-
troleum exploration work in the bavarian Molasse basin it is known that this part of the crust has been slightly extended in a NNW–ssE direction in Oligocene times, most likely as an effect of lithospheric flexure. these extensional structures are still present as such and have not been inverted (bachmann & Müller 1992); this is in contrast to the swiss Molasse basin, where at least the sedimentary cover has been involved in Al-pine compression.
the age of (reactivated) faults is mostly Hercynian, Permo-carboniferous, and Oligocene. the dominating style of pres-ent-day faulting in strike slip.
rhine Graben (rG) and bresse Graben (bG) zones
the rhine and bresse Graben zones are characterized by well-marked surface depressions, vast Quaternary alluvial plains, tertiary graben fills and complex faulted border areas with Mesozoic and basement outcrops. both graben zones have a reduced crustal thickness (Moho depth around 25 km), a weak positive bouguer anomaly and a large thermal anomaly, most pronounced in the case of the southern rhine Graben.
Lateral eastern and western boundaries of the rhine Gra-ben zone are systematically chosen a few kilometers outside of the mapped boundary faults and fault zones. this choice is deliberate in order to include earthquakes from this bordering area, not to miss ill-located earthquakes and also because there might be non-mapped faults, or blind faults in the boundary zone between the graben border and the Vosges and black for-est rift shoulders.
the limits of the bresse Graben zone are quite obvious in the northern part of this graben structure. Further south, how-ever, we opted to include parts of the south-western Jura fold-and-thrust belt as well as a small area of stable crust within a generalized and simplified southern bresse graben zone. this choice is artificial and not motivated by any tectonic consid-erations.
the age of (reactivated) faults is usually Oligocene, less pronounced Permo-carboniferous or Hercynian. the style of present-day faulting is in strike slip mode.
Alps External (AE) zone
this zone comprises areas, which have visibly undergone some Alpine shortening in the form of folds and thrusts. Alpine de-formation within this zone is mostly, if not exclusively, thin skinned; deformation is limited to the sedimentary cover of some 2 km (NW) to 5 km (sE) thickness. Décollement is lo-cated within a weak basal layer of triassic evaporites and/or within higher stratigraphic levels (e.g. Aalénian shales or Lower Marine Molasse). the crustal scale architecture of this zone is dominated by a sE-ward bending down of the European crust, best documented on structure contour maps of Moho-depth (and top basement). this downward flexure is a direct result of Alpine subduction to the sE. basement thickness is constant at ca. 28 km. the sE-ward down-bending of the European
Fig. 3. Large scale zones following structural “architectural” consider-ations with minor input from the present day seismicity. this large scale zonation will be subdivided into small scale zones later on (see Fig. 8). Ac – Alps central, AE – Alps External, AI – Alps Internal, bG – bresse Gra-ben, EF – Eastern France, PP – Po plain, rG – rhine Graben, sG – southern Germany.
6
lithosphere is documented by an increasing Moho depth and is compensated by the increasing thickness of tertiary Molasse sediments.
the Alps External zone comprises the Jura fold-and-thrust belt and large parts of the swiss Molasse basin. In contrast to the bavarian Molasse basin that is characterized by the preser-vation of Oligocene normal faults (bachmann & Müller 1992) the swiss Molasse basin is characterized by compressional structures with Mesozoic and tertiary sediments.
the northern and north-western limit of the Alps External zone has been chosen so as to generously include the most ex-ternal folds and thrusts of the Jura arc, including controversial areas such as the massif de la serre basement high and sur-roundings, which may be an Oligocene horst rather than a Late Miocene thrust inversion structure (as indicated in the French geological map 1 : 500'000). the limit to the sW is chosen some-what artificially, slightly to the sW of the Vuache fault. this choice is purely topologic and has no link to the Alpine thrust system architecture in this area. the limit to the NE, i.e. east of the eastern-most obvious Jura structures (Lägern-fold and Mandach-fault) is ill defined. We have chosen a straight line to connect the tip of the north-eastern Jura arc with the subal-pine Molasse triangle zone of eastern switzerland near Lake constance.
the sE limit of the Alps External zone is chosen as a smooth line close to but not identical with the classical Alpine Front, either defined as the frontal emergence of the basal Hel-vetic thrust on a tectonic map or as the northern limit of Al-pine relief as seen on a digital elevation model. Any choice of a ‘northern limit to the Alps’ is problematic, however, since no surface feature does have any significance at the deeper crustal levels of interest. A more relevant choice would probably be the thin skinned/thick skinned transition, i.e. the locus where the Late Miocene Alpine basal ‘Jura’ thrust cuts down into the basement. the position of this line is unknown, however. Most probably it runs some 5 to 10 km south of the actually chosen ‘Alpine Front’. Our choice is a conservative one since it reduces the lateral extent of the area of the Alps External zone, where tectonics are thin skinned, from the Alps central zone that is characterized by thick skinned tectonics.
the age of (reactivated) faults is Miocene and Oligocene as well as to a much lesser extent Permo-carboniferous. the dominating style of present-day faulting is strike slip.
Alps central (Ac) and Alps Internal (AI) zones
the Alps central and Alps Internal zones represent the main body of the Alps as defined by its topographic expression (Fig. 3). the topographic features are a direct result of the collision pro-cess which led to an overthickened crust. the crustal thickness of the central and Internal Alps increases from about 35 km at the outer borders to more than 60 km along a line running from chur to Martigny and further sW-ward, approximately along a median line of the Western Alps. this Alpine crust is made of an intricate stack of basement nappes, separated from each other
by thin slivers of Mesozoic sedimentary rocks. Nappe stacking, strong internal deformation and metamorphism are geologi-cally young events (40 to 15 Ma). Evidence for young thrusting (15 Ma and younger) is limited to the bordering areas, such as the subalpine Molasse and the southern Alps, however. Within the main body of the Alps, well documented young, i.e. Late Miocene tectonic activity is mostly in the form of normal and strike slip faulting. Uplift (up to 1.6 mm/a) and erosion (up to 0.5 mm/a) still take place at high rates today. the external limit of the Alps central zone is chosen as a smooth line, loosely fol-lowing the ‘Alpine front’.
the age of (reactivated) faults in the mostly Alpine struc-tures is younger than 50 Ma, partly Liassic or Permo-carbonif-erous (Hercynian). the style of present-day faulting varies from strike slip to normal faulting and locally even to thrusting.
the southern limit of the central Alps with the Internal Alps is chosen along the Insubric and Giudicarie Lines, respec-tively. both are major, long-lived faults separating the cen-tral Alps from the southern Alps (part of our Internal Alps). Further to the sW, in the Western Alps, this distinction is less obvious and our subdivision becomes somewhat artificial. the main difference between the Alps central and Alps Internal zones concerns the vergence of the latest thrusting: NW-ward in Alps central, sE-ward in Alps Internal zone. the southern (and eastern) limit of the Alps Internal zone against the Po plain zone is chosen deliberately south of the obvious surface expression of the Alpine front of the southern Alps in order to include some known and suspected south-vergent thrust faults hidden below the sedimentary cover of the Po plain (scandone 1990; schoenborn 1992).
Po plain (PP) zone
the Po plain zone represents the southern foreland basin to the Alps and the northern foreland to the Apennines, cov-ering the vast Quaternary alluvial lowlands of the Po plain. this zone also comprises frontal parts of the Apennines, both emergent and hidden below Latest Miocene, Pliocene and Quaternary sediments of the Po plain (compare with ‘Modello strutturale, Italian map’; scandone 1990). Despite this internal heterogeneity, we did not want to subdivide this Po plain zone any further, since it is located very far from the center of our study area. the northern and western border of this zone has been chosen to follow the surface morphologic expression of the Alpine front.
the age of (reactivated) faults is Miocene to Oligocene. this large and complex zone encompassed areas with different style of present-day faulting, which does not allow specifying any prevailing type (cf. next sub-chapter).
Fault parameters (orientation, style, depth, rupture geometry) within the large scale zones
the large scale zones outlined above are characterized by their geologic history, crustal structure and their relative location
7

with respect to the Alps. For these zones we used the available information in order to determine:
– the representative orientation for maximum horizontal stress σ1
– the predominant style of present-day faulting– the most likely depth distribution for large earthquakes, pa-
rameters that are directly used as input for the probabilistic seismic hazard assessment (PsHA).
these values are used as standard or ‘default’ values for the large scale zones. such values will, in certain cases, be modi-fied or ‘overridden’ later on within several small source zones, where additional information is available.
Fault orientation and style of faulting
the ‘representative’ orientation for the maximum horizontal stress σ1-axis has been determined by visually inspecting maps
of compiled stress information (Fig. 4, after Delacou et al. 2004) including focal plane solutions and in situ stress determinations. For each style of faulting, the most likely fault orientation has been determined based on a very simple set of rules, following Anderson’s fault types (Anderson 1951):
– normal faults dip 60° and have their strike at 90° to the σ3-axis
– thrust faults dip 30° and have their strike at 90° to the σ1-axis
– strike slip faults are vertical and have their strike at + or – 45° from the σ1-axis
– however, and most important: we assumed that pre-existing faults are likely to be reactivated if their orientation (pole) is no more than 30° away from the optimum orientation of a new ‘Andersonian fault’.
In a very large majority of cases, the present day seismic ac-tivity occurs along pre-existing faults and fractures. these are numerous indeed. superregional trends of structures are
Fig. 4. synthetic map of the Alpine strain/stress state after Delacou et al. (2004). A large data set of fault plane solutions (including the data available in the PEGAsOs data base, e.g. Kas-trup (2002) has been used to interpolate regional stress fields. black arrows are for horizontal σ1, open arrows stand for horizontal σ3. the short bars indicate P-axes (mainly transcurrent to transpressive tectonic mode). the open bars rep-resent horizontal t-axes in areas in extension of extensional strike slip mode.
8

widely accepted as Alpine, rhenish, Eggish, Permo-carbon-iferous, Variscan (Wetzel & Franzke 2001, 2003). Major lin-eaments seen on an Earth & space research (Esr) radar mosaic of southern Germany and surroundings are shown in Figure 5. We used Figure 5 for (1) choosing the most likely orientation of faults that are prone to reactivation and (2) as an additional argument for the choice of both large and small zone boundaries.
For each large scale zone, we estimated the relative percent-age of earthquakes in normal faulting, strike slip and thrusting mode based on focal plane solutions and our understanding of the regional tectonics (see Fig. 6).
Depth distribution of earthquakes
In order to estimate a characteristic depth for the earthquakes above the threshold relevant for the PsHA, we used the EcOs Earthquake catalogue prepared for the PEGAsOs project. For this purpose we only considered events of moment mag-
nitude Mw 3.5 and larger that have occurred since 1972; i.e. the instrumental catalogue of switzerland. Note, however, that the entire EcOs/PEGAsOs catalogue contains only few earthquakes with a magnitude larger than 5 that have been recorded since 1972. Also, but we have little confidence in depth determinations for older events. Note also that we will use the term ‘magnitude’ for the moment magnitude Mw, if not specified otherwise. For each zone an average depth with its 1σ standard deviation, as well as a lower bound, was determined.
Earthquake depth distributions obtained in this way bear certain problems, however. First, there are only very few rela-tively large events in the catalogue for each zone. secondly, the catalogue contains ill constrained depths. For the central Alps, where Deichmann et al. (2000) document a maximum depth of seismicity at 18 km, the EcOs catalogue features earthquakes at more than 30 km depth. this is why we have not chosen a rigorous approach. We assume a normal ‘Gaussian’ frequency vs. depth distribution of earthquakes and we estimate three pa-
Fig. 5. Fracture lineaments of southern Germany and surrounding parts of France, switzerland and Austria, supplemented and redrawn as combina-tion of data from Wetzel & Franzke (2001, 2003). the fracture lineaments were derivated from high resolution data from Ers-1/2 radar mosa-ics, Landsat-tM, AstEr-DEM, and X-sAr-srtM.
9

rameters to describe this distribution to the best of our knowl-edge:
1. an average depth2. a 1σ value (standard deviation) for a normal distribution3. a maximum depth (lower truncation value).
With respect to the shape of our Gaussian depth distributions and the way they are tackled in the PsHA we refer to copper-smith et al. (this volume).
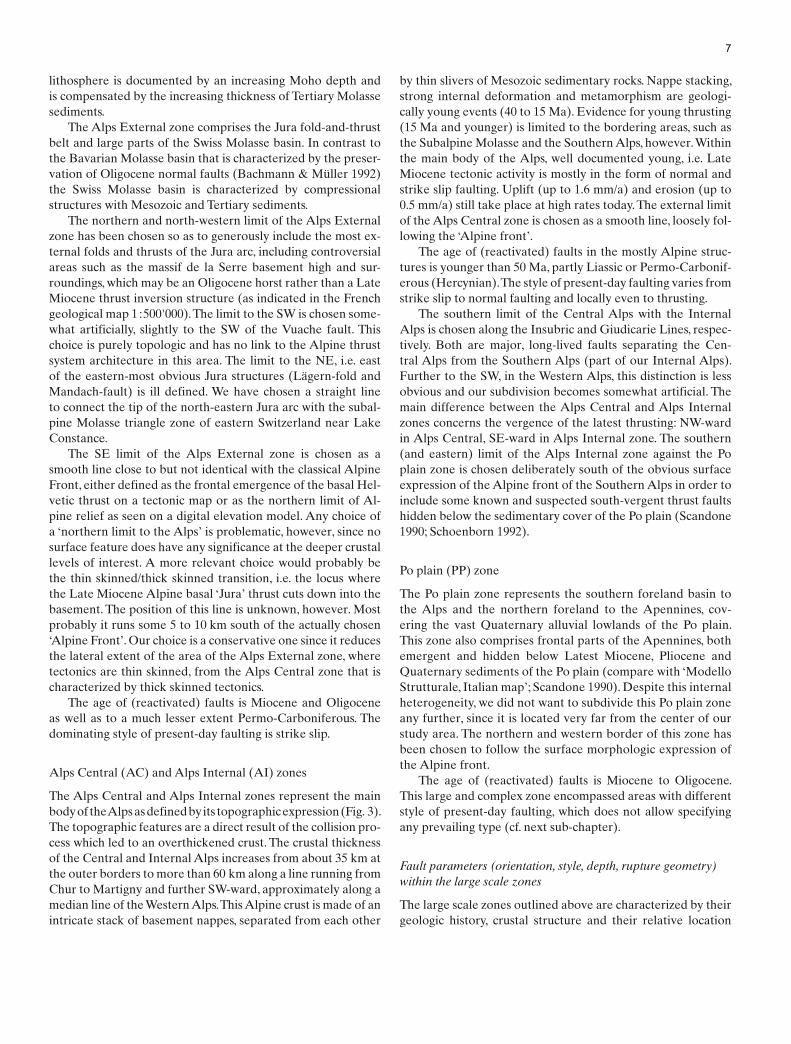
Earthquake depth distributions have been the focus of re-search in Northern switzerland and in the central swiss Alps (Deichmann 1992a, 1992b; Deichmann et al. 2000; Deichmann & Garcia Fernandez 1992; Deichmann & rybach 1989). An impor-tant finding of these studies is the definition of a thick seismo-genic layer which encompasses most if not all of the continental crust in the Northern Alpine Foreland (our Alps External zone). Here, earthquakes are known to occur down to depths of about 30 km, but not one single event is documented from below the Moho. Within the central Alps (our Alps central zone), the seis-mogenic layer is significantly thinner; a large majority of earth-quakes occur between 0 and 12 km depth, the deepest events reach 18 km below sea level (Deichmann et al. 2000).
reasonably good information about the depth distribu-tion of small earthquakes outside of the Alps External and Alps central zones is locally available in the swabian Alb area (our small scale zone sG_1 discussed later) of south Germany (reinecker & schneider 2002), for the remiremont area (our small scale zone EF_1) of East France (Audin et al. 2002) and for the western part of the Internal Alps zone (our small scale zone AI_1 Dora Maira), where seismicity is documented down to depths of 20 km (sue 1998).
the reason for the difference between Northern Foreland and Inner Alpine earthquake depth distributions remains a
matter of debate. the most obvious explanation for the lack of deep earthquakes below the Alps is temperature. the base of the seismogenic layer could be interpreted as an isotherm of around 350 °c. Above this temperature, at depth below about 15 km, quartz-rich rocks such as granites start to deform in a crystal plastic manner, thereby prohibiting the buildup of high differential stresses and the generation of earthquakes. Us-ing this very same argument in the Northern Alpine Foreland poses a problem, however, since we would have to postulate quite a low temperature, less than about 350 °c, at the Moho depth of 30 km. such a temperature is difficult to reconcile with measurements of heatflow and geothermal gradients. Note that both are measured within the topmost 3 km of the crust, and extrapolations down to Moho depths are not straightforward. Alternative explanations for the seismicity within the lower crust of northern switzerland are the presence of fluids at high, i.e. near lithostatic, pressure; this is the favored explanation of Deichmann et al. (2000). Another possibility is that the lower crust is quartz-poor; in feldspar dominated rock the brittle plas-tic transition could be as high as 500 °c. still, this very same crust is present within the European lithosphere seen to be extending sE-ward below the Alps, where it stops to be seis-mic – most likely because of increased temperatures within this young orogen and/or because it is bent downward to greater depth and into a higher temperature field. this configuration is schematically drawn in Figure 7.
Small scale seismic source zones
the further subdivision of the large scale zones is based to a large extent on information provided by the seismicity pat-terns. the main document used for the delimitation of small scale source zones was the EcOs Earthquake catalogue pro-
Fig. 6. the present-day tectonic regime in each of the large zones. General expected fault orientations are indicated by a hatching overlain onto our large zones. the strike orientation of the most likely fault orientation is given separately for each faulting mode. Numbers (in%) indicate the estimated percentage of large earthquakes to occur in ‘thrusting’, ‘strike slip’ and ‘normal’ faulting mode respectively.
10

vided for PEGAsOs. Additional information was taken from the local geology and the suspected or known presence or ab-sence of faults, respectively. the guiding philosophy in the de-limitation of these source zones was to capture the maximum information provided by localized sources of seismicity on the one hand, to ‘build fences around the wild dogs’ on the other hand, wherever our limited knowledge of the local seismicity allows us to make some informed guess about the size of the ‘dog-house’.
Labeling scheme
the large scale zones carry names such as rhine Graben and their abbreviations are given in two capital letters (e.g., rG). For the small scale zones, we simply add a number to the let-tering of the large scale zones. In the labeling of the small scale zones we therefore do not add the term “small scale”, when we describe e.g. the AE_12 Jura West zone.
We started numbering with one of the most prominent seis-mic sources within each larger zone and then continued num-bering the other zones in a general clockwise sense (see Fig. 8). In addition to this short label such as rG_1, we also named each small zone according to some geographic reference, e.g. basel. In the following, we provide an exhaustive list of all small source zones. Detailed descriptions and justification for our choices will be given in the case of the more seismically active or potentially active zones near the center of the study area. Many of the remote zones with little activity will receive little coverage, however. Quantitative data for each source zone are provided in table 1.
Rhine Graben RG_1, RG_2, and RG_3 small scale zones
the RG_1 Basel zone with the NNE-SSE oriented strike-slip Reinach fault lies in the sE corner of the rhine Graben, an area characterized by relatively high seismic activity, both historical and instrumental. this zone hosts an epi-center of one of the large historical basel events of 18.10.1356, with M = 6.2. the big M = 6.9 basel 1356 earthquake, however, is not located in this zone, but in AE_1 further south, according to isoseismals as determined from his-torical documents (Mayer-rosa & cadiot 1979).
Within this south-eastern part of the rhine Graben, the total thickness of tertiary sediments varies between 0 and 500 m. An abrupt increase to more than 1500 m of tertiary graben fill occurs along normal faults in the Mulhouse area. the trend of these buried normal faults has been chosen as rough limits of rG_1 to the north and to the west. the eastern and southern boundaries
of sG_1 are ‘natural’ tectonic boundaries too. to the east, the rhine Graben is limited against the black Forest high, to the south, the rhine Graben is interfering with the folded Jura. However, there is quite some uncertainty in the choice of the lateral limits of this zone to the east (sG_8, sG_7) and to the south (AE_1), where high seismic activity straddles our boundaries. these uncertainties will be taken into account in the form of a logic tree, in which we sequentially remove some of these boundaries (between small zones) in order to regroup small adjacent zones into larger ones.
the rG_1 zone contains the northern part of the reinach fault, a NNE–ssW striking geomorphic feature that has been proposed as the surface rup-ture of the 1356 basel earthquake by Meghraoui et al. (2001). In trenches dug across this fault scarp, Meghraoui et al. (2001) identified three slip events, constrained by c14 age dating. the total amount of slip accumulated over the last 8500 years is 1.8 m vertical displacement. based on such paleo-seismic data, combined with the historical record of seismicity, these authors estimate a recurrence time of 1500 to 2500 years for a 1356-type earthquake.
there are a series of open questions, however, addressed within this pro-ject:
– the strike of this fault is not suitably oriented for a normal fault movement given the present day stress field and regime.
– tilted bedding in the hanging wall of the fault indicates a very shallow listric geometry at depth.
– Other geomorphic features in the area have been proposed as candidates for the big basel earthquake (Meyer et al. 1994).
the major problem is that of fault orientation with respect to the present-day stress field. If we accept the stress orientations determined from earthquakes in northern switzerland, such as presented by Kastrup (2002), the reinach fault is ill oriented for any type of faulting, even if we allow for substantial uncertainty in the orientations of the principal stresses and/or permutations of principal stress axes orientations. In the prevailing field of combined strike slip/normal faulting, with a NE–sW oriented extension direction, the reinach fault is very unlikely to act as a normal fault, but even reactivation in sinistral strike slip seems almost impossible.
Additional problems arise from the new magnitude of 6.9 attributed to the 1356 event (and an older 250 AD earthquake ‘Augusta raurica’) in the EcOs/PEGAsOs catalogue, while both Meghraoui et al. (2001) and becker et al. (2002) used a magnitude of 6 to 6.5. Grünthal & Wahlström (2003) esti-mated Mw = 6.5 for the 1356 basel earthquake. taken at face value, the paleo-seismic data of Meghraoui et al. (2001) or becker et al. (2002) plot below the actually observed historical activity for the basel region such as given by the EcOs/PEGAsOs catalogue (Fig. 9).
Faced with this dilemma – in estimating a and b as well as Mmax for the rG_1 basel zone – we conclude that the trenched reinach fault does not provide any useful additional constraints for these parameters.
the alternative view, presented by Meghraoui et al. (2001), was to ex-trapolate a downward trend of the activity curve, fitting the observed pa-leo-seismic data. Even if the observed fault was along the surface rupture of the 1356 basel earthquake this approach is questionable since it assumes that:
1. the fault was trenched in its central portion.2. the observed slip is close to the maximum co-seismic slip.3. this is the only active fault in the basel area.
Fig. 7. Depth distribution of well constrained small earthquakes of switzerland, projected onto a N–s profile across the Alps after Deichmann et al. (2002). We superimposed a tentative interpre-tation in terms of temperature and lithology. the 350 °c isotherm is proposed as the base of the seismogenic layer for quartz-rich (granitic) upper crustal rocks, while a 450 °c isotherm might cor-respond to the brittle ductile transition in quartz-poor (dioritic) rocks of the lower crust.
11

4. the trenches provide a complete earthquake record for basel for the last 8500 years.
Alternative views (to the reinach fault as responsible for the basel earth-quake) have been published by Meyer et al. (1994) and Niviere & Winter (2000). both argue in favor of a thrust mechanism, in relation with ongoing Jura or rather Alpine shortening in a (N)NW-(s)sE direction, possibly by re-
activation of older, Permo-carboniferous and or Oligocene faults within the basement. these interpretations will be discussed in more detail later.
RG_2 South Rhine Graben vs. RG_3 North Rhine Graben: We have chosen to cut the rhine Graben into a southern and a northern part (brun et al. 1991; Wenzel et al. 1991). such a subdivision is justified on geological and seismological grounds. Geologically, the southern and northern parts of the rhine Graben have markedly different geo-histories (brun et al. 1992) and subsidence curves. subsidence in the northern half of the rhine Graben fol-lows a straight regular trend since more than 40 Ma, the maximum thickness of tertiary graben fill is over 3 km. In the southern rhine Graben subsidence is irregular in space and time, maximum thickness of tertiary is less than 2 km. the southern rhine Graben hosts the young, i.e. Late Miocene, Kaiserstuhl Volcano and is bordered by two important basement highs or ‘rift shoulders’ in the form of the Vosges and black forest massifs. seismically, the southern part of the rhine Graben seems to be more active than the northern one.
the present day stress regime in the rhine Graben is documented by Plenefisch & bonjer (1997), who analyzed a total of 97 earthquake focal plane mechanisms. At least the upper part of the crust seems to be deforming in strike slip mode with a tendency for extension. the most stable principal stress orientation is that of σ3, oriented WsW–ENE to sW–NE. A slight, counter-clockwise rotation in this orientation is observed from south to north.
South Germany small scale zones: SG_1 through to SG_15
We tried to delineate our zonation for south Germany independently from earlier ones, e.g. those of Grünthal et al. (1998) used for the D-A-cH study. but the well established and obvious seismotectonic constraints consequently lead to a seismic source zone model which resembles earlier proposed zona-tions. these first order seismotectonic elements are, for example, the Upper rhine Graben, the swabian (schwäbische) Alb or the Altmühl Valley seis-micity cluster. the source zone model uses the seismotectonic schemes by schneider (1968, 1972, 1973, 1979, 1993), the mosaic of radar data sets (Wetzel
Fig. 8. a) configuration of small scale source zones of Expert Group 2 (EG1b). Labeling is according to that of the large scale tectonic province (EF for East France, sG for south Germany, rG for rhine Graben, etc.) complemented with a number. Numbering starts within each large scale zone with the seismically most prominent small scale zone and continues clockwise. b) spatial distribution of seismicity, considered for the delimitation of the small zones.
Fig. 9. Frequency magnitude graphs for the basel area. We superimposed the basel 1356 earthquake with a magnitude of M = 6.9 according to the PEGAsOs catalogue onto the analysis of becker et al. (2002, his Fig. 3). the exact position on the vertical axis of the basel earthquake, determined from the EcOs/PEGAsOs catalogue, is dependent on the ‘filters’ (completeness and declustering, etc.) applied to this catalogue, which in its raw form features two events of M 6.9 near basel at A.D. 250 and 1356.
12

& Franzke 2001, 2003) in combination with the seismicity and fault plane solu-tions, as well as available geologic maps.
SG_1 Schwäbische Alb: seismicity along a single N–S fault zone: the schwäbische Alb zone is a well confined small area with considerable seismic activity (Haessler et al. 1980; reinecker & schneider 2002; schneider 1973; schneider 1979; turnovsky & schneider 1982). this zone currently is Germa-ny’s most energetic seismicity spot, where the seismic activity initiated on the 16.11.1911 with the so-called central European earthquake of Mw = 5.8 after EcOs (or Mw = 5.68 derived directly with the Hanks & Kanamori (1979) re-lation from the seismic moment after Kunze 1986). the last Mw > 5 event in this very localized zone occurred on 03.09.1978 with Mw = 5.15 after EcOs (Mw = 5.08 after Kunze 1986). Limits to this zone were chosen in order to capture this seismic activity. According to reinecker & schneider (2002), this seismic activity mostly occurs along a N–s striking fault or fault zone within the Hercynian basement. For simplicity, we assume the seismic activity of zone sG_1 as stemming from a single N–s oriented strike slip fault, running in the middle of the zone. such faults are numerous within southern Germany and the question arises if any or all of these faults have the same chance of being seismically active – albeit at different times. Although we give this view some thought (large zonation, spatial smoothing of seismicity), we prefer an alter-native view, in which seismicity is locally constrained, e.g. at the intersection of different faults (similar to the seismotectonic model of the Vogtland area by Grünthal et al. (1990), notably the intersection of sG_1 and sG_14, a ‘con-jugate’ ENE–WsW running lineament, which seems to host some increased seismic activity as well.
SG_2 Stuttgart: We consider this zone, also dominated by a single N–s fault zone, as the northern extension of the sG_1, aligned along a set of N–s strik-ing basement fractures. Historically, seismic activity (the last significant event M = 5.8 occurred on 29.03.1655) seems to have jumped southward, being con-fined to sG_1 at present. Just as its neighbor to the south, seismicity within this zone is considered to stem from one single fault running in its middle.
SG_3 Saulgau: Another small ‘hot spot’ of seismic activity is found in the saulgau, apparently disconnected from the two zones sG_1 and sG_2. We surrounded this zone with ‘fences’ which have a strike similar to that of sG_1, assuming the same two fault orientations to be present in this area. EW ori-ented structural elements constrain the elongation of this zone.
SG_4 Linzgau: this is a small ‘left-over’ zone with very little seismicity. In terms of crustal structure it is comparable to the larger zone sG_15 (bavaria) to the east. southward, the Linzgau zone sG_4 is limited against the more ac-tive sG_5 singen-bodensee zone along a gently curved WNW–EsE line, run-ning just north of Lake Konstanz (bodensee). this line follows the structural trend known from the schwarzwald, swabian Alb area and Lake Konstanz.
SG_5 Singen-Bodensee: tectonically, this zone clearly lies outside the Alpine front, but it shows an increased seismic activity with respect to its northern neighbors (sG_4 and sG_15). Epicenters including historical events define a WNW–EsE striking trend, apparently along Lake constance. some geologists have suspected the presence of faults below this lake but no major feature has been mapped so far. Lake constance (bodensee) and the singen-bodensee zone have the orientation of a family of faults which is well known also from subsurface seismic data of the bavarian Molasse basin, however (brink et al. 1992). It seems likely that the rhine river and rhine glacier followed such a fault line or family of faults, eroding and deepening the Lake constance basin. In the present day stress field, such faults are reactivated in dextral strike slip as is confirmed by fault plane solutions (Kastrup 2002).
SG_6 Leibstadt: this is a small zone with a somewhat smaller seismicity com-pared to the surroundings. this zone is the ‘rest’ that results after the definition of the surrounding source zones. It will be modified or removed, however, in several branches of our logic tree dealing with the zone configuration referred to as ‘tucan beak’ and described below in the regrouping of small zones.
SG_7 Dinkelberg: this is the eastern neighbor of the basel rG_1 zone. the limits between the two are motivated by a geologic argument: the Dinkelberg-
’scholle’ represents a block which is intermediate in height between the rhine Graben to the west and the black Forest ‘horst’ to the north and to the east. southward, the Dinkelberg dips gently below the tabular Jura and Molasse basin but it remains clearly outside of any visible trace of Alpine compression. the seismicity of this area is discussed by Faber et al. (1994).
SG_8 to SG-11: s schwarzwald, W schwarzwald, rottweil, and N schwarz-wald. these four zones are located within the basement high of the ‘black Forest Massif’ (schwarzwald). this area is geologically very well studied. It allows access to the Late Variscan basement – which is a complex assem-blage of terranes with different metamorphic histories, and with granitic intrusions of carboniferous to Permian age. the present day elevated posi-tion is partly due to Late Oligocene-Miocene extension, which led to the formation of the rhine Graben and associated rift shoulders in the form of the Vosges and black Forest massifs. Our internal subdivision of the larger black Forest area into four small zones is based on visual inspection of seismicity patterns. Zones sG_8 and sG_9 apparently have higher activity compared with the adjacent sG_10 and sG_11 small scale zones. Limits between these zones have then been drawn along well known structural trends (compare Fig. 5).
SG_12 Würzburg: this is a large ‘background’ zone in the northeastern cor-ner of our large scale south Germany zone which is characterized by a very low seismic activity. the limit to the west is naturally defined by the rhine Graben. towards the ssE, the limit is defined by an apparent increase in seismicity.
SG_13 ‘Dreieck’: this zone located between stuttgart to the west and Aalen to the east, is referred to as ‘Dreieck’ (= triangle) for lack of an obvious geo-graphic feature. the characterization in terms of geology or seismicity is de-fined by its neighbors; it can be regarded as a ‘left-over’ zone. there seems to be more seismic activity within this triangular zone sG_13 than within its northeastern neighbor sG_12. However, we did not want to link this seismic-ity with that of the south-eastern zone sG_14 either, because the latter seems to be associated with a vague tectonic lineament. to the west the triangle is limited in a more straightforward manner against the N–s oriented fault-bound zone sG_2.
The SG_14 Frankian Alb zone is chosen along a geological trend, roughly followed by the Danube river and the limit between the gently ssE dipping Mesozoic limestones to the N and the flat-lying Molasse series to the s. this geologic trend is confirmed by a series of ENE–WsW structural elements after Franzke & Wetzel (2001, 2003) and was repeatedly described as a zone of ‘bookshelf tectonics’ (schneider 1968, 1972, 1973 and 1993). A vast zone of (slightly) increased seismicity seems to run in a WsW–ENE direction all along from the northern end of the bresse Graben across the southern end of the rhine Graben, then towards the ENE crossing the southern tip of the central schwarzwald block and the swabian Alb seismic zone. the eastern part of this lineament in the Frankian Jura represents our zone sG_14. Its seismic activity is apparently higher than the almost aseismic sG_15 München zone to the south and the fairly aseismic sG_12 Würzburg zone to the north. Westward, the Frankian Alb zone is limited against the earthquake cluster of the much more active fault zone sG_1; the location of the latter at the intersection of a vague WsE-ENE oriented and a better defined N–s lineament may not be fortuitous (schneider 1993).
SG_15 München: A large portion of the bavarian Molasse basin is seismically quite quiet. this is in contrast to the swiss Molasse basin which has a higher seismic activity. the transition between the two areas within the same tectonic unit, the Alpine foredeep, also known as the ‘Molasse basin’, may be due to the above-mentioned position of the most external Alpine thrust front. the bavarian Molasse basin has been involved in down-warping of the European lithosphere below the Alps and has seen some extension in the Oligocene. Normal faults from this period are well known from petroleum exploration since they form structural traps (bachmann et al. 1982; bachmann & Mül-ler 1992; bachmann et al. 1987). they have not been inverted to any sizable degree, a strong argument in favor of this region to lie outside of the Alpine thrust regime (be it thin- or thick-skinned).
13

East France: EF_1 to EF_6 small scale zones
the large scale East France zone hosts two seismic ‘hot spots’, one near remiremont and one in the Lorraine. Only the former (EF_1) is considered as an individual source zone, however, since the latter exhibits mining induced activity. the remaining subdivisions roughly follow geological provinces, such as the Massif central or the Dijon-saône area, representing the Northern Foreland to the Folded Jura. An overview of the seismicity of France is found in Grellet et al. (1993).
EF_1 Remiremont with a N–S trending fault (?): the remiremont area in the Vosges is well known for its seismicity, which shows up clearly on seismicity maps. the shape of the remiremont zone EF_1 reflects the N–s alignment of seismicity as revealed by instrumental and historical earthquakes (Audin et al. 2002). this zone hosts the significant historical remiremont earthquake of 12 May 1682 with an intensity of VIII, translated to a M = 6.0 in the EcOs/PEGAsOs catalogue. At present, there seem to be two distinct areas of in-creased seismic activity, located in the northern and southern half of the zone near Epinal and remiremont, respectively. the alignment of seismicity sug-gests the presence of a fault, or fault zones, at depth. there is no clear corre-spondence with any mapped surface faults, however. the NNE–ssW trend of seismicity (in the southern part of the zone) suggests a rhenish trend. surface faults as seen on a geological map (brGM 1989), strike either NE–sW or NW–sE.
On 22nd February 2003, a significant earthquake of magnitude ML/Ms = 5.8 took place in the Vosges area. It occurred almost two years after we defined this source zone. this earthquake plots onto the northern border of our remiremont zone. What should we conclude from this localization? First of all, this most recent earthquake happened close to a well known ‘hotspot’ of seismic activity, the remiremont area. However, this earthquake did not occur along any recognized fault line, be it a geomorphically or a micro-seismically defined lineament. Future studies may probably reveal the culprit fault(s), but what is important here and now: we (a geologist and a seismologist with seismotectonic background) did not exactly anticipate an earthquake to take place where it did. Our zone boundary around the remiremont seismicity was chosen just about large enough to still include this latest earthquake. statistically speaking, however, we anticipated this event in the middle of the zone, along the ‘remiremont lineament’, leaving a very small probability to a ‘remiremont’ type earthquake to happen near the very zone boundary.
the Vosges zone EF_2 is geologically defined as the western shoulder of the southern rhine Graben. this zone includes faulted blocks along the eastern border of the rhine Graben as well as the highest basement culmination of the Vosges massif. seismicity within this zone is somewhat heterogeneous; from a visual inspection of the EcOs/PEGAsOs data, seismicity seems to be concentrated within the southern part of this zone. Nevertheless, we included a northern ‘tip’ of block faulted terrains based on the argument of a very similar structure and estimated likelihood of re-activation.
the EF_3 Dijon-Saône zone in the northern foreland of, and immediately ad-jacent to the Jura fold-and-thrust belt, is separated from its neighbors for two reasons: (1) this E–W corridor corresponds to the ‘left lateral transform’ nec-essary to accommodate strains between rhine and bresse Graben (bergerat 1987); (2) seismicity within this zone seems to be more important than in the adjacent Lorraine to the NW, the Massif central to the West or the bresse graben to the south.
seismicity is clearly less important and less confined than in the remire-mont zone to the NE. the southern limit, toward the Jura fold-and-thrust belt, is motivated by a geological argument. the Dijon-saône clearly lies outside Alpine thin skinned thrust belt. the entire zone is strongly faulted, however. At least two sets of ‘Oligocene’ faults are present, a dominant rhenish trend with NNE–ssW strike as well as an ‘Alpine’ or ‘Jura’ trend of roughly ENE–WsW strike. both fault families are ‘thick skinned’ basement rooted strike slip faults. In the present day stress field these two fault families do not define a conjugate set, however. the rhenish faults are likely to be reactivated in sinistral strike slip, whereas the Jura trend faults could potentially be re-acti-vated in thrusting mode.
the EF_4 Massif Central zone can be regarded as the Western shoulder of the Oligocene bresse graben. It is characterized by some topographic relief, recent Volcanism and some seismic activity.
the EF_5 Lorraine zone represents a larger area, far from the centre of the study area and can be regarded more as a left over ‘back ground’ zone rather than as a seismic source zone with a particular seismic activity. the Lorraine zone hosts an apparent hot spot of mining induced seismic activity (not indi-cated as such in EcOs) we have not considered for further consideration with respect to the PsHA.
the EF_6 Rheingau zone shows an increased seismic activity near its NW border area adjacent to the rhine Graben. We consider this activity as related to the complex tectonic situation in this area, where the rhine Graben abuts the ‘rheinisches schiefergebirge’. similar to the situation at the southern termination of the rhine Graben – bresse Graben transform zone, some ac-commodation zone, right lateral in this case, had (or has) to exist between the northern rhine Graben and the adjacent northern parts.
The Bresse Graben: BG_1 and BG_2 zone
In contrast to the contemporaneous rhine Graben structure in the NE, the bresse Graben is presently seismically rather quiet. the Graben structure is defined mostly morphologically as lowland surrounded by the Jura Mountains to the east, by the burgundy platform (carbonates) to the north and the Massif central to the west. From drill holes, industry seismic lines, and an EcOrs line, the depth and internal structure of the tertiary graben fill (reaching up to 3 km) is well known (bergerat et al. 1990).
the orientation of the present day ‘European’ stress field is nearly or-thogonal with respect to the N–s orientation of the graben structure. Fault plane solutions are scarce, however, and there is no indication for ongoing normal faulting despite the accumulation of young (Pleistocene) sediments within this graben.
BG_1 Bresse Graben: this small scale zone is chosen roughly along the trend of the northern bresse graben structure. It is characterized through the ab-sence of seismicity. towards the east, we have not included ‘boundary faults’. the graben bounding normal faults are hidden below the overriding Jura fold-and-thrust belt. the seismicity observed within the most external Jura has been included in the western Jura zone, treated to belong to the Alpine realm. We recognize the possibility that some of this seismic activity along the western boundary of the AE_12 Western Jura small scale zone could be due to normal faults bounding the bresse Graben, rather than being connected with the Alpine thrust system. Given the large distance to the central study area, the weak seismicity and the scarcity of fault plane solutions, we regard this simplification as justified.
BG_2 South Bresse Graben: this small scale zone straddles three geologic domains, namely the External Jura, the bresse Graben and the Massif central. the limits have not been chosen by any geologic arguments but purely for ‘topologic reasons’. the southern bresse Graben clearly has a higher seismic activity compared to its northern neighbor. therefore, we chose to cut the bresse Graben into two parts. West of the Vuache fault, some seismic activity is present within the southwesternmost Jura. Following our tectonic reasoning, this part of the Jura should belong to the Alps External (AE) zone. However, given the far distance with respect to the centre of the study zone, we feel authorized to neglect such subtleties and regroup two small areas, namely the southern bresse Graben and the southwesternmost folded Jura into one single zone with an apparently homogeneous seismic activity.
Alps External zone: AE_1 to AE_13 zones
AE_1 Basel Jura with E–W thrust faults: this zone hosts the historical basel 1356 event with M = 6.9. the larger basel area is characterized by a hot spot of seismic activity. this seismicity straddles the limit between the rhine Graben to the north and the Jura fold-and-thrust belt to the south. Focal plane solu-
14

tions indicate mostly strike slip faulting with a tendency for extensional defor-mation with a sW–NE oriented minimum horizontal stress σ3 (Kastrup 2002). With regard to the basel 1356 event, at least two alternative interpretations have been proposed. Meghraoui et al. (2001) ‘identified’ the reinach Fault as an ‘active normal fault’ responsible for the basel 1356 earthquake. Meyer et al. (1994), on the other hand, propose this major historical earthquake to be related to thrusting along a basement fault with an E–W orientation. these authors identified several geomorphic features in the northernmost folded Jura apparently indicating recent inversion of thalwegs, interpreted again, as due to active folding and thrusting along deep-seated N-vergent E–W-striking thrust faults.
similar findings of recent thrusting and folding have been presented by s. schmid within the PEGAsOs project in respect to post 3 Ma old sund-gau gravels, apparently folded into a series of anticlines in the northern-most basel Jura and southernmost rhine Graben (schmid & slejko, this volume).
Additional evidence for a recent, i.e. younger than ca. 3 Ma, northward propagation of thrusting deformation (in thin skinned mode) all the way up to Mulhouse has also been presented by Niviere & Winter (2000), based mostly on a geomorphic analysis of river terraces and additional constraints from seismic reflection profiles. these authors propose a complex Istein-Allschwil-rhine Valley fault system (inverse, thick skinned, but essentially a blind thrust) as culprit for the 1356 basel earthquake.
In summary, the source of the 1356 basel earthquake remains wide open to discussion.
We address this question in two ways:
– On the one hand we assign default values for fault orientations and the es-timated percentage of earthquakes taking place in thrust, normal and strike slip mode (see table 1).
– On the other hand, various regroupings of small zones around basel are treated as separate branches in a logic tree, as will be discussed below. Merg-ing zones AE_1 and rG_1, for instance, provides a larger N–s extension for a potential reinach fault, with earthquake data collected from the same merged zones. Alternatively, merging AE_1, AE_2 and AE_1 5 – in various combinations – allows hosting a considerable potential thrust fault with an E–W extension of well over 100 km length. Various such alternative concep-tual models are considered in the form of a logic tree.
Note that as a proponent of thin skinned Jura tectonics one of the team mem-bers (M. burkhard) would give the thick-skinned thrusting scenario a zero weight. As a representative of the larger structural geologist’s community, however, he feels that the current thinking is rather in favor of ongoing thick-skinned thrusting concerning the Jura in general and the basel region in par-ticular. Our group proposes the following compromise: the thrusting scenario is given an intermediate weight of up to 0.3. this weight seems outrageously high to the thin skinned proponents, but much too small to adepts of the thick skinned school.
AE_2 East Jura zone with E–W thrust faults: the northern and southern lim-its of the Eastern small scale Jura zone AE_2 are drawn according to geologi-cal arguments. the northern limit is chosen to include the northernmost occur-rence of Alpine compressional structures, notably the Mandach Fault.the southern limit is chosen such as to include all of the large clearly visible folds (and blind thrusts) of the Jura fold-and-thrust belt, but to exclude the more subtle compressional structures present within and below the Molasse basin. seismic surveys in this area, as well as a series of drill holes by Nagra, have allowed mapping a deep narrow ssE–NNW trending graben structure within the basement below the Jura detachment (Diebold et al. 1991; Müller et al. 2002).
More than 2 km thickness of Permo-carboniferous strata are not affected by Alpine deformation to any mappable degree. However, despite clear seis-mic evidence for a thin skinned detachment of the Jura fold-and-thrust belt above this graben structure, many authors have speculated about a causal relationship between the two structures, namely Jura folds and the Permo-carboniferous Graben.
the most likely and plausible relationship was formulated by Laubscher (1985) who speculated about the role of a disrupted basal triassic décolle-ment level as a ‘nucleation line’ that triggered the ramping up of the basal
Jura thrust, thus leading to the formation of ramp anticlines within the ‘thin skinned’ cover (Fig. 10). According to this view, the internal limit of the Jura, i.e. the transition between Molasse basin and Jura fold-and-thrust belt, has to be located above such pre-existing basement structures. this idea has been followed by many, notably Philippe (1995).
From the fault orientation with respect to the present day stresses a reactivation in thrusting mode of any of these graben bounding faults seems unlikely, however. Even disregarding the prevalent stress regime, which is strike slip to normal faulting mode rather than thrusting mode at present, the present day orientation of the maximum horizontal stress axis σ1 makes an angle of 50° to 60° even with the most ideally oriented basement faults and boundary faults to the Permo-carboniferous grabens. Note that, accord-ing to simple Andersonian rules ‘of thumb’, a 30° dip-angle is considered ideal, 45° is possible still; but higher angles are considered very unlikely for reactivation.
In summary, we consider the reactivation of Permo-carboniferous graben bounding faults and other old basement faults by way of estimating the rela-tive percentage of earthquakes in thrusting, normal and or strike slip mode. Permo-carboniferous grabens are documented to exist in our zones AE_1, AE_2, AE_5 and AE_8, we further suspect a continuation of such grabens westward into AE_13 and AE_12.
Default values for faulting style within the Alps External large scale zone are 0.1, 0.8 and 0.1 for normal, strike slip and thrust faulting respectively. In other words, we expect the large majority (80%) of earthquakes to be in strike slip mode, but we do not rule out the occasional normal or thrust fault esti-mating their relative percentage to one in ten events each. Locally, however, within certain small zones of the Alpine Foreland, structural arguments lead us to override these default values.
However, we give the thick skinned Permo-carboniferous graben inver-sion, i.e. the thrust faulting scenario, up to 30% weight in the basel and East-ern Jura regions. this is against the seismological evidence which excludes such fault plane solutions (Kastrup 2002). On the other hand, it honors a com-munity of structural geologists who find evidence for recent inversion in the southernmost rhine Graben (rG_1) and adjacent folded basel Jura (AE_1) (Meyer et al. 1994; Niviere & Winter 2000) and work of the basel group (ste-fan schmid, pers. comm. at the time when this report was compiled, see more recent discussion in Ustaszewski & schmid 2007).
AE_3 Zürich-Thurgau and AE_4 Aarau-Luzern zones: the northern limit of both zones is chosen along the boundary between the Molasse basin and the Jura fold-and-thrust belt. the southern limit corresponds to the classic Alpine thrust front. the border between both is somewhat arbitrary. We believe to see a change in seismic activity within the Molasse basin along strike going from E to W; i.e. the small zone AE_3 being seismically rather quiet, while the small zone AE_4 shows somewhat higher seismic activity. A new geological map of the canton thurgau and accompanying explanations have been published recently (schlaefli 1999).
AE_5 Biel zone with a potential ENE–WSW oriented thrust fault: As dis-cussed earlier, the internal border of the folded Jura may be located above some hidden basement faults, identified in eastern switzerland to form the boundary to the Permo-carboniferous Weiach Graben.
two alternative solutions have been put forward by Pfiffner & Heitz-mann (1997) and Erard (1999), respectively. Pfiffner & Heitzmann (1997) argue in favor of a recent (post 10 Million years) inversion of a Permo-carboniferous Graben. Erard (1999) re-treated the same seismic lines and interprets the critical anticline drilled at the Hermrigen site in a thin skinned fashion, i.e. as being due to a triassic evaporite accumulation above a perfectly planar basal Jura décollement level, the basement below being unaffected. this latter interpretation is in line with Meier (1994) who in-terprets the Hermrigen drill hole to be located above suspected crystalline basement rather than above a Permo-carboniferous graben fill. the pres-ence of widespread Permo-carboniferous graben structures is nevertheless likely, notably along the transition between the Jura fold belt and the Mo-lasse basin, in general with a NE–sW strike. In the AE_5 biel zone (as well as in zone AE_8 Lake Neuchâtel) we allow for the presence of such deep seated faults but we give them only a small chance of being reactivated in thrusting mode.
15

table 1. Earthquake rupture Parameters within the seismic source zones.
Label Name style of faulting Fault orientation Depth (km)
[%] [%] [%] Normal Fault strike slip Fault thrust FaultNormal strike
slipthrust strike Dip dip dir strike dip dip dir strike dip dip dir max peak 1 σ
‘Large Scale’ Zones
EF Eastern France 0.15 0.8 0.05 150 60 NE, sW 0 90 – 60 45 NW, sE 15 10 3
rG rhine Graben 0.25 0.75 0 145 60 E, W 5 90 – 65 45 sE,NW
26 13 5
sG south Germany 0.15 0.8 0.05 160 60 E, W 10 90 – 70 45 s, N 20 9 3
bG bresse Graben 0.4 0.6 0 160 60 E, W 10 90 – 70 45 s, N 30 15 15
AE Alps external 0.1 0.8 0.1 150 60 NE, sW 0 90 – 60 30 sE 30 12 10
Ac Alps central 0.5 0.3 0.2 150 60 E, W 0 90 – 60 30 sE 15 9 4
AI Alps internal 0 0.8 0.2 180 60 E, W 30 90 – 90 30 sE 37 18 10
PP Po_Plain 0.333 0.334 0.333 random 60 – random 90 – random 45 – 20 10 8
‘Small Scale’ Zones
EF01 remiremont 0.15 0.8 0.05 150 60 NE, sW 0 90 – 60 45 NW, sE 15 10 3
EF02 Vosges 0.15 0.8 0.05 150 60 NE, sW 0 90 – 60 45 NW, sE 15 10 3
EF03 Dijon-saône 0.15 0.8 0.05 150 60 NE, sW 0 90 – 60 45 NW, sE 15 10 3
EF04 Massif central 0.15 0.8 0.05 150 60 NE, sW 0 90 – 60 45 NW, sE 15 10 3
EF05 Lorraine 0.15 0.8 0.05 150 60 NE, sW 0 90 – 60 45 NW, sE 15 10 3
EF06 Mainz 0.15 0.8 0.05 150 60 NE, sW 0 90 – 60 45 NW, sE 15 10 3
rG01 basel 0.25 0.75 0 145 60 E, W 5 90 – 65 45 sE, NW 26 13 5
rG02 south rhine Graben 0.25 0.75 0 145 60 E, W 5 90 – 65 45 sE, NW 26 13 5
rG03 North rhine Graben 0.25 0.75 0 145 60 E, W 5 90 – 65 45 sE, NW 26 13 5
sG01 schwäbische Alb 0.15 0.8 0.05 160 60 E, W 10 90 – 70 45 s, N 20 9 3
sG02 stuttgart 0.15 0.8 0.05 160 60 E, W 10 90 – 70 45 s, N 20 9 3
sG03 saulgau 0.15 0.8 0.05 160 60 E, W 10 90 – 70 45 s, N 20 9 3
sG04 Linzgau 0.15 0.8 0.05 160 60 E, W 10 90 – 70 45 s, N 20 9 3
sG05 singen-bodensee 0.15 0.8 0.05 160 60 E, W 10 90 – 70 45 s, N 20 9 3
sG06 Leibstadt 0.15 0.8 0.05 160 60 E, W 10 90 – 70 45 s, N 20 9 3
sG07 Dinkelberg 0.15 0.8 0.05 160 60 E, W 10 90 – 70 45 s, N 20 9 3
sG08 s schwarzwald 0.15 0.8 0.05 160 60 E, W 10 90 – 70 45 s, N 20 9 3
sG09 W schwarzwald 0.15 0.8 0.05 160 60 E, W 10 90 – 70 45 s, N 20 9 3
sG10 rottweil 0.15 0.8 0.05 160 60 E, W 10 90 – 70 45 s, N 20 9 3
sG11 N schwarzwald 0.15 0.8 0.05 160 60 E, W 10 90 – 70 45 s, N 20 9 3
sG12 Würzburg 0.15 0.8 0.05 160 60 E, W 10 90 – 70 45 s, N 20 9 3
sG13 Dreieck 0.15 0.8 0.05 160 60 E, W 10 90 – 70 45 s, N 20 9 3
sG14 Fränk.Alb 0.15 0.8 0.05 160 60 E, W 10 90 – 70 45 s, N 20 9 3
sG15 München 0.15 0.8 0.05 160 60 E, W 10 90 – 70 45 s, N 20 9 3
bG01 bresse Graben 0.4 0.6 0 160 60 E, W 10 90 – 70 45 s, N 30 15 15
bG02 s_bresse Graben 0.4 0.6 0 160 60 E, W 10 90 – 70 45 s, N 30 15 15
AE01 baselJura 0.1 0.6 0.3 150 60 NE, sW 0 90 – 80 45 sE 30 12 10
AE02 E_Jura 0.1 0.7 0.2 150 60 NE, sW 0 90 – 80 45 sE 30 12 10
AE03 Zürich-thurgau 0.2 0.7 0.1 150 60 NE, sW 0 90 – 70 45 sE 30 12 10
AE04 Aarau-Luzern 0.1 0.8 0.1 150 60 NE, sW 0 90 – 60 45 sE 30 12 10
16

table 1. (continued).
Label Name style of faulting Fault orientation Depth (km)
[%] [%] [%] Normal Fault strike slip Fault thrust FaultNormal strike
slipthrust strike Dip dip dir strike dip dip dir strike dip dip dir max peak 1 σ
‘Small Scale’ Zones
AE05 biel 0 0.8 0.2 155 60 NE, sW 5 90 – 65 45 sE 30 12 10
AE06 Napf 0.1 0.8 0.1 155 60 NE, sW 5 90 – 65 45 sE 30 12 10
AE07 Fribourg 0.05 0.9 0.05 155 60 NE, sW 5 90 – 65 45 sE 30 12 10
AE08 Neuchâtel Lake 0 0.8 0.2 155 60 NE, sW 5 90 – 65 45 sE 30 12 10
AE09 Vaud 0.1 0.8 0.1 155 60 NE, sW 5 90 – 65 30 sE 30 12 10
AE10 Geneva 0.1 0.8 0.1 130 60 NE, sW 160 90 – 70 30 sE 30 12 10
AE11 Vuache 0.05 0.8 0.15 130 60 NE, sW 160 90 – 70 30 sE 30 12 10
AE12 Jura West 0.1 0.8 0.1 130 60 NE, sW 160 90 – 70 30 sE 30 12 10
AE13 Jura center 0.1 0.8 0.1 150 60 NE, sW 0 90 – 60 30 sE 30 12 10
Ac01 Grenoble 0.5 0.3 0.2 150 60 E, W 0 90 – 60 30 sE 15 9 4
Ac02 briançon 0.5 0.3 0.2 150 60 E, W 0 90 – 60 30 sE 15 9 4
Ac03 Arve 0.1 0.8 0.1 150 60 E, W 0 90 – 60 30 sE 15 9 4
Ac04 Préalpes 0.1 0.8 0.1 150 60 E, W 0 90 – 60 30 sE 15 9 4
Ac05 Wildhorn 0.2 0.8 0 80 60 s 80 90 – – – – 15 9 4
Ac06 Valais 0.6 0.4 0 100 60 N, s 70 90 – – – – 15 9 4
Ac07 sarnen 0.1 0.8 0.1 150 60 E, W 0 90 – 60 30 sE 15 9 4
Ac08 ticino 0.5 0.3 0.2 150 60 E, W 0 90 – 60 30 sE 15 9 4
Ac09 Walensee 0 0.8 0.2 150 60 E, W 0 90 – 60 30 sE 15 9 4
Ac10 Graubünden 0.3 0.7 0 160 60 E, W 20 90 – – – – 15 9 4
Ac11 Vorarlberg 0.3 0.7 0 170 60 E, W 10 90 – – – – 15 9 4
Ac12 Glorenza 0.5 0.3 0.2 150 60 E, W 0 90 – 60 30 sE 15 9 4
Ac13 Allgäu 0.5 0.3 0.2 150 60 E, W 0 90 – 60 30 sE 15 9 4
Ac14 Inntal 0.3 0.7 0 150 60 E, W 70 90 – – – – 15 9 4
Ac15 tauern 0.5 0.3 0.2 150 60 E, W 0 90 – 60 30 sE 15 9 4
AI01 DoraMaira 0 0.6 0.4 – – – 60 90 – 10 45 E 37 18 10
AI02 Alpi sud 0.333 0.334 0.333 0 60 E, W 30 90 – 90 45 s 37 18 10
AI03 bolzano 0.333 0.334 0.333 170 60 E, W 20 90 – 80 45 s 37 18 10
PP01 Po_Plain 0.333 0.334 0.333 random 60 – random 90 – random 45 – 20 10 8
regroupings of ‘small scale’ zones
Dinkelberg Area: ‘tucan beak’
sG5678 0.15 0.8 0.05 160 60 E, W 10 90 – 70 45 s, N 20 9 3
sG5_6_8 0.15 0.8 0.05 160 60 E, W 10 90 – 70 45 s, N 20 9 3
sG5_8 0.15 0.8 0.05 160 60 E, W 10 90 – 70 45 s, N 20 9 3
sG6_7 0.15 0.8 0.05 160 60 E, W 10 90 – 70 45 s, N 20 9 3
basel area: ‘rhinozeros’
rG1_AE1 0.15 0.6 0.25 145 60 E, W 5 90 – 80 45 sE 26 13 5
AE1_2 0.1 0.6 0.3 150 60 NE, sW 0 90 – 80 45 sE 30 12 10
AE1_2_13 0.1 0.65 0.25 150 60 NE, sW 0 90 – 75 45 sE 30 12 10
AE1_13 0.1 0.7 0.2 150 60 NE, sW 0 90 – 70 45 sE 30 12 10
schwäbische Alb
sG1_2 0.15 0.8 0.05 160 60 E,W 10 90 – 70 45 s, N 20 9 3
17
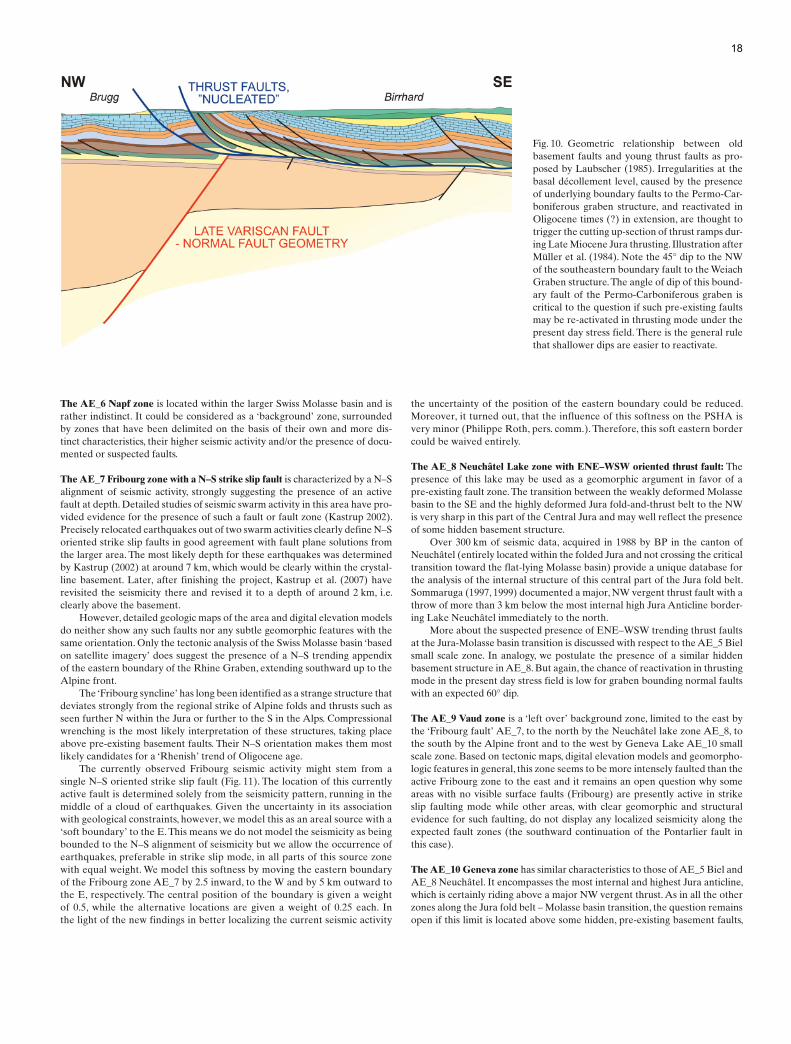
The AE_6 Napf zone is located within the larger swiss Molasse basin and is rather indistinct. It could be considered as a ‘background’ zone, surrounded by zones that have been delimited on the basis of their own and more dis-tinct characteristics, their higher seismic activity and/or the presence of docu-mented or suspected faults.
The AE_7 Fribourg zone with a N–S strike slip fault is characterized by a N–s alignment of seismic activity, strongly suggesting the presence of an active fault at depth. Detailed studies of seismic swarm activity in this area have pro-vided evidence for the presence of such a fault or fault zone (Kastrup 2002). Precisely relocated earthquakes out of two swarm activities clearly define N–s oriented strike slip faults in good agreement with fault plane solutions from the larger area. the most likely depth for these earthquakes was determined by Kastrup (2002) at around 7 km, which would be clearly within the crystal-line basement. Later, after finishing the project, Kastrup et al. (2007) have revisited the seismicity there and revised it to a depth of around 2 km, i.e. clearly above the basement.
However, detailed geologic maps of the area and digital elevation models do neither show any such faults nor any subtle geomorphic features with the same orientation. Only the tectonic analysis of the swiss Molasse basin ‘based on satellite imagery’ does suggest the presence of a N–s trending appendix of the eastern boundary of the rhine Graben, extending southward up to the Alpine front.
the ‘Fribourg syncline’ has long been identified as a strange structure that deviates strongly from the regional strike of Alpine folds and thrusts such as seen further N within the Jura or further to the s in the Alps. compressional wrenching is the most likely interpretation of these structures, taking place above pre-existing basement faults. their N–s orientation makes them most likely candidates for a ‘rhenish’ trend of Oligocene age.
the currently observed Fribourg seismic activity might stem from a single N–s oriented strike slip fault (Fig. 11). the location of this currently active fault is determined solely from the seismicity pattern, running in the middle of a cloud of earthquakes. Given the uncertainty in its association with geological constraints, however, we model this as an areal source with a ‘soft boundary’ to the E. this means we do not model the seismicity as being bounded to the N–s alignment of seismicity but we allow the occurrence of earthquakes, preferable in strike slip mode, in all parts of this source zone with equal weight. We model this softness by moving the eastern boundary of the Fribourg zone AE_7 by 2.5 inward, to the W and by 5 km outward to the E, respectively. the central position of the boundary is given a weight of 0.5, while the alternative locations are given a weight of 0.25 each. In the light of the new findings in better localizing the current seismic activity
the uncertainty of the position of the eastern boundary could be reduced. Moreover, it turned out, that the influence of this softness on the PsHA is very minor (Philippe roth, pers. comm.). therefore, this soft eastern border could be waived entirely.
The AE_8 Neuchâtel Lake zone with ENE–WSW oriented thrust fault: the presence of this lake may be used as a geomorphic argument in favor of a pre-existing fault zone. the transition between the weakly deformed Molasse basin to the sE and the highly deformed Jura fold-and-thrust belt to the NW is very sharp in this part of the central Jura and may well reflect the presence of some hidden basement structure.
Over 300 km of seismic data, acquired in 1988 by bP in the canton of Neuchâtel (entirely located within the folded Jura and not crossing the critical transition toward the flat-lying Molasse basin) provide a unique database for the analysis of the internal structure of this central part of the Jura fold belt. sommaruga (1997, 1999) documented a major, NW vergent thrust fault with a throw of more than 3 km below the most internal high Jura Anticline border-ing Lake Neuchâtel immediately to the north.
More about the suspected presence of ENE–WsW trending thrust faults at the Jura-Molasse basin transition is discussed with respect to the AE_5 biel small scale zone. In analogy, we postulate the presence of a similar hidden basement structure in AE_8. but again, the chance of reactivation in thrusting mode in the present day stress field is low for graben bounding normal faults with an expected 60° dip.
The AE_9 Vaud zone is a ‘left over’ background zone, limited to the east by the ‘Fribourg fault’ AE_7, to the north by the Neuchâtel lake zone AE_8, to the south by the Alpine front and to the west by Geneva Lake AE_10 small scale zone. based on tectonic maps, digital elevation models and geomorpho-logic features in general, this zone seems to be more intensely faulted than the active Fribourg zone to the east and it remains an open question why some areas with no visible surface faults (Fribourg) are presently active in strike slip faulting mode while other areas, with clear geomorphic and structural evidence for such faulting, do not display any localized seismicity along the expected fault zones (the southward continuation of the Pontarlier fault in this case).
The AE_10 Geneva zone has similar characteristics to those of AE_5 biel and AE_8 Neuchâtel. It encompasses the most internal and highest Jura anticline, which is certainly riding above a major NW vergent thrust. As in all the other zones along the Jura fold belt – Molasse basin transition, the question remains open if this limit is located above some hidden, pre-existing basement faults,
Fig. 10. Geometric relationship between old basement faults and young thrust faults as pro-posed by Laubscher (1985). Irregularities at the basal décollement level, caused by the presence of underlying boundary faults to the Permo-car-boniferous graben structure, and reactivated in Oligocene times (?) in extension, are thought to trigger the cutting up-section of thrust ramps dur-ing Late Miocene Jura thrusting. Illustration after Müller et al. (1984). Note the 45° dip to the NW of the southeastern boundary fault to the Weiach Graben structure. the angle of dip of this bound-ary fault of the Permo-carboniferous graben is critical to the question if such pre-existing faults may be re-activated in thrusting mode under the present day stress field. there is the general rule that shallower dips are easier to reactivate.
18

if any such step in the basal Jura décollement was responsible for the localiza-tion / triggering of this thrust fault, and if such basement faults have a chance of being reactivated in thrusting mode. there is at least one published occur-rence of a pure thrusting fault plane mechanism and for an earthquake that occurred in the French Jura some 30 km northwest of Geneva on 5. 2. 1968 (sambeth & Pavoni 1988). A general shift from strike slip – normal faulting in the eastern Jura to strike slip – thrust faulting in the western Jura is noted by Kastrup (2002).
Given the narrow NW–sE width of the Molasse basin below Lake Ge-neva we generously included this entire area into one single zone, in contrast to the Molasse basin further east, where a distinction between Jura fold belt and flat-lying Molasse basin was made.
The AE_11 Vuache zone with a NNW–SSE oriented strike slip fault: the Vuache fault is part of an entire family of sinistral strike slip faults which have an intimate relationship with the formation of the Jura fold-and-thrust belt. Among all the well known strike slip faults of the Jura arc, the Vuache fault is the only one that is clearly seismically active today (blondel et al. 1988). It is probably the best defined active fault structure of the entire study area. A recent earthquake of magnitude ML 5.3 took place near Annecy on 15th of July in 1996 in a depth of about 2 km (thouvenot et al. 1998).
the Vuache fault is also well known as a major geomorphic and tectonic feature. Our zone AE_11 is chosen such as to include the entire mapped length of the Vuache fault. the width is chosen in order to only collect seismic events stemming from this fault or fault zone. southward, the Vuache zone extends into the realm of truly Alpine tectonics of the chablais Prealps. Al-though the geometry of our zone boundaries may seem somewhat artificial in this respect, such a ‘bridge’ between the External Alps and the Jura fold-and-thrust belt quite nicely reflects the fact that the Molasse basin separating the two provinces (Jura and Alps) further east dies out towards the sW, abutting the Vuache tear fault.
The AE_12 Jura West zone includes an important portion of the western Jura fold-and-thrust belt, an area bordering the bresse Graben to the west along a major thin skinned thrust fault (Guellec et al. 1990). to the N, the transition
between Alpine thrust belt and stable European foreland has been extended somewhat northward beyond the thin skinned front of the Jura fold belt in order to include the ‘Massif de la serre’.
the AE_12 zone contains many mapped strike slip faults similar to the Vuache fault, but none of them is documented to be seismically active. seis-micity seems to be distributed rather evenly over the entire area. Pre-existing faults of different age can potentially be reactivated in the present day stress field. NNW–ssE striking tear faults of the Vuache type are expected to be reactivated in sinistral strike slip. N–s trending boundary faults of the bresse graben, hidden below the most frontal Jura folds and thrusts, might equally be reactivated in sinistral strike slip. WsW–ENE trending Hercynian, Oligocene and/or Miocene faults are potentially reactivated in thrusting (sambeth & Pavoni 1988).
The AE_13 Jura Center zone is limited to the west along another major sinis-tral tear fault, the Pontarlier fault zone, which has been included in AE_13. to the north, this zone is limited generously so as to include any thin or thick skinned Alpine compression features. to the south, we delimited the central Jura zone towards the seemingly more active boundary zone of AE_8 Neuchâ-tel Lake, transitional towards the Molasse basin. the boundary with its eastern neighbor AE_1, basel Jura is again chosen along another N–s striking fault zone which itself has been included into AE_1.
Alps Central zone: AC_01 to AC_15 small scale zones
The AC_1 Grenoble zone includes large parts of the thin skinned ‘chaînes subalpines’, as well as thick skinned parts of the hinterland such as the Mt. blanc massif. If it were located closer to the center of the study area, we cer-tainly would have subdivided this zone further in order to take into account such major structural and tectonic differences. the simplification seems justi-fied by the rather erratic pattern of seismicity within the larger Grenoble area. An interesting observation about the present day activity and stress state of the Alpine chain is that this zone is indeed one of the few places where thrust-ing fault plane solutions have been observed. the location of thrusting fits nicely with the proposed frontal and/or basal ramp of the youngest Alpine floor thrust at the transition where the External crystalline Massifs (belle-donne massif in this case) are thrust upon the non-affected European foreland basement (sue et al. 1999).
The AC 2 Briançon zone belongs to the core of the central Alps (often re-ferred to as ‘internal’, in contrast to ‘external’). It is clearly separated from the External crystalline Massifs to the west by the frontal, or rather basal, Penninic thrust zone. Long recognized as one of the more important ‘sutures’ (some questionable ophiolites of the Valais Ocean are present indeed) within the Alps, this thrust zone has now also been identified as being re-activated in normal faulting mode in late Alpine times (from the Miocene onwards).
A normal faulting regime is also well documented through focal plane solutions (sue et al. 1999). On the scale of the Western Alps, the briançon zone is defined by an elongate N–s oriented area with some elevated seismic-ity closely following the surface trace of the Penninic Front. It is limited to the east along a N–s line in order to distinguish it from another seismic arc along the Alps-Po plain transition, the ‘Piemontais Arc’ (sue et al. 1999), forming the AI_1 Dora Maira zone.
The AC_3 Arve zone is very similar to the zone Ac_4 (Préalps) further east. both areas are characterized by the presence of a thin (in terms of crustal structure) thrust sheet of far travelled thin skinned briançonnais cover units. the internal structure of the topmost about 2 km is highly complex, with gen-erally NE–sW trending folds and thrust faults. N–s and E–W trending tear-faults are equally present, but their age is ill-constrained. Many of these major tear-faults certainly owe their origin to the emplacement history, starting in the late Eocene. Final emplacement in their present day position on the north-ern border of the Alps is younger than Early Miocene, since some Molasse deposits are found below and in front. the deeper structure of this part of the Alps is ill constrained as well. Most probably, the top of the European foreland crust is gently bending downward to reach a depth of around 6 km. there is no evidence for thick skinned tectonics below the Arve zone.
Fig. 11. seismic activity along a N–s earthquake cluster within the AE_7 Fribourg zone is interpreted as stemming from a single central N–s oriented sinistral strike slip fault (grey line in the source zone AE_7). but non of the known faults is identical with the N–s orientation of the seismicity cluster.
19
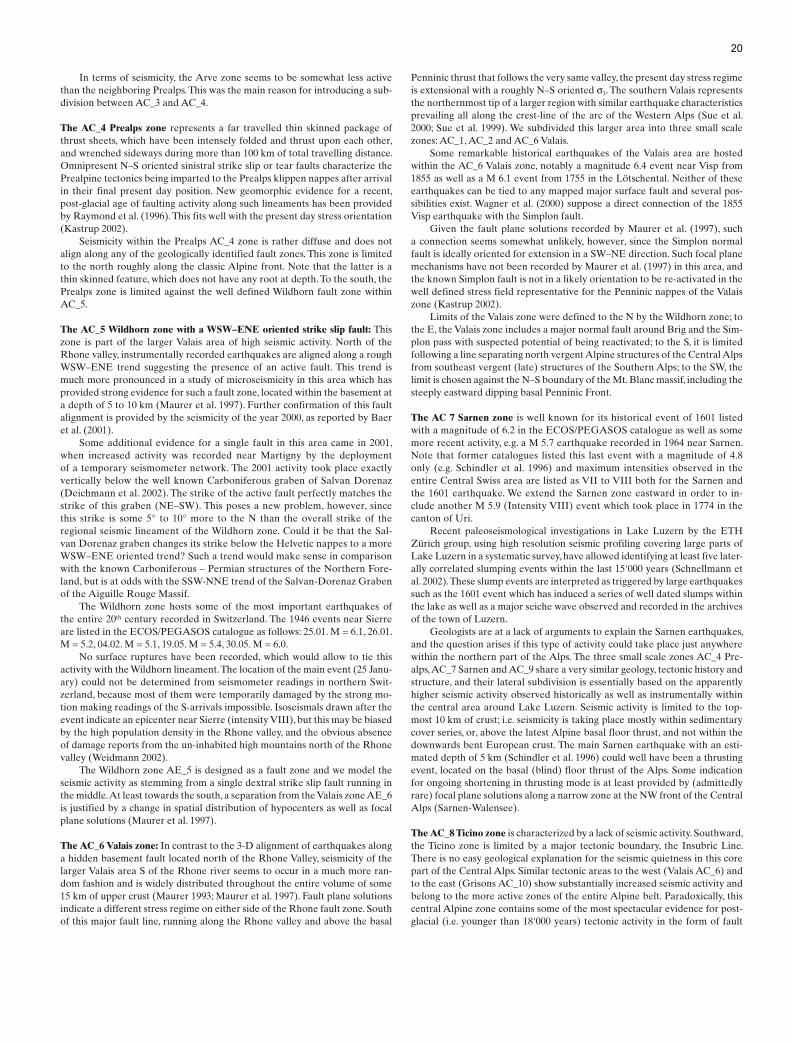
In terms of seismicity, the Arve zone seems to be somewhat less active than the neighboring Prealps. this was the main reason for introducing a sub-division between Ac_3 and Ac_4.
The AC_4 Prealps zone represents a far travelled thin skinned package of thrust sheets, which have been intensely folded and thrust upon each other, and wrenched sideways during more than 100 km of total travelling distance. Omnipresent N–s oriented sinistral strike slip or tear faults characterize the Prealpine tectonics being imparted to the Prealps klippen nappes after arrival in their final present day position. New geomorphic evidence for a recent, post-glacial age of faulting activity along such lineaments has been provided by raymond et al. (1996). this fits well with the present day stress orientation (Kastrup 2002).
seismicity within the Prealps Ac_4 zone is rather diffuse and does not align along any of the geologically identified fault zones. this zone is limited to the north roughly along the classic Alpine front. Note that the latter is a thin skinned feature, which does not have any root at depth. to the south, the Prealps zone is limited against the well defined Wildhorn fault zone within Ac_5.
The AC_5 Wildhorn zone with a WSW–ENE oriented strike slip fault: this zone is part of the larger Valais area of high seismic activity. North of the rhone valley, instrumentally recorded earthquakes are aligned along a rough WsW–ENE trend suggesting the presence of an active fault. this trend is much more pronounced in a study of microseismicity in this area which has provided strong evidence for such a fault zone, located within the basement at a depth of 5 to 10 km (Maurer et al. 1997). Further confirmation of this fault alignment is provided by the seismicity of the year 2000, as reported by baer et al. (2001).
some additional evidence for a single fault in this area came in 2001, when increased activity was recorded near Martigny by the deployment of a temporary seismometer network. the 2001 activity took place exactly vertically below the well known carboniferous graben of salvan Dorenaz (Deichmann et al. 2002). the strike of the active fault perfectly matches the strike of this graben (NE–sW). this poses a new problem, however, since this strike is some 5° to 10° more to the N than the overall strike of the regional seismic lineament of the Wildhorn zone. could it be that the sal-van Dorenaz graben changes its strike below the Helvetic nappes to a more WsW–ENE oriented trend? such a trend would make sense in comparison with the known carboniferous – Permian structures of the Northern Fore-land, but is at odds with the ssW-NNE trend of the salvan-Dorenaz Graben of the Aiguille rouge Massif.
the Wildhorn zone hosts some of the most important earthquakes of the entire 20th century recorded in switzerland. the 1946 events near sierre are listed in the EcOs/PEGAsOs catalogue as follows: 25.01. M = 6.1, 26.01. M = 5.2, 04.02. M = 5.1, 19.05. M = 5.4, 30.05. M = 6.0.
No surface ruptures have been recorded, which would allow to tie this activity with the Wildhorn lineament. the location of the main event (25 Janu-ary) could not be determined from seismometer readings in northern swit-zerland, because most of them were temporarily damaged by the strong mo-tion making readings of the s-arrivals impossible. Isoseismals drawn after the event indicate an epicenter near sierre (intensity VIII), but this may be biased by the high population density in the rhone valley, and the obvious absence of damage reports from the un-inhabited high mountains north of the rhone valley (Weidmann 2002).
the Wildhorn zone AE_5 is designed as a fault zone and we model the seismic activity as stemming from a single dextral strike slip fault running in the middle. At least towards the south, a separation from the Valais zone AE_6 is justified by a change in spatial distribution of hypocenters as well as focal plane solutions (Maurer et al. 1997).
The AC_6 Valais zone: In contrast to the 3-D alignment of earthquakes along a hidden basement fault located north of the rhone Valley, seismicity of the larger Valais area s of the rhone river seems to occur in a much more ran-dom fashion and is widely distributed throughout the entire volume of some 15 km of upper crust (Maurer 1993; Maurer et al. 1997). Fault plane solutions indicate a different stress regime on either side of the rhone fault zone. south of this major fault line, running along the rhone valley and above the basal
Penninic thrust that follows the very same valley, the present day stress regime is extensional with a roughly N–s oriented σ3. the southern Valais represents the northernmost tip of a larger region with similar earthquake characteristics prevailing all along the crest-line of the arc of the Western Alps (sue et al. 2000; sue et al. 1999). We subdivided this larger area into three small scale zones: Ac_1, Ac_2 and Ac_6 Valais.
some remarkable historical earthquakes of the Valais area are hosted within the Ac_6 Valais zone, notably a magnitude 6.4 event near Visp from 1855 as well as a M 6.1 event from 1755 in the Lötschental. Neither of these earthquakes can be tied to any mapped major surface fault and several pos-sibilities exist. Wagner et al. (2000) suppose a direct connection of the 1855 Visp earthquake with the simplon fault.
Given the fault plane solutions recorded by Maurer et al. (1997), such a connection seems somewhat unlikely, however, since the simplon normal fault is ideally oriented for extension in a sW–NE direction. such focal plane mechanisms have not been recorded by Maurer et al. (1997) in this area, and the known simplon fault is not in a likely orientation to be re-activated in the well defined stress field representative for the Penninic nappes of the Valais zone (Kastrup 2002).
Limits of the Valais zone were defined to the N by the Wildhorn zone; to the E, the Valais zone includes a major normal fault around brig and the sim-plon pass with suspected potential of being reactivated; to the s, it is limited following a line separating north vergent Alpine structures of the central Alps from southeast vergent (late) structures of the southern Alps; to the sW, the limit is chosen against the N–s boundary of the Mt. blanc massif, including the steeply eastward dipping basal Penninic Front.
The AC 7 Sarnen zone is well known for its historical event of 1601 listed with a magnitude of 6.2 in the EcOs/PEGAsOs catalogue as well as some more recent activity, e.g. a M 5.7 earthquake recorded in 1964 near sarnen. Note that former catalogues listed this last event with a magnitude of 4.8 only (e.g. schindler et al. 1996) and maximum intensities observed in the entire central swiss area are listed as VII to VIII both for the sarnen and the 1601 earthquake. We extend the sarnen zone eastward in order to in-clude another M 5.9 (Intensity VIII) event which took place in 1774 in the canton of Uri.
recent paleoseismological investigations in Lake Luzern by the EtH Zürich group, using high resolution seismic profiling covering large parts of Lake Luzern in a systematic survey, have allowed identifying at least five later-ally correlated slumping events within the last 15'000 years (schnellmann et al. 2002). these slump events are interpreted as triggered by large earthquakes such as the 1601 event which has induced a series of well dated slumps within the lake as well as a major seiche wave observed and recorded in the archives of the town of Luzern.
Geologists are at a lack of arguments to explain the sarnen earthquakes, and the question arises if this type of activity could take place just anywhere within the northern part of the Alps. the three small scale zones Ac_4 Pre-alps, Ac_7 sarnen and Ac_9 share a very similar geology, tectonic history and structure, and their lateral subdivision is essentially based on the apparently higher seismic activity observed historically as well as instrumentally within the central area around Lake Luzern. seismic activity is limited to the top-most 10 km of crust; i.e. seismicity is taking place mostly within sedimentary cover series, or, above the latest Alpine basal floor thrust, and not within the downwards bent European crust. the main sarnen earthquake with an esti-mated depth of 5 km (schindler et al. 1996) could well have been a thrusting event, located on the basal (blind) floor thrust of the Alps. some indication for ongoing shortening in thrusting mode is at least provided by (admittedly rare) focal plane solutions along a narrow zone at the NW front of the central Alps (sarnen-Walensee).
The AC_8 Ticino zone is characterized by a lack of seismic activity. southward, the ticino zone is limited by a major tectonic boundary, the Insubric Line. there is no easy geological explanation for the seismic quietness in this core part of the central Alps. similar tectonic areas to the west (Valais Ac_6) and to the east (Grisons Ac_10) show substantially increased seismic activity and belong to the more active zones of the entire Alpine belt. Paradoxically, this central Alpine zone contains some of the most spectacular evidence for post-glacial (i.e. younger than 18'000 years) tectonic activity in the form of fault
20
scarps with displaced scree slopes, including moraine material. Fault scarps are well visible in the field, in aerial photography, in numerical altitude models and even as lineaments in satellite imagery. the interpretation of these scarps has long been and still remains a riddle (Eckart 1957, 1974; Eckart et al. 1983). the most obvious scarps are found along and on either side of the Urseren valley where they form long linear features crossing several side-streams of the main E-W striking valley.
the big open question remains, however, whether these fault scarps are indicators for paleo-seismic activity within the central Alps. If yes, could the relative quietness within zone Ac_8 ticino be regarded as a ‘seismic gap’ be-tween the presently much more active small scale zones Grisons and Valais to the east and west, respectively? this question is particularly relevant for the assessment of the maximum magnitude of earthquakes. If we consider the entire length of the rhine-rhone lineament (> 180 km) between chur and brig (or the Wildhorn zone), we easily have the potential fault for an Mmax on the order of 7.5. this topic will be further discussed later in the context of an evaluation of maximum magnitudes.
The AC_9 Walensee zone shares similar geology and tectonics with its western neighbors Ac_7 sarnen and Ac_4 Prealps. the motivation for a subdivision into three zones, rather than a single strike parallel long ‘Alpine front zone’ is motivated by the apparently higher seismic activity around Lake Luzern.
The AC_10 Graubünden zone has a seismicity that resembles the Valais zone Ac_6 in many respects. It hosts a large historical earthquake of intensity VIII at chur on the 4th of september 1295, listed with a magnitude 6.5 in the EcOs/PEGAsOs catalogue as well as a whole series of significant earthquakes with magnitudes greater or equal to 5. Only one of these M 5 events is ‘instrumen-tal’, however, namely that from 9.8.1961 in the lower Engadine.
A seismotectonic study of roth et al. (1992) is one of the earlier records documenting the limited thickness of the seismogenic zone within the Alps, given as 13 km. A correlation of seismic activity with rain fall and snow melt has been discovered by roth et al. (1992) for earthquakes within the topmost 5 km.
The AC_11 Vorarlberg and the AC_14 Inntal zones: two ENE–WsW strik-ing large ‘strike slip fault couloirs’ are distinguished within the eastern Alps of the study area: the Vorarlberg zone Ac_11 and the Inntal zone Ac_14. these two small scale zones are characterized by a clustered seismic activ-ity roughly aligned along these corridors. During the last two decades or so, many such strike slip fault, have been identified throughout the eastern Alps (ratschbacher et al. 1989). their significance as faults accommodating lateral, eastward extrusion of the central Alps is widely accepted and an abundant body of literature documents the ‘paleo-stress orientations’ re-sponsible for late brittle deformation in such a strike slip dominated lateral extrusion regime.
The AC_12 Glorenza zone: this is a ‘background zone’, distinguished from neighboring areas with higher seismic activity. the northern, eastern and southeastern boundaries are all geologically defined, tectonic boundaries ex-ist against WsW–ENE trending strike slip fault zones in the north and against the Giudicarie line to the sE. the limit to the west against the Grisons zone Ac_10 is chosen more artificially, based entirely on the observed seismicity patterns: a straight line separating the high activity of the bündnerland zone against the low activity of the Ac_12 Glorenza zone.
The AC_13 Allgäu zone: In contrast to the swiss Alps, the morphologic and tectonic Alpine front in the Allgäu seems to be seismically quiet. this zone is characterized through its low level of activity delimited to the south against the two strike slip fault zones Vorarlberg Ac_11 and Inntal Ac_14. to the north, the delimitation against the zone sG_15 is entirely motivated by the presence of a major tectonic boundary: the Alpine front. In the seismicity pat-tern, this limit does not show up at all, however.
The AC_15 Tauern zone: the tauern window area has attracted much atten-tion by geologists worldwide. It is considered as the type example of a ‘met-amorphic core complex’, where highly metamorphic rocks (of amphibolite grade) have been exhumed rapidly through a combination of normal faulting,
vertical extrusion and erosion (Axen et al. 1998). In this respect, the tauern/Glorenza/Inntal area of the Eastern Alps and the simplon fault/Valais/Wild-horn area of the Western Alps (Mancktelow 1985, 1992) share a very similar structural and tectonic history. In terms of their present day seismicity too, both ‘core complexes’, the ticino – Lepontine dome of the Western Alps and the tauern window of the Eastern Alps are very quiet themselves, but appar-ently surrounded by zones of higher activity. In both cases, present day activity seems to be concentrated along strike slip faults accommodating lateral extru-sion (Inntal- and Wildhorn zones), but evidence for ongoing true extensional detachment faulting in the style of the former simplon- or brenner faults is lacking.
The Alps Internal: AI_01 to AI_03 and the Po plain zone
The AI_1 Dora Maira zone: the transition between the Alps and the Po plain coincides with a N–s alignment of seismicity, the so-called Piemontais seismic arc of the French authors (e.g. sue et al. 1999). On a tectonic map, such as the structural Model of Italy (scandone 1990), the zone of increased seismicity corresponds roughly to the eastern limit of the Dora Maira internal crystalline massif. In 3-D, however, a correlation between seismicity and the presence of the mostly hidden Ivrea body seems to make more sense. seismicity seems to be more or less localized along the western steep border of the Ivrea mantle indenter as identified from the gravimetric anomaly.
The AI_2 Alpi Sud zone is geologically different from the adjacent Dora Maira zone to the sW. First of all, there is a marked change in strike from N–s to E–W. this sharp bend at the inner arc of the Alps probably has its origin in the presence of a major hidden indenter in the form of the Ivrea body, known to be present only behind the Western Alps. the southern Alps ‘Fore-land Fold and thrust belt’ on the other hand terminates westward against the eastern flank of the Ivrea-strona ceneri zone and does not have any ‘cylin-drical’ equivalent further southwest (schumacher 1997). southward thrust-ing within the southern Alps in general predates 5 Ma, since thrust faults are sealed by Messinian sediments below the Po plain. Locally, however ongoing south-ward thrusting has been documented by displaced terraces near Mon-tebelluna as well as by a correlation between earthquake activity and hidden ‘blind’ thrust faults in the case of the 1976 Friuli earthquake (Aoudia et al. 2000; Poli et al. 2002).
the zone AI_2 is limited to the north against the Insubric line, an obvious choice despite the fact that it does not seem to affect seismicity patterns at all. to the south, we deliberately choose to incorporate parts of the morpho-logically distinct Po plain, in order to include potentially hidden south-vergent ‘blind’ thrust faults.
The AI_3 Bolzano zone: the most important tectonic feature of the bolzano zone is the Giudicarie line, limiting this zone to the NW. the Giudicarie line is part of the Periadriatic lineament system, causing a major step (off-set) within the otherwise E–W trending Insubric line (schmid et al. 1989). the Giudicarie line will certainly become a new focus of interest because it seems to be the surface expression of a flip in the subduction polarity as revealed by recent mantle tomographic studies (Lippitsch 2002). Given the low seismic activity within the bolzano zone and around the Giudicarie line there is no indication for any recent re-activation of this fault system.
The PP_1 Po plain zone is a composite of different tectonic areas and regimes. It encompasses parts of the Po plain, i.e. the foredeep of the Apennines as well as frontal, north-vergent, thin skinned portions of this latter fold-and-thrust belt. to make things more complicated, the frontal Apennines are not a straight belt in this area, but consist in two major curvatures with a recess inbetween. the two arcs are located east of the ‘Montferrato’ near torino and centered around Piacenza respectively. A deep recess is located south of Voghera (scandone 1990).Despite this complex structure we did not see the need for any further subdivi-sion of this zone, however. First of all the area is located far from the center of the study area and secondly seismicity for this area is rather weak and distributed.
21

Logic trees for modelling alternative source zone configurations
Large vs. small zones
As explained in detail above, we distinguish between large and small scale zones. the large scale zones were defined on the basis of what we consider distinct tectonic provinces, such as the European foreland zones Eastern France and southern Germany, separated by the Oligocene rhine Graben. but the seismicity does not really respect this most obvious tectonic zo-nation. Present day seismicity preferentially occurs in localized ‘hot spots’, in some places along known or unknown faults, but more often in ill defined regional clusters. We tried to honor such seismicity patterns through the delineation of small scale seismic source zones, which are defined to a certain extent on the basis of seismicity maps, and by additionally using regional geologic arguments, for instance for choosing the orientation of zone boundaries.
Along the first of two logic branches of our master tree (Fig. 12), we consider the ‘large scale zone ‘approach as less important (0.2) in respect to our small scale zonation, to which we give a much larger weight (0.8). the basic issue addressed with these two alternative zonation approaches is stationarity of seismicity; i.e. we expect no systematic significant change in either mean or variance in the spatial distribution of future seismicity. A small scale variation is admitted of course.
the principle of stationarity is applied to the large zones as well. therefore, in the case of the large scale zones, the observed seismicity is smoothed with a Gaussian operator, using three different diameters for the counting circles: 5, 7.5 and 10 km respectively. the 7.5 km smoothing is our preferred model with a weight of (0.6) in comparison to smaller and larger circles (0.2 each). this is schematically illustrated in Fig. 12. With respect to the map which results from this smoothing procedure we refer to coppersmith et al. (this volume). With this smoothing we try to anticipate variations in the expected future spatial distribu-tion of seismicity within our large scale zones.
Despite the fact that this approach remains very close to the actually observed seismicity of the last 500 to 1000 years and the expectation that ‘the past is a good key to the present’, we prefer an alternative small scale zone approach in which we have more geological reasoning built into the anticipated future seismicity. We believe to have a sufficiently good understanding of the geological past, the structural elements and the present day geodynamic situation of the study area in order to build a seismotectonic framework, expressed in our case in the form of small scale zones, each with its very own characteristics.
Regrouping of small scale zones
Many of our small source scale zones have been defined on the basis of subtle differences in seismicity and/or geology. We take these uncertainties into account in three particular areas in which we consider several alternatives of regroupings of small zones, sequentially removing certain zone boundaries.
The Basel area ‘Rhinoceros’. Located in the middle of the study area and hosting the most important seismicity of the entire EcOs/PEGAsOs catalogue, the larger basel area merits spe-cial attention. Our considerations concern the four small scale zones rG_1, AE_1, AE_2 and AE_1 3 (Fig. 13). regrouping these zones straddles two tectonic provinces: the rhine Graben (rG) large scale zone to the N and the Alps External (AE) large scale zone to the s. seismicity patterns seem to disregard this tectonic subdivision despite the fact that it seems quite straightforward based on tectonic maps.
In order to take this uncertainty into account, we regroup rG_1 and AE_1 into one zone and give this N–s oriented, larger basel zone a weight of 0.25. this merged zone contains all of the large basel events of the EcOs catalogue, as well as all of the geomorphic features which have been proposed as faults responsible for the basel 1356 earthquake. In particu-lar, the reinach fault straddles our zones rG_1 and AE_1. the combined rG_1 and AE_1 zone allows hosting a large NNE–ssW striking reinach type fault, cutting across both the
Fig. 12. Master logic tree of Expert Group 2 (EG1b) concerning the seismic source zonation. the number above certain branches of the logic tree indicate their respective weights.
22

rhine Graben filling in the north and the frontal Jura folds in the south.
the largest weight (0.75 · 0.7 = 0.525) remains with a sub-division into four individual small zones, our preferred model for this area. three additional subdivisions within the Jura Fold belt are proposed, regrouping the basel Jura (AE_1) with either the Eastern Jura (AE_2) or the central Jura (AE_13) to the west. the most extreme case considered is the one in which the three Jura zones AE_1, AE_2 and AE_13 are grouped together in one single zone, which results in a very long E–W extension. Each of the latter three regroup-ings receives a low weight of 0.75 · 0.1 = 0.075. they are all motivated by the small possibility that E–W striking normal faults might be reactivated as thrusts in a thick skinned mode, or alternatively, lead to the triggering of thin skinned thrust-ing. the subsurface geology is fairly well constrained in the eastern zone AE_2, where the presence of an E–W striking Permo-carboniferous graben structure has been documented through reflection seismic studies of Nagra (Müller et al. 2002). the continuation of these structures further west is not documented, but highly probable.
Strict ‘impermeable’ boundariesIn principle we consider all of our boundaries as strict, or ‘im-permeable’, to faults. by ‘impermeable’ we mean that faults are
not allowed to rupture across zone boundaries. Earthquakes are allowed to initiate at the very zone boundary, but will then have to propagate asymmetrically towards the inside of the re-spective zone only. ruptures across the boundary to the oppo-site side are not allowed. Wherever known or suspected faults are present with a given zone, the size of this zone has been carefully evaluated so as to: (a) collect all seismicity potentially stemming from within this fault zone, and (b) be large enough in order to accommodate the maximum size of faults that seems geologically reasonable for the area considered. Uncertainties are implicitly treated by way of alternative regroupings of small zones into larger ones such as treated above for the basel ‘rhi-noceros’ or the ‘tucan beak’, as will be discussed below.
Soft boundaries in case of the small scale zone AE_2In all of the regroupings shown in Figure 13, the boundar-ies of the small scale zone AE_2 East Jura were considered as somewhat ‘soft’. With ‘softness’, we express the uncertainty concerning the location of zone boundaries. this is quite criti-cal in case of AE_2 since this zone is close to three of the four power plants. Our demand is motivated by the fact that none of our boundaries is truly fixed in space by a well defined major tectonic feature. In order to express this uncertainty, we are moving the northern and southern boundaries of AE_2 in and outward by ± 5 km. We are content with having this ‘softness’
Fig. 13. seismic source zonation in the larger ba-sel area: the ‘rhinoceros’. regroupings of two or more small scale zones are considered according to the logic tree given at the right hand side. Num-bers indicate the respective weights.
23

applied only to the source zone as provider of earthquake en-ergy, but not for the collection of characteristic data within the zone, such as a- and b-values and Mmax.
The Dinkelberg-Bodensee area ‘Tucan beak’. Many small scale zones were defined in the center of the study area, and they all belong to the large scale zone south Germany: sG_5, sG_6, sG_7 and sG_8.
sG_6 Leibstadt is the smallest zone in this family and it contains the Leibstadt power plant (KKL). Most of the chosen boundaries within this ‘tucan beak’ are subject to discussion and we consider these uncertainties by removing them sequen-tially according to the scheme illustrated in Figure 14. Our re-groupings can be subdivided into two categories.
In a first category, the one shown in the upper branch, the Dinkelberg zone (sG_7) remains separated from the rest of the ‘beak’. this is our highly preferred solution and given a weight of 0.8. the Dinkelberg area does indeed have a seis-micity pattern and tectonic structure of its own (Faber et al. 1994). the remaining boundaries, however, are rather ill de-fined, and by further subdivisions we give some special con-sideration to the Leibstadt zone sG_6. the small sG_6 Leib-stadt zone remains isolated in two cases, each given a weight of 0.8 · 0.2 = 0.16.
A second major branch, along which the Dinkelberg is not isolated is given a small weight of 0.2. three different regroupings are proposed in this case, with a preference for merging Dinkelberg sG_7 with Leibstadt sG_6, while the
separation between sG_8 and sG_5 is considered of minor importance (see lower part of logic tree in Fig. 14). From vi-sual inspection of the ‘sW–NE’ hatched areas in Figure 14, it becomes obvious that we consider the boundary between the sG_8 (southern schwarzwald) and sG_5 (singen-bodensee) zones as fairly weakly defined. ‘Weak’ means that we do not have any strong geologic or seismologic argument in favor of its existence. Accordingly, most of our regroupings entirely disregard it. this boundary remains in place only in two models and together they only weight (0.8 · 0.2 + 0.2 · 0.25) = 0.21.
The Schwäbische Alb area: Zones sG_1 and sG_2 are re-com-bined into one larger N–s oriented zone in this area. such a recombination is motivated by the historically observed high activity which occurred in sG_2, adjacent and immediately north of sG_1. this recombination allows for hosting a lon-ger N–s trending strike slip fault. this regrouping is notably necessary because of our choice of an ‘impermeable’ bound-ary. In the case considered in this area, seismic activity is cur-rently confined to sG_1 (reinecker & schneider 2002) where it seems to be localized along a N–s trending fault within the basement. the likelihood of a larger fault extending along the entire length of the recombined sG_1 and sG_2 zone is consid-ered as small, but nevertheless existent.
The final logic tree. the final logic tree of Expert Group 2 (EG1b) is assembled from the elements of the seismic source
Fig. 14. seismic source zonation in the Dinkel-berg-bodensee area: ‘the tucan beak’. Weights of regroupings of small zones are given in the logic tree (right).
24

zone definition described above. the fundament is the mas-ter logic tree (Fig. 12) which considers the two alternative zonations; i.e. the large scale zones with Kernel smoothing and the small scale zones with their spatially homogeneous seismicity.
Within the ‘small scale’ zone model three independent com-binations of small zones are considered: the basel-Jura ‘rhi-nocerus’ zonation (Fig. 13), the Dinkelberg-bodensee ‘tucan beak’ zonation (Fig. 14), and the swabian Alb zonation.
Another level of branches of the logic tree concerns the uncertain zone boundaries within the ‘small scale’ model; i.e. within the small scale zones AE_2 Eastern Jura and AE_7 Fri-bourg, which interact with the neighboring zones basel-Jura and Dinkelberg-bodensee area, respectively.
the combination of these alternatives, zonation combina-tions, and uncertainties results in a final logic tree of 543 end branches (Fig. 15). We depict a simplified version of this final logic tree, where several repetitions of branch patterns above
Fig. 15. Final logic tree developed by Expert Group 2 (EG1b) depicted in a simplified form; i.e. certain repetitions in the branch pattern are omitted. the final logic tree consists of 543 end branches.
25

certain branch levels are omitted; e.g. the Dinkelberg-bodensee zonation in combination with the Jura zonations is shown for one of the four combinations only.
Earthquake Recurrence Parameters
Declustering of the catalogue data
the declustering aims at the identification and separation of fore-shocks and aftershocks in a seismicity file. A special test has been performed within the PEGAsOs project to analyze the different techniques commonly used in seismological practice. these are the approaches by Gardner & Knopoff (1974), Grünthal (1985, modified), reasenberg (1985), Uhrhammer (1986) and Youngs et al. (1987, modified). In general, all these approaches apply space-time windows. Gardner & Knopoff (1974), reasenberg (1985) and Uhrhammer (1986) derived their window parameters for the californian catalogue, Youngs et al. (1987) for a study of the Wasatch Front seismicity in Utah, and Grünthal (1985) for characteristics of the foreshock and aftershock activity accord-ing to the central European earthquake catalogue data with all their location uncertainties. the conclusion of the test was that “the Grünthal scheme does the most rigorous job of decluster-ing” (Nicolas Deichmann, pers. comm.). the test criterion was to explore how the mentioned approaches identify what manually would be chosen as the main shock, for four cases of foreshock, mainshock and aftershock combinations in the time period 1946 to 2000 in the EcOs/PEGAsOs file. solely the Grünthal (1985) technique repeated the expert decision for all cases. the EG1b team therefore decided to apply this approach. the window pa-rameters after Grünthal (1985, modified) are:
the foreshock time window:
exp 4.77 0.62 17.32 if 7.8d ( )
exp 6.44 0.055 otherwisew w
f ww
M MT M
M
the aftershock time window:
exp 3.95 0.62 17.32 if 6.6d ( )
exp 6.44 0.055 otherwisew w
a ww
M MT M
M
the distance window:
d ( ) exp 1.77 0.037 1.02w wR M M
this technique results in a reduction of the totally released seismic moment by 1.99% only, although the number of small magnitude events which were identified as foreshocks and af-tershocks is fairly large.
Catalogue completeness as a function of time
the analysis of the catalogued data completeness with time is an essential element in the data pre-processing for the determi-
nation of the earthquake recurrence parameters. For this sub-task Expert Group 2 (EG 1b) applied a simple but powerful procedure, successfully used since more than 20 years by one of the team members (G. Grünthal).
Firstly, gross seismic zones were defined which comprise larger areas of homogeneous cultural-historical conditions in the cataloguing of earthquakes. the chosen gross zones approx-imately agree with the areas covered by the national catalogues, i.e., as shown in Figure 16 in form of polygons cH (switzer-land), G-sW (sW-Germany), A (western Austria), I (northern Italy) and F (eastern France).
For each of the gross seismic zones the cumulative number of catalogue entries for each magnitude class is plotted. the ordinate, displaying the numbers, is given in arbitrary units.
the graph for gross seismic zone cH is shown in Figure 17. Each of the step-like curves are interpreted in a retrospective way, i.e., time points are identified where the ascent of the step-like curve significantly changes. It is assumed that these times mark the periods of sufficient completeness. the periods of completeness derived in this way are summarized in table 2.
Each of the different seismic source zones was associated with one of these completeness models. Due to the scarcity of data in the gross zone A (western Austria) its completeness as-sessments is less reliable and the completeness model derived for cH (switzerland) was applied.
Recurrence parameters
the truncated exponential model, derived from the Gutenberg-richter recurrence relationship log N(m) = a – bm, by truncat-ing the rate density of earthquakes at the maximum magnitude mx, reads as:
0 0
00
1
x
x
m m m m
m m
e eN m N me
N(m0) is the annual frequency of earthquakes larger than the lower bound magnitude m0, and β = bln(10), where b is the Gutenberg-richter parameter.
the recurrence parameters ν = N(m0) and b were estimated with the maximum likelihood technique developed by Weichert (1980) which properly addresses the uncertainty of the param-eters. the parameters ν, b, σν, and σb were calculated for the eight large scale zones, for the small scale zones as well as for the source zone combinations (table 3). this table also indi-cates the completeness model which was used for the respec-tive source zone. the b-values are in the range 0.68–1.18, with corresponding σb in the range 0.02–0.14, if two extremes with rather low seismicity activity are excluded. Figure 18 shows the observed earthquake occurrence in the large scale zone Ac with the corresponding maximum likelihood fit as an example.
the recurrence parameters for the small scale zones, includ-ing their combinations (tucan beak, rhinoceros), have been calculated where a sufficient number of events is available (table 3a). the small scale source zones with low seismicity
26

were grouped according to the described seismotectonic con-straints. A common b-value was then calculated for each group of source zones and is given in table 3b.the corresponding ν-value is then calculated for each zone separately.
Evaluation of maximum earthquake magnitudes Mmax
Given the general nature of seismicity within the entire study area, characterized by very few and very small seismically ac-
Fig. 16. Polygons defining the gross seismic zones for studying catalogue completeness as a function of time.
27
tive faults and very low (if any) deformation rates, the discus-sion of maximum earthquake magnitude is largely reduced to a statistical analysis rather than based on geological, tectonic or geodetical data. there is only very limited geological evidence regarding the size of individual faults or fault zones, fault seg-mentation, and maximum fault displacements.
In the following, we provide an overview of the ‘statistical’ approaches we used in order to determine maximum earth-quake magnitude distributions. We also present various argu-ments used to apply truncations (upper limits). Initially, two alternative approaches have been considered for deriving Mmax distributions; the EPrI (Johnston et al. 1994) and the Kijko (Kijko & Graham 1998) approaches, respectively. In the course of our evaluations we disregarded the Kijko results, however. the main reason was the small number of earthquakes in most of the small zones, which in many instances leads to unrealistic Mmax values.
In order to prevent unrealistically high upper tails in the EPrI Mmax distributions we apply truncations. We use both geo-logical (size of individual faults and seismic source zones) and statistical arguments in order to assign ultimate upper limits to the EPrI Mmax distributions.
EPRI approach to Mmax distributions
In order to compensate the limited time of observation (and small size of study area) covered by the PEGAsOs earthquake catalog, a comparison is made with worldwide observations of seismicity in ‘stable continental’ regions (Johnston et al. 1994). In this ‘EPrI’ approach, the observed seismicity of a limited study area is used in order to determine an adapted Mmax dis-tribution. the basis of this approach are two slightly different ‘a priori’ worldwide distributions, one for non-extended and another for extended ‘stable continental’ crust. these ‘a priori’ distributions are multiplied with seismic source zone specific likelihood functions, which are zero for magnitudes lower than the maximum observed magnitude Mmaxobs in the respective zone. the shape of this likelihood function above Mmaxobs de-pends on the number of observed significant earthquakes in a zone and the b-values of the frequency-magnitude distribu-tions. the result is a source zone specific distribution of Mmax.
the EPrI approach was first applied to the large scale zones based on large scale tectonic arguments such as crustal structure, tectonic history and, most important, their role in Neogene Alpine tectonics. In comparison with criteria used in the EPrI study (Johnston et al. 1994), it appears that only two of our large source zones fit the definition of non-extended,
Fig. 17. cumulative graph of catalogue entries (N) for the gross zone switzerland for each mag-nitude class. the ordinate, displaying the cumula-tive numbers, is given in arbitrary units, i.e. differ-ent for each graph representing one magnitude class. the bold dots indicate the times from which on a sufficient completeness is assumed.
table 2. times of assigned PEGAsOs data completeness in the gross zones.
Mw
Gross zones3.0 3.5 4.0 4.5 5.0 5.5 6.0 6.5 7.0
switzerland cH 1880 1880 1860 1825 1770 1650 1575 1250 1250Germany sW D-sW 1965 1870 1865 1865 1860 1200 1200France east F-E 1970 1965 1810 1810 1750 1650 1650Italy north I-N 1975 1975 1875 1850 1750 1750 1600 1600Austria west A-W 1975 1900 1875 1875 1550 1550
28
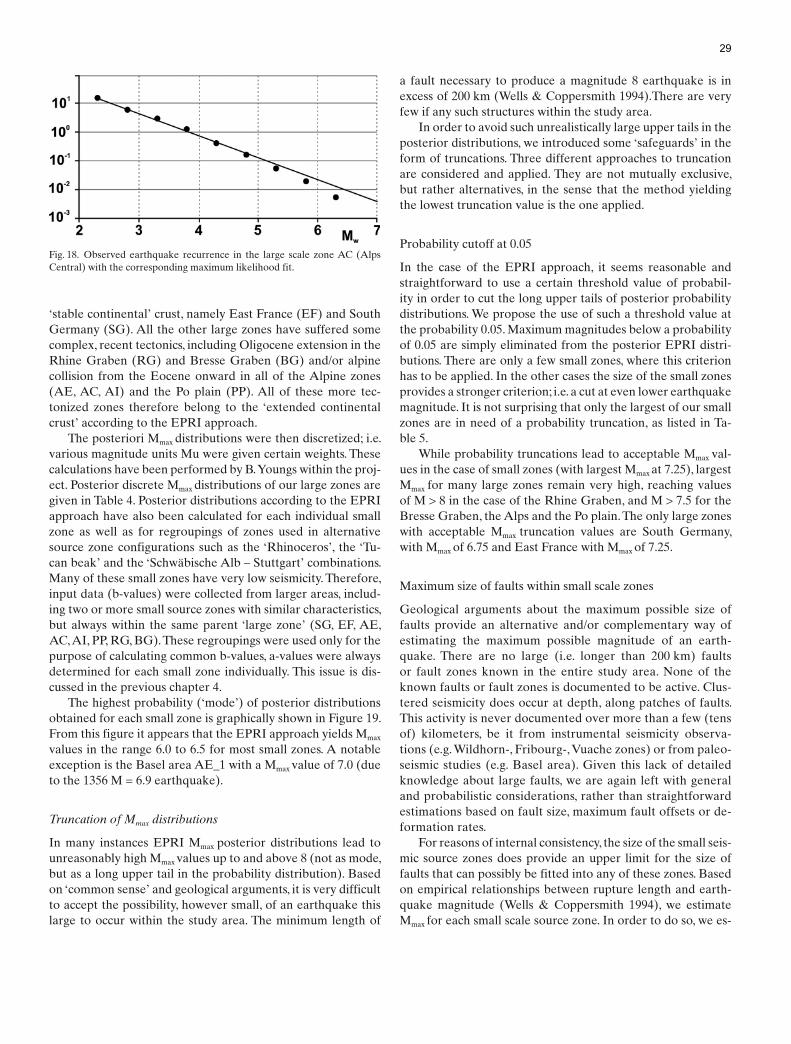
‘stable continental’ crust, namely East France (EF) and south Germany (sG). All the other large zones have suffered some complex, recent tectonics, including Oligocene extension in the rhine Graben (rG) and bresse Graben (bG) and/or alpine collision from the Eocene onward in all of the Alpine zones (AE, Ac, AI) and the Po plain (PP). All of these more tec-tonized zones therefore belong to the ‘extended continental crust’ according to the EPrI approach.
the posteriori Mmax distributions were then discretized; i.e. various magnitude units Mu were given certain weights. these calculations have been performed by b. Youngs within the proj-ect. Posterior discrete Mmax distributions of our large zones are given in table 4. Posterior distributions according to the EPrI approach have also been calculated for each individual small zone as well as for regroupings of zones used in alternative source zone configurations such as the ‘rhinoceros’, the ‘tu-can beak’ and the ‘schwäbische Alb – stuttgart’ combinations. Many of these small zones have very low seismicity. therefore, input data (b-values) were collected from larger areas, includ-ing two or more small source zones with similar characteristics, but always within the same parent ‘large zone’ (sG, EF, AE, Ac, AI, PP, rG, bG). these regroupings were used only for the purpose of calculating common b-values, a-values were always determined for each small zone individually. this issue is dis-cussed in the previous chapter 4.
the highest probability (‘mode’) of posterior distributions obtained for each small zone is graphically shown in Figure 19. From this figure it appears that the EPrI approach yields Mmax values in the range 6.0 to 6.5 for most small zones. A notable exception is the basel area AE_1 with a Mmax value of 7.0 (due to the 1356 M = 6.9 earthquake).
Truncation of Mmax distributions
In many instances EPrI Mmax posterior distributions lead to unreasonably high Mmax values up to and above 8 (not as mode, but as a long upper tail in the probability distribution). based on ‘common sense’ and geological arguments, it is very difficult to accept the possibility, however small, of an earthquake this large to occur within the study area. the minimum length of
a fault necessary to produce a magnitude 8 earthquake is in excess of 200 km (Wells & coppersmith 1994).there are very few if any such structures within the study area.
In order to avoid such unrealistically large upper tails in the posterior distributions, we introduced some ‘safeguards’ in the form of truncations. three different approaches to truncation are considered and applied. they are not mutually exclusive, but rather alternatives, in the sense that the method yielding the lowest truncation value is the one applied.
Probability cutoff at 0.05
In the case of the EPrI approach, it seems reasonable and straightforward to use a certain threshold value of probabil-ity in order to cut the long upper tails of posterior probability distributions. We propose the use of such a threshold value at the probability 0.05. Maximum magnitudes below a probability of 0.05 are simply eliminated from the posterior EPrI distri-butions. there are only a few small zones, where this criterion has to be applied. In the other cases the size of the small zones provides a stronger criterion; i.e. a cut at even lower earthquake magnitude. It is not surprising that only the largest of our small zones are in need of a probability truncation, as listed in ta-ble 5.
While probability truncations lead to acceptable Mmax val-ues in the case of small zones (with largest Mmax at 7.25), largest Mmax for many large zones remain very high, reaching values of M > 8 in the case of the rhine Graben, and M > 7.5 for the bresse Graben, the Alps and the Po plain. the only large zones with acceptable Mmax truncation values are south Germany, with Mmax of 6.75 and East France with Mmax of 7.25.
Maximum size of faults within small scale zones
Geological arguments about the maximum possible size of faults provide an alternative and/or complementary way of estimating the maximum possible magnitude of an earth-quake. there are no large (i.e. longer than 200 km) faults or fault zones known in the entire study area. None of the known faults or fault zones is documented to be active. clus-tered seismicity does occur at depth, along patches of faults. this activity is never documented over more than a few (tens of) kilometers, be it from instrumental seismicity observa-tions (e.g. Wildhorn-, Fribourg-, Vuache zones) or from paleo-seismic studies (e.g. basel area). Given this lack of detailed knowledge about large faults, we are again left with general and probabilistic considerations, rather than straightforward estimations based on fault size, maximum fault offsets or de-formation rates.
For reasons of internal consistency, the size of the small seis-mic source zones does provide an upper limit for the size of faults that can possibly be fitted into any of these zones. based on empirical relationships between rupture length and earth-quake magnitude (Wells & coppersmith 1994), we estimate Mmax for each small scale source zone. In order to do so, we es-
Fig. 18. Observed earthquake recurrence in the large scale zone Ac (Alps central) with the corresponding maximum likelihood fit.
29

table 3a. recurrence parameters for all source zones and their combinations. the asterisks indicate common b-values as given in tab. 3b.
seismic source Zones
label name
Magnitude Frequency Parameters (maximum likelihood)
compl.model
ν (mmin) b σν (mmin) σb mmin
Large ZonesEF Eastern France 7.0190 1.0470 0.5012 0.0460 2.3 F-ErG rhine Graben 2.8950 0.8580 0.3'127 0.0570 2.3 D-sWsG south Germany 5.1890 0.7750 0.4160 0.0370 2.3 D-sWbG bresse Graben 0.878 1 0.6730 0.1788 0.0860 2.3 F-EAE Alps External 4.4160 0.7720 0.2858 0.0370 2.3 cHAc Alps central 15.720 0.7720 0.5392 0.0200 2.3 cHAI Alps Internal 1.3520 0.9170 0.1851 0.0930 3.3 I-NPP Po_Plain 0.4511 1.0750 0.1132 0.1990 3.3 I-Nall large zones 34.2400 0.7760 0.7970 0.0130 2.3 cH
Detailed ZonesAc_01 Grenoble 1.0660 0.7690 0.1402 0.0740 2.3 cHAc_02 briancon 1.1100 0.7310 0.1408 0.0670 2.3 cHAc_03 Arve 0.3494 0.7790 0.0806 0.1330 2.3 cHAc_04 Prealpes 1.0130 0.7410 0.1351 0.0720 2.3 cHAc_05 Wildhorn 1.4640 0.7560 0.1634 0.0620 2.3 cHAc_06 Valais 1.3600 0.7280 0.1557 0.0600 2.3 cHAc_07 sarnen 0.6494 0.6810 0.1055 0.0790 2.3 cHAc_08 ticino 0.8332 0.9600 0.1336 0.1200 2.3 cHAc_09 Walensee 1.2200 0.7330 0.1477 0.0640 2.3 cHAc_10 Grisons 3.7480 0.8120 0.2675 0.0430 2.3 cHAc_11 Vorarlberg 1.0280 0.7150 0.1346 0.0680 2.3 cHAc_12 Glorenza 0.3638 0.8280* 0.0728 0.1290 2.3 cHAc_13 Allgaeu 0.2117 0.7910* 0.0547 0.0510 2.3 cHAc_14 Inntal 1.2620 0.8850 0.1599 0.0860 2.3 cHAc_15 tauern 0.0873 0.8280* 0.0356 0.1290 2.3 cHAE_01 baselJura 0.1932 0.5840 0.0553 0.1160 2.3 cHAE_02 E_Jura 0.2642 0.7180* 0.0591 0.0610 2.3 cHAE_03 Zuerich-thurgau 0.8679 0.7290* 0.1076 0.0410 2.3 cHAE_04 Aarau-Luzern 0.1602 0.7290* 0.0463 0.0410 2.3 cHAE_05 biel 0.2403 0.7290* 0.0567 0.0410 2.3 cHAE_06 Napf 0.1869 0.7290* 0.0500 0.0410 2.3 cHAE_07 Fribourg 0.2136 0.7290* 0.0534 0.0410 2.3 cHAE_08 Neuchatel lake 0.5341 0.7290* 0.0844 0.0410 2.3 cHAE_09 Vaud 0.3204 0.7290* 0.0654 0.0410 2.3 cHAE_10 Geneva 0.2670 0.7290* 0.0597 0.0410 2.3 cHAE_11 Vuache 0.1335 0.7290* 0.0422 0.0410 2.3 cHAE_12 West_Jura 0.7503 1.1830* 0.1172 0.1400 2.3 cHAE_13 central_Jura 0.3843 1.1830* 0.0839 0.1400 2.3 cHAI_01 Dora Maira 2.3050 0.7000 0.2906 0.0520 2.3 I-NAI_02 Alpi sud 2.3900 0.7110* 0.2956 0.0520 2.3 I-NAI_03 bolzano 0.0116 0.7110* 0.0116 0.0510 3.3 I-NbG_01 bresse Graben 0.0642 0.6730* 0.037 1 0.0860 2.3 F-EbG_02 bresse_sud 0.8306 0.6870 0.1735 0.0900 2.3 F-EEF_01 remiremont 0.7382 0.9220 0.1619 0.1210 2.3 F-EEF_02 Vosges 0.5408 0.8660 0.1385 0.1330 2.3 F-EEF_03 Dijon-saone 0.7051 1.0320 0.1588 0.1420 2.3 F-EEF_04 Massif central 0.0406 1.1530* 0.0143 0.0640 3.8 F-EEF_05 Lorraine 4.0490 1.3330 0.3850 0.0880 2.3 F-EEF_06 Mainz 0.9257 0.9070 0.1812 0.1070 2.3 F-EPP_01 Po_Plain 0.4511 1.0750 0.1132 0.1990 3.3 I-NrG_01 basel 0.7386 0.8940 0.1544 0.1140 2.3 D-sWrG_02 south rhine Graben 1.3280 0.8100 0.2046 0.0740 2.3 D-sW
30
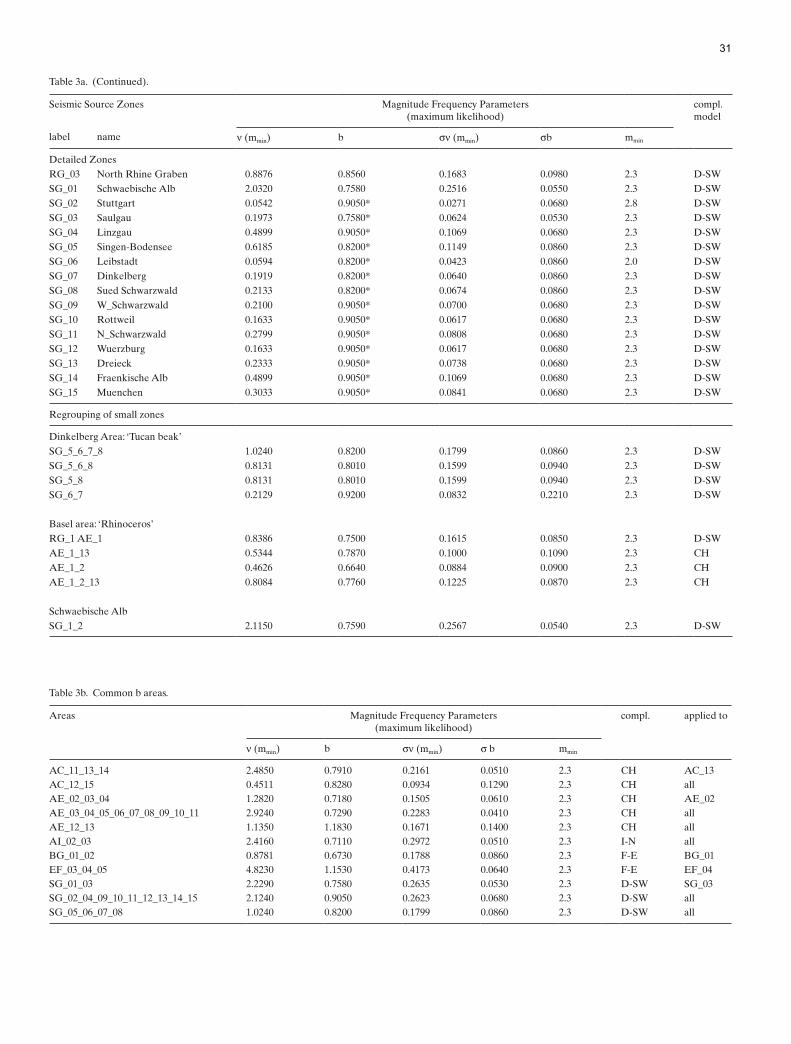
table 3a. (continued).
seismic source Zones
label name
Magnitude Frequency Parameters (maximum likelihood)
compl.model
ν (mmin) b σν (mmin) σb mmin
Detailed ZonesrG_03 North rhine Graben 0.8876 0.8560 0.1683 0.0980 2.3 D-sWsG_01 schwaebische Alb 2.0320 0.7580 0.2516 0.0550 2.3 D-sWsG_02 stuttgart 0.0542 0.9050* 0.0271 0.0680 2.8 D-sWsG_03 saulgau 0.1973 0.7580* 0.0624 0.0530 2.3 D-sWsG_04 Linzgau 0.4899 0.9050* 0.1069 0.0680 2.3 D-sWsG_05 singen-bodensee 0.6185 0.8200* 0.1149 0.0860 2.3 D-sWsG_06 Leibstadt 0.0594 0.8200* 0.0423 0.0860 2.0 D-sWsG_07 Dinkelberg 0.1919 0.8200* 0.0640 0.0860 2.3 D-sWsG_08 sued schwarzwald 0.2133 0.8200* 0.0674 0.0860 2.3 D-sWsG_09 W_schwarzwald 0.2100 0.9050* 0.0700 0.0680 2.3 D-sWsG_10 rottweil 0.1633 0.9050* 0.0617 0.0680 2.3 D-sWsG_11 N_schwarzwald 0.2799 0.9050* 0.0808 0.0680 2.3 D-sWsG_12 Wuerzburg 0.1633 0.9050* 0.0617 0.0680 2.3 D-sWsG_13 Dreieck 0.2333 0.9050* 0.0738 0.0680 2.3 D-sWsG_14 Fraenkische Alb 0.4899 0.9050* 0.1069 0.0680 2.3 D-sWsG_15 Muenchen 0.3033 0.9050* 0.0841 0.0680 2.3 D-sW
regrouping of small zones
Dinkelberg Area: ‘tucan beak’sG_5_6_7_8 1.0240 0.8200 0.1799 0.0860 2.3 D-sWsG_5_6_8 0.8131 0.8010 0.1599 0.0940 2.3 D-sWsG_5_8 0.8131 0.8010 0.1599 0.0940 2.3 D-sWsG_6_7 0.2129 0.9200 0.0832 0.2210 2.3 D-sW
basel area: ‘rhinoceros’rG_1 AE_1 0.8386 0.7500 0.1615 0.0850 2.3 D-sWAE_1_13 0.5344 0.7870 0.1000 0.1090 2.3 cHAE_1_2 0.4626 0.6640 0.0884 0.0900 2.3 cHAE_1_2_13 0.8084 0.7760 0.1225 0.0870 2.3 cH
schwaebische AlbsG_1_2 2.1150 0.7590 0.2567 0.0540 2.3 D-sW
table 3b. common b areas.
Areas Magnitude Frequency Parameters (maximum likelihood)
compl. applied to
ν (mmin) b σν (mmin) σ b mmin
Ac_11_13_14 2.4850 0.7910 0.2161 0.0510 2.3 cH Ac_13Ac_12_15 0.4511 0.8280 0.0934 0.1290 2.3 cH allAE_02_03_04 1.2820 0.7180 0.1505 0.0610 2.3 cH AE_02AE_03_04_05_06_07_08_09_10_11 2.9240 0.7290 0.2283 0.0410 2.3 cH allAE_12_13 1.1350 1.1830 0.1671 0.1400 2.3 cH allAI_02_03 2.4160 0.7110 0.2972 0.0510 2.3 I-N allbG_01_02 0.8781 0.6730 0.1788 0.0860 2.3 F-E bG_01EF_03_04_05 4.8230 1.1530 0.4173 0.0640 2.3 F-E EF_04sG_01_03 2.2290 0.7580 0.2635 0.0530 2.3 D-sW sG_03sG_02_04_09_10_11_12_13_14_15 2.1240 0.9050 0.2623 0.0680 2.3 D-sW allsG_05_06_07_08 1.0240 0.8200 0.1799 0.0860 2.3 D-sW all
31

timated the maximum rupture area using the formula of Wells & coppersmith (1994):
M = 4.07 + 0.98 log (RA),
where rA is the rupture area in km2. Maximum possible rupture areas were determined for all individual small scale source zones, and regroupings of small zones. First, we con-sidered orientation and most plausible style of faulting (thrusting, strike slip, normal). this fault orientation was then intersected with the map view shape of the source zone. this provides the longest possible fault which can be fitted into the source zone. this procedure has been done visually ‘by hand’ on a poster printout of the basemap with source zone
boundaries, and fault lengths were rounded to the nearest 10 km.
Despite the fact that many of our source zones have a strong ‘preferred orientation’, we only consider one single ‘ultimate’ Mmax value for each zone. the longest fault corre-sponds to the most probable fault orientation and faulting style. Examples are the Wildhorn Ac_5, the Fribourg AE_7 and the Vuache AE_11 small scale zones, the shape of which mimic the presence of a fault. In theory, however, it would have been possible to define three different Mmax values based on the longest possible expected thrust, normal and strike slip faults, which respectively can be hosted within each indi-vidual small source zone. Given the large uncertainties in all the other parameters, we did not want to go into such detail,
table 4. seismic source maximum magnitude distributions discretized in form of weights at certain magnitude units.
source Discrete Maximum Magnitude Distribution
Mu Weight Mu Weight Mu Weight Mu Weight Mu Weight Mu Weight
Large ZonesAc 6.5 0.880 7.0 0.120AE 7.0 0.535 7.5 0.303 7.8 0.162AI 6.0 0.088 6.5 0.490 7.0 0.270 7.5 0.126 7.9 0.026bG 5.5 0.232 6.0 0.377 6.5 0.215 7.0 0.130 7.5 0.045EF 6.0 0.311 6.5 0.422 6.8 0.215 7.2 0.052PP 5.5 0.144 6.0 0.274 6.5 0.265 7.0 0.167 7.3 0.087 7.6 0.062rG 6.0 0.087 6.5 0.466 7.0 0.234 7.3 0.131 7.7 0.082sG 6.0 0.796 6.3 0.165 6.7 0.039
small ZonesAc01 6.0 0.442 6.5 0.293 7.0 0.166 7.4 0.098Ac02 5.5 0.626 6.0 0.289 6.5 0.072 6.8 0.013Ac03 5.5 0.196 6.0 0.298 6.5 0.202 6.8 0.304Ac04 6.5 0.340 6.8 0.310 7.2 0.350Ac05 6.0 0.279 6.5 0.341 6.8 0.161 7.1 0.219Ac06 6.5 0.506 6.8 0.254 7.1 0.240Ac07 6.0 0.100 6.5 0.448 6.8 0.452Ac08 5.5 0.125 6.0 0.275 6.5 0.223 6.8 0.145 7.1 0.232Ac09 5.5 0.330 6.0 0.331 6.5 0.192 7.0 0.097 7.3 0.049Ac10 6.5 0.314 6.8 0.379 7.2 0.306Ac11 5.5 0.408 6.0 0.323 6.5 0.138 6.8 0.079 7.2 0.052Ac12 5.5 0.139 6.0 0.286 6.5 0.220 6.8 0.159 7.2 0.195Ac13 5.5 0.107 6.0 0.263 6.5 0.228 6.8 0.152 7.1 0.251Ac14 5.5 0.167 6.0 0.296 6.5 0.211 6.8 0.130 7.1 0.195Ac15 5.5 0.112 6.0 0.267 6.5 0.280 7.0 0.341AE01 6.8 0.128 7.1 0.872AE02 5.5 0.119 6.0 0.273 6.5 0.277 7.0 0.175 7.3 0.156AE03 5.5 0.216 6.0 0.316 6.5 0.239 7.0 0.133 7.3 0.096AE04 5.5 0.134 6.0 0.278 6.5 0.221 6.8 0.142 7.1 0.225AE05 5.5 0.118 6.0 0.272 6.5 0.225 6.8 0.147 7.1 0.237AE06 5.5 0.125 6.0 0.275 6.5 0.224 6.8 0.166 7.2 0.210AE07 5.5 0.116 6.0 0.271 6.5 0.278 7.0 0.177 7.3 0.158AE08 5.5 0.387 6.0 0.341 6.5 0.170 7.0 0.078 7.3 0.024AE09 5.5 0.141 6.0 0.286 6.5 0.219 6.8 0.139 7.1 0.215AE10 5.5 0.118 6.0 0.272 6.5 0.278 7.0 0.176 7.3 0.157AE11 5.5 0.125 6.0 0.275 6.5 0.275 7.0 0.173 7.3 0.153AE12 5.5 0.116 6.0 0.264 6.5 0.277 7.0 0.214 7.5 0.130AE13 5.5 0.102 6.0 0.259 6.5 0.283 7.0 0.184 7.3 0.172AI01 6.0 0.136 6.5 0.584 7.0 0.182 7.3 0.072 7.6 0.026AI02 5.5 0.734 6.0 0.206 6.3 0.049 6.6 0.011
32

however, and it is assumed that the maximum earthquake in each small source zone is in the class of fault styles with the highest likelihood.
some of our ‘small’ source zones are still fairly large and we therefore introduced an additional, admittedly arbitrary, but generous cut-off at 200 km ultimate fault length. the second, downdip dimension of a maximum size fault was determined from the estimated maximum depth of the rupture area rA in a seismogenic zone:
RA = L · h
where L is fault length and h is the maximum seismogenic depth. For simplicity, we assumed all faults to be vertical, even in the case of normal and thrust faults, for which the rupture
area could be slightly increased due to inclined fault planes. based on all these premises, the largest possible fault (here as rupture area rA) has been determined for each zone. this in-formation is provided in table 5.
the argument for choosing Mmax from the size of small source zones is admittedly somewhat circular. by choosing small zones, we implicitly limited the size of the largest faults that can possibly be active within any such small zone. We are well aware of this problem and we have considered it seriously. the choice of our small scale source zones, including their di-mensions, is based on geological and seismological informa-tion. In a few cases of known faults, such as the Fribourg and Wildhorn zones, or suspected faults (Neuchâtel lake, biel) the shape and size of our source zones explicitly reflect the esti-
table 4. (continued).
source Discrete Maximum Magnitude Distribution
Mu Weight Mu Weight Mu Weight Mu Weight Mu Weight Mu Weight
small ZonesAI03 5.5 0.094 6.0 0.364 6.5 0.330 6.8 0.159 7.1 0.053bG01 5.5 0.135 6.0 0.279 6.5 0.271 7.0 0.168 7.3 0.087 7.6 0.060bG02 5.5 0.184 6.0 0.325 6.5 0.243 7.0 0.167 7.5 0.081EF01 6.0 0.319 6.5 0.498 7.0 0.183EF02 5.5 0.099 6.0 0.367 6.5 0.326 6.8 0.157 7.1 0.052EF03 5.5 0.098 6.0 0.366 6.5 0.360 6.9 0.177EF04 5.5 0.102 6.0 0.367 6.5 0.324 6.8 0.156 7.1 0.051EF05 5.5 0.098 6.0 0.365 6.5 0.327 6.8 0.158 7.1 0.052EF06 5.5 0.115 6.0 0.377 6.5 0.375 7.0 0.133PP01 5.5 0.154 6.0 0.278 6.5 0.261 7.0 0.163 7.3 0.085 7.6 0.058rG01 5.5 0.158 6.0 0.306 6.5 0.252 7.0 0.284rG02 6.0 0.094 6.5 0.480 7.0 0.270 7.5 0.156rG03 5.5 0.115 6.0 0.267 6.5 0.278 7.0 0.178 7.3 0.093 7.6 0.069sG01 6.0 0.751 6.5 0.205 6.8 0.044sG02 5.5 0.095 6.0 0.364 6.5 0.330 6.8 0.159 7.1 0.053sG03 5.5 0.059 6.0 0.459 6.5 0.309 6.8 0.173sG04 5.5 0.121 6.0 0.295 6.3 0.292 6.7 0.293sG05 5.5 0.106 6.0 0.371 6.5 0.322 6.8 0.201sG06 5.5 0.094 6.0 0.362 6.5 0.330 6.8 0.214sG07 5.5 0.096 6.0 0.278 6.3 0.261 6.6 0.365sG08 5.5 0.096 6.0 0.278 6.3 0.261 6.6 0.365sG09 5.5 0.094 6.0 0.363 6.5 0.329 6.8 0.214sG10 5.5 0.094 6.0 0.363 6.5 0.363 6.9 0.179sG11 5.5 0.103 6.0 0.368 6.5 0.323 6.8 0.155 7.1 0.051sG12 5.5 0.094 6.0 0.362 6.5 0.330 6.8 0.160 7.1 0.055sG13 5.5 0.094 6.0 0.363 6.5 0.362 6.9 0.181sG14 5.5 0.094 6.0 0.363 6.5 0.362 6.9 0.181sG15 5.5 0.096 6.0 0.364 6.5 0.328 6.8 0.158 7.1 0.052
regrouping of small ZonessG5_6_7_8 5.5 0.112 6.0 0.374 6.5 0.317 6.8 0.150 7.1 0.047sG5_6_8 5.5 0.113 6.0 0.374 6.5 0.317 6.8 0.149 7.1 0.047sG5_8 5.5 0.113 6.0 0.374 6.5 0.317 6.8 0.149 7.1 0.047sG6_7 5.5 0.097 6.0 0.365 6.5 0.361 6.9 0.177rG1_AE1 7.0 0.381 7.3 0.619AE1_13 7.0 0.547 7.5 0.453AE1_2 7.0 0.441 7.3 0.294 7.6 0.265AE1_2_13 7.0 0.548 7.5 0.299 7.8 0.153sG1_2 6.0 0.747 6.5 0.206 6.8 0.046
33

table 5. truncation values applied to large and small zones, geologic truncations are based on the size of the largest fault within each zone, the 95% cumulative truncation is applied to the EPrI probability distributions. the applied value (‘whichever is smaller’) is highlighted in grey for each zone – or regrouping of small zones.
Large Zone Geologictruncation
95% cumulativetruncation
smallZone
Geologictruncation
95% cumulativetruncation
EF 7.5 7.2 AE01 7.1 8.1
rG 7.7 7.9 AE02 7.3 7.8
sG 7.6 6.7 AE03 7.3 7.7
bG 7.8 7.5 AE04 7.1 7.8
AE 7.8 8.2 AE05 7.1 7.8
Ac 7.5 7.0 AE06 7.2 7.8
AI 7.9 7.9 AE07 7.3 7.8
PP 7.6 7.8 AE08 7.3 7.3
AE09 7.1 7.8
small Zone AE10 7.3 7.8
EF01 7.0 7.2 AE11 7.3 7.8
EF02 7.3 7.1 AE12 7.5 7.8
EF03 6.9 7.1 AE13 7.3 7.8
EF04 7.5 7.1
EF05 7.5 7.1 Ac01 7.4 7.7
EF06 7.0 7.1 Ac02 7.4 6.8
Ac03 6.8 7.7
rG01 7.0 7.8 Ac04 7.2 7.9
rG02 7.5 7.9 Ac05 7.1 7.8
rG03 7.6 7.8 Ac06 7.1 7.7
Ac07 6.8 7.8
sG01 6.9 6.8 Ac08 7.1 7.8
sG02 7.1 7.1 Ac09 7.3 7.5
sG03 6.8 7.1 Ac10 7.2 7.8
sG04 6.7 7.1 Ac11 7.2 7.4
sG05 6.8 7.1 Ac12 7.2 7.8
sG06 6.8 7.1 Ac13 7.1 7.8
sG07 6.6 7.1 Ac14 7.1 7.7
sG08 6.6 7.1 Ac15 7.0 7.8
sG09 6.8 7.1
sG10 6.9 7.1 AI01 7.7 7.6
sG11 7.2 7.1 AI02 7.9 6.6
sG12 7.4 7.1 AI03 7.5 7.1
sG13 6.9 7.1
sG14 6.9 7.1 PP01 7.6 7.8
sG15 7.3 7.1
bG01 7.6 7.8
bG02 7.5 7.7
34

mated maximum length of these faults. In other cases, such as the larger basel region, the uncertainty about the fault(s) re-sponsible for the big basel 1356 earthquake is reflected in our alternative zone regroupings within the so-called ‘rhinoceros’ (Fig. 13).
Maximum size of faults within large scale zones
First of all, we recall the fact that Expert Group 2 (EG1b) also considers the possibility of choosing large scale seismic source zones (Fig. 3), the boundaries of which are based on geological/tectonic arguments. this large zone approach is given a weight of 0.2 in comparison to 0.8 for the small scale zonation (Fig. 8). Hence, we clearly prefer the small scale zonation, whereby the zone boundaries were chosen based on geological arguments
and using all available information from historical and instru-mental seismicity. We are well aware that none of these local arguments are absolute, and any of our small zone boundaries could be ignored by the next large earthquake. Nevertheless, we consider all boundaries of our small zones as strictly imper-meable to fault ruptures. this strict impermeability condition is compensated by the ‘large zone approach’ (with a weight of 0.2), where the size of source zones does not provide any con-straints on the value of Mmax anymore. As discussed earlier, the EPrI approach to large zones yields acceptable Mmax values for the mode, but apparently still unreasonably high values within the long upper tails of the probability distributions; values of M > 8.0 remain even after a cutoff at 0.05. this is the main rea-son for introducing an additional cutoff based on a geological argument estimating the absolute maximum size of any fault which exists within the study area.
Large faults and lineaments do exist throughout the study area. Examples include blind, hidden boundary faults of iden-tified and suspected E–W running Permo-carboniferous gra-ben structures in northern switzerland and below the folded Jura. A seismic lineament in the western Helvetic Alps, the Wildhorn small scale zone (Ac_5) seems to be localized, at least partly along such an old carboniferous graben within the External crystalline Aiguilles rouges massif; this fault zone is seismically active along a linear stretch of some 80 km in an ssW–NNE direction. N–s oriented, rhenish faults of Oligocene age may be present in large parts of central and western switzerland where they have a clear geomorphic ex-pression as tear faults in the folded Jura. seismic activity is known for such a structure below the Molasse basin in the Fri-bourg area (AE_7). the seismically active Vuache fault zone (AE_11) of the westernmost Jura belongs to this tear fault family, too. both, the Fribourg and Vuache faults have lengths of the order of 50 to 60 km.
All of these fault zones extend over at least 50 km and many of them could easily be more than 100 km long. the Permo-carboniferous graben structures of northern switzerland are now well known and mapped to extend from the bodensee to Kaisten over about 100 km (Müller et al. 2002). the westward extension of this graben structure is wide open to speculation. It could well extend another 100 km further to the west into the
table 5. (continued).
Large Zone Geologictruncation
95% cumulativetruncation
smallZone
Geologictruncation
95% cumulativetruncation
Zone regroupings
sG1_2 7.3 6.8 rG1_AE1 7.3 8.2
sG5678 7.3 7.1
sG5_6_8 7.3 7.1 AE1_2 7.6 8.1
sG5_8 7.3 7.1 AE1_2_13 7.8 8.2
sG6_7 6.9 7.1 AE1_13 7.5 8.2
Fig. 19. Mmax derived according to the EPrI approach for small scale zones. shades of grey are according to the bar given at the left. the values shown correspond to the highest probability (mode) of the EPrI posterior Mu prob-ability distributions. the largest value of Mmax = 7 calculated for AE_1, basel, contains the basel earthquake (Mmax observed = 6.9).
35

region of besançon. Fault segmentation does exist, of course, but where known and mapped, as in the case of the Weiach trough, it does not seem to be too severe to preclude rupturing across bridges between individual fault strands (rubin 1996).
Large, up to 200 km long, geomorphically expressed fault lineaments also exist within the central Alps. the most striking example is the rhine-rhone lineament, a feature which has been recognized a long time ago and which is at least partly (within the Aar massif) reported on the classical tectonic map of switzerland (spicher 1980). In more recent tectonic maps of switzerland none of these long lineaments are shown anymore. they still exist, however, and in places, there is even clear geo-morphic evidence for considerable post-Würm ice age vertical displacements (Eckart et al. 1983) along faults with the same general orientation. In an extreme interpretation, the seismic quiescence of the area with the most spectacular fault scarps in the Gotthard region (our ticino Ac_8 source zone), could possibly be interpreted as a ‘seismic gap’ inbetween the two seismic ‘hot spots’ of the Valais (Ac_5 and Ac_6) and the Gri-sons (Ac_10) zones, located at either end of this large fault lineament.
In summary, we conclude that 200 km is an uppermost limit to the length of any fault within the entire study area. this limit is arbitrary, and our choice is deliberately on the large side. the present day seismicity and the historical record of the last 1000 years speak against seismic activity of faults this large, even if we allow for the fact that our wet climate is not favorable to the preservation of the paleoseismic record (Kaneda 2003). the present day plate tectonic situation of the Alps, with little if any ongoing plate convergence, is another argument against large active faults.
Despite these arguments, reflected in the recurrence pa-rameters of the different seismic source zones, we are reluc-tant to set the uppermost Mmax values too close to the observed Mmax. there are indeed hints to isostatic unloading phenom-ena within the Alps and their surroundings. the present day vertical uplift of up to 1.5 mm/a (Gubler et al. 1984) may still be influenced by post-glacial rebound (Gudmundsson 1994). Many of the seismic hot spots in the Alpine Foreland (basel, remiremont, schwäbische Alb) bear some resemblance to intra-plate, intracontinental earthquakes observed elsewhere (Meers fault, Ungava; Adams et al. 1991), New castle, and extreme, New Madrid (Hough 2002). such extreme events are included in the EPrI approach where they lead to the long upper tails in probability distributions. Here we opted to take an intermediate route, EPrI distributions, truncated at Mmax
of around 7.5.
Conclusion
this paper describes a complex seismic source model for swit-zerland, sW Germany, eastern France, northern Italy, and western Austria. It is one of four models derived within the PEGAsOs project. these four models represent the epistemic uncertainty involved in the process of determining seismic
source zones. Each of the four models tackles the problem of epistemic uncertainty also internally as it is seen by the respec-tive experts in form of their specific logic trees. the model pre-sented in this paper consists of 543 end branches in the logic tree. Obviously such a model complexity is beyond previous standards.
the seismic source zone model described here consists of two main elements, (1) the large scale zones in form of the regional tectonic architecture and (2) the small scale seis-motectonic subdivision of the large zones. the constraints and justification for this procedure, which are summarized in the paper, represent a review of the state of the art of associat-ing the observed seismicity with known tectonic features. A key element for addressing certain tectonic elements as po-tentially seismically active is the tectonic regime. this infor-mation enables to assign which fault orientation in the source zones would satisfy a failure criterion and thus preferably be activated. this is performed as multiple styles of faulting in form of the probability of expected strike, normal, or thrust faulting within each source zone.
Moreover, each seismic source zone is characterized by its parameters of the frequency magnitude relation with their uncertainties as well as the truncated probability density func-tion of maximum magnitudes Mmax according to the “EPrI” approach. the truncation follows both geological constraints and the limitations in the fault lengths due to the areal extent of source zones. the derived source zone parameters, and es-pecially the Mmax density distribution, are strongly dependent on the way the intensity assignments of the largest historical earthquakes have been converted into Mw.
the principle of stationarity of seismicity was consequently followed throughout our model development. this concept is not only reflected in the set of small scale zones, but also in the use of the Kernel smoothing of seismicity in case of the large scale zones.
All in all, not only a comprehensive seismic source zone model has been derived, but, according to the goal connected with the applied ssHAc methodology (budnitz et al. 1997), also the involved uncertainties are captured to a level which set a new standard at least from the European perspective.
Acknowledgements
One strong motivation to finalize this manuscript was to honor our colleague and friend Martin burkhard who suffered a fatal accident in 2006 during geo-logical field work. Most of the geological constraints described in this paper carry Martin’s trademark.
the contribution of Armando cisternas, the third team member, is ac-knowledged. special thanks are expressed to the project tFI team Kevin coppersmith and bob Youngs for their guidance and help in developing the model. We want to thank, as well, christian sprecher (Nagra), Philippe roth and Jim Farrington (both at formerly Proseis AG) for their organizational, logistic and technical efforts. stefan schmid is sincerely thanked for improving the manuscript. We would like to thank for the financial contributions towards the printing costs we received from Nagra through P. Zuidema, from the GFZ Potsdam, as well as from a special grant of Prof. P. Perrochet, former colleague of Martin burkhard at the University of Neuchâtel.
36

rEFErENcEs
Abrahamson, N., birkhäuser, P., Koller, M., Mayer-rosa, D., smit,. P., spre-cher, c., tinic, s. & Graf, r. 2004: Pegasos – a comprehensive probabilis-tic seismic hazard assessment for nuclear power plants in switzerland. 12th European conference on Earthquake Engineering, London, Paper No. 633.
Adams, J., Wetmiller, r.J., Hasegawa, H.s. & Drysdale, J. 1991: the first sur-face faulting from a historical intraplate earthquake in North America. Nature 352.
Ahorner, L. & rosenhauer, W. 1978: seismic risk evaluation for the up-per rhine graben and its vicinity. Journal of Geophysics 44, 481– 497.
Ahorner, L. & rosenhauer, W. 1986: regionale Erdbebengefährdung. In: realistische seismische Lastannahmen für bauwerke, Kap. 9. Abschluss-bericht an das Institut für bautechnik berlin, t 1829, König und Heu-nisch, beratende Ingenieure, Irb Verlag stuttgart.
Anderson, E.M. 1951: Dynamics of faulting and dyke formation. Oliver and boyd, Edinburgh.
Aoudia, A., sarao, A., bukchin, b. & suhadolc, P. 2000: the 1976 Friuli (NE Italy) thrust faulting earthqu ake: A reappraisal 23 years later. Geophysi-cal research Letters 27/4, 573–576.
Audin, L., Avouac, J.P. & Flouzat, M. 2002: Fluid-driven seismicity in a stable tectonic context; the remiremont fault zone, Vosges, France. Geophysical research Letters 29/6, 10. 1029.
Avouac, J.P. & burov, E.b. 1996: Erosion as a driving mechanism of intrac-ontinental mountain growth. Journal of Geophysical research 101/b8, 17747–17769.
Axen, G.J., selverstone, J., byrne, t. & Fletcher, J.M. 1998: If the strong crust leads, will the weak crust follow? GsA today 8/12, 1–8.
bachmann, G.H. & Müller, M. 1992: sedimentary and structural evolution of the German Molasse basin. Eclogae Geologicae Helvetiae 85/3, 5 19–530.
bachmann, G.H., Dohr, G. & Müller, M. 1982: Exploration in a classic thrust belt and its foreland: bavarian Alps, Germany. American Association of Petroleum Geologists bulletin 66, 2529–2542.
bachmann, G.H., Müller, M. & Weggen, K. 1987: Evolution of the Molasse ba-sin (Germany, switzerland). tectonophysics 137, 77–92.
baer, M., Deichmann, N., braunmiller, J., Dolfin, D.b., bay, F., bernardi, F., De-louis, b., Fäh, D., Gerstenberger, M., Giardini, D., Huber, s., Kastrup, U., Kind, F., Kradolfer, U., Maraini, s., Mattle, b., schler, t., salichon, J., sel-lami, s., steimen, s. & Wiemer, s. 2001: Earthquakes in switzerland and surrounding regions during 2000. Eclogae Geologicae Helvetiae 94/2, 253–264.
becker, A., Davenport, c.A. & Giardini, D. 2002: Palaeoseismicity studies on end-Pleistocene and Holocene lake deposits around basle, switzerland. Geophysical Journal International 149/3, 659–678.
berger, J.-P. 1996: cartes paléogéographiques-palinspastiques du bassin mo-lassique suisse (Oligocène inférieur – Miocène moyen). Neues Jahrbuch für Geologie und Paläontologie, Abhandlungen 202/1, 1–44.
bergerat, F. 1987: Paléo-champs de contrainte tertiaires dans la plate-forme européenne au front de l’orogène alpin. bulletin de la société géologique de France 8/3, 611–620.
bergerat, F., Mugnier, J.L., Guellec, s., truffert, c., cazes, M., Damotte, b. & roure, F. 1990. Extensional tectonics and subsidence of the bresse basin: an interpretation form EcOrs data. In: Deep structure of the Alps (edited by roure, F., Heitzmann, P. & Polino, r.). Mémoire 1, 145–156.
blondel, t., charollais, J., sambeth, U. & Pavoni, N. 1988: La faille du Vuache (Jura meridional); un exemple de faille a caractère polyphase. bulletin de la société Vaudoise des sciences Naturelles 79/2, 65–91.
boyer, s.E. & Elliott, D. 1982: thrust systems. American Association of Petro-leum Geologists bulletin 66/9, 1196–1230.
brink, H.J., burri, P., Lunde, A. & Winhard, H. 1992: Hydrocarbon habitat and potential of swiss and German Molasse basin: A comparison. Eclogae Geologicae Helvetiae 85/3, 715–732.
brun, J.P., Wenzel, F., blum, r., bois, c., burg, J.P., colletta, b., Damotte, b., Durbaum, H., Durst, H., Fuchs, K., Grohmann, N., Gutscher, M.A., Hueb-
ner, M., Karcher, t., Kessler, G., Kloeckner, M., Lucazeau, F., Lueschen, E., Marthelot, J.M., Meier, L., ravat, M., reichert, c., Vernessa, s., Villemin, t. & Wittlinger, G. 1991: crustal-scale structure of the southern rhine-graben from EcOrs-DEKOrP seismic reflection data. Geology 19/7, 758–762.
brun, J.P., Gutscher, M.A., blum, r., bois, c., burg, J.P., colletta, b., Duer-baum, H., Damotte, b., Durst, H., Fuchs, K., Grohmann, N., Huebner, M., Karcher, t., Kessler, G., Kloeckner, M., Lucazeau, F., Lueschen, E., Mar-thelot, J.M., Meier, L., ravat, M., reichert, c., Vernassa, s., Villemin, t., Wenzel, F. & Wittlinger, G. 1992: Deep crustal structure of the rhine Gra-ben from DEKOrP-EcOrs seismic reflection data; a summary. tecto-nophysics 208/1–3, 139–147.
budnitz, r.J., Apostolakis, G., boore, D.M., cluff, L.s., coppersmith, K.J., cornell, c.A. & Morris, P.A. 1997: recommendations for probabilis-tic seismic hazard analysis: guidance on uncertainty and use of experts, NUrEG/cr-6372, Washington, D.c.: U.s. Nuclear regulatory commis-sion.
burkhard, M. 1988: L’Helvétique de la bordure occidentale du massif de l’Aar (évolution tectonique et métamorphique. Eclogae Geologicae Helvetiae 81/1, 63–114.
burkhard, M. 1999: strukturgeologie und tektonik im bereich Alptransit. In: Vorerkundung und Prognose der basistunnels am Gotthard und am Lötschberg (edited by Löw, s., Wyss, r., briegel, U., Oddson, b. & schlickenrieder, L.). balkema, rotterdam, 45–56.
burkhard, M. & sommaruga, A. 1998: Evolution of the western swiss Mo-lasse basin: structural relations with the Alps and the Jura belt. In: cenozoic Foreland basins of Western Europe (edited by Mascle, A., Puigdefàbregas, c., Luterbacher, H.P. & Fernàndez, M.) 134. Geological society special Publications, London, 279–298.
calais, E., bayer, r., chery, J., cotton, F., Doerflinger, E., Flouzat, M., Jouanne, F., Kasser, M., Laplanche, M., Maillard, D., Martinod, J., Mathieu, F., Nico-lon, P., Nocquet, J.M., scotti, O., serrurier, L., tardy, M. & Vigny, c. 2001: rEGAL: a permanent GPs network in the western Alps. configura-tion and first results. bulletin de la société Géologique de France 172/2, 141–158.
coppersmith, K. J., Youngs, r. r. & sprecher, c. 2009: Methodology and main results of seismic source characterization for the PEGAsOs Project, switzerland. swiss Journal of Geosciences 102, 91–105.
Deichmann, N. 1992a: recent seismicity of the northern Alpine foreland of switzerland. Eclogae Geologicae Helvetiae 85/3, 701–705.
Deichmann, N. 1992b: structural and rheological implications of lower-crustal earthquakes below northern switzerland. Physics of the Earth and Plan-etary Interiors 69/3–4, 270–280.
Deichmann, N. & Garcia Fernandez, M. 1992: rupture geometry from high-precision relative hypocentre locations of microearthquake clusters. Geo-physical Journal International 110/3, 501–517.
Deichmann, N. & rybach, L. 1989: Earthquakes and temperatures in the lower crust below the northern Alpine Foreland of switzerland. Geophysical Monograph 51, 197–213.
Deichmann, N., baer, M., braunmiller, J., Dolfin, D.b., bay, F., Delouis, b., Fäh, D., Giardini, D., Kastrup, U., Kind, F., Kradolfer, U., Kunzle, W., roth-lisberger, s., schler, t., salichon, J., sellami, s., spuhler, E. & Wiemer, s. 2000: Earthquakes in switzerland and surrounding regions during 1999. Eclogae Geologicae Helvetiae 93/3, 395–406.
Deichmann, N., baer, M., braunmiller, J., ballarin, D., bay, F., bernardi, F., De-louis, b., Fäh, D., Gerstenberger, M., Giardini, D., Huber, s., Kradolfer, U., Maraini, s., Oprsal, I., schibler, r., schler, t., sellami, s., steimen, s., Wiemer, s., Wössner, J. & Wyss, A. 2002: Earthquakes in switzerland and surround-ing regions during 2002. Eclogae Geologicae Helvetiae 95/3, 249–261.
Delacou, b., sue, ch., champagnac, J.-D., burkhard, M. (2004) Present-day geodynamics in the bend of the western and central Alps as constrained by earthquake analysis. Geophysical Journal International 158/2, 753–774.
Dewey, J.F. 1988: Extensional collapse of orogens. tectonics 7/6, 1123–1139.Diebold, P., Naef, H. & Ammann, M. 1991: Zur tektonik der Zentralen Nord-
schweiz. Nagra technischer bericht Ntb 90–04. Nagra, Wettingen, swit-zerland.
Eckart, P. 1957: Zur talgeschichte des tavetsch, seine bruchsysteme und jung-quartären Verwerfungen, Zürich.
37

Eckart, P. 1974: Untersuchungen von rezenten Krustenbewegungen an der rhein-rhone-Linie. Eclogae Geologicae Helvetiae 67/1, 233–235.
Eckart, P., Funk, H. & Labhart, t. 1983: Postglaziale Krustenbewegungen an der rhein-rhone-Linie. Vermessung, Photogrammetrie und Kulturtech-nik 83/2, 43–56.
Erard, P.F. 1999: traitement et interprétation de cinq lignes sismiques réflex-ion à travers le Plateau molassique et les Préalpes suisses, de bienne à Lenk. Unpubl. PhD thesis, Lausanne.
Faber, s., bonjer, K.P., brüstle, W. & Deichmann, N. 1994: seismicity and struc-tural complexity of the Dinkelberg block, southern rhine Graben. Geo-physical Journal International 116/2, 393–408.
Gardner, J.K. & Knopoff, L. 1974: Is the sequence of earthquakes in southern california, with aftershocks removed, Poissonian? bulletin of the seismo-logical society of America 64, 1363–1367.
GEOtEr sArL 1993:sismotectonique de la France Métropolitaine. Institut de Protection et de sureté Nucléaire.
Grellet, b., combes, P., Granier, t. & Philip, H. 1993: sismotectonique de la France Métropolitaine. Mémoire société Géologique France n.s. 164/1/2, 76 p.
Grünthal, G. 1985: the up-dated earthquake catalogue for the German Dem-ocratic republic and adjacent areas – statistical data characteristics and conclusions for hazard assessment. 3rd International symposium on the Analysis of seismicity and seismic risk, Liblice/czechoslovakia, 17–22 June 1985 (Proceedings Vol. I, 19–25)
Grünthal, G. & GsHAP region 3 Working Group 1999: seismic hazard as-sessment for central, north and northwest Europe: GsHAP region 3. Annali di Geofisica 42/6, 999–1011.
Grünthal, G. & stromeyer, D. 1992: the recent crustal stress field in central Europe – trajectories and finite-element modeling. Journal of Geophysi-cal research 97/b8, 11.805–11.820.
Grünthal, G., & Wahlström, r. 2003: An Mw based earthquake catalogue for central, northern and northwestern Europe using a hierarchy of magni-tude conversions. Journal of seismology 7/4, 507–531.
Grünthal, G., Mayer-rosa, D. & Lenhardt, W.A. 1998: Abschätzung der Erd-bebengefährdung für die D-A-cH-staaten Deutschland, Österreich, schweiz. bautechnik 75/10, 19–33.
Grünthal, G., schenk, V., Zeman, A. & schenková, Z. 1990: seismotectonic model for the earthquake swarm of 1985/86 in the Vogtland/West bohe-mia focal area. tectonophysics 174/3–4, 369–383.
Gubler, E., schneider, D. & Kellerhals, P. 1984: bestimmung von rezenten be-wegungen der Erdkruste mit geodätischen Methoden. Nagra technischer bericht Ntb 84–17. Nagra, Wettingen, switzerland.
Gudmundsson, G.H. 1994: An order of magnitude estimate of the current up-lift-rates in switzerland caused by the Würm alpine deglaciation. Eclogae Geologicae Helvetiae 87/2, 545–557.
Guellec, s., tardy, M., roure, F. & Mugnier, J. L. 1989: Une interprétation tec-tonique nouvelle du massif subalpin des bornes (Alpes occidentales): ap-ports des données de la géologie et de la géophysique profondes. comptes rendus de l’Académie des sciences de Paris 309/II, 9 13–920.
Guellec, s., Mugnier, J.L., tardy, M. & roure, F. 1990: Neogene evolution of the western Alpine foreland in the light of EcOrs data and balanced cross sections. In: Deep structure of the Alps (edited by roure, F., Heitzmann, P. & Polino, r.). 1. Mém. soc. géol. suisse, Zürich, 165– 184.
Haessler, H., Hoangtrong, P., schick, r., schneider, G. & strobach, K. 1980: the september 3, 1978, swabian Jura Earthquake. tectonophysics 68/1–2, 1–14.
Hanks, t.c. & Kanamori, H. 1979: A moment magnitude scale. Journal of Geophysical research 84, 2348–2350.
Hinderer, M. 2001: Late Quaternary denudation of the Alps, valley and lake fillings and modern river loads. Geodinamica Acta 14/4, 231–263.
Hough, s.E. 2002: Earthshaking science – What we know (and don’t know) about earthquakes. Princeton University Press, Princeton and Oxford.
Homberg, c., Lacombe, O., Angelier, J. & bergerat, F. 1999: New constraints for indentation mechanisms in arcuate belts from the Jura Mountains, France. Geology 27/9, 827–830.
Hunziker, J.c., Hurfond, A.J. & calmbach, L. 1997: Alpine cooling and uplift. In: results of NrP 20 deep structure of the swiss Alps (edited by Pfiffner, O.A., Lehner, P., Heitzmann, P., Mueller, s. & steck, A.). birkhäuser Verlag, basel, 260–263.
Jaeckli, H. 1958: Der rezente Abtrag der Alpen im spiegel der Vorlandsedi-mentation. Eclogae Geologicae Helvetiae 5/1–2, 354–365.
Jiménez, M.-J., Giardini, D. & Grünthal, G. 2003: the Esc-sEsAME unified hazard model for the European-Mediterranean region. EMsc/csEM Newsletter 19, 2–4.
Johnston, A.c., coppersmith, K.J., Kanter, L.r. & cornell, c.A. 1994: the earthquakes of stable continental regions – Assessment of large earth-quake potential. Electric Power research Institute (EPrI), tr-102261-V1, 2–1-98.
Kahle, H.G., Geiger, A., buerki, b., Gubler, E., Marti, U., Wirth, b., roth-acher, M., Gurtner, W., beutler, G., bauersima, I. & Pfiffner, O.A. 1997: recent crustal movements, geoid and density distribution, contribution from integrated satellite and terrestrial measurements. In: results of NrP 20 deep structure of the swiss Alps (edited by Pfiffner, O.A., Leh-ner, P., Heitzmann, P., Mueller, s. & steck, A.). birkhäuser Verlag, basel, 251–259.
Kaneda, H. 2003: threshold of geomorphic detectability estimated from geo-logic observations of active low slip-rate strike-slip faults. Geophysical research Letters 30/5, 1238–1241.
Kastrup, U. 2002: seismotectonics and stress field variations in switzerland. Unpubl. PhD thesis, EtH Zürich.
Kastrup, U., Deichmann, N., Fröhlich, A. & Giardini, D. 2007: Evidence for an active fault below the northwestern Alpine foreland of switzerland. Geo-physical Journal International 169, 1273–1288.
Kijko, A. & Graham, G. 1998: Parametric-historic procedure for probabilistic seismic hazard analysis. Part I: estimation of maximum regional magni-tude mmax. Pure and Applied Geophysics 152, 413–442.
Kunze, th. 1986: Ausgangsparameter für die Abschätzung der seismischen Gefährdung in Mitteleuropa, Jahresberichte und Mitteilungen des Ober-rheinischen Geologischen Vereins 68, 225–240.
Laubscher, H.P. 1985: the eastern Jura: relations between thin-skinned and basement tectonics, local and regional. Nagra technischer bericht Ntb 85–53. Nagra, Wettingen, switzerland.
Laubscher, H.P. 1987: Die tektonische Entwicklung der Nordschweiz. Eclogae Geologicae Helvetiae 80/2, 287–303.
Laubscher, H. 1992: the Alps – a transpressive pile of peels. In: thrust tectonics 1990 (edited by Mcclay, K.r.), Egham, United Kingdom, 277–285.
Lippitsch, r. 2002: Lithosphere and upper mantle p-wave velocity structure beneath the Alps by High-resolution teleseismic tomography. Unpubl. PhD thesis, EtH Zürich.
Mancktelow, N. 1985: the simplon Line: a major displacement zone in the western Lepontine Alps. Eclogae Geologicae Helvetiae 78/1, 73–96.
Mancktelow, N. 1992: Neogene lateral extension during convergence in the central Alps: evidence from interrelated faulting and backfolding around the simplonpass (switzerland). tectonophysics 215, 295–317.
Maurer, H. 1993: seismotectonics and upper crustal structure in the Western swiss Alps. Unpubl. PhD thesis, EtH Zürich.
Maurer, H., burkhard, M., Deichmann, N. & Green, A.G. 1997: Active tecto-nism in the central Alps: contrasting stress regimes north and south of the rhone Valley. terra Nova 9/2, 91–94.
Mayer-rosa, D. & cadiot, b. 1979: review of the 1356 basel Earthquake – ba-sic Data. tectonophysics 53/3–4, 325–333.
Meghraoui, M., Delouis, b., Ferry, M., Giardini, D., Huggenberger, P., spottke, I. & Granet, M. 2001: Active normal faulting in the Upper rhine Graben and paleoseismic identification of the 1356 basel earthquake. science 293/5537, 2070–2073.
Meier, b.P. 1994: Untere süsswassermolasse des westlichen Mittellandes – re-gionale Interpretation bestehender seismik und petrophysikalische In-terpretation von Fremdbohrungen. Unpubl. Nagra Internal report NIb 94–28. Nagra, Wettingen, switzerland.
Meyer, b., Lacassin, r., brulhet, J. & Mouroux, b. 1994: the basel 1356 Earth-quake – Which fault produced it? terra Nova 6/1, 54–63.
Molnar, P. 1987: Inversion of profiles of uplift rates for the geometry of dip-slip faults at depth, with examples from the Alps and the Himalaya. Annales Geophysicae 5b/06, 663–670.
Mosar, J. 1999: Present-day and future tectonic underplating in the western swiss Alps: reconciliation of basement/wrench-faulting and décollement
38

folding of the Jura and Molasse basin in the Alpine foreland. Earth and Planetary science Letters 173/3, 143–155.
Müller, W.H., Huber, M., Isler, A. & Kleboth, P. 1984: Erläuterungen zur “Geologischen Karte der zentralen Nordschweiz 1 : 100'000”. Nagra tech-nischer bericht Ntb 84-25. Nagra, Wettlingen, switzerland.
Müller, W.H., Naef, H. & Graf, H.r. 2002: Geologische Entwicklung der Nord-schweiz, Neotektonik und Langzeitszenarien Zürcher Weinland. Nagra technischer bericht Ntb 99-08. Nagra, Wettlingen, switzerland.
Niviere, b. & Winter, t. 2000: Pleistocene northwards fold propagation of the Jura within the southern Upper rhine Graben: seismotectonic implica-tions. Global and Planetary change 27/1–4, 263–288.
Pavoni, N. 1961: Faltung durch Horizontalverschiebung. Eclogae Geologicae Helvetiae 54/2, 515–534.
Pavoni, N. 1987: Zur seismotektonik der Nordschweiz. Eclogae Geologicae Helvetiae 80/2, 461–471.
Pavoni, N., Maurer,H.r., roth, P. & Deichmann, N. 1997: seismicity and seis-motectonics of the swiss Alps. In: results of NrP 20 deep structure of the swiss Alps (edited by Pfiffner, O.A., Lehner, P., Heitzmann, P., Mueller, s. & steck, A.). birkhäuser Verlag, basel, 24 1–250.
Pfiffner, O.A. 1986: Evolution of the north Alpine foreland basin in the cen-tral Alps. special Publication of the international Association of sedimen-tologists 8, 219–228.
Pfiffner, O.A. & Heitzmann, P. 1997: Geological interpretation of the seismic profiles of the central traverse (lines c1, c2 and c3-north). In: results of NrP 20 deep structure of the swiss Alps (edited by Pfiffner, O.A., Lehner, P., Heitzmann, P., Mueller, s. & steck, A.). birkhäuser Verlag, basel, 115–122.
Pfiffner, O.A., Erard, P.F. & staeuble, M. 1997: two cross sections through the swiss Molasse basin (lines E4-E6, W1, W7-W10). In: results of NrP 20 deep structure of the swiss Alps (edited by Pfiffner, O.A., Lehner, P., Heitzmann, P., Mueller, s. & steck, A.). birkhäuser Verlag, basel, 64–72.
Philippe, Y. 1995: rampes latérales et zones de transfert dans les chaînes plis-sées: géométrie, conditions de formation et pièges structuraux associés. Unpubl. PhD thesis, chambéry (savoie, France).
Philippe, Y., coletta, b., Deville, E. & Mascle, A. 1996: the Jura fold-and-thrust belt: a kinematic model based on map-balancing. In: Peri-tethys Memoir 2: structure and Prospects of Alpine basins and Forelands (edited by Ziegler, P.A. & Horvath, F.). Mémoires du Muséum National d’Histoire Naturelle 170, 235–261.
Plenefisch, t. & bonjer, K.P. 1997: the stress field in the rhine Graben area inferred from earthquake focal mechanisms and estimation of frictional parameters. tectonophysics 275/1–3, 7 1–97.
Poli, M.E., Peruzza, L., rebez, A., renner, G., sleijko, D. & Zanferrari, A. 2002: New seismotectonic evidence from the analysis of the 1976–1977 and 1977–1999 seismicity in Friuli (NE Italy). bolletino Geofisica teorica ed Applicata 43/1–2, 53–78.
Price, N.J. & cosgrove, J.W. 1990: Analysis of Geological structures. cam-bridge University Press, cambridge.
rahn, M.K., Hurford, A.J. & Frey, M. 1997: rotation and exhumation of a thrust plane, apatite fission-track data from the Glarus thrust, switzer-land. Geology 25/7, 599–602.
ratschbacher, L., Frisch, W., Neubauer, F., schmid, s.M. & Neugebauer, J. 1989: Extension in compressional orogenic belts: the eastern Alps. Geol-ogy 17, 404–40.
raymond, D., Defontaines, b., Fehri, A., Dorioz, J.M. & rudant, J.P. 1996: Néotectonique dans la région sud-lémanique (Haute-savoie, France): ap-proche multisources (imagerie optique et hyperfréquences, analyse mor-phostructurale). Eclogae Geologicae Helvetiae 89/3, 949–973.
reasenberg, P.A. 1985: second-order moment of central california seis-micity. Journal of Geophysical research, b, solid Earth and Planets 90, 5479–5495.
reinecker, J. & schneider, G. 2002: Zur Neotektonik der Zollernalb: Der Hohenzollerngraben und die Albstadt-Erdbeben. Jahresberichte und Mitteilungen des Oberrheinischen Geologischen Vereins 84, 39 1–417.
roth, P., Pavoni, N. & Deichmann, N. 1992: seismotectonics of the Eastern swiss Alps and Evidence for Precipitation-Induced Variations of seismic Activity. tectonophysics 207/1–2, 183–197.
rubin, c.M. 1996: systematic underestimation of earthquake magnitudes from large intra-continental reverse faults: Historical ruptures break across segment boundaries. Geology 24/11, 989–992.
sägesser, r. & Mayer-rosa, D. 1978: Erdbebengefährdung in der schweiz. schweizerische bauzeitung 96/7, 107–123.
sambeth, U. & Pavoni, N. 1988: A seismotectonic investigation in the Geneva basin, southern Jura Mountains. Eclogae Geologicae Helvetiae 81/2, 433–440.
scandone, P. 1990: structural Model of Italy. consiglio Nazionale delle ri-cerche, Florence, Italy.
scandone, P., Patacca, E., Meletti, c., bellatalla, M., Perilli, N. and santini, U. 1992: struttura geologica evoluzione cinematica e schema sismo tettonico della penisola Italiana, in GNDt, Atti del convegno 1990 “Zonazione e riclassificazione sismica” (Ed. Ambiente bologna), vol. 1, 119–135.
schindler, c., beer, c., Mayer rosa, D., rüttener, E., Wagner, J.J., Jaquet, J.-M. & Frischknecht, c. 1996: Integrierte Auswertung von seismischen und bodenspezifischen Parametern: Gefährdungskarten im Kanton Ob-walden. Geologische berichte, Landeshydrologie und -geologie 19, 61.
schlaefli, A. 1999: Geologie des Kantons thurgau. In: Mitteilungen der thur-gauischen Naturforschenden Gesellschaft 55, 102.
schlunegger, F. & Hinderer, M. 2001: crustal uplift in the Alps: Why the drain-age patterns matter. terra Nova 13/6, 425–432.
schmid, s.M. & slejko, D. 2009: seismic source characterization of the Al-pine foreland in the context of probabilistic seismic hazard analysis by PEGAsOs Expert Group 1 (EG1a). swiss Journal of Geosciences 102, 121–148.
schmid, s.M., Aebli, H.r., Heller, F. & Zingg, A. 1989: the role of the Periadri-atic Line in the tectonic evolution of the Alps. In: Alpine tectonics (edited by coward, M.P., Dietrich, D. & Park, r.G.) special Publication No. 45. Geological society London, Oxford, 153–171.
schmid, s.M., Pfiffner, O.A., schoenborn, G., Froitzheim, N. & Kissling, E. 1997: Integrated cross section and tectonic evolution of the Alps along the eastern traverse. In: results of NrP 20 deep structure of the swiss Alps (edited by Pfiffner, O.A., Lehner, P., Heitzmann, P., Mueller, s. & steck, A.). birkhäuser Verlag, basel, 289–304.
schneider, G. 1968: Erdbeben und tektonik in südwest-Deutschland. tecto-nophysics 5/6, 459–511.
schneider, G. 1972: Die Erdbeben in südwestdeutschland als tektonisches Ereignis. Naturwissenschaften 59/3, 112–119.
schneider, G. 1973: Die Erdbeben in baden-Württemberg 1963–1972. Landes-erdbebendienst baden-Württemberg, stuttgart.
schneider, G. 1979: Earthquake in the swabian Jura of 16 November 1911 and present concepts of seismotectonics. tectonophysics 53/3–4, 279–288.
schneider, G. 1993: beziehungen zwischen Erdbeben und strukturen der süd-deutschen Großscholle. Neues Jahrbuch für Geologie und Paläontologie, Abhandlungen 189/1–3, 275–288.
schnellmann, M., Anselmetti, F.s., Giardini, D., McKenzie, J.A. & Ward, s.N. 2002: Pre-historic earthquake history revealed by lacustrine slump depos-its. Geology 30/12, 1131–1134.
schoenborn, G. 1992: Alpine tectonics and kinematic model of the central southern Alps. Memorie di scienze Geologiche 44, 229–393.
schumacher, M.E. 1997: Geological interpretation of the seismic profiles through the southern Alps (lines s1-s7 and c3-south). In: results of NrP 20 deep structure of the swiss Alps (edited by Pfiffner, O.A., Lehner, P., Heitzmann, P., Mueller, s. & steck, A.). birkhäuser Verlag, basel, 101–114.
sommaruga, A. 1997: Geology of the central Jura and the Molasse basin: new insight into an evaporite-based foreland fold and thrust belt. Mémoire de la société des sciences naturelles de Neuchâtel 12, 145.
sommaruga, A. 1999: Décollement tectonics in the Jura foreland fold-and-thrust belt. Marine and Petroleum Geology 16, 111–134.
spicher, A. 1980: tektonische Karte der schweiz. schweiz. Geol. Kommision.sue, c. 1998: Dynamique actuelle et récente des Alpes occidentales internes,
approche structurale et sismologique. Unpubl. PhD thesis, Grenoble.sue, c., thouvenot, F., Frechet, J. & tricart, P. 1999: Widespread extension in
the core of the western Alps revealed by earthquake analysis. Journal of Geophysical research-solid Earth 104/b11, 25611–25622.
sue, c., Martinod, J., tricart, P., thouvenot, F., Gamond, J.F., Frechet, J., Marinier, D., Glot, J.P. & Grasso, J.r. 2000: Active deformation in the in-
39

ner western Alps inferred from comparison between 1972-classical and 1996-GPs geodetic surveys. tectonophysics 320/1, 17–29.
thouvenot, F., Frechet, J., tapponnier, P., thomas, J.c., Le brun, b., Men-ard, G., Lacassin, r., Jenatton, L., Grasso, J.r., coutant, O., Paul, A. & Hatzfeld, D. 1998: the ML 5.3 Epagny (French Alps) earthquake of 1996 July 15: a long-awaited event on the Vuache Fault. Geophysical Journal International 135/3, 876–892.
turnovsky, J. & schneider, G. 1982: the seismotectonic character of the september 3, 1978, swabian-Jura earthquake series. tectonophysics 83/3–4, 151–162.
Uhrhammer, r. 1986: characteristics of northern and southern california seismicity. Earthquake Notes 57, 21.
Ustaszewski, K. & schmid, s.M. 2007: Latest Pliocene to recent thick-skinned tectonics at the Upper rhine Graben-Jura Mountains junction. swiss Journal of Geosciences 100/2, 293–312.
Vigny, c., chery, J., Duquesnoy, t., Jouanne, F., Ammann, J., Anzidei, M., Avouac, J.P., barlier, F., bayer, r., briole, P., calais, E., cotton, F., Duquenne, F., Feigl, K.L., Ferhat, G., Flouzat, M., Gamond, J.F., Geiger, A., Harmel, A., Kasser, M., Laplanche, M., Le Pape, M., Martinod, J., Menard, G., Meyer, b., ruegg, J.c., scheubel, J.M., scotti, O. & Vidal, G. 2002: GPs network monitors the Western Alps’ deformation over a five-year period: 1993–1998. Journal of Geodesy 76/2, 63–76.
Wagner, J.J., Frischknecht, c., rosset, P., sartori, M., schindler, c., beer, c., Mayer-rosa, D., rüttener, E. & smit, P. 2000: contribution au zonage sis-mique dans la vallée du rhône, entre sion et brigue. Landeshydrologie und -geologie, Geologische berichte 25, 123.
Weichert, D.H. 1980: Estimation of the earthquake recurrence parameters for unequal observation periods for different magnitudes. bulletin of the seismological society of America 70/4, 1337–1346.
Wells, D.L. & coppersmith, K.J. 1994: New empirical relationships among mag-nitude, rupture length, rupture width, rupture area, and surface displace-ment. bulletin of the seismological society of America 84/4, 974–1002.
Wenzel, F., brun, J.P., blum, r., bois, c., burg, J.P., coletta, b., Duerbaum, H., Durst, H., Fuchs, K., Grohmann, N., Gutscher, M.A., Huebner, M., Karcher, t., Kessler, G., Kloeckner, M., Lucazeau, F., Lueschen, E., Mar-thelot, J.M., Meier, L., ravat, M., reichert, c., Vernassat, s. & Villemin, t. 1991: A deep reflection seismic line across the northern rhine Graben. Earth and Planetary science Letters 104/2–4, 140–150.
Wetzel, H.U. & Franzke, H.J. 2001: Geologische Interpretation eines Esr-1 radarmosaiks von Deutschland. Deutsche Gesellschaft für Photogram-mmetrie und Fernerkundung 10, 503–510.
Wetzel, H.-U. & Franzke, H.J. 2003: Lassen sich über die Fernerkundung weitere Kenntnisse zur seismogenen Zone bodensee-stuttgart (9°-Ost) gewinnen? Publikationen der Deutschen Gesellschaft für Pho-togrammetrie, Fernerkundung und Geoinformation, band 12, 23. Wis-senschaftlich-technische Jahrestagung vom 9.–11. 09. 2003 in bochum, 339–348.
Youngs, r.r., swan, F.H., Power, M.s., schwartz, D.P. & Green, r.K. 1987: Probabilistic analysis of earthquake ground shaking hazard along the Wasatch Front, Utah. In: Assessment of regional earthquake hazard and risk along the Wasatch Front, Utah, (edited by Glori, W.W. & Hays, P.L.), M1-M110.
Ziegler, P.A. 1982: Geological Atlas of Western and central Europe. shell In-ternationale Petroleum Maatschappij b.V., the Hague.
Ziegler, P.A. & Dèzes, P. 2006: crustal Evolution of Western and central Europe. In: European Lithosphere Dynamics (edited by Gee, D.G. & stephenson, r.A.), Geological society, London, Memoirs 32, 43–56.
40