seismic and aseismic preparatory processes before large
TRANSCRIPT
Seismic and Aseismic Preparatory Processes Before Large Stick–Slip Failure
GEORG DRESEN,1,4 GRZEGORZ KWIATEK,1,5 THOMAS GOEBEL,2 and YEHUDA BEN-ZION3
Abstract—Natural earthquakes often have very few observable
foreshocks which significantly complicates tracking potential
preparatory processes. To better characterize expected preparatory
processes before failures, we study stick-slip events in a series of
triaxial compression tests on faulted Westerly granite samples. We
focus on the influence of fault roughness on the duration and
magnitude of recordable precursors before large stick–slip failure.
Rupture preparation in the experiments is detectable over long time
scales and involves acoustic emission (AE) and aseismic defor-
mation events. Preparatory fault slip is found to be accelerating
during the entire pre-failure loading period, and is accompanied by
increasing AE rates punctuated by distinct activity spikes associ-
ated with large slip events. Damage evolution across the fault zones
and surrounding wall rocks is manifested by precursory decrease of
seismic b-values and spatial correlation dimensions. Peaks in spa-
tial event correlation suggest that large slip initiation occurs by
failure of multiple asperities. Shear strain estimated from AE data
represents only a small fraction (\ 1%) of total shear strain accu-
mulated during the preparation phase, implying that most
precursory deformation is aseismic. The relative contribution of
aseismic deformation is amplified by larger fault roughness. Sim-
ilarly, seismic coupling is larger for smooth saw-cut faults
compared to rough faults. The laboratory observations point
towards a long-lasting and continuous preparation process leading
to failure and large seismic events. The strain partitioning between
aseismic and observable seismic signatures depends on fault
structure and instrument resolution.
Keywords: Earthquakes, rupture, stick–slip tests, seismic,
aseismic.
1. Introduction
Recent seismic and geodetic studies of large
earthquakes at plate-bounding faults suggest potential
preparation phases extending for months before the
main shocks occurred. The observations show pro-
nounced interaction of seismic foreshocks and
aseismic slip, low and decreasing seismic b-values in
space–time and correlation of pre-seismic locking
and coseismic slip distribution (Moreno et al. 2010,
Schurr et al. 2014, Hasegawa and Yoshida 2015;
Avouac 2015). Aseismic creep may occur episodi-
cally, punctuated by slow slip events and low
frequency earthquakes (Socquet et al. 2017; Frank
et al. 2018). Creep likely accommodates varying but
significant portions of slip in plate-bounding faults
during the seismic cycle (Pacheco et al. 1993; Scholz
and Campos 2012). These observations suggest that
deformation in fault zones leading to seismic ruptures
consists of a long-lasting and largely aseismic
preparation phase punctuated by seismic events.
However, the earthquake preparation phase and its
potential observables may vary significantly
depending on tectonic and thermodynamic conditions
and fault properties. This study has the aim to resolve
some of the primary parameters that govern
preparatory processes before fault slip in laboratory
and nature.
A plethora of field studies analyze the generation
and geologic evolution of faults (e.g., Scholz 2019).
These studies show that progressive strain localiza-
tion results in the formation of single or multiple slip
zones embedded in less deformed damage zones.
Natural faults including those associated with major
plate-boundaries have finite width, roughness and
segmentation (e.g., Ben-Zion and Sammis 2003).
Complex failure sequences and stress transfer from
earthquakes on other faults produce additional local
1 Helmholtz Centre Potsdam, German Research Centre for
Geosciences GFZ, Potsdam, Germany. E-mail: dre@gfz-pots-
dam.de; [email protected] Department of Earth Sciences, Memphis Center for
Earthquake Research and Information, University of Memphis,
Memphis, USA. E-mail: [email protected] Department of Earth Sciences, University of Southern
California and Southern California Earthquake Center, Los Ange-
les, CA 90089-0740, USA. E-mail: [email protected] Institute of Earth and Environmental Sciences, Universitat
Potsdam, Potsdam, Germany.5 Department of Earth Sciences, Freie Universitat Berlin,
Berlin, Germany.
Pure Appl. Geophys. 177 (2020), 5741–5760
� 2020 The Author(s)
https://doi.org/10.1007/s00024-020-02605-x Pure and Applied Geophysics
stress heterogeneities affecting the seismic source,
energy release and rupture arrest (e.g., Ben-Zion et al.
2003, Ampuero et al. 2006, Rippberger et al. 2007).
Major faults with[ 100 km slip also have finite
width, roughness, segmentation, and varying
strengths that are expected to evolve with further
deformation. Heterogeneous fault properties and
evolving seismicity produce strong heterogeneities of
the stress field persisting along the fault over the
entire seismic cycle (e.g., Ben-Zion and Rice 1993;
Mai and Beroza 2002; Ben-David and Fineberg
2011). The heterogeneities control seismic energy
release during inter-seismic loading and rupture
dynamics (e.g., Ampuero et al. 2006; Rippberger
et al. 2007; Romanet et al. 2018) resulting, for
example, in varying slip distributions and aftershock
stress drops (Fletcher and McGarr 2006; Schmittbuhl
et al. 2006; Delouis et al. 2002; Bouchon et al. 2013;
Schurr et al. 2014; Hasegawa and Yoshida 2015;
Abercrombie et al. 2017; Cocco et al. 2016). Field
observations are largely in agreement with experi-
mental and modelling studies, clearly demonstrating
the strong influence of a complex fault structure and
fault roughness on rupture processes (Candela et al.
2011; Goebel et al. 2012, 2017). In addition, dynamic
effects during rupture propagation and arrest (e.g.,
Cochard and Madariaga 1994; Ben-Zion et al. 2012)
may also lead to roughening of the stress field, and
therefore influence the slip, slip rate, and stress drop
distributions (e.g., Schmittbuhl et al. 2006).
Classical nucleation and rupture models focus on
single seismic events on a large pre-existing fault.
These models predict a stable sliding phase over a
critical nucleation patch before dynamic rupture
breaks away (Ida 1972; Dieterich 1978, 1979, 1992;
Palmer and Rice 1973; Ohnaka 1992). A nucleation
phase involving slow stable sliding leading to
dynamic rupture in a two-stage process has been
observed experimentally in stick–slip tests performed
on blocks of PMMA, steel, glass, and rocks (e.g.,
Ohnaka and Shen 1999; Popov et al. 2010; Kammer
et al. 2015). The nucleation phase may involve only
slow aseismic slip or produce a series of foreshocks
as is frequently observed in laboratory tests (Scholz
et al. 1972, McLaskey and Kilgore 2013; McLaskey
and Lockner 2014, Selvadurai and Glaser 2017;
Passelegue et al. 2017). Foreshock activity before
large events has been widely reported (Reasenberg
1999; Bouchon et al. 2013, Brodsky and Lay 2014,
Mignan 2014, Ellsworth and Bulut 2018, Trugman
and Ross 2019). However, the occurrence of fore-
shocks has clear spatial dependency on temperature
and other conditions (e.g., Zaliapin and Ben-Zion
2013, 2016; McGuire et al. 2005; Martınez-Garzon
et al. 2019), and there are well-documented cases of
moderate to large events such as the 2004 M6 Park-
field earthquake in CA or the 1999 M7.1 Duzce
earthquake in Turkey with no detectable foreshock
activity (Bakun et al. 2005; Roeloffs 2006; Wu et al.
2014).
Conceptual nucleation models capturing distinct
foreshocks or weak precursor phases observed for
some earthquakes have motivated cascade and pre-
slip models (Ellsworth and Beroza 1995), implying a
stable preparation phase of an upcoming mainshock,
characterized by slow aseismic pre-slip or, alterna-
tively, a growing cascade of interacting foreshocks.
However, it seems difficult to isolate the nucleation
phase of a larger event from the preceding and
potentially long-lasting preparation phase (Durand
et al. 2020).
Here we exploit the similarities between stick–
slip laboratory tests (Brace and Byerlee 1966,
McLaskey and Lockner 2014, Kwiatek et al. 2014b;
Goebel et al. 2017) and natural earthquakes to ana-
lyze premonitory deformation processes leading to
failure. We present results from a series of new lab-
oratory tests focusing on the preparation of stick–slip
events involving progressive shear localization and
unlocking of faults with different roughness. We
present compiled results on the evolution of statistical
and seismic source characteristics in space and time
such as AE hypocenter distributions, focal mecha-
nism orientation variability, magnitude-frequency
distributions, fractal and clustering properties. The
results emphasize the complex interplay of localized
aseismic deformation, episodic slow slip events and
small-scale dynamic ruptures manifested as AEs. To
demonstrate the role of fault structure in governing
rupture preparation and partitioning between seismic
and aseismic deformation, we compare experiments
on fresh fracture surfaces resulting in rough faults,
with pre-cut surfaces resulting in smooth planar
faults.
5742 G. Dresen et al. Pure Appl. Geophys.

2. Materials and Methods
2.1. Sample Material and Experimental Set-Up
We performed a series of stick–slip experiments
on 4 samples cored from the same block of Westerly
granite. This rock type consists of 28% quartz, 33%
plagioglase, 33% K-feldspar, 5% mica with an
average grainsize of 750 lm (Goebel et al. 2012).
Initial porosity was\ 2%. Cylindrical samples were
precision ground to 102–107 mm in length and a
diameter of 40–50 mm. Samples were dried in an
oven for several days before placing them in a rubber
jacket to insulate them from the oil confining medium
in the pressure vessel. For deformation tests, confined
samples were placed in a servo-controlled Material
Testing System (MTS) 4600 kN loading frame. A
summary of experimental data is shown in Table 1.
To produce rough faults, intact specimens were
prepared with 2.5 cm deep notches inclined at 30� to
the specimen axis (Wgn05, Wgn19). Samples were
then loaded axially at a confining pressure Pc of
75 MPa until shear failure occurred. Subsequently,
confining pressure was raised to lock the faults and
progressive axial loading at constant displacement rate
of 0.33 lm/s was used to induce stick slip events
(Goebel et al. 2012). Faults with smooth sliding
surfaces, were fabricated by cutting cylindrical sam-
ples at 30� inclination to the loading axis producing
diagonal sawcuts (Wgc10, Wgc12). Stick–slip failure
on rough and smooth faults was produced at confining
pressures between 130–150 MPa.
Axial force was measured using an internal load
cell with accuracy of ± 0.05 MPa. Piston displace-
ment and axial shortening across the entire specimen
was measured using a linear variable displacement
transducer (LVDT) with sampling rate of 5 Hz. Local
strains were measured using strain gages in axial and
circumferential direction as well as parallel and
perpendicular to the faults in some tests forming a full
bridge using MTS data acquisition system. Strain
gages were glued directly to the sample surface at
about 10 mm distance above and below the diagonal
fault. Axial strain gage measurements were compared
to the LVDT measurements and accuracy of strain
gage measurements is estimated to be within ± 0.5%.
Up to 14 piezoelectric crystal P-wave transducers
were placed in brass housings and glued directly to
the sample surface using a low viscosity epoxy and
appropriate holes in the rubber jacket. Piezoceramic
PZT crystals were 5 mm in diameter with a thickness
of 2 mm. The resonant frequency of the P-wave
sensors was 1 MHz. The epoxy also served as a seal
between sensor casing and rubber jacket (Fig. 1).
Two additional P-wave transducers were placed in
the top and bottom steel plugs. Full waveforms
recorded continuously at the transducers were stored
in a 16-channel transient recording system (DAXBox,
PROKEL, Germany), with 16-bit digital amplitude
resolution and 10 MHz sampling rate. Signals were
amplified by 40 dB preamps (Physical Acoustic
Corporation) and high-pass filtered at 100 kHz.
Specific horizontal and vertical sensor pairs were
used to derive time-dependent quasi-anisotropic and
time-dependent P-wave velocity model composed of
5 horizontal and 1 vertical layers (e.g., Kwiatek et al.
2014a; b).
2.2. Data Analysis
2.2.1 AE Locations, Magnitudes and Source
Mechanisms
Ultrasonic pulses and AE signals were separated
automatically during post-processing. To locate AE
Table 1
Experimental data of specimens with rough (Wgn05, Wgn19) and smooth faults (Wgc10, Wgc12)
Sample Pc
(MPa)
Loading rate
(lm/s)
No.
AEs
No. AE per
second
Average stress drop of slip
events (MPa)
Average slip of events (mm)
along the fault
Roughness
(rms)
Wgn05 150 0.333 87,108 6.100 132 0.24 0.494
Wgn19 150 0.333 27,237 1.800 103 0.26 n/a
Wgc10 120 0.333 2259 0.1 146 0.34 0.014
Wgc12 133 0.333 1268 0.100 118 0.25 0.034
Vol. 177, (2020) Seismic and Aseismic Preparatory Processes 5743

hypocenters, P-wave onset times were picked auto-
matically using different criteria including Akaike’s
Information Criterion. AE hypocenter locations were
estimated by minimizing travel time residuals using a
hybrid grid search-downhill simplex algorithm using
the time-dependent anisotropic velocity model. The
estimated location accuracy of AE hypocenter is
about ± 2 mm (e.g., Stanchits et al. 2006; Goebel
et al. 2014).
After hypocenter determination, the relative AE
magnitude was estimated as:
MAE ¼ log10
ffiffiffiffiffiffiffiffiffiffiffiffiffiffiffiffiffiffiffiffiffiffiffiffi
1
n
X
n
i¼1
AiRið Þ2
s
; ð1Þ
where Ai and Ri are the maximum amplitude and
source-receiver distance for sensor i, respectively
(e.g., Zang et al. 1998).
To compare cumulative seismic strain from AEs
with shear strain during loading, we assumed seismic
moment of the largest observed AE event, associated
with a large slip event along a rough fault, to be
M0 = 7 Nm. This corresponds to a cm-scale source
radius, in agreement with the maximum size of
sheared asperities representing a fraction of the
known lab-fault dimensions. The moment magnitudes
of all remaining events were then calculated relative
to the largest event. The moment magnitudes (MW) of
AE events ranged from - 8.5 to - 5.5 comparable to
those obtained in similar laboratory studies (McLas-
key and Glaser 2012; Yoshimitsu et al. 2014).
The AE moment magnitudes were used to calcu-
late seismic moment of AE events using a standard
relation (Hanks and Kanamori 1979). Full moment
tensor (FMT) inversion was performed using
hybridMT software, based on first-motion P-wave
amplitudes (Kwiatek et al. 2016). Before the FMT
inversion, AE sensors were cross-calibrated using
ultrasonic transmission measurements to remove
effects of the coupling of AE sensors on recorded
P-wave amplitudes and identify the correction for
Figure 1a Specimen assembly. The sample is contained in a rubber sleeve fixed to top and bottom end caps. The sleeve is perforated to allow
placement of 14 piezoceramic transducers contained in brass housings. The transducers are glued directly to the specimen surface, sealed in
the jacket with epoxy and signals are transmitted through cabled seals in the bottom plug. b Schematic cross section of sample assembly inside
rubber jacket. Dotted line represents rough or sawcut fault
5744 G. Dresen et al. Pure Appl. Geophys.

incidence angle (see Kwiatek et al. 2014a, b, 2016 for
details). The calculated FMTs were rotated into the
principal coordinate system to obtain P(ressure),
T(ension) and N(ull) axes directions, which in turn
were used to calculate the orientation of nodal planes
(strike/dip/rake). For a selected ensemble of AE
events, we calculated the average 3D rotation angle
between all unique pairs of AE focal mechanisms
using their cardinal P and T axes. (e.g., Kagan 2007).
The defined average rotation angles characterize the
heterogeneity of focal mechanisms forming the
ensemble (cf. Goebel et al. 2017).
2.2.2 Pair correlation function and fractal dimension
The spatial distribution of AE hypocenters in our
experiments varies substantially as a function of
roughness. To quantify this variability, we compute
the Pair-Correlation-Function, C(r), at all scales and
for all AE event pairs, N, with separation distance, s,
less than r (Kagan and Knopoff 1980; Grassberger
1983):
C rð Þ ¼ N s\rð Þ=N2tot; ð2Þ
where Ntot is the total number of AE events within
each experiment. Here we use only AE events in
narrow time windows which are most representative
of a given fault stress state. Through the selection of
relatively narrow time windows, we can avoid events
that repeatedly rupture the same fault patch which
may be problematic for reliable estimates of fractal
dimensions (Main 1992). After log-transformation,
the Pair-Correlation-Function in Eq. (2) is approxi-
mately linear between 1 to 10 mm for our datasets,
indicating that the spatial distributions of AEs are
fractal within this distance-range (Henderson and
Main 1992; Main et al. 1992; Main 1992; Wyss et al.
2004). The corresponding correlation dimension, D,
was determined from the linear portion of logarith-
mically-binned Pair-Correlation-Functions, using a
maximum-likelihood estimate and assuming Poisso-
nian uncertainties in C:
C rð Þ ¼ brD; ð3Þ
where b is a constant that depends on the overall
number of events.
The distance, r, in Eq. (3) is bounded by a
minimum (rmin) and a maximum cut-off (rmax) due to
finite event density and finite sample size. The former
is simply a function of the overall point-density
relative to the size of the considered area, i.e.,
rmin * 2 * height * diameter * (1/N)^1/D, where N is
the total number of events and D is the dimension of
the embedding Euclidean space (Kagan 2007). In
practice, this minimum distance approximately coin-
cides with r at C(r) * 2/Ntot2, that is the distance at
which the function is comprised of more than a single
event. More details about the applied methods and
robustness tests including the influence of overall
event number and location uncertainty can be found
in Goebel et al. (2017).
2.2.3 Magnitude Distributions and b-Values
The AE magnitude distribution in our experiments
can commonly be described by an exponential
distribution with an exponent b. This b-value was
determined by using a maximum-likelihood approach
(Aki 1965).
b ¼ 1= �M � Mcð Þ � logðeÞ; ð4Þ
where Mc is the magnitude of completeness, cor-
rected for bin-size (Utsu et al. 1965, Guo and Ogata
1997) and M is the mean magnitude above catalog
completeness. For reliable b-value estimates, we
require distributions to contain at least 150 AE
events. Moreover, Eq. (4) shows that b-value esti-
mates are sensitive to the estimated magnitude of
completeness, Mc. To avoid biases, we use an
objective approach to invert for both Mc and
b through minimizing the misfit between observed
and modeled distributions (Clauset et al. 2009; Goe-
bel et al. 2017).
2.2.4 Seismic Coupling and Localization
In an effort to estimate shear strain on smooth and
rough faults accommodated by seismic events, we
follow Kostrov (1974; Eqs. (3, 10). The mean shear
deformation from N seismic events distributed in a
damage zone volume DV (i.e., Kostrov strain) is
estimated as:
Vol. 177, (2020) Seismic and Aseismic Preparatory Processes 5745

Deij ¼1
2lDV
X
N
x¼1
Mxij; ð5Þ
where l is the shear modulus of Westerly granite
assumed to be 30 GPa. The volume of the damage
zone, DV, was determined by multiplying the ellip-
tical surface area of the laboratory fault by the
thickness of the damage zone, wF. The former can
directly be calculated based on the known sample
dimensions and an angle of 30� between loading axis
and fault surface. The damage zone thickness was
derived from the 5th and 95th percentiles of across-
fault AE event profiles with wF * 4 mm and * 10
mm for saw-cut and rough faults, respectively. We
assume that shear strain estimated from (5) corre-
sponds to the cumulative shear strain from AE events,
cAE, hosted in the fault and damage zone.
The total fault zone shear strain cF was estimated
from the difference between the axial strain ctot and
the local axial strain cloc of the sample. The axial
strain ctot is an extrapolated linear elastic shortening
of the sample and cloc is the local axial strain of the
sample measured by the strain gages. The strain
difference ctot–cloc was converted to fault parallel slip
dF and shear strain cF ¼ dF=wF.
We then estimated the seismic coupling (Scholz
and Campos 2012, McLaskey and Lockner 2014)
during preparatory slip:
v ¼ cAE=cF; ð6Þ
i.e., the ratio of shear strain from AE events, cAE to
total shear strain in the fault zone cF.
3. Results
The data recorded during a series of triaxial
compression tests on 4 samples with rough faults and
smooth saw-cut faults include a series of up to 6
large, system-size stick–slip events (LSE) separated
by loading cycles (Fig. 2). Between the LSE events,
AE activity first drops following an Omori-Law type
decay (Goebel et al. 2012) before loading of the
sample assembly commences again about 20 s after
the LSE stress drop. Here we analyze a selected
number of these slip events from the tested samples
focusing on processes controlling rupture preparation.
3.1. Loading Curves of Sawcut and Rough Faults
The loading curves have distinctly different
shapes for rough and smooth faults (Fig. 2). In
general, rough faults show mostly non-linear stress
strain curves with initial elastic loading up to a yield
point for each cycle. Between yield points at about
85–90% peak stress, rP, and onset of the system-size
slip event at rP, non-linear strain hardening is
frequently interrupted by small, macroscopically
visible slip events (Fig. 2). After several stick–slip
cycles, fewer events with small stress drop are
observed, suggesting that fault roughness decreased.
Peak stress of subsequent stick–slip remains about
constant; however, stress drops tend to increase with
progressive slip events. In contrast, smooth faults
show an extended period of almost linear elastic
loading with minor strain hardening before abrupt
onset of stick–slip failure resulting in LSEs. Defor-
mation along smooth faults did not produce any small
stress drop events as observed for rough faults. A
macroscopic yield point before stress drop is more
difficult to define from the loading curves prior to
large slip events and typically is at[ 90% rP. For
sawcut samples, peak stresses increase markedly with
successive stick-slip cycles and are up to 25% higher
compared to rough faults. Similarly, stress drops of
large slip events on smooth faults are significantly
larger than on rough faults.
Large stress drops of system-size events on rough
faults range from 100 to 150 MPa with average slip
displacements of up to 0.26 mm (Table 1). Stress
drops on smooth faults are up to 300 MPa and almost
twice as large compared to rough faults. The
corresponding slip displacements during individual
events are as large as 0.5 mm. The MTS machine
stiffness kS is 360 MPa/mm but the combined loading
stiffness is lower for both smooth and rough faults
(kL = 250–300 MPa/mm). Macroscopic stress drop
events typically occur with slip rates ranging between
0.02 m/s to 20 lm/s (Goebel et al. 2012).
3.2. AE Activity, Hypocenter Locations and Focal
Mechanisms
During loading between subsequent LSEs along
rough faults, we observe an increase in AE activity
5746 G. Dresen et al. Pure Appl. Geophys.

and the cumulative number of AEs approaching peak
load (Fig. 2). The cumulative number of AEs during
loading to LSE is up to 70 times larger for rough
faults compared to sawcuts, also exceeding the
number of events emitted during a single slip event.
Before the onset of an LSE, the cumulative AE
number increases in all samples but much more
abruptly for smooth faults. With progressive slip
events along rough faults, the increase in AE rate and
cumulative AE number during leading to failure
become less pronounced.
Increasing AE rates on rough faults are punctu-
ated by intermittent bursts of AE activity prior to and
during slip events. This suggests that AE rate and slip
rate are correlated. The bursts in AE activity are
superimposed on the background AE activity during
inter-seismic loading that is increasing towards
failure (Fig. 2). Large bursts in activity are linked
to macroscopic slip events visible in the loading
curve but with no clear relation to magnitudes of the
stress drops (Fig. 2). This indicates that small
episodic slip events preceding system-size failure
produce enhanced AE activity. In contrast, numerous
small AE bursts occurring during inter-seismic load-
ing without noticeable macroscopic stress drops are
linked to small slip events contained in the fault
surface. These events are too small to be resolved by
displacement transducer, strain gages and external
load cell. For sawcut samples, no discernable activity
bursts comparable to those on rough faults are visible,
except those related to large slip events, suggesting
that during loading smooth faults are essentially
locked for most of the inter-slip periods. Noticeable
AE activity starts only very close to peak stress, when
deviations of the stress-time curves from linear
elastic behavior coincide with a rapid increase in
both AE activity and cumulative number of AEs
(Fig. 2), indicating onset of sliding along the fault.
AE hypocenter locations show non-stationary
clusters activated along the fault trace for almost
the entire loading cycle (Fig. 3). The spatial distri-
bution of AE hypocenters clearly depends on fault
roughness (Goebel et al. 2017). AE activity across the
fault forms clusters changing in space and time with
progressive loading, reflecting the change in contact
area across the fault core. AE hypocenters prior to
large slip events are more broadly distributed across
the entire fault for smooth faults, suggesting more
spatially-homogeneous stress compared to rough
Figure 2Differential stress-time plots for (a) rough fault produced by sample fracture of Wgn05 and (b) smooth saw-cut sample Wgc12. Differential
stress is highlighted in black, AE rate in orange and normalized cumulative AE number in green
Vol. 177, (2020) Seismic and Aseismic Preparatory Processes 5747

faults that show clustering of intermediate-size events
reflecting localized asperities (Fig. 3).
The cores of fault zones in the experiments are
surrounded by process or damage zones that form
during initial fault propagation (Zang et al. 2000) and
are reworked during multiple slip episodes. This is
manifested by progressive clustering of events along
the primary fault surface and a peak in event density
distribution centered around the fault core. For
smooth faults we find a narrow damage zone of
about 2–3 mm width, which is of the order of the
location accuracy for AE hypocenters (Fig. 4). In
contrast, the AE event density distribution across
rough faults indicates fault core widths of[ 5–10
mm, with a power-law decay of event density
towards the adjacent wall-rock (Fig. 4; Goebel et al.
2014). The width of the damage zone of rough faults
in sections normal to the fault trace is 2–3 times that
of sawcut faults (Kwiatek et al. 2014b).
However, the distribution of AE events surround-
ing the fault core is not stationary during a stick–slip
cycle. We observe a distinct shift of hypocenter
locations towards the fault core as peak stress is
approached, expressed in a narrowing width of the
fault-normal AE distribution (Fig. 5). During large slip
events, the entire fault zone is activated resulting in a
broad AE distribution. Once inter-slip loading of the
fault restarts, the AE activity shifts from the outer
damage zone towards the fault core with increasing
stress highlighting progressive shear localization along
rough faults prior to the next large slip event (Fig. 5).
We also find that orientations of AE focal
mechanisms show significantly less variability for
smooth faults compared to rough ones (Fig. 6a).
Moreover, the progressive spatial localization of
seismic activity towards the fault core when
approaching failure is characterized by a reduced
variability of fault plane orientations, both for saw-
cuts and rough faults (Fig. 6a). This decrease in
Figure 3Computer-tomographic image of (a) rough fault and (b) sawcut.
Symbols indicate AE hypocenter distribution along faults from a
single slip episode; the estimated location error is ± 2 mm.
Symbols are color-coded according to AE magnitudes. Note that
damage zone in a rough fault is significantly wider compared to
sawcut and fault structure is more complex
Figure 4AE event density from experiments Wgn05 and Wgc12 projected
in a fault-normal section. Rough faults show a wider damage zone
compared to sawcut faults
Figure 5Damage zone half width centered at the fault trace (Wgn05) and
estimated for a sliding time window during loading. During inter-
slip loading, a shift of AE distributions towards the fault core
reveals progressive localization of damage approaching failure
5748 G. Dresen et al. Pure Appl. Geophys.

variability of focal mechanisms with progressive
loading is accompanied by a relative increase in
double-couple components of FMTs (Kwiatek et al.
2014b), which is more clearly visible in the sawcut
sample.
The double-couple components of moment
release rates show a rapid temporal increase, which
may be described by a power-law with an exponent
of * 2. Since the axial displacement is linearly
correlated with time, our observations indicate that
the observed initial increase in moment rates scales
with displacement squared. Prior to stick–slip failure,
sawcut and rough faults show different trends. For
smooth faults the slope decreases. This effect is
visibly pronounced for rough faults for which
moment rates level off prior to failure (Fig. 6b),
suggesting that strain is partitioned progressively into
aseismic deformation.
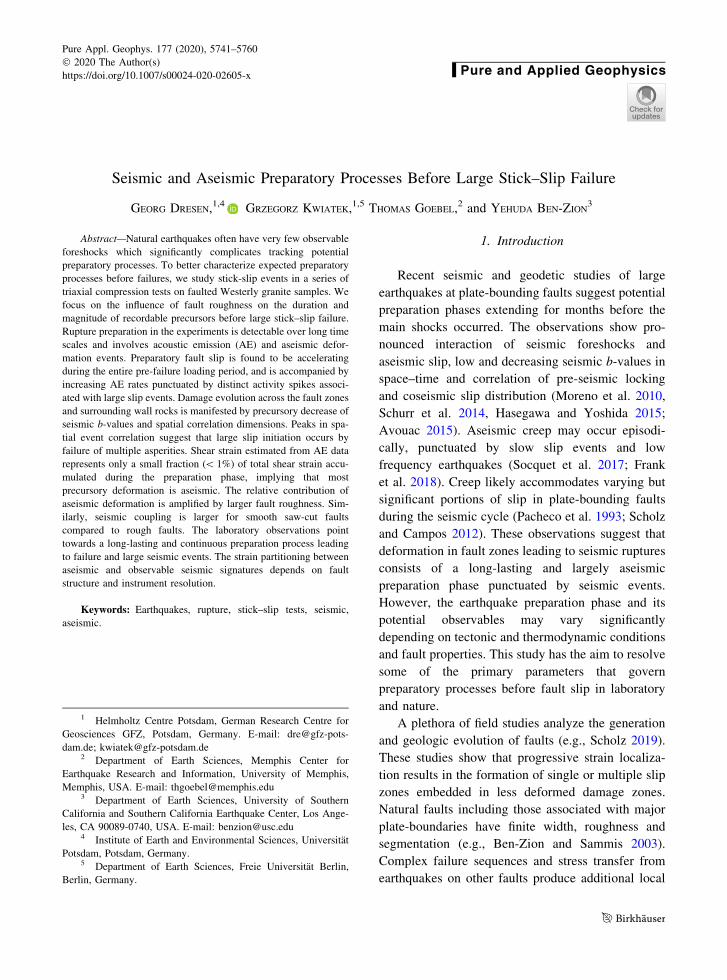
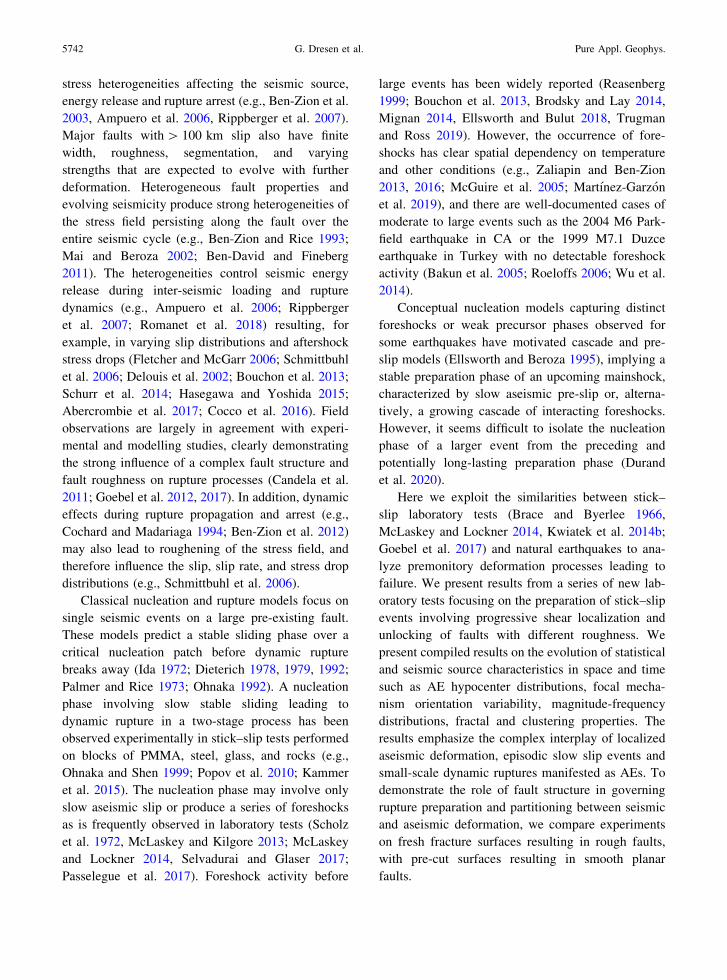
3.3. Changes in AE Magnitude-Frequency
Distributions and Dimensional Parameters D
and C
As has been observed in many previous studies,
AE magnitude-frequency distributions show a pro-
nounced change approaching failure in stick slip
tests. (Fig. 7a; Goebel et al. 2012, 2013, 2017).
Decreasing b-values have been attributed to
increasing local stresses, crack growth and crack
coalescence. Here we emphasize that the observed
changes are a manifestation of progressive shear
localization and are very similar to what has been
observed previously in the formation of shear frac-
tures in intact rocks (Stanchits and Dresen 2003).
In general, b-values decrease towards failure for
both rough and sawcut faults, albeit with different
trends. Changes in b-value during stick–slip cycles on
rough faults involves two different time scales
(Fig. 7a, b) (Goebel et al. 2013). The long-term trend
of decreasing b-values during stress increase is
interrupted by shorter episodes of accelerated b-value
decrease with subsequent recovery. These episodes
occur during inter-seismic loading and seem to be
correlated with bursts in AE activity signaling small
slip episodes that are not recorded by macroscopic
strain measurements.
Changes in fractal dimension, D, suggest space–
time varying clustering of AEs during loading and
large slip. Such changes in D mirror the development
of preferred slip orientations observed in AE focal
mechanisms (Fig. 7c, d). As expected, D values for
most slip events start at a value of about 2, which
reflects AE activity along the localized fault zone,
and then decrease towards failure on rough faults but
less so for sawcuts.
Figure 6(a) Median fault plane variability of AE-derived focal mechanisms shows increasing similarity of focal mechanism towards failure, regardless
of fault roughness. (b) Evolution of AE-derived seismic moment release rates leading-up to failure. The initial slope for all fault types is close
to two (black dashed line) but significant differences between rough and smooth faults are observed closer to failure. For rough faults the
seismic moment levels off and for smooth faults the exponent decreases to about 1 (black solid line)
Vol. 177, (2020) Seismic and Aseismic Preparatory Processes 5749
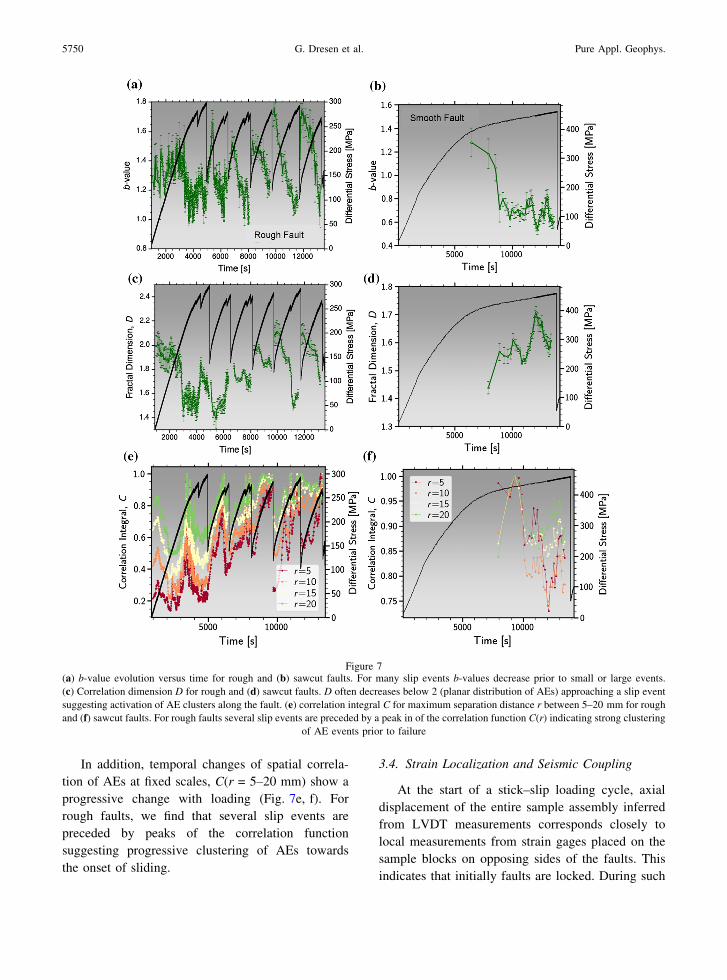
In addition, temporal changes of spatial correla-
tion of AEs at fixed scales, C(r = 5–20 mm) show a
progressive change with loading (Fig. 7e, f). For
rough faults, we find that several slip events are
preceded by peaks of the correlation function
suggesting progressive clustering of AEs towards
the onset of sliding.
3.4. Strain Localization and Seismic Coupling
At the start of a stick–slip loading cycle, axial
displacement of the entire sample assembly inferred
from LVDT measurements corresponds closely to
local measurements from strain gages placed on the
sample blocks on opposing sides of the faults. This
indicates that initially faults are locked. During such
Figure 7(a) b-value evolution versus time for rough and (b) sawcut faults. For many slip events b-values decrease prior to small or large events.
(c) Correlation dimension D for rough and (d) sawcut faults. D often decreases below 2 (planar distribution of AEs) approaching a slip event
suggesting activation of AE clusters along the fault. (e) correlation integral C for maximum separation distance r between 5–20 mm for rough
and (f) sawcut faults. For rough faults several slip events are preceded by a peak in of the correlation function C(r) indicating strong clustering
of AE events prior to failure
5750 G. Dresen et al. Pure Appl. Geophys.

periods of locking the strain gages record linear axial
shortening of the entire sample assembly that is
largely elastic (Figs. 2, 8). When approaching failure,
the strain gage signals differ progressively from
stiffness-corrected LVDT displacement data indicat-
ing a slow and gradual onset of localized sliding
along the fault (Fig. 8). As faults start to slip, a
progressively smaller amount of elastic sample
shortening is accommodated by the opposing fault
blocks. This is also expressed in the loading curves
by a pronounced transition from linear to nonlinear
stress increase at the yield point.
For smooth faults, sliding starts prior to failure at
about 90–95% peak stress, rP, but for rough faults
sliding starts at about 85–90% rP or even earlier
(Fig. 8a, b). This corresponds to the different yield
stresses that are lower for samples containing rough
faults compared to smooth sawcut faults. Differential
stresses at the onset of sliding are typically higher for
smooth faults compared to rough faults, i.e., average
frictional strength and shear traction acting across
rough faults is lower (Fig. 2). Also, peak stresses at
failure are higher for smooth faults at our experi-
mental conditions and stored elastic energy at the
onset of sliding is significantly larger. In rough faults,
shear strain is progressively localized into slip bands
embedded in the damage zone in agreement with the
observed shift in AE activity (Fig. 5). Irrespective of
the progressively localized slip along the fault, load
on the sample assembly and local shear stresses in the
fault zone continue to increase toward peak strength.
In contrast, smooth faults remain locked almost up to
peak stress with only minor premonitory sliding
before large slip events.
At peak stress rP, the seismic coupling v (Eq. 6)
is about 0.01% for rough faults and about 0.1% for
sawcut faults (cyan lines in Fig. 8). This agrees with
significantly larger moment rates produced during
sliding of smooth compared to rough faults (Fig. 6b).
4. Discussion
4.1. Inter-Slip Loading, Failure Preparation
and Foreshocks
Earthquake preparation has been argued to be an
accelerating process involving premonitory slip that
may last for weeks or possibly years before the
mainshock occurs. The preparatory phase may con-
sist of any combination of aseismic transient creep
events, slow slip and tremor events and progressive
foreshock activity (e.g., Jones and Molnar 1979;
Bouchon et al. 2013). Seismic foreshock activity
preceding large earthquakes has long been suggested
a precursor phenomenon potentially useful for earth-
quake forecasting (e.g., Jones and Molnar 1976,1979;
Mignan 2014) but foreshocks prior to a larger
earthquake are also frequently missing. Giulia and
Wiemer (2019) recently suggested that seismic b-
value variations can help to discriminate between
foreshocks and mainshocks. However, as of now,
foreshocks are only defined in retrospect and no
Figure 8Difference (pink shape fill) between strain ctot calculated from
LVDT recordings and from axial strain gages cloc for tested
samples indicating onset of slip along faults during loading beyond
yield stress. Onset of localized sliding occurs at lower stresses for
rough faults (a) compared to sawcut samples (b), which remain
locked almost up to peak stress. Cyan dashed lines indicate seismic
coupling as defined in Eq. (7). Temporal changes in differential
stress and cumulative AE activity are shown as black and green
lines, respectively
Vol. 177, (2020) Seismic and Aseismic Preparatory Processes 5751

unique relationship has been found between fore-
shock signatures and subsequent mainshock
magnitude (Lipiello et al. 2012). This is illustrated
by recent studies of small events detected with
template matching across southern California, high-
lighting that[ 70% of larger earthquakes are
preceded by foreshocks (Trugman and Ross 2019).
However, analyzing the same catalog using an
alternative approach, van den Ende and Ampuero
(2020) identify a significantly smaller fraction (33%)
of these events displaying foreshocks.
It is well established that higher heat flow and
fluid content leads to a larger fraction of foreshocks
in earthquake clusters (e.g., McGuire et al. 2005;
Zaliapin and Ben-Zion 2016). Analytical and numer-
ical results in a viscoelastic damage rheology model
indicate that the effective viscosity of rocks (associ-
ated with the ratio of between a brittle damage
timescale and Maxwell viscous timescale) influences
strongly the form of earthquake clusters and seismic
coupling coefficient (Ben-Zion and Lyakhovsky
2006). In the results of this study and many other
laboratory studies, foreshocks of stick–slip events are
frequently reported (Lei 2003; Goebel et al. 2012;
Selvadurai and Glaser 2015; Passelegue et al. 2017;
Riviere et al. 2018). The detailed results presented in
this work show that foreshock activity, b-value
evolution and premonitory signatures are largely
controlled by fault structure, which in turn determines
stress distribution and affects rupture dynamics in the
fault zone (e.g., Romanet et al. 2018).
Newly fractured specimens with rough surfaces
may be regarded as laboratory equivalents of juvenile
faults with a broad damage zone and small cumula-
tive displacement, in contrast to sawcut samples that
may represent mature faults with low roughness,
localized strain and more homogeneous stress distri-
bution (Goebel et al. 2017). In both cases, loading
produces a nonlinear increase in cumulative AE
number signaling accelerating slip; however, rough
faults show more prominent seismic activity during
the preparation phase of large events. Such an
acceleration of AE activity has also been found
before fracture nucleation in triaxial tests on intact
specimens, (e.g., Lei et al. 2000; Thompson et al.
2005), samples containing joints (Journiaux et al.
2001) and stick–slip friction (Thompson et al. 2009;
Goebel et al. 2012).
The stress at onset of premonitory fault slip
(Fig. 4) corresponds approximately to the yield point
of the loading curves (Fig. 4; McLaskey and Lockner
2014) and is often indicated by increased AE rates. In
our tests, slip along the fault starts once the macro-
scopic yield stress is reached, and for rough faults is
accompanied by progressive shear localization
towards one or more slip bands constituting the fault
zone (Figs. 2, 4). Evolution of rough faults involves
formation of anastomosing shear bands within a
broader damage zone similar to process or damage
zones surrounding incipient faults propagating
through intact rock (Zang et al. 2000; Lennartz-
Sassinek et al. 2014). Damage zone width of rough
faults significantly exceeds damage surrounding
narrow sawcut faults (Fig. 4). The decay of crack,
AE and fracture density with distance to the fault core
observed in lab tests on intact and faulted samples
(Goebel et al. 2014) was also reported in field studies
of faults with a wide range of fault lengths and
displacements (e.g., Scholz et al. 1993; Vermilye and
Scholz 1998; Mitchell and Faulkner 2009; Savage
and Brodsky 2011) and in numerical modelling of
off-fault damage (Xu et al. 2012; Johri et al. 2014). In
these studies, the decay in crack and fracture density
has been inferred to follow a power-law, logarithmic
or exponential trend.
Increasing localized shear strain in slip bands is
also indicated by progressive concentration of AE
hypocenters along the fault trace (Figs. 4, 5). Ben-
Zion and Zaliapin (2020) recently showed several
cases where prior to large earthquakes seismicity
tended to localize into narrower fault zones and also
coalesce into larger clusters. Regardless of fault
roughness we also found increasing homogeneity of
fault planes from AE focal mechanisms approaching
failure (Fig. 6a). In general, rough faults display
larger fault plane variability compared to smooth
faults. It is conceivable that fault plane variability
may serve as a proxy for fault roughness at seismo-
genic depth.
Cumulative event number, seismic moment rate
and shear strain evolution all follow a power-law
indicative of an accelerating run-away process with
total slip rate evolving as:
5752 G. Dresen et al. Pure Appl. Geophys.

_D tð Þ ¼ _D 0ð Þ � Bn; ð7Þ
Where _DðtÞ, _Dð0Þ are slip rate and initial slip rate,
respectively. B is a non-dimensional loading param-
eter characterizing, for example, local stress
evolution and n is a constant, depending on fault
topography, effective confining pressure and fault
constitutive behavior. This form of avalanching
damage accumulation towards failure signaled by
seismic activity is commonly observed in brittle
fracture experiments (Girard et al. 2010; Renard et al.
2018) and has often been reported preceding some
earthquakes (Mignan 2011).
For rough and sawcut samples, we find a clear
trend of decreasing b-values as stick–slip failure is
approached (Fig. 7a, b). This is in agreement with
numerus previous experimental studies of brittle
fracture (e.g., Scholz 1968; Main et al. 1989; Lei
et al. 2000; Thompson et al. 2005) and frictional
sliding (Goebel et al. 2013; Riviere et al. 2018).
Fluctuation of b-values have also been observed prior
to large earthquakes (Smith 1981). A significant b-
value decrease has been reported to precede the large
2014 Iquique and the 2011 Tohoku earthquakes
(Nanjo et al. 2012, Schurr et al. 2014) and more
recently the 2020, MW = 6.4 event in Puerto Rico
(Dascher-Cousineau et al. 2020).
The striking observation is that b-values consis-
tently start decreasing with progressive shear
localization (Goebel et al. 2017) well before labora-
tory failure finally occurs suggesting growth and
coalescence of microcracks that finally lead to
macroscopic slip events. This process may be anal-
ogous to what has been proposed for faulting in intact
brittle rocks due to clustering of interacting micro-
cracks defining a fault nucleation patch (Reches and
Lockner 1994; Reches 1999). The change of b-values
approaching failure has been related inversely to
global and local stress changes and progressive
evolution of crack damage (Scholz 1968; Main
et al. 1989; Goebel et al. 2013). This evolution starts
approximately with the onset of shearing along fault
and damage zone or even before, suggesting that the
preparation process of an upcoming slip events is
long-lasting and may even involve the final afterslip
phase of the preceding slip event.
In stick–slip tests, b-values typically recover and
increase significantly after failure (Goebel et al. 2013;
Fig. 7a). Recently, Gulia and Wiemer (2019) sug-
gested to estimate temporal trends in b-value before
(b-value decrease) and after (b-value increase) large
events to potentially identify foreshocks in real time.
However, temporal changes of b-values as observed
from foreshock-mainshock sequences observed in the
field remain difficult to interpret (Dascher-Cousineau
et al. 2020; Gulia et al. 2020).
4.2. Asperity Failure and Yield Stress
Our experiments have been performed on Wes-
terly granite samples at room temperature. Direct
observation of post-mortem microstructures and AE
activity indicate that deformation in the samples is
accommodated entirely by brittle processes, i.e., the
formation and coalescence of microcracks, grain
comminution and granular flow govern inter-slip
loading periods and slip events. However, only a
small fraction of the total deformation is accommo-
dated by slip generating high-frequency acoustic
events with frequencies[ 100 KHz. Aseismic defor-
mation is accommodated by lower frequency (slow)
slip possibly assisted by brittle creep.
Our observations indicate that nucleation of
unstable large slip events along rough faults is linked
to a failure process of individual asperities by
evolving crack damage similar to processes leading
to fracture of intact specimen (Lockner et al. 1991,
Reches 1999; Lei 2003; Thompson et al. 2009;
Renard et al. 2018). However, for sawcut faults,
dominant asperities are difficult to identify based on
visual inspection alone and may rather be expressed
by patches of clustered AE activity. It is conceivable
that debris produced during slip events in smooth
sawcut faults introduces non-stationary local gouge
patches with different frictional properties that may
serve as asperities. For fresh fractured faults, Goebel
et al. (2012) found that roughness produces hetero-
geneous AE distribution across the fault. Rough
faults display undulating and anastomosing slip
surfaces enclosing ellipsoidal fragments that may
represent larger asperities contained in the fault zone
(Fig. 4).
Vol. 177, (2020) Seismic and Aseismic Preparatory Processes 5753

Yabe et al. (2003) suggested a bi-modal contact
model with small asperities on the grain-scale or
below and larger long-wavelength asperities consist-
ing of multiple grains. Rupture of grain-scale
asperities may produce single or clustered AEs as
opposed to the rupture of larger asperities along
rough faults that may be linked to AE bursts and b-
value drops. This is in agreement with observations
of Goebel et al. (2012) as well as AE foreshock
distribution and activity patches observed here pre-
ceding slip events.
4.2.1 Failure of Grain-Scale Asperities
Loading of rough faults yields AE activity at
differential stresses well below the macroscopic yield
stress. Assuming that some AE events during loading
result from formation and propagation of microcracks
through grain-scale asperities exposed in the fault
(Yabe et al. 2003), we may estimate the average shear
stress at failure of a single asperity rcrA with radius r
embedded in a low-stress environment (Sammis and
Rice 2001):
rcrA ¼ 1:1KIC
�
ffiffi
rp ; ð8Þ
where KIC is the critical stress intensity factor of
Westerly granite. Assuming KIC = 1 MPa m0.5
(Atkinson and Meredith 1987), and r scaling with
average grainsize a = 750 lm, we estimate the shear
stresses required for onset of AE activity of about
40 MPa or less. This agrees with our observation on
rough faults where minor AE activity already starts at
shear stresses\ 50 MPa and differential stresses\100 MPa (Fig. 2).
4.2.2 Yield Stress and Failure of Larger Asperities
in Rough Faults
Slip along the faults starts at yield stress i.e., once
stresses operating in wall rock and the fault reach a
critical level. At this critical stress, slip initiates when
larger asperities are fractured by microcracking and
sliding occurs along preexisting defects such as grain
contacts and grain boundaries. Similar to observa-
tions from intact rock failure, the formation of
microcracks under elevated confining pressures is
expected to involve initiation and propagation of
wing cracks (e.g., Brace and Bombolakis 1963;
Ashby and Hallam 1986). Crack initiation and crack
propagation have previously been correlated with the
yield point of intact samples, i.e., the departure from
approximate linearity of the loading curve of intact
samples. Yielding and the onset of dilatant cracking
are expected to occur once a critical stress level is
reached (Ashby and Sammis 1990):
r1 ¼ r3
1 þ l2ð Þ0:5 þl
1 þ l2ð Þ0:5�l�
p3
1 þ l2ð Þ0:5�l
KIcppc
: ð9Þ
Here l is static friction coefficient, KIC is critical
stress intensity factor of Westerly granite and 2c is
initial crack length. Assuming KIC = 1 MPa�m0.5
(Atkinson and Meredith 1987), l = 0.6, c = 750 lm,
we find that yield stresses for a faulted sample to range
between 200 and 250 MPa. These values represent
upper bounds for the onset of failure of larger asperities
in a faulted and fully locked specimen, in good
agreement with our experimental observations.
4.3. Strain Partitioning, Seismic Coupling
and Aseismic Slip Close to Failure
Preparatory slip along rough faults initiates at
lower stresses compared to peak stress on sawcuts.
This may be due to average contact area Ar of rough
surfaces being smaller compared to sawcut faults and
average shear stress r acting on asperity contact areas
therefore being higher. The average stress rA across
contact areas (asperities) of a fault may be expressed
as (Jones and Molnar 1979):
rA ¼ r0A0=Ar; ð10Þ
where r0 is the remote stress acting across the fault
and A0 is the fault area. Assuming that the critical
stress across asperities required for onset of sliding
only depends on the material and damage state, the
critical stress is expected to increase as contact area
Ar gets larger due to a decrease in roughness and/or
increase in confining pressure (Ohnaka 2004; Sel-
vadurai and Glaser 2015). This is in agreement with
our observation of the yield stress being higher for
sawcut faults.
Seismic moment release rates preceding failure
and during rupture differ considerably between
5754 G. Dresen et al. Pure Appl. Geophys.
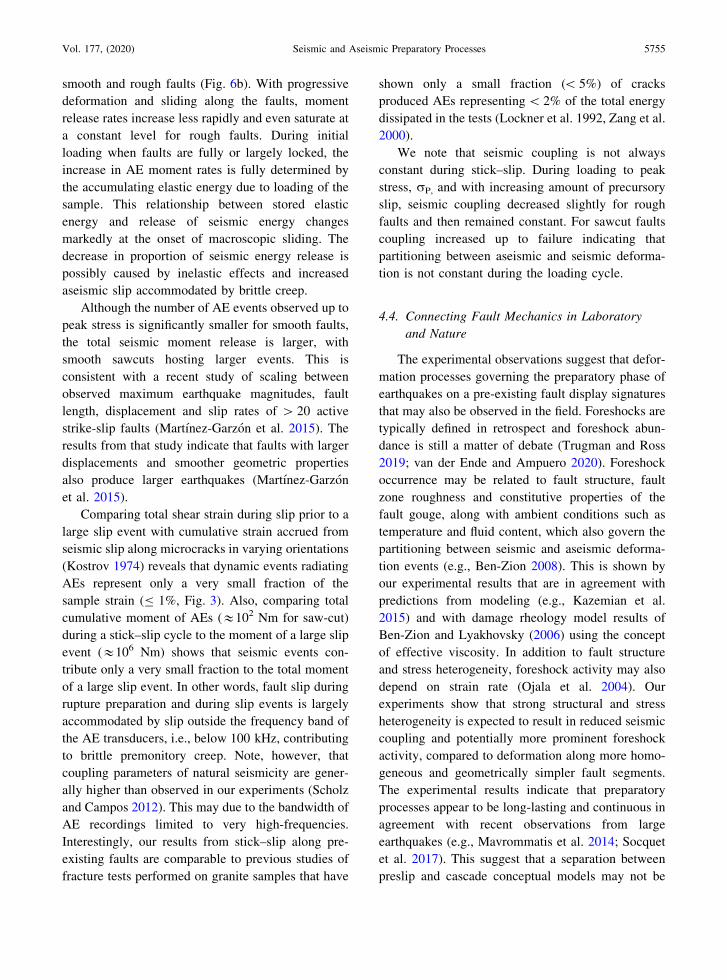
smooth and rough faults (Fig. 6b). With progressive
deformation and sliding along the faults, moment
release rates increase less rapidly and even saturate at
a constant level for rough faults. During initial
loading when faults are fully or largely locked, the
increase in AE moment rates is fully determined by
the accumulating elastic energy due to loading of the
sample. This relationship between stored elastic
energy and release of seismic energy changes
markedly at the onset of macroscopic sliding. The
decrease in proportion of seismic energy release is
possibly caused by inelastic effects and increased
aseismic slip accommodated by brittle creep.
Although the number of AE events observed up to
peak stress is significantly smaller for smooth faults,
the total seismic moment release is larger, with
smooth sawcuts hosting larger events. This is
consistent with a recent study of scaling between
observed maximum earthquake magnitudes, fault
length, displacement and slip rates of [ 20 active
strike-slip faults (Martınez-Garzon et al. 2015). The
results from that study indicate that faults with larger
displacements and smoother geometric properties
also produce larger earthquakes (Martınez-Garzon
et al. 2015).
Comparing total shear strain during slip prior to a
large slip event with cumulative strain accrued from
seismic slip along microcracks in varying orientations
(Kostrov 1974) reveals that dynamic events radiating
AEs represent only a very small fraction of the
sample strain (B 1%, Fig. 3). Also, comparing total
cumulative moment of AEs (&102 Nm for saw-cut)
during a stick–slip cycle to the moment of a large slip
event (&106 Nm) shows that seismic events con-
tribute only a very small fraction to the total moment
of a large slip event. In other words, fault slip during
rupture preparation and during slip events is largely
accommodated by slip outside the frequency band of
the AE transducers, i.e., below 100 kHz, contributing
to brittle premonitory creep. Note, however, that
coupling parameters of natural seismicity are gener-
ally higher than observed in our experiments (Scholz
and Campos 2012). This may due to the bandwidth of
AE recordings limited to very high-frequencies.
Interestingly, our results from stick–slip along pre-
existing faults are comparable to previous studies of
fracture tests performed on granite samples that have
shown only a small fraction (\ 5%) of cracks
produced AEs representing\ 2% of the total energy
dissipated in the tests (Lockner et al. 1992, Zang et al.
2000).
We note that seismic coupling is not always
constant during stick–slip. During loading to peak
stress, rP, and with increasing amount of precursory
slip, seismic coupling decreased slightly for rough
faults and then remained constant. For sawcut faults
coupling increased up to failure indicating that
partitioning between aseismic and seismic deforma-
tion is not constant during the loading cycle.
4.4. Connecting Fault Mechanics in Laboratory
and Nature
The experimental observations suggest that defor-
mation processes governing the preparatory phase of
earthquakes on a pre-existing fault display signatures
that may also be observed in the field. Foreshocks are
typically defined in retrospect and foreshock abun-
dance is still a matter of debate (Trugman and Ross
2019; van der Ende and Ampuero 2020). Foreshock
occurrence may be related to fault structure, fault
zone roughness and constitutive properties of the
fault gouge, along with ambient conditions such as
temperature and fluid content, which also govern the
partitioning between seismic and aseismic deforma-
tion events (e.g., Ben-Zion 2008). This is shown by
our experimental results that are in agreement with
predictions from modeling (e.g., Kazemian et al.
2015) and with damage rheology model results of
Ben-Zion and Lyakhovsky (2006) using the concept
of effective viscosity. In addition to fault structure
and stress heterogeneity, foreshock activity may also
depend on strain rate (Ojala et al. 2004). Our
experiments show that strong structural and stress
heterogeneity is expected to result in reduced seismic
coupling and potentially more prominent foreshock
activity, compared to deformation along more homo-
geneous and geometrically simpler fault segments.
The experimental results indicate that preparatory
processes appear to be long-lasting and continuous in
agreement with recent observations from large
earthquakes (e.g., Mavrommatis et al. 2014; Socquet
et al. 2017). This suggest that a separation between
preslip and cascade conceptual models may not be
Vol. 177, (2020) Seismic and Aseismic Preparatory Processes 5755

warranted as both, aseismic and seismic processes are
involved in shear deformation leading to failure.
However, their respective contributions may vary
significantly depending of fault structure and consti-
tutive properties of the fault zone material.
We note that generation of large earthquakes
involves generally also localization of deformation
onto the main rupture zones (e.g., Lyakhovsky et al.
2001; McBeck et al. 2020; Ben-Zion and Zaliapin
2020). Progressive healing of faulted materials during
long inter-seismic periods (e.g., Reches 1999; Muhuri
et al. 2003; Aben et al. 2017; Pei et al. 2019) requires
some form of re-localization onto pre-existing faults
before subsequent large earthquakes (e.g., Ben-Zion
and Zaliapin 2020). Detailed analysis of localization
processes in our AE data is deferred to a future work.
5. Conclusions
We analyzed the rupture preparation process of
stick slip events in a series of triaxial tests performed
on Westerly granite samples with rough and smooth
fault surfaces. Rupture preparation is a long-lasting
process involving progressive decoupling and slip
accommodated by seismic and aseismic shear.
Preparatory fault slip is accelerating over the entire
inter-slip loading periods and is accompanied by
seismic (AE) activity. Increasing rates of AE are
punctuated by distinct peaks associated with rela-
tively large slip events. Damage evolution along the
faults and surrounding wall rocks is tracked by pre-
cursory decrease of seismic b-values and correlation
dimension, and peaks in spatial event correlation,
suggesting that nucleation of large slip events and
propagation occurs by failure of multiple asperities.
Shear strain estimated from AEs represents only a
small fraction (\ 1%) of total shear strain accumu-
lated during the slip preparation phase and during a
system-size slip event. Seismic coupling is larger for
sawcut faults compared to rough faults and decreases
for both fault types towards failure, with rough faults
showing a more pronounced contribution of aseismic
deformation leading up to failure.
Acknowledgments
We thank reviewers Ian Main and Art McGarr for
their constructive comments that helped to improve
the manuscript, Stefan Gehrmann for sample prepa-
ration and Michael Naumann for technical support at
GFZ-Potsdam. GK acknowledges support from the
Deutsche Forschungsgemeinschaft (DFG), Grant KW
84/4-1 T. Goebel and Y. Ben-Zion were supported by
GFZ and the German Alexander von Humboldt
Foundation during several visits to GFZ
Author contributions All authors contributed to the study.
Material preparation, data collection and analysis were
performed by all authors. The first draft of the manuscript
was written by GD and all authors commented on previous
versions of the manuscript. All authors read and approved the
final manuscript.
Funding
Open Access funding enabled and organized by
Projekt DEAL. GD acknowledges support from GFZ.
Compliance with ethical standards
Conflict of interest Not relevant.
Availability of data and material All experimental data is
available from the authors.
Code availability Not relevant.
Open Access This article is licensed under a Creative Com-
mons Attribution 4.0 International License, which permits use,
sharing, adaptation, distribution and reproduction in any
medium or format, as long as you give appropriate credit to the
original author(s) and the source, provide a link to the Creative
Commons licence, and indicate if changes were made. The
images or other third party material in this article are included
in the article’s Creative Commons licence, unless indicated
otherwise in a credit line to the material. If material is not
included in the article’s Creative Commons licence and your
intended use is not permitted by statutory regulation or exceeds
the permitted use, you will need to obtain permission directly
from the copyright holder. To view a copy of this licence, visit
http://creativecommons.org/licenses/by/4.0/.
Publisher’s Note Springer Nature remains neutral
with regard to jurisdictional claims in published maps
and institutional affiliations.
5756 G. Dresen et al. Pure Appl. Geophys.

REFERENCES
Aben, F. M., Doan, M. L., Gratier, J. P., & Renard, F. (2017).
Experimental postseismic recovery of fractured rocks assisted by
calcite sealing. Geophysical Research Letters, 44, 7228–7238.
Abercrombie, R. E., Bannister, S., Ristau, J., & Doser, D. (2017).
Variability of earthquake stress drop in a subduction setting, the
Hikurangi Margin, New Zealand. Geophysical Journal Interna-
tional, 208, 306–320. https://doi.org/10.1093/gji/ggw393
Aki, K. (1965). Maximum likelihood estimate of b in the formula
log N = a - bM and its confidence limits. Bulletin of the
Earthquake Research Institute of Tokyo University, 43, 237–239.
Ampuero, J.-P., Rippberger, J., & Mai, P. M. (2006). Properties of
dynamic earthquake ruptures with heterogeneous stress drop. In
R. Abercrombie, A. McGarr, G. Di Toro, G. & H. Kanamori
(Eds.), Earthquakes: Radiated energy and the physics of faulting.
https://doi.org/10.1029/170GM25
Ashby, M. F., & Hallam, S. D. (1986). The failure of brittle solids
containing small cracks under compressive stress states. Acta
Metallurgica, 34, 497–510.
Ashby, M. F., & Sammis, C. G. (1990). The damage mechanics of
brittle solids in compression. Pure and Applied Geophysics, 33,
489–521.
Avouac, J.-P. (2015). From geodetic imaging of seismic and
aseismic fault slip to dynamic modeling of the seismic cycle.
Annual Review of Earth and Planetary Sciences, 43, 233–271.
Bakun, W. H., et al. (2005). Implications for prediction and hazard
assessment from the 2004 Parkfield earthquake. Nature, 437,
969–974. https://doi.org/10.1038/nature04067
Ben Zion, Y., & Sammis, C. (2003). Characterization of fault
zones. Pure Applied Geophysical, 160, 677–715. https://doi.org/
10.1007/PL00012554
Ben-David, O., & Fineberg, J. (2011). Static friction coefficient is
not a material constant. Physical Review Letters, 106, 254301.
https://doi.org/10.1103/PhysRevLett.106.254301
Ben-Zion, Y. (2008). Collective behavior of earthquakes and faults:
Continuum-discrete transitions, evolutionary changes and corre-
sponding dynamic regimes. Reviews of Geophysics, 46. https://
doi.org/10.1029/2008RG000260
Ben-Zion, Y., & Lyakhovsky, V. (2006). Analysis of aftershocks in
a lithospheric model with seismogenic zone governed by damage
rheology. Geophysical Journal International, 165, 197–210.
https://doi.org/10.1111/j.1365-246X.2006.02878.x
Ben-Zion, Y., & Rice, J. R. (1993). Earthquake failure sequences
along a cellular fault zone in a three-dimensional elastic solid
containing asperity and nonasperity regions. Journal of Geo-
physical Research, 98, 14109–14131.
Ben-Zion, Y., Rockwell, T., Shi, Z., & Xu, S. (2012). Reversed-
polarity secondary deformation structures near fault stepovers.
Journal of Applied Mechanics, 79, 031025. https://doi.org/10.
1115/1.4006154
Ben-Zion, Y., Eneva, M., & Liu, Y. (2003). Large earthquake
cycles and intermittent criticality on heterogeneous faults due to
evolving stress and seismicity. Journal of Geophysical
Research,. https://doi.org/10.1029/2002JB002121.
Ben-Zion, Y., & Zaliapin, I. (2020). Localization and coalescence
of seismicity before large earthquakes. Geophysical Journal
International, 223, 561–583. https://doi.org/10.1093/gji/ggaa315
Bouchon, M., Durand, V., Marsan, D., Karabulut, H., & Schmit-
tbuhl, J. (2013). The long precursory phase of most large
interplate earthquakes. Nature Geoscience, 6, 299–302. https://
doi.org/10.1038/NGEO1770
Brace, W. F., & Bombolakis, E. G. (1963). A note on brittle crack
growth in compression. Journal of Geophysical Research, 68,
3709–3713.
Brace, W. F., & Byerlee, J. D. (1966). Stick–slip as a mechanism
for earthquakes. Science, 153, 990–992.
Brodsky, E. E., & Lay, T. (2014). Recognizing foreshocks from the
1 April 2014 Chile Earthquake. Science, 344, 700–702.
Candela, T., Renard, F., Bouchon, M., Schmittbuhl, J., & Brodsky,
E. E. (2011). Stress drop during earthquakes: Effect of fault
roughness scaling. Bulletin of the Seismological Society of
America, 101, 2369–2387. https://doi.org/10.1785/0120100298
Clauset, A., Shalizi, C. R., & Newmann, M. E. J. (2009). Power-
law distributions in empirical data. SIAM Review, 51(4),
661–703.
Cocco, M., Tinti, E., & Cirella, A. (2016). On the scale dependence
of earthquake stress drop. Journal of Seismology, 20, 1151–1170.
https://doi.org/10.1007/s10950-016-9594-4
Cochard, A., & Madariaga, R. (1994). Dynamic faulting under rate-
dependent friction. Pure Applied Geophysical, 142, 419–445.
https://doi.org/10.1007/BF00876049
Dascher-Cousineau, K., Lay, T., & Brodsky, E. E. (2020). Two
foreshock sequences post Gulia and Wiemer (2019). Seismo-
logical Research Letters, 91, 2843–2850. https://doi.org/10.1785/
0220200082
Delouis, B., Giardini, D., Lundgren, P., & Salichon, J. (2002). Joint
inversion of InSAR, GPS, teleseismic, and strong-motion data for
the spatial and temporal distribution of earthquake slip: Appli-
cation to the 1999 Izmit Mainshock. Bulletin of the Seismological
Society of America, 92(1), 278–299.
Dieterich, J. H. (1978). Preseismic fault slip and earthquake pre-
diction. Journal of Geophysical Research, 83, 3940–3948.
Dieterich, J. H. (1979). Modeling of rock friction, 2. Simulation of
preseismic slip. Journal of Geophysical Research, 84,
2169–2175.
Dieterich, J. H. (1992). Earthquake nucleation on faults with rate-
and state-dependent strength. Tectonophysics, 211, 115–134.
https://doi.org/10.1016/0040-1951(92)90055-B
Durand, V., Bentz, S., Kwiatek, G., Dresen, G., Wollin, C., Hei-
dbach, O., et al. (2020). A two-scale preparation phase preceded
an M w 5.8 earthquake in the Sea of Marmara Offshore Istanbul,
Turkey. Seismological Research Letters. https://doi.org/10.1785/
0220200110.
Ellsworth, W. L., & Beroza, G. C. (1995). Seismic evidence for an
earthquake nucleation phase. Science, 268, 851–855.
Ellsworth, W. L., & Bulut, F. (2018). Nucleation of the 1999 Izmit
earthquake by a triggered cascade of foreshocks. Nature Geo-
science. https://doi.org/10.1038/s41561-018-0145-1.org/10.1038/
s41561-018-0145-1
Fletcher, J. B., & McGarr, A. (2006). Distribution of stress drop,
stiffness, and fracture energy over earthquake rupture zones.
Journal of Geophysical Research, 111. https://doi.org/10.1029/
2004JB003396
Frank, W., Rousset, B., Lasserre, C., & Campillo, M. (2018).
Revealing the cluster of slow transients behind a large slow slip
event. Science Advances, 4. https://doi.org/10.1126/sciadv.
aat0661
Girard, L., Amitrano, D., & Weiss, J. (2010). Failure as a critical
phenomenon in a progressive damage model. Journal of
Vol. 177, (2020) Seismic and Aseismic Preparatory Processes 5757
Statistical Mechanics. https://doi.org/10.1088/1742-5468/2010/
01/P01013
Goebel, T.H.W., Becker, T.W., Schorlemmer, D., Stanchits, S.,
Sammis, C., Rybacki, E., and Dresen, G. (2012). Identifying fault
heterogeneity through mapping spatial anomalies in acoustic
emission statistics. Journal of Geophysical Research. 117.
https://doi.org/10.1029/2011JB008763
Goebel, T. H. W., Candela, T., Sammis, C. G., Becker, T. W.,
Dresen, G., & Schorlemmer, D. (2014). Seismic event distribu-
tions and off-fault damage during frictional sliding of saw-cut
surfaces with pre-defined roughness. Geophysical Journal
International, 196(1), 612–625. https://doi.org/10.1093/gji/
ggt401
Goebel, T. H. W., Kwiatek, G., Becker, T. W., Brodsky, E. E., &
Dresen, G. (2017). What allows seismic events to grow big?:
Insights from b-value and fault roughness analysis in laboratory
stick–slip experiments. Geology, 45(9), 815–818. https://doi.org/
10.1130/G39147.1
Goebel, T. H. W., Schorlemmer, D., Becker, T. W., Dresen, G., &
Sammis, C. G. (2013). Acoustic emissions document stress
changes over many seismic cycles in stick–slip experiments.
Geophysical Research Letters, 40, 2049–2054. https://doi.org/10.
1002/grl.50507
Grassberger, P. (1983). Generalized dimensions of strange attrac-
tors. Physics Letters A, 97(6), 227–230.
Gulia, L., & Wiemer, S. (2019). Real-time discrimination of
earthquake foreshocks and aftershocks. Nature, 574, 193–199.
https://doi.org/10.1038/s41586-019-1606-4
Gulia, L., Wiemer, S., & Vannucci, G. (2020). Prospective eval-
uation of the foreshock traffic light system in Ridgecrest and
implications for aftershock hazard assessment. Seismol:
Research Letters. https://doi.org/10.1785/0220190307
Guo, Z., & Ogata, Y. (1997). Statistical relations between the
parameters of aftershocks in time, space, and magnitude. Journal
of Geophysical Research, 102(B2), 2857–2873.
Hanks, T. C., & Kanamori, H. (1979). A moment magnitude scale.
Journal of Geophysical Research, 84, 2348–2350.
Hasegawa, A. & Yoshida, K. (2015). Preceding seismic activity
and slow slip events in the source area of the 2011 Mw 9.0
Tohoku-Oki earthquake: a review. Geoscience Letters. 2. https://
doi.org/10.1186/s40562-015-0025-0
Henderson, J., & Main, I. (1992). A simple fracture-mechanical
model for the evolution of seismicity. Geophysical Research
Letters, 19(4), 365–368.
Ida, Y. (1972). Cohesive force across the tip of a longitudinal-shear
crackand Griffith’s specific surface energy. Journal of Geo-
physical Research, 77, 3796–3805.
Johri, M., Dunham, E. M., Zoback, M. D., & Fang, Z. (2014).
Predicting fault damage zones by modeling dynamic rupture
propagation and comparison with field observations, Journal of
Geophysical Research Solid Earth, 119. https://doi.org/10.1002/
2013JB010335
Jones, L., & Molnar, P. (1976). Frequency of foreshocks. Nature,
262, 677–679.
Jones, L., & Molnar, P. (1979). Some characteristics of foreshocks
and their possible relationship to earthquake prediction and
premonitory slip on faults. Journal of Geophysical Research, 84,
3596–3608.
Journiaux, L., Masuda, K., Lei, X., Kusunose, K., Liu, L., & Ma,
W. (2001). Comparison of the microfracture localization in
granite betweenfracturation and slip of a preexisting macroscopic
healed joint by acoustic emission measurements. Journal of
Geophysical Research, 106, 8687–8698.
Kagan, Y. Y. (2007). Earthquake spatial distribution: The corre-
lation dimension. Geophysical Journal International, 168(3),
1175–1194. https://doi.org/10.1111/j.1365-246X.2006.03251.x
Kagan, Y. Y., & Knopoff, L. (1980). Spatial distribution of
earthquakes: The two-point correlation function. Geophysical
Journal International, 62(2), 303–320. https://doi.org/10.1111/j.
1365-246X.1980.tb04857.x
Kammer, D. S., Radiguet, M., Ampuero, J. P., & Molinari, J. F.
(2015). Linear elastic fracture mechanics predicts the propaga-
tion distance of frictional slip. Tribology Letters, 57, 23. https://
doi.org/10.1007/s11249-014-0451-8
Kazemian, J., Tiampo, K. F., Klein, W., & Dominguez, R. (2015).
Foreshock and aftershocks in simple earthquake models. Physi-
cal Review Letters, 114, 088501. https://doi.org/10.1103/
PhysRevLett.114.088501
Kostrov, V. (1974). Seismic moment and energy of earthquakes
and seismic flow of rock. Earth Physics, 1, 23–40.
Kwiatek, G., Charalampidou, E. M., & Dresen, G. (2014a). An
improved method for seismic moment tensor inversion of
acoustic emissions through assessment of sensor coupling and
sensitivity to incidence angle. International Journal of Rock
Mechanics and Mining Sciences, 65, 153–161. https://doi.org/10.
1016/j.ijrmms.2013.11.005
Kwiatek, G., Goebel, T. H. W., & Dresen, G. (2014b). Seismic
moment tensor and b value variations over successive seismic
cycles in laboratory stick–slip experiments. Geophysical
Research Letters, 41, 5838–5846. https://doi.org/10.1002/
2014GL060159
Kwiatek, G., Martınez-Garzon, P., & Bohnhoff, M. (2016).
HybridMT: A MATLAB/Shell environment package for seismic
moment tensor inversion and refinement. Seismological Research
Letters, 87, 964–976. https://doi.org/10.1785/0220150251
Lei, X. (2003). How do asperities fracture? An experimental study
of unbroken asperities. Earth and Planetary Science Letters, 213,
347–359.
Lei, X., Kusunose, K., Nishizawa, O., Cho, A., & Satoh, T. (2000).
On the spatio-temporal distribution of acoustic emissions in two
granitic rocks under triaxial compression:the role of pre-existing
cracks. Geophysical Research Letters, 27, 1997–2000.
Lennartz-Sassinek, S., Main, I. G., Zaiser, M., & Graham, C. C.
(2014). Acceleration and localization of subcritical crack growth
in a natural composite material. Physical Review E, 90, 052401.
https://doi.org/10.1103/PhysRevE.90.052401
Lippiello, E., Marzocchi, W., de Arcangelis, L., & Godano, C.
(2012). Spatial organization of foreshocks as a tool to forecast
large earthquakes. Scientific Reports. https://doi.org/10.1038/
srep00846
Lyakhovsky, V., Ben-Zion, Y., & Agnon, A. (2001). Earthquake
cycle, fault zones, and seismicity patterns in a rheologically
layered lithosphere. Journal of Geophysical Research, 106,
4103–4120.
Mai, P. M., & Beroza, G. C. (2002). A spatial random field model
to characterize complexity in earthquake fields. Journal of
Geophysical Research, 107, 2308. https://doi.org/10.1029/
2001JB000588
Main, I. G. (1992). Damage mechanics with long-range interac-
tions: Correlation between the seismic b-value and the fractal
two-point correlation dimension. Geophysical Journal
5758 G. Dresen et al. Pure Appl. Geophys.

International, 111(3), 531–541. https://doi.org/10.1111/j.1365-
246X.1992.tb02110.x
Main, I. G., Meredith, P. G., & Jones, C. (1989). A reinterpretation
of the precursory seismic b-value anomaly using fracture
mechanics. Geophysical Journal, 96, 131–138.
Main, I. G., Meredith, P. G., & Sammonds, P. R. (1992). Temporal
variations in seismic event rate and b-values from stress corro-
sion constitutive laws. Tectonophysics, 211, 233–246.
Martınez-Garzon, P., Ben-Zion, Y., Zaliapin I., & Bohnhoff, M.
(2019). Seismic clustering in the Sea of Marmara: Implications
for monitoring earthquake processes, Tectonophysics, 768.
https://doi.org/10.1016/j.tecto.2019.228176
Martınez-Garzon, P., Bohnhoff, M., Ben-Zion, Y., & Dresen, G.
(2015). Scaling of maximum observed magnitudes with geo-
metrical and stress properties of strike–slip faults. Geophysical
Research Letters, 42, 10230–10238. https://doi.org/10.1002/
2015GL066478
Mavrommatis, A. P., Segall, P., & Johnson, K. M. (2014). A
decadal-scale deformation transient prior to the 2011 Mw 9.0
Tohoku-oki earthquake. Geophysical Research Letters, 41,
4486–4494. https://doi.org/10.1002/2014GL060139
McBeck, J., Ben-Zion, Y., & Renard, F. (2020). The mixology of
precursory strain partitioning approaching brittle failure in rocks.
Geophysical Journal International., 221, 1856–1872. https://doi.
org/10.1093/gji/ggaa121
McGuire, J. J., Boettcher, M. S., & Jordan, T. H. (2005). Foreshock
sequences and short-term earthquake predictability on East
Pacific Rise transform faults. Nature, 434(7032), 457–461.
McLaskey, G. C., & Glaser, S. D. (2012). Acoustic emission sensor
calibration for absolute source measurements. Journal of Non-
destructive Evaluation, 31, 157–168. https://doi.org/10.1007/
s10921-012-0131-2
McLaskey, G. C., & Kilgore, B. D. (2013). Foreshocks during the
nucleation of stick–slip instability. Journal of Geophysical
Research, 118, 2982–2997. https://doi.org/10.1002/jgrb.50232
McLaskey, G. C., & Lockner, D. A. (2014). Preslip and cascade
processes initiating laboratory stick slip. Journal of Geophysical
Research, 119, 6323–6336. https://doi.org/10.1002/
2014JB011220
Mignan, A. (2011). Retrospective on the accelerating seismic
release (ASR) hypothesis: Controversy and new horizons.
Tectonophysics, 505, 1–16.
Mignan, A. (2014). The debate on the prognostic value of earth-
quake foreshocks: A meta-analysis. Scientific Reports, 4, 4099.
https://doi.org/10.1038/srep04099
Mitchell, T. M., & Faulkner, D. R. (2009). The nature and origin of
off-fault damage surrounding strike–slip fault zones with a wide
range of displacements: A field study from the Atacama fault
system, northern Chile. Journal of Structural Geology, 31,
802–816. https://doi.org/10.1016/j.jsg.2009.05.002
Moreno, M., Rosenau, M., & Oncken,O. (2010). Maule earthquake
slip correlates withpre-seismic locking of Andean subduction
zone, Nature. 467. https://doi.org/10.1038/nature09349
Muhuri, S. K., Dewers, T. A., ScottThurman, E., & Reches, Z.
(2003). Interseismic fault strengthening and earthquake–slip
instability: Friction or cohesion? Geology, 31, 881–884.
Nanjo, K. Z., Hirata, N., Obara, K., & Kasahara, K. (2012). Dec-
ade-scale decrease in b value prior to the M9-class 2011 Tohoku
and 2004 Sumatra quakes, Geophysical Research Letters, 39.
https://doi.org/10.1029/2012GL052997
Ohnaka, M. (1992). Earthquake source nucleation: A physical
model for short-term precursors. Tectonophysics, 211, 149–178.
Ohnaka, M. (2004). A constitutive scaling law for shear rupture
that is inherently scale-dependent, and physical scaling of
nucleation time to critical point. Pure Applied Geophysics, 161,
1915–1929.
Ohnaka, M., & Shen, L. (1999). Scaling of the shear rupture pro-
cess from nucleation to dynamic propagation: Implications of
geometric irregularity of the rupturing surfaces. Journal of
Geophysical Research, 104, 817–844.
Ojala, I. O., Main, I. G., & Ngwenya, B.T. (2004). Strain rate and
temperature dependence of Omori law scaling constants of AE
data: Implications for earthquake foreshock-aftershock sequen-
ces, Geophysical Research Letters. 31. https://doi.org/10.1029/
2004GL020781
Pacheco, J. F., Sykes, L., & Scholz, C. H. (1993). Nature of seismic
coupling along simple plate boundaries of the subduction type.
Journal of Geophysical Research, 98, 14133–14155.
Palmer, A. C., & Rice, J. R. (1973). The growth of slip surfaces in
the progressive failure of overconsolidated clay. Proceedings of
the Royal Society London A, 332, 527–548.
Passelegue, F., Latour, S., Schubnel, A., Nielsen, S., Bhat, H., &
Madariaga, R. (2017). Influence of fault strength on precursory
processes during laboratory earthquakes. In M. Thomas, T.
M. Mitchell, & H. S. Bhat (Eds.), Fault zone dynamic processes:
Evolution of fault properties during seismic rupture (Vol. 227,
pp. 229–242). New York: Wiley.
Pei, S., et al. (2019). Seismic velocity reduction and accelerated
recovery due to earthquakes on the Longmenshan fault. Nature
Geoscience, 12, 387–392.
Popov, V. L., Grzemba, B., Starcevic, J., & Fabry, F. (2010).
Accelerated creep as a precursor of frictional instability and
earthquake prediction. Physical Mesomechanics, 13, 283–291.
Reasenberg, P. A. (1999). Foreshock occurrence before large
earthquakes. Journal of Geophysical Research, 104, 4755–4768.
Reches, Z. (1999). Mechanisms of slip nucleation during earth-
quakes. Earth and Planetary Science Letters, 170, 475–486.
Reches, Z., & Lockner, D. A. (1994). Nucleation and growth of
faults in brittle rocks. Journal of Geophysical Research, 99,
18159–18173.
Renard, F., Weiss, J., Mathiesen, J., Ben Zion, Y., Kandula, N., &
Cordonnier, B. (2018). Critical evolution of damage towards
system-size failure in crystalline rock. Journal of Geophysical
Research, 123, 1969–1986. https://doi.org/10.1002/
2017JB014964
Ripperger, J., Ampuero, J.-P., Mai, P. M., & Giardini, D. (2007).
Earthquake source characteristics from dynamic rupture with
constrained stochastic fault stress, Journal of Geophysical
Research. 112. https://doi.org/10.1029/2006JB004515
Roeloffs, E. A. (2006). Evidence for aseismic deformation rate
changes prior to earthquakes. Annual Review of Earth and
Planetary Sciences, 2006(34), 591–627. https://doi.org/10.1146/
annurev.earth.34.031405.124947
Romanet, P., Bhat, H. S., Jolivet, R., & Madariaga, R. (2018). Fast
and slowslip events emerge due to fault geo-metrical complexity.
Geophysical Research Letters, 45, 4809–4819. https://doi.org/10.
1029/2018GL077579
Sammis, C. G., & Rice, J. R. (2001). Repeating earthquakes as low-
stress-drop events at a border between locked and creeping fault
patches. Bulletin of the Seismological Society America, 91,
532–537.
Vol. 177, (2020) Seismic and Aseismic Preparatory Processes 5759

Savage, H. M., & Brodsky, E. E. (2011). Collateral damage:
Evolution with displacement of fracture distribution and sec-
ondary fault strands in fault damage zones. Journal of
Geophysical Research, 116, B03405. https://doi.org/10.1029/
2010JB007665
Schmittbuhl, J., Chambon, G., Hansen, A., & Bouchon, M. (2006).
Are stress distributions along faults the signature of asperity
squeeze? Geophysical Research Letters, 33, L13307. https://doi.
org/10.1029/2006GL025952
Scholz, C. H. (1968). Experimental study of the fracturing process
in brittle rock. Journal of Geophysical Research, 73, 1447–1454.
Scholz, C. H. (2019). The mechanics of earthquakes and faulting.
Cambridge: Cambridge Univ Press. https://doi.org/10.1017/
9781316681473
Scholz, C. H., & Campos, J. (2012). The seismic coupling of
subduction zones revisited. Journal of Geophysical Research,
117, B05310. https://doi.org/10.1029/2011JB009003
Scholz, C. H., Dawers, N. H., Yu, J. Z., & Anders, M. H. (1993).
Fault growth and fault scaling laws: Preliminary results. Journal
of Geophysical Research, 98, 21951–21961.
Scholz, C. H., Molnar, P., & Johnson, T. (1972). Detailed studies of
frictional studies of granite and implications for the earthquake
mechanism. Journal of Geophysical Research, 77, 6392–6406.
Schurr, et al. (2014). Gradual unlocking of plate boundary-con-
trolled initiation of the 2014 Iquique earthquake. Nature, 512,
299–302. https://doi.org/10.1038/nature13681
Selvadurai, P. A., & Glaser, S. D. (2015). Laboratory-developed
contact models controlling instability on frictional faults. Journal
of Geophysical Research, 120, 4208–4236. https://doi.org/10.
1002/2014JB011690
Selvadurai, P. A., & Glaser, S. D. (2017). Asperity generation and
its relationship to seismicity on a planar fault: A laboratory
simulation. Geophysical Journal International, 208, 1009–1025.
https://doi.org/10.1093/gji/ggw439
Smith, W. D. (1981). The b-value as an earthquake precursor.
Nature, 289, 136–139.
Socquet, A., Valdes, J. P., Jara, J., Cotton, F., Walpersdorf, A.,
Cotte, N., Specht, S., Ortega-Culaciati, F., Carrizo, D., & Nor-
abuena, E. (2017). An 8month slow slip event triggers
progressive nucleation of the 2014 Chile megathrust, Geophysi-
cal Research Letters. 44. https://doi.org/10.1002/2017GL073023
Stanchits S., & Dresen, G. (2003). Separation of tensile and shear
cracks based on acoustic emission analysis of rock fracture, In
Proceedings of the International Symposium: Non-Destructive
Testing in Civil Engineering (NDT-CE), (p. 107) Berlin,
Germany
Stanchits, S., Vinciguerra, S., & Dresen, G. (2006). Ultrasonic
velocities, acoustic emission characteristics and crack damage of
basalt and granite. Pure and Applied Geophysics, 163, 975–994.
https://doi.org/10.1007/s00024-006-0059-5
Thompson, B. D., Young, R. P., & Lockner, D. A. (2005).
Observations of premonitory acoustic emission and slip nucle-
ation during a stick slip experiment in smooth faulted Westerly
granite. Geophysical Research Letters, 32, L10304. https://doi.
org/10.1029/2005GL022750
Thompson, B. D., Young, R. P., & Lockner, D. A. (2009). Pre-
monitory acoustic emissions and stick–slip in natural and
smooth-faulted Westerly granite. Journal of Geophysical
Research, 114, B02205. https://doi.org/10.1029/2008JB005753
Trugman, D. T., & Ross, Z. E. (2019). Pervasive foreshock activity
across southern California. Geophysical Research Letters, 46,
8772–8781. https://doi.org/10.1029/2019GL083725
Utsu, T., Ogata, Y., & Ritsuko, M. (1965). The centenary of Omori
formula for a decay law of afterhock activity. Journal of Physics
of the Earth, 43, 1–33.
van den Ende, M. P. A., & Ampuero, J.-P. (2020). On the statistical
significance of foreshock sequences in Southern California.
Geophysical Research Letters, 47. https://doi.org/10.1029/
2019GL086224
Vermilye, J. M., & Scholz, C. H. (1998). The process zone: A
microstructural view of fault growth. Journal of Geophysical
Research Solid Earth., 103, 12223–12237.
Wu, C., Peng, Z., Meng, X., & Ben-Zion, Y. (2014). Lack of
spatio-temporal localization of foreshocks before the 1999
Mw7.1 Duzce, Turkey earthquake. Bulletin of the Seismological
Society of America, 104, 560–566. https://doi.org/10.1785/
0120130140
Wyss, M., Sammis, C. G., Nadeau, R. M., & Wiemer, S. (2004).
Fractal dimension and b-value on creeping and locked patches of
the San Andreas fault near Parkfield, California. Bulletin of the
Seismological Society of America, 94(2), 410–421. https://doi.
org/10.1785/0120030054
Xu, S., Ben-Zion, Y., & Ampuero, J.-P. (2012). Properties of
inelastic yielding zones generated by in-plane dynamic ruptures:
II. Detailed parameter-space study. Geophysical Journal Inter-
national, 191, 1343–1360. https://doi.org/10.1111/j.1365-246X.
2012.05685.x
Yabe, Y., Kato, N., Yamamoto, K., & Hirasawa, T. (2003). Effect
of sliding rate on the activity of acoustic emission during
stable sliding. Pure and Applied Geophysics, 160, 1163–1189.
Yoshimitsu, N., Kawakata, H., & Takahashi, N. (2014). Magnitude
-7 level earthquakes: A new lower limit of self-similarity in
seismic scaling relationships. Geophysical Research Letters, 41,
4495–4502. https://doi.org/10.1002/2014GL060306
Zaliapin, I., & Ben-Zion, Y. (2013). Earthquake clusters in
southern California II: Classification and relation to physical
properties of the crust. Journal of Geophysical Research, 118,
2865–2877. https://doi.org/10.1002/jgrb.50178
Zaliapin, I., & Ben-Zion, Y. (2016). A global classification and
characterization of earthquake clusters. Geophysical Journal
International, 207, 608–634. https://doi.org/10.1093/gji/ggw300
Zang, A., Wagner, F. C., Stanchits, S., Dresen, G., Andresen, R., &
Haidekker, M. A. (1998). Source analysis of acoustic emissions
in granite cores under symmetric and asymmetric compressive
load. Geophysical Journal International, 135, 1113–1130.
Zang, A., Wagner, C., Stanchits, S., Janssen, C., & Dresen, G.
(2000). Fracture process zone in granite. Journal of Geophysical
Research, 105, 23651–23661.
(Received March 12, 2020, revised October 2, 2020, accepted October 10, 2020, Published online October 26, 2020)
5760 G. Dresen et al. Pure Appl. Geophys.