seismic analysis of the west bay suspension spans of … · seismic analysis of the west bay...
TRANSCRIPT

Presented at National Seismic Conference on Bridges and Highways, San Diego, California, Dec. 10-13 1995
SEISMIC ANALYSIS OF THE WEST BAY SUSPENSION SPANSOF THE SAN FRANCISCO – OAKLAND BAY BRIDGE
Mark A. Ketchum, Ph.D., P.E.Vice President
OPAC Consulting Engineers, Inc.San Francisco, California
Fletcher Waggoner, P.E.Project Engineer
OPAC Consulting Engineers, Inc.San Francisco, California
ABSTRACT
A seismic analysis of the existing West Bay Crossing of the San Francisco - Oakland Bay Bridge was per-formed for the California Department of Transportation to determine the seismic vulnerability and retrofittingrequirements of the structure. Engineering studies were performed to gain an understanding of the dynamicseismic behavior of the bridge, to evaluate its seismic vulnerability, and to determine basic retrofit require-ments. The goals and scope of the evaluation, along with the methods and findings of the engineering studiesthat were performed to evaluate seismic vulnerability, are summarized here.
INTRODUCTION
The 8¼ mile long San Francisco-Oakland Bay Bridge provides the only direct highway link between SanFrancisco and the East Bay communities. Since it first opened to traffic in 1936, it has been a critical struc-ture to the people of the San Francisco Region and the State of California. It was recognized by the AmericanSociety of Civil Engineers (ASCE) in 1955 as one of the seven wonders of the United States. From its westend in San Francisco to its east end in Oakland, it consists of the San Francisco Approaches, the West BayCrossing, the Island Crossing, the East Bay Crossing, and the East Bay Approaches.
A seismic vulnerability evaluation of the West Bay Crossing [1] was completed in 1994 by OPAC ConsultingEngineers and a team of subconsultants, under contract to the California Department of Transportation(Caltrans). The evaluation made use of separately contracted site-specific seismic hazard assessment andground motion studies [2,3], and consisted of a number of engineering studies designed to evaluate the elasticand inelastic mechanical properties of the bridge and its principal components, estimate the seismic responseand structural behavior of the bridge in earthquakes of differing magnitudes, determine the damage that mightoccur to the bridge in these earthquakes, estimate the vulnerability of the bridge to collapse or loss of servicedue to this damage, and provide an estimate of the retrofitting measures that would be required to keep thebridge open for continued service after a major earthquake. These studies provided one step in the ongoingseismic retrofit program of this heavily used transportation structure.
BRIDGE DESCRIPTION
The West Bay Crossing (Fig. 1), connecting Yerba Buena Island and the City of San Francisco, consists ofback-to-back suspension bridges with main spans of 2,310 ft (704 m), side spans of 1,160 ft (354 m), andwestern continuous truss approach spans, for a total length of 10,300 ft (3,140 m). The riveted steel stiffeningtrusses that carry ten lanes of traffic on two 66 ft (20m) wide roadway levels, are suspended from two 28¾ in.(0.73 m) diameter parallel wire cables. Braced steel towers up to 470 ft (143 m) tall are founded on multicel-lular concrete caissons up to 231 ft (70 m) deep that are embedded in soil and bear directly on rock. With its1.95 mile (3.14 km) long cables between end-anchorages, the 59-year-old West Bay Crossing is one of thelongest continuous elevated structures in the United States.
Fig.1: Bridge Elevation

Page 2
The anchorages and Piers W1 through W6 are foundedon Franciscan sandstone. Soil conditions at Piers W2 -W6 are shown in Fig. 2. Foundations at Piers W3 - W6are cellular concrete caissons that were floated to the site,sunk through the overlying soil to rock, and then sealedwith tremie concrete. These caissons extend as far as 231ft (70 m) below water level and have footprints as largeas 92 ft x 197 ft (28 m x 60 m). The caissons are lightlyreinforced with low-deformation bars. Foundations atPiers W1 and W2 are spread footings on rock, built in-side cofferdams. Piers A and B that support the continu-ous truss spans are founded on spread footings that bearon sand.
The San Francisco cable anchorage consists of massiveconcrete blocks keyed into the rock. The Center anchor-age at W4 is a 450 ft (137 m) high vertical cantilever pier, with the cables anchored to steel A-frames insideits walls. At the Yerba Buena Island anchorage, the cables areanchored in grillage beams at the bases of 170 ft (52 m) groutedtunnels.
Batter-leg steel towers (Fig. 3) support the cables at W2, W3, W5,and W6. Riveted splices in the tower shafts were designed to de-velop the full compression capacity of the plates, but only partialtension capacity. The tower shafts are connected to the caissoncaps with bolts anchored in steel grillages in the concrete. Thesebolts are not capable of developing the full bending capacity ofthe tower shafts. Additional support for the cables is provided bysteel bents at W1 and the Yerba Buena anchorage. Cast steel cablesaddles are bolted to the top of each tower and cable bent.
A 35 ft (10.7 m) deep suspended steel stiffening truss system (Fig. 4) supportsthe upper and lower deck slabs. Steelwork consists of top and bottom chords,truss posts, diagonals, floor beams, and lower deck transverse K-bracing. Expan-sion joints are provided at each tower. The floor systems consist of concreteslabs supported on steel stringers and the floor beams. The trusses are supportedby the suspenders and by rocker posts at the towers. Longitudinal restraint isprovided only be pendulum action of the cable system. Transverse restraint isprovided through wind locks at the towers in the bottom chord plane. The con-tinuous spans make use of a traditional truss system with a similar layout.
The 1940 paper “Earthquake Stresses in the San Francisco-Oakland Bay Bridge”[4], outlines the approach used in the original seismic analysis and design of thebridge. The earthquake forces used were “those resulting froma ground motion with a horizontal acceleration of 0.1 g, a pe-riod of 1.5 sec., and an amplitude of 2.2 inches”. The estimated5 to 15 sec. vibration period of the superstructure was consid-ered long enough that an earthquake could never be in reso-nance with any part of the structure. For the towers, it was as-sumed that a 0.1 g acceleration acted at the center of thetower’s mass, with analogous participation from the adjacentspans. The overall conclusion with respect to seismic resistancewas that the earthquake stresses were of the same order asthose arising from the assumed wind loads, thus very little ad-ditional material was provided to resist earthquake forces.
Fig. 2: Foundation Conditions
Fig. 3: Typical tower
Fig. 4: Stiffening truss section

Page 3
PROJECT GOALS & STRATEGY
The contracted goals of the project were to evaluate the anticipated seismic performance of the West BayCrossing by performing a seismic analysis of the bridge using ground motions provided by Caltrans, and tomake recommendations and cost estimates for seismic retrofit measures. The project strategy adopted to meetthese goals within the imposed time and budget constraints consisted of the following tasks:
1. Development of linear and nonlinear global computer models of the bridge, to account for the dynamicproperties of the superstructure and substructure, and interaction between the foundations and the sur-rounding soil. This task entailed development of three-dimensional global structural models capable ofcapturing dominant linear and nonlinear seismic response of the system.
2. Development of component models as necessary to determine critical local responses. These models,including soil-structure interaction (SSI) models of the foundations, detailed nonlinear inelastic finiteelement models of bridge subassemblies, and simple models of members and connections based on fun-damental principles, provided a basis for defining mechanical properties used in the global models.
3. Analysis of these models under ground motion input to determine critical bridge response. The analysesincluded linear response spectrum analyses, plus linear and nonlinear time-history analyses with multi-support incoherent ground motion input. Linear analyses were performed first; then, as “important” re-sponse nonlinearities were found, they were explicitly incorporated in the models and analyses.
4. Determination of demand and capacity values for forces and deformations at critical locations. Demandsand capacities were expressed in terms of displacements, focusing on the ability of systems and elementsto withstand the deformation or ductility demands imposed by the earthquake. Structural vulnerabilitywas evaluated on the basis of these demands and capacities.
5. Preparation of recommendations for any retrofit construction required to enable the bridge to performsatisfactorily during the specified earthquakes. Preparation of approximate construction cost estimates forthe recommended retrofit work.
6. Preparation of a final report documenting and summarizing the studies.
It was recognized by the consulting team at the inception of the project that the engineering analyses requiredto reach the stated goals would by necessity be of a predictive nature. The overall analytical approach wastherefore designed to estimate the true structural response and behavior of the bridge, including explicit con-sideration of nonlinear global system behavior and cyclic inelastic component behavior in critical compo-nents. It was felt that this would provide a rational and most readily defensible approach to assessing vulner-ability.
PERFORMANCE CRITERIA
Performance criteria were developed to identify and document suitable performance objectives for the bridgeand to establish methods for evaluating whether current bridge components comply with those objectives. Theperformance objectives were governed by public policy, while the evaluation criteria were governed by tech-nical issues such as the correlation of demands to damage and the correlation of damage to vulnerability.
Caltrans Policy
The Caltrans Seismic Performance Criteria for San Francisco Bay Area Toll Bridges [5] required both aFunctional Evaluation and a Service Evaluation of the bridge. The Safety Evaluation event is defined with areturn period of “approximately 1000 to 2000 years” while the Functional Evaluation event is defined with areturn period of 300 years, consistent with a 40% probability of occurring in the useful life of the bridge.
In the functional evaluation event, the Criteria [5] required the bridge to perform at an Immediate ServiceLevel, that is, there should be access to essentially normal traffic almost immediately. During this event thereshould be Minimal Damage, that is the bridge should behave with only minor inelastic deformations.

Page 4
In the safety evaluation event, the Criteria [5] required the bridge to perform again at the Immediate ServiceLevel, as described above. During this event there can be at most Repairable Damage, that is damage that canbe repaired without complete closure of the bridge and with minimum risk of losing functionality.
Technical Approach
Development of the component performance criteria was displacement driven, focusing on the ability of thesystems and elements of the bridge to withstand the deformation or ductility demands imposed by the groundmotions. The Caltrans policy presented above were therefore interpreted to place the following limitations onstructural deformations in the Safety Evaluation event:
1. The global structural system must be capable of accommodating the expected seismic deformations with-out significant loss of its gravity load carrying capability.
2. Damage to individual elements resulting from the expected deformations must be repairable withoutcomplete interruption of the bridge operation.
Rational application of such criteria, where vulnerability is assessed by comparing computed deformationswith acceptable deformations, would require global modeling of all important geometric and material non-linearities. Such analysis was judged unfeasible for this study because of the size of the bridge and the bridgemodel, the uncertainties in modeling the post-elastic behavior of all members and connections, and the needto predict vulnerability prior to expending the effort required for such a fully nonlinear analysis.
A simplified global modeling approach was adopted instead, in which only certain critical components weremodeled inelastically. These components were characterized inelastically in the global model (to provide de-formation demands) as well as in local subsystem models (to define deformation capacities). For the majorityof components, surrogate elastic deformations and forces were compared with surrogates of allowable ductil-ity ratios, based on the equal deformations assumption. Acceptable strength demand/capacity ratios were es-tablished for these components based on their ductility characteristics and consequences of failure.
Deformation capacities of components were categorized as related to form, function, and behavior. The fail-ure modes to which an element is susceptible, i.e. its behavior, are dictated by its form and function; its ca-pacity depends on its behavior and form; and the consequences of failure are dictated by its function and be-havior.
Form describes the material characteristics and element shapes of the component. The material type deter-mines the shape of the stress strain curve which, along with the element geometry, defines the potential fail-ure modes and inelastic behavior characteristics of the component.
Function describes the role the element fills in the system. The structure is considered functional only if theprimary gravity load paths are complete and the elements that form these paths are not compromised. Thecriteria therefore distinguish between Criticality Classes of components, according to the consequences oftheir failure. For Criticality Class I elements, whose failure may imperil the stability of the gravity load sys-tem, inelastic deformations are acceptable only if they result in no strength loss. For Criticality Class II ele-ments, including all other structural components, inelastic deformations are acceptable if they cause not morethan 20% strength loss. Deformations must also be controlled to the extent that they do not render the bridgecompletely dysfunctional or unrepairable.
Behavior describes the inelastic characteristics of the element. For ductile components, including adequatelybraced compact steel beams in flexure and steel tension elements that yield at the gross cross section, allow-able deformations are controlled by stability and reparability issues. For brittle components that may not yieldprior to failure, including connections subject to net section fracture, shear failure in pre-1970’s reinforcedconcrete, and non-compact compression elements, deformations are limited to less than those at failure. Forintermediate failure modes in which the member “softens” as displacements increase, including compact sec-tions in compression and structural systems that are susceptible to P-∆ effects, deformations are limited tovalues at which 80% of yield strength is maintained.

Page 5
ROCK MOTIONS
Rock motions were developed under a separate Caltrans contract [2,3]. A probabilistic seismic hazard as-sessment provided equal-hazard spectra (Fig. 5) for 300-year and 1000-2000 year return periods used in re-sponse spectrum evaluations. A deterministic approach was used to develop target (84th percentile) responsespectra for a Maximum Credible Event (Mw = 8) on the San Andreas Fault at a distance of 15 km from thebridge (Fig. 6). The rock motions used in time history analyses were generated to be compatible with thesespectra.
a: Horizontal components b: Vertical component
Fig. 5: Equal-hazard spectra Fig. 6: Target response spectra for San Andreas event
Wave passage and incoherence effects were considered in development of multi-support histories of rockmotions for the Maximum Credible Event. The multi-support motions were developed from the spectrumcompatible ground motion histories using semi-empirical coherency functions and time-shifting. Plots for PierW3 of longitudinal acceleration, velocity, and displacement vs. time are shown in Fig. 7. Site effects wereconsidered in the soil-structure interaction analyses performed as part of the structural vulnerability studies.
-0.60
-0.40
-0.20
0.00
0.20
0.40
0.60
0 10 20 30 40 50 60 70 80
Time (seconds)
a: Acceleration (g) vs. time
-30-20-10
010203040
0 10 20 30 40 50 60 70 80Time (seconds)
b: Velocity (inches/sec) vs. time
-20-15-10-505
1015
0 10 20 30 40 50 60 70 80Time (seconds)
c: Displacement (inches) vs. time
Fig. 7: Free field rock motions at W3 for San Andreas event

Page 6
OVERVIEW OF ANALYTICAL MODELING
Numerous analytical models of the West Bay Crossing and its subassemblies and components were developedas a part of the vulnerability evaluation. These models are conveniently classified as either global or local.The global models were developed to capture the overall linear and nonlinear seismic response of the bridgeunder multi-support ground motions. The local models were developed for improved evaluation of both thedemands and capacities. For the demand evaluation, pre-global modeling of local components was used todevelop simplified representations of the elastic and inelastic mechanical properties of critical componentsthat could then be incorporated into the global model. For the capacity evaluation, post-global modeling oflocal components was used to gain an improved understanding of the deformation limits under which the per-formance criteria would be met. In most cases, the same numerical description was used for both pre- andpost- global models, only the driving functions changed.
GLOBAL MODELING
Global models of the West Bay Crossing were developed for evaluation of overall seismic response, includingdynamic displacements as well as load and deformation demands, under multi-support seismic ground mo-tion. The global model represented the entire bridge above the rock line, from anchorage to anchorage. Initialmodel development was limited to linear elastic dynamic behavior. During the engineering studies, numerousnonlinearities were incorporated into the model, to provide a better assessment of dominant response.
As well as accounting for the dynamic properties of the superstructure and substructure, the global model(Fig. 8) accounted for soil-structure interaction (SSI) between the foundations and the surrounding soil byincorporating the results of soil-structure interaction analyses. The SSI analyses were considered as local sub-system analyses; the foundations were incorporated into the global model as super-elements. Other local sub-systems subjected to such analyses include the anchorage housings, truss systems, tower bases, and Pier W-1.
Fig. 8: Global structural model
The global model included representations of all major structural components of the bridge: the cables, thesuspenders, the main towers, their supporting caissons, the continuous truss system between the San FranciscoAnchorage and Pier W-1, the stiffening trusses, the center anchorage, the cable bents, etc. The following ele-ment types were used for modeling the various components of the bridge:
1. The cables and suspenders were modeled with two-node cable elements in which, for nonlinear analyses,the equilibrium equations were established using large displacement / small strain theory, and the sus-penders were considered to have no compressive stiffness, to account for slackening. Over most of theirlengths, the cables were modeled with axial stiffness only. Near the supports, however, the cable bendingstiffness was also incorporated; this was particularly important for capturing demands on the cable bents.

Page 7
The geometric stiffness (initial stress) term was included in linear and nonlinear analyses. Dead loadstresses and geometry were evaluated using cable theory in a separate analysis, based on a constructionsequence that leaves the chords and diagonals of the stiffening trusses stress-free under dead load.
2. The trusses were modeled with each main member represented by a separate element, i.e. an equivalentline-element was not used. This was essential for capturing the distortional behavior of the unbraced dou-ble-deck system. All steel members except the floor beams were modeled with axial-force-only elements,to capture dominant behavior with reasonable numerical effort. “Pseudo sway bracing” members wereincorporated to capture the distortional stiffness. In the nonlinear analyses, the truss element equilibriumequations were established in the deformed coordinate system.
At each floor beam, the model has three nodes across each deck to capture the mass distribution acrossthe widths of the top and bottom planes. Floor beams were modeled as beam-column elements with endmoment releases at the stiffening truss planes. Their sectional properties were adjusted to account forshear transfer mechanisms between the deck slab and the chord members.
3. Global participation of the deck slabs was considered using frame elements, representing the gross stiff-ness of the floor slab / stringer system, connected to the center nodes of the floor beams. This model wascalibrated against the results of a detailed local truss model described subsequently. The deck slab jointsat every fourth floor beam were considered using conventional tension and compression models. Explicitmodeling of pounding of these joints was outside the scope of the project.
4. The steel towers, bents A and B, the cable bents, and the A-frame in the Center Anchorage were modeledexplicitly with three-dimensional frame elements. For nonlinear analyses, the frame elements utilized alarge displacement, small incremental rotation, small strain formulation. The tower shafts, cable bents,and piers that are under dead load compression were formulated with geometric stiffness included.
The torsional properties of the multi-cellular tower shafts were found by solving the statically indetermi-nate multicellular torsion problem. For the laced bending members, the influences of strains in the lacingbars were incorporated into the evaluations of stiffness and strength by using virtual work to evaluateequivalent line-element properties.
5. Rocking (edge uplift) of the bases of the tower shafts was modeled using frame elements with a fila-mented cross section. An elastic-plastic material model was used for each filament, with nominal capac-ity in compression and zero capacity in tension. The hold-down bolts were modeled with additional fila-ments.
6. Pounding of the wind locks and expansion joints between the trusses and the towers was modeled withmulti-linear contact-impact “gap” elements. To account for the additional energy dissipation throughdamage that occurs during pounding, the stiffness-proportional damping of these gap elements was in-creased tenfold over the nominal stiffness-proportional damping assumed for the bridge system analysis.
7. The San Francisco Anchorage, Pier W1, the Center Anchorage, and the Yerba Buena Anchorage weremodeled as simple equivalent frames, adequate for capturing the demands on these components due toglobal bridge behavior. Local analyses of these components were conducted to support the global models.
8. Foundation impedances representing the footings and caissons, were provided as boundary elements at alllocations where the bridge is supported. These impedances consist of stiffness, mass, and damping matri-ces, derived to account for the interaction of the structure with the surrounding soil and water.
The underlying philosophy in developing this 17,000 DOF model was to provide adequate detail to capturethe global and regional behavior modes of the bridge. The authors believe that any simplification of thismodel would have compromised its predictive ability, and that any further refinement would not have yieldedresults that could be interpreted within the context of the limited-scope vulnerability evaluation.

Page 8
GLOBAL ANALYSES
Numerous analyses of the global model were undertaken to calibrate it against previous static solutions, andto evaluate live load demands, vibration properties, and seismic response.
Static Calibration
The global model was subjected to several static loadings, for which displaced shapes were provided in theoriginal design drawings, and that represent approximately the original design traffic live loads and the windloads on the stiffening trusses. These analyses were used only to validate the computer model, they were notused to establish demands for use in the seismic evaluations. Truss displacements based on both linearizedsmall-displacement, and nonlinear large-displacement analyses checked very closely with the designers’ val-ues. The nonlinear analyses provided slightly smaller displacement estimates than the linear analyses; thedifferences were very small for the vertical loads, and were indistinguishable for the transverse loads.
Live Load Analyses
Live loads cause the dominant service-load demands on the trusses, therefore static moving-load analyseswere conducted to evaluate design live load demands on the truss members. In recognition of the conserva-tism of AASHTO lane loads for long-span bridges [6], and in lieu of developing a site-specific live loadmodel, the lane loadings specified by Caltrans for engineering studies of the Benicia-Martinez [7] and Car-quinez parallel spans were used. A lane load of 0.54 kips/ft/lane was adopted, with no point loads for momentor shear, and no reduction for multiple lanes. This provided a total live load of 6.48 kips/ft to represent 12lanes.
Unfactored live load stress envelopes for truss top chords and diagonals are shown in Fig. 9. These envelopesindicate that design live load demands can utilize a significant portion of the truss member capacities.
-20
-10
0
10
20
-6000 -5000 -4000 -3000 -2000 -1000 0 1000 2000 3000 4000 5000
a) Top Chords
-20
-10
0
10
20
-6000 -5000 -4000 -3000 -2000 -1000 0 1000 2000 3000 4000 5000
a) DiagonalsFig. 9: Truss live load stresses (ksi) vs. distance (ft) from center anchorage
Vibration Mode Analyses
Eigenvectors and eigenvalues were extracted for use in response spectrum analyses and to gain an under-standing of the dynamic behavior of the bridge. The calculated periods and mode shapes for several keymodes are shown in Fig. 10. The long period of the fundamental mode, associated with transverse motion ofthe main span, is characteristic of suspension bridges. None of the modes shown causes significant motions inthe towers or piers. These components are stiffer than the suspended system, and are excited by higher modes.The west suspension unit has marginally longer periods due to the long anchor spans of the cables at its westend.
Mode 1: T = 12.1 sec.West Bridge 1st Transverse
Mode 3: T = 8.0 sec.West Bridge 1st Vertical
Mode 7: T = 6.1 sec.West Bridge 1st Longitudinal
Fig. 10: Vibration mode shapes and periods

Page 9
An ambient vibration survey conducted shortly after the bridge was built [8] indicated main span transverseperiods of about 9 seconds. The original authors state in the publication that the measurements may have beenin error. Considering the accuracy with which the current modeling replicates the designers’ static analyses, itwas concluded that the current analyses adequately represent the structural dynamics of the bridge.
Response Spectrum Analysis
Response spectrum analyses were conducted for both the 300-year event and the maximum credible event, toestablish an initial probabilistic estimate of seismic demands, to eliminate modeling problems prior to thetime history analyses, and to establish the importance of various dynamic modes on seismic response. About400 eigenvectors were required to excite the supporting components of the bridge and capture 90% of theirmass; this number of vectors reached a shortest modal period of about 0.3 seconds.
Results of all seismic demand analyses, based on these response spectra analyses as well as the time historyanalyses presented below, are discussed subsequently.
Linear uniform support excitation time history analysis
Linear uniform-support ground motion analyses provided a starting point in refining estimates of response andseismic demands. The San Francisco Anchorage rock accelerations were input through the foundation imped-ances at each support. This analysis provided an improved estimate of pounding susceptibility at the tower-truss joints, since peak tower responses occur earlier during the earthquake than peak truss responses.
All time history analyses were performed by direct integration of the coupled equations of motion of thebridge model. Rayleigh damping was used, with assumed damping ratios of 5% at a period of 0.2 sec and 3%at a period of 8 sec. This damping characterization is believed to adequately reflect the light damping of thelonger period modes (transverse and vertical stiffening truss modes, cable sway modes) and the heavierdamping of lower period modes in supporting components.
Linear multi- support excitation time history analysis
Linear multi-support ground motion analyses were conducted to evaluate the effects of the time-delayed in-coherent ground motions. These motions changed significantly the peak response of some critical componentssuch as the truss chords and the tower bases, due to the additional structural modes that they excite and thechange in phasing of various responses. These analyses also provided a reliable indication of the locations ofsignificant nonlinearities in seismic response.
For the multi-support analyses, the equations of dynamic equilibrium were formed with respect to the inertialreference frame, in total displacement coordinates. Since all displacements, velocities, and accelerations werereferenced to total displacement coordinates, no partitioning of the equations between total and relative termswas required, and all computed results were representative of total values, rather than the relative system ofthe uniform-support analyses. Therefore, interpretation of the results required some additional care.
The multi-support model was driven by the ground motions by applying “fictitious” force time histories at theinterface nodes where the SSI-based impedances were assembled. These driving functions were derived byconsidering the stand-alone caisson motions from the SSI analyses as time-varying initial-strain loadings. Assuch, the computed caisson forces were adjusted to reflect this formulation.
Nonlinear multi- support excitation time history analysis
Final vulnerability estimates were based on nonlinear multi-support excitation analyses, which explicitly con-sidered large displacements, joint pounding, tower-base rocking, and cable slackening. The nonlinear analysesprovided a reasonable evaluation of seismic demands and vulnerability of the bridge. It is recognized, how-ever, that incorporation of additional nonlinearities would provide an improved basis for determining thesafety, serviceability, and retrofitting requirements of the structure.

Page 10
The nonlinear response mechanisms were considered separately and in combination to gain an understandingof their contributions to seismic vulnerabilities. Some nonlinearities, such as suspender slackening that occursin only a few locations, have little influence on vulnerability. Other nonlinearities, such as pounding of theback span cables on Bents A and B, have some local influence but little effect on global vulnerabilities. Themost significant nonlinearities, such as joint pounding and P-∆ effects, have both local and global influences.
Some additional static nonlinear studies were undertaken to qualitatively evaluate the effects of loss of trussmember capacity on global behavior. These nonlinearities were not incorporated into the dynamic model.
Discussion
The global analyses provided considerable insight into the seismic behavior of the bridge. The bridge wasfound to respond quite strongly over a wide frequency range, with significant demands in many superstructureand substructure components. The following observations are important in understanding its vulnerability:
1. The suspended system responds strongly in its relatively long-period fundamental mode; some higher-mode response is also apparent (Fig. 11). Some of the higher-mode participation is apparently due tomulti-support excitation, which can excite traveling waves in the roadway. Forces in truss componentsappear to be dominated by the higher-mode, short wave-length traveling waves.
-30
-20
-10
0
10
20
30
0 10 20 30 40 50 60 70 80
Time (seconds)
Transverse displacement (in.) at middle of west main span
Displaced shape (20x) at T=16 sec .
Fig. 11. Multi-support response of suspended system
2. Tower response is strongest at thehigher frequency of the tower (Fig.12). Tower demands are largely dueto first longitudinal mode bendingmoments, with moment diagramscorresponding to behavior as a can-tilever column, fixed at the caissontops and propped by the elastic guyprovided by the side-span cables.Rocking of the tower bases due toyielding of the anchor bolts par-tially decouples the bridge from thefoundations, and therefore signifi-cantly reduces bending demands inthe tower shafts.
Impact between towers and thelonger-period stiffening trusses ap-pears to limit maximum longitudi-nal displacements of the towers,therefore limiting maximum cur-vatures and global fiber strains inthe tower shafts.
-30
-20
-10
0
10
20
30
0 10 20 30 40 50 60 70 80Time (seconds)
Longitudinal displacement (in.) at mid-height of Tower 2
Fiber stress envelopes (ksi) without and with rocking
Fig. 12. Multi-support response of towers

Page 11
3. Three-dimensional behavior of the unbraced double-deck stiffening truss system puts significant bendingdemands on the joints between the floor beams and the truss posts. Transverse racking (distortion) of thetruss cross section causes many cycles of large bending demands about the longitudinal axes of trussposts and floor beams. The demands are critical at the connections between these two members that occurat each truss panel, where bending and shear capacity are provided primarily by the main gusset plates.Even at ¼ span (Fig. 13), the bendingdemands are significantly higher thanthe capacity of about 400 ft-k. Globaltransverse shear in the truss crosssection causes large bending momentsabout the vertical axes of the floorbeams, which apparently act as stubs,feeding transverse shear forces intothe relatively stiff floor slabs.
These global dynamic response analyses provided a reliable indication of the location and extent of damagethat can be expected in the West Bay Crossing due to a major earthquake. Seismic vulnerability of bridgecomponents was evaluated by comparing demands from these analyses with capacities, in accordance withthe performance criteria. In a few instances, such as the truss post / floor beam connections discussed above,the vulnerability of the bridge to loss of functionality or safety could be better estimated by refined analysesthat explicitly include additional nonlinear response mechanisms. Retrofitting measures required for thebridge to meet functionality and reparability criteria could also be refined on the basis of such studies.
LOCAL COMPONENT ANALYSES
Structural components were analyzed prior to global analyses to provide input to global model development,as well as after the global analyses to evaluate their performance. Both computer solutions and detailed handcalculations were used in these analyses. A few of the more interesting studies are summarized here.
Foundations
Three-dimensional soil-structure interaction (SSI) analyses were conducted by Geomatrix using the computerprogram SASSI [9] for both pre- and post- global assessments. Caissons W-2 through W-6 were subjected toadditional post-global check evaluations by OPAC using frame-element-and-dashpot models. The input rockmotions were the multiple support motions developed previously to account for effects of spatially incoherentground motions [3]. The SSI studies consisted of subsurface characterization, finite element modeling, devel-opment of impedance functions, development of input motions, and foundation demand / capacity evaluation.
Subsurface Characterization: Various clay layers up to 160 feet deep overlay Franciscan bedrock at the site. Alayered soil idealization was developed at each pier location; strain-compatible properties for the layers wereevaluated using the program SHAKE [10] to perform site response analyses with iteration on soil properties.Soil properties for the SHAKE analyses were based on published data for similar soils in the Bay Area.
Finite Element Models: Ten separate models were developed, each extending down to bedrock. Surroundingsoils were idealized as semi-infinite viscoelastic layers; underlying rock was idealized as a viscoelastic half-space. Layer thickness was selected to capture the anticipated frequency range of soil response. The caissonsand excavated soils were idealized as eight-node brick elements. An effective density and elastic moduluswere used to account for the open cells of the caissons. Hydrodynamic effects were simulated using addedmasses.
Impedance Functions: Frequency-dependent impedances defined as ij ij ijK ( ) = k ( )+i c ( ) weredeveloped for the six coupled DOF at an interface point on each foundation model. Frequency-independentmasses and stiffnesses were developed for the global time-domain model by fitting polynomials of the form
ij o ij o ijk ( ) = ( k ) - (m )2 ⋅ to the real part of the impedances. Damping function polynomials of the formij ij ij ij ij ijI = c = A + B +C + D2 3 were curvefit to the imaginary part. Good fits to the real parts sug-
gest that the frequency-dependent stiffness is reasonably approximated by a static stiffness and a mass.
-4000-3000-2000-1000
01000200030004000
0 10 20 30 40 50 60 70 80
Time (seconds)
Fig. 13: Transverse bending (ft-k) of connectionbetween truss post and floor beam at ¼ of main span

Page 12
Motions: Histories of foundation accelerations, velocities, and displacements at each interface DOF werecomputed from the SSI analyses, for use in developing the driving functions for the global analysis. Inputmotions were taken as the rock accelerations generated in the Seismic Ground Motion Coherency Study [3].
Response: Foundation response was evaluated by driving the SSI models with the rock motions and the inter-face forces from the superstructure. As a check, simpler models consisting of frame elements for the caissons,springs for the bedrock, dashpots for the soil, and lumped masses for the water were evaluated under the sameconditions. The two models provided time-histories and envelopes of demands over the height of the caissons.
Envelopes of transverse shear forces and longitudinal-axis moments in caisson W-4 are shown in Fig. 14. Forall caissons, the SASSI and frame models agreed within about 20 percent.
-210-200-190-180-170-160-150-140-130-120-110-100-90-80-70-60-50-40-30-20-10
0
0.0E+0 1.0E+5 2.0E+5 3.0E+5 4.0E+5 5.0E+5
Cai
sson
Ele
v. (f
t)
Frame SASSI
Transverse shear (kips)
-210-200-190-180-170-160-150-140-130-120-110-100-90-80-70-60-50-40-30-20-10
0
0.0E+0 2.0E+8 4.0E+8 6.0E+8 8.0E+8
Cai
sson
Ele
v. (f
t)
Frame SASSI
Longitudinal-axis bending (inch-kips)
Fig. 14: Demand envelopes for caisson W-4
Vulnerability evaluation of the caissons was limited to comparing the shear and bending demands discussedabove with corresponding capacities. The caissons are lightly reinforced with low-deformation bars; somelight-gauge steel formwork supports left from construction clouded the capacity evaluation issues. Even con-sidering this steel as fully effective, cracking moments were larger than ultimate moment capacities. The con-sultants’ vulnerability conclusions were based on expressing shear demands as a function of f c' and com-paring them to limiting values between 2 (the ACI limit) and 6 (a value supported by some experiments butnot in accordance with Caltrans retrofit criteria), and by comparing axial and bending demands with conven-tionally calculated P-M interaction surfaces. Such comparisons for the demands on W-4 are shown in Fig. 15.In interpreting this figure it is valuable to note that the natural period of this caisson is about ¼ second.
-210-200-190-180-170-160-150-140-130-120-110-100-90-80-70-60-50-40-30-20-10
0
0 1 2 3 4 5 6 7 8 9 10 11 12 13 14Stress [ksi / sqrt (f'c=5000 psi)]
Cai
sson
Ele
v. (f
t)
Trans. Shear-Frame Long. Shear-Frame
Trans. Shear-SASSI Long. Shear-SASSI
Shear
0
1000000
2000000
3000000
4000000
5000000
6000000
7000000
0E+0 2E+8 4E+8 6E+8 8E+8 1E+9M|long. axis (k-in)
P(k)
Axial & Longitudinal Bending
Fig. 15: Demand vs. Capacity for caisson W-4

Page 13
Stand-alone Tower Models
A model of Tower 2 was evaluated for vibration prop-erties, dynamic response, and the effects of tower-baserocking. The tower and caisson models were taken di-rectly from the global model. Inclined springs repre-sented the elastic stiffness of the cable.
Vibration modes were extracted to determine how shorta structural period is required to adequately capturemass participation of the tower. The first three vibrationmodes are illustrated in Fig. 16.
The computed vibration properties illustrated that fun-damental tower modes fall in or near the plateau of theacceleration spectra for the evaluation earthquakes,suggesting that the towers will respond quite strongly tothe ground motions. Also, it showed that considerationof vibration periods as short as ¼ second is necessary inorder to capture 90% of the tower mass.
Tower Bases
An inelastic finite element model of the base of Tower 3 was analyzed by Anatech to evaluate behavior, per-formance, and damage patterns as moments cause the edges of the tower base to uplift. It was also used tovalidate the filamented model used in global analyses. The model included explicit consideration of the base-plate, anchor bolts, stiffening fins, vertical webs and bulkheads up to the third bulkhead, 21 ft above the base-plate. Longitudinal rocking behavior was studied by loading the model with vertical dead load and then in-crementing a rotation about the transverse axis.
The model was pushed to a deformation d/c ratio of about 3.0 (Fig. 17); a sharp drop in moment was observedat a system d/c ratio of 2.9 (0.0115 radians rotation). The drop in capacity appears to be associated withbuckling of the fins, especially those at the corners. The 1.9% strains in the anchor bolts are far from fractureeven at peak deformation. Inelastic rivet behavior was not modeled; at a few critical locations, however, rivetdemand exceeded capacity by a factor of two. Plastic strains caused a permanent-set deformation after un-loading. At a d/c ratio of 2.0 (the highest value from the global analysis), about 24.5’ of the baseplate uplifts(¾ of the base length), and fairly limited plate buckling was observed.
Base rotation response Deformed shaped at d/c = 2.8
Fig. 17: Inelastic model of Tower 3 base region
Longitudinal Transverse TorsionalT=1.01 sec. T=0.98 sec. T=0.77 sec.
Fig. 16: Tower 2 Vibration modes
Page 14
Stiffening Trusses
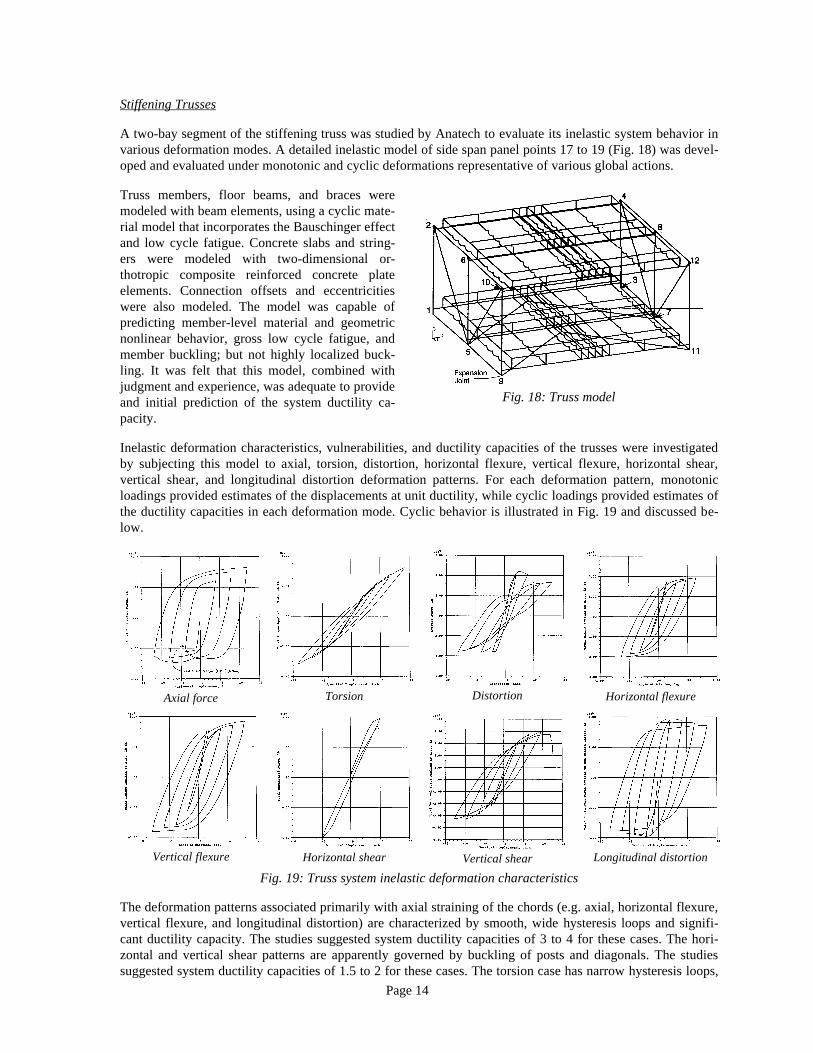
A two-bay segment of the stiffening truss was studied by Anatech to evaluate its inelastic system behavior invarious deformation modes. A detailed inelastic model of side span panel points 17 to 19 (Fig. 18) was devel-oped and evaluated under monotonic and cyclic deformations representative of various global actions.
Truss members, floor beams, and braces weremodeled with beam elements, using a cyclic mate-rial model that incorporates the Bauschinger effectand low cycle fatigue. Concrete slabs and string-ers were modeled with two-dimensional or-thotropic composite reinforced concrete plateelements. Connection offsets and eccentricitieswere also modeled. The model was capable ofpredicting member-level material and geometricnonlinear behavior, gross low cycle fatigue, andmember buckling; but not highly localized buck-ling. It was felt that this model, combined withjudgment and experience, was adequate to provideand initial prediction of the system ductility ca-pacity.
Inelastic deformation characteristics, vulnerabilities, and ductility capacities of the trusses were investigatedby subjecting this model to axial, torsion, distortion, horizontal flexure, vertical flexure, horizontal shear,vertical shear, and longitudinal distortion deformation patterns. For each deformation pattern, monotonicloadings provided estimates of the displacements at unit ductility, while cyclic loadings provided estimates ofthe ductility capacities in each deformation mode. Cyclic behavior is illustrated in Fig. 19 and discussed be-low.
Axial force Torsion Distortion Horizontal flexure
Vertical flexure Horizontal shear Vertical shear Longitudinal distortion
Fig. 19: Truss system inelastic deformation characteristics
The deformation patterns associated primarily with axial straining of the chords (e.g. axial, horizontal flexure,vertical flexure, and longitudinal distortion) are characterized by smooth, wide hysteresis loops and signifi-cant ductility capacity. The studies suggested system ductility capacities of 3 to 4 for these cases. The hori-zontal and vertical shear patterns are apparently governed by buckling of posts and diagonals. The studiessuggested system ductility capacities of 1.5 to 2 for these cases. The torsion case has narrow hysteresis loops,
Fig. 18: Truss model

Page 15
it lacks a well-defined yield point and appears to be governed by geometric nonlinearity. The studies sug-gested system ductility capacities of about 3 for this case. The distortion case has narrow hysteresis loops ofdramatically decreasing stiffness, indicative of progressive failure not associated with axial stress-strain. Re-sistance is primarily due to bending of the post-girder box frame. Failure was at a system ductility of about 3.
Summary
The local component analyses described above, along with additional local analyses of other component as-semblies and individual members, provided the vulnerability assessment with quantitative data to correlatestructural demands from the global model with damage to the components, and to correlate damage to vulner-ability. They provided a key component in implementation of the vulnerability criteria for the project.
VULNERABILITY
The engineering studies conducted in the structural evaluation of the West Bay Crossing led to predictions ofthe following vulnerabilities to function-or safety- threatening damage in the maximum credible event:
1. The foundations of Piers W-2 through W-6 are subject to significant biaxial shear and moment demands.The effects of these demands could include some caisson rocking, shear and tension cracking of the con-crete above and below the mud line, and spalling of concrete cover on both inside and outside surfaces.
2. Tower vulnerability is predicted at the bases (plate buckling and tension yield of the hold-down bolts),riveted splices (plate buckling and tension fracture), cable saddles (longitudinal shear), truss connections(pounding), and struts (longitudinal shear and bending). The cable bents are similarly vulnerable.
3. The suspended truss system is vulnerable to damage in transverse bending of the floor beams (due toglobal transverse shear), bending of the truss post joints (due to distortion), and buckling of the chordsand diagonals (due to vertical and transverse system curvatures). Large transverse shears in the roadwayslabs are also predicted, particularly in the unbraced upper chord plane. This truss damage may be corre-lated to loss of function, but probably not to overall stability problems since the cables carry all deadload.
4. The continuous trusses at the San Francisco Anchorage have transverse vulnerabilities similar to the sus-pended trusses. In addition their bottom chords are under high demand near the fixed bearings on the An-chorage. The bearings and bents that support these spans are also under high demands.
5. The concrete piers, anchorage housings, and center anchorage are under high demands due to both over-all shaking and local wall flexure. The are lightly reinforced, but their thick and compact walls may havesome out-of-plane reserve strength due to internal arching action.
The suspenders, cables, and anchorages were found to be relatively unsusceptible to damage due to theevaluation ground motions. Slackening (or complete loss of tension) of the main cables is not predicted, andonly in one incident do any suspenders slacken. Only some local slapping damage is predicted in the cables,where they enter the anchorage housings and pass through other steelwork.
RETROFIT
Retrofit measures were identified by the consultant team to address each of the vulnerabilities found in theevaluations. Retrofit engineering is now being undertaken by Caltrans and is outside the scope of this paper.
CONCLUSIONS
A detailed seismic vulnerability evaluation was undertaken of the West Bay Crossing of the San Francisco -Oakland Bay Bridge. A primary objective of the engineering studies that were undertaken was to estimate thesafety and functionality of the bridge in earthquakes of various probabilities. The assumptions, methods, andresults of these components are summarized here.

Page 16
Performance criteria addressed functionality, safety, and reparability. Component performance was expressedin terms of deformation capacities, which depend on the form, function, and behavior of the item.
Multi-support rock motions provided by Caltrans were used in the response analyses. The safety evaluationmotions were representative of a Maximum Credible Event (Mw=8) on the San Andreas Fault.
Numerous local and global computer models were used to predict the seismic response and behavior of thebridge. Global models were used to evaluate overall behavior and demands. Local models were used to de-velop simplified global representations of subsystems, and to provide refined estimates of deformation ca-pacities.
The global model represented the entire bridge from anchorage to anchorage, and was subjected to static anddynamic analyses to arrive at estimates of seismic demands and behavior of the bridge.
Local component analyses were performed of the foundations, towers, stiffening trusses, and other compo-nents in order to calibrate demands to damage and damage to vulnerability.
The bridge was found to be susceptible to some damage in both the safety evaluation and functional evalua-tion earthquakes. Retrofit measures were identified to address these vulnerabilities.
ACKNOWLEDGMENTS
The seismic studies described here were performed under contract to Caltrans by OPAC Consulting Engineersand subconsultants Anatech Applications, Geomatrix Consultants, Tudor Engineering Company, EKM Engi-neering, Dr. Greg Luth, and Prof. Helmut Krawinkler. Stanford Larsen was Contract Manager for Caltrans.The extraordinary efforts of all agencies, companies, and individuals who contributed to the project are grate-fully acknowledged. Special thanks are due to Kwong Cheng, Francis Drouillard, Chin-Yung Chang, RobertDameron, Heinz Mueller, Ed McNinch, Greg Luth, Helmut Krawinkler, their staffs, and Peets Coffee.
REFERENCES
1. Ketchum, M.A., “Seismic Analysis of the Existing West Bay Spans of the San Francisco - Oakland BayBridge”, Contract No. 59U064, prepared for Caltrans by OPAC Consulting Engineers, 1994.
2. Power, M., “Seismic Ground Motion Study for West San Francisco Bay Bridge”, Contract No. 59N772,prepared for Caltrans by Geomatrix Consultants, 1992.
3. Power, M., “Seismic Ground Motion Coherency Study for West San Francisco Bay Bridge”, ContractNo. 59N772, prepared for Caltrans by Geomatrix Consultants, 1992.
4. Raab N.C., and Wood H.C., “Earthquake Stresses in the San Francisco-Oakland Bay Bridge”, ASCETransactions, Paper No. 2123, v. 106, pp. 1363-1390, 1941.
5. Gates, J., Caltrans Seismic Performance Criteria Directive Memo, March 9, 1993.
6. Ivy, et al. “Live Loading for Long-Span Highway Bridges,” Transactions of the ASCE, Vol. 119, 1954.
7. Ketchum, M.A., “Benicia-Martinez Bridge Preliminary Engineering Study, Segmental Concrete BoxGirder Alternatives”, Contract No. 59K051, prepared for Caltrans by T.Y. Lin International, 1990.
8. Carder, Dean S., “Observed Vibration of Bridges”, Bulletin of the Seismological Society of America, v.27, no. 4, pp. 267-303, October 1937.
9. Lysmer, J., et al., “SASSI - a system for analysis of soil-structure interaction”, Report No. UCB/GT/81-02, Geotechnical Engineering, University of California, Berkeley, California, 1981.
10. Schnabel, P.B., et al., “SHAKE - A computer program for earthquake response analysis of horizontallylayered sites”, Report No. UCB/EERC 71-12, EERC, University of California, Berkeley, December1972.