calfed bay-delta program performance measures report · calfed bay-delta program performance...
TRANSCRIPT
CALFED Bay-Delta Program Performance Measures Report
Phase 1 Report
FINAL
October 23, 2007
PARTICIPANTS
Performance Measures Subcommittee
Bill Burkhard, DWR Scott Cantrell, DFG Steve Cimperman, DWR Steven Detwiler, FWS Bill Foster, CBDA Donna Garcia, USBR Lauren Hastings, CBDA Lisa Holm, CBDA Leslie Laudon, SWRCB Lynn O’Leary, USACE Bart Prose, FWS Steve Roberts, DWR John Ryan, CBDA Elizabeth Soderstrom, CBDA David Spath, DHS Ken Trott, CDFA Diane Windham, NOAA Carolyn Yale, USEPA
Water Quality Subgroup
Carol Atkins, DFG Steve Book, CDPH Stephanie Fong, RWQCB Lisa Holm, CBDA Roger Fujii, USGS Lauma Jurkevics, SWRCB Tom Kimball, SWRCB Karen Larsen, RWQCB Rafael Maestu, SWRCB Kari Schumaker, SWRCB Alyce Ujihara, CDPH Lori Webber, RWQCB Carolyn Yale, USEPA
Water Supply Reliability Subgroup
Steve Cimperman, DWR Donna Garcia, USBR Paul Massera, DWR Jason Phillips, USBR
Steve Roberts, DWR Ecosystem Restoration Subgroup
Neil Clipperton, DFG Steven Detwiler, USFWS Bart Prose, FWS Diane Windham, NOAA
Levee System Integrity Subgroup
Bill Burkhard, DWR Lynn O’Leary, USACE Bob Orcutt, DFG Mike Mirmazaheri, DWR
TABLE OF CONTENTS
1. Executive Summary ............................................................................................................. 1 2. Performance Measures ......................................................................................................... 6
2.A. Water Supply Reliability .............................................................................................. 6 2.B. Water Quality................................................................................................................ 8 2.C. Levee System Integrity ............................................................................................... 12 2.D. Ecosystem Restoration................................................................................................ 13
3. Implementation Plan .......................................................................................................... 20 3.A. Relationship to Other Delta Efforts ............................................................................ 20 3.B. Water Supply Reliability............................................................................................. 24 3.C. Water Quality.............................................................................................................. 30 3.D. Levee System Integrity ............................................................................................... 38 3.E. Ecosystem Restoration ................................................................................................ 41
Appendix A: Performance Measures Framework................................................................ A-1 Appendix B: Glossary of Terms........................................................................................... B-1 Appendix C: Additional Information ................................................................................... C-1
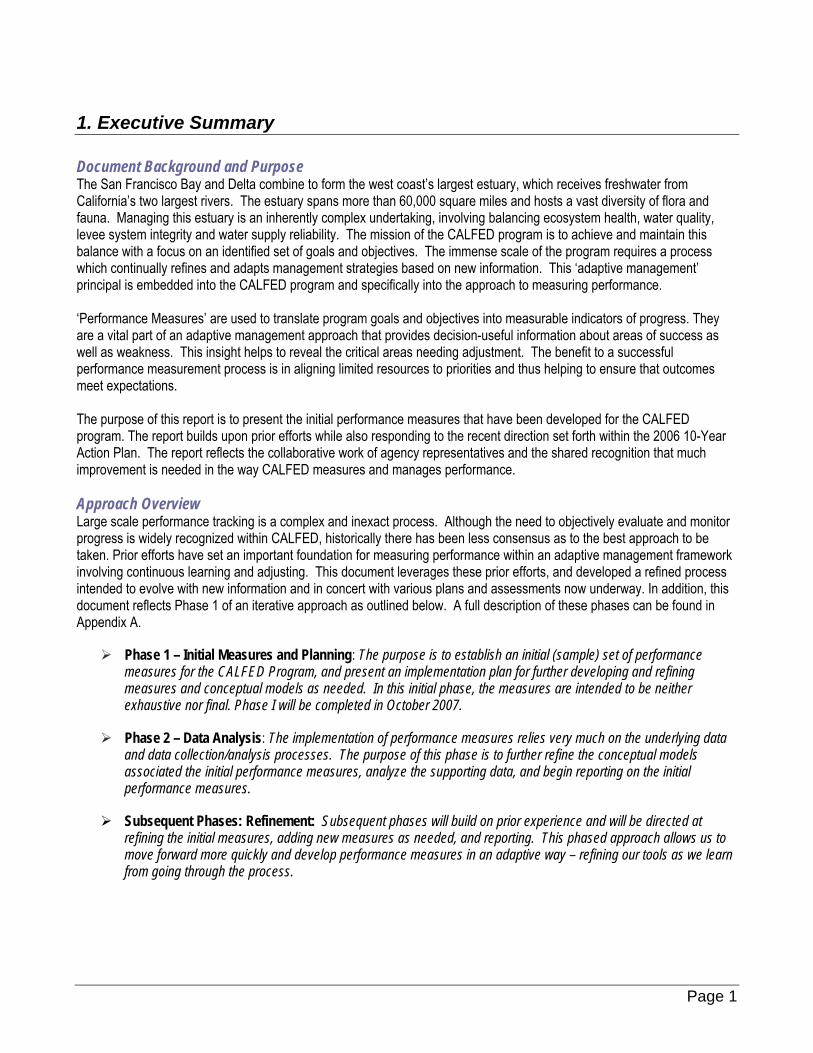
1. Executive Summary Document Background and Purpose The San Francisco Bay and Delta combine to form the west coast’s largest estuary, which receives freshwater from California’s two largest rivers. The estuary spans more than 60,000 square miles and hosts a vast diversity of flora and fauna. Managing this estuary is an inherently complex undertaking, involving balancing ecosystem health, water quality, levee system integrity and water supply reliability. The mission of the CALFED program is to achieve and maintain this balance with a focus on an identified set of goals and objectives. The immense scale of the program requires a process which continually refines and adapts management strategies based on new information. This ‘adaptive management’ principal is embedded into the CALFED program and specifically into the approach to measuring performance. ‘Performance Measures’ are used to translate program goals and objectives into measurable indicators of progress. They are a vital part of an adaptive management approach that provides decision-useful information about areas of success as well as weakness. This insight helps to reveal the critical areas needing adjustment. The benefit to a successful performance measurement process is in aligning limited resources to priorities and thus helping to ensure that outcomes meet expectations. The purpose of this report is to present the initial performance measures that have been developed for the CALFED program. The report builds upon prior efforts while also responding to the recent direction set forth within the 2006 10-Year Action Plan. The report reflects the collaborative work of agency representatives and the shared recognition that much improvement is needed in the way CALFED measures and manages performance. Approach Overview Large scale performance tracking is a complex and inexact process. Although the need to objectively evaluate and monitor progress is widely recognized within CALFED, historically there has been less consensus as to the best approach to be taken. Prior efforts have set an important foundation for measuring performance within an adaptive management framework involving continuous learning and adjusting. This document leverages these prior efforts, and developed a refined process intended to evolve with new information and in concert with various plans and assessments now underway. In addition, this document reflects Phase 1 of an iterative approach as outlined below. A full description of these phases can be found in Appendix A.
Phase 1 – Initial Measures and Planning: The purpose is to establish an initial (sample) set of performance measures for the CALFED Program, and present an implementation plan for further developing and refining measures and conceptual models as needed. In this initial phase, the measures are intended to be neither exhaustive nor final. Phase I will be completed in October 2007.
Phase 2 – Data Analysis: The implementation of performance measures relies very much on the underlying data and data collection/analysis processes. The purpose of this phase is to further refine the conceptual models associated the initial performance measures, analyze the supporting data, and begin reporting on the initial performance measures.
Subsequent Phases: Refinement: Subsequent phases will build on prior experience and will be directed at refining the initial measures, adding new measures as needed, and reporting. This phased approach allows us to move forward more quickly and develop performance measures in an adaptive way – refining our tools as we learn from going through the process.
Page 1
This phased approach will also incorporate multiple reviews. Preliminary performance measures documents will undergo review by CALFED Bay-Delta Public Advisory Subcommittees, the full CALFED Bay-Delta Public Advisory Committee, as well as the CALFED Independent Science Board where performance measures are a standing agenda item on board meetings. When and where appropriate, the CALFED Science Program will convene Science Review Panels to perform in-depth science reviews of the technical aspects. Performance measure products are also made available on the CALFED website for additional public review opportunities. The CALFED Bay-Delta Advisory Committee and Independent Science Board make recommendations on performance measure products before they are considered by the California Bay-Delta Authority Board for adoption. This report presents Phase 1 results, including initial measures and planning. These measures have been developed in accordance with the Performance Measures Guiding Framework (Framework) established by the CALFED Science Program (Appendix A). The framework is comprised of the following elements:
Administrative Measures: These measures describe what resources (funds, programs, projects) are being implemented (or plan to be implemented). These may also be called “input measures”.
Drivers: These measures describe the factors that may be influencing outcome measures. There are two types of driver indicators:
a. Outputs, including on-the-ground implementation of management actions, such as acres of habitat restored, miles of levees strengthened, etc, and
b. Uncontrollable factors, often natural phenomena not caused by the management actions of the program, such as weather and hydrologic fluctuations.
Outcome Measures: Also called “response,” or “results” measures, these measures describe the ultimate outcome of the management action upon the ‘system’ that is being managed, in this case the Bay-Delta region. These measures should be tied to the goals and objectives of the program.
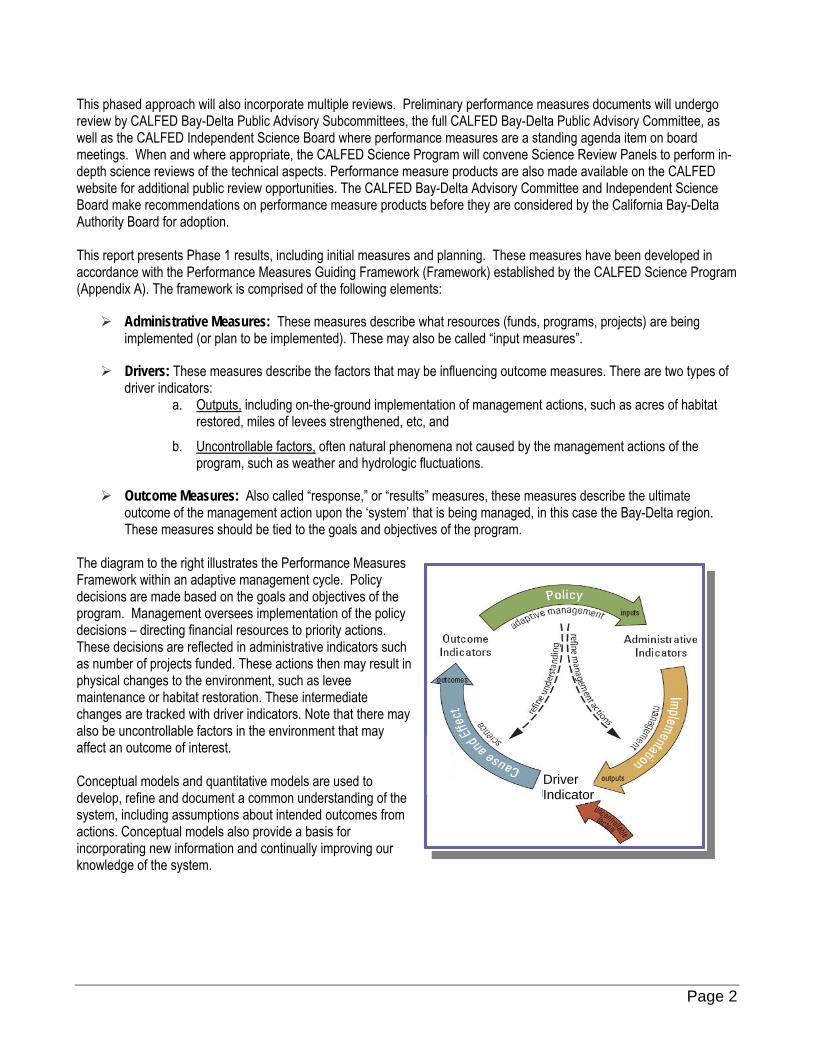
The diagram to the right illustrates the Performance Measures Framework within an adaptive management cycle. Policy decisions are made based on the goals and objectives of the program. Management oversees implementation of the policy decisions – directing financial resources to priority actions. These decisions are reflected in administrative indicators such as number of projects funded. These actions then may result iphysical changes to the environment, such as levee maintenance or habitat restoration. These intermediate changes are tracked with driver indicators. Note that there may also be uncontrollable factors in the environment that may affect an outcome of interest.
Driver Indicator
n
Conceptual models and quantitative models are used to develop, refine and document a common understanding of the system, including assumptions about intended outcomes from actions. Conceptual models also provide a basis for incorporating new information and continually improving our knowledge of the system.
Page 2
Overview The CALFED Record of Decision, signed in August 2000, was designed to provide a blueprint to address the needs of major stakeholders. The ROD defined CALFED as comprising 11 program elements, organized around the following four primary objectives. Below are the initial performance measures for each of the CALFED Program areas.
Water Supply Reliability Performance Measure 1: The annual number of incidences when water quality standards, flow
requirements, or other agreements related to SWP operations throughout the Delta are not met. Target 1: Zero incidences of not meeting water quality and flow requirements, or other
agreements throughout the Delta related to SWP operations. Performance Measure 2: Acre-feet of unexpected reductions in SWP water supplies due to
Delta export reductions to meet Endangered Species Act requirements or actions taken to protect at-risk Delta fish species during the current year.
Target 2: Zero unexpected reductions in SWP water supplies. Performance Measure 3: Acre-feet of water delivered in a water year with a description of the
conditions during the water year for each delivery (e.g. above average snowpack, salinity problems in Delta during July, etc.) This would be compared to a long-term delivery capability estimate for the same type of water year.
Target 3: Actual annual deliveries within one standard deviation of the long term statistical mean for a given water year type
Water Quality Performance Measure 1: Annual averages of organic carbon and bromide at Delta intakes
Target: 50 µg/L bromide Target: 3.0 mg/L total organic carbon
Performance Measure 2: Equivalent level of public health protection5 (i.e., equivalent to meeting targets for organic carbon and bromide above)
Target: Under development through technical studies Performance Measure 3: Toxicity to aquatic test organisms (water and sediment)
Target: No toxicity from controllable sources Performance Measure 4: Tools for identifying causes of toxicity are added to currently available
suite Target: All causes and sources of toxicity of high magnitude, duration, and frequency are
identified Performance Measure 5: Mercury concentrations in the tissue of representative Bay-Delta fish
and wildlife species1
1 The targets for this performance measure is based on the Draft Methylmercury TMDL and may change accordingly once the TMDL is finalized.
Page 3
Target: Mercury levels in fish tissue are safe for consumption by humans and wildlife (Draft Delta methylmercury TMDL targets – 0.07 and 0.24 mg methylmercury/kg, in muscle tissue of trophic level 3 and 4 fish, respectively [150-500 mm total length]2 and 0.03 mg methylmercury/kg wet weight in whole fish less than 50 mm in length3)
Driver indicator for mercury in fish tissue: Methylmercury concentrations in water Target: Draft Delta methylmercury TMDL target – 0.06 ng/L4
Performance Measure 6: Mercury exposure is at a safe level for all individuals that consume Bay-Delta fish
Target: Safe eating guidelines (also known as “advisories”) are developed for all waterbodies in the watershed where contaminant levels in fish are known or expected to be elevated
Target: All individuals that consume Bay-Delta fish are aware of the health risks and benefits of eating Bay-Delta fish, and are familiar with measures to protect their health5
Target: Human exposure to mercury, as measured in surveys or in biological samples such as blood or hair, is at safe levels in affected populations, including sensitive subpopulations.
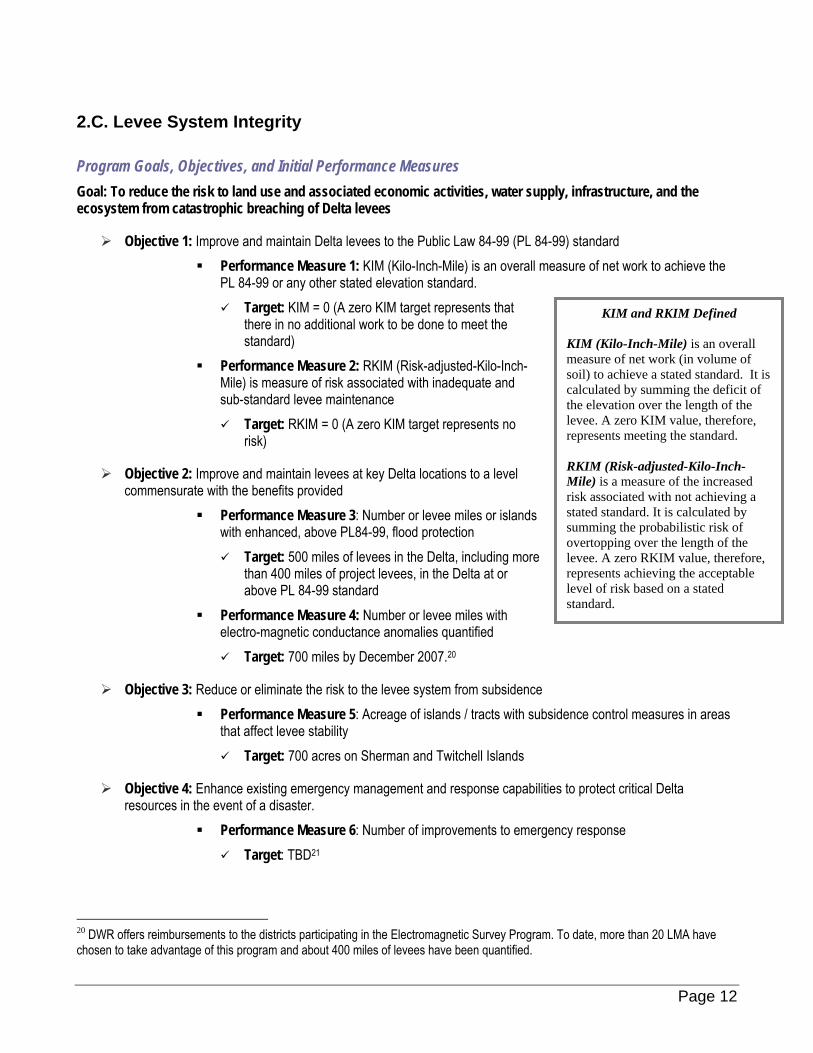
Levee System Integrity Performance Measure 1: KIM (Kilo-Inch-Mile) is an overall measure of net work to achieve the
PL 84-99 standard Target: KIM = 0 (A zero KIM target represents that there in no additional work to be done to
meet the standard) Performance Measure 2: RKIM (Risk-adjusted-Kilo-Inch-Mile) is measure of risk associated with
inadequate and sub-standard levee maintenance Target: RKIM = 0 (A zero KIM target represents no risk)
Performance Measure 3: Number of levee miles or islands with enhanced (above PL84-99) flood protection
Target: 500 miles of levees in the Delta, including more than 400 miles of project levees, in the Delta at or above PL 84-99 standard
Performance Measure 4: Number of levee miles with electro-magnetic conductance anomalies quantified
Target: 700 miles by December 20076 Performance Measure 5: Acreage of islands / tracts with subsidence control measures
Target: 700 acres on Sherman and Twitchell Islands
2 These targets are protective of (a) humans eating 32 g/day of commonly consumed large fish; and (b) all wildlife species that consume large fish. There are populations that consume more than 32 g/day of Bay-Delta fish. 3 This target is protective of wildlife species that consume small fish. 4 There is a direct link between aqueous methylmercury concentrations and fish tissue concentrations. The draft methylmercury TMDL for the Delta concludes that reducing aqueous methylmercury concentrations to 0.06 ng/L should result in achievement of the fish tissue targets. 5 Increases in awareness and knowledge in affected populations can be measured using standard evaluation tools such as surveys, interviews, focus groups, etc. 6 DWR offers reimbursements to the districts participating in the Electromagnetic Survey Program. To date, more than 20 LMA have chosen to take advantage of this program and about 400 miles of levees have been quantified.
Page 4

Performance Measure 6: Number of improvements to emergency response Target: TBD
Ecosystem Restoration Performance Measure 1: Achieve recovery for CALFED “R” species
Target: Minimum viable population with risk of extinction not to exceed 5% chance over 100 years (including impacts from projected future stressors)
Performance Measure 2: Contribute to recovery for CALFED “r” species Target: Stable or positive population trends or stable numbers at some predetermined
benchmark (e.g., equal to pre-determined baseline) Performance Measure 3: Conserve non-listed native species
Target: Stable or positive population trends Performance Measure 4: Sustain populations of (non-listed) harvested species
Target: Double from Established Baseline (as prescribed within the CVPIA doubling objective for anadromous fish) or maintain stable populations (for other harvested taxa
Performance Measure 5: Protect ecosystem integrity as measured in broad-based indicators of estuarine “health”
Target: Diversity indices, community metrics, etc. (e.g., Shannon’s H or Simpson’s D and E) using a defined Delta-specific baseline (to be determined)
Performance Measure 6: Control and prevent invasive species Target: No new colonizations/no net increase in range or dominance of extant invaders
Performance Measure 7: Reduce or eliminate contaminant impacts to native flora and fauna, (and species upon which they depend)
Target: Reduction or remediation of known contaminants to the lesser of either: 1) the lower 95% confidence limit of the EC10 (for non-lethal endpoints) or, 2) ≤ LC01 for the 95% most sensitive species (where mortality is the endpoint of concern)
Performance Measure 8: Population status of Lange’s Metalmark Target: Maintain a five year moving average count of Lange’s metalmark adults (based on
flight season peak population counts) of 2000 individuals Driver Indicator (predominant driver): Maintain densities of auriculate naked-stemmed
buckwheat (host plant) within the critical Antioch Dunes habitat for the Lange’s Metalmark at a minimum percent cover of X%. (Control measures to increase host plant density include firebreak maintenance and carefully managed disking)
Driver Indicator (indirect driver): Reduce invasive plant species in inverse proportion to the density of the host species (metric to be defined), through scraping to expose sandy soils and careful use of herbicides2. Performance Measures
Page 5
2. Performance Measures
2.A. Water Supply Reliability Program Goals and Objectives This section describes two proposed strategic objectives designed to help provide a stable water supply from and within the Delta. The first strategic objective will be the focus of the CALFED Program, consistent with recommendations developed through the CALFED refocusing effort of 2005. The second strategic objective will be developed and evaluated primarily through the California Water Plan Update process, with significant coordination and communication between the Water Plan Update process and the CALFED Program. Proposed Goal, Objectives and Initial Performance Measures
Strategic Objecive 1: Enhance Stability of Delta Water Supplies (CALFED Focus)
Performance Objective 1: Provide water supply in sufficient quantity and timing to meet the regulatory baseline and additional contractual commitments for the protection of water quality and the ecosystem. Water supplies for these purposes will be provided subject to the terms included in the Bay-Delta Water Quality Control Plan, ESA Biological Opinions, HCP and NCCP agreements, EWA Operating Principles agreement, and any other relevant regulations or agreements of the CALFED implementing agencies. These regulations and agreements will change as scientific understanding of the water supply needs for water quality improvement and ecosystem restoration evolves.
Performance Measure 1: The annual number of incidences when water quality standards, flow requirements, or other agreements related to SWP operations throughout the Delta are not met.
Target 1: Zero incidences of not meeting water quality and flow requirements, or other agreements throughout the Delta related to SWP operations.
Performance Objective 2: Increase the certainty of Delta water deliveries in the short-term. The primary component of water delivery certainty is the degree of confidence that a scheduled quantity of water will be delivered as planned.
Performance Measure 2: Acre-feet of unexpected reductions in SWP water supplies due to Delta export reductions to meet Endangered Species Act requirements or actions taken to protect at-risk Delta fish species during the current year.
Target 2: Zero unexpected reductions in SWP water supplies.
Performance Objective 3: Increase the certainty of Delta water deliveries relative to an estimated long-term delivery capability
Performance Measure 3: Acre-feet of water delivered in a water year with a description of the conditions during the water year for each delivery (e.g. above average snowpack, salinity problems in Delta during July, etc.) This would be compared to a long-term delivery capability estimate for the same type of water year.
Target 3:Actual annual deliveries within one standard deviation of the long term statistical mean for a given water year type
Page 6
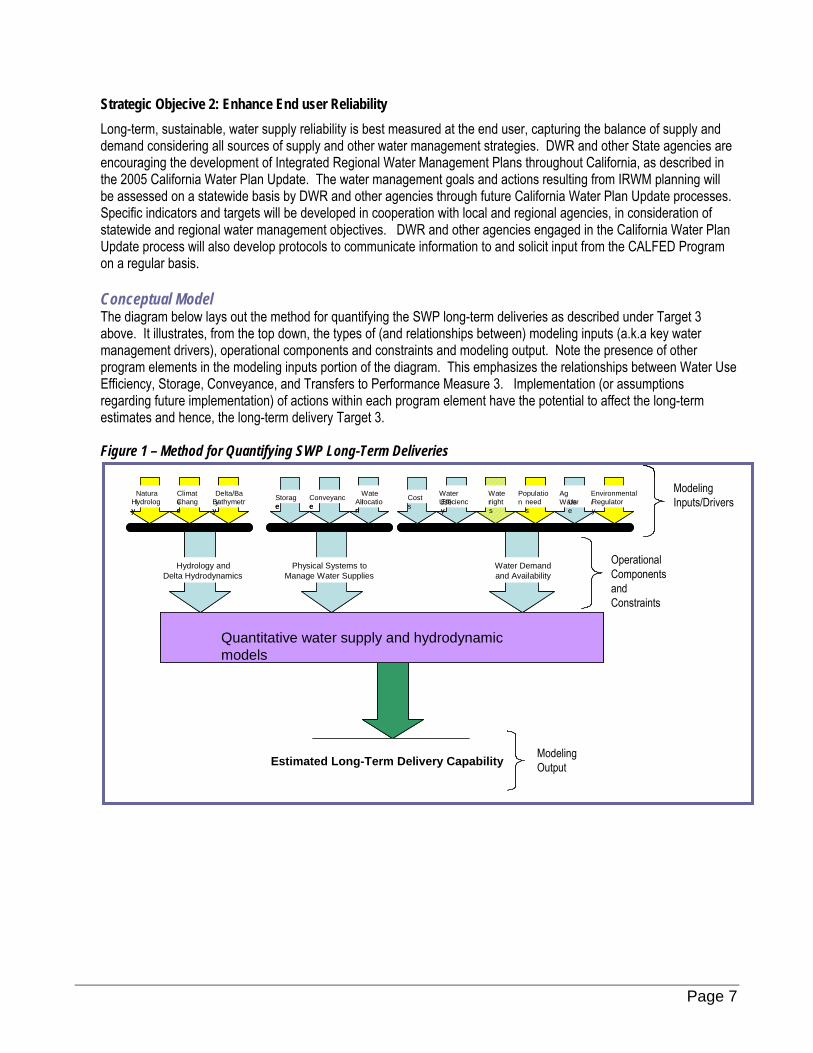
Strategic Objecive 2: Enhance End user Reliability Long-term, sustainable, water supply reliability is best measured at the end user, capturing the balance of supply and demand considering all sources of supply and other water management strategies. DWR and other State agencies are encouraging the development of Integrated Regional Water Management Plans throughout California, as described in the 2005 California Water Plan Update. The water management goals and actions resulting from IRWM planning will be assessed on a statewide basis by DWR and other agencies through future California Water Plan Update processes. Specific indicators and targets will be developed in cooperation with local and regional agencies, in consideration of statewide and regional water management objectives. DWR and other agencies engaged in the California Water Plan Update process will also develop protocols to communicate information to and solicit input from the CALFED Program on a regular basis. Conceptual Model The diagram below lays out the method for quantifying the SWP long-term deliveries as described under Target 3 above. It illustrates, from the top down, the types of (and relationships between) modeling inputs (a.k.a key water management drivers), operational components and constraints and modeling output. Note the presence of other program elements in the modeling inputs portion of the diagram. This emphasizes the relationships between Water Use Efficiency, Storage, Conveyance, and Transfers to Performance Measure 3. Implementation (or assumptions regarding future implementation) of actions within each program element have the potential to affect the long-term estimates and hence, the long-term delivery Target 3. Figure 1 – Method for Quantifying SWP Long-Term Deliveries
Natural Hydrolog
y
Climate Change
Water Allocatio
n
Delta/Bay Bathymetr
y
Conveyance
Water rights
Population need
s
Ag Water Us
e
Environmental need
s
Hydrology and Delta Hydrodynamics
Costs
Water Demand and Availability
% of environmental demand supplied
Quantitative models:CALSIM,
WSR 2WSR 1
Water Use Efficiency
Storage
Physical Systems to Manage Water Supplies
% of export demand supplied
Natural Hydrolog
y
Climate Change
Water Allocatio
n
Delta/Bay Bathymetr
y
Conveyance
Water rights
Population need
s
Ag Water Us
e
Environmental/ Regulatory
Hydrology and Delta Hydrodynamics
Costs
Water Demand and Availability
% of environmental demand supplied
Quantitative water supply and hydrodynamic models
WSR 2WSR 1
Water Use Efficiency
Storage
Physical Systems to Manage Water Supplies
% of export demand supplied
Estimated Long-Term Delivery Capability Modeling Output
Operational Components and Constraints
Modeling Inputs/Drivers
Natural Hydrolog
y
Climate Change
Water Allocatio
n
Delta/Bay Bathymetr
y
Conveyance
Water rights
Population need
s
Ag Water Us
e
Environmental need
s
Hydrology and Delta Hydrodynamics
Costs
Water Demand and Availability
% of environmental demand supplied
Quantitative models:CALSIM,
WSR 2WSR 1
Water Use Efficiency
Storage
Physical Systems to Manage Water Supplies
% of export demand supplied
Natural Hydrolog
y
Climate Change
Water Allocatio
n
Delta/Bay Bathymetr
y
Conveyance
Water rights
Population need
s
Ag Water Us
e
Environmental/ Regulatory
Hydrology and Delta Hydrodynamics
Costs
Water Demand and Availability
% of environmental demand supplied
Quantitative water supply and hydrodynamic models
WSR 2WSR 1
Water Use Efficiency
Storage
Physical Systems to Manage Water Supplies
% of export demand supplied
Estimated Long-Term Delivery Capability Modeling Output
Operational Components and Constraints
Natural Hydrolog
y
Climate Change
Water Allocatio
n
Delta/Bay Bathymetr
y
Conveyance
Water rights
Population need
s
Ag Water Us
e
Environmental need
s
Hydrology and Delta Hydrodynamics
Costs
Water Demand and Availability
% of environmental demand supplied
Quantitative models:CALSIM,
WSR 2WSR 1
Water Use Efficiency
Storage
Physical Systems to Manage Water Supplies
% of export demand supplied
Natural Hydrolog
y
Climate Change
Water Allocatio
n
Delta/Bay Bathymetr
y
Conveyance
Water rights
Population need
s
Ag Water Us
e
Environmental/ Regulatory
Hydrology and Delta Hydrodynamics
Costs
Water Demand and Availability
% of environmental demand supplied
Quantitative water supply and hydrodynamic models
WSR 2WSR 1
Water Use Efficiency
Storage
Physical Systems to Manage Water Supplies
% of export demand supplied
Estimated Long-Term Delivery Capability Modeling Output
Operational Components and Constraints
Modeling Inputs/Drivers
Page 7
2.B. Water Quality Program Goals and Objectives and Initial Performance Measures Goal: Provide good water quality for all beneficial uses.
Objective 1: Provide water quality at the intakes which meets CALFED drinking water goals Performance Measure 1: Annual averages of organic carbon and bromide at Delta intakes7
Target 1a: 50 µg/L bromide Target 1b: 3.0 mg/L total organic carbon
Objective 2: Provide safe, reliable, affordable drinking water using a cost-effective combination of alternative water sources, source control, and treatment technologies
Performance Measure 2: Equivalent level of public health protection (i.e., equivalent to meeting targets for organic carbon and bromide above).
Target: Under development through technical studies
Objective 3: Reduce toxicity to aquatic organisms in water and sediments8 Performance Measure 3: Toxicity to aquatic test organisms9 (water and sediment)
Target: No toxicity10 from controllable sources
Objective 4: Improve methods for identifying causes of toxicity11 Performance Measure 4: Tools for identifying causes of toxicity are added to currently available
suite Target: All causes and sources of toxicity of high magnitude, duration and frequency
identified
Objective 5: Reduce mercury in water and sediment to levels that do not adversely affect aquatic organisms, wildlife, and human health12
Performance Measure 5: Mercury concentrations in the tissue of representative Bay-Delta fish and wildlife species13
Target: Mercury levels in fish tissue are safe for consumption by humans and wildlife (Draft Delta methylmercury TMDL targets – 0.07 and 0.24 mg methylmercury/kg, in muscle tissue
7 The CALFED Record of Decision , p.9, sets out this goal. There is a more specific goal to continuously improve source water for drinking water quality. Additionally, the ROD specifies the water quality targets cited here for water quality at the intakes. 8 CALFED Water Quality Program Plan, p 11-1 9 Toxicity will be measured using USEPA toxicity test methods. For water column toxicity, the freshwater species, Pimephales promelas (minnow), Ceriodaphnic dubia (invertebrate), and Selenastrum capricornutum (algae), are used. For sediment, Hyallela azteca (amphipod), is used. 10 Toxicity is defined as a statistically significant difference in test organism performance (i.e., survival, growth, reproduction) compared to that in standard laboratory control water. 11 Ecosystem Restoration Program Plan, Goal 6, Objective 1 12 Water Quality Program Plan, p.4-2 13 Most measures are in terms of methylmercury, the toxic form of mercury that is bioavailable and that bioaccumulates.
Page 8
of trophic level 3 and 4 fish, respectively [150-500 mm total length]14 and 0.03 mg methylmercury/kg wet weight in whole fish less than 50 mm in length15)16
Driver indicator for mercury in fish tissue: Methylmercury concentrations in water. Target: Draft Delta methylmercury TMDL target – 0.06 ng/L17
Objective 6: Reduce exposure to mercury from consumption of Bay-Delta fish to levels that will protect humans from adverse health effects.18
Performance Measure 6: Mercury exposure is at a safe level for all individuals that consume Bay-Delta fish.
Target a: Safe eating guidelines (also known as “advisories”) are developed for all waterbodies in the watershed where contaminant levels in fish are known or expected to be elevated.
Target b: All individuals that consume Bay-Delta fish are aware of the health risks and benefits of eating Bay-Delta fish, and are encouraged to take measures to protect their health.19
Target c: Human exposure to mercury, as measured in surveys or in biological samples like blood or hair, is at safe levels in affected populations, including sensitive subpopulations.
Initial Key Driver Indicators Indicators for key drinking water quality drivers, discussed in the conceptual model summary below, are under development. For toxicity and mercury key drivers, and appropriate indicators, will be identified in Phase 2. These activities will be closely coordinated with DRERIP and, in the case of mercury, the Regional Board TMDL. Consideration of significant controllable factors which can be addressed through management actions will be a priority. Note that one driver for methylmercury production and biological exposure—methylmercury concentrations in water—has been incorporated as an indicator (PM 5). Conceptual Models Drinking Water The drivers of drinking water quality at the intakes are the sources and fate of pollutants and Delta hydrodynamics. Delta hydrodynamics are driven by some factors that can be controlled (water operations, and intake location) as well as uncontrollable factors such as natural hydrology. Water quality at the intakes, along with water quality of non-Delta sources, storage and conveyance, drives raw water quality, which is then subjected to treatment for distribution to consumers. Raw water quality, treatment plant characteristics, regulations, and socioeconomic issues (e.g., consumer expectations) drive water quality at the tap.
14 These targets are protective of (a) humans eating 32 g/day of commonly consumed large fish; and (b) all wildlife species that consume large fish. There are populations that consume more than 32 g/day of Bay-Delta fish. 15 This target is protective of wildlife species that consume small fish. 16 The targets for this performance measure is based on the Draft Methylmercury TMDL and may change accordingly once the TMDL is finalized. 17 There is a direct link between aqueous methylmercury concentrations and fish tissue concentrations. The draft methylmercury TMDL for the Delta concludes that reducing aqueous methylmercury concentrations to 0.06 ng/L should result in achievement of the fish tissue targets. 18 Quantative targets for Objective 6 will be developed in the next phase. 19 Increases in awareness and knowledge in affected populations can be measured using standard evaluation tools such as surveys, interviews, focus groups, etc
Page 9
Toxicity The concentration of a contaminant to which an aquatic organism is exposed (i.e., exposure concentration) is driven by watershed hydrology, chemical use and origin, habitat properties, contaminant properties, and hydrodynamics and sediment transport. Among these, only the watershed hydrology cannot be controlled in some way. However, one cannot determine the toxicity of a contaminant or mixture of contaminants using measurements of the exposure concentration alone because toxicity depends on how much of a contaminant is available for the organism to take up (i.e., bioavailable concentration). The bioavailable concentration of a contaminant depends on the contaminant properties, organism properties, and the properties of the habitat in which the organism lives. Once the organism uptakes the contaminant, organism properties, metabolism, the contaminant’s mode of action, the exposure regime and effects of contaminant mixtures ultimately determines the toxic effects at the individual level. Depending on the degree of effects at the individual level, there could be population effects that then drive the population size and structure. The model for toxicity is very generic because specifics only can be estimated if the contaminant of concern is identified. Organisms, either in the field or the laboratory, may exhibit toxic effects, but the cause can only be determined through a series of sample manipulations and chemical analysis (i.e., toxicity identification evaluation). Mercury Drivers that affect mercury cycling in the environment include mercury sources (such as atmospheric deposition and mines), mercury speciation, sediment properties (such as grain size and redox potential), water properties (such as dissolved oxygen and suspended sediment concentrations), habitat characteristics and hydrodynamics. Inorganic mercury is transformed into the more toxic methylmercury through the process of mercury methylation. Most mercury methylation occurs as a result of microbial activity in the sedimentsand results in methylmercury in sediments and water. A substantial portion of mercury methylation occurs in wetland environments because the bacteria that methylate mercury are more prevalent in anoxic sediments. A portion of this methylmercury is transported to other areas outside of the Bay-Delta. Some methlymercury in sediments and water is transferred to the biota and moves through the food web. The process of bioaccumulation results in higher concentrations of methylmercury at higher trophic levels. Humans and wildlife who eat fish and other species contaminated with high levels of methylmercury are at risk for health effects.
Page 10
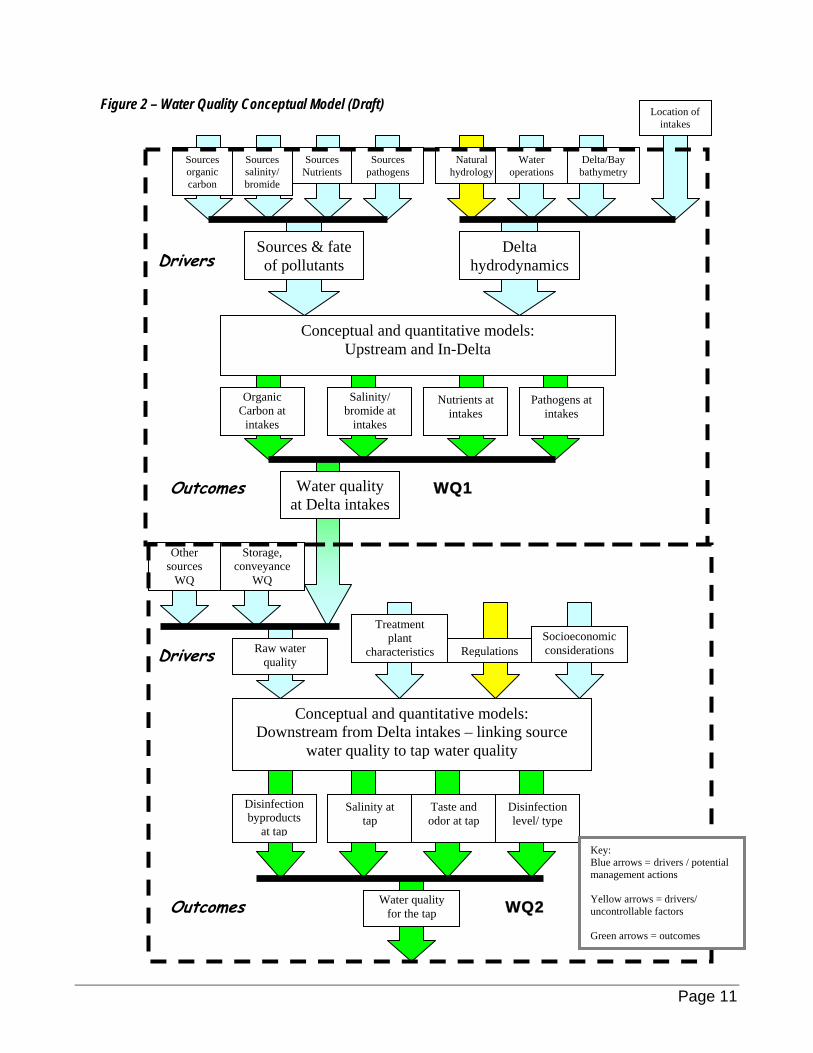
Figure 2 – Water Quality Conceptual Model (Draft)
Conceptual and quantitative models: Upstream and In-Delta
Delta hydrodynamics
Sources & fate of pollutants
Water quality at Delta intakes
Organic Carbon at
intakes
Salinity/ bromide at
intakes
Nutrients at intakes
Pathogens at intakes
Location of intakes
Sources organic carbon
Sources salinity/ bromide
Sources Nutrients
Sources pathogens
Natural hydrology
Water operations
Delta/Bay bathymetry
Drivers
Conceptual and quantitative models: Downstream from Delta intakes – linking source
water quality to tap water quality
Disinfection byproducts
at tap
Salinity at tap
Taste and odor at tap
Disinfection level/ type
Water quality for the tap
RegulationsSocioeconomic considerations Raw water
quality
Treatment plant
characteristics
Other sources
WQ
Storage, conveyance
WQ
Outcomes WQ1
Drivers
WQ2 Outcomes
Key: Blue arrows = drivers / potential management actions Yellow arrows = drivers/ uncontrollable factors Green arrows = outcomes
Page 11
2.C. Levee System Integrity Program Goals, Objectives, and Initial Performance Measures Goal: To reduce the risk to land use and associated economic activities, water supply, infrastructure, and the ecosystem from catastrophic breaching of Delta levees
Objective 1: Improve and maintain Delta levees to the Public Law 84-99 (PL 84-99) standard Performance Measure 1: KIM (Kilo-Inch-Mile) is an overall measure of net work to achieve the
PL 84-99 or any other stated elevation standard. Target: KIM = 0 (A zero KIM target represents that
there in no additional work to be done to meet the standard)
KIMmeassoil) calcuthe eleveerepre RKIMMile)risk astatedsummovertleveereprelevelstand
Performance Measure 2: RKIM (Risk-adjusted-Kilo-Inch-Mile) is measure of risk associated with inadequate and sub-standard levee maintenance
Target: RKIM = 0 (A zero KIM target represents no risk)
Objective 2: Improve and maintain levees at key Delta locations to a level commensurate with the benefits provided
Performance Measure 3: Number or levee miles or islands with enhanced, above PL84-99, flood protection
Target: 500 miles of levees in the Delta, including more than 400 miles of project levees, in the Delta at or above PL 84-99 standard
Performance Measure 4: Number or levee miles with electro-magnetic conductance anomalies quantified
Target: 700 miles by December 2007.20
Objective 3: Reduce or eliminate the risk to the levee system from subsidence Performance Measure 5: Acreage of islands / tracts with subsidence
that affect levee stability Target: 700 acres on Sherman and Twitchell Islands
Objective 4: Enhance existing emergency management and response capabilities to proresources in the event of a disaster.
Performance Measure 6: Number of improvements to emergency res Target: TBD21
20 DWR offers reimbursements to the districts participating in the Electromagnetic Survey Program. To datechosen to take advantage of this program and about 400 miles of levees have been quantified.
KIM and RKIM Defined
(Kilo-Inch-Mile) is an overall ure of net work (in volume of to achieve a stated standard. It islated by summing the deficit of levation over the length of the . A zero KIM value, therefore, sents meeting the standard.
(Risk-adjusted-Kilo-Inch- is a measure of the increased ssociated with not achieving a standard. It is calculated by ing the probabilistic risk of
opping over the length of the . A zero RKIM value, therefore, sents achieving the acceptable of risk based on a stated ard.
control measures in areas
tect critical Delta
ponse
, more than 20 LMA have
Page 12
Objective 5: Identify risk to Delta levees from seismic events and develop recommendations to reduce levee vulnerability and improve their seismic stability. This item will be evaluated in DRMS.
2.D. Ecosystem Restoration The Ecosystem Restoration Subgroup intends to address performance measures in the following fashion. In the long-term, we will be using the strategy outlined in this document. In the short-term, the Ecosystem Restoration Subgroup of the Performance Measures subcommittee will convene during Summer of 2007 (pending new hires at DFG) to begin a more formal evaluation of existing measures; and, if deemed appropriate, begin the process of defining or revising interim performance measures to serve until implementation of full performance measures is possible. Outcome indicators will be finalized, and their associated quantitative metrics derived within this short-term timeframe, as these represent the logical first step as we translate management objectives downwards through the finer details of adaptive management to their underlying ecosystem processes. The following tasks are involved within the process of translating Program Objectives and Goals to quantitative performance metrics and implementing these into the larger framework of adaptive management. To implement performance measures, the Ecosystem Restoration subgroup shall:
Define performance measures that meet Program objectives
Select quantitative and specific performance indicators (metrics)
Factor uncertainty into these metrics
Incorporate a safety margin within indicators (risk-based approach)
Base indicators upon peer-reviewed models describing ecosystem functions
Develop predictive models of indicator response, quantitative where possible
Design a monitoring program to track these indicators
Identify research needs from information gaps
Refine and update working models
Evaluate Program performance on a regular basis
Continually evaluate and refine performance measures Program Goals and Objectives Following are the founding goals and objectives from the CALFED ROD: Goal 1: Endangered and At-Risk Species and Native Biotic Communities: Achieve recovery of at-risk species dependent on the Delta and Suisun Bay as the first step toward establishing large, self-sustaining populations of these species; support similar recovery of at-risk native species in San Francisco Bay and the watershed above the estuary; and
21 The Flood Operations Center is preparing an Emergency Operations Plan for the Delta which considers single and multiple breaches and formulates a flood fighting plan. DWR is also providing SEMS training for staff. Additionally, staff have been able to form a regional emergency response committee with county and city officials being active participants.
Page 13
minimize the need for future endangered species listings by reversing downward population trends of native species not listed.
Objective 1: Achieve, first, recovery and then large self-sustaining populations of the following at-risk native species dependent on the Delta, Suisun Bay, and Suisun Marsh: Central Valley winter-, spring-, and fall/late fall-run Chinook salmon ESUs, Central Valley steelhead ESU, delta smelt, longfin smelt, Sacramento splittail, green sturgeon, valley elderberry longhorn beetle, Suisun ornate shrew, Suisun song sparrow, soft bird’s-beak, Suisun thistle, Mason’s lilaeopsis, San Pablo song sparrow, Lange’s metalmark butterfly, Antioch Dunes evening primrose, Contra Costa wallflower, and Suisun marsh aster.
Objective 2: Contribute to the recovery of the following at-risk native species in the Bay-Delta estuary and its watershed: Sacramento perch, delta green ground beetle, giant garter snake, salt marsh harvest mouse, riparian brush rabbit, San Pablo California vole, San Joaquin Valley woodrat, least Bell’s vireo, California clapper rail, California black rail, little willow flycatcher, bank swallow, western yellow-billed cuckoo, greater sandhill crane, Swainson’s hawk, California yellow warbler, salt marsh common yellowthroat, Crampton’s tuctoria, Northern California black walnut, delta tule pea, delta mudwort, bristly sedge, delta coyote thistle, alkali milkvetch, and Point Reyes bird’s-beak.
Objective 3: Enhance and /or conserve native biotic communities in the Bay-Delta estuary and its watershed, including the abundance and distribution of the following biotic assemblages and communities: native resident estuarine and freshwater fish assemblages, anadromous lampreys, neotropical migratory birds, wadiing birds, shore birds, waterfowl, native anuran amphibians, estuarine plankton assemblages, estuarine and freshwater marsh plant communities, riparian plant communities, seasonal wetland plant communities, vernal pool communities, aquatic plant communities, and terrestrial biotic assemblages associated with aquatic and wetland habitats.
Objective 4: Maintain the abundance and distribution of the following species: hardhead western least bittern, California tiger salamander, western spadefoot toad, California red-legged frog, western pond turtle, California freshwater shrimp, recurved larkspur, mad-dog skullcap, rose-mallow, eel-grass pondweed, Colusa grass, Boggs Lake hedge-hyssop, Contra Costa goldfields, Greene’s legenere, heartscale, and other species designated “maintain” in the Multi-Species Conservation Strategy.
Goal 2: Ecological Processes: Rehabilitate natural processes in the Bay-Delta estuary and its watershed to fully support, within minimal ongoing human intervention, natural aquatic and associated terrestrial biotic communities and habitats, in ways that favor native members of those communities.
Objective 1: Establish and maintain hydrologic and hydrodynamic regimes for the Bay and Delta that support the recovery and restoration of native species and biotic communities, support the restoration and maintenance of functional natural habitats, and maintain harvestable species.
Objective 2: Increase estuarine productivity and rehabilitate estuarine food web processes to support the recovery and restoration of native estuarine species and biotic communities.
Objective 3: Rehabilitate natural processes to create and maintain complex channel morphology, in-channel islands, and shallow water habitat in the Delta and Suisun Marsh.
Objective 4: Create and/or maintain flow and temperature regimes in rivers that support the recovery and restoration of native aquatic species.
Objective 5: Establish hydrologic regimes in streams, including sufficient flow timing, magnitude, duration, and high flow frequency, to maintain channel and sediment conditions supporting the recovery and restoration of native aquatic and riparian species and biotic communities.
Page 14
Objective 6: Reestablish floodplain inundation and channel-floodplain connectivity of sufficient frequency, timing, duration, and magnitude to support the restoration and maintenance of functional natural floodplain, riparian, and riverine habitats.
Objective 7: Restore coarse sediment supplies to sediment-starved rivers downstream of reservoirs to support the restoration and maintenance of functional natural riverine habitats.
Objective 8: Increase the extent of freely meandering reaches and other pre-1850 river channel forms to support the restoration and maintenance of functional natural riverine, riparian, and floodplain habitats.
Goal 3: Harvested Species: Maintain and/or enhance populations of selected species for sustainable commercial and recreational harvest, consistent with other ERP strategic goals.
Objective 1: Enhance fisheries for salmonids, white sturgeon, pacific herring, and native cyprinid fishes.
Objective 2: Maintain, to the extent consistent with ERP goals, fisheries for striped bass, American shad, signal crayfish, grass shrimp, and nonnative warmwater gamefishes.
Objective 3: Enhance, to the extent consistent with ERP goals, fisheries for striped bass, American shad, signal crayfish, grass shrimp, and nonnative warmwater gamefishes
Objective 4: Ensure that Chinook salmon, steelhead, trout, and striped bass hatchery, rearing, and planting programs do not have detrimental effects on wild populations of native fish species and ERP actions.
Goal 4: Habitats: Protect and/or restore functional habitat types in the Bay-Delta estuary and its watershed for ecological and public values such as supporting species and biotic communities, ecological processes, recreation, scientific research, and aesthetics.
Objective 1: Restore large expanses of all major habitat types, and sufficient connectivity among habitats, in the Delta, Suisun Bay, Suisun Marsh, and San Francisco Bay to support recovery and restoration of native species and biotic communities and rehabilitation of ecological processes. These habitat types include tidal marsh (fresh, brackish, and saline), tidal perennial aquatic (including shallow water and tidal flats), non-tidal perennial aquatic, tidal sloughs, midchannel island, and shoal, seasonal wetlands, riparian and shaded riverine aquatic, inland dune scrub, upland scrub, and perennial grasslands.
Objective 2: Restore large expanses of all major aquatic, wetland, and riparian habitats, and sufficient connectivity among habitats, in the Central Valley and its rivers to support recovery and restoration of native species and biotic communities and rehabilitation of ecological processes. These habitat types include riparian and shaded riparian aquatic, in-stream, fresh emergent wetlands, seasonal wetlands, other floodplain habitats, lacustrine, and other freshwater fish habitats.
Objective 3: Protect tracts of existing high quality major aquatic, wetland, and riparian habitat types, and sufficient connectivity among habitats, in the Bay-Delta estuary and its watershed to support recovery and restoration of native species and biotic communities, rehabilitation of ecological processes, and public value functions.
Objective 4: Minimize the conversion of agricultural land to urban and suburban uses and maintain open space buffers in areas adjacent to existing and future restored aquatic, riparian, and wetland habitats, and manage agricultural lands in ways that are favorable to birds and other wildlife.
Objective 5: Manage the Yolo and Sutter Bypasses as major areas of seasonal shallow water habitat to enhance native fish and wildlife, consistent with CALFED Program objectives and solution principles.
Page 15
Goal 5: Nonnative Invasive Species: Prevent the establishment of additional non-native invasive species and reduce the negative ecological and economic impacts of established non-native species in the Bay-Delta estuary and its watershed.
Objective 1: Eliminate further introductions of new species from the ballast water of ships into the Bay-Delta estuary.
Objective 2: Eliminate further introductions of new species from imported marine and freshwater baits into the Bay-Delta estuary and its watershed.
Objective 3: Halt the unauthorized introduction and spread of potentially harmful non-native introduced species of fish and other aquatic organisms in the Bay-Delta and Central Valley.
Objective 4: Halt the release of non-native introduced fish and other aquatic organisms from private aquaculture operations and the aquarium and pet trades into the Bay-Delta estuary, its watershed, and other California waters.
Objective 5: Halt the introduction of non-native invasive aquatic and terrestrial plants into the Bay-Delta estuary, its watershed, and other Central California waters.
Objective 6: Reduce the impact of non-native mammals on native birds, mammals, and other organisms.
Objective 7: Limit the spread or, when possible and appropriate, eradicate populations of non-native invasive species through focused management efforts.
Objective 8: Prevent the invasion of the zebra mussel into California. Goal 6: Water and Sediment Quality: Improve and/or maintain water and sediment quality conditions that fully support healthy and diverse aquatic ecosystems in the Bay-Delta estuary and watershed; and eliminate, to the extent possible, toxic impacts to aquatic organisms, wildlife and people.
Objective 1: Reduce the loadings and concentrations of toxic contaminants in all aquatic environments in the Bay-Delta estuary and watershed to levels that do not adversely affect aquatic organisms, wildlife and human health.
Objective 2: Reduce loadings of oxygen-depleting substances from human activities into aquatic ecosystems in the Bay-Delta estuary and watershed to levels that do not cause adverse ecological effects.
Objective 3: Reduce fine sediment loadings from human activities into rivers and streams to levels that do not cause adverse ecological effects.
Initial Performance Measures Full derivation of the necessary suite of initial performance measures has not been completed to date, and is expected to continue through 2008. Appendix C.2 lays out the conceptual foundation and framework for the Ecosystem Restoration performance measures effort, from which the next steps towards final development, adoption, monitoring, and reassessment of performance measures will proceed in our next phase of planning. Below we present the initial approach to performance measures for ERP as translated from the founding goals and objectives within the ROD.
Following ERP Goal 1: Achieve recovery of at-risk native species dependent on the Delta and Suisun Bay as the first step toward establishing large, self-sustaining populations of these species; support similar recovery of at-risk native species in San Francisco Bay and the watershed above the estuary; and minimize the need for future endangered species listings by reversing downward population trends of native species that are not listed.
Page 16
Performance Measure 1: Achieve recovery for CALFED “R” species Target: Minimum Viable Population with risk of extinction not to exceed 5% chance over 100
years (including impacts from projected future stressors) Performance Measure 2: Contribute to recovery for CALFED “r” species
Target: Stable or Positive Population trends or stable numbers at some predetermined benchmark (e.g., equal to pre-determined baseline)
Performance Measure 3: Conserve non-listed native species Target: Stable or Positive Population trends
Following ERP Goal 2: Rehabilitate natural processes in the Bay-Delta estuary and its watershed to fully support, with minimal ongoing human intervention, natural aquatic and associated terrestrial biotic communities and habitats, in ways that favor native members of those communities
Driver Indicator(s): Reflected in the suite of driver indicators designed to alleviate critical limiting factors for a suite of species to include, but not limited to, all R species, POD species, BDCP species
Target: TBD
Following ERP Goal 3: Maintain and/or enhance populations of selected species for sustainable commercial and recreational harvest, consistent with the other ERP strategic goals
Performance Measure 4: Sustain populations of non-listed harvested species Target: Double from Established Baseline (as prescribed in the CVPIA doubling objective for
anadromous fish) or maintain stable populations
Following ERP Goal 4: Protect and/or restore functional habitat types in the Bay-Delta estuary and its watershed for ecological and public values such as supporting species and biotic communities, ecological processes, recreation, scientific research, and aesthetics.
Performance Measure 5: To the extent that it is not encompassed within recovery objectives associated with “R” and “r” species, protect ecosystem integrity as measured in broad-based indicators of estuarine “health”
Target: Diversity indices, community metrics, etc. (e.g., Shannon’s H or Simpson’s D and E) using a defined Delta-specific baseline (to be determined).
Most notable among the species not explicitly encompassed with the CALFED designated species of concern (“R” and “r” lists) are migratory birds that utilize habitats ranging from open waters to upland estuarine margins. These will need to be covered by a relevant performance metric(s) to track habitat utility to these particular species. It is also presumed that broader protections for other native taxa (e.g., native amphibians, reptiles, plants, small mammals, etc.) are possible through generally preserving heterogeneity of habitat types and physiognomy and the quality of these natural habitats.
Following ERP Goal 5: Prevent the establishment of additional nonnative invasive species and reduce the negative ecological and economic impacts of established nonnative species in the Bay-Delta estuary and its watershed.
Performance Measure 6: Allocation of resources and performance of invasive exotic prevention programs, and eradication efforts.
Target: No new colonizations/no net increase in range or dominance of extant invaders
Page 17
The Draft California Aquatic Invasive Species Management Plan (CDFG, 2006) has been developed and is currently under review by the Federal Aquatic Nuisance Species Task Force pending final approval. Performance Measures for invasive species prevention and eradication will likely be derived from this already extant management plan.
Following ERP Goal 6: Improve and/or maintain water and sediment quality conditions that fully support healthy and diverse aquatic ecosystems in the Bay-Delta estuary and watershed; and eliminate, to the extent possible, toxic impacts to aquatic organisms, wildlife, and people
Performance Measure 7: Survival and reproduction of exposed populations and community components upon which these species depend
√ Target: The target for contaminant-related performance measures will be based on the reduction or remediation of known contaminants to the lesser of either: 1) the lower 95% confidence limit of the EC10 (for non-lethal endpoints) or, 2) ≤ LC01 for the 95% most sensitive species (where mortality is the endpoint of concern). Additionally, ongoing monitoring and research for emerging contaminants shall be implemented to detect and identify new exogenous toxicants as they detrimentally impact native species within the Delta. 22
√ Example Performance Measure – The Lange’s Metalmark Butterfly: Performance measures shall be based upon conceptual models currently under development through the DRERIP process. One such model (in draft form) appears in the figure on the following page (Figure 3). Basically, the DRERIP format specifies a color-coding scheme that indicates the importance, predictability, and understanding associated with particular drivers and linkages tied to key outcomes for the species of interest. Through this process, key limiting factors and our understanding of the mechanics driving population status are readily expressed in graphical format. The performance measures process within the Ecosystem Restoration subgroup will rely on such models (among others), and the associated narratives (not provided herein) to derive appropriate performance measures (outcomes, targets, and monitoring metrics). Initial measures for the Lange’s Metalmark appear following the conceptual model graph.
Performance Measure 8: Population status of Lange’s Metalmark
Target: Maintain a five year moving average count of Lange’s metalmark adults (based on flight season peak population counts) of 2000 individuals2233.
Driver Indicator (predominant driver): Maintain densities of auriculate naked-stemmed buckwheat (host plant) within the critical Antioch Dunes habitat for the Lange’s Metalmark at a minimum percent cover of X2244%. (Control measures to increase host plant density include firebreak maintenance and carefully managed disking).
Driver Indicator (indirect driver): Reduce invasive plant species in inverse proportion to the density of the host species (metric to be defined), through scraping to expose sandy soils and careful use of herbicides.
22 These criteria are based upon currently accepted EPA guidelines for acute water quality standards (lethal concentrations), and chronic standards for bioaccumulative contaminants and wildlife protection (Reiley et al., 2003; An et al., 2006; Sparks, 2000). 23 Note, this figure was based on prior baselines, and not specific PVA approach as mentioned for the overall framework. Therefore, this figure should be regarded as both “draft” and “interim.” 24 A figure for host plant density has not been derived to date.
Page 18
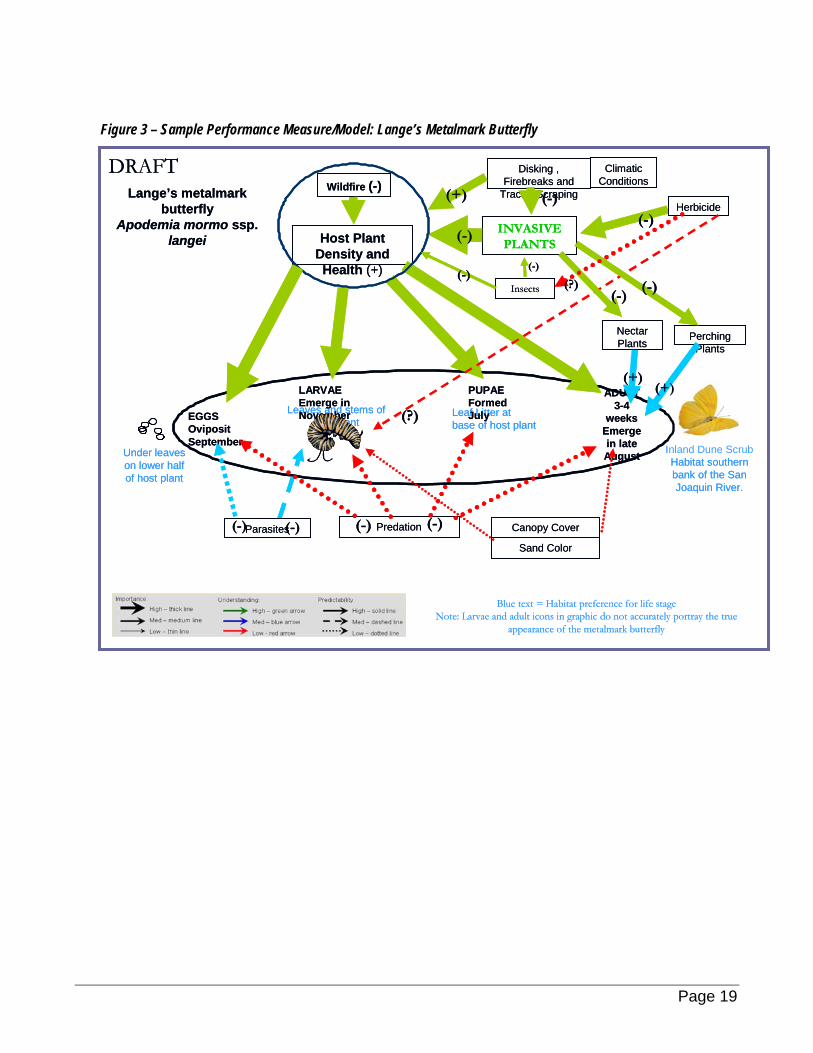
Figure 3 – Sample Performance Measure/Model: Lange’s Metalmark Butterfly
ADULT3-4
weeksEmerge in late AugustUnder leaves
on lower half of host plant
Leaves and stems of host plant
Leaf Litter at base of host plant
PUPAEFormed July
Inland Dune Scrub Habitat southern bank of the San Joaquin River.
LARVAEEmerge in November
Wildfire (-)
Nectar Plants
EGGSOvipositSeptember
Host Plant Density and Health (+)
Perching Plants
Parasites Predation
Herbicide
DRAFTLange’s metalmark
butterflyApodemia mormo ssp.
langeiINVASIVE PLANTS
Blue text = Habitat preference for life stageNote: Larvae and adult icons in graphic do not accurately portray the true
appearance of the metalmark butterfly
Canopy Cover
Sand Color
Disking , Firebreaks and
Tractor Scraping
Climatic Conditions
(-)
(+)(+)
(+)
(-)(-)
(-)
(-)(-)
(?)
(-)
(-) (-)
Insects
(-)(-)
(?)
Page 19
3. Implementation Plan
3.A. Relationship to Other Delta Efforts Development of performance measures is one of several efforts currently underway to plan for the Delta’s future management, including the Delta Vision process (DV), Delta Regional Ecosystem Restoration Implementation Plan (DRERIP), Delta Risk Management Strategy (DRMS), Bay-Delta Conservation Plan (BDCP), Stage 2 Decisions, Comprehensive Monitoring, Assessment and Research Program (CMARP III), Interagency Ecological Program (IEP), the pelagic organism decline (POD) investigation, and the Regional Water Boards Total Maximum Daily Loads (TMDL), amongst others. Below we briefly describe these efforts.
Delta Vision/Delta Strategic Plan (DV). (http://www.deltavision.ca.gov/) DV will be a plan for a sustainable delta and will: 1) assess the risks and consequences to the Delta’s many uses and resources in light of changing climatic, hydrologic, environmental, seismic, and land use conditions; 2) develop a program for sustainable management of the Delta’s multiple uses, resources, and ecosystem; 3) develop a Strategic Plan to implement public policy changes, investment strategies, emergency response plans, level maintenance options, and monitoring and reporting on performance; and 4) develop recommendations on institutional changes and funding mechanisms. The Plan will also encompass and integrate many separate planning efforts. The Delta Vision Strategic Plan will be developed by a cabinet-level committee chaired by the Secretary of the Resources Agency. The Committee will report with recommendations for implementing the Delta Vision and Strategic Plan. In addition, there will be Blue Ribbon Task Force which will prepare an independent public report on the sustainable management of the Delta, and a Strategic Plan to implement the Delta Vision.
Delta Regional Ecosystem Restoration Implementation Plan (DRERIP). The Delta Regional Ecosystem Restoration Implementation Plan is one of four regional plans intended to guide the implementation of the CALFED Ecosystem Restoration Program (ERP) element. The DRERIP will refine the planning foundation specific to the Delta, refine existing and develop new Delta specific restoration actions and provide Delta specific implementation guidance, program tracking, performance evaluation and adaptive management feedback. One of the key components of DRERIP is the development of Species and Ecosystem Conceptual Models.
Delta Risk Management Strategy (DRMS). The 2000 CALFED Record of Decision presented its Preferred Program Alternative that described actions, studies, and conditional decisions to help fix the Delta. Included in the Preferred Program Alternative for Stage 1 implementation was the completion of a Delta Risk Management Strategy (DRMS) that would look at sustainability of the Delta, and that would assess major risks to the Delta resources from floods, seepage, subsidence, and earthquakes. DRMS would also evaluate the consequences, and develop recommendations to manage the risk. The report is due to the Legislature no later than January 1, 2008.
Bay Delta Conservation Plan (BDCP). The BDCP is one of the key actions called for in the CALFED 10-Year Action Plan and will be implemented over the next 3-4 years. It is a voluntary mechanism for Bay-Delta system water users to comply with the Federal Endangered Species Act and the California Endangered Species Act to attain incidental take coverage via a Habitat Conservation Plan (HCP) and Natural Community Conservation Plan (NCCP). The first step is for a steering committee to negotiate an agreement that identifies which water users are interested in securing coverage and which activities they would like to have covered, and to describe which species are covered and the geographic scope needed to encompass the range of covered species. The intent is to have substantial progress made by end of 2007.
Plan for Stage 2 Activities. The CALFED Program is a 30-year Federal and State Program to fund and implement fish and wildlife restoration efforts in California’s Bay- Delta and Central Valley while assuring water quality, water supply reliability, and levee stability for all uses. The first stage of the CALFED Program will last seven years, after which a series of questions would be answered in order to collectively and collaboratively determine the activities
Page 20
for the next stage (Stage 2). At present, the CALFED implementing agencies are in the process of evaluating the end of Stage 1, and planning for Stage 2.
Comprehensive Monitoring, Assessment, and Research Program (CMARP III). There have been three stages to CMARP. Stage I (1997-1998) involved the development of a joint proposal to design a Comprehensive Monitoring, Assessment, and Research Program (CMARP) for CALFED. Stage II (1998-1999) involved the design of CMARP. During Stage III (2000 to present) there has been some reexamination of the scope CMARP. For water quality, emphasis was placed on regional monitoring and assessment strategies which could be integrated in a larger, watershed-wide program. This program will include strategies to monitor key system attributes and indicators, to undertake focused assessment and research to obtain better technical understanding, and to facilitate the transfer of technical information to decision makers. The data and technical conclusions generated through CMARP will be integrated into an adaptive management program designed to inform the CALFED decision-making process.
Interagency Ecological Program (IEP). IEP consists of ten member agencies, three State (Department of Water Resources, Department of Fish and Game, and State Water Resources Control Board), six Federal (Fish and Wildlife Service, Bureau of Reclamation, Geological Survey, Army Corps of Engineers, National Marine Fisheries Service, and Environmental Protection Agency), and one non-government organization (The San Francisco Estuarine Institute). These ten program partners work together to develop a better understanding of the estuary's ecology and the effects of the State Water Project (SWP) and Federal Central Valley Project (CVP) operations on the physical, chemical, and biological conditions of the San Francisco Bay-Delta estuary.
The Environmental Monitoring Program (EMP) for the Sacramento-San Joaquin Delta, Suisun Bay, and San Pablo Bay is conducted under the auspices of IEP. The EMP was initiated in 1971 in compliance with California State Water Resources Control Board (SWRCB) Water Right Decision D-1379 and continued from 1978 through 1999 under D-1485. Currently it is mandated by Water Right Decision D-1641. The program is carried out jointly by the two water right permittees operating the California water projects, the United States Bureau of Reclamation (USBR) and the California Department of Water Resources (DWR). Assistance is provided by the California Department of Fish and Game (CDFG) and the United States Geological Survey (USGS). The primary purpose of the EMP is to provide necessary information for compliance with flow-related water quality standards specified in the water right permits. In addition, the EMP also provides information on a wide range of chemical, physical and biological baseline variables.
Pelagic Organism Decline (POD). In 2004, IEP managers reported a marked decline in abundance of four pelagic (i.e., open-water dwelling) fish species (i.e., delta smelt, longfin smelt, striped bass, and threadfin shad) in the Sacramento-San Joaquin Delta. Data from the Department of Fish and Game’s surveys indicated the decline began in 2001 and has continued through 2006 despite an increase in Delta outflow in 2005 and 2006. IEP researchers also observed a decline in important zooplankton (i.e., fish food) species coincident with the declines in pelagic fish species. In mid-2005, IEP launched investigations into the cause of the Delta species declines. The initial studies aimed to determine what changed at the same time as the decline, how and why the changed occurred, and whether it could affect pelagic organism populations. These studies focused on three major categories influencing fish abundance: physical and chemical habitat, loss (through predation or entrainment), and food availability.
Central Valley Drinking Water Policy. A multi-year effort is currently underway to develop a drinking water policy for surface waters of the Central Valley. As water from the tributaries to the Sacramento and San Joaquin rivers flow from the foothills and into the valley, pollutants from a variety of urban, industrial, agricultural, and natural sources affect the quality of the water and can lead to drinking water treatment challenges and potential public health concerns. The Central Valley Drinking Water Policy Workgroup (Workgroup), comprised of interested stakeholders and technical experts, has initiated the technical work that will lead to adoption of a policy as a Basin Plan amendment in 2009.
End of Stage 1 Water Quality Final Assessment The CALFED ROD includes a milestone for its Water Quality Program, on behalf of the BDPAC Water Quality Subcommittee, to produce a Final Stage 1 Assessment. In the
Page 21
CALFED 10-Year Action Plan (2005), the Water Quality Program is committed to collect and synthesize available drinking water quality information to determine if a Through-Delta facility is a cost-effective way to achieve water quality improvements by the end of 2007. In addition to these requirements, the Initial Program Assessment indicated that water quality performance could only be determined once the full system was better quantified. The Final Stage 1 Assessment is building off of existing studies to fully develop watershed and Delta intake information, developing new information (conceptual model, data assessment) with respect to "an equivalent level of public health", and synthesizing this information with Conveyance and Storage project analyses to present the status of our knowledge of Delta drinking water quality. This report will include the development of initial performance measures, priorities for Stage 2, and an analysis of monitoring and research needs.
Regional Water Board Total Maximum Daily Loads. San Joaquin River Salinity and Boron Upstream of Vernalis. In Water Rights Decision 1641, the State Water Board directed the Regional Board to adopt water quality objectives for salinity in the lower San Joaquin River upstream of Vernalis. The Regional Board will develop a TMDL as part of the process used to adopt water quality objectives. The TMDL will apply to the portion of the San Joaquin River that is listed on the 303(d) list, which extends upstream to the Mendota Pool. This TMDL will expand on work previously completed in the Vernalis TMDL and will adjust the implementation framework presently in the Basin Plan to implement the upstream TMDL throughout the San Joaquin River watershed. A Board hearing for this TMDL is tentatively scheduled for the end of 2008.
Delta Mercury. This TMDL will set mercury fish tissue objectives for the Delta and establish methylmercury and total mercury load allocations for the principal sources entering the Delta. Included are discharges from wetlands, NPDES facilities, urban areas, and discharges associated with dredging and flood control and water management. The proposed Basin Plan amendment requires responsible parties to conduct studies to evaluate how compliance with load allocations can be achieved. The amendment25 would require the Regional Board to re-evaluate the load allocations and implementation strategies before the date of compliance with load allocations. In anticipation that not all dischargers will be able to meet the proposed allocations, staff is working with stakeholders to develop an offset program.
San Joaquin River Dissolved Oxygen. The San Joaquin River regularly exhibits periods of low dissolved oxygen (DO) concentrations in the first few miles of the Stockton Ship Channel downstream from the City of Stockton. There are three main factors contributing low DO levels: oxygen demanding substances entering the channel from upstream, channel geometry (that has been deepened significantly over natural conditions to accommodate shipping), and reduced flow resulting from water management in the San Joaquin River basin. The low DO poses a threat to migrating salmon trying to enter and leave the San Joaquin River and to resident species.
The Basin Plan Amendment and Dissolved Oxygen Control Program that implement the DO TMDL was adopted by the Regional Board in January 2005 and approved by USEPA in March 2007. The Control Program addresses the three factors contributing to the impairment. It is phased to allow the gathering of information and completion of studies needed to make more detailed allocations regarding the load factor. To assure this information is obtained, the TMDL requires submission of a study plan from entities responsible for the various sources of oxygen demand. Source and linkage studies will be completed in December of 2008. Discharge of all oxygen demanding substances and their precursors are prohibited if flow in the DWSC is less than 3,000 cfs unless the discharge is regulated by a waiver of waste discharge requirements, individual or general waste discharge requirements, or NPDES permits
25 A revised draft Basin Plan amendment containing the objectives and TMDL implementation plan was released in February 2007. The proposed water quality objectives are expressed in terms of methylmercury concentrations in fish tissue at levels considered protective of fish, wildlife and human health. The implementation plan addresses two basic approaches for meeting objectives: reducing inorganic mercury in the system and controlling methylmercury.
Page 22
which implement the TMDL. A final DO TMDL will be developed in 2009, once modeling studies that evaluate algae production in the San Joaquin River are completed.
Portions of the DO implementation plan will continue to be refined by Regional Board staff through additional studies and through the stakeholder process. The December 2011 prohibition of discharge for oxygen demanding substances is scheduled for reconsideration by the Regional Board in December 2009 based on the results of oxygen demand and precursor studies and prevailing DO conditions in the DWSC.26
Old and Middle River Dissolved Oxygen. TMDLs and basin plan amendments will be developed for Old and Middle River in conjunction with on-going review and development of the dissolved oxygen TMDL for the Deep Water Ship Channel portion of the San Joaquin River. A technical report is scheduled for completion in June 2008.
San Joaquin River Selenium. Three TMDLs addressing selenium sources and loading in the San Joaquin Basin are in place and being implemented: a San Joaquin River selenium TMDL (2000), Grasslands Marshes TMDL (2000), and Salt Slough TMDL (1999). TMDL load limits were incorporated into revised Waste Discharge Requirements (WDR) in July 2001. The waste discharge requirements set targets, decreasing over time, for allowable selenium loads into Mud Slough, a tributary to the San Joaquin River. Although in compliance with the WDR, loads at the present time exceed the ultimate goal of meeting selenium objectives for the River. A TMDL report was submitted to US EPA documenting that existing regulatory programs were in place to address the impairment. The current WDR and associated Use Agreement for the San Luis Drain expire at the end of 2009, and an extension of the Use Agreement and renewal of the WDR to allow continued discharges with permitted limits above the objectives for selenium are being explored. Regional Water Board staff are working with agencies and stakeholders in support of continuing data collection and monitoring related to the Waste Discharge Requirements.
San Joaquin River Diazinon and Chlorpyrifos – Adopted October 2005. The San Joaquin River is on the 303(d) list because diazinon and chlorpyrifos were present in the water at levels that violated the Basin Plan narrative toxicity objective. The threat to aquatic life was the most significant impairment. The principle source of diazinon and chlorpyrifos was runoff following applications of diazinon as a dormant orchard spray and irrigation runoff. Other less significant sources included urban stormwater runoff and discharges from wastewater treatment plants.
The Basin Plan amendment adopted in October 2005 established diazinon and chlorpyrifos water quality objectives for the San Joaquin River, established load allocations for tributaries and prohibited the discharge of diazinon and chlorpyrifos after 1 July 2008 unless the objectives and load allocations are being met. The amendment also required dischargers of diazinon and chlorpyrifos to submit management plans that describes actions that will be implemented to meet the allocations. The amendment required monitoring to document program success. Changes in practices have already been implemented that have greatly reduced the concentrations of diazinon in our rivers and the Delta. Staff is working with the coalitions and growers on management plans.
Delta Diazinon and Chlorpyrifos – Adopted June 2006. The Delta TMDL is patterned largely on the provisions adopted by the Regional Board for the San Joaquin River (see description above). The amendment included a listing of the specific Delta waterways where the provisions apply (essentially all waters that are hydrologically connected by surface water flows to the Sacramento and/or San Joaquin
26 The Department of Water Resources is sponsoring a demonstration aeration project in the Deep Water Ship Channel, due to start by 2008.
Page 23
Rivers). The Regional Board adopted the basin plan amendment in June 2006. The State Board will consider approving the basin plan amendment in May 2007.
Central Valley Pesticides. During the development of earlier basin plan amendments, the public and the Board raised concerns about the inefficiency of the current approach of adopting TMDLs waterbody by waterbody and pesticide by pesticide. Therefore, staff is currently developing information to address pesticide water quality problems in one comprehensive TMDL. The effort would involve development of water quality objectives for several pesticides, confirmation of aquatic life beneficial uses for potentially hundreds of natural waterways currently not identified in the Basin Plan, development of narrative sediment quality objectives, monitoring and source analysis, and extensive internal and external coordination (e.g., 8 coalition groups, Farm Bureau, DPR). Three CEQA scoping meetings were held in February 2006. We anticipate bringing this to the Regional Board in June 2009.
3.B. Water Supply Reliability Approach Overview Historically, the CALFED Program objective for water supply reliability has been to “reduce the mismatch between Bay-Delta water supplies and current and projected beneficial uses dependent on the Bay-Delta system.” Another way to state the goal is to establish acceptable balance of Bay-Delta water used to protect resources within the Bay-Delta System with water used to meet demands outside the Bay Delta System. In order to assess how well Program actions are fulfilling the intent of this objective directly, at least two things must be considered: (1) some measure of protection provided to beneficial uses in the Bay-Delta System that depend on water flow into or out of the Bay Delta system and (2) some measure of water supplies from the Bay-Delta for uses outside the Bay-Delta System. To that end, this section describes the two strategic objectives involving water supplies: Strategic Objective #1 – Enhance Stability of Delta Water Supplies; and Strategic Objective #2 – Enhance End User Reliability. There are three performance measures that pertain directly to Strategic Objective #1, or the stability of Delta water supplies. The first performance measure can be assessed by determining the degree of compliance with established flow related standards or export limitations that have been established in water rights decisions, Endangered Species Biological Opinions, or other regulatory actions. The second and third performance measures are based on the amount of water diverted from the Delta for use outside of the Bay-Delta System. Of course, the amount of water diverted from the Delta for use outside of the Bay-Delta System does not provide a complete picture of water supply reliability for Delta water users who have multiple options to meet their demand for water. However, if CALFED agencies can improve the stability or certainty of Delta water supplies, Delta water users have the opportunity to better manage their diverse portfolios. Although water supply performance measures could be designed to also assess how well programs like the Ecosystem Restoration Program are working to improve populations of at risk fish species in the Delta, it is important to note that none of these proposed water supply performance measures assess beneficial uses or the extent to which the temporal, spatial and/or volumetric aspects of project operations affect environmental protection or water quality. The environmental restoration and water quality performance measures will assess these types of effects. Since water from the Bay-Delta System is only one component within Delta water users' portfolios, the CALFED Program will not attempt to measure comprehensive end-user water supply reliability (including implementation of all water supply and other options available to local water management agencies). Strategic Objective 2 outlines an approach for measuring comprehensive end user reliability through the California Water Plan Update Process. There are currently no performance measures proposed under this strategic objective.
Page 24
Monitoring and Modeling for Performance Measures
Strategic Objecive 1: Enhance Stability of Delta Water Supplies (CALFED Focus): The stability of water supplies for uses both within and exported from the Bay-Delta system is linked to the sustainability of the Delta ecosystem and Delta water quality for aquatic species and municipal, industrial and agricultural uses. The following performance objectives describe how CALFED implementing agencies propose to measure progress toward enhancing long-term stability of Delta water supplies.
Performance Objective 1: Provide water supply in sufficient quantity and timing to meet the regulatory baseline and additional contractual commitments for the protection of water quality and the ecosystem. Water supplies for these purposes will be provided subject to the terms included in the Bay-Delta Water Quality Control Plan, ESA Biological Opinions, HCP and NCCP agreements, EWA Operating Principles agreement, and any other relevant regulations or agreements of the CALFED implementing agencies. These regulations and agreements will change as scientific understanding of the water supply needs for water quality improvement and ecosystem restoration evolves.
Performance Measure 1: The annual number of incidences when water quality standards, flow requirements, or other agreements related to SWP operations throughout the Delta are not met.
Target 1: Zero incidences of not meeting water quality and flow requirements, or other agreements throughout the Delta related to SWP operations.
Data and Methodology: A vast array of operational criteria, commitments/agreements and constraints currently affect the operation and management of the state and federal projects. There are also several rapidly developing processes that will modify or add to the current operational practices and priorities in the near future. The BDCP and OCAP processes in particular are expected to result in significant changes in existing operating criteria. Coordination with these and other processes will occur, and this performance objective will be adapted as appropriate to reflect these evolving conditions. The basis of such criteria involve complex water rights, environmental allocations, water quality standards as well as many hydrodynamic operational parameters involving flow rates, timing, quantities and temperatures. Implementation of this performance measure will largely involve reporting on existing monitoring and data collection activities. The report might also include an alert protocol for CALFED implementation agencies to forensically analyze the magnitude and consequences of incidences where standards, criteria, and/or agreements were not met.
A partial list of current and emerging regulations and agreements is provided below:
SWRCB Decision 1641 Biological Opinions Court Order FERC Settlement (Oroville Operating Criteria) Corps of Engineers Operational Criteria
Operational parameters such as flow rates, volumes and timing will be tracked through routine observation of actual operations data. These data are currently collected, logged and examined, with respect to the criteria listed above, by project operators. Water quality regulations and criteria can also be tracked through ongoing activities being executed by the project operators. There are two main areas of ongoing water quality monitoring: 1) Environmental Water Quality, and 2) Operational Water Quality.
Current monitoring practices ensure the overall water quality needs of the Department of Water Resources and Reclamation. Operators currently provide a central focal point for the collection and dissemination of water quality information for the project contractors and stakeholders. This includes providing water quality data and information
Page 25
in support of such activities as long-range planning, regulatory compliance, project operations, scientific research and policy development.
Environmental water quality is also monitored through DWR and Reclamation. They document the environmental water quality conditions affected by operation of the SWP and the federal Central Valley Project through the monitoring and assessment of various physical, chemical and biological constituents throughout the Delta. This activity is performed through implementation of the Bay-Delta Environmental Monitoring Program and the Interagency Ecological Program and various other water quality programs within DWR and Reclamation. The State Water Project (SWP) water quality monitoring program is an extensive effort, encompassing monthly collection of physical, chemical and biological samples at more than 30 stations in the California, North Bay and South Bay Aqueducts and project reservoirs. In addition, several automated stations continuously monitor water quality conditions in key locations along the SWP and provide real-time data to SWP water contractors. All collected data are stored at the California Data Exchange Center (CDEC) website.
Performance Objective 2: Increase the certainty of Delta water deliveries in the short-term. The primary component of water delivery certainty is the degree of confidence that a scheduled quantity of water will be delivered as planned.
Performance Measure 2: Acre-feet of unexpected reductions in SWP water supplies due to Delta export reductions to meet Endangered Species Act requirements or actions taken to protect at-risk Delta fish species during the current year.
Target 2: Zero unexpected reductions in SWP water supplies.
Data and Methodology: Performance Measure 2 will be quantified in the broadest terms by the difference between acre-feet of water scheduled to be delivered in the current year and acre-feet of water actually made available to SWP contractors in the same year. For SWP deliveries, the “Scheduled Deliveries” are defined by SWP contract allocations (Table A) approved by project operators. Final approval generally occurs in March or April of each year. However, monthly comparisons will be made beginning with the earliest delivery estimate; generally December 1st. Historically there have been only a couple of incidences where final scheduled deliveries exceeded actual deliveries. Still, this performance measure serves as a metric for success relative to the “zero incidences” target and under future conditions that will likely make it more challenging to meet all scheduled deliveries. Although reallocation of carryover or unused project water might not impact deliveries in the current year, it can impact deliveries in subsequent years. This inter-annual effect is also captured in the proposed approach.
Given the complexity and dynamic nature of delivery scheduling and accounting, a formula is required to accurately measure and demonstrate how well the SWP is meeting scheduled deliveries on an annual basis. Below is a demonstration of the formula under two scenarios: (1) no unexpected reductions in project water; and (2) unexpected reduction in project water.
No Reductions Scenario: Actual Table A Deliveries + Unused Allocations + Carryover of Allocations to Next Year+ Other Transactions = Spring Table A Approved Allocation
Reductions Scenario: Actual Table A Deliveries + Unused Allocations + Carryover of Allocations to Next Year + Other Transactions < Spring Table A Approved Allocation
Table 1 below shows a sample application of this method based on the actual data for 2006. Column 1 is the release date of the SWP allocation by DWR. Columns 2 and 3 show the percentage of contractor requests approved by DWR and the corresponding water volumes, respectively. Column 4 is the total annual SWP supplies that were actually made available. Column 5 is the difference between column 3 and 4, and reflects any unanticipated reductions in SWP water supplies. This is the metric by which performance is measured, with the target being zero unanticipated reductions.
Page 26
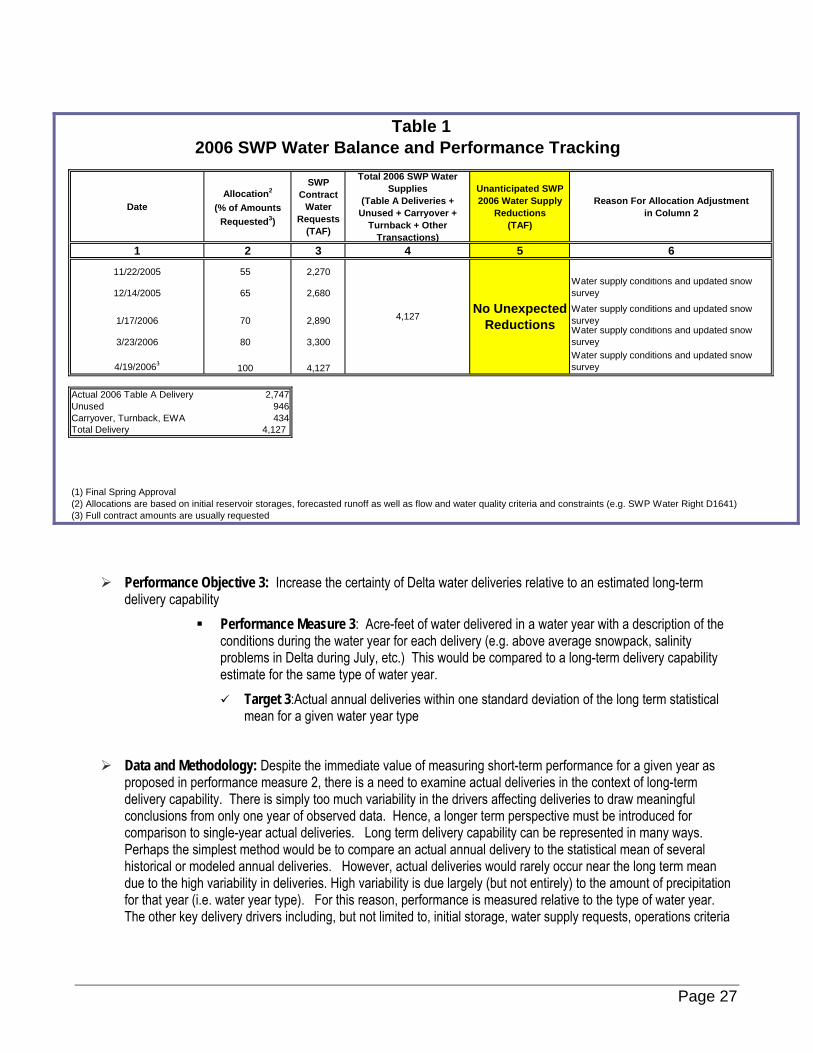
2006 SWP Water Balance and Performance Tracking
DateAllocation2
(% of Amounts Requested3)
SWP Contract
Water Requests
(TAF)
Total 2006 SWP Water Supplies
(Table A Deliveries + Unused + Carryover +
Turnback + Other Transactions)
Unanticipated SWP 2006 Water Supply
Reductions(TAF)
Reason For Allocation Adjustmentin Column 2
1 2 3 4 5 6
11/22/2005 55 2,270
12/14/2005 65 2,680Water supply conditions and updated snow survey
1/17/2006 70 2,890Water supply conditions and updated snow survey
3/23/2006 80 3,300Water supply conditions and updated snow survey
4/19/20061 100 4,127Water supply conditions and updated snow survey
Actual 2006 Table A Delivery 2,747Unused 946Carryover, Turnback, EWA 434Total Delivery 4,127
(1) Final Spring Approval(2) Allocations are based on initial reservoir storages, forecasted runoff as well as flow and water quality criteria and constraints (e.g. SWP Water Right D1641)(3) Full contract amounts are usually requested
No Unexpected Reductions
4,127
Table 1
Performance Objective 3: Increase the certainty of Delta water deliveries relative to an estimated long-term delivery capability
Performance Measure 3: Acre-feet of water delivered in a water year with a description of the conditions during the water year for each delivery (e.g. above average snowpack, salinity problems in Delta during July, etc.) This would be compared to a long-term delivery capability estimate for the same type of water year.
Target 3:Actual annual deliveries within one standard deviation of the long term statistical mean for a given water year type
Data and Methodology: Despite the immediate value of measuring short-term performance for a given year as proposed in performance measure 2, there is a need to examine actual deliveries in the context of long-term delivery capability. There is simply too much variability in the drivers affecting deliveries to draw meaningful conclusions from only one year of observed data. Hence, a longer term perspective must be introduced for comparison to single-year actual deliveries. Long term delivery capability can be represented in many ways. Perhaps the simplest method would be to compare an actual annual delivery to the statistical mean of several historical or modeled annual deliveries. However, actual deliveries would rarely occur near the long term mean due to the high variability in deliveries. High variability is due largely (but not entirely) to the amount of precipitation for that year (i.e. water year type). For this reason, performance is measured relative to the type of water year. The other key delivery drivers including, but not limited to, initial storage, water supply requests, operations criteria
Page 27
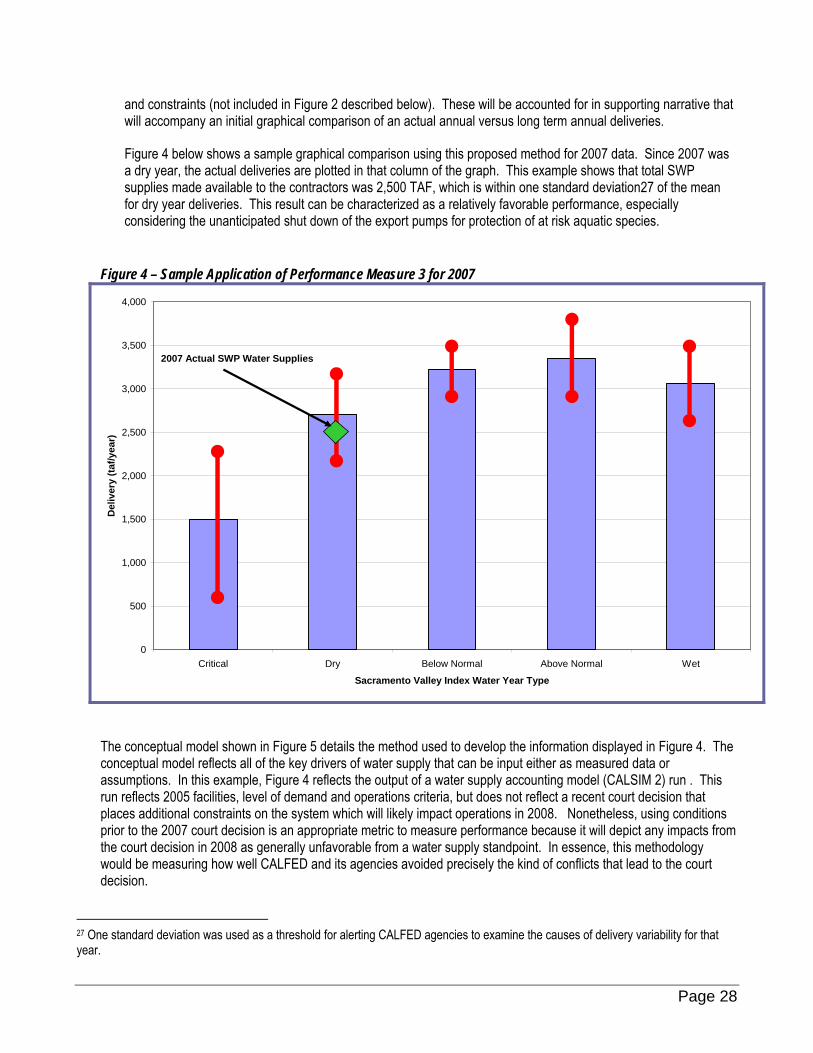
and constraints (not included in Figure 2 described below). These will be accounted for in supporting narrative that will accompany an initial graphical comparison of an actual annual versus long term annual deliveries.
Figure 4 below shows a sample graphical comparison using this proposed method for 2007 data. Since 2007 was a dry year, the actual deliveries are plotted in that column of the graph. This example shows that total SWP supplies made available to the contractors was 2,500 TAF, which is within one standard deviation27 of the mean for dry year deliveries. This result can be characterized as a relatively favorable performance, especially considering the unanticipated shut down of the export pumps for protection of at risk aquatic species.
Figure 4 – Sample Application of Performance Measure 3 for 2007
0
500
1,000
1,500
2,000
2,500
3,000
3,500
4,000
Critical Dry Below Normal Above Normal Wet
Sacramento Valley Index Water Year Type
Del
iver
y (ta
f/yea
r)
2007 Actual SWP Water Supplies
The conceptual model shown in Figure 5 details the method used to develop the information displayed in Figure 4. The conceptual model reflects all of the key drivers of water supply that can be input either as measured data or assumptions. In this example, Figure 4 reflects the output of a water supply accounting model (CALSIM 2) run . This run reflects 2005 facilities, level of demand and operations criteria, but does not reflect a recent court decision that places additional constraints on the system which will likely impact operations in 2008. Nonetheless, using conditions prior to the 2007 court decision is an appropriate metric to measure performance because it will depict any impacts from the court decision in 2008 as generally unfavorable from a water supply standpoint. In essence, this methodology would be measuring how well CALFED and its agencies avoided precisely the kind of conflicts that lead to the court decision.
27 One standard deviation was used as a threshold for alerting CALFED agencies to examine the causes of delivery variability for that year.
Page 28
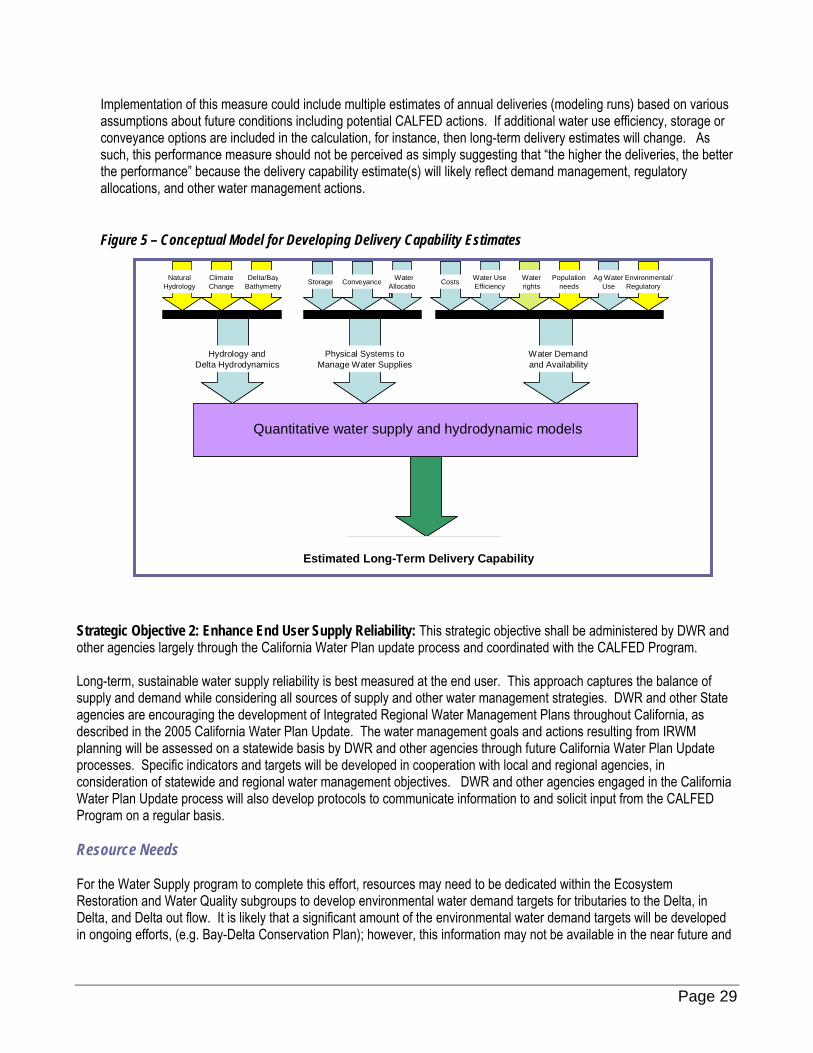
Implementation of this measure could include multiple estimates of annual deliveries (modeling runs) based on various assumptions about future conditions including potential CALFED actions. If additional water use efficiency, storage or conveyance options are included in the calculation, for instance, then long-term delivery estimates will change. As such, this performance measure should not be perceived as simply suggesting that “the higher the deliveries, the better the performance” because the delivery capability estimate(s) will likely reflect demand management, regulatory allocations, and other water management actions.
Figure 5 – Conceptual Model for Developing Delivery Capability Estimates
Natural Hydrology
Climate Change
Water Allocation
Delta/Bay Bathymetry Conveyance Water
rightsPopulation
needsAg Water
Use Environmental
needs
Hydrology and Delta Hydrodynamics
Costs
Water Demand and Availability
% of
Quantitative models:
CALSIM, DSM2
WSR 2
WSR 1
Water Use EfficiencyStorage
Physical Systems to Manage Water Supplies
% of export demand
Natural Hydrology
Climate Change
Water Allocation
Delta/Bay Bathymetry Conveyance Water
rightsPopulation
needsAg Water
Use Environmental/Regulatory
Hydrology and Delta Hydrodynamics
Costs
Water Demand and Availability
% of
Quantitative water supply and hydrodynamic models
WSR 2
WSR 1
Water Use EfficiencyStorage
Physical Systems to Manage Water Supplies
% of export demandEstimated Long-Term Delivery Capability
Strategic Objective 2: Enhance End User Supply Reliability: This strategic objective shall be administered by DWR and other agencies largely through the California Water Plan update process and coordinated with the CALFED Program. Long-term, sustainable water supply reliability is best measured at the end user. This approach captures the balance of supply and demand while considering all sources of supply and other water management strategies. DWR and other State agencies are encouraging the development of Integrated Regional Water Management Plans throughout California, as described in the 2005 California Water Plan Update. The water management goals and actions resulting from IRWM planning will be assessed on a statewide basis by DWR and other agencies through future California Water Plan Update processes. Specific indicators and targets will be developed in cooperation with local and regional agencies, in consideration of statewide and regional water management objectives. DWR and other agencies engaged in the California Water Plan Update process will also develop protocols to communicate information to and solicit input from the CALFED Program on a regular basis. Resource Needs For the Water Supply program to complete this effort, resources may need to be dedicated within the Ecosystem Restoration and Water Quality subgroups to develop environmental water demand targets for tributaries to the Delta, in Delta, and Delta out flow. It is likely that a significant amount of the environmental water demand targets will be developed in ongoing efforts, (e.g. Bay-Delta Conservation Plan); however, this information may not be available in the near future and
Page 29
interim targets for environmental demands may need to be developed. Ultimately, resource allocation decisions for these purposes would be made by ERP and WQ program agencies. Because hydrologic and hydraulic data collection for both the federal and state water projects are ongoing, no significant data gaps exist in measuring water supplies to the Delta. Further engagement and cooperation with local and regional agencies will be needed to develop objectives, performance measures and targets; as well as the data needed for accurate analysis under Strategic Objective 2: End User Supply Reliability. Resource needs are under development but unknown at this time. Schedule and Next Steps
1. Ongoing coordination with Ecosystem Restoration and Water Quality Program agencies to ensure that initial targets are established for water supply volume, flows and timing to support CALFED ecosystem and water quality goals. It should be made clear that these targets may change in the future as on-going and planned research activities are completed.
2. Ongoing coordination with BDCP/OCAP and other processes that will affect future project operations.
3. DWR and USBR will ensure they are positioned for implementation by developing any additional organizational
framework or resource allocations that might necessary to monitor, synthesize and document the performance measures.
4. The CWPU process will host 8 regional workshops for the calendar year 2007. They will be strategically held in
cities throughout the state to capture the full range of California’s hydrological, climatological and geographical diversity. Sixteen additional regional workshops will be held throughout the state during calendar years 2008 and 2009.
3.C. Water Quality The initial water quality performance measures relate principally to activities and objectives of two CALFED Programs-- the Water Quality Program, which has focused on drinking water quality, and the Ecosystem Restoration Program. Together, these programs address human and ecosystem “beneficial uses,” – and CALFED Program objectives for these uses – which are affected by water quality. In Stage 2 the CALFED Program will need to account for and manage impacts of agency actions on water quality. This work requires sustained coordination among the CALFED agencies. The long-term viability of the Delta requires a broader perspective on water quality than is embraced by the CALFED Program. Although the CALFED Program will continue to address water quality issues central to the Program goals, future Delta management must take into account water quality necessary to protect all beneficial uses of Delta waters. Status and trend measures of water quality – i.e., key “outcome indicators”-- need this comprehensive perspective. Work in Phase 2 and beyond should seek to place the important objectives and performance measures identified through CALFED within a comprehensive context. Phase II work on performance measures will include defining “intermediate” drivers, refining outcomes, and quantifying targets (with specified schedules). For example, the organophosphate pesticide objectives adopted by the Regional Water Board will be included as driver indicators. When achievement of ultimate outcomes is considered uncertain or extremely “long-term” we will identify reasonable nearer-term objectives, measures and targets. Improving understanding and management of key mercury methylation process drivers is an example. The toxicity performance measures also imply a
Page 30
step-wise approach to the ultimate objective of toxicity reduction. Emphasis will be placed on linking drivers to management activities. This effort must be supported by a monitoring, assessment, and research design. In addition to reporting on the initial topics identified in this Report (i.e., drinking water quality parameters, mercury and toxicity), work in the upcoming Phases will also include systematic reexamination of the water quality contaminants present in the Delta system and their relative significance in impeding achievement of ecosystem goals and objectives. The water quality and ecosystem resource agencies will coordinate their efforts to identify and quantify relationships between contaminants and ecosystem effects, with particular attention to high-priority, at-risk aquatic species. This effort will make use of the conceptual models and information developed through DRERIP and will be directed, collaboratively, by the ecosystem and water quality agencies and CALFED Science Program. The CALFED Water Quality Program is working with the Central Valley Drinking Water Policy workgroup to develop conceptual models and comprehensive data assessments for priority drinking water constituents of concern. This effort will contribute to completion of a policy for drinking water which the Central Valley Water Board would incorporate in the Basin Plan. For the past eighteen months, this work has focused on water quality at Delta (and Central Valley) intakes. The workgroup is now beginning work on the linkage of Delta water quality to treated water quality, in parallel with the CALFED Water Quality Program’s final assessment. In addition, this document describes performance measures for drinking water quality as they were spelled out in the CALFED ROD. Along with this Phase 1 report, the CALFED Water Quality Program is developing a Final Stage 1 Program Assessment report. One purpose of this report is to develop an initial set of performance measures. This work will develop, integrate, and synthesize the available information on the Delta as a source of drinking water, from the source to tap, and identify the role of the CALFED program within the existing national and statewide drinking water activities. For the sake of efficiency, the Phase 1 report does not capture the latest developments in this technical work. The current schedule for this report is completion in fall 2007, immediately followed by peer review. Salinity is the pivotal water quality parameter for the Delta, and is regulated and managed through flow and channel controls for a range of beneficial uses which have differing salinity needs and tolerances. Because of its importance to water supply, salinity is more carefully monitored in the estuary than any other component of the aquatic system. Generally, supply water objectives of reliably low salinity are orthogonal to the variable salinity regimes and tolerances to which the Delta native species are adapted. CALFED agencies are continuing work to improve understanding of Delta salinity dynamics and our ability, through conceptual and quantitative models, to characterize salinity in geographic and temporal detail. A variety of models exist to allow estimation of the effects of changes in flow or sea level rise on salinity distributions in the delta. In Phase I, performance measures have not been identified for salinity outside of the framework of drinking water supplies. Existing regulatory requirements, and compliance with these requirements, may provide provisional performance measures and targets; however these requirements are unlikely to capture the full ecosystem needs. Also, although there are extensive existing monitoring facilitates reporting on salinity conditions, there may be future need to expand or revise the monitoring. The CALFED end of Stage 1 review and Delta Vision process will involve reexamination of salinity goals and management of the Delta, and should provide a new perspective on appropriate objectives, performance measures, and targets for salinity. Monitoring and Modeling for Performance Measures
Performance Measure 1: Annual averages of organic carbon and bromide at Delta intakes Monitoring and Modeling Needs for PM1: To assess and report on these performance
measures, at a minimum, monthly monitoring for drinking water constituents of concern should be conducted at key locations in the Delta that represent water quality at the intakes (i.e., Banks, CCWD diversions, etc.). Analytical modeling is needed to identify and characterize the relative importance of sources of the constituents and the effects of Delta and upstream hydrodynamics.
Page 31
Existing Monitoring and Modeling for PM1: Drinking water constituents of concern are monitored to varying degrees throughout the Delta and its tributaries. The largest amounts of monitoring data exist at the ends of the major tributaries to the Delta and at the Delta intakes, with significantly less data available the further upstream. Salinity is the most frequently measured, followed by organic carbon, nutrients, and pathogens, which are infrequently or not monitored at these locations. Flow is reasonably well measured throughout the Central Valley and Bay, at higher frequency than water quality data. Efforts are underway to better understand the drivers of water quality at intakes, through assembling and assessing existing data. In addition, the California Department of Health Services (CDHS) regulates drinking water systems and collects considerable monitoring data from public water systems for regulatory compliance purposes.
Gaps in Monitoring and Modeling for PM1: Drinking water constituents of concern upstream of Delta boundaries Conduct studies to improve understanding of the linkage between source water quality,
water quality at the intakes and treated water quality Modeling sensitivity of sources to prioritize sources by their fate and transport to Delta
intakes
Performance Measure 2: Equivalent level of public health protection Monitoring and Modeling Needs for PM2: This information is being developed through the
CALFED Drinking Water Quality Final Assessment work Existing Monitoring and Modeling for PM2: This information will be included in the CALFED
Drinking Water Quality Final Assessment Gaps in Monitoring and Modeling for PM2: This information will be included in the CALFED
Drinking Water Quality Final Assessment
Performance Measure 3: Toxicity to aquatic test organisms (water and sediment) Monitoring and Modeling Needs for PM3: This will be developed in coordination with the
Ecosystem Restoration Program and the Comprehensive Monitoring, Assessment, and Research Program.
Existing Monitoring and Modeling for PM3: In 2001, a multi-agency technical work group convened to develop a Strategy to Address Toxicity of Unknown Cause in water and sediment. The strategy document summarized existing information and toxicity monitoring programs in the Central Valley and Bay-Delta and described the significant data and knowledge gaps related to toxicity of unknown cause. Only limited resources have been allocated to work on aspects of the 2001 Toxicity Strategy so much of the information needs still remain. Baseline monitoring includes the following:
Some monitoring is required through regulatory programs such as NPDES permitting and irrigated lands.
The Sacramento River Watershed Program sponsors some monitoring and assessment but is not supported by permanent funding.
The Surface Water Ambient Monitoring Program (SWAMP) supports some limited toxicity monitoring in localized areas.
In the Bay region, the Regional Monitoring Program addresses toxicity.
Page 32
POD supports special studies for FY 2006-2007. Some grants issued by the State Board and CALFED for water quality-related work will
generate data. Some of these activities are tracked by the Central Valley RWQCB. Gaps in Monitoring and Modeling for PM3: First, there is need to update the Strategy to
Address Toxicity of Unknown Cause with data and research information gathered since 2001. Fate and transport models for specific constituents exist but there is a lack of models for the general parameter “toxicity.” Data for toxicity driver indicators exist for specific constituents (i.e., pesticides). However, in many cases the driver causing the toxicity could not be determined, making it impossible to identify needed analysis for the toxicant: That is, toxicity of unknown cause (TUC) is essentially a data gap. Furthermore, knowledge regarding ecological impacts of TUC is extremely limited. Bioassessments, toxicity testing on resident species, and biomarker analyses could contribute to a weight-of-evidence assessment of impacts on aquatic ecosystem populations. This approach is being pursued in the context of Delta “Pelagic Organism Decline” (POD) investigations. If the issue of TUC is to be resolved, toxicity identification evaluation (TIE) and analytical chemistry procedures need to be refined, or new ones developed.
For the most part, toxicity testing projects have focused on major tributaries and downstream of major reservoirs. To gain a better understanding of toxicity in these watersheds, monitoring programs that include TIEs must be expanded and focused on critical events and locations (e.g., storms, land use activities). In addition, ambient toxicity monitoring associated with NPDES permit discharges has largely been ignored. Analysis of these data, which are largely only available in hard copy format, could assist in understanding toxicity in the Central Valley and San Francisco Bay water bodies. Finally, identification of sources and the practices or actions that result in toxicants entering surface waters would be helpful in designing control strategies.
Performance Measure 4: Tools for identifying causes of toxicity are added to currently available suite Monitoring and Modeling Needs for PM4: This information will be developed in Phase II. Existing Monitoring and Modeling for PM4: See description of existing monitoring and
modeling for PM3 above. Gaps in Monitoring and Modeling for PM4: See description of gaps in monitoring and
modeling for PM3 above.
Performance Measure 5: Mercury concentrations in the tissue of representative Bay-Delta fish and wildlife species. Targets anticipate data with respect to: methylmercury in selected Bay-Delta fish species; methylmercury concentrations in biosentinel species (fish and avian); methylmercury concentrations in water. In addition, monitoring of total and methylmercury in sediments is needed.28
Monitoring and Modeling Needs for PM5: Mercury monitoring of fish tissue, water and sediment is needed throughout the Bay-Delta. Mercury monitoring of appropriate biosentinels is also needed. Modeling needs and use of models being developed through DRERIP and other efforts will be addressed in Phase 2.
Existing Monitoring and Modeling for mercury in the ecosystem and human health (Performance Measures 6 and 7): A number of agencies are currently involved in mercury-related work (e.g., the SWRCB and Regional Water Boards, CDHS, CDFG, OEHHA, U.S. FWS, USGS, and U.S. EPA). Although OEHHA is not an implementing agency for the CALFED
28 See Appendix C, “Draft Report on Indicators for Mercury” for a discussion of the uses and considerations of various measures.
Page 33
Program, this agency’s fish consumption advisory program is the key for risk communication issues. In addition to the Water Quality Program agencies, other agencies whose participation is important are the Ecosystem Restoration Program implementation agencies. Baseline activities include:
CALFED-funded grants investigating aspects of mercury will wind down in 2007 (see list at: http://www.delta.dfg.ca.gov/erp/docs/wq_mercuryissues/List_of_Mercury_Projects.pdf). These projects include a mass balances for total and methylmercury in the Delta and investigations of methylmercury from wetlands. Final reports are expected early to mid 2008. CALFED is also funding the “Fish Mercury Project” which is to conclude in 2008. SFEI is the lead for studies of mercury in sport and biosentinel fish Funds to continue mercury research and “Fish Mercury Project” activities have not been identified in the Ecosystem Restoration Program, which provided support in Stage 1.
Mercury monitoring is conducted in the context of some regulatory programs (NPDES permits) and certain ambient monitoring programs. (See summary prepared for the SWAMP; Jay Davis, SFEI., SFEI is also working on updating the mercury monitoring inventory)
The San Francisco Bay and Central Valley Water Boards are developing TMDLs and control programs for methyl mercury. The Central Valley Water Board’s work includes mass balances for the Delta and tributaries. Special studies include evaluating methyl mercury from Delta islands and marshes in Mud Slough and the Yolo Bypass. (However, follow-through work on control measures. pilot studies, and control program implementation are not funded baseline activities.)
In the field of human health, OEHHA uses available fish tissue data as the basis for public health advisories; CDHS conducts public outreach and risk communication based on the advisories. For example, drawing substantially from information developed through the CALFED-funded Fish Mercury Project OEHAA has recently released draft “safe eating guidelines” for fish in the San Joaquin River and South Delta. Advisories for the North Delta and Sacramento River are planned. Data have been developed which document widespread fish contamination throughout the Central Valley watershed, outpacing agency preparation of fish consumption advisories and other forms of public outreach.
There are a number of smaller studies of methylmercury from wetlands and agricultural lands funded through the Central Valley Regional Board, DFG and grant funds (Prop 40).
Gaps in Monitoring and Modeling for PM5: SFEI is currently working on an inventory of mercury monitoring projects in the Bay-Delta. Once the inventory is complete data gaps can be identified. Work on modeling will be conducted in Phase 2.
Performance Measure 6: Mercury exposure is at a safe level for all individuals that consume Bay-Delta fish. Targets for this Performance Measure anticipate information on (1) extent to which fish advisories are developed for areas known to be contaminated; (2) degree of awareness in at-risk populations of fish contamination risks and safe consumption practices; and (3) direct measures of mercury exposure in human populations.
Monitoring and Modeling Needs for PM6: The first two targets relate to reporting the extent and results of agency activities. Focused studies of fish consuming populations, that may include fish consumption surveys or biological monitoring, are needed to characterize exposure to mercury from consumption of Bay-Delta fish. These studies intend to clarify fish consumption patterns, identify high risk populations, and assess information needs and optimal methods for reducing mercury exposure through risk communication.
Page 34
Existing Monitoring and Modeling for PM6: DHS conducted a fish consumption survey of anglers in San Francisco Bay (SFEI 2001), and several small pilot studies of fish consuming populations in the Delta. In conjunction with information of fish contamination developed through the Fish Mercury Project (see PM5), DHS has conducted public outreach and OEHHA has prepared fish consumption advisories.
Through past surveys, biomonitoring studies, and other activities, DHS has attempted characterized awareness and knowledge of advisories for limited populations.
Gaps in Monitoring and Modeling for PM6: Because mercury exposure can result from sources other than Bay-Delta fish, it is important to have information on background exposure levels. Background exposure to mercury from consumption of commercial sources of fish is not well characterized in California populations. Recent legislation established a statewide biomonitoring program that is likely to include measurement of mercury in representative sample of adults and children in California. However, funding to implement this program has not yet been approved.
Better evaluation is needed of changes in awareness, knowledge, and behavior as a result of educational (and other) interventions in affected populations, particularly populations of color and/or non-English speaking groups. This evaluation may use methods such as surveys, interviews, focus groups, and direct observation. Studies are needed to characterize and document behavior changes resulting from increased awareness about mercury contamination in fish.
Resource Needs State and Regional Board Resource Needs: Limited staff resources are currently committed to this phase of designing water quality performance measures and indicators, or to the monitoring, assessment, research and other activities needed on an ongoing basis to generate information and scientific understanding required for good performance measures. Some staff are conducting work related to performance measures and indicators for drinking water quality, but this is less the case for indicators and performance measures associated with toxicity or mercury. In Phase 2 the Water Quality Indicators Subgroup will refine a work plan which builds on activities currently underway to identify indicators and available information and adds indicator monitoring, data retrieval, assessment, and reporting. Fiscal year 2006/2007 work for the POD included investigation of toxicity as a contributing factor through toxicity testing, study of contaminant trends, and biomarker analyses. Additional resources at the Regional Water Board and at the California Department of Fish and Game are needed to address these toxicity data gaps, including refining procedures, expanding monitoring, retrieving existing data into compatible electronic formats, and evaluating such data. However, additional resources are not anticipated in the upcoming fiscal year. With no added resources, there will not be a system-wide compilation and analysis of current toxicity data; existing practices for reporting individual research and monitoring projects would continue. Current programs support some monitoring, toxicity profiling and TIEs but these activities are limited in geographic scope and purpose, and, in particular, do not provide for coordinated and comprehensive assessment. Current staffing is inadequate to support substantial work related to performance measures for mercury. Additional resources for the Water Quality Program implementing agencies, including the California Department of Fish and Game, will be needed to build on current contract work scheduled to end in 2007. Future work priorities are: linking mercury monitoring and science to “driver” projects in the field, addressing data gaps, improving conceptual models for the drivers, assessing watershed management activities with respect to total mercury and methylmercury loads, assessing and reporting on outreach to educate people on safe fish consumption, investigating the processes of mercury methylation, and monitoring. One staff role which could be of particular value is a “mercury coordinator.” This position was initially recommended by the Mercury Strategy to serve as “scientific leader, facilitator, communicator, and point of contract on mercury issues for the
Page 35
Bay-Delta Program.” A recent CALFED Program mercury workshop has also emphasized the importance of a coordinator. For mercury, current staff resources to support the activities identified above or to further develop CALFED Program performance measures are limited to certain “baseline activities”. Additional resources—not anticipated at this time-- would be needed to synthesize and build on current contract work, scheduled to end in 2007, that offers a scientific and information basis for performance measures. Project (grant) funding is needed for:
Pilot projects and data gaps (resulting data also contributes to indicator and performance measure development) - $7M
Delta fish consumption study (resulting data also contributes to indicator and performance measure development) - $3 M.
Overall, an additional 3 PY and $250K in contract funds are needed for performance measure and indicator development. CDHS Resource Needs for CALFED Performance Measures: As one of the implementing agencies for the Water Quality Program CDHS will participate in work to improve and report on drinking water quality; additionally, DHS’ Environmental Health Investigations Branch, which conducts public information programs on threats to human health, will continue to conduct and report on its mercury education and outreach activities, but , without renewed funding, at a substantially reduced level compared with the recent years of CALFED funding. Drinking water: CDHS, along with SWRCB, US EPA, and the CALFED Bay-Delta Program, is working to develop a comprehensive strategy for maintaining and improving drinking water quality in California, including identification of multi-tiered performance measures. There is a substantial amount of technical work needed to inform these efforts, which are bringing together significant amounts of technical information to better understand and communicate drinking water quality in the state. CDHS does not currently have resources to support these efforts. CDHS has determined that the technical evaluation and development of conceptual models and performance measures could be accomplished with additional resources. If funding for these efforts is not provided, the CALFED Water Quality Program will be significantly delayed in developing a strategy and performance measures, protracting the State’s inability to make cost-effective drinking water quality decisions. The development of a strategy and performance measures for the CALFED Water Quality Program will support critical decisions for the future of the Delta, will provide for a more effective approach to providing safe drinking water from surface waters in the state, and will develop an integrated framework for groundwaters, as well as for addressing water quality through regulations, public funding, and regional water management.
Page 36
Human Health – Mercury: CALFED-funded work—the “Fish Mercury Project”—has generated data on fish contamination throughout the Central Valley watershed. However, CDHS does not have resources to continue the level of outreach and education, and related reporting, funded through the grants, which will conclude in August 2008. Grant funds, in combination with one fulltime DHS staff, supported 3.5 FTE.
Schedule and Next Steps 1. Coordinate with/support of Central Valley Drinking Water Policy: (i) update water quality database, (ii) complete and
refine conceptual models to form basis of watershed performance measures, and develop monitoring needs, modeling studies, and economic information. The items (i) and (ii), without additional resources, will be completed by early 2007, dependent on continued commitment of CALFED staff resources.
2. Support CALFED Water Quality Program’s Final Program Assessment, which both synthesizes watershed information and develops conceptual models of linkages between Delta surface water and treated water quality. CDHS and CALFED are working on identifying these treatment plants and determining whether representative treatment categories can be created for conceptual model purposes. Consultant support has been obtained through the U.S. Bureau of Reclamation, and work will be completed in October 2007.
3. There is also need for additional detail on the Delta hydrodynamics driver, including better bathymetry, elevation, and flow data. Our understanding of the transport of constituents through the Delta is only as good as this information, and additional resources should be dedicated to this.
4. Update information developed for the “Strategy to Address Toxicity of Unknown Cause” (2002). This activity would retrieve information, assess the information being generated through current programs (see below, for example), identify toxicity data gaps and refine procedures, and prepare a plan for further work on toxicity, including a design for expanded monitoring. Additional staff would be needed at the Central Valley Water Board and California Department of Fish and Game. To complete this task by the end of 2007, additional staff would be needed at the Central Valley Water Board and California Department of Fish and Game. Without additional resources, approximately 25% of Step 1 could be covered over the period of a year. However, the utility of this work given the pressing need for assessment of information being generated is questionable.
5. Using information from Task 5 and supporting work from the POD investigations, refine conceptual models characterizing toxicity mechanisms and effects in an ecosystem context. There are no existing resources for Task 6. This task would require someone to coordinate a technical group focusing on conceptual models.
6. Fund additional biomarker research and investigate incorporation of biomarkers as indicators of toxicity. Task 7 could be funded through research grants (cost tbd). However, currently no funding source has been identified for this task.
7. Compile, synthesize, and assess information developed through CALFED-funded grants and related mercury projects; identify data gaps, refine conceptual models, and identify further research needs. Focus this activity on key drivers of mercury methylation and biotic and human exposure.
8. Develop protocols and guidance for (1) key factors to consider when designing a hypothesis-driven restoration project, and (2) methyl mercury monitoring associated with activities such as watershed management, wetlands habitat restoration in the Delta and habitat restoration in upstream sites with high mercury levels.
9. Continue biosentinel and sport fish monitoring and regional monitoring of methyl and total mercury in water and sediment; continue work on human consumption of contaminated fish and effectiveness of risk communication. Monitoring should provide more complete coverage of the Delta and upstream waters for both ecosystem and human health concerns.
10. Identify methyl mercury sources from wetlands, agricultural runoff, and urban stormwater. 11. Provide support for studies designed to evaluate methods for the reduction of loads of total and methyl mercury
using management activities/best management practices (e.g. restoration, wetlands, floodways, agriculture, urban
Page 37
runoff, water conveyance and storage). Identify and implement opportunities to design habitat management and restoration projects to test hypotheses regarding methylation processes.
12. Develop best management practices, pilot studies and implement control programs related to mercury.
Next Steps Target Date Gather additional data on Delta hydrodynamics (all indicators) TBD
Update drinking water database, refine conceptual models, develop analytical models, and define the human health basis for potential water quality objectives
Support the CALFED Drinking Water Quality Program final assessment
Mid to late 2008
Late 2007
Gather and analyze existing data on water column and sediment toxicity Update strategy to address unknown toxicity Refine toxicity conceptual models Conduct studies on biomarker indicators of toxicity
FY 07-08 TBD May 07 07-08
Compile and assess available data on mercury to identify gaps and research needs and refine conceptual models
Continue methyl and total mercury monitoring in biosentinel and sport fish and in water and sediment
Continue assessment of human consumption of contaminated fish and risk communication
Identify total and methyl mercury sources and assess their relative importance
Ongoing: Some projects complete in mid-2008
Support studies to evaluate methods to reduce total mercury and mercury methylation
TBD
Develop strategic monitoring & research plan (all indicators) TBD
3.D. Levee System Integrity Approach Overview It is recognized that having and presenting data and information about the state of the Delta levees is important, even critical, for managing the Delta levee system and for informing agencies, stakeholders and publics about the state of the Delta levees. The Delta Risk Management Strategy (DRMS) will provide relevant information for the development of indicators and performance measures. DRMS is gathering and analyzing existing data that is available, but there is a need to develop a long-term monitoring program in order to provide this information in a consistent and timely manner. For example, surveys of levee elevations should be done at least every 5 years and involve the local reclamation districts. Borings and engineering analyses are needed to evaluate levee stability. Additional research is needed to further understand the major risks to levee stability – including levee fragility studies, understanding the seismic response of peat soils, and investigating whether the CRCV is an active fault. Monitoring plans for the Delta Levee System Integrity Program elements are directly or indirectly dependent on accurate vertical and horizontal data. A common coordinate system for quantifying and mapping features that are tied to vertical and horizontal position data in the Delta is critical in determining levee standard compliance, providing emergency response, and
Page 38
evaluating the effects of subsidence and seismic activity. Specifically, minimum survey-control standards are needed to develop a network of vertical and horizontal control points in the Delta. Without this common survey standard, true elevations and horizontal positions for Delta levees cannot be known, thereby leading to a false sense of confidence in survey data and flood protection. Much of CALFED Program work will require horizontal and vertical control. A single base map/control is critical. Horizontal and vertical datum will be needed by the CALFED storage and conveyance and ecosystem restoration program elements in addition to the Levee Program. Monitoring and Modeling for Performance Measures
Performance Measure 1: KIM (Kilo-Inch-Mile) is an overall measure of net work to achieve the PL 84-99 standard.
Performance Measure 2: RKIM (Risk-adjusted-Kilo-Inch-Mile) is a measure of risk associated with inadequate and sub-standard levee maintenance
Monitoring and Modeling Needs for PM1 and PM2: The principle input to the KIM and RKIM is the levee crest elevations.
Existing Monitoring and Modeling for PM1 and PM2: Some recent levee crest elevations exist from either the Magnetic Anomaly Surveys or from levee crest surveys performed by the Reclamation Districts. This data can be used to develop the KIM and RKIM on those islands. By fall 2007, the LiDAR data will be available for the KIM and RKIM baseline.
Gaps in Monitoring and Modeling for PM1 and PM2: Levee crest elevation updates are few and far between. We expect to perform another LiDAR survey in 5 – 7 years. When DRMS is complete, the assets identified will be used to “flavor” the RKIM.
Performance Measure 3: Number or levee miles or islands with enhanced (above PL84-99) flood protection Monitoring and Modeling Needs for PM3: LiDAR survey every 3-5 years, levee cross-
sections, annual levee maintenance inspections, and land surveys. Existing Monitoring and Modeling for PM3:
Levee Profile. Program participants are required to make a profile of the levee crown not less than every fifth year, or more often if determined necessary by the District Board (such as after severe storms).
Levee Cross Section. DWR retains copies of existing cross sections documenting that levees meet minimum HMP cross section criteria. When districts have brought their levees into compliance with HMP they are required to update cross sections, at intervals no greater than 500 feet, in rehabilitation projects areas. Copies of this information have also been submitted to FEMA.
Annual Levee Maintenance Inspection DWR and DFG annually inspect nonproject levees in the Delta in accordance with Water Code Section 12989, the 1986 Flood Hazard Mitigation Plan, and AB360 habitat requirements. The reviews include the following levee maintenance:
vegetation removal, road surface maintenance, roadway crown grading, and gate repair on the levee crown,
•
•
•
vegetation removal, hazard tree removal, mature tree trimming, slipouts, erosion, cracking, and subsidence on the land side levee slopes,
vegetation removal, revetment slippage, slipouts, erosion, cracking, and subsidence of the water side levee slopes,
Page 39
control of encroachments that affect levee integrity, and •
• control of rodents that affect levee integrity. In addition, approximately every two years, the U.S. Army Corps of Engineers inspects those levees for continuing eligibility with PL 84-99 certification.
LiDAR and ground surveys (baseline for KIM and RKIM, delta completely surveyed in 2007, flight data available 8/07, tracking system under development)
Periodic land surveys by Reclamation Districts to determine subsidence at each location. Gaps in Monitoring and Modeling for PM3:
Performance Measure 4: Number or levee miles with electro-magnetic conductance anomalies quantified Monitoring and Modeling Needs for PM4: Anomaly surveys. Existing Monitoring and Modeling for PM4: Work agreements with 26 Districts to conduct
anomaly surveys with 50% of the Delta surveyed by 9/08 in terms of levee miles. Gaps in Monitoring and Modeling for PM4: 50% of the Delta will not be surveyed using the
most accurate techniques. Follow-up work will be done to investigate the anomalies detected in Districts that participated in the preliminary investigations.
Performance Measure 5: Acreage of islands / tracts with subsidence control measures Monitoring and Modeling Needs for PM5: Monitoring of islands/tracts with subsidence control
measures. Existing Monitoring and Modeling for PM5: Information regarding acreage is available from
project descriptions. Projects are now in the planning stages. Gaps in Monitoring and Modeling for PM5: There are no gaps in monitoring for this PM.
Performance Measure 6: Number of improvements to emergency response Monitoring and Modeling Needs for PM6: Improvements need to be monitored once
implemented. Existing Monitoring and Modeling for PM6: DWR Hydrology Branch is performing hydraulic
modeling for various scenarios to understand needs for emergency response. Gaps in Monitoring and Modeling for PM6: There is a need for additional hydraulic and
forecast modeling to better understand the potential consequences and complete a preparedness plan. River and weather forecast modeling is needed to understand the needs for emergency response.
Resource Needs The implementing agencies for the CALFED Levee program (CA Dept. of Water Resources, US Army Corps of Engineers, and CA Dept. of Fish and Game) do not have the staff capacity to work on the development and reporting of indicators and performance measures for the program. The resources being requested are one full-time person that could do most of the work and coordinate with other efforts, advised by a multi-agency technical advisory team. The technical advisory team would meet approximately ½ day per month, with some additional time for reviewing and commenting on materials. Therefore, each member of the technical advisory team would need to contribute about 10 days per year toward this effort – over the next year. The suggested make-up of the technical team should be 4 state staff (2-DWR, 1-CBDA, 1-DFG), 3 federal staff (2-USACE, 1-USBR) and 3-4 representatives of the reclamation districts (3 consultants). Funds would be
Page 40

needed to pay the Reclamation District consultants for their participation in the effort (approx 10 days per year). In the future, funds would be needed for a long-term monitoring program and staff for data compilation, analysis and reporting. Next Steps
1. Use relevant information from the DRMS study to apply toward indicators and performance measures 2. Develop and refine conceptual models to link drivers and outcomes 3. Develop and refine targets 4. Develop KIM and RKIM 5. Identify linkages with other CALFED programs 6. Develop web-based reporting system
3.E. Ecosystem Restoration Resource Needs Since its inception, the CALFED Ecosystem Restoration Program has acknowledged the need to establish ecosystem indicators and performance measures, and much work has been conducted in these areas during the past several years. During Stage 1 implementation, the ERP has relied on “milestones” to track program progress. The milestones were identified in the CALFED programmatic biological opinions and Natural Community Conservation Plan (NCCP) determination, and comprise actions and objectives intended to benefit species covered in the biological opinions and NCCP determination. An assessment of milestones progress was completed by the ERP in 2004, and another assessment for the end of Stage 1 is ongoing.
Development of ecosystem performance measures is concurrent with several ongoing efforts intended to inform development of the most appropriate indicators; and, for maximum consistency and effectiveness, should be integrated with activities currently in progress. These evaluations and activities include: the end of Stage 1 milestones assessment; a detailed review of the current Conservation Agreement and CALFED regulatory documents; a full evaluation of efforts to date towards the derivation of Ecosystem Restoration performance measures; the assessment of present ecological conditions of the Bay-Delta watershed (with specific reference to POD); the development of the Bay-Delta Conservation Plan (BDCP) and broader ERP conservation strategy; the completion of conceptual models for the Delta Regional Ecosystem Restoration Implementation Plan (DRERIP); and the inventory and assessments envisioned for the Comprehensive Monitoring, Assessment, and Research Program (CMARP III). The ERP agencies believe that the performance measures effort must be consistent with these other endeavors, include mutually agreeable factors and conditions, and broadly accepted as the conceptual basis upon which recovery planning, monitoring and assessment, and adaptive management are integrated.
The Ecosystem Restoration Program agencies (ERP) propose an approach to integrate the performance measures effort within the larger perspective of adaptive management, including future uses of the conceptual models coming out of the DRERIP process. There are a multitude of steps preceding the successful implementation of the adaptive management process envisioned within the CALFED Record of Decision (ROD). Underpinning these are conceptual models describing our current state of knowledge regarding the functional components and natural processes within the Bay/Delta ecosystem. Additionally, monitoring and assessment of data generated through existing programs, or that generated by new sampling efforts (i.e., CMARP III), must be tailored to meet the informational needs identified by ERP management objectives.
Page 41
Successful adaptive management requires extensive communication and coordination between and among resource managers and scientific experts. The approach described herein utilizes the performance measures process to reflect management needs and priorities, and to most efficiently direct the technical work required to support the adaptive management process in furtherance of those objectives. The tasks outlined within this approach involve considerable technical demands, and will require significant additional expertise and staff time.
This document outlines the procedural approach envisioned by the ERP to translate Program objectives for ecosystem restoration into quantitative metrics that will assist in prioritizing and directing resource allocation through Stage 2. These metrics may also be utilized to assess program performance. The focus herein is upon indicators of ecosystem integrity, as opposed to measures associated with fiscal tracking or relative resource allocation amongst the broader range of activities associated with ecosystem restoration. The efforts outlined within this report are not meant to replace the ongoing milestones end of Stage 1 assessment.
The technical work associated with the identification, quantification, evaluation, regular reiteration, and verification of driver indicators as performance measures reflects the majority of effort remaining within the larger performance measures framework, and requires collaboration within and between joint Agency-scientific expert teams. This work awaits the completion of ongoing efforts (DRERIP conceptual models, final definition of outcome indicators) and further anticipates required integration with other critical tasks (the design of a monitoring plan to estimate and assess our identified metrics, and feedback from a comprehensive assessment of current monitoring activities—aka CMARP III).
Currently, it is envisioned that the DRERIP conceptual models (process, habitats, species, and stressors) shall be completed during 2007. The scientific information within these models represents critical components towards completion of the performance measures effort; and, in the larger CALFED perspective, the implementation of adaptive management.
ERP staff availability for work towards finalizing Program performance measures is currently limited. Estimates are that the equivalent of 6 to 10 full time staff (depending on status of CMARP III and completion of other efforts29) will be needed to develop initial performance measures over the next 18 months. Additional expenditures are estimated for technical assistance contracts. To date, these staff resources have not been fully provided towards the performance measures effort and directly-related activities. To that end, the Department of Fish and Game has developed a concept where ERP agency staff with additional support by university scientists and other consultants could carry out the development of performance measures and monitoring that would ultimately comply with the Conservation Agreement and ROD. The department is currently taking steps to develop the resources to create a dedicated unit that would support development of ERP performance measures and program assessment, at an estimated cost of $1.7 million per year. The DFG employees would work with other agency staff to fully develop and implement a coordinated monitoring and performance measure strategy for the ERP.
Schedule and Next Steps Once adequate staff is available to work actively on ecosystem restoration performance measures, the following tasks will be initiated:
29 The Record of Decision for the CALFED Bay Delta Program called for establishment of the CALFED Science Program and charged the lead scientist with the task of implementing a Comprehensive Monitoring, Assessment, and Research Program to effect monitoring, assessment, and development of an adaptive management strategy to chart program progress and compliance with the "CALFED Bay-Delta Conservation Agreement regarding the Multi-Species Conservation Strategy" dated August 28, 2000. To date, these prescriptions have not been fully realized; and since then, the Little Hoover Commission, the Department of Finance, and the Governor's 10-Year Action Plan have all called for development of the means to assess performance of the CALFED Bay Delta Program.
Page 42
A thorough assessment and review of performance measure efforts to date will be conducted and evaluated for carryover into the Stage 2 performance measures.
The Ecosystem Restoration Performance Measures Subgroup will convene regularly to reevaluate and derive interim performance measures to serve until the final performance measures package is available.
Members will begin the process of full integration with the Water Quality Performance Measures Subgroup.
In association with CMARP III, roles and responsibilities will be outlined and tasks and staff assignments made accordingly.
The Eco subgroup will actively integrate with the NMFS Salmonid Recovery Plan effort to develop indicators consistent with recovery objectives contained in that plan.
The Eco subgroup will actively integrate with the Delta Native Fishes Recovery Plan process to incorporate a consistent process into USFWS recovery planning.
In association with the Department of Fish and Game, the Eco Subgroup will finalize development of the models identified as DRERIP tier 2-4 species (see Table 2, following).
Page 43
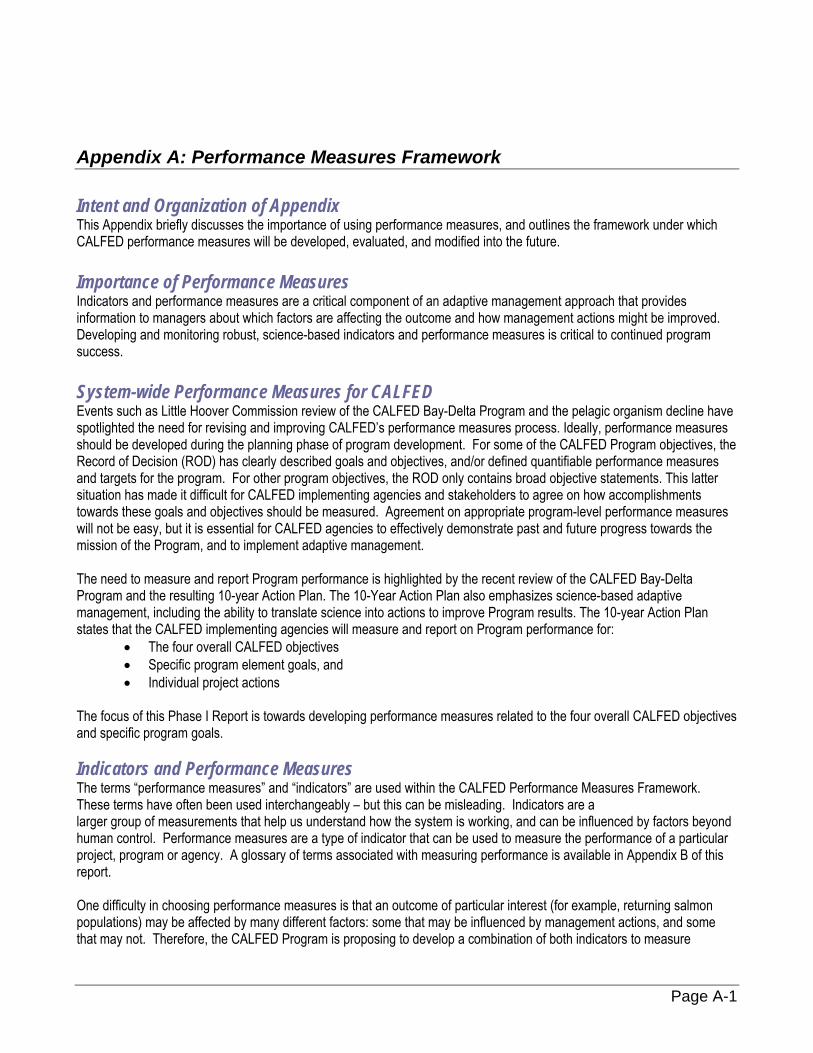
Appendix A: Performance Measures Framework Intent and Organization of Appendix This Appendix briefly discusses the importance of using performance measures, and outlines the framework under which CALFED performance measures will be developed, evaluated, and modified into the future. Importance of Performance Measures Indicators and performance measures are a critical component of an adaptive management approach that provides information to managers about which factors are affecting the outcome and how management actions might be improved. Developing and monitoring robust, science-based indicators and performance measures is critical to continued program success. System-wide Performance Measures for CALFED Events such as Little Hoover Commission review of the CALFED Bay-Delta Program and the pelagic organism decline have spotlighted the need for revising and improving CALFED’s performance measures process. Ideally, performance measures should be developed during the planning phase of program development. For some of the CALFED Program objectives, the Record of Decision (ROD) has clearly described goals and objectives, and/or defined quantifiable performance measures and targets for the program. For other program objectives, the ROD only contains broad objective statements. This latter situation has made it difficult for CALFED implementing agencies and stakeholders to agree on how accomplishments towards these goals and objectives should be measured. Agreement on appropriate program-level performance measures will not be easy, but it is essential for CALFED agencies to effectively demonstrate past and future progress towards the mission of the Program, and to implement adaptive management. The need to measure and report Program performance is highlighted by the recent review of the CALFED Bay-Delta Program and the resulting 10-year Action Plan. The 10-Year Action Plan also emphasizes science-based adaptive management, including the ability to translate science into actions to improve Program results. The 10-year Action Plan states that the CALFED implementing agencies will measure and report on Program performance for:
• The four overall CALFED objectives • Specific program element goals, and • Individual project actions
The focus of this Phase I Report is towards developing performance measures related to the four overall CALFED objectives and specific program goals. Indicators and Performance Measures The terms “performance measures” and “indicators” are used within the CALFED Performance Measures Framework. These terms have often been used interchangeably – but this can be misleading. Indicators are a larger group of measurements that help us understand how the system is working, and can be influenced by factors beyond human control. Performance measures are a type of indicator that can be used to measure the performance of a particular project, program or agency. A glossary of terms associated with measuring performance is available in Appendix B of this report. One difficulty in choosing performance measures is that an outcome of particular interest (for example, returning salmon populations) may be affected by many different factors: some that may be influenced by management actions, and some that may not. Therefore, the CALFED Program is proposing to develop a combination of both indicators to measure
Page A-1
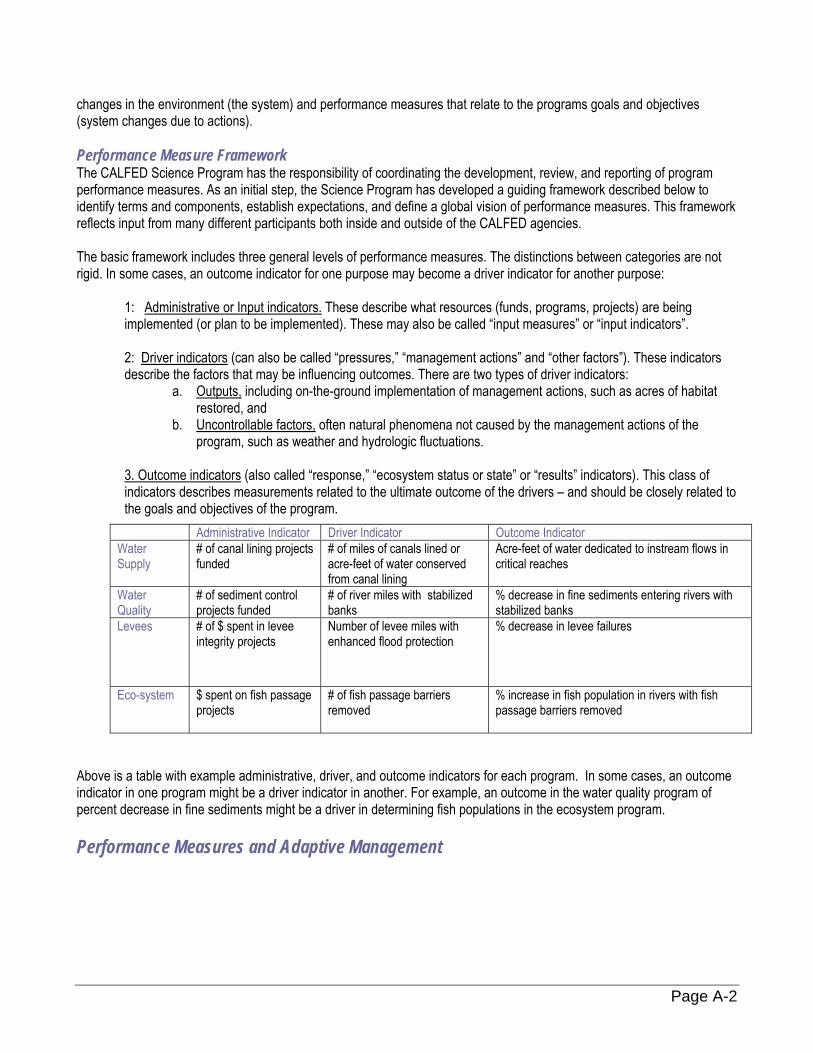
changes in the environment (the system) and performance measures that relate to the programs goals and objectives (system changes due to actions). Performance Measure Framework The CALFED Science Program has the responsibility of coordinating the development, review, and reporting of program performance measures. As an initial step, the Science Program has developed a guiding framework described below to identify terms and components, establish expectations, and define a global vision of performance measures. This framework reflects input from many different participants both inside and outside of the CALFED agencies. The basic framework includes three general levels of performance measures. The distinctions between categories are not rigid. In some cases, an outcome indicator for one purpose may become a driver indicator for another purpose:
1: Administrative or Input indicators. These describe what resources (funds, programs, projects) are being implemented (or plan to be implemented). These may also be called “input measures” or “input indicators”. 2: Driver indicators (can also be called “pressures,” “management actions” and “other factors”). These indicators describe the factors that may be influencing outcomes. There are two types of driver indicators:
a. Outputs, including on-the-ground implementation of management actions, such as acres of habitat restored, and
b. Uncontrollable factors, often natural phenomena not caused by the management actions of the program, such as weather and hydrologic fluctuations.
3. Outcome indicators (also called “response,” “ecosystem status or state” or “results” indicators). This class of indicators describes measurements related to the ultimate outcome of the drivers – and should be closely related to the goals and objectives of the program.
Above is a table with example administrative, driver, and outcome indicators for each program. In some cases, an outcome indicator in one program might be a driver indicator in another. For example, an outcome in the water quality program of percent decrease in fine sediments might be a driver in determining fish populations in the ecosystem program. Performance Measures and Adaptive Management
Administrative Indicator Driver Indicator Outcome Indicator Water Supply
# of canal lining projects funded
# of miles of canals lined or acre-feet of water conserved from canal lining
Acre-feet of water dedicated to instream flows in critical reaches
Water Quality
# of sediment control projects funded
# of river miles with stabilized banks
% decrease in fine sediments entering rivers with stabilized banks
Levees # of $ spent in levee integrity projects
Number of levee miles with enhanced flood protection
% decrease in levee failures
Eco-system $ spent on fish passage projects
# of fish passage barriers removed
% increase in fish population in rivers with fish passage barriers removed
Page A-2
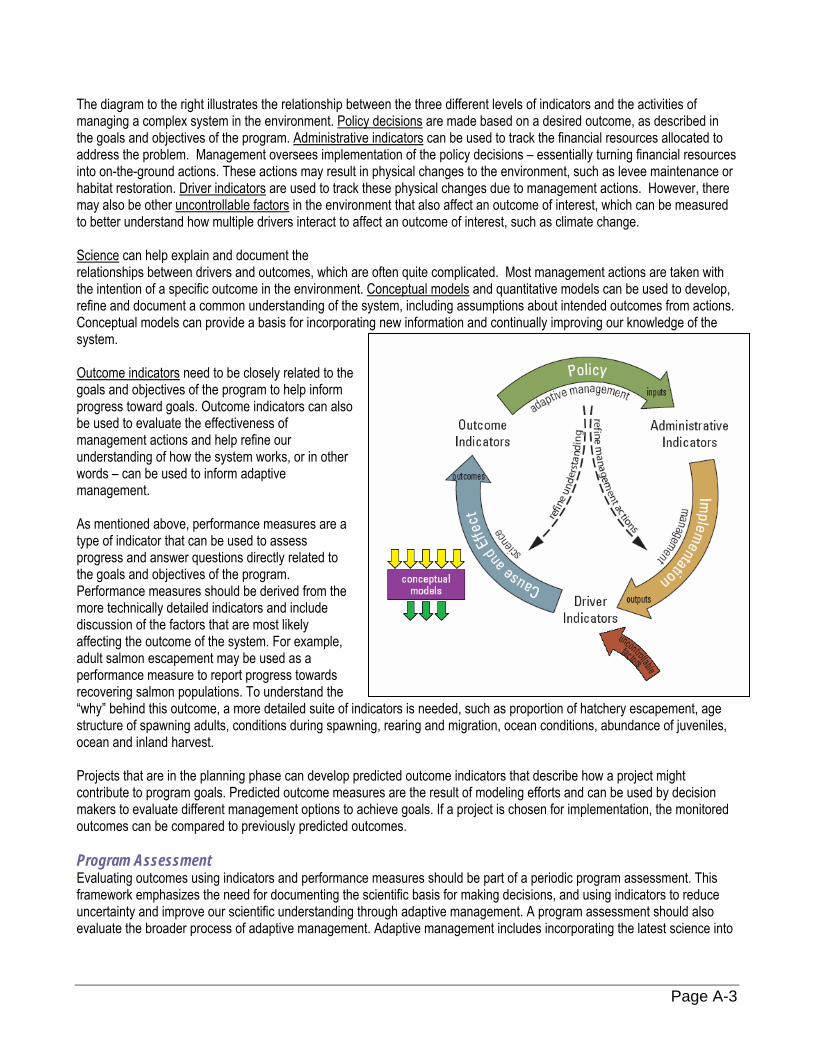
The diagram to the right illustrates the relationship between the three different levels of indicators and the activities of managing a complex system in the environment. Policy decisions are made based on a desired outcome, as described in the goals and objectives of the program. Administrative indicators can be used to track the financial resources allocated to address the problem. Management oversees implementation of the policy decisions – essentially turning financial resources into on-the-ground actions. These actions may result in physical changes to the environment, such as levee maintenance or habitat restoration. Driver indicators are used to track these physical changes due to management actions. However, there may also be other uncontrollable factors in the environment that also affect an outcome of interest, which can be measured to better understand how multiple drivers interact to affect an outcome of interest, such as climate change. Science can help explain and document the relationships between drivers and outcomes, which are often quite complicated. Most management actions are taken with the intention of a specific outcome in the environment. Conceptual models and quantitative models can be used to develop, refine and document a common understanding of the system, including assumptions about intended outcomes from actions. Conceptual models can provide a basis for incorporating new information and continually improving our knowledge of the system. Outcome indicators need to be closely related to the goals and objectives of the program to help inform progress toward goals. Outcome indicators can also be used to evaluate the effectiveness of management actions and help refine our understanding of how the system works, or in other words – can be used to inform adaptive management. As mentioned above, performance measures are a type of indicator that can be used to assess progress and answer questions directly related to the goals and objectives of the program. Performance measures should be derived from the more technically detailed indicators and include discussion of the factors that are most likely affecting the outcome of the system. For example, adult salmon escapement may be used as a performance measure to report progress towards recovering salmon populations. To understand the “why” behind this outcome, a more detailed suite of indicators is needed, such as proportion of hatchery escapement, age structure of spawning adults, conditions during spawning, rearing and migration, ocean conditions, abundance of juveniles, ocean and inland harvest. Projects that are in the planning phase can develop predicted outcome indicators that describe how a project might contribute to program goals. Predicted outcome measures are the result of modeling efforts and can be used by decision makers to evaluate different management options to achieve goals. If a project is chosen for implementation, the monitored outcomes can be compared to previously predicted outcomes. Program Assessment Evaluating outcomes using indicators and performance measures should be part of a periodic program assessment. This framework emphasizes the need for documenting the scientific basis for making decisions, and using indicators to reduce uncertainty and improve our scientific understanding through adaptive management. A program assessment should also evaluate the broader process of adaptive management. Adaptive management includes incorporating the latest science into
Page A-3

management decisions, evaluating the effectiveness of management actions, and adjusting planning and policy based on new information. Performance Measures Process CALFED implementing agencies created an interagency subcommittee to begin development and coordination of system-wide performance measures. Since there is a lot of detailed technical work to be undertaken and coordinated among the agencies, the subcommittee formed four subgroups to focus on the technical details – each led by a representative from the subcommittee. The four subgroups are focused on each of the four CALFED Program objectives: Water Supply Reliability, Water Quality, Ecosystem Restoration, and Levee System Integrity. All CALFED Implementing Agencies are participating in at least one if not more subgroups (see Participating Agency list). The Performance Measures Subcommittee defined the direction of the work, and formed Technical Subgroups to further develop the technical information for the CALFED objectives. The Performance Measures Subcommittee reports its activities to the Agency Coordination Team and Agency Directors, passing along information reported to them by the Technical Subgroups. The figure below illustrates the review process for the technical products. Generally, performance measure products within CALFED program elements are vetted with the appropriate CALFED Bay-Delta Public Advisory Subcommittees, bringing products at varying levels of development (from policy to technical) to subcommittees at their scheduled meetings. The next stage in this policy/stakeholder vetting process is the CALFED Bay-Delta Public Advisory Committee. Performance measure products are also made available on the CALFED website for additional public review opportunities. The second review route for performance measure products is through the CALFED Independent Science Board, where performance measures is a standing agenda item on board meetings and two Science board member liaisons have been appointed for each technical subgroup. When and where appropriate, the CALFED Science Program will convene Science Review Panels to perform in-depth science reviews of the technical aspects of the performance measure products. Both the CALFED Bay-Delta Advisory Committee and Independent Science Board make recommendations on performance measure products before they are considered by the California Bay-Delta Authority Board for adoption.
Phased Approach Work on indicators will be iterative, starting with a small set of outcanalysis and reporting. The 10-Year Action Plan recognizes that it is resource intensive toalso recognizes that there are many monitoring, research and otheeffort. The Performance Measures Subcommittee and the Sciencedevelopment and implementation of performance measures, recogand to identify the resources needed to make meaningful progress
Independent Science Review Panel
e
R
Bay-Delta Public Advisory Subcommittees
APPROVE
Performance Measure Products In-Depth REVIEW
Bay-Delta Public Advisory Committe
ome indicators and taking the
develop, analyze and report or activities that could provide v Program have outlined a fournizing the need to work within.
ECOMMEND
California Bay-Delta AuthorityBoard
Independent Science
Board
m through development,
n meaningful indicators. It aluable information for this
phase process for the the resources available
Page A-4
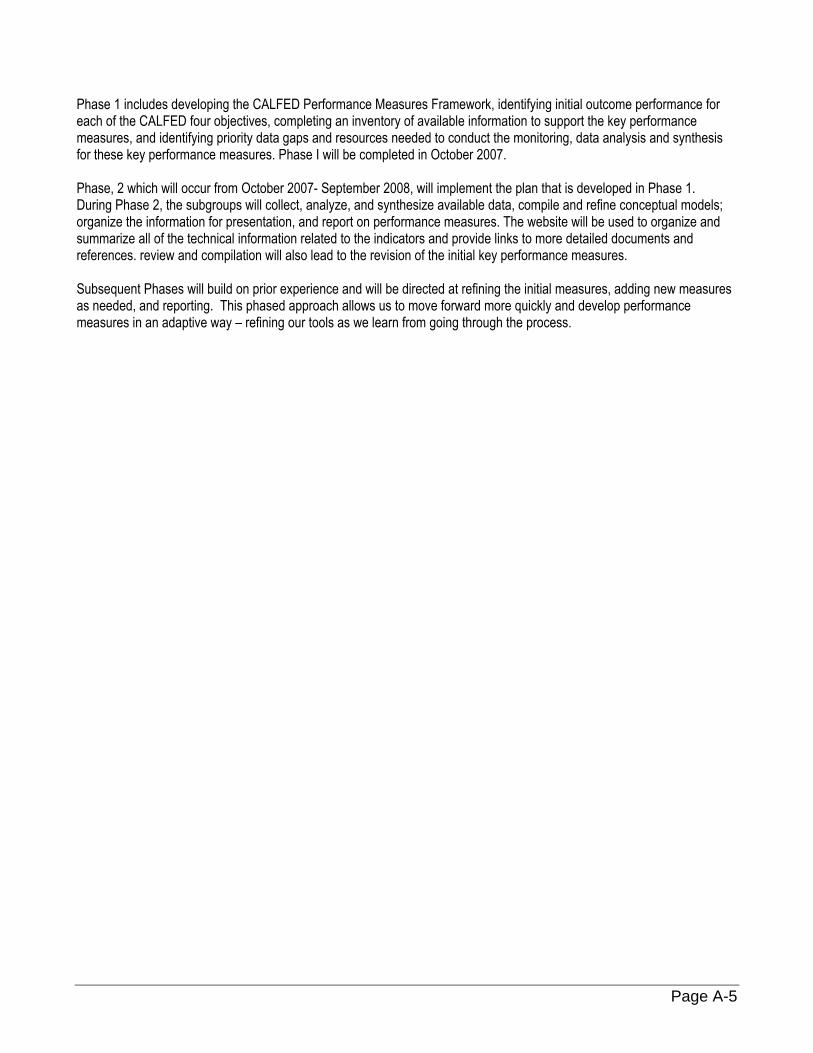
Phase 1 includes developing the CALFED Performance Measures Framework, identifying initial outcome performance for each of the CALFED four objectives, completing an inventory of available information to support the key performance measures, and identifying priority data gaps and resources needed to conduct the monitoring, data analysis and synthesis for these key performance measures. Phase I will be completed in October 2007. Phase, 2 which will occur from October 2007- September 2008, will implement the plan that is developed in Phase 1. During Phase 2, the subgroups will collect, analyze, and synthesize available data, compile and refine conceptual models; organize the information for presentation, and report on performance measures. The website will be used to organize and summarize all of the technical information related to the indicators and provide links to more detailed documents and references. review and compilation will also lead to the revision of the initial key performance measures. Subsequent Phases will build on prior experience and will be directed at refining the initial measures, adding new measures as needed, and reporting. This phased approach allows us to move forward more quickly and develop performance measures in an adaptive way – refining our tools as we learn from going through the process.
Page A-5
Appendix B: Glossary of Terms
Adaptive Management: “Learning by doing.” “An approach to designing and implementing resource management policy that takes account of uncertainty and maximizes the opportunity to learn from management actions” (Michael Healy)
Conceptual Model – a visual and/or narrative explanation of how a system works or expected to respond. A conceptual model should include a discussion of controlling factors (management actions and other uncontrollable factors), expected response or outcome, and a discussion of areas of uncertainty and unpredictability. Quantitative models can be developed from conceptual models and used to predict potential outcomes. Two common frameworks for conceptual models include:
• Driver-Linkage-Outcome (DLO) framework for conceptual models: a conceptual model that describes the relationship between several or many controlling factors and their expected influence on the outcome of interest. For example, a conceptual model related to salmon life cycle, may include drivers such as: spawning habitat, flow conditions, rearing conditions, lotic food web, ocean conditions, predation, pumps, diversions, impediments to passage and effects of contaminants. Outcomes may include: number of adults returning to spawn, number of redds, etc. DLO conceptual models should discuss the relative magnitude of the linkages (i.e. influence on the outcome) as well as uncertainty and unpredictability.
• Pressure-State-Response (PSR) framework for conceptual models: a conceptual model that describes the relationship between one controlling factor (pressure) and the expected influence on the outcome of interest. The PSR model could be considered a simplification or focusing of the DLO model, which may be appropriate in some situations. For example, discharges of a specific constituent causing toxicity in an organism of interest has a simple and linear relationship – it may not be necessary to examine it in the context of a broader conceptual model.
Metric – something that is actually measured. Example: concentration of organic carbon at Banks.
Indicator – a quantitative evaluation of a metric or set of metrics that are representative of an environmental attribute or system attribute of interest. Indicators may be directly tied to a metric (example: daily concentration of organic carbon at Banks) or may be a derivation of one or more metrics (example: average monthly organic carbon concentration at the 5 Delta export points). Indicators are classified into four types with some sub-types, described below.
• Administrative Indicators – indicators that summarize administrative actions and describe resources (i.e. funds, personnel, projects) focused on a particular subject. Example: amount of funds spent on projects to improve water use efficiency. Administrative indicators may also be called “input” indicators.
• Driver Indicators- These indicators describe the factors that may be influencing outcomes. There are two types of driver indicators: 1. Outputs which are on-the-ground implementation of management actions such as acres of habitat restored and 2. Uncontrollable factors which are often natural phenomena not controlled by the management actions of the program such as weather and hydrologic fluctuations
o Output Indicators – Output indicators describe the level of activity that will be provided over a period of time, including a description of the characteristics (e.g. timeliness) established as standards for the activity. Outputs refer to the internal activities of a program – the products and services delivered.1 (Example: acres of best management practices implemented for agricultural water conservation per year).
• Outcome Indicators – Indicators that are representative of system or environmental response to controlling factors. (example: adult salmon returning to spawn)
Page B-1
o Baseline Outcome Indicators – Outcome indicators where no program implementation has occurred. Baseline monitoring is needed for future evaluation of effectiveness of implementation actions.
o Predicted Outcome Indicators – Indicators of outcomes that are predicted from modeling evaluations of potential implementation options. These can assist decision makers that are evaluating different options to achieve program goals and can become the performance goals if the project is implemented.
• Efficiency measures – Sound efficiency measures capture skillfulness in executing programs, implementing activities, and achieving results, while avoiding wasted resources, effort, time and/or money. Simply put, the efficiency is the ratio of the outcome or output to the input of any program. Because they relate to costs, efficiency measures are likely to be annual measures. Meaningful efficiency measures consider the benefit to the customer and serve as indicators of how well the program performs …(e.g. balancing costs and quality)30.
o Outcome efficiency measures – The best efficiency measures capture skillfulness improvements in program outcomes for a given level of resource use. Outcome efficiency measures are generally considered the best type of efficiency measure for assessing the program overall.1
o Output efficiency measures – It may be difficult to express efficiency measures in terms of outcomes. In such cases, acceptable efficiency measures could focus on how to produce a given output level with fewer resources. However, this approach should not shift incentives toward quick, low-quality methods that could hurt program effectiveness.1
Performance measure – using a specific indicator or set of indicators to assess program performance and/or progress towards program goals. Example: A performance measure for water supply reliability might be “unmet demand” = demand – supply Performance measures may be quantitative or qualitative interpretations of quantitative information.
There may be some value in identifying quantitative targets or goals associated with specific performance measures.
Program assessment – an evaluation of program progress and performance that includes performance measures and evaluation of the effectiveness of processes, including adaptive management.
PART: Program Assessment Rating Tool – PART is a diagnostic tool used to assess the performance of Federal programs and to drive improvements in program performance. It helps inform budget decisions and identify actions to improve results. PART is designed to provide a consistent approach to assessing and rating programs across the Federal government. PART assessments review overall program effectiveness, from how well a program is designed to how well it is implemented and what result it achieves.31 Information on PART guidance: www.omb.gov. Examples of Program Assessments using the PART process: ExpectMore.gov
Long-term Performance Objective: A more specific description of outcome indicators that relate to strategic goal or strategic objective. The Performance objective should be as specific as possible to describe what should be measured to describe long-term success for the program. Multiple long-term performance objectives can be described to support one strategic goal or strategic objective.
Performance Goal: Sets a target level of performance over time expressed as a tangible, measurable objective, against which actual progress can be compared, including a goal expressed as a quantitative standard, value or rate. A performance goal is comprised of performance measures with targets and timeframes.2 The PART process recommends establishing long term performance goals and annual performance goals for each performance measure.
30 Excerpt from “Guide to the Program Assessment Rating Tool (PART)” Office of Management and Budget, March 2006, www.omb.gov 31 Excerpt from “Guide to the Program Assessment Rating Tool (PART)” Office of Management and Budget, March 2006, www.omb.gov
Page B-2
Strategic Goal or Strategic Objective: A statement of aim or purpose that is included in a strategic plan.
Target – Quantifiable or otherwise measurable characteristic that tells how well a program must accomplish a performance measure.2
Page B-3
Appendix C: Additional Information ECOSYSTEM RESTORATION Full derivation of the necessary suite of initial performance measures has not been completed to date, and is expected to continue through 2008. The purpose of the additional information contained in Appendix C is to lay out the conceptual foundation and framework for the Ecosystem Restoration performance measures effort, from which the next steps towards final development, adoption, monitoring, and reassessment of performance measures will proceed in our next phase of planning. The CALFED ERP goals and objectives form a conceptual foundation from which adaptive management may be targeted, and a framework from which performance measures may be extracted. However, neither has reached full fruition to date, and performance measures require considerable additional development. Although the initial CALFED ERP goals and objectives were based upon scientific understanding at the time, they were not transparently and thoroughly vetted through a systematic process designed to evaluate the efficacy, costs and benefits associated with each objective. Further, little guidance was provided to help prioritize restoration and management actions for implementation (which actions were most expected to benefit, with greatest certainty and least risk). Finally, many lacked the specificity needed to guide implementation (i.e., prescribing nebulous targets, often not specifically identifying anticipated outcomes, specific actions to achieve these outcomes, or the underlying approach being proposed—the rationale and hypothetical underpinning to support the action). The ERP agencies are currently working within the adaptive management framework (and the Delta Regional Ecosystem Restoration Implementation Plan—aka DRERIP) to address these limitations. This document outlines the procedural approach envisioned by the ERP to translate Program objectives for ecosystem restoration into quantitative metrics that will assist in prioritizing and directing resource allocation through Stage 2. These metrics may also be utilized to assess program performance. The focus herein is upon indicators of ecosystem integrity, as opposed to measures associated with fiscal tracking or relative resource allocation amongst the broader range of activities associated with ecosystem restoration. Therefore, the efforts outlined within this report are not meant to serve as part of the ongoing milestones end of Stage 1 assessment (or CBDP “Retrospective” assessment). Ecosystem Restoration Indicators – Needs and Strategic Framework The CALFED implementing agencies need clear endpoints upon which to direct recovery objectives, and tangible restoration and management actions fitted into a coherent conservation strategy directed at attaining these endpoints. Performance measures, then, are basically reflected in these benchmarks. It is the job of scientists to derive the most up to date, and accurate understanding of the ecosystem; to identify the underlying causative factors contributing to the decline of desirable endpoints, and to prescribe the appropriate actions to ameliorate these undesirable conditions and restore system dynamics to sustain more desirable conditions. It is the responsibility of the implementing agencies and stakeholders to carry out these actions and apply sound adaptive management to sustain these systems. The successful achievement of these quantitative benchmarks reflects satisfactory performance by the parties responsible for implementing the conservation strategy. The success of the CALFED process itself is fully reliant upon the progress realized on both fronts—science and management. The approach described herein utilizes the performance measures process to reflect management needs and priorities, and to direct the technical work required to facilitate the adaptive management process in support of those objectives. The technical work of deriving defensible and informed metrics or indicators would be completed between collaborative teams comprising agency scientists, consulting experts, and academicians. These tasks to be completed are basically enumerated within this document.
Page C-1
The intended overall strategy is to define an efficient yet credible monitoring program to adaptively manage for highest priority outcome indicators preferentially as opposed to defining a broad monitoring plan that may be rendered technically insufficient through dilution of resources in an attempt to attain breadth of coverage. It is anticipated that through the prioritization process contained within the framework proposed within, coupled with the weighting process and evaluation of key driver indicators associated with each particular outcome indicator; the actual number of monitoring metrics required to adequately track performance will collapse upon shared driver variables. Additionally, where appropriate, surrogate and/or multi-functional metrics will be identified and implemented. Finally, prioritization itself clearly directs finite resource allocation accordingly. However, the ultimate strategy adopted awaits further technical assessment. This process will be conducted in a transparent fashion within the Ecosystem Restoration Performance Measures planning effort, and reported on within succeeding versions of the CBDP Performance Measures reports. From Broad Goals to Specific Actions within Adaptive Management The achievement of broad recovery objectives is implied within the actions and targets identified in the ERPP (Jul 2000b), however these actions are too numerous and specific to be easily encompassed within the performance measure framework currently in progress. Moreover, the efforts of scientific expert panels must be grounded by the management objectives and mandates that fall under the responsibilities of the CALFED implementing agencies. It is suggested herein that the framework provided by performance measures should provide this grounding, and set the stage or “finish line” to which scientists supporting the CALFED process must eventually target their efforts. Although the central theme of the ERPP (that true population sustainability requires the rehabilitation of ecological processes) remains theoretically valid, the implementation of such rehabilitation necessitates specific management actions to achieve this end. In other words, the broad goals and objectives that have been laid out in earlier planning documents do not specifically address how to achieve these rehabilitation aims. Further, there is no clear indication of how implementing agencies may weigh or prioritize one action relative to another. This weighting process is a decision based on which species are expected to benefit, the costs inherent in each specific action, and the relative scientific certainty one may attach to any given measure. In other words, who will it benefit, at what cost, and what is our confidence that it will work? Additionally, it is required that (where applicable) trade-offs be assessed. In some instances, a benefit to one species may be a detriment to another. In all cases, resources are finite. Given the reality of resource limitations, there is a recognized need for directing available funds and/or resources towards those actions that are expected to yield the maximum return. There must be a prioritization amongst the suite of available actions based upon the myriad factors mentioned above. Even at the level of ERP goals, the six statements identified in the ERP Strategic Plan (Jul 2000d) can be prioritized based upon those that represent values and desirable attributes versus those that are recognized mandates (specifically, Endangered Species Act obligations). Management agencies may take the information developed within the adaptive management process (e.g., the recommendations from the AMPT using the DRERIP conceptual models) to prioritize projects based on feasibility and predicted efficacy. However, the implementation of such actions shall necessarily be prioritized by the management mandates of the respective agencies. These mandates are species-driven. Yet, tailoring ecosystem analysis to species isn’t solely a management-driven endeavor. From a scientific perspective, analyzing status and response at the hierarchical level of populations allows a convenient platform from which scaling to individual or community level interactions can be more reliably accomplished. The species/population scale reflects an intermediate level of organization—whereby community-level interactions (those within and between species and guilds) can be quantitatively modeled, as well as the ecologically-significant endpoint to which individual scale effects (e.g., net impact of toxicants) can be applied. For these reasons, it is suggested that the species/population emphasis is the most reasonable approach to take from both the management and scientific perspectives.
Page C-2
Tailoring performance measures, research monitoring, and assessment to species of management concern does not necessarily preclude broader management objectives of ecosystem integrity as expressed by the rehabilitation of ecosystem processes. It is anticipated that the more rigorous investigation of ecosystem dynamics made possible through the completion of the DRERIP suite of conceptual models will allow for assessments of restoration and management actions that are simultaneously species-based (reflecting actions suggested and supported by principal limiting factors for species of management concern) and inclusive of broader objectives. For example, if certain keystone species are determined to be critical ecosystem components (due to interactions with desirable ecosystem components), these will be factored into performance measures with weight commensurate to their importance. Where non-endangered species or suites of species are deemed important sentinels within the system (as surrogates for indicators of some other priority endpoint), metrics for these species would be incorporated as priority performance measures. The value of the framework as outlined within this document is that it represents an approach by which managers can weigh, evaluate, and prioritize possible restoration and management actions, thereby providing the specificity lacking in broader restoration prescriptions such as “rehabilitate natural processes.” The execution of specific restoration measures carries more than an implied cause-effect relationship between actions and species recovery. There is a clear expectation that one leads to the other. This relationship is markedly more specific than the broad rehabilitation objectives characterized in the ERP planning goals discussed above. Such specificity calls for a rigorous, transparent, and justifiable process based on the best available scientific knowledge regarding the ecology of the Bay/Delta. This task is daunting, but critical to the success of the ERP, and therefore CALFED itself. Currently, the DRERIP process is underway with the specific task of deriving conceptual models through which restoration actions will be evaluated, and influences upon the suite of species inhabiting the Delta can be assessed in light of current and future management actions. This process will directly address the issue of scientific certainty, and prioritizing specific restoration and management actions with a mind towards species-specific benefits. The performance measures effort may serve the function of grounding the scientific effort within the concerns imposed by management responsibilities—operating at the interface between applied science and policy. Contained within this proposal is an approach to implementing adaptive management through the directive capacity of performance measures (the clear and concrete expression from ERP agencies of desirable ecosystem state), including the basic steps and tasks necessary to bring resource management decisions in line with scientific knowledge (wherein decision-makers are informed by the best available scientific information and guidance). Translating Program Objectives to Quantitative Indicators Following are basic guidelines, and the critical steps associated with the translation of CALFED Program Goals and Objectives into quantitative performance measures. In order to complete this task and track Program performance, the Implementing Agencies (and the Science Program as facilitators), must:
1) Define indicators and performance measures that meet Program objectives. (The proposal herein outlines an approach for this).
2) Select indicators (metrics) that reflect direct attainment of these standards (e.g., delta smelt fall MWT index of X ±
Y), or that reflect our best estimates of controllable measures to deterministically meet these targets (e.g., limit entrainment of species Z to no more than X individuals within a defined time frame). (These two above would be “outcome” and “driver” metrics in the language of performance measures).
3) To the maximum extent practical, make these indicators quantitative and specific.
Page C-3
4) To the maximum extent practical, factor uncertainty into these indicators (such that they are robust to environmental stochasticity—uncontrolled events), as well as educated guesses reflecting a realistic range of future management scenarios (anthropogenically-controlled actions).
5) The target indicator can incorporate a safety margin associated with the defined performance measure, reflecting
the degree of risk we are willing to accept, given the relative uncertainty we have with respect to the accuracy of our current indicator (i.e., is it really the minimum viable population?), our confidence in our measurement (i.e., is our monitoring and analysis adequate to instill confidence in our population estimate?), and our future expectations with respect to changes within the system (e.g., how will climate change, invasive species, or disease impact the species, and with what degree of predictability and magnitude?).
6) The working suite of models should be robust, peer-reviewed, and interlinked such that they define the state of the
art scientific consensus regarding the functioning of the ecosystem with sufficient detail to include all principal factors driving ecosystem processes (community and population dynamics), yet simplified and clarified enough to allow practical utility across disciplines (i.e., models that can be utilized by technically-trained professionals with familiarity of the ecosystem and ecological principles, not necessarily experts in each sub-discipline which the models cover). (This task is currently being completed by the AMPT for DRERIP).
7) The link to quantitative indicators from conceptual models requires quantitative (or semi-quantitative) models. (The
DRERIP conceptual models are the foundation for these, but would need to be further defined to meet this criterion.)
8) Design and implement a monitoring program to most specifically address these quantitative indicators (i.e., as
close to direct measurements of the indicator as possible), as defined by best available scientific knowledge. Included in this monitoring program is a rigid QA/QC protocol with standardization, calibration, reporting guidelines, etc. as appropriate to the indicators of concern. (This task should be a primary responsibility of CMARP III).
9) Identify research needs from information gaps illustrated by the working models. Within available resources,
prioritize those areas reflecting highest need (e.g., those reflecting suspected limiting factors with high magnitude of influence on our quantitative indicator). (This task has been earlier identified as a CMARP function, but may be better suited within the current AMPT).
10) Refine and update working models as research, monitoring, and assessment augment our working knowledge of
the ecosystem.
11) The link between conceptual understanding and adaptive management requires predictive models and ongoing reassessment, so that results running counter to prediction can be utilized to refine our conceptual understanding towards a more reliable reflection of reality.
12) Program performance will be evaluated on a regular (annual?) basis based on attainment of standards as
determined by measurement metrics. (It is our understanding that this review may be external to the implementing agencies. These metrics outlined within this framework would lend themselves to external review.)
13) In light of information gained through adaptive management, monitoring and assessment, performance measures
will continually be evaluated and refined.
Performance Measures within the ERP Framework Figure A contains a structural diagram outlining the framework under which ERP performance measures have been organized. The approach herein involves the organization of the performance measures framework on two basic principles. The first of these is that the outcome of interest from a management perspective is the populations of given component
Page C-4
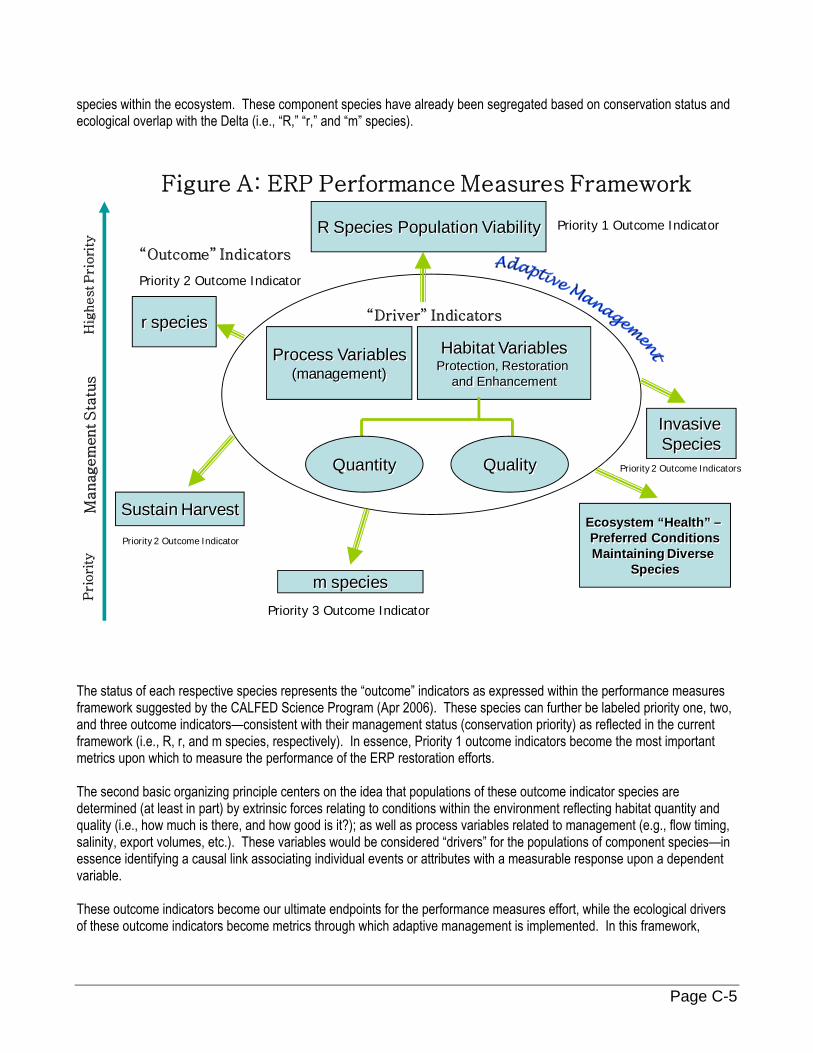
species within the ecosystem. These component species have already been segregated based on conservation status and ecological overlap with the Delta (i.e., “R,” “r,” and “m” species).
R Species Population Viability
Process Variables(management)
Habitat VariablesProtection, Restoration
and Enhancement
“Outcome” Indicators
Quantity Quality
“Driver” Indicators
Hig
hest P
riori
tyP
riori
ty
Sustain Harvest
Invasive Species
r species
m species
Managem
ent S
tatu
s
Figure A: ERP Performance Measures Framework
Ecosystem “Health” –Preferred ConditionsMaintaining Diverse
Species
Priority 1 Outcome Indicator
Priority 2 Outcome Indicator
Priority 3 Outcome Indicator
Priority 2 Outcome Indicators
Priority 2 Outcome Indicator
The status of each respective species represents the “outcome” indicators as expressed within the performance measures framework suggested by the CALFED Science Program (Apr 2006). These species can further be labeled priority one, two, and three outcome indicators—consistent with their management status (conservation priority) as reflected in the current framework (i.e., R, r, and m species, respectively). In essence, Priority 1 outcome indicators become the most important metrics upon which to measure the performance of the ERP restoration efforts. The second basic organizing principle centers on the idea that populations of these outcome indicator species are determined (at least in part) by extrinsic forces relating to conditions within the environment reflecting habitat quantity and quality (i.e., how much is there, and how good is it?); as well as process variables related to management (e.g., flow timing, salinity, export volumes, etc.). These variables would be considered “drivers” for the populations of component species—in essence identifying a causal link associating individual events or attributes with a measurable response upon a dependent variable. These outcome indicators become our ultimate endpoints for the performance measures effort, while the ecological drivers of these outcome indicators become metrics through which adaptive management is implemented. In this framework,
Page C-5
broader and more fundamental management objectives (or mandates) are encompassed within the ultimate outcome indicators. More specific (and numerous) management actions function more in the realm of driver indicators. Outcome indicators are generally the fundamental benchmarks whereby progress towards overall CALFED goals are assessed, whereas successful implementation (selection and accurate prediction) of driver indicators reflects the realm of actual adaptive management specifically aimed towards successful achievement of these ultimate outcomes. Appropriate indicators would be developed for both sets of variables, and Program performance can be evaluated at each level, in accordance with the importance of each metric relative to how tightly it is aligned with the appropriate outcome indicator(s), and the management significance of that particular outcome indicator. The approach connotes deterministic ecological relationships (consistent with the DLO—drivers, linkages, outcomes approach). In this sense, these performance measures can be considered hierarchically, such that achievement of the one (driver indicators that are the application of management and restoration actions designed to recover populations of desirable species) can be viewed as successful implementation of the adaptive management process (and therefore, successful Program performance). However, true success shall not be attained until the outcome indicators are satisfied (i.e., that all species are recovered). In the event that all driver indicators are successfully achieved while outcome indicators are not, we can therefore presume that scientific understanding rather than management implementation has been the limiting factor. But the success of CALFED itself ultimately lies with achieving recovery of the “R” species the program is specifically entrusted to recover. These performance measures should be recognized as integral to all Program Objectives. Prioritization of Performance Measures
The ERP performance measures have been prioritized as such:
“Outcome Indicators” are the endpoints of management concern:
Priority 1 Outcome Indicators are either Agency mandates, or highest priority objectives
o Recovery of populations of “R” species
Priority 2 Outcome Indicators reflecting Agency high priority objectives
o Contribute to recovery of populations of “r” species o Efforts at eradication, and prevention measures to avoid the introduction of new invasive exotic
fauna or flora into the Bay/Delta ecosystem o Desirable expressions of ecosystem state (e.g., maintaining desirable species, indices of diversity,
etc.) o Reduce or eliminate the impacts of environmental contaminants upon populations of Bay/Delta flora
and fauna
Priority 3 Outcome Indicators reflecting Agency priority objectives
o Have no discernable adverse effects to populations of “m” species o Maintain sustainable harvest levels for fish and game species
“Driver Indicators,” are the principal factors known or suspected to determine these outcomes
These include processes (e.g., water management) and habitat variables (e.g., habitat restoration, specific
pollution abatement/remediation).
Page C-6
Driver Indicators shall be assigned priority status and designated based on their associated Outcome
Indicator (i.e., Priority 1 indicator drivers, Priority 2 driver indicators, etc.).
Performance measures based upon driver indicators shall carry equal weight to Outcome Indicators, commensurate with the assigned management priority of their associated outcome indicator, and the magnitude of their influence upon that outcome of interest
o these include uncertainty (based on scientific understanding and/or inability to fully predict
outcomes), and o assessment and reiteration become significant technical tasks associated with these measures.
The specific strategy within this framework for the population sustainability objective is presented in Figure B, and would entail the following steps: For each outcome indicator (species)—in order of their respective management priority—the performance measure would be for the recovery and/or maintenance of a minimum viable population (as embodied within extant recovery plans, updated as needed). The Endangered Species Act of 1973 (as amended) defines endangered species as “any species which is in danger of extinction throughout all or a significant portion of its range.” This statute further directs the Secretary of the Interior to “give consideration to species which have been identified as in danger of extinction, or likely to become so in the foreseeable future, by any State agency or by any agency of a foreign nation that is responsible for the conservation of fish or wildlife or plants.”
Page C-7
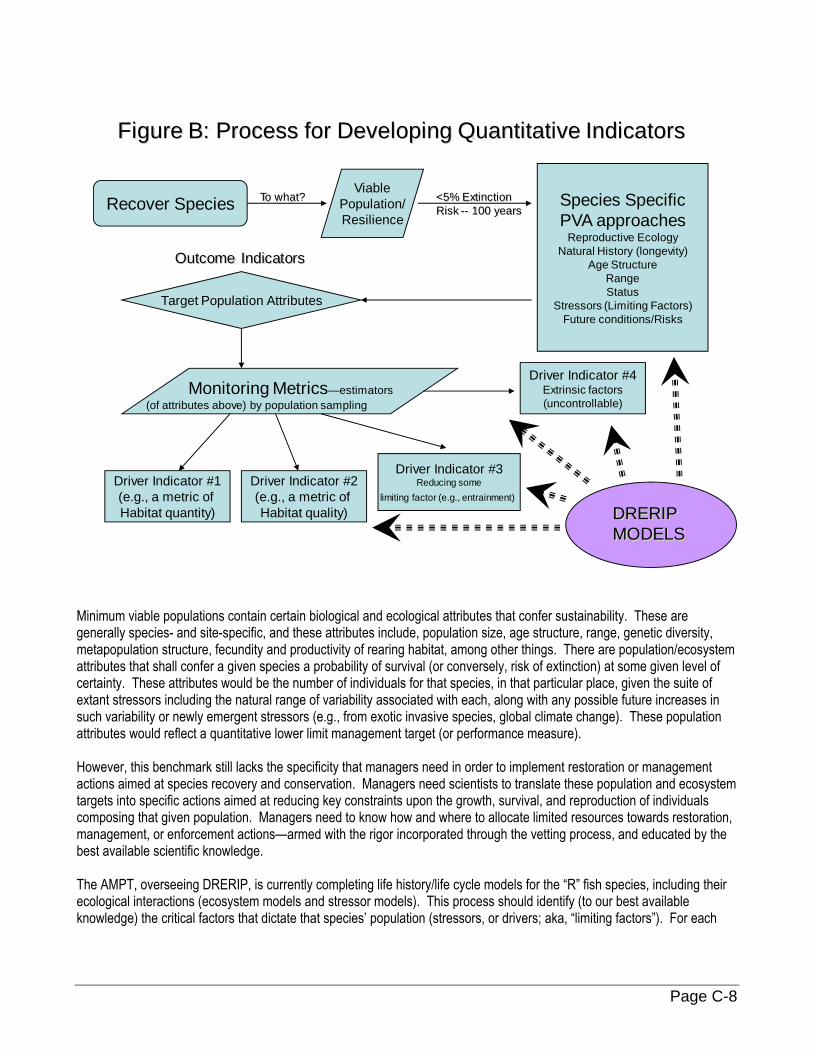
To what?Recover SpeciesViable
Population/Resilience
<5% Extinction Risk -- 100 years
Species SpecificPVA approaches
Reproductive EcologyNatural History (longevity)
Age StructureRangeStatus
Stressors (Limiting Factors)Future conditions/Risks
Target Population Attributes
Monitoring Metrics—estimators(of attributes above) by population sampling
Outcome Indicators
Driver Indicator #4Extrinsic factors(uncontrollable)
Driver Indicator #3Reducing some
limiting factor (e.g., entrainment)Driver Indicator #2(e.g., a metric of Habitat quality)
Driver Indicator #1(e.g., a metric of Habitat quantity) DRERIP
MODELS
Figure B: Process for Developing Quantitative Indicators
Minimum viable populations contain certain biological and ecological attributes that confer sustainability. These are generally species- and site-specific, and these attributes include, population size, age structure, range, genetic diversity, metapopulation structure, fecundity and productivity of rearing habitat, among other things. There are population/ecosystem attributes that shall confer a given species a probability of survival (or conversely, risk of extinction) at some given level of certainty. These attributes would be the number of individuals for that species, in that particular place, given the suite of extant stressors including the natural range of variability associated with each, along with any possible future increases in such variability or newly emergent stressors (e.g., from exotic invasive species, global climate change). These population attributes would reflect a quantitative lower limit management target (or performance measure). However, this benchmark still lacks the specificity that managers need in order to implement restoration or management actions aimed at species recovery and conservation. Managers need scientists to translate these population and ecosystem targets into specific actions aimed at reducing key constraints upon the growth, survival, and reproduction of individuals composing that given population. Managers need to know how and where to allocate limited resources towards restoration, management, or enforcement actions—armed with the rigor incorporated through the vetting process, and educated by the best available scientific knowledge. The AMPT, overseeing DRERIP, is currently completing life history/life cycle models for the “R” fish species, including their ecological interactions (ecosystem models and stressor models). This process should identify (to our best available knowledge) the critical factors that dictate that species’ population (stressors, or drivers; aka, “limiting factors”). For each
Page C-8
species, the key indicators of their population status would be defined, and the best metric(s) assigned as that specific outcome indicator. Funding permitting, the implementing agencies (by, or with assistance from, the IEP and under the direction of CMARP III) will monitor these population indicators, as well as the critical drivers. These data will be compared against predictive models to be refined and adapted as necessary (preferably from the basic conceptual models provided through the DRERIP process). Some key questions to answer within this process include (for each species):
1) What are the key stressors (drivers) dictating the demographically significant endpoints of reproduction and survival?
2) What is the relative or absolute weight of each parameter? 3) How do these interact? 4) Are we currently monitoring these variables, and if not, how do we best do so? 5) What is the relative certainty we can attach to each estimate within the quantitative model? Depending on the
weight of the driver, and the relative uncertainty associated, this should indicate a need for more research.
6) What kind of research/monitoring would resolve this uncertainty? 7) How much would it cost? 8) How does this species’ model interact with other related species (say, less endangered ones that may still be
useful sentinels or surrogates—e.g. longfin smelt related to delta smelt). A final issue for managers to address within this adaptive management approach is a decision regarding the allocation of funds towards monitoring/research (learning and interpretation) versus restoration (implementation). Given the reality of limited funding, a balance must be struck. It appears that in recent years, momentum has swung towards implementation at the cost of interpretation, and it is apparent that the adaptive management model is now hampered by lack of information and understanding about the dynamic processes of the system, or perhaps inadequate tracking and synthesis of critical information. This balance is always a delicate tradeoff. However, even the crudest of subjective measurements—in light of the current POD and the significant resources that have been allocated to CALFED objectives to date—makes it apparent there is much room for improvement with respect to the application of adaptive management by the implementing agencies in adherence to the CALFED Mission. Successful adaptive management ultimately entails the application of predictive models that define the key ecosystem attributes influencing species composition and abundance. To the extent that these models are quantitative, they shall be more utilitarian. To the extent that they are complete and accurate, they will be more useful in discriminating causal interactions. Scientists working on these models face the daunting task of reducing them to the significant variables to eliminate unnecessary complexity, integrating multivariate abiotic and biotic factors, and nesting the various models together; while simultaneously maintaining enough realism and detail that retains their utility as predictive and discriminative tools. The efforts of the AMPT (and/or the CMARP III) become central to the remaining critical elements within the adaptive management process, including: 1) the identification of data gaps and associated monitoring and research needs, 2) the formulation of testable hypotheses to which management and restoration actions may be evaluated for effectiveness, and 3) the derivation, validation and evolution of the models through successive iterations as our knowledge about the Bay/Delta ecosystem grows.
Page C-9
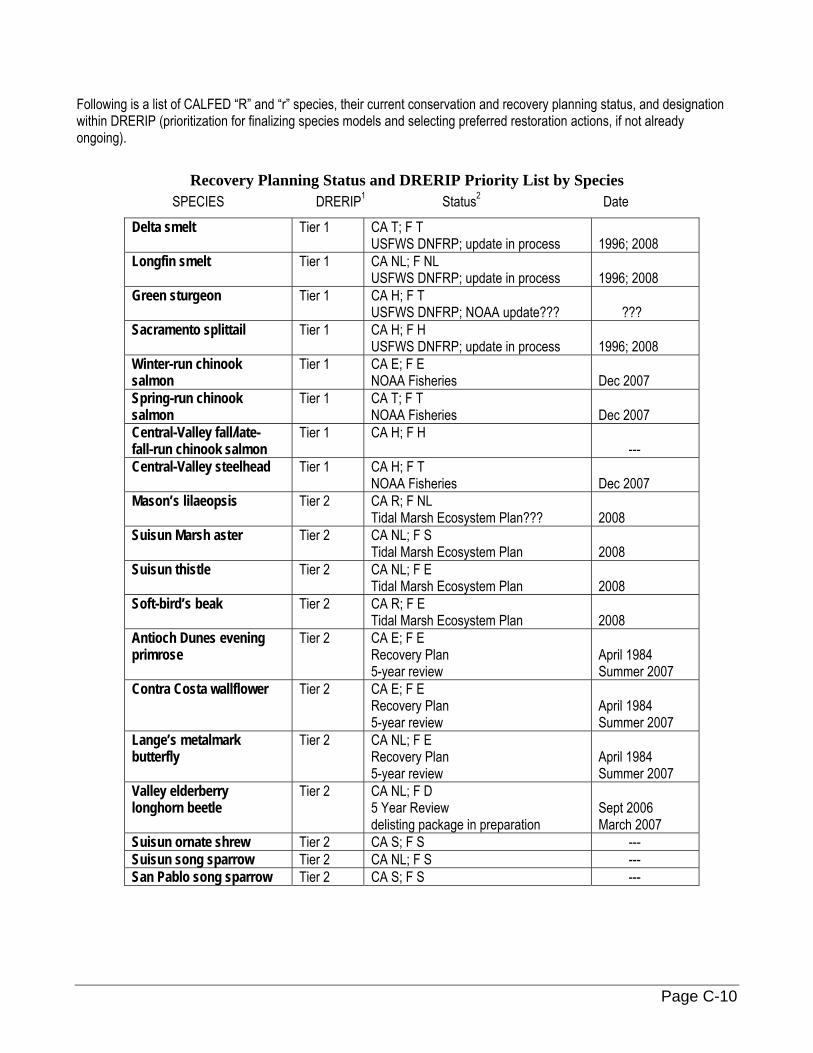
Following is a list of CALFED “R” and “r” species, their current conservation and recovery planning status, and designation within DRERIP (prioritization for finalizing species models and selecting preferred restoration actions, if not already ongoing).
Recovery Planning Status and DRERIP Priority List by Species
SPECIES DRERIP1 Status2 Date
Delta smelt Tier 1 CA T; F T USFWS DNFRP; update in process
1996; 2008
Longfin smelt Tier 1 CA NL; F NL USFWS DNFRP; update in process
1996; 2008
Green sturgeon Tier 1 CA H; F T USFWS DNFRP; NOAA update???
???
Sacramento splittail Tier 1 CA H; F H USFWS DNFRP; update in process
1996; 2008
Winter-run chinook salmon
Tier 1 CA E; F E NOAA Fisheries
Dec 2007
Spring-run chinook salmon
Tier 1 CA T; F T NOAA Fisheries
Dec 2007
Central-Valley fall/late- fall-run chinook salmon
Tier 1 CA H; F H ---
Central-Valley steelhead Tier 1 CA H; F T NOAA Fisheries
Dec 2007
Mason’s lilaeopsis Tier 2 CA R; F NL Tidal Marsh Ecosystem Plan???
2008
Suisun Marsh aster Tier 2 CA NL; F S Tidal Marsh Ecosystem Plan
2008
Suisun thistle Tier 2 CA NL; F E Tidal Marsh Ecosystem Plan
2008
Soft-bird’s beak Tier 2 CA R; F E Tidal Marsh Ecosystem Plan
2008
Antioch Dunes evening primrose
Tier 2 CA E; F E Recovery Plan 5-year review
April 1984 Summer 2007
Contra Costa wallflower Tier 2 CA E; F E Recovery Plan 5-year review
April 1984 Summer 2007
Lange’s metalmark butterfly
Tier 2 CA NL; F E Recovery Plan 5-year review
April 1984 Summer 2007
Valley elderberry longhorn beetle
Tier 2 CA NL; F D 5 Year Review delisting package in preparation
Sept 2006 March 2007
Suisun ornate shrew Tier 2 CA S; F S --- Suisun song sparrow Tier 2 CA NL; F S --- San Pablo song sparrow Tier 2 CA S; F S ---
Page C-10
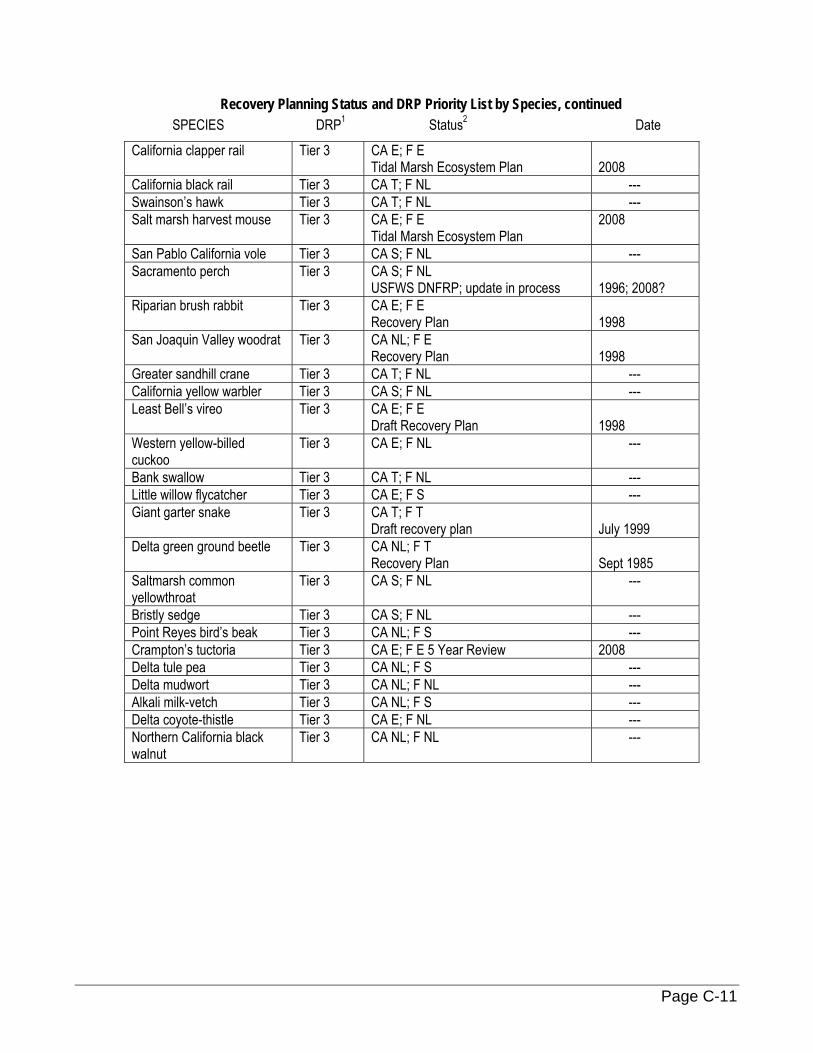
Recovery Planning Status and DRP Priority List by Species, continued SPECIES DRP1 Status2 Date
California clapper rail Tier 3 CA E; F E Tidal Marsh Ecosystem Plan
2008
California black rail Tier 3 CA T; F NL --- Swainson’s hawk Tier 3 CA T; F NL --- Salt marsh harvest mouse Tier 3 CA E; F E
Tidal Marsh Ecosystem Plan 2008
San Pablo California vole Tier 3 CA S; F NL --- Sacramento perch Tier 3 CA S; F NL
USFWS DNFRP; update in process 1996; 2008?
Riparian brush rabbit Tier 3 CA E; F E Recovery Plan
1998
San Joaquin Valley woodrat Tier 3 CA NL; F E Recovery Plan
1998
Greater sandhill crane Tier 3 CA T; F NL --- California yellow warbler Tier 3 CA S; F NL --- Least Bell’s vireo Tier 3 CA E; F E
Draft Recovery Plan 1998
Western yellow-billed cuckoo
Tier 3 CA E; F NL ---
Bank swallow Tier 3 CA T; F NL --- Little willow flycatcher Tier 3 CA E; F S --- Giant garter snake Tier 3 CA T; F T
Draft recovery plan July 1999
Delta green ground beetle Tier 3 CA NL; F T Recovery Plan
Sept 1985
Saltmarsh common yellowthroat
Tier 3 CA S; F NL ---
Bristly sedge Tier 3 CA S; F NL --- Point Reyes bird’s beak Tier 3 CA NL; F S --- Crampton’s tuctoria Tier 3 CA E; F E 5 Year Review 2008 Delta tule pea Tier 3 CA NL; F S --- Delta mudwort Tier 3 CA NL; F NL --- Alkali milk-vetch Tier 3 CA NL; F S --- Delta coyote-thistle Tier 3 CA E; F NL --- Northern California black walnut
Tier 3 CA NL; F NL ---
Page C-11