seismic analysis of lateral force resisting...
TRANSCRIPT

Vol-2 Issue-4 2016 IJARIIE-ISSN(O)-2395-4396
2873 www.ijariie.com 282
SEISMIC ANALYSIS OF LATERAL FORCE
RESISTING SYSTEM FOR TALL
BUILDINGS
Sucheta.Jagtap1, V.S.Shingade2
1 Student, M.E.-II,Civil Engg. Dept.Trinity College of Engineering & Research, Pune Maharashtra,India
2 HOD, Civil Engg. Dept.Trinity College of Engineering & Research, Pune Maharashtra,India
ABSTRACT
In recent years of construction, high rise buildings are widely increased due to highly increasing land cost and
scarcity of land in the metropolitan cities. High rise structures are sensitive to wind a nd earthquake forces.
Behavior of these structures can be controlled effectively by lateral force resisting systems, which increases stiffness
of building. Although at present computer technology allows for more precise analysis and design of different
structural systems for high rise buildings. The enhancement in the performance of the building is studied under
earthquake loads by installing lateral force resisting systems, like shear walls and bracing system. In the present
paper, shear wall and bracing systems were applied at various positions of the building. Modeling and analysis was
carried out using ETABS 9.7.2. From the observations it is seen that all the proposed arrangements provided
improve the structural performance of the building in controlling top story displacement, base shear and story drift.
Key words: lateral force resisting systems, shear walls, bracing.
1. INTRODUCTION
Amongst all the natural hazards, earthquakes cause the greatest damages. Since earthquake forces are random &
unpredictable, it is necessary to that our engineering tools needs to be used beneficially to analyze structures under
the action of earthquake forces. Earthquake loads are to be modeled carefully so as to assess the real behavior of
structure so that a clear understanding that the damage is expected but it should be minimized. In this context time
history and response spectra analysis which is an iterative procedure shall be looked upon as an alternative for the
orthodox analysis procedure. Population explosion has made high-rises the order of the day as it is only logical
solution and way of accommodating growing population within the boundaries of cities. It is needless to emphasis
that tall buildings are prone to larger movement and damages than low rise structures during earthquakes and as the
number of people Occupying in high rise building at any given time is far greater so also the risk of collateral
damage. Apart from ensuring structural safety during earthquakes high rise are giving engineer another cause o f
concern that is the wind induced vibrations that cause occupant discomfort should be mitigated. Excessive floor
displacements and accelerations which are caused by relatively frequent strong ground motions can render building
unserviceable for reasons for occupant discomfort. The effect is more pronounced in tall and slender buildings and
for buildings to qualify for serviceability. The dynamic response of structures to earthquakes needs to be reduced. In
general, the structural system of building is a complex three dimensional assemblage of various combinations of
interconnected structural elements. The primary function of structural system is to carry dynamic and static loads,
wind loads, external or internal explosion and impact loads. A variety of factors has to be considered in the process
of selecting most suitable structural system for high rise building. The selection is complicated process, and no
simple clear cut process available. The design team must use imagination, previous experiences, and re levant
literature to decide at the best solution in each particular case. Although present day engineering computer
Vol-2 Issue-4 2016 IJARIIE-ISSN(O)-2395-4396
2873 www.ijariie.com 283
technology allows for precision in analysis and design of different systems of high rise building, it does not provide
readily insight for choosing among alternative of these systems to arrive at the best overall design.
2. OBJECTIVE OF RESEARCH 1. To study the response of building for applied lateral force resisting systems.
2. Compare the results between the Lateral force resisting systems.
3. Comparing the Static and dynamic response quantities for different structural systems.
4. To decide most efficient and reliable lateral force resisting system for tall buildings.
3. LITERATURE REVIEW Jeffrey W. Berman, Michel Bruneau, Oguz C. Celik. (2005)
Braced frames and steel plate shear walls (SPSWs) both have been seen to be useful in the seismic retrofit of
buildings. While both these systems have merit, no guidance exists which could help the engineer to determine
which of the two approaches will be preferable in terms of providing the stiffness, maximum displacement, ductility,
the cumulative hysteretic energy dissipation, and energy dissipation per cycle for a given strength. As an attempt to
provide some quantitative data and an insight for this purpose, this paper describes and compares the results by the
cyclic testing of six frames of which four are concentrically braced frames, and two are light -gauge steel plate shear
walls. The large initial stiffness was seen to be provided by a braced frame specimen with a cold formed steel studs
and largest ductility was achieved with the steel plate shear wall with flat infill. After scaling the hysteretic results to
same design base shear, it is found that both energy dissipated per cycle and cumulative energy dissipation were
similar for the flat plate SPSW and the braced frames containing two tubular braces, till a ductility of four. After that
the tubular braces fractured while SPSW containing a flat infill reached to ductility of nine before the energy
dissipation per cycle decreased.
Kyoung Sun Moon .(2010)
Braced tubes are an efficient structural system for tall buildings and have been found continuously used for the
major tall buildings as since their emergence in late 1960s. This paper, presents a stiffness-based design
methodology for determining the preliminary member sizes of the braced tubes for tall buildings. The methodology
is applied to a set of buildings which ranges from 40 to 80 stories tall, and the parameters for the most economic
design in terms of material usage are been generated for the representative design loadings. The impact of different
geometric configurations of the structural members on economic design is also been discussed, and the
recommendations for the optimal geometries are made. The stiffness-based method, with a less iterative process, is
seen very efficient for the preliminary design of braced tube structures, and can contribute to constructing a built
environment using minimum amounts of the resources. Lateral load carrying capacity of braced frame within the
building's interior core is much smaller than that of the later-developed exterior braced tube on a building's
perimeter. The lateral stiffness of perimeter braced tubes can be enhanced by adding the latera l load resisting core
structures, like the steel braced cores or concrete shear cores. Studies show that typical braced cores contribute to
about 20% of total lateral rigidity in properly designed braced tube tall buildings.
R.Tremblay, M.H. Archmambault, A. Filiatrault (2003)
This paper describes an experimental study on the seismic performance of the concentrically braced steel frames
which are made with cold-formed rectangular tubular bracing members. A total of 24 quasistatic cyclic test was
performed on full size X bracing and the single diagonal bracing systems. Two loading sequences were considered
i.e the asymmetrical stepwise increasing deformation sequence and a displacement history record that was obtained
from the nonlinear dynamic analyses of typical braced steel frame. All the specimens buckled out of plane of the
frame and tests were interrupted when the fracture of braces occurred in the region having highest curvature. For X
bracing, results clearly show that the effective length of the braces can be used so as to determine their compression
strength and for characterizing their hysteretic response, which also includes the energy dissipation capability.
Simplified models are made to predict the out of plane deformation of the braces as function of ductility level. These
models are then used for developing an empirical expression so as to assess inelastic deformation capacity before the
fracture of bracing members made from the rectangular hollow sections. The brace slenderness ratio can be red uced
by adopting an X bracing configuration, it is shown that tension acting bracing can provide an efficient support at
Vol-2 Issue-4 2016 IJARIIE-ISSN(O)-2395-4396
2873 www.ijariie.com 284
the brace intersection point for compression bracing with k=0.5. Rectangular hallow section are seen very effective
in compression and their use in X bracing forms an efficient means of resisting lateral seismic load.
Prof. Bhosle Ashwini Tanaji, Prof. Shaikh A. N. (2015)
Concrete braced and steel braced reinforced concrete frame is one of the structural systems that is used to resist
earthquake loads in multistoried buildings. Many existing reinforced concrete buildings need to be retrofit to
overcome deficiencies to resist seismic loads. The use of concrete and steel bracing systems for strengthening the
seismically inadequate reinforced concrete frames is a suitable solution for enhancing earthquake resistance. The
Concrete and steel bracing is economical, easy to erect, occupies less space and has the flexibility to design for
meeting required strength and stiffness also. In this study, the seismic analysis of reinforced concrete (RC) buildings
with the different types of bracings (Diagonal, V type, Inverted V type, Combine V type, K type, X type) are
studied. The bracing is provided for the peripheral columns and the any two parallel sides of modeled building. A
thirteen-storey building is analyzed for seismic zone III according to IS 1893: 2002 using ETAB software. The
percentage of reduction in storey displacement is found out. It is seen that the X type of concrete bracing
significantly contributes towards structural stiffness and reduces the maximum storey drift of frames. The bracing
system improves not only the stiffness and the strength capacity but also the displacement capacity of the structure.
Shahzad Jamil Sardar and Umesh. N. Karadi (2013)
In this paper the study of 25 storied building in zone V is presented with some investigation that is analyzed by
changing the location of shear wall for determining parameters like storey drift, storey shear and displacement using
ETAB. Building models for both the linear static and the linear dynamic method are prepared for analysis and the
influence of concrete core wall which is provided at the center of the building. The seismic analysis of reinforced
concrete frame structure is done by both static and dynamic analysis to determine and compare the base shear. It has
been found that maximum base shear in the model-5 (i.e. When shear wall placed at the centre and four shear wall
are placed at outer edge parallel to X and Y direction) as compared to the other models. In equivalent static analysis
it is seen that the model-5 shows lesser displacement as compared to other models in longitudinal direction. In the
response spectrum analysis model-5 shows lesser displacement as compared to other models in longitudinal
direction. In the equivalent static analysis it has been found that model-5 shows lesser inter storey drift as compared
to other models in longitudinal direction. In response spectrum analysis model-5 shows lesser inter-storey drift as
compared to other models in longitudinal direction.
Alfa Rasikan , M G Rajendran (2013)
This paper presents the study and comparison of the difference between the wind behavior of buildings with and
without the shear wall using the Staad pro software. A 15 storey building and 20 storey building was analysed with
shear wall and without shear wall and the displacements of the buildings with shear wall and without shear wall
were compared. From the results it is seen that the displacement for a 15 storey building with shear wall was 20.18%
less than the 15 storey building without shear wall and the displacement for 20 storey building with shear wall was
14.6% less than that of the 20 storey building without shear wall. It is found that the building with she ar wall resists
wind load effectively.
Adithya. M , Swathi rani K , Shruthi H , Dr. Ramesh B.R (2015)
A three dimensional structure is taken with 4 horizontal bays of width 4m and 20 stories is taken with storey
height of 3m. The beams and columns are designed to withstand dead and live load only, wind load and Earthquake
loads are taken by the bracings. The bracings are provided only on the peripheral columns. Maximum 4 bracings are
used in a storey for economic purposes. In this study, an attempt is been made to study the effects of various types of
the bracing systems, its position in the building and cost of the bracing system with respect to minimum drift index
and the inter storey drift. The different parameters are compared for five models and it is found that as per
displacement criteria the bracings are good to reduce the displacement and the max reduction of 68.43% is been
observed in Single diagonal braces arranged as diamond shape in 3rd and 4th bay model compared to model without
brace. The bending moment and the shear force in columns are also reduced in braced models from which it can
found that these are less in the single diagonal braced model compare to other models.

Vol-2 Issue-4 2016 IJARIIE-ISSN(O)-2395-4396
2873 www.ijariie.com 285
P. P. Chandurkar , Dr. P. S. Pajgade (2013)
In seismic design of buildings, the reinforced concrete structural walls, or shear walls, act as a major earthquake
resisting members. Structural walls provide an efficient bracing system and offer great lateral load resistance. The
properties of these seismic shear walls dominate the response of the buildings, and it is therefore important to
evaluate the seismic response of the walls appropriately. In this study, the main focus is to determine solution for
shear wall location in multi-storey building. Effectiveness of shear wall has been studied by the help of four
different models. Model one is bare frame structural system and other three models are of dual type structural
system. An earthquake load is applied to a building of ten storied building located in the zone II, zone III, zone IV
and zone V. Parameters like Lateral displacement, story drift and total cost required for ground floor are calculated
in both cases replacing column with shear wall.
4. MODELLING AND ANALYSIS
4.1 Description of structure
The building considered for analysis is a G+15 story building designed using Indian codes IS 456-2000.
Material properties are assumed to be M20 and Fe 500.
Table 4.1 Loads on Structure
Loads on Structure
Live load on Roof and Floor 5kN/m2
Roof/Floor finish 1.5kN/m2
Slab Thickness 150mm thick
Beam size 230mm x 600mm
Column size 450mm x 600mm upto 6th
storey
Above 6th
storey 300mmx450mm
Bracing size 230mm x 230mm (X -bracing)
Story height 3m
Damping 5%
Table 4.2 Seismic parameters
Seismic Parameters(IS 1893)
Zone III
Soil Type II(Medium Soil)
Importance factor(I) 1
Building System Special Moment Resisting Frame(R=5) and Ordinary
Moment Resisting Frame(R=3)
Vol-2 Issue-4 2016 IJARIIE-ISSN(O)-2395-4396
2873 www.ijariie.com 286
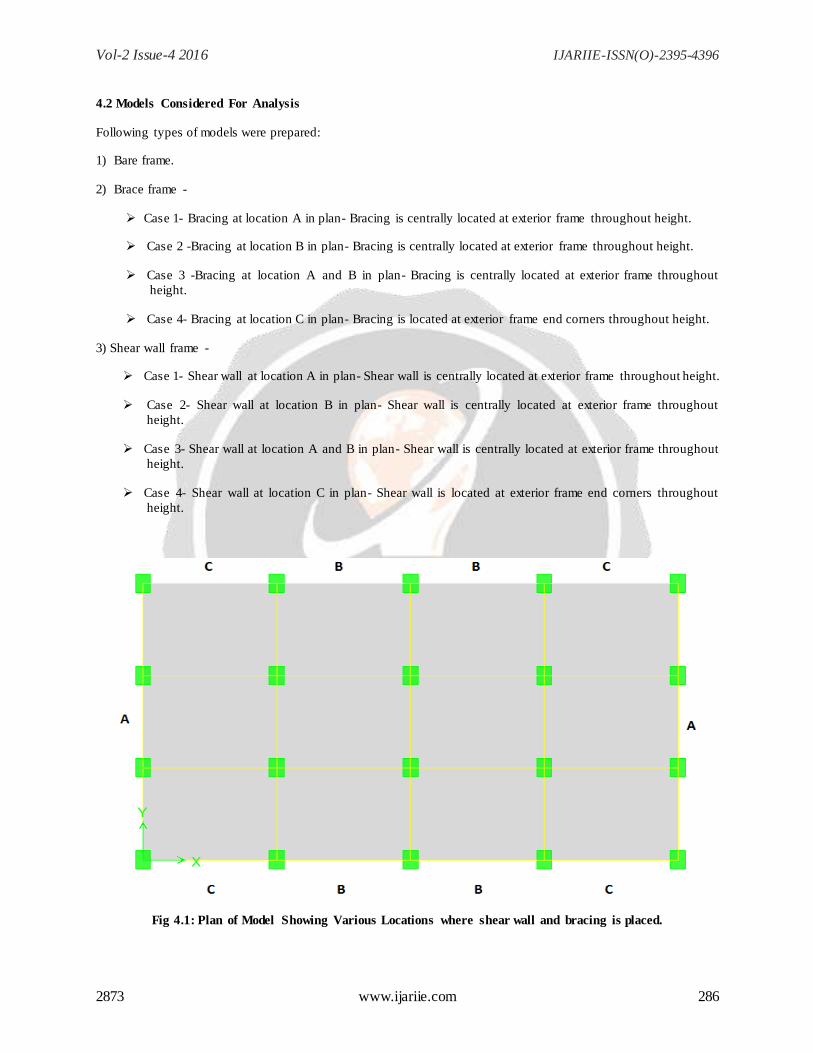
4.2 Models Considered For Analysis
Following types of models were prepared:
1) Bare frame.
2) Brace frame -
Case 1- Bracing at location A in plan- Bracing is centrally located at exterior frame throughout height.
Case 2 -Bracing at location B in plan- Bracing is centrally located at exterior frame throughout height.
Case 3 -Bracing at location A and B in plan- Bracing is centrally located at exterior frame throughout
height.
Case 4- Bracing at location C in plan- Bracing is located at exterior frame end corners throughout height.
3) Shear wall frame -
Case 1- Shear wall at location A in plan- Shear wall is centrally located at exterior frame throughout height.
Case 2- Shear wall at location B in plan- Shear wall is centrally located at exterior frame throughout
height.
Case 3- Shear wall at location A and B in plan- Shear wall is centrally located at exterior frame throughout
height.
Case 4- Shear wall at location C in plan- Shear wall is located at exterior frame end corners throughout
height.
Fig 4.1: Plan of Model Showing Various Locations where shear wall and bracing is placed.
Vol-2 Issue-4 2016 IJARIIE-ISSN(O)-2395-4396
2873 www.ijariie.com 287
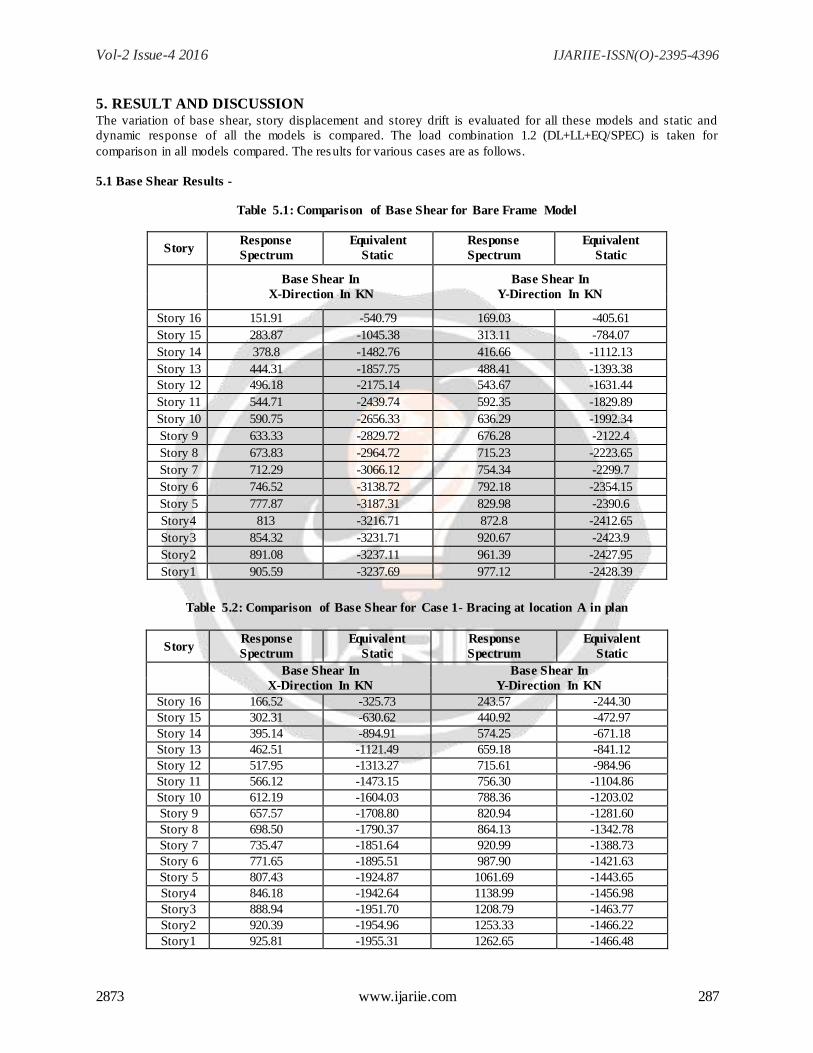
5. RESULT AND DISCUSSION The variation of base shear, story displacement and storey drift is evaluated for all these models and static and
dynamic response of all the models is compared. The load combination 1.2 (DL+LL+EQ/SPEC) is taken for
comparison in all models compared. The results for various cases are as follows.
5.1 Base Shear Results -
Table 5.1: Comparison of Base Shear for Bare Frame Model
Story Response
Spectrum
Equivalent
Static
Response
Spectrum
Equivalent
Static
Base Shear In
X-Direction In KN
Base Shear In
Y-Direction In KN
Story 16 151.91 -540.79 169.03 -405.61
Story 15 283.87 -1045.38 313.11 -784.07
Story 14 378.8 -1482.76 416.66 -1112.13
Story 13 444.31 -1857.75 488.41 -1393.38
Story 12 496.18 -2175.14 543.67 -1631.44
Story 11 544.71 -2439.74 592.35 -1829.89
Story 10 590.75 -2656.33 636.29 -1992.34
Story 9 633.33 -2829.72 676.28 -2122.4
Story 8 673.83 -2964.72 715.23 -2223.65
Story 7 712.29 -3066.12 754.34 -2299.7
Story 6 746.52 -3138.72 792.18 -2354.15
Story 5 777.87 -3187.31 829.98 -2390.6
Story4 813 -3216.71 872.8 -2412.65
Story3 854.32 -3231.71 920.67 -2423.9
Story2 891.08 -3237.11 961.39 -2427.95
Story1 905.59 -3237.69 977.12 -2428.39
Table 5.2: Comparison of Base Shear for Case 1- Bracing at location A in plan
Story Response
Spectrum
Equivalent
Static
Response
Spectrum
Equivalent
Static
Base Shear In
X-Direction In KN
Base Shear In
Y-Direction In KN
Story 16 166.52 -325.73 243.57 -244.30
Story 15 302.31 -630.62 440.92 -472.97
Story 14 395.14 -894.91 574.25 -671.18
Story 13 462.51 -1121.49 659.18 -841.12
Story 12 517.95 -1313.27 715.61 -984.96
Story 11 566.12 -1473.15 756.30 -1104.86
Story 10 612.19 -1604.03 788.36 -1203.02
Story 9 657.57 -1708.80 820.94 -1281.60
Story 8 698.50 -1790.37 864.13 -1342.78
Story 7 735.47 -1851.64 920.99 -1388.73
Story 6 771.65 -1895.51 987.90 -1421.63
Story 5 807.43 -1924.87 1061.69 -1443.65
Story4 846.18 -1942.64 1138.99 -1456.98
Story3 888.94 -1951.70 1208.79 -1463.77
Story2 920.39 -1954.96 1253.33 -1466.22
Story1 925.81 -1955.31 1262.65 -1466.48
Vol-2 Issue-4 2016 IJARIIE-ISSN(O)-2395-4396
2873 www.ijariie.com 288
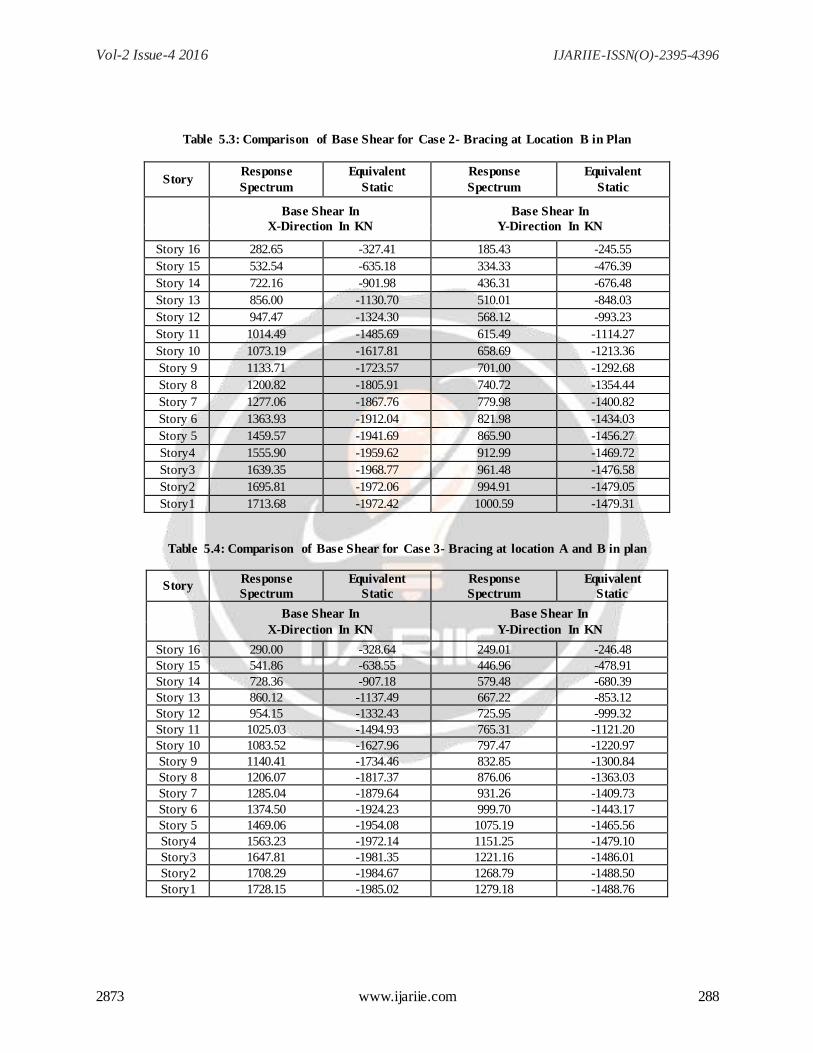
Table 5.3: Comparison of Base Shear for Case 2- Bracing at Location B in Plan
Story Response
Spectrum
Equivalent
Static
Response
Spectrum
Equivalent
Static
Base Shear In
X-Direction In KN
Base Shear In
Y-Direction In KN
Story 16 282.65 -327.41 185.43 -245.55
Story 15 532.54 -635.18 334.33 -476.39
Story 14 722.16 -901.98 436.31 -676.48
Story 13 856.00 -1130.70 510.01 -848.03
Story 12 947.47 -1324.30 568.12 -993.23
Story 11 1014.49 -1485.69 615.49 -1114.27
Story 10 1073.19 -1617.81 658.69 -1213.36
Story 9 1133.71 -1723.57 701.00 -1292.68
Story 8 1200.82 -1805.91 740.72 -1354.44
Story 7 1277.06 -1867.76 779.98 -1400.82
Story 6 1363.93 -1912.04 821.98 -1434.03
Story 5 1459.57 -1941.69 865.90 -1456.27
Story4 1555.90 -1959.62 912.99 -1469.72
Story3 1639.35 -1968.77 961.48 -1476.58
Story2 1695.81 -1972.06 994.91 -1479.05
Story1 1713.68 -1972.42 1000.59 -1479.31
Table 5.4: Comparison of Base Shear for Case 3- Bracing at location A and B in plan
Story Response
Spectrum
Equivalent
Static
Response
Spectrum
Equivalent
Static
Base Shear In
X-Direction In KN
Base Shear In
Y-Direction In KN
Story 16 290.00 -328.64 249.01 -246.48
Story 15 541.86 -638.55 446.96 -478.91
Story 14 728.36 -907.18 579.48 -680.39
Story 13 860.12 -1137.49 667.22 -853.12
Story 12 954.15 -1332.43 725.95 -999.32
Story 11 1025.03 -1494.93 765.31 -1121.20
Story 10 1083.52 -1627.96 797.47 -1220.97
Story 9 1140.41 -1734.46 832.85 -1300.84
Story 8 1206.07 -1817.37 876.06 -1363.03
Story 7 1285.04 -1879.64 931.26 -1409.73
Story 6 1374.50 -1924.23 999.70 -1443.17
Story 5 1469.06 -1954.08 1075.19 -1465.56
Story4 1563.23 -1972.14 1151.25 -1479.10
Story3 1647.81 -1981.35 1221.16 -1486.01
Story2 1708.29 -1984.67 1268.79 -1488.50
Story1 1728.15 -1985.02 1279.18 -1488.76
Vol-2 Issue-4 2016 IJARIIE-ISSN(O)-2395-4396
2873 www.ijariie.com 289
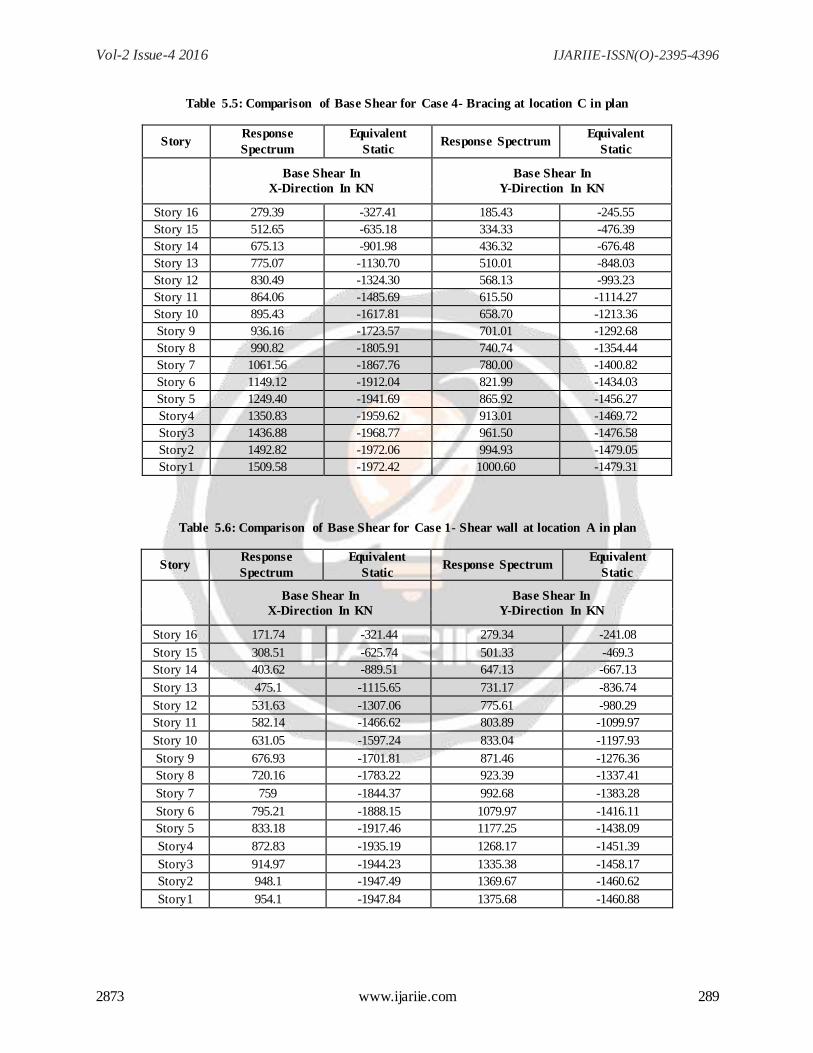
Table 5.5: Comparison of Base Shear for Case 4- Bracing at location C in plan
Story Response
Spectrum
Equivalent
Static Response Spectrum
Equivalent
Static
Base Shear In
X-Direction In KN
Base Shear In
Y-Direction In KN
Story 16 279.39 -327.41 185.43 -245.55
Story 15 512.65 -635.18 334.33 -476.39
Story 14 675.13 -901.98 436.32 -676.48
Story 13 775.07 -1130.70 510.01 -848.03
Story 12 830.49 -1324.30 568.13 -993.23
Story 11 864.06 -1485.69 615.50 -1114.27
Story 10 895.43 -1617.81 658.70 -1213.36
Story 9 936.16 -1723.57 701.01 -1292.68
Story 8 990.82 -1805.91 740.74 -1354.44
Story 7 1061.56 -1867.76 780.00 -1400.82
Story 6 1149.12 -1912.04 821.99 -1434.03
Story 5 1249.40 -1941.69 865.92 -1456.27
Story4 1350.83 -1959.62 913.01 -1469.72
Story3 1436.88 -1968.77 961.50 -1476.58
Story2 1492.82 -1972.06 994.93 -1479.05
Story1 1509.58 -1972.42 1000.60 -1479.31
Table 5.6: Comparison of Base Shear for Case 1- Shear wall at location A in plan
Story Response
Spectrum
Equivalent
Static Response Spectrum
Equivalent
Static
Base Shear In
X-Direction In KN
Base Shear In
Y-Direction In KN
Story 16 171.74 -321.44 279.34 -241.08
Story 15 308.51 -625.74 501.33 -469.3
Story 14 403.62 -889.51 647.13 -667.13
Story 13 475.1 -1115.65 731.17 -836.74
Story 12 531.63 -1307.06 775.61 -980.29
Story 11 582.14 -1466.62 803.89 -1099.97
Story 10 631.05 -1597.24 833.04 -1197.93
Story 9 676.93 -1701.81 871.46 -1276.36
Story 8 720.16 -1783.22 923.39 -1337.41
Story 7 759 -1844.37 992.68 -1383.28
Story 6 795.21 -1888.15 1079.97 -1416.11
Story 5 833.18 -1917.46 1177.25 -1438.09
Story4 872.83 -1935.19 1268.17 -1451.39
Story3 914.97 -1944.23 1335.38 -1458.17
Story2 948.1 -1947.49 1369.67 -1460.62
Story1 954.1 -1947.84 1375.68 -1460.88
Vol-2 Issue-4 2016 IJARIIE-ISSN(O)-2395-4396
2873 www.ijariie.com 290
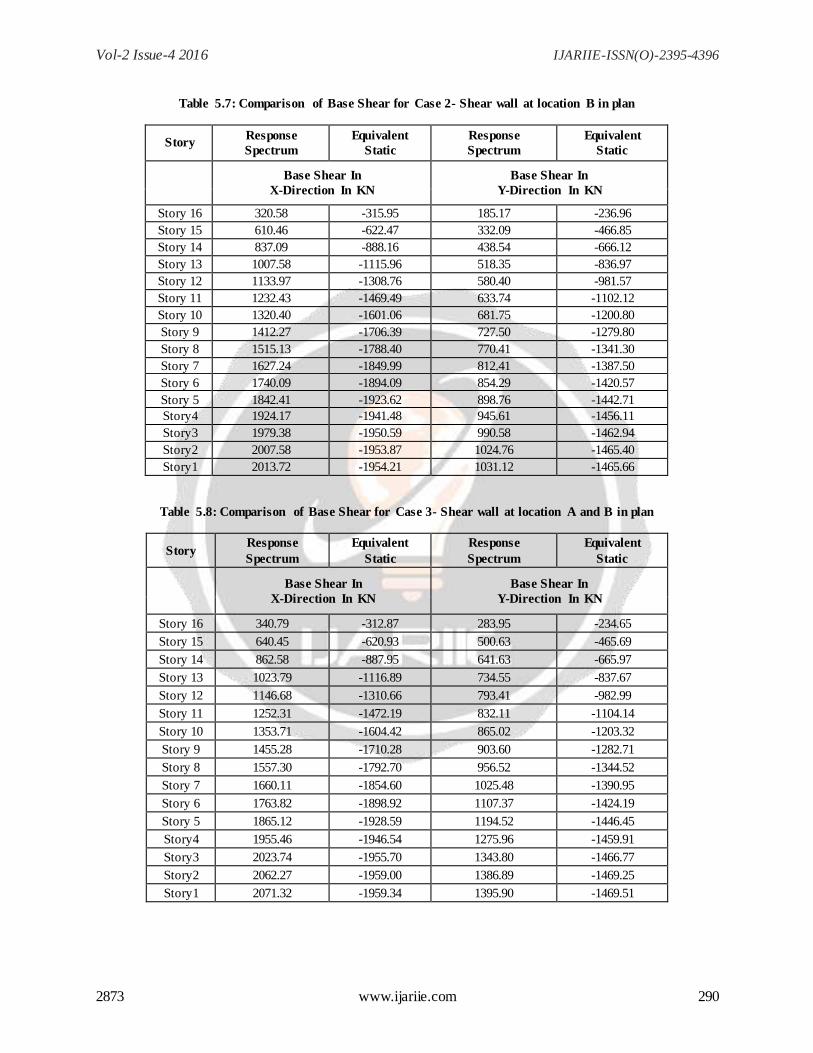
Table 5.7: Comparison of Base Shear for Case 2- Shear wall at location B in plan
Story Response
Spectrum
Equivalent
Static
Response
Spectrum
Equivalent
Static
Base Shear In
X-Direction In KN
Base Shear In
Y-Direction In KN
Story 16 320.58 -315.95 185.17 -236.96
Story 15 610.46 -622.47 332.09 -466.85
Story 14 837.09 -888.16 438.54 -666.12
Story 13 1007.58 -1115.96 518.35 -836.97
Story 12 1133.97 -1308.76 580.40 -981.57
Story 11 1232.43 -1469.49 633.74 -1102.12
Story 10 1320.40 -1601.06 681.75 -1200.80
Story 9 1412.27 -1706.39 727.50 -1279.80
Story 8 1515.13 -1788.40 770.41 -1341.30
Story 7 1627.24 -1849.99 812.41 -1387.50
Story 6 1740.09 -1894.09 854.29 -1420.57
Story 5 1842.41 -1923.62 898.76 -1442.71
Story4 1924.17 -1941.48 945.61 -1456.11
Story3 1979.38 -1950.59 990.58 -1462.94
Story2 2007.58 -1953.87 1024.76 -1465.40
Story1 2013.72 -1954.21 1031.12 -1465.66
Table 5.8: Comparison of Base Shear for Case 3- Shear wall at location A and B in plan
Story Response
Spectrum
Equivalent
Static
Response
Spectrum
Equivalent
Static
Base Shear In
X-Direction In KN
Base Shear In
Y-Direction In KN
Story 16 340.79 -312.87 283.95 -234.65
Story 15 640.45 -620.93 500.63 -465.69
Story 14 862.58 -887.95 641.63 -665.97
Story 13 1023.79 -1116.89 734.55 -837.67
Story 12 1146.68 -1310.66 793.41 -982.99
Story 11 1252.31 -1472.19 832.11 -1104.14
Story 10 1353.71 -1604.42 865.02 -1203.32
Story 9 1455.28 -1710.28 903.60 -1282.71
Story 8 1557.30 -1792.70 956.52 -1344.52
Story 7 1660.11 -1854.60 1025.48 -1390.95
Story 6 1763.82 -1898.92 1107.37 -1424.19
Story 5 1865.12 -1928.59 1194.52 -1446.45
Story4 1955.46 -1946.54 1275.96 -1459.91
Story3 2023.74 -1955.70 1343.80 -1466.77
Story2 2062.27 -1959.00 1386.89 -1469.25
Story1 2071.32 -1959.34 1395.90 -1469.51
Vol-2 Issue-4 2016 IJARIIE-ISSN(O)-2395-4396
2873 www.ijariie.com 291
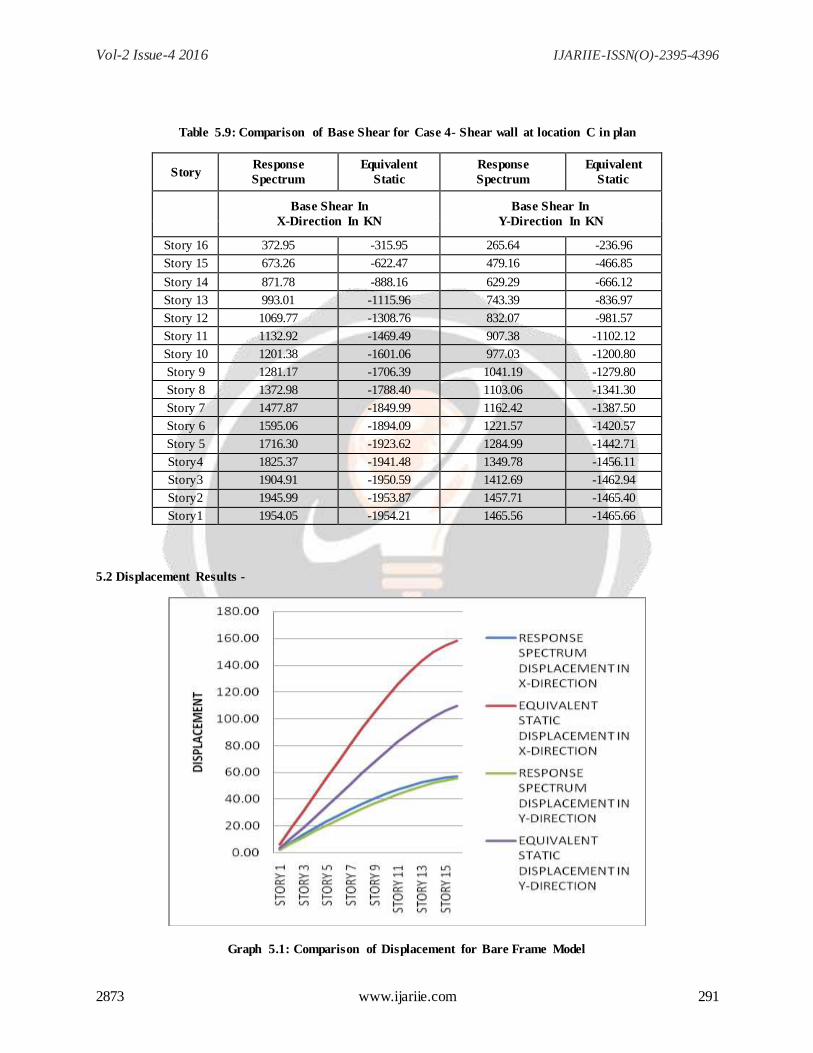
Table 5.9: Comparison of Base Shear for Case 4- Shear wall at location C in plan
Story Response
Spectrum
Equivalent
Static
Response
Spectrum
Equivalent
Static
Base Shear In
X-Direction In KN
Base Shear In
Y-Direction In KN
Story 16 372.95 -315.95 265.64 -236.96
Story 15 673.26 -622.47 479.16 -466.85
Story 14 871.78 -888.16 629.29 -666.12
Story 13 993.01 -1115.96 743.39 -836.97
Story 12 1069.77 -1308.76 832.07 -981.57
Story 11 1132.92 -1469.49 907.38 -1102.12
Story 10 1201.38 -1601.06 977.03 -1200.80
Story 9 1281.17 -1706.39 1041.19 -1279.80
Story 8 1372.98 -1788.40 1103.06 -1341.30
Story 7 1477.87 -1849.99 1162.42 -1387.50
Story 6 1595.06 -1894.09 1221.57 -1420.57
Story 5 1716.30 -1923.62 1284.99 -1442.71
Story4 1825.37 -1941.48 1349.78 -1456.11
Story3 1904.91 -1950.59 1412.69 -1462.94
Story2 1945.99 -1953.87 1457.71 -1465.40
Story1 1954.05 -1954.21 1465.56 -1465.66
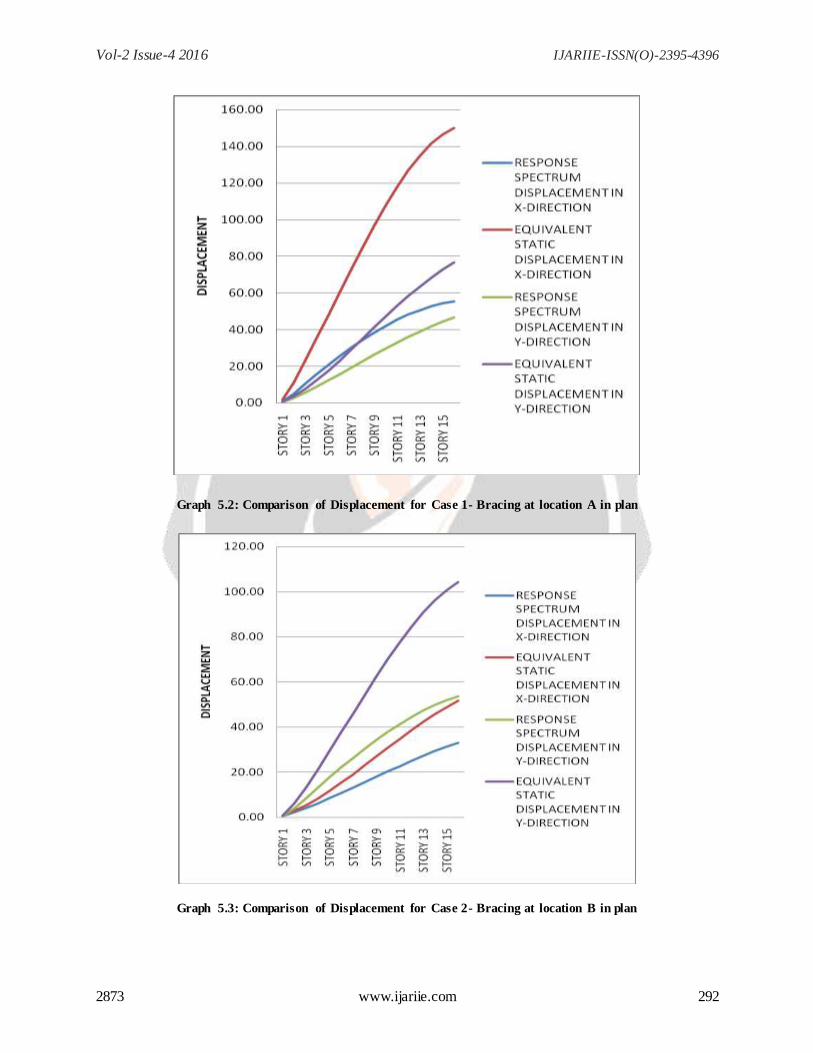
5.2 Displacement Results -
Graph 5.1: Comparison of Displacement for Bare Frame Model
Vol-2 Issue-4 2016 IJARIIE-ISSN(O)-2395-4396
2873 www.ijariie.com 292
Graph 5.2: Comparison of Displacement for Case 1- Bracing at location A in plan
Graph 5.3: Comparison of Displacement for Case 2- Bracing at location B in plan
Vol-2 Issue-4 2016 IJARIIE-ISSN(O)-2395-4396
2873 www.ijariie.com 293
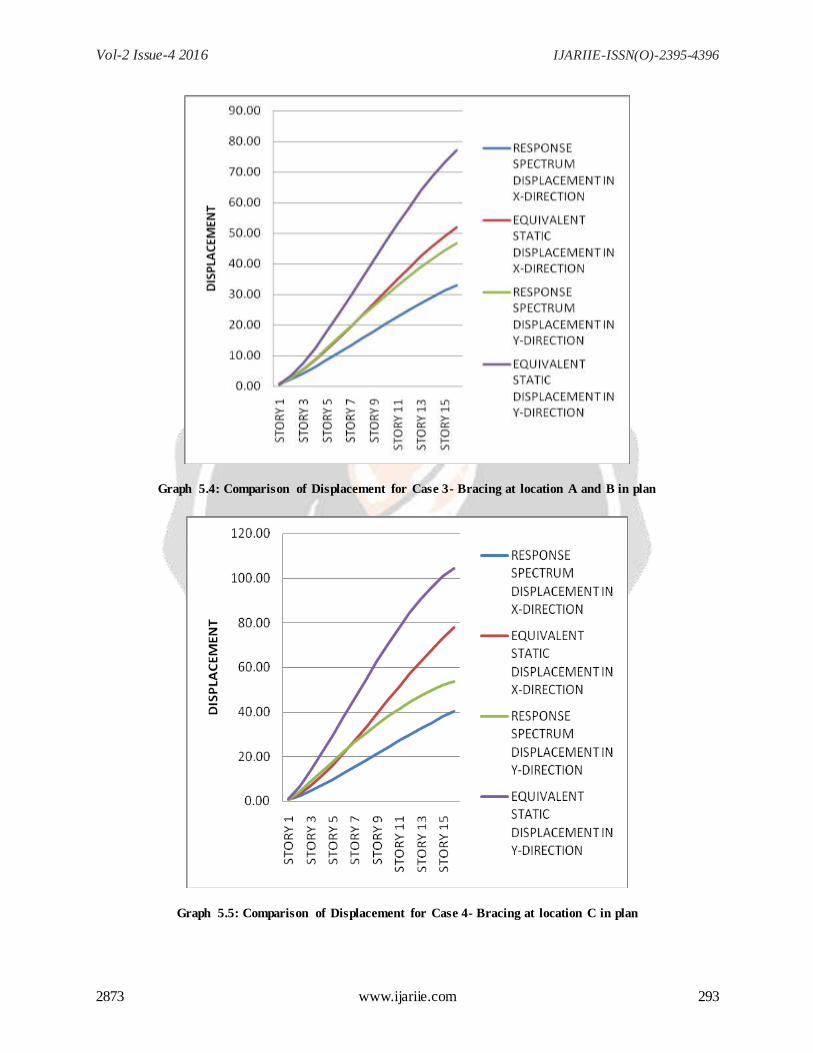
Graph 5.4: Comparison of Displacement for Case 3- Bracing at location A and B in plan
Graph 5.5: Comparison of Displacement for Case 4- Bracing at location C in plan
Vol-2 Issue-4 2016 IJARIIE-ISSN(O)-2395-4396
2873 www.ijariie.com 294
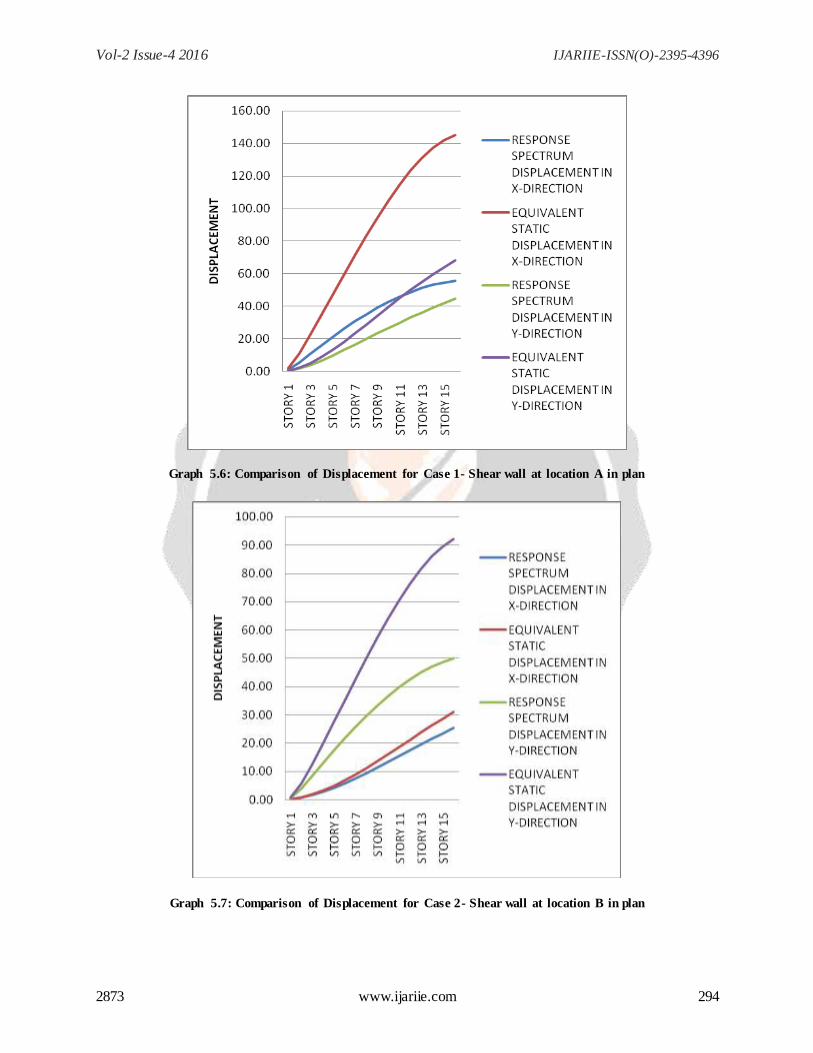
Graph 5.6: Comparison of Displacement for Case 1- Shear wall at location A in plan
Graph 5.7: Comparison of Displacement for Case 2- Shear wall at location B in plan
Vol-2 Issue-4 2016 IJARIIE-ISSN(O)-2395-4396
2873 www.ijariie.com 295
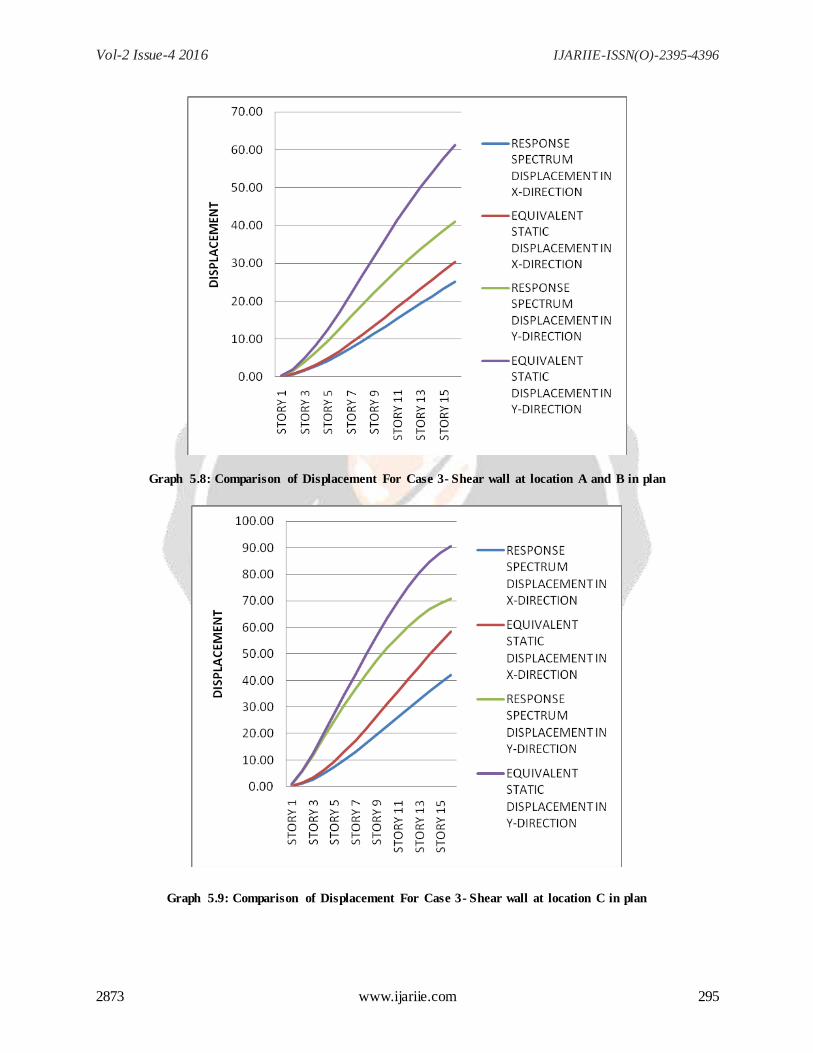
Graph 5.8: Comparison of Displacement For Case 3- Shear wall at location A and B in plan
Graph 5.9: Comparison of Displacement For Case 3- Shear wall at location C in plan

Vol-2 Issue-4 2016 IJARIIE-ISSN(O)-2395-4396
2873 www.ijariie.com 296
5.3 Storey Drift Results –
Graph 5.10: Comparison of Drift for Bare Frame Model
Graph 5.11: Comparison of Drift for Case 1- Bracing at location A in plan
Vol-2 Issue-4 2016 IJARIIE-ISSN(O)-2395-4396
2873 www.ijariie.com 297
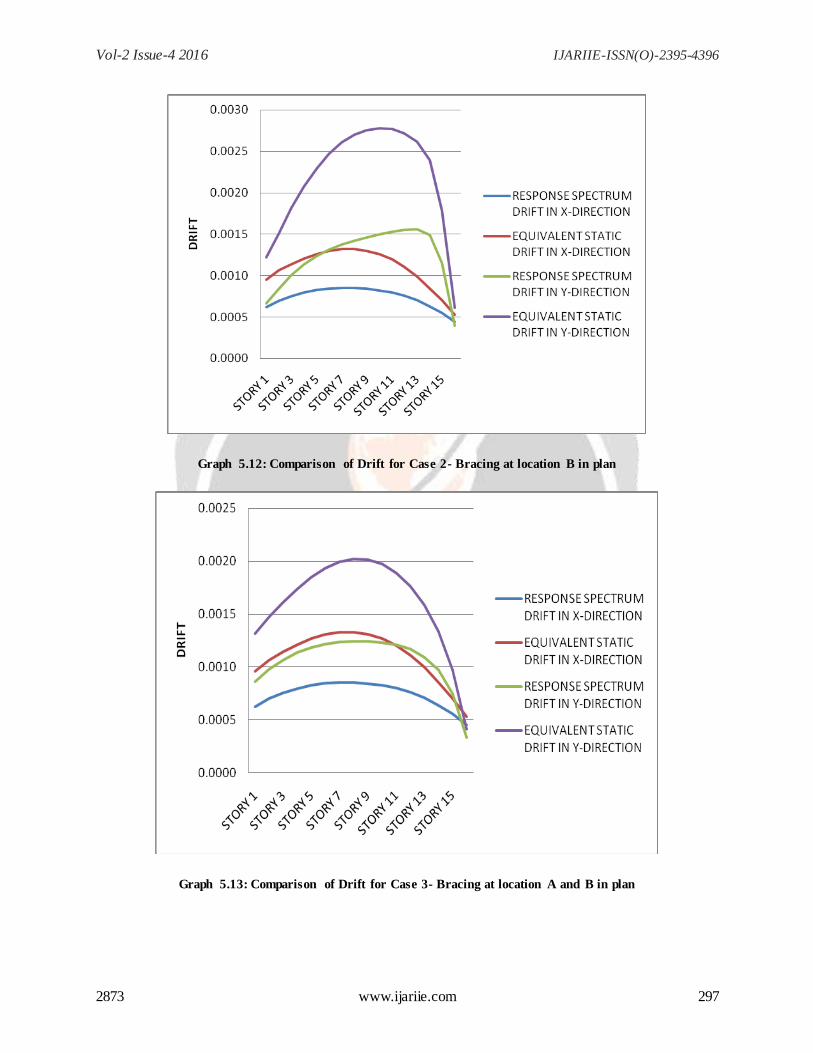
Graph 5.12: Comparison of Drift for Case 2- Bracing at location B in plan
Graph 5.13: Comparison of Drift for Case 3- Bracing at location A and B in plan
Vol-2 Issue-4 2016 IJARIIE-ISSN(O)-2395-4396
2873 www.ijariie.com 298
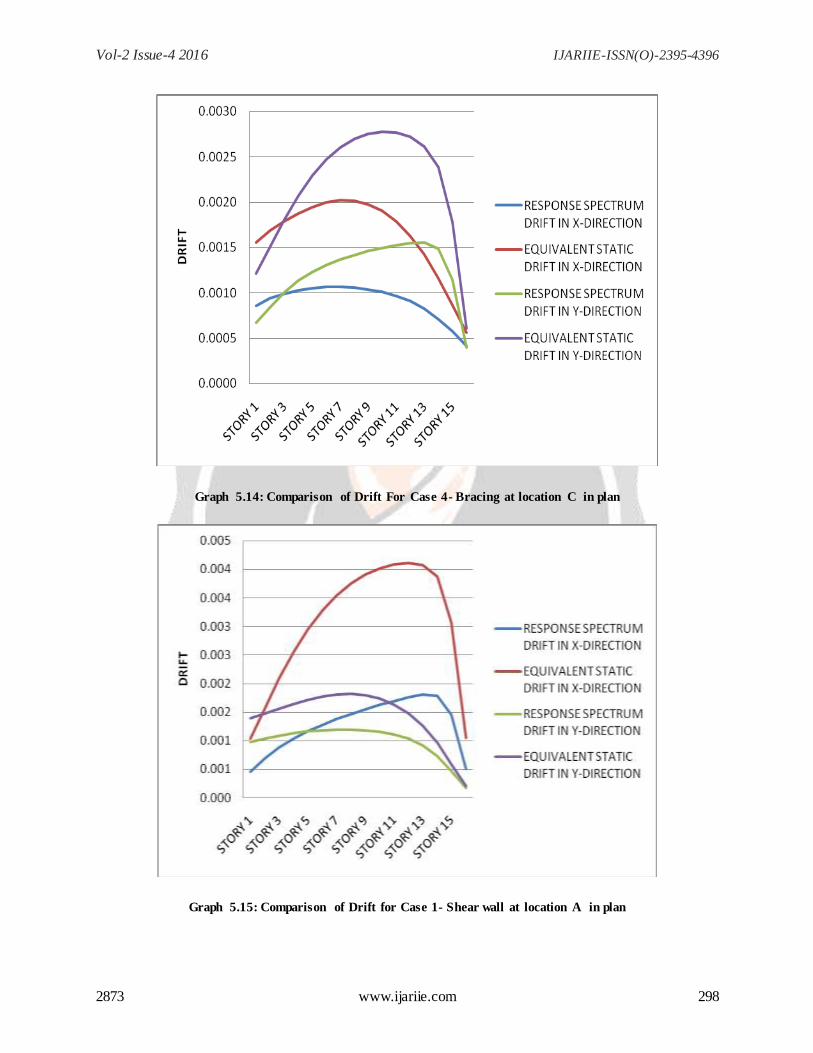
Graph 5.14: Comparison of Drift For Case 4- Bracing at location C in plan
Graph 5.15: Comparison of Drift for Case 1- Shear wall at location A in plan
Vol-2 Issue-4 2016 IJARIIE-ISSN(O)-2395-4396
2873 www.ijariie.com 299
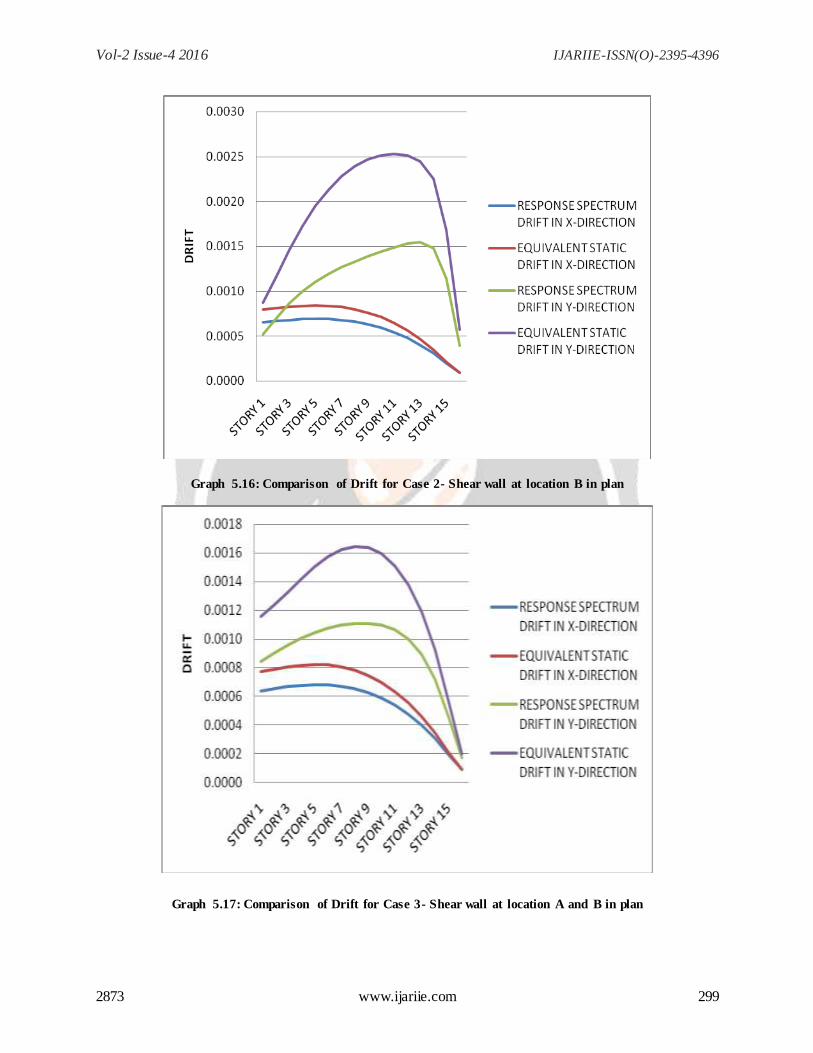
Graph 5.16: Comparison of Drift for Case 2- Shear wall at location B in plan
Graph 5.17: Comparison of Drift for Case 3- Shear wall at location A and B in plan
Vol-2 Issue-4 2016 IJARIIE-ISSN(O)-2395-4396
2873 www.ijariie.com 300
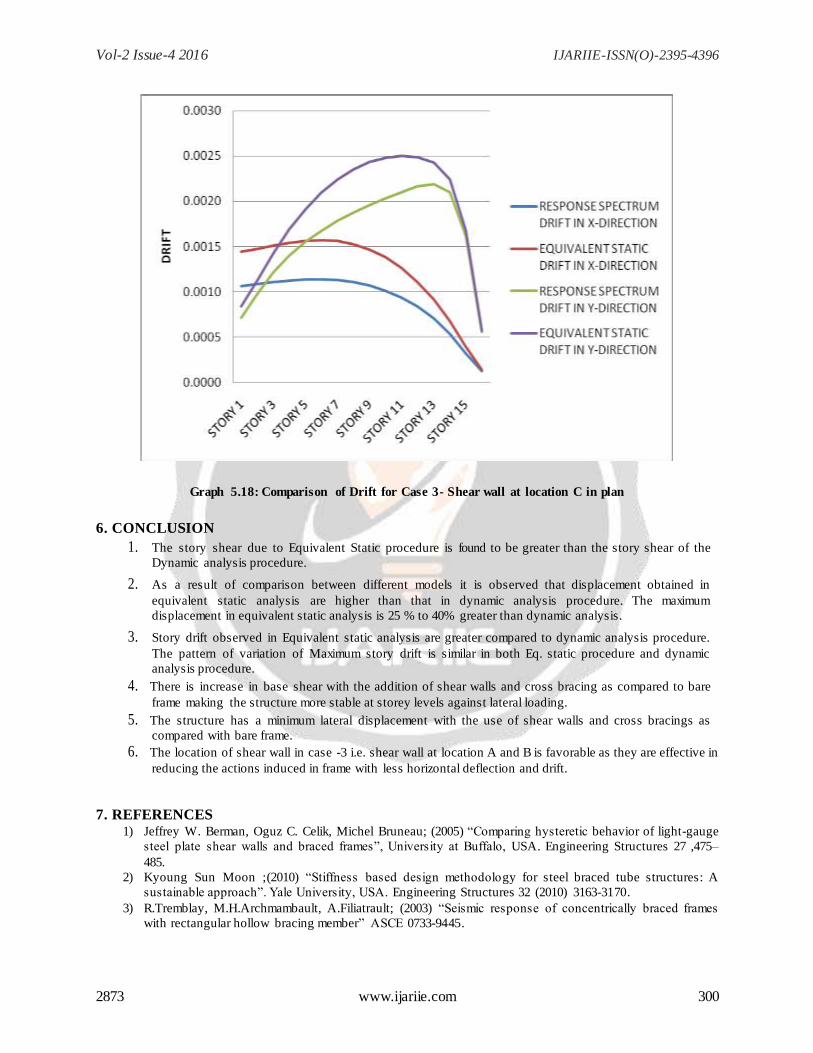
Graph 5.18: Comparison of Drift for Case 3- Shear wall at location C in plan
6. CONCLUSION
1. The story shear due to Equivalent Static procedure is found to be greater than the story shear of the
Dynamic analysis procedure.
2. As a result of comparison between different models it is observed that displacement obtained in
equivalent static analysis are higher than that in dynamic analysis procedure. The maximum
displacement in equivalent static analysis is 25 % to 40% greater than dynamic analysis.
3. Story drift observed in Equivalent static analysis are greater compared to dynamic analysis procedure.
The pattern of variation of Maximum story drift is similar in both Eq. static procedure and dynamic
analysis procedure.
4. There is increase in base shear with the addition of shear walls and cross bracing as compared to bare
frame making the structure more stable at storey levels against lateral loading.
5. The structure has a minimum lateral displacement with the use of shear walls and cross bracings as
compared with bare frame.
6. The location of shear wall in case -3 i.e. shear wall at location A and B is favorable as they are effective in
reducing the actions induced in frame with less horizontal deflection and drift.
7. REFERENCES 1) Jeffrey W. Berman, Oguz C. Celik, Michel Bruneau; (2005) “Comparing hysteretic behavior of light-gauge
steel plate shear walls and braced frames”, University at Buffalo, USA. Engineering Structures 27 ,475–
485.
2) Kyoung Sun Moon ;(2010) “Stiffness based design methodology for steel braced tube structures: A
sustainable approach”. Yale University, USA. Engineering Structures 32 (2010) 3163-3170.
3) R.Tremblay, M.H.Archmambault, A.Filiatrault; (2003) “Seismic response of concentrically braced frames
with rectangular hollow bracing member” ASCE 0733-9445.
Vol-2 Issue-4 2016 IJARIIE-ISSN(O)-2395-4396
2873 www.ijariie.com 301
4) Kyoung Sun Moon (2011); “Sustainable structural systems and configurations for tall building”, Yale
University, USA. ASCE.
5) Adithya. M, Swathi rani K.S, Shruthi H K, Dr. Ramesh B.R; (2015) “Study On Effective Bracing Systems
for High Rise Steel Structures” (SSRG-IJCE)- volume 2, Issue 2.
6) Shahzad Jamil Sardar and Umesh. N. Karadi; (2013)“Effect of Change In Shear Wall Location On Storey
Drift Of Multistorey Building Subjected To Lateral Loads” International Journal of Innovative Research in
Science Vol. 2, Issue 9 ISSN: 2319-8753.
7) P. P. Chandurkar, Dr. P. S. Pajgade; (2013) “Seismic Analysis of RCC Building with and Without Shear
Wall”, International Journal of Modern Engineering Research (IJMER) Vol. 3, Issue. 3, pp-1805-1810
8) Prof.Bhosle Ashwini Tanaji, Prof. Shaikh A. N (2015); “Analysis of Reinforced Concrete Building with
Different Arrangement of Concrete and Steel Bracing system” (IOSR-JMCE) PP 08-12.
9) Pankaj Agrawal, Manish Shrikhande, „Earthquake Resistant Design of Structures‟, Prentice Hall India
Publication.
10) IS 456:2000; “Plain and Reinforced Concrete Code of Practice” Forth revision.
11) IS 1893:2002 (Part 1); “Criteria for Earthquake Resistant Design of Structures ”