segmentation of smallholder households: meeting the range ... · miller and jones (2010) is an...
TRANSCRIPT
No. 85April 2013
Robert Peck Christen and Jamie Anderson
Segmentation of Smallholder Households: Meeting the Range of Financial Needs in Agricultural Families
There are an estimated 500 million smallholder
farmers in low- and middle-income countries.
And, despite some improvement in their access to
general financial services, relatively little progress
has been made in financial services specific to their
agricultural activities.1 Rural households and their
demand for financial services have not been well
understood, and the risk of extending them credit
seems higher, due in part to the inherent risks of
agriculture, the axis on which much of the rural
economy turns. The relatively low population density
of rural areas and the small size of most transactions
have also made it very difficult to capture savings,
channel remittances, build money transfer systems,
and offer individual microinsurance products.
Expanding the access of poor households to general
financial services has already proven difficult. Meeting
their additional needs for financial services related to
agriculture seems even more daunting.
But opportunities in agricultural finance do exist,
as demonstrated by positive experiences across a
range of delivery channels, products, and financial
service providers. Simple yet powerful innovations
in the use of mobile phones, for example, are
aggregating farmers and driving down transaction
costs to levels that could pave the way for financial
products and applications that had been previously
unprofitable. Savings products have been modified
to allow users to accumulate toward specific
household goals in practical ways that fit with their
cash flows and future spending needs. Financial
service providers have learned a great deal about
how to manage microloans to poor families and get
them repaid—profitably. Private-sector agricultural
businesses have also been steadily expanding
their role in financial services, embedding access
to credit in the production chain within a bundle
of other goods and services (e.g., seeds, inputs,
weather information, insurance) to secure steady
supplies of raw materials and higher-value crops.
This paper examines the challenge of providing
financial services that support the multiple goals of
rural households, including those related to their
more universal, general household needs and those
linked to their agricultural activities.2 Following
an overview of the policy and business case for
attention to smallholders and their agricultural
activities, this paper proposes a segmentation
framework for the 500 million smallholders
in low- and middle-income countries to more
precisely characterize their demand for financial
services related to agricultural activities. These
three segments—(i) noncommercial smallholders,
(ii) commercial smallholders in loose value chains,
and (iii) commercial smallholders in tight value
chains—are differentiated by what they grow, how
they engage with markets as buyers and/or sellers,
and how those markets are organized. These
segments are not meant to be fixed, iron-clad
divisions, but rather categories based on common
traits that can begin to illuminate the financial
mechanisms that might best fit the given financial
goals and cash flows. This paper then outlines the
demand for and current supply of financial services
FOC
US
NO
TE
1 The number of smallholder farms is estimated to be between 400 million and 500 million, and the number of people living in these households between 1.5 billion and 2.5 billion. See Conway (2012); Hazell (2011); Hazell, Poulton, Wiggins, and Dorward (2007); IFAD (2011c); Nagayets (2005); and World Bank (2007). See Box 1 on the terminology in this paper and Annex 1 on the calculation of the various population estimates in this paper.
2 The scope of this paper does not include how to increase agricultural productivity, promote higher-value crops, or even alleviate poverty. These are all important goals, but they are complex topics in which finance plays only a subordinate role.

2
within each segment, and it concludes with some
initial ideas on opportunities to better meet their
financial needs.
The results of this analysis emphasize that different
kinds of households have different kinds of financial
needs, and that this variety in demand cannot
be met by the same suite of financial products,
terms of service, or even formal financial service
providers. Moreover general household finance
and specific agricultural finance do not exist in
isolation. Money is fungible, and many existing
financial services can meet a range of household
goals, including some related to agriculture.
Financial service providers that are working to
understand the entirety and variety of household
income flows could play an important role in
meeting the demand for these general, widely
applicable financial services from poor farming
households. And value-chain finance approaches
can make an important contribution, though for a
limited range of crops and farmers, and focused
largely on credit. Beyond what general financial
services can offer, there seem to be relatively
few additional—though important—instances
in which new delivery channels, products, or
business models may be needed to address the
specific risks and cash flows of agriculture. More
work is needed, however, to better understand
the demand for and use of financial products
in agricultural households, and how their total
portfolio of financial services can be improved.
Box 1. TerminologySince this paper is intended for audiences working in both inclusive finance and agriculture, it may be useful to define a number of the key terms used throughout this analysis.
Agriculture and farming are used in this paper as general terms that encompass the wide variety of crop, livestock, and fisheries production, at whatever scale of production.
Agricultural households is intended in this paper as shorthand for that group of families in which agricultural activities represent a meaningful proportion of their total household income. Poor, farming households tend to earn income from a range of both agricultural and nonagricultural sources, and the relative significance of their agricultural activities in their total household income is highly variable (see Section 1b). Used here, agricultural households is meant to express the paper’s objective of using financial services and products to support a range of agricultural activities, as well as the wide variety of other family goals for which formal financial services can be useful, while leaving aside the exact degree to which households may depend on agriculture for their income.
Defining the precise poverty level of households is similarly thorny. This analysis focuses on families in low- and middle-income countries that would generally be considered poor, by any reasonable definition (e.g., living on less than US$2 a day, living under the poverty line, locally used definition).
Financial service providers are considered formal, semiformal, and informal. Formal financial service
providers such as banks are subject to general laws and regulations, as well as to specific banking regulations and supervision. Semiformal providers such as credit unions are registered entities subject to all relevant general laws, but not to bank regulation and supervision. Informal providers such as savings and credit associations are subject to neither commercial law nor special banking laws or regulations, meaning that disputes often cannot be resolved by turning to the legal system.a
A value chain is the series of steps and related actors that transform raw materials into finished products. Value-chain finance includes any or all of the financial services, products, and support services that flow to and/or through a value chain to address the needs and constraints of its participants in accessing finance, securing sales, procuring products, reducing risks, and/or improving efficiency (Miller and Jones 2010). These approaches include inter alia credit from input suppliers or traders, factoring, warehouse receipts, and contract farming.b
Contract farming, the most common value-chain approach, is a transaction between buyers and agricultural producers that is governed by a contract that may stipulate product and quality attributes, production methods, and/or the commitments for the future sale (e.g., timing, location, price).c
a. See Ledgerwood (2013) for more background on the distinctions between institutional types of financial service providers.
b. Miller and Jones (2010) is an excellent resource on agricultural value-chain finance.
c. See da Silva (2005).

3
3 Note that both figures here are in 2004 U.S. dollars.4 The World Bank classifies countries as low, middle, or high income based largely on their gross national income per capita.5 See Footnote 1.6 LDCs are designated by the United Nations according to the following criteria: very low incomes (i.e., three-year average per capita gross
national income less than US$750); low levels of human assets; high economic vulnerability; and a population of less than 75 million.
1. Linkages Between Agriculture, Poverty, and Access to Finance
Interest in agricultural development waned at the end
of the 20th century. Its share of official development
assistance dropped from 18 percent in 1979 to
3.5 percent in 2004, and declined in absolute terms
from a peak of US$8.0 billion in 1984 to US$3.4
billion in 2004 (World Bank 2007).3 But smallholders
are back in the spotlight. The food price crisis of
2007–2008 played a large role in refocusing the
international development community on agriculture.
Building on this momentum, developing-country
governments made agriculture a higher priority,
political alliances such as the G-20 recognized its
leverage in poverty alleviation, organizations such
as the Alliance for a Green Revolution in Africa
focused on smallholders to reduce hunger and
poverty, and research centers and governments
began exploring ways that smallholders could use
mechanisms such as payments for environmental
services to adapt to climate change (IFAD 2011a).
Financial service providers gained some ground
in rural and agricultural communities, and new
approaches to agricultural development have more
fully engaged the private sector. This section offers
a brief background on the pivotal role of agriculture
in rural households and poverty reduction, and
outlines the role of financial services in meeting both
general household goals and objectives specific to
agriculture.
a. Key role of agriculture in national economies, rural households, and poverty reduction
To appreciate the scale of the global agricultural
sector, consider that in 2010, of the approximately
5.7 billion people living in low- and middle-income
countries worldwide, more than half—an estimated
3.1 billion people—lived in rural areas (IFAD 2011b;
World Bank 2010).4 Among these rural households,
estimates suggest that more than 80 percent are
engaged in some kind of agricultural activity, at
varying levels of focus and intensity (IFAD 2011b;
Valdés et al. 2009). All told, estimates suggest
that there are up to 2.5 billion people living in
500 million smallholder farm households in the
developing world.5
At the national level, agriculture plays a critical role
in the economies of poor countries. In over half
of the 48 nations designated as least developed
countries (LDCs) by the United Nations, agriculture
contributes more than 20 percent of the gross
domestic product (GDP), and in 10 of them it
accounts for over 40 percent of GDP (IFAD 2011b).6
Agriculture is also a major employer of rural labor in
developing countries, often providing wage income
to those who do not have any land or enough of
their own to cultivate (Valdés et al. 2009). The
Food and Agriculture Organisation (FAO) of the
United Nations estimates that agriculture provides
employment to 1.3 billion people around the world,
97 percent of whom live in developing countries
(World Bank 2007). Women also play a key role
as 43 percent of the agricultural work force (FAO
2011). Agriculture also provides a source of vitality
and social welfare in rural communities that can
mitigate urban shocks (World Bank 2007).
Despite the importance of agriculture, agricultural
productivity in low- and middle-income countries
remains quite low. Half of the world’s undernourished
people and a majority of people living in absolute
poverty are smallholder farmers (Hazell, Poulton,
Wiggins, and Dorward 2007). Limited access to
improved seeds and inputs, declining soil fertility,
poor connectivity to markets, weak infrastructure,
and inadequate access to financial services continue
to hinder agricultural growth. In fact, most rural
communities are characterized by poverty. An
estimated 75 percent of the world’s poor and
chronically undernourished people live in rural
areas, and most of them directly or indirectly

4
Activities (RIGA) project8 examined poor rural
households, their income sources, and the role of
agriculture in their livelihoods. Their results indicated
that rural households receive income from a range
of sources, including agricultural production (e.g.,
crops, livestock, fisheries), wage-earning employment
(in both agricultural and nonagricultural businesses),
self-employment, and transfer payments, which
include private remittances and public income
support transfers (e.g., conditional cash transfers
[CCTs]) (IFAD 2011b; World Bank 2007). In most
countries in the RIGA database, 30–60 percent of
rural households earned approximately 75 percent
of their total income from more than two sources
(IFAD 2011b). Since some employment, particularly
in agriculture, is seasonal and weather-dependent,
maintaining a range of household income streams
from different sources helps mitigate the risk of a
decline in any one (Davis et al. 2010).
No clear pattern has emerged between the relative
poverty of households and the importance of
their agricultural income. Valdés et al. (2009) and
Davis et al. (2010), for example, found that lower-
income rural households earned the highest
proportion of their income from crop and livestock
activities and agricultural wage labor, while higher-
income households earned the majority of their
income from nonagricultural activities. In contrast,
Jayne, Mather, and Mghenyi (2010) concluded
that the poorest quintile of households in Ethiopia,
Kenya, Mozambique, Rwanda, and Zambia
generated a higher proportion of their income from
off-farm sources.9 While the relative importance of
agricultural income in a household is influenced by
a number of factors (e.g., quality of the resource
base, access to markets, perceptions of risk, off-
farm alternatives), agriculture remains an important
activity and meaningful income source in most rural
households (Valdés et al. 2009; Davis et al. 2010).
depend on agriculture for their livelihoods (World
Bank 2012; FAO 2002). Even with urbanization, a
large majority of poor people will continue to live in
the rural areas of the developing world for at least
another 20 years (Hazell 2007).
These links among agriculture, poverty, and
rural households also present an opportunity.
Agriculture has been found to play a powerful role
in poverty reduction, especially when agricultural
development has focused on small farms and the
staple crops they tend to grow (Hazell, Poulton,
Wiggins, and Dorward 2007). Thirtle, Lin, and
Piesse (2003) estimate that a 1 percent increase
in crop productivity reduces the number of poor
people by 0.72 percent in Africa and by 0.48
percent in Asia. In cross-country studies, Ligon
and Sadoulet (2007) concluded that a 1 percent
increase in GDP due to agriculture led to a more
than 6 percent increase in expenditures among
the poorest decile of the population. And Gallup,
Radelet, and Warner (1997) calculated that a 1
percent increase in per capita agricultural output
generated a 1.6 percent increase in income for the
poorest 20 percent of the population.7 Likewise,
Christiaensen, Demery, and Kuhl (2010) found
that agricultural growth is as much as 3.2 times
more effective at reducing US$1 per day poverty
than nonagricultural growth in low-income and
resource-rich countries. There is clearly scope for
gains in agricultural productivity to make greater
contributions to poverty reduction.
b. Diversity of rural incomes and the varied importance of agricultural activities
The 2008 World Development Report on agriculture
(World Bank 2007), the 2011 Rural Poverty Report
(IFAD 2011b), and the Rural Income Generating
7 See DFID (2005); OECD (2006); and Thirtle, Lin, and Piesse (2003).8 The RIGA project is a collaboration among FAO, the World Bank, and American University. The RIGA database aggregates detailed
household surveys from Albania and Bulgaria in Eastern Europe; Ghana, Madagascar, Malawi, and Nigeria in Africa; Ecuador, Guatemala, Nicaragua, and Panama in Latin America; and Bangladesh, Indonesia, Nepal, Pakistan, and Vietnam in Asia. It distinguishes seven categories of income for poor rural households: (1) crop production, (2) livestock production, (3) agricultural wage employment, (4) nonagricultural wage employment, (5) nonagricultural self-employment, (6) transfers, and (7) other. While 15 countries in the RIGA database cannot alone capture the breadth and diversity of low- and middle-income countries, a relatively consistent picture did emerge across this sample; see Davis et al. (2010), Valdés et al. (2009), and Winters et al. (2009).
9 See also the six case studies presented in Valdés et al. (2009): some found off-farm sources of income more significant to poorer rural households, others found the reverse.

5
d. Financing specific agricultural activities with tailored financial tools
Under the canopy of these general household
objectives, and the related household demand for
a generic suite of financial services, agricultural
households may also demand an additional set
of financial services related to some specific
agricultural activities or circumstances. A number of
production-related factors dictate when specialized
financial products or techniques would be required:
• When households are relatively more dependent
on farming for their total income and grow
relatively few or no cash crops, which can create
more extreme cyclical liquidity management
problems
• When investments needed for production are large
relative to a farmer’s annual income and require a
longer term for loan repayment
• When production is relatively riskier for farmers,
due to the sensitivity of crops to pests or climatic
events; the specific production methods, quality
standards, and volumes required by buyers; and/
or price volatility
• When production fails due to catastrophic events,
exhausting all financial resources, and yet must be
restarted the following season
Such specific agricultural activities and circumstances
would call for a range of supply responses from
both informal and formal sources (though the
household’s capacity to service loans would still
be determined by its overall cash flow). Generally,
as households get more intensively engaged in
producing higher-value cash crops, and as these
activities generate a more significant proportion
of their total income, their need for specialized
financial tools may increase. The presence of
agricultural income and its characteristics could also
influence the design of more general products (e.g.,
the payment of school fees due at the beginning of
the academic year could be tied to payments from
crop or livestock sales at other times of year).
c. Meeting common household objectives with a range of financial services
All households—at all income levels, in urban
and rural areas, and those active in and outside
of agriculture—share a number of overarching
objectives. And to work toward them they use a
variety of financial tools (e.g., savings, transfers,
credit, insurance). These common household
objectives typically include the following:
• Meeting regular expenses, including the
production costs of most everyday crops sold
through local informal markets
• Making investments or large purchases related
to improved housing, income-generating assets,
consumer durables, and others
• Financing foreseeable, programmed expenses
related to life events, such as births, education,
weddings, retirement, and deaths
• Responding to emergencies, illnesses, and other
sudden requirements for money
• Migrating or financing the migration of someone
in the household
Most financial products have the flexibility to serve
multiple objectives, just as a range of products can
also be used to work toward one goal. Money is
fungible. Parents organizing their child’s wedding
may search for funds from a variety of sources:
a pawn loan, a loan that was given to plant rice,
loans from neighbors, their savings, contributions
from family and friends, remittances from sons and
daughters working in the city. When the parents pay
for the wedding dinner, the caterer doesn’t ask where
the money came from, just as the clerk at the farm
supply store doesn’t care how they pay for the few
bags of seed they buy every year.10 This flexibility
suggests that a household’s general portfolio of
financial services includes a range of products that
can address most of their objectives, including
standard agricultural production. But there are some
notable instances that call for specific tools to finance
agricultural activities.
10 The fungibility of loans has vexed past efforts to provide financing specifically to increase agricultural production, such as government-led “directed lending” initiatives run by state agriculture banks. When borrowers used funds for other production needs or household consumption, the sponsors or funders of those programs tended to view this as misuse. (See Adams and Von Pischke [1980] and Adams, Graham, and Pischke [1984] on the performance of early targeted agricultural lending programs.) More recently, the experience with microcredit and further analysis of the financial lives of the poor have established that clients, including smallholder households, tend to be relatively able, rational managers of complex financial portfolios who typically respond to the same nudges (and make the same short-sighted choices) widely common to others.
6
households.12 That said, segmentation is
challenging. Successful segmentation depends
on the availability of a great deal of up-to-date
demographic information, as Morton (2007)
outlines, but there are no standard, widely
accepted definitions of smallholders or subsistence
farmers. International bodies such as FAO and the
World Bank do not track data disaggregated to
these categories. The temporal orientation of the
segmentation also guides what data are considered
relevant. Some approaches focus on the current
context of the household—examining its asset base,
demographics, income sources, and other profiling
information—and are more applicable to global
landscape research. Others consider the household’s
aspirations, including how its beliefs and values may
influence its likelihood to adopt new technologies
or pay for new services, and are more applicable
to product design.13 Each approach has its merits
and relevance to a specific line of questioning, as
explored below.
The objective of segmentation is to create a
general framework for analysis. Though useful,
such a simplification cannot fully portray the great
variety of households. Following Morton’s (2007)
idea of a continuum, each household falls along a
spectrum marked with clear points, each with its
own distinctive characteristics. Some households
may land squarely on one point and clearly match
the profile of that segment, while many will fall
between two points and share some traits from
both. One key example is in dairy: In “zero-
grazing,” a dairy cow is kept in a stall and brought
fodder (instead of grazing in pasture), and the milk
is often sold into a highly structured, often urban-
oriented value chain. In India, for example, the
Indian Dairy Cooperatives Network has 12 million
members, 60 percent of whom are smallholders,
many among them landless women (Valdés et al.
2009). Staal et al. (2001) and Ngigi, Ahmed, Ehui,
and Assefa (2010) document similar practices
among smallholders in Kenya who produce milk
for the Nairobi market.
Financing agricultural activities is challenging.
Agriculture is by nature seasonal, with time passing
between cash outflows and inflows. Farming
is rooted in the quality of the resource base,
exposed to the volatility of weather and prices,
and vulnerable to pests and spoilage. Its irregular
cash flows and risks further complicate an already
complex system of household cash management.
This in turn creates risk and liquidity management
challenges for financial service providers, in that
farmers in the same area generally want to borrow
at the same time, and are often undertaking the
same activities, and therefore are exposed to the
same risks.11
Identifying the distinctions among agricultural
households is an important step in understanding
and mitigating these risks. It also contributes to
an understanding of their demand for financial
services, which could help address their production
challenges and improve their portfolios of financial
services, and motivate the segmentation exercise
presented in the next section.
2. Three Segments of Smallholder Agriculture Households
This paper examines the estimated 500 million
smallholders and attempts to broadly identify
segments of agricultural households that share
similar characteristics in terms of what they grow
and how they produce it; what they consume at
home and what they sell in the market; and how
those markets are organized. The objective is to
facilitate a greater understanding of the specific
demands for financial services, including financing
for agricultural activities, within each segment.
a. General parameters in segmenting agricultural households
To improve the success of agricultural interventions,
there is wide interest in segmenting farming
11 See Jessop et al. (2012), Nagarajan and Meyer (2005), and Meyer (2011) for a thorough overview of agricultural finance and its challenges.12 See Faz and Breloff (2012); GIZ (2011); Hansen, Carroll, Bradlow, and Ahmad (2012); IFC (2011); Jaleta, Gebremedhin, and Hoekstra
(2009); Jayne, Mather, and Mghenyi (2010); Nagayets (2005); OECD (2006); Orden, Torero, and Gulati (2004); Seville, Buxton, and Vorley (2011); Staal et al. (2001); Torero (2011); USAID (2011); Valdés et al. (2009); von Braun (2005); and World Bank (2007).
13 Hansen (2012), personal communication.
7
Households, like people, are dynamic. A household’s
place in one segment today may not reflect its
position tomorrow, or over the longer term.
Livelihoods change, income streams ebb and flow,
and people move in and out of poverty, buoyed by
opportunity and burdened by shocks. IFAD (2011b),
for example, found that in nine countries in Asia,
sub-Saharan Africa, and Latin America 10–20 percent
of the population moved into or out of poverty
within a period of 5–10 years; in some cases, as much
as 30 percent of the population shifted. Dercon
and Shapiro (2007) argued there are more people
considered sometimes poor than always poor.
Households may also actively be working to move
from one segment to another, and generally moving
toward a portfolio of economic activities that
is less risky and offers higher returns. Some may
want to get out of agriculture altogether. Farming
is hard, physical work, often for little if any return,
and farmers may have less and less interest or even
ability to continue in agriculture as they age, to the
extent that they have a choice. And no matter how
successful their agricultural activities may be, they
may also want to ensure that their children have
other, less physically gruelling alternatives to earn
income and do not follow them into farming. Young
people often tend to look for career paths away from
agriculture anyway, which they may perceive as a last
resort.14 Thus any segmentation framework offers at
best a snapshot of households at the given moment.
b. Key examples of segmentation among agricultural households
There have been a number of different approaches to
the segmentation of agricultural households. Some
distinguish among broad groups of farmers. As part
of a landscape study on contemporary trends and
challenges in agricultural finance, for example, GIZ
(2011) recognized two segments of farmers: “a vast
number of small, subsistence-oriented farmers with
highly-diversified income sources,” and “market-
oriented farmers. . .for whom agriculture is the main
economic activity.” Torero (2011); von Braun (2005);
and Orden, Torero, and Gulati (2004) further refined
this characterization by adding a third general
segment, differentiating among subsistence farmers,
farmers oriented toward local and national markets,
and globally competitive market-oriented farmers.
Jessop et al. (2012) made similar distinctions, and
also included a fourth segment of large agricultural
estates (e.g., oil palm, coffee, tea).
The most common way to differentiate among
small farms is by the size of the landholding or
the number of livestock, as detailed in Nagayets
(2005) and von Braun (2005). While the logic of this
approach is clear, it has a number of limitations.
Knowing only the number of hectares farmed
indicates nothing about what is grown, where it
is sold, the quality of the soil, access to irrigation
or the reliability of the rains, or the state of the
surrounding infrastructure and services. It also offers
no clear indication about the balance between
family and hired labor. In addition, farm size is
highly region-specific, and what is considered small
in one country would be considered quite large in
another: A 100 hectare farm is considered modest
to some in Brazil, for example, while it would be
quite large by the standards of sub-Saharan Africa
(Rabo Development 2011).
Another approach to the segmentation of
agricultural households is based on the extent of
the farm’s commercialization. Jaleta, Gebremedhin,
and Hoesktra (2009) presented a thorough outline
of how this is evaluated. Some research measured
commercialization according to the production
of cash commodities; other studies focused on
how agricultural households make decisions
about what to produce and how to market it. The
common interpretation is that commercialized
farmers make production decisions based on their
own comparative advantage and signals from
the market, whereas subsistence farmers largely
consider their own food requirements and the
feasibility of generating outputs, and only sell
any surplus that remains after household needs
are met. Jayne, Mather, and Mghenyi (2010) used
survey data on staple grain markets in eastern
and southern Africa to identify four categories of
14 See Mwaura (2012), Tadele and Ayalew (2012), and White (2012).

8
smallholder households: sellers of staple grains,
buyers of staple grains, households that both
buy and sell grain in a given year, and those that
neither buy nor sell.15 Similarly, Seville, Buxton,
and Vorley (2011) proposed four segments of
agricultural households according to farmers’
market participation.
Income is also commonly used to segment farming
households. The World Bank World Development
Report on agriculture (2008), working first at the
global level, classified countries into three worlds
of agriculture for development—agriculture-
based, transforming, and urbanized—and then
at the household level identified five livelihood
strategies according to the relative importance of
income from agriculture, labor, and migration. Using
relative income or income composition to segment
households, however, is problematic. It does not
reflect important regional and national variation in
income, or that landholdings vary in their potential
to generate income according to the quality of soil,
choice of crops, access to markets, and other factors.
To address these limitations, IFC (2011) segmented
agricultural households using a proxy for income
that compares the annual net income from farming
(after expenses) with the annual net earnings of a
skilled laborer in that country or region. They then
identified four segments of primary agricultural
producers that differ in respect to their landholding,
use of labor, level of commercial production,
capacity, and position in the value chain.
Other approaches to segmentation use a blend
of indicators. Looking at low-income households
in Mexico, Faz and Breloff (2012) collected data
on households’ incomes, aspirations, concerns,
and financial management strategies and defined
four lower-income livelihood segments, including
one “seasonal/agricultural worker” segment. They
then outlined the financial services that would be
most valuable for each. To tailor development
interventions to assist smallholder dairy producers
in Kenya, Staal et al. (2001) conducted a principal
component and cluster analysis, identifying four
groups that varied according to their level of
intensification, available resources, and access
to inputs and markets. Expanding the variables
considered, OECD (2006) considered the “financial
and physical holdings of the household; the access
to labour and product markets and to a variety of
services needed to sustain livelihoods, including
finance, information and infrastructure; the
provisions for health care, education, and training
and upgrading skills (especially for women);
and the social networks that enable households
to benefit from their participation in economic,
political and social institutions and organisations”
and delineated five “rural worlds,” each with its
own relationship to agricultural production. Finally,
the approach to segmentation used by Valdés et
al. (2009) was even more detailed. Based on the
RIGA dataset, 12 groups of rural households were
identified, varying according to their landholdings,
the level of education of the head of the household,
and an index measuring access to infrastructure.
Within this rich literature on segmentation, relatively
few papers took the added step of estimating
the population size of the defined segments. The
exceptions—including Seville, Buxton, and Vorley
(2011); Jayne, Mather, and Mghenyi (2010); Valdés et
al. (2009); and Staal et al. (2001)—collected their own
data, or reviewed the data of others (Barrett 2010).
In one case, Staal et al. (2001) classified 51 percent
of dairy farmers in their survey as “informal resource
poor,” the largest of the four segments, and only
7 percent as “specialised dairy” producers (i.e.,
those who sell into multiple markets and purchase
large amounts of fodder). Seville, Buxton, and Vorley
(2011) estimated that 40–50 percent of farmers
were subsistence farmers and only 1–2 percent were
commercial farmers, which appears closely linked to
the Jayne, Mather, and Mghenyi (2010) finding that
only 2 percent of farmers in Kenya, Mozambique,
and Zambia generated 50 percent of all maize sales.
c. Three segments of agricultural households: Their characteristics and estimated size
The segmentation proposed in this paper is
intended to identify and determine the approximate
size of distinct groups of smallholder agricultural
15 See Barrett (2010) for a thorough discussion of smallholder market participation (i.e., net buyers and net sellers) in eastern and southern Africa.

9
households in low- and middle-income countries
and differentiate their demand for financial
services, particularly for financing related to their
agricultural activities. This analysis defines three
distinct segments of poor households that depend
on agriculture—noncommercial smallholders,
commercial smallholders in loose value chains, and
commercial smallholders in tight value chains. Each
segment is discussed below and outlined in Table 1.
Their demand and supply for financial services is
addressed in the following section.
Drawing from the literature, this segmentation
framework is based on the general types of crops
grown on the farm (e.g., staple crops, high-value
cash crops), the way that smallholders engage
with markets (e.g., buyer, seller, both in different
periods), and how those markets are organized
(e.g., local spot markets, export markets with high
standards and specific contractual obligations).
With the overall objective of increasing financial
inclusion, this approach was designed to bring
household agricultural activities to the fore
(independent of their relative importance to total
household income) and illuminate the financial
relationships and transactions behind them,
identifying areas where more formal, specialized
agricultural finance could add value to existing
portfolios of financial services.
The approximation of the size of the segments is
based on the estimate that there are up to 500
million smallholder farms worldwide and 2.5 billion
people living in these households.16 To approximate
the size of the three segments, this paper draws on
findings from the World Bank RuralStruc dataset
(IFAD 2011b); Jayne, Mather, and Mghenyi (2010);
and Seville, Buxton, and Vorley (2011). The paper
estimates that 60 percent of the total population
of smallholder farms would be considered
noncommercial smallholders, 33 percent would be
commercial smallholders in loose value chains, and
7 percent would be commercial smallholders in
tight value chains. Then, to approximate the total
household population of each segment, the paper
uses an average household size of five persons,
based on Conway (2012) and Bongaarts (2001).
Annex 1 provides further detail on the methodology
behind this approximation.
1. Noncommercial smallholders—approximately
300 million smallholder farmers—are generally
considered subsistence farmers. Among the
world’s poorest households, they farm not as
a vocation or strategic business choice, but to
contribute to their own sustenance and survival.
Agricultural production is concentrated in staple
crops (e.g., cereals, roots and tubers, pulses) and
could include small livestock (e.g., hens, goats,
pigs). Access to land, technology, education,
markets, and information about weather or
production methods is very limited. Very few
purchased inputs and little mechanization
are used (if any), and the household is highly
vulnerable to income and other shocks. Outputs
are relatively low and consumed largely by the
household. They are generally buyers of food
(supplementing their own production) and sellers
of labor, which limits their ability to produce.
And they may endure periods of food deficits
throughout the year. Any irregular, small amounts
of surplus would be sold in an informal, local
market. Noncommercial smallholder households
are not connected to a structured value chain
of any kind. They are largely limited to informal
financial mechanisms and simple tools, such as
local savings and loan groups, to meet their
relatively basic financial service needs.
2. Commercial smallholders in loose value
chains—approximately 165 million smallholder
farmers—are still considered very poor, but tend
to be somewhat less so than the noncommercial
smallholder segment. Their crop mix usually
focuses on staple crops and could also include
some higher-value crops (e.g., sugar, tea, coffee,
oilseeds, fibers, energy crops). They have
access to somewhat more land than the first
segment, though they still have limited access
to inputs, financial services, and information
about weather, markets, and prices and tend
to rely on unimproved seeds and traditional
production methods. Commercial smallholders
in loose value chains generate some level
of surplus to sell, usually in informal local or
16 See Conway (2012); Hazell (2011); Hazell, Poulton, Wiggins, and Dorward (2007); IFAD (2011c); Nagayets (2005); and World Bank (2007).

10
Tab
le 1
. Th
ree
Seg
men
ts o
f A
gri
cult
ural
Ho
useh
old
s in
Lo
w-
and
Mid
dle
-Inc
om
e C
oun
trie
s
No
tes
1. N
onc
om
mer
cial
sm
allh
old
ers
2. C
om
mer
cial
sm
allh
old
ers
in
loo
se v
alue
cha
ins
3. C
om
mer
cial
sm
allh
old
ers
in t
ight
va
lue
chai
ns
Po
pul
atio
n es
tim
ates
500
mill
ion
smal
lho
lder
sa
2.5
bill
ion
peo
ple
in
smal
lho
lder
ho
useh
old
s
300
mill
ion
smal
lho
lder
s1.
5 b
illio
n p
eop
le in
ho
useh
old
s16
5 m
illio
n sm
allh
old
ers
825
mill
ion
peo
ple
in h
ous
eho
lds
35 m
illio
n sm
allh
old
ers
175
mill
ion
peo
ple
in h
ous
eho
lds
Gen
der
of
farm
erW
om
en a
re m
ore
like
ly t
o e
ngag
e in
su
bsi
sten
ce f
arm
ing
bW
om
en a
re le
ss li
kely
to
cul
tiva
te
cash
cro
psc
Land
siz
e es
tim
ates
Reg
iona
l diff
eren
ces
in
land
siz
e ar
e p
arti
cula
rly
imp
ort
ant,
as
are
cons
ider
atio
ns o
f so
il q
ualit
y,
acce
ss t
o w
ater
, inp
uts,
and
m
arke
ts, a
nd t
he c
hose
n ag
ricu
ltur
al a
ctiv
itie
s an
d
cro
ps.
•N
ola
ndo
rle
sst
han
one
hec
tare
d
•“M
ost
rur
alh
ous
eho
lds
ow
nno
la
nd, o
r o
nly
smal
l plo
ts o
f la
nd…
La
ndho
ldin
gs
of
op
erat
ed la
nd in
m
ost
of
the
RIG
A c
oun
trie
s ar
e sm
all;
the
vast
maj
ori
ty h
ave
less
th
an o
ne h
ecta
re in
siz
e.”e
•O
net
ot
wo
hec
tare
s•
“The
vas
tm
ajo
rity
of
farm
ers
in d
evel
op
ing
co
untr
ies
are
smal
lho
lder
s, a
nd a
n es
tim
ated
85
% o
f th
em a
re f
arm
ing
less
tha
n tw
o h
ecta
res.
”f
•A
nes
tim
ated
90%
of
farm
sin
the
d
evel
op
ing
wo
rld
are
sm
alle
r th
an
two
hec
tare
s.g
•A
tle
ast
two
hec
tare
s•
85%
of
the
farm
ers
par
tici
pat
ing
in
cont
ract
far
min
g h
ave
at le
ast
two
he
ctar
es o
f la
nd.h
Gen
eral
cro
p m
ixSt
aple
cro
ps
Stap
le c
rop
sSo
me
cash
cro
ps
Cas
h cr
op
sR
elat
ivel
y fe
w s
tap
le c
rop
s
Eng
agem
ent
wit
h m
arke
ts•
Mo
stp
rod
ucti
on
cons
umed
by
the
hous
eho
ld f
or
sub
sist
ence
, and
ad
dit
iona
l fo
od
is b
oug
ht in
the
m
arke
t•
Very
litt
le,i
fan
y,e
ngag
emen
tw
ith
any
mar
kets
as
a se
ller
of
foo
d
•So
me
pro
duc
tio
nco
nsum
edb
yth
e ho
useh
old
fo
r su
bsi
sten
ce•
Rel
iab
les
urp
lus
of
stap
lec
rop
sso
ld t
hro
ugh
rela
tive
ly in
form
al,
loca
l mar
kets
•So
me
pro
duc
tio
nm
ayb
eco
nsum
ed b
y th
e ho
useh
old
fo
r su
bsi
sten
ce•
Rel
iab
les
urp
lus
of
stap
lec
rop
sco
uld
be
sold
thr
oug
h re
lati
vely
in
form
al, l
oca
l mar
kets
•C
ash
crop
sso
ldin
reg
iona
lor
exp
ort
mar
kets
thr
oug
h co
ntra
ct f
arm
ing
i
Acc
ess
to im
pro
ved
ag
ricu
ltur
al t
echn
olo
gy
Very
lim
ited
if a
t al
lLi
mit
edG
oo
d, t
hank
s to
val
ue-c
hain
far
min
g
bun
dle
s p
rovi
ded
by
the
buy
er
Acc
ess
to f
inan
cial
se
rvic
esLi
mit
ed, i
nfo
rmal
if a
t al
lLi
mit
ed a
nd in
form
alIn
form
al a
nd s
om
e fo
rmal
, so
me
of
whi
ch is
pro
vid
ed b
y th
e b
uyer
a. I
FAD
(20
11b)
b. I
FAD
(20
11b)
c. I
FAD
(20
11b)
d. O
ne h
ecta
re is
equ
al t
o ap
prox
imat
ely
2.5
acre
s.e.
Val
dés
et a
l. (2
009)
f. W
orld
Ban
k (2
007)
g. A
nríq
uez
and
Bono
mi (
2007
)h.
IFA
D (
2011
b)i.
Wor
ld B
ank
(200
7)

11
regional markets. These households have access
to a wider range of financial services than
noncommercial smallholders and may be looking
for opportunities to further diversify their assets
and sources of income.
3. Commercial smallholders in tight value
chains—approximately 35 million smallholder
farmers—are generally less poor and more
resilient than the other two segments and take
a more business-like approach to farming.
A sizeable portion of their agricultural income
may be derived from higher-value specialty
crops, though they are also likely to grow some
staple crops as well. They tend to manage at
least two hectares of land (subject to important
regional differences) and, due to their place in
relatively more structured value chains, have
access to buyer-provided bundles of improved
seeds, inputs, agricultural and weather
information, finance, and secure markets and
prices. Commercial smallholders in tight value
chains have the capacity to generate reliable,
high-quality outputs that are sold on a contract
basis through relatively highly organized value
chains. Staple crops may be sold more informally
through local and regional markets. As relatively
larger producers, they may hire people to
support some of their agricultural activities,
including members of the two other segments.
They are likely to demand and use a wider
range of financial services from both formal
and informal financial service providers than the
other two segments.
There are two important points about this
segmentation framework to keep in mind. First,
while this approach follows general trends in
household poverty status (i.e., subsistence
farmers tend to be poorer than farmers linked
to local markets, who in turn tend to be poorer
than farmers linked to national or international
markets), the intention is not to assert a correlation
between agricultural activities and household
wealth. A great majority of rural households do
engage in agricultural activities, but these are not
their only sources of income, and they may not
be their most important ones. The segmentation
framework proposed here, however, is designed
to highlight differences in household demand
for financial services related to agriculture and
therefore focuses on these activities and related
market relationships.
Second, this segmentation model does not
intend to suggest that only some segments are
bankable while some are not “ready” for formal
financial services and should be written off until
they somehow become less poor or get out of
agriculture. Instead this model highlights that
different kinds of households have different kinds
of needs, and that this variety in demand cannot be
met by the same suite of financial products, terms
of service, or even pool of formal financial service
providers. The generally poorer noncommercial
smallholders, for example, tend to access most
financial services through informal mechanisms,
and it remains to be seen whether formal financial
intermediaries can improve on how they manage
their money today. This critical question in financial
inclusion is explored in the next section.
3. Improving the Financial Portfolio of Each Segment of Agricultural Households
This section examines the three segments of
farming families and the extent to which they are
able to use the formal financial services that have
been developed for the poor over the past three
to four decades. The financial portfolio of each
of the three segments of agricultural households
is outlined in the tables that follow, identifying
the demand for financial services specific to each
segment and the financial service providers most
likely to supply relevant products. Though these
demand and supply portfolios greatly simplify
the real complexities and variations among
poor agricultural households, three distinctive
portfolios of formal financial products start to
take shape. It begins to become clearer what
financial goals may be well served with either
general finance or a somewhat tweaked form of
microfinance, and what goals may require more
specialized approaches tailored to the specific
agricultural circumstance.
This framework outlines household demand as
it corresponds to broadly grouped household

12
goals and general categories of financial services
(e.g., savings, credit). Whether a family is saving
to send their children to school, to buy a new roof
for their home, or to repair a plow, for example,
these are all called “large purchases, investments,
or programmed expenses” in these tables. In other
cases, similar products may be listed separately
if they come from different providers and have
specific conditions or if they are offered only by
certain entities (e.g., financing for farming inputs).
For example, inputs for staple crops sold into
loosely organized value chains may be purchased
or financed from input suppliers (if they are
purchased at all), while inputs for high-value crops
sold into tightly organized value chains are typically
provided by the buyer.
The different segments may also use the various
products in different ways. For poorer households,
mobile money may be largely a mechanism to
receive money transfers from family members
working in the cities and to send money home
to help the family through hard times. Better-off
families engaged in tight value chains, in addition to
using the more common money transfer functions,
might also receive harvest payments from buyers
or pay input providers directly.
Important information about how poor households
use financial tools has come from key publications,
such as the FinMark Financial Diaries,17 Portfolios
of the Poor (Collins, Morduch, Rutherford, and
Ruthven 2009), and The Poor and Their Money
(Rutherford 2001). Though these seminal works
have informed this analysis, the current data on
smallholder households and their demand for
financial services related specifically to their range
of agricultural activities are very limited. More
information is needed on agricultural households
to more clearly understand their demand for
financial services. Increasing transparency on the
products that are already available is another
important step. These insights will help align
general forms of finance with products tailored
to agricultural activities, and add greater overall
value to the financial portfolios of agricultural
households.
a. Financial portfolio of noncommercial smallholders
Approximately 300 million farmers would be
considered noncommercial smallholders, and a
total of roughly 1.5 billion people live in these
households. Noncommercial smallholders have
incomes that are low and highly variable, and they
are vulnerable to significant periods with no income
at all. They probably do not own their own land, or
don’t own enough to be commercially successful.
Family members often work as day laborers on the
farms of others. Their financial transactions tend to
be too small to interest the formal financial sector.
Any formal financial services beyond remittances or
conditional cash transfers (CCTs) are likely to come
from development finance organizations, such as
state development banks.
Demand. As outlined in Table 2, noncommercial
smallholders translate their household objectives
into a series of financial goals and, by extension,
demands for financial services that are relatively
modest, compared with the other household
profiles outlined here. To make significant
purchases or programmed expenses, they look
for avenues to save or take loans; to deal with
emergencies or take advantage of short-term
opportunities, they turn to credit; and to smooth
or supplement household income, they may
receive money transfers in the form of remittances
or CCTs.
To mitigate risk, noncommercial smallholders may
look for opportunities to join burial societies or
take life insurance, which in some regions are
accessible and widely used. Even health insurance
is available to some very poor rural households,
though the success of such interventions depends
as much on a sound financial model as the presence
of easily reachable, reliable health care providers.
More complex forms of insurance that are both
challenging to understand and expensive to
launch (e.g., weather index-based insurance) have
not yet reached noncommercial smallholders (or
smallholders in general) on a sustainable, cost-
covering basis at a notable scale.
17 The Financial Diaries. http://www.financialdiaries.com/index.htm. Accessed 1 June 2012.

13
Table 2. Demand and (Potential) Supply of Formal Financial Services: Noncommercial Smallholders
Demand Supply
Overarching category Financial goal Financial service provider Product
Savings Investments, large purchases, and/or programmed expenses
Savings-and-loan groups promoted by nonprofits
Contractual, periodic, savings, with programmed disbursements
Credit Investments, large purchases, and/or programmed expenses
Microlenders that use a group-based lending technique
Solidarity group or village-banking-type loan
Emergencies and sudden requirements
Savings and loan groups promoted by nonprofits
Loans by groups made with internal funds for short terms
Emergencies and sudden requirements
Licensed pawn-based lenders, including banks
Pawn-based loans for very short terms (commonly gold, other jewellery)
Transfers Regular expenses Remittance companies, telecommunication companies, post offices
Money transfer services, mobile money, CCTs
Risk management tools
Emergencies and sudden requirements
Microlenders Group-based life and funeral insurance policies added to small loans
Note: Demand from this segment is relatively basic, and there are comparatively few areas where formal financial services can add value and be offered profitably.
Clients in this category are reached largely through group mechanisms of some sort that transfer significant portions of transaction costs to themselves. This is changing with the increasing importance of technology—and particularly mobile phones—in delivering financial services.
Supply. The demand for financial services from
noncommercial smallholders poses three fundamental
challenges to financial service providers:
1. Income in noncommercial smallholder households
is low, highly irregular, and unpredictable.
2. The average amount of each financial transaction
is tiny.
3. The cost of developing a product may be large
relative to its potential income.
These barriers would seem to preclude mainstream
formal financial institutions from ever reaching
noncommercial smallholders, except to the extent that
they work through agency relationships to channel
remittances or CCTs. And yet, as demonstrated in
Collins, Morduch, Rutherford, and Ruthven (2009)
and Rutherford (2001), these households are very
active money managers and connect to some basic
forms of financial services.
The few financial service providers meeting the
needs of noncommercial smallholders include pawn-
based lenders that make short-term loans usually
collateralized by gold or jewellery; microlenders using
a group-based methodology; remittance companies
or telecommunications firms channelling money
from family members or CCTs; and, perhaps most
importantly, simple, locally based savings-and-loan
groups promoted through nonprofits. Savings-and-
loan groups are the most significant financial tool
available to noncommercial smallholder households.
They allow group members to regularly save and
borrow small amounts of money and do not
require collateral, fees, or financial sophistication to
participate.18
Gaps. The demand for financial services among
noncommercial smallholders is relatively narrow,
and some services more common to the other two
segments tend to be beyond the scope of their
18 Savings-and-loan groups take many forms around the world, including rotating savings and credit associations, accumulating savings and credit associations, the millions of self-help groups in India, and village savings and loan associations (VSLAs). VSLAs alone now reach an estimated 4.6 million participants in 54 countries (see Economist 2011).

14
needs. Contract farming, for example, is by definition
unfeasible at this level (see Section 3d), and credit
from agricultural suppliers is uncommon. Household
cash flows are usually not robust or diversified
enough to ensure repayment of loans for agricultural
production, and the family is unlikely to have collateral
to offer that would be acceptable to a formal lender.
b. Financial portfolio of commercial smallholders in loose value chains
Commercial smallholders in loose value chains
number approximately 165 million people, and
roughly 825 million people live in these households.
Commercial smallholders in loose value chains usually
have access to more land than noncommercial
farmers, though still very small amounts, and
they tend to be less poor than noncommercial
smallholders. Their household income comes from a
diverse range of both agricultural and nonagricultural
activities. They tend to sell into open, unstructured
local markets, not the tightly organized value chains
characteristic of export crops. They are also in a
position to conduct financial transactions at a size and
frequency that could be attractive to formal financial
institutions, including transactions related to the sale
of harvest proceeds, loans in support of agricultural
production, and small consumer loans for personal
consumption. Commercial smallholders in loose value
chains probably have a higher capacity to save and
are relatively more accustomed to saving in some
form to get through the periods between harvesting
their principal cash crops. This household segment
has relatively few hungry days in the year, unless
there has been a climatic event that adversely affects
the harvest.
Demand. Commercial smallholders in loose value
chains tend to use a more robust portfolio of financial
services than noncommercial smallholders, with a
wider range of suppliers available to meet their wider
demand for financial services. They would demand
a larger array of savings products, including, for
example, both harvest savings accounts that use one
season’s profits to pay for next season’s inputs (see
Section 3e) and standard passbook savings accounts
in which they can deposit the small amounts of regular
income from nonagricultural activities. While they
may participate in larger savings-and-loan groups that
include relatively less poor members and therefore
manage larger pools of money, these groups do not
play as central a role as in noncommercial smallholder
households. Instead they complement a range
of other suppliers, including banks, credit unions,
deposit-taking microfinance institutions (MFIs), input
suppliers, and microcredit providers with a degree of
specialization in agricultural lending.
Receiving money, including income-supporting CCTs
and contributions from relatives working overseas or
in urban centers, is also important to this segment,
and brings them in contact with remittance and
telecommunications companies. Mitigating risk is also
a challenge, and they, too, want to join burial societies
or take life insurance. In some cases, this segment
has access to health insurance through a microcredit
group loan. More complex forms of insurance (e.g.,
weather index-based insurance) whose delivery meets
reasonable performance expectations (e.g., reliable,
timely payouts for insured events) are typically not
available to commercial smallholders in loose value
chains on a commercial basis or at a wide scale.
Supply. The profile of commercial smallholders
in loose value chains presents three fundamental
challenges to financial service providers:
1. Their income includes a component that is highly
seasonal.
2. The average size of their transactions is on the
lower end of the scale of what can profitably be
offered.
3. The cash flows and income related to their
agricultural production may be significant,
and should be well understood, together
with all other sources of household income, in
considering the extension of credit.
These challenges could pose significant costs, but a
number of financial service providers have overcome
these barriers and serve commercial smallholders in
loose value chains. Banks, credit unions, and licensed

15
Table 3. Demand and (Potential) Supply of Formal Financial Services: Commercial Smallholders in Loose Value Chains
Demand Supply
Overarching category Financial goal
Financial service provider Product
Savings Regular expenses: Pay for farming inputs at the right time
Banks, credit unions, licensed deposit-taking MFIs
Harvest savings account—depositing proceeds of sales for a later, agreed use
Investments, large purchases, and/or programmed expenses
Banks, credit unions, licensed deposit-taking MFIs
Passbook savings account into which family members deposit daily and weekly income from nonfarming activities
Investments, large purchases, and/or programmed expenses
Savings-and-loan groups Contractual, periodic, savings from nonfarm activities, with programmed disbursements
Credit Regular expenses: Pay for farming inputs at the right time
Input suppliers Supplies on credit if farmer has a long-standing relationship with one and is a steady producer
Regular expenses: Pay for farming inputs at the right time
Microlenders with specialized capacity, agricultural banks
Agricultural production loans—tied to cash flow cycle, but maintaining general credit obligation for the household
Investments, large purchases, and/or programmed expenses
Microlenders that use a group-based lending technique
Solidarity group or village banking type loan
Emergencies and sudden requirements
Licensed pawn-based lenders, including banks
Pawn-based loans for very short terms (commonly gold, other jewellery)
Emergencies and sudden requirements
Savings-and-loan groups promoted by nonprofits
Loans by groups made with internal funds for short terms
Transfers Regular expenses Remittance companies, tele-communication companies
Money transfer services, mobile money, CCTs
Risk management
Emergencies and sudden requirements
Microlenders Group-based life and funeral insurance policies added to microcredit
Note: Clients in this category have notable and varied sources of household income and are in a position to build credit histories. They may represent the best target for MFIs that want to expand into rural areas.
Financial service providers that lend to this segment mitigate risk primarily through diversification, spreading loans across many agroecological zones, crops and livestock, and markets, and by insisting that family incomes also be widely diversified.
deposit-taking MFIs may offer savings products
suited to their needs and constraints. Agricultural
banks or MFIs that have developed some specialized
capacity in agriculture may be able to offer loans.
Input suppliers who know them well may also extend
credit on the basis of these relationships. These more
formal sources of financial services could complement
their participation in savings-and-loan groups.
Gaps. Though commercial smallholders in loose value
chains have access to a relatively wider portfolio of
financial services than noncommercial smallholders,
some financial products and approaches are
incompatible with their crop mix and market linkages
(e.g., contract farming).
c. Financial portfolio of commercial smallholders in tight value chains
Producing higher-value cash crops and selling into
tightly organized value chains, approximately 35
million people would be considered commercial

16
smallholders in tight value chains, and a total of
roughly 175 million people live in these households.
As relatively larger producers, they may hire people
from the other two segments. They work with a range
of value-chain actors that provide inputs, advice,
and finance, and that then, if the stringent quality
standards are met, purchase the final output. Though
the households may derive significant income from
these activities, they are also probably engaged
in other agricultural activities for either home
consumption or for sale into loosely organized value
chains, as well as other nonagricultural activities.
These smallholders are more attractive customers
for lenders, particularly as they become increasingly
engaged in the production of high-end crops and
livestock and enter production contracts with
buyers. These households are the primary target of
most specialized agricultural finance approaches,
particularly related to contract farming, equipment
leasing, and long-term loans for investments in tree
crops, land preparation, or required agroprocessing
infrastructure. That said, they also present a more
complex risk profile than the other two segments
(see Section 3d). Their income tends to be higher
than households in the other segments, but it
may also be more concentrated in less diversified
agricultural production.
Demand. Commercial smallholders in tight value
chains demand a more extensive suite of financial
services than the other two segments. They look
for a range of saving products to plan for medium-
term expenditures, save regular income flows from
nonfarming activities, make large purchases, and
respond to emergencies. This segment also has a
wider set of demands related to money transfers.
In addition to receiving money from relatives or
CCTs, as with the other two groups, these farming
households may also want to send money to family
members who rely on their regular support or
who turn to them in emergencies, or to business
contacts, such as input suppliers or employees, for
payments. They could also receive transfers through
these services, including payments for their crops
from buyers. Commercial smallholders in tight value
chains would demand a more complete range of risk
management products as well, including crop and
livestock insurance.
Supply. This segment has access to the same suppliers
of financial services as commercial smallholders in
loose value chains, with some notable additions. Unlike
the other two segments of farming households, these
farmers may also be served by microlenders and credit
unions that have developed the capacity to analyze
individual credit risks, meaning that they no longer
need to participate in group-lending approaches to
access credit for large purchases or programmed
expenses. In addition, commercial smallholders in
tight value chains are more easily reached by insurers
working through aggregating organizations (e.g.,
financial service providers, farmers organizations,
value chain lead firms) to offer more complex forms
of coverage, such as weather index-based insurance
and area yield-based insurance, particularly as part
of a package of other agricultural services. These are
key differences, but the most important distinction is
their use of contract farming and other value-chain
financing instruments.
The characteristics of commercial smallholders
in tight value chains present three fundamental
challenges to financial services providers:
1. Their overall household income may come from
relatively diverse sources, but some significant
portion of their agricultural income may depend
on one output and a single buyer.
2. Their contract farming agreements may on
balance result in higher than normal risk, due to
the exacting standards that outputs must meet
to be sold under the contract.
3. The successful production methods related to
the high-value crops grown under contract may
be closely held and not widely available (unlike
the well-known and relatively straightforward
methods of growing staple crops), making it
more challenging for financial service providers
to evaluate household cash flows and risks.
Responding to these challenges, contract farming has
successfully targeted this segment of smallholders.
The capacity of commercial smallholders in tight value
17
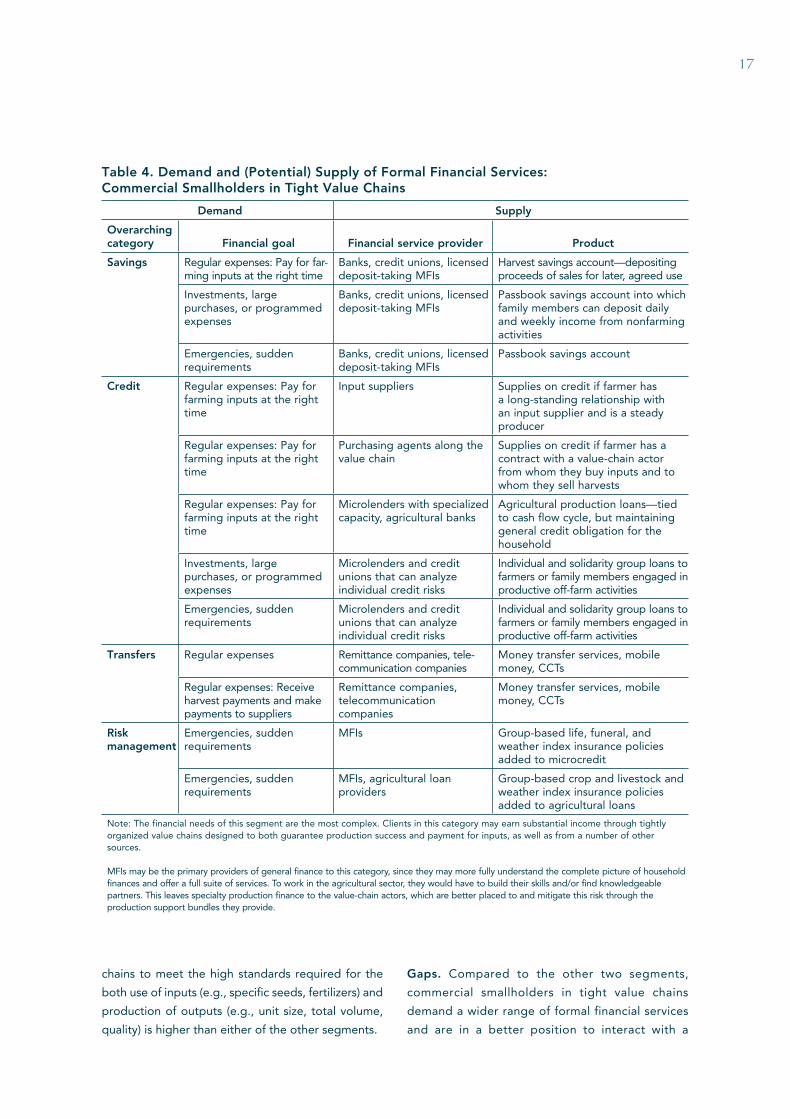
Table 4. Demand and (Potential) Supply of Formal Financial Services: Commercial Smallholders in Tight Value Chains
Demand Supply
Overarching category Financial goal Financial service provider Product
Savings Regular expenses: Pay for far-ming inputs at the right time
Banks, credit unions, licensed deposit-taking MFIs
Harvest savings account—depositing proceeds of sales for later, agreed use
Investments, large purchases, or programmed expenses
Banks, credit unions, licensed deposit-taking MFIs
Passbook savings account into which family members can deposit daily and weekly income from nonfarming activities
Emergencies, sudden requirements
Banks, credit unions, licensed deposit-taking MFIs
Passbook savings account
Credit Regular expenses: Pay for farming inputs at the right time
Input suppliers Supplies on credit if farmer has a long-standing relationship with an input supplier and is a steady producer
Regular expenses: Pay for farming inputs at the right time
Purchasing agents along the value chain
Supplies on credit if farmer has a contract with a value-chain actor from whom they buy inputs and to whom they sell harvests
Regular expenses: Pay for farming inputs at the right time
Microlenders with specialized capacity, agricultural banks
Agricultural production loans—tied to cash flow cycle, but maintaining general credit obligation for the household
Investments, large purchases, or programmed expenses
Microlenders and credit unions that can analyze individual credit risks
Individual and solidarity group loans to farmers or family members engaged in productive off-farm activities
Emergencies, sudden requirements
Microlenders and credit unions that can analyze individual credit risks
Individual and solidarity group loans to farmers or family members engaged in productive off-farm activities
Transfers Regular expenses Remittance companies, tele-communication companies
Money transfer services, mobile money, CCTs
Regular expenses: Receive harvest payments and make payments to suppliers
Remittance companies, telecommunication companies
Money transfer services, mobile money, CCTs
Risk management
Emergencies, sudden requirements
MFIs Group-based life, funeral, and weather index insurance policies added to microcredit
Emergencies, sudden requirements
MFIs, agricultural loan providers
Group-based crop and livestock and weather index insurance policies added to agricultural loans
Note: The financial needs of this segment are the most complex. Clients in this category may earn substantial income through tightly organized value chains designed to both guarantee production success and payment for inputs, as well as from a number of other sources.
MFIs may be the primary providers of general finance to this category, since they may more fully understand the complete picture of household finances and offer a full suite of services. To work in the agricultural sector, they would have to build their skills and/or find knowledgeable partners. This leaves specialty production finance to the value-chain actors, which are better placed to and mitigate this risk through the production support bundles they provide.
chains to meet the high standards required for the
both use of inputs (e.g., specific seeds, fertilizers) and
production of outputs (e.g., unit size, total volume,
quality) is higher than either of the other segments.
Gaps. Compared to the other two segments,
commercial smallholders in tight value chains
demand a wider range of formal financial services
and are in a better position to interact with a

18
greater variety of service providers. Value-chain
financing has an important, if narrow, role in
their financial portfolio, and many other tools are
needed to achieve the breadth of their household
financial objectives.
d. Benefits and limitations of value-chain finance for these three segments of agricultural households
Notable improvements in access to finance for
agricultural production have come from outside
the field of financial inclusion, woven along the
linkages of agricultural value chains. Traders and
agricultural processors interested in increasing
agricultural production and securing their supply
lines recognized that farmers needed buyers to
provide a bundle of inputs—such as fertilizer,
improved seed varieties, agronomic advice, and
the necessary financing to acquire everything
at the beginning of the planting season—to
produce the quantity and quality they wanted
to purchase. The motivation of this “contract
farming,” the most common of the value-chain
finance approaches, was not necessarily to
promote a more inclusive financial system, nor
to reach more remote or less wealthy farmers,
but to finance one specific agricultural output
to secure the needed raw materials or export
crops. Like other forms of value-chain finance—
including forward contracts, warehouse receipts,
input supplier and trader credit, factoring, and
forfaiting—the motivation is to facilitate a
transaction, a narrow, but entirely valid goal.
Using the segmentation framework in this analysis,
value-chain finance tends to be largely irrelevant to
noncommercial smallholders. In contract farming
arrangements for high-value export crops, they
would require extensive (and costly) support to
meet the required quality standards. The large
number of very small-scale farmers generating
very small quantities of outputs would also present
significant challenges and costs in coordinating,
aggregating, and transporting their production for
export or processing, even when working through
aggregators (who would then need to assume
these responsibilities and costs).
For commercial smallholders in loose value
chains, some forms of value chain finance
such as warehouse receipts could offer limited
opportunities, if the volumes they wanted to
store would warrant the transportation and other
transaction costs. Contract farming, however, is
usually not feasible with this segment. Commercial
smallholders in loose value chains tend to focus
on common, undifferentiated staple crops that
are sold in a wide variety of markets. Many
alternative buyers are present (as is the option
of home consumption), which can result in side-
selling: when farmers agree to sell to one buyer
but then later choose to sell to a different buyer.
Side-selling is a choice largely driven by the need
for quick cash in hand, even if at a lower price
than agreed with the intended buyer. This creates
disruptions in supply for buyers and agricultural
processors and can lead to an understandable
lack of interest in working with smallholders at this
level of production, especially when the needed
supply of staple crops can be purchased relatively
easily in informal markets and there is no need to
cultivate a loyal supplier base of farmers.
Commercial smallholders in tight value chains,
however, are the natural targets for highly
structured value chain finance approaches, as they
have the capacity and resources to grow high-value
crops. These outputs are not consumed at home
or sold as readily or even at all in local markets,
due to their (1) structured sale by a government-
managed marketing board (e.g., commodities such
as coffee and cacao), though few of these remain;
(2) need for further processing (e.g., cotton); and/
or, (3) specific characteristics that differ from local
tastes and preferences (e.g., processing potatoes
grown for potato chips have a higher dry matter
content and less sugar than table potatoes, making
them less flavorful and less likely to be sold for
everyday consumption). These characteristics
make side-selling for these crops significantly
less likely, which creates powerful incentives for
buyers to develop longer-term relationships with
producers.
Value-chain finance approaches such as contract
farming can serve an important role in the financial

19
portfolio of commercial smallholders in tight
value chains and achieve notable results—for
one very specific agricultural activity. As would
be expected, they are not engineered to address
the much wider range of household goals and
financial needs outlined above. These tools do not
mobilize savings, open access to other forms or
uses of credit, reduce nonagricultural household
risks, or facilitate money transfers.19 While value-
chain financing has an important role, it is a narrow
one, and many other financial tools are needed to
achieve the wide range of household objectives in
these households.
In addition, the presence of contract farming in a
portfolio of financial services alters a household’s
overall risk profile. While contract farming can
mitigate some risks and even has positive spillover
effects on other agricultural activities,20 it also
presents some important challenges. First, it can
be difficult to tease apart the various elements
of a contract farming bundle and evaluate their
individual price. The discrete costs of inputs,
transportation, and credit are often unclear and
cannot be compared to the standard market prices
to evaluate the overall value of the arrangement.
Second, power between buyers and farmers is
usually uneven, and farmers can be exploited unless
they are well-organized, prepared to negotiate, and
have a certain level of business acumen. Third, and
most important, unexpected and uncontrollable
changes in conditions—weather shocks, illnesses,
pest outbreaks, labor shortages, transportation
delays—can prevent farmers from meeting the very
precise quality and quantity terms of the contracts,
and they would not get paid. Finding an alternative
buyer may be impossible, even at a lower price,
due to the specificities of the crop. Thus, with some
risks mitigated and others intensified, commercial
smallholders in tight value chains have a qualitatively
different risk profile than the other two segments.
e. Selected opportunities: Products, delivery channels, and provider business models
Responding to the gaps between the demand
from smallholder households and the supply from
financial service providers outlined above, there are
some promising opportunities that could improve
the financial portfolios of smallholder families. While
further analysis and experimentation are needed
to better understand what agricultural households
find useful in managing their financial lives, the
following examples of products, delivery channels,
and provider business models could suggest future
directions relevant to the agricultural activities of
the three segments identified in this paper.
In terms of products, commitment savings
accounts modify standard savings accounts in
simple, but very practical ways by limiting their
accessibility and targeting their use. For example,
the Save, Earn, Enjoy Deposits (SEED) accounts
at Green Bank of Caraga, a rural bank in the
Philippines, allow savers to restrict access to their
own deposits until they reach a savings goal of
their choice (e.g., target amount, specific date).21
In agricultural households, commitment savings
products can be used to set aside end-of-season
profits to pay for the next season’s input expenses.
Opportunity International Bank in Malawi offers
tobacco farmers commitment savings accounts to
set aside profits from one harvest to fund the inputs
(primarily fertilizer) for the next planting season.22
Restricted savings products allow farmers to use
their own money to finance planting costs, thereby
avoiding the interest expense and financial burden
of a loan, as well as the transaction costs of engaging
with financial service providers, input suppliers,
and/or loan officers. Commitment savings accounts
are also easy for clients to understand, and they
19 There are exceptions in which in-kind credit programs for cash crops facilitate finance for another agricultural activity (e.g., some rural bank lenders in Mali have used cotton contracts as security in lending for inputs related to noncotton crops, see Tefft [2010]), but these remain uncommon and are still limited, relative to the breadth of household objectives.
20 The positive spillover effects of contract farming on other noncontract crops, discussed in da Silva (2005), includes, for example, when the agronomic advice in the production bundle for the cash crop is also applicable to other crops (e.g., techniques to prevent soil erosion) or when the by-products of the cash crop can be used to benefit other crops (e.g., poultry manure as a soil enhancement, sugar beet leaves as animal feed).
21 See Ashraf, Karlan, and Yin (2006).22 See Brune, Giné, Goldberg, and Yang (2010).
20
present a secure form of savings that cannot spoil,
perish, or be stolen, unlike crops and livestock,
and that is not vulnerable to demands from family
(including spouses) and friends. There is also scope
to tie additional features and services to these
accounts, such as linkages to points of payment and
direct deposit service. Payments from buyers could
be deposited directly into the commitment savings
account, with any amount over a level determined
by the farmer spilling over into a standard savings
account or a mobile money account. The size and
infrequency of these transactions could also be
profitable for financial service providers, especially
those that have agency relationships with retailers
or postal systems and that reach smaller, more
remote towns and villages.
As a delivery channel, mobile phones are a
powerful tool to reach vast numbers of clients
with a range of information and simple financial
services at lower cost. In agriculture, more and
more services are delivered via mobile phone.
Applications such as iCow and Farmpal (Wakoba
2012) direct specific, timely information on
agricultural production methods to farmers through
their mobile phone. The CocoaLink program (http://
worldcocoafoundation.org/cocoalink)—initiated
by the Ghana Cocoa Board, Hershey Company,
and the World Cocoa Foundation—reaches cocoa
farmers with free voice and SMS messages about
improved farm practices, crop disease prevention,
post-harvest handling, and marketing. Growers can
also interact with the service to get answers to
specific questions about cocoa farming (Reuters
2012). Moving beyond one-to-one communication,
M-Farm (http://mfarm.co.ke/marketplace) is an
Internet- and SMS-based service in Kenya that
allows farmers to aggregate; it publishes wholesale
price information on 42 crops and provides a
platform for smallholders to collectively sell
crops and buy inputs, thereby lowering costs and
accessing new markets (Pisani 2011).
More financial transactions in agriculture are
taking place via mobile phone as well. In Kenya,
farmers can pay premiums and collect payouts
from weather-based index insurance policies sold
by UAP Insurance and the Syngenta Foundation,
and can make “mobile layaway” payments for
Kickstart irrigation pumps through M-PESA, the
mobile phone-based financial service (Mwangi
2012). MACE Foods, which manufactures and
ships dried horticultural products to Europe, pays
all its employees and farmer suppliers in Kenya
through M-PESA. Making its payments through
the mobile network has reduced fraud, theft, and
administrative fees and has allowed it to track
key statistical information about the farmers they
work with (USAID 2012). In Zambia, Dunavant, a
large cotton ginning company that finances and
buys cotton from smallholders, uses a mobile
payment system designed and piloted by Mobile
Transactions Zambia Limited, with the support
of USAID, to track and pay some of its farmers.
This has reduced the time it takes to disburse
payments, decreased side-selling, and allowed it
to reward the best producers (USAID 2010a; USAID
2010b). These combinations of information and
financial services, delivered through what is now
a common household tool, can play a unique role
in a household’s financial portfolio and overall
livelihood strategy.
Finally, as a provider business model, the successful
expansion of MFIs into rural and agricultural
areas is blending the most promising features of
traditional microfinance, contemporary agricultural
finance, and standard financial services such as
leasing. A number of common concepts underpin
the approach, such as assessing a potential
borrower’s ability to repay based on their overall
household cash flows and not the potential
success of one specific investment, delinking loan
repayment from loan use, and enforcing repayment.
Character-based lending techniques, as well as
agricultural criteria that consider the feasibility of
the proposed farming activity, are used to evaluate
potential borrowers and set loan terms. Loan
portfolios are also highly diversified, avoiding the
concentration of risk in any sole region, market,
crop, or livestock activity. PRODEM in Bolivia, for
example, lends only to agricultural households that
have additional off-farm income and that farm at
least two crops (Christen and Pearce 2005). Most
institutions limit their total exposure to agriculture
to no more than one-third of their total lending
portfolio and may also protect their loan portfolio
with credit insurance, which covers the repayment

21
of an outstanding loan in case of default (Christen
and Pearce 2005).
MFIs build their capacity in agricultural micro-
finance by engaging local expertise in agriculture,
either by training credit officers on the basics
of the agricultural cycle or building credit
teams that combine experts in crop science
and animal husbandry with lending specialists.
This helps create a sound portfolio of lending
and contributes to the development of other
complementary financial services. In Uganda,
Centenary Rural Development Bank trained loan
officers in agriculture and agribusiness to develop
their understanding of farming as a business and
promote better engagement with and monitoring
of agricultural households they served, and in
Thailand BAAC employs specialized agricultural
credit staff throughout its branch network (Jessop
et al. 2012).
Overall, for financial service providers in increasingly
competitive markets, the business case to expand
their products to smallholder households—serving
both their general household needs as well as
their agricultural ones—is getting stronger. The
estimated 500 million smallholder farmers in low-
and middle-income countries, arguably the largest
single group of financially underserved people
in the world, would find such services highly
relevant.
4. Conclusions
In the financial portfolios of agricultural households,
both general finance products and agricultural
finance products play a role in meeting their
overall objectives. General finance can cover
most needs, including some related to everyday
agricultural production. There seem to be relatively
few instances—though important ones—in which
dedicated financial products would be needed
to address the particular risks and cash flows of
agriculture:
• When agricultural households are relatively more
dependent on farming for their total income and
therefore face more extreme cyclical liquidity
management problems.
• When larger investments over longer terms are
needed.
• When the crop is relatively riskier.
• When production must be restarted following a
catastrophic harvest.
From this perspective, financial service providers
that specialize in understanding total household
income flows could play a vital role in providing
a wide spectrum of financial products to farming
households. Financial service providers, such as
MFIs, that are willing to develop some expertise
in agriculture and that more closely identify the
specific needs of farming households could play a
pivotal role in facilitating a household’s agricultural
activities, as well as its other, more general financial
goals. It may ultimately be more feasible for MFIs to
learn about cash-flow cycles related to agricultural
production than it would be for actors in the value
chain to learn about nonfarm-related household
incomes or to offer added savings opportunities
or other financial services outside their area of
expertise or beyond their natural interest.
Overall, it may be the case that most farming
families need a portfolio of general finance all the
time, and specific agricultural finance only as they
engage more heavily in higher-value crops. In most
cases, if they are growing staple crops for sale into
loosely organized value chains, loans whose basic
terms and conditions have been tailored to the
agricultural cycle would be needed, and not much
more. As their production includes more and more
higher-value crops for sale on contract or other
linked arrangements through tight value chains,
their need for specialized financial tools would
increase, and most of the financial tools needed
for their agricultural activities would be embedded
in the value chain itself.
In this segmentation framework, most value-chain
finance instruments are relevant only to commercial
smallholders in tight value chains. Contract farming,
for example, can be a useful, even fundamental,
complement to their overall portfolio of financial
products. But for the agricultural activities of
noncommercial smallholders and commercial
smallholders in loosely organized value chains—
which together represent the vast majority of poor,

22
farming households—value-chain finance tools are
of limited utility, barring meaningful reductions in
transaction costs and significant support for their
“graduation” into more profitable agricultural
activities.
Efforts to move at least some portion of
farmers’ incomes into higher-value production
are important, and the presence of financing
mechanisms to support those higher-risk/higher-
return crops is vital. But access to finance is still
only a necessary—not sufficient—condition for
improvements in agricultural production. As with
every development challenge, the overall picture is
complex and characterized by several interlinking
elements. Parallel improvements are also needed
in market infrastructure; farmer organizations and
other intermediaries; input suppliers; and extension
organizations, research bodies, and other sources
of innovation and information. Looking ahead, to
meet the demand for financial products specific to
smallholder agriculture, more information about
farming families and their agricultural activities
is needed. To improve supply, we need to more
precisely define demand, and better understand
how agricultural households differ, what is working
and what is not in agricultural finance, and why that
is. Refining the broad segmentation of agricultural
households presented here, as well as encouraging
increased transparency of the products and service
providers already reaching them, are important
steps toward answering these fundamental market
questions. Illuminating the financial lives of these
families could also help align general forms of
finance with products tailored to their agricultural
activities, and add greater value to the financial
portfolios of the world’s 500 million smallholder
households.
23
Annex 1. Estimating the Size of the Three Segments
Estimates place the number of smallholder farms
worldwide between 400 million and 500 million
and the total number of people living in these
households between 1.5 billion and 2.5 billion.23
For simplicity, this paper uses the estimates that
there are 500 million smallholders worldwide and
2.5 billion total people living in these households.
Within the segmentation framework presented
here, an estimate of the population of each segment
has been derived. Since no easily applicable global
data exist, the analysis is guided by the relevant
literature. As a first step, the estimate of the number
of commercial smallholders in tight value chains was
based on the findings in the World Bank RuralStruc
data, which indicated that 7 percent of farmers in
its sampled countries had production contracts with
buyers (IFAD 2011b). Applied to the total of 500
million smallholders, this indicates that roughly 35
million smallholders would fall into this segment.24
The next step was to differentiate between
noncommercial smallholders and commercial
smallholders in loose value chains, which is not
straightforward. Income measures alone are
problematic, as discussed above, and no global
datasets distinguish among the various forms of
subsistence or smallholder farming. As such, until
more precise data are available, this paper refers
to Seville, Buxton, and Vorley (2011) and Jayne,
Mather, and Mghenyi (2010) and estimates that
60 percent of smallholders could be considered
subsistence farmers, as they grow primarily staple
crops, buy in food to supplement what they grow,
and only occasionally sell surplus production into
markets. Thus an estimated 300 million farmers
would be considered in the noncommercial
smallholder segment. By deduction, therefore,
165 million people would then be in the segment
of commercial smallholders in loose value chains.
Then, to estimate the total population in these
segments of smallholder households, literature on
the average household size in low- and middle-
income countries was consulted. Conway (2012)
estimated the size of smallholder farming families
to be five. Similarly Bongaarts (2001) found that
the average size of the household in developing
countries ranged from 4.8 to 5.6 people (averaging
5.2 people per household across regions) and
showed little regional variation. Thus, for the
sake of simplicity, the estimate of five people per
smallholder household is used in this paper, which
results in 1.5 billion people in noncommercial
smallholder households, 825 million in commercial
smallholder in loose value chain households, and
175 million people in commercial smallholder
in tight value chain households. In total, these
households account for roughly 2.5 billion people,
or over 35 percent of the world’s population.
Clearly these are only estimates and are intended
largely to give a sense of the relative size of each
segment and start a conversation about how
agricultural households can be better differentiated
and understood. As more specific data become
available, they can be recalculated. Ideally, to
clearly define market segments and precisely
calculate their population size, more work is
needed at the local and regional level.
23 See Conway (2012); Hazell (2011); Hazel, Poulton, Wiggins, and Dorward (2007); IFAD (2011c); Nagayets (2005); and World Bank (2007).
24 The World Bank coordinates a research effort on the “Structural Dimensions of Liberalisation in Agriculture and Rural Development” (i.e., RuralStruc) jointly with the French Cooperation and the International Fund for Agricultural Development. It focuses on seven countries in various stages of structural transformation and economic integration: Kenya, Madagascar, Mali, Mexico, Morocco, Nicaragua, and Senegal. For more information, see http://web.worldbank.org/WBSITE/EXTERNAL/COUNTRIES/AFRICAEXT/0,,contentMDK:21079721~pagePK:146736~piPK:146830~theSitePK:258644,00.html

24
References
Adams, Dale W., and J. D. Von Pischke. 1980.
“Fungibility and the Design and Evaluation of
Agricultural Credit Projects.” American Journal of
Agricultural Economics, v. 62, no. 4: 719–26.
Adams, Dale W., Douglas H. Graham, and
J. D. Von Pischke, eds. 1984. Undermining
Rural Development with Cheap Credit. Boulder,
Colorado: Westview Press.
Anríquez, Gustavo, and Genny Bonomi. 2007.
“Long-Term Farming Trends: An Inquiry Using
Agricultural Censuses.” Rome: Food and Agriculture
Organization of the United Nations. ftp://ftp.fao.
org/docrep/fao/010/ah856e/ah856e.pdf
Arnfield, Robin. 2012. “Haiti Leads in Mobile
Payments.” Partners in Prepaid. https://www.
partnersinprepaid.com/topics/art icles/hait i-
leads-in-mobile-payments.html. Accessed 1 June
2012.
Ashraf, Nava, Dean Karlan, and Wesley Yin. 2006.
“Tying Odysseus to the Mast: Evidence from a
Commitment Savings Product in the Philippines.”
The Quarterly Journal of Economics 121(2): 635–72.
http://karlan.yale.edu/p/SEED.pdf
Barrett, Christopher B. 2010. “Smallholder Market
Participation: Concepts and Evidence from Eastern
and Southern Africa.”In Alexander Sarris and Jamie
Morrison, eds. Food Security in Africa: Market
and Trade Policy for Staple Foods in Eastern and
Southern Africa. Rome: United Nations Food and
Agriculture Organization, pp. 41–76.
Bongaarts, John. 2001. “Household Size and
Composition in the Developing World.” New York:
Population Council. http://www.popcouncil.us/
pdfs/wp/144.pdf
Brune, Lasse, Xavier Giné, Jessica Goldberg,
and Dean Yang. 2011. “Commitments to
Save: A Field Experiment in Rural Malawi.”
World Bank Policy Research Working Paper,
No. 5748. Washington, D.C.: World Bank.
h t tp : / /www-wds .wor ldbank .o rg /ex te rna l /
defau l t /WDSContentServer/ IW3P/ IB/2011/
08/02/000158349_20110802154804/Rendered/
PDF/WPS5748.pdf
Christen, Robert Peck, and Douglas Pearce.
2005. “Managing Risks and Designing Products
for Agricultural Microfinance: Features of an
Emerging Model.” Washington, D.C., and Rome:
CGAP and International Fund for Agricultural
Development. http://www.ifad.org/ruralfinance/
pub/risks.pdf
Christiaensen, L., L. Demery, and J. Kuhl. 2010. “The
(Evolving) Role of Agriculture in Poverty Reduction:
An Empirical Perspective.” Working Paper 2010/36.
Helsinki: United Nations University—World Institute
for Development Economics Research. http://www.
wider.unu.edu/publications/working-papers/2010/
en_GB/wp2010–36/
CocoaLink Programme. Accessed 19 February
2013. http://worldcocoafoundation.org/cocoalink/
Collins, Daryl, Jonthan Morduch, Stuart Rutherford,
and Orlanda Ruthven. 2009. Portfolios of the Poor.
Princeton, N.J.: Princeton University Press.
Conway, Gordon. 2012. One Billion Hungry:
Can We Feed the World? Ithaca, N.Y.: Cornell
University. http://www.canwefeedtheworld.org/
da Silva, Carlos Arthur B. 2005. “The Growing
Role of Contract Farming in Agri-Food Systems
Development: Drivers, Theory, and Practice.”
Rome: Food and Agriculture Organization of the
United Nations. http://www.fao.org/fileadmin/
user_upload/ags/publications/AGSF_WD_9.pdf
Davis, Benjamin, Paul Winters, Gero Carletto,
Katia Covarrubias, Esteban J. Quinones, Alberto
Zezza, Kostas Stamoulis, Carlo Azzarri, and Stefania
DiGiuseppe. 2010. “A Cross-Country Comparison
of Rural Income Generating Activities.” World
Development 38 (1): 48–63. http://www.fao.org/
fileadmin/user_upload/riga/pdf/cross_country_
comparison_2010.pdf

25
Dercon, S., and J. S. Shapiro. 2007. “Moving on,
Staying behind, Getting Lost: Lessons on Poverty
Mobility from Longitudinal Data.” In D. Narayan
and P. Petesch, eds. Moving out of Poverty: Cross
Disciplinary Perspectives on Mobility. Washington,
D.C., and New York: World Bank and Palgrave
Macmillan.
DFID (Department for International Development).
2005. “Growth and Poverty Reduction: The Role
of Agriculture.” DFID Policy Paper. London:
DFID. http://dfid-agriculture-consultation.nri.org/
launchpapers/roleofagriculture.pdf
Economist, The. 2011. “Small Wonder: A New
Model of Microfinance for the Very Poor Is
Spreading.” 10 December. http://www.economist.
com/node/21541429
FAO (Food and Agriculture Organisation of the
United Nations). 2002. “Reducing Poverty and
Hunger: The Critical Role of Financing for Food,
Agriculture, and Rural Development.” Paper
prepared for the International Conference of
Financing for Development in Monterrey, Mexico,
18–22 March. Rome: FAO. ftp://ftp.fao.org/
docrep/fao/003/Y6265E/Y6265E.pdf
———. 2011. “Women in Agriculture: Closing
the Gender Gap for Development.” Rome:
FAO. http://www.fao.org/docrep/013/i2050e/
i2050e.pdf
Faz, Xavier, and Paul Breloff. 2012. “A Structured
Approach to Understanding the Financial Service
Needs of the Poor in Mexico.” Washington, D.C.:
CGAP. http://www.cgap.org/gm/document-1.9.
57615/Brief_MexicoSegmentation.pdf
Gallup, J., S. Radelet, and A. Warner. 1997.
“Economic Growth and the Income of the
Poor.” CAER II Discussion Paper No. 36.
Boston: Harvard Institute for International
Development.
GIZ (Gesellschaft für Internationale Zusammenarbeit).
2011. “Agricultural Finance: Trends, Issues, and
Challenges.” Eschborn: GIZ.
Haggblade, Steven, Peter B. R. Hazell, and
Wilberforce Kisamba-Mugerwa. 2010. “Implications
for the Future.” In Steven Haggblade and Peter
B.R. Hazell, eds. Successes in African Agriculture:
Lessons for the Future. Baltimore: The Johns Hopkins
University Press, pp. 349–72.
Hansen, Angela. 2012. Dalberg Global Development
Advisors. Personal communication on 16 July.
Hansen, Angela, Thomas Carroll, Adam Bradlow,
and Naveed Ahmad. 2012. ”Knowing Your
Customer: Segmentation for Agriculture.”
In Fund This, Not That: Ideas for Improving
Investments in Global Development. A Dalberg
Compendium. Washington, D.C.: Dalberg
Consulting. http://www.dalberg.com/documents/
FTNT-Final.pdf
Hazell, Peter. 2011. “Five Big Questions about
Five Hundred Million Small Farms.” Presented
at the IFAD Conference on New Directions for
Smallholder Agriculture, Rome, 24–25 January.
http://www.ifad.org/events/agriculture/doc/
papers/hazell.pdf
Hazell, Peter, Colin Poulton, Steve Wiggins, and
Andrew Dorward. 2007. “The Future of Small Farms
for Poverty Reduction and Growth.” Washington,
D.C.: International Food Policy Research
Institute. http://www.ifpri.org/sites/default/files/
publications/vp42.pdf
iCow. 2012. Accessed 23 August. http://www.icow.
co.ke/
IFAD (International Fund for Agricultural
Development). 2011a. “Livestock and Rural
Finance.” Rome: IFAD. http://www.ifad.org/lrkm/
factsheet/rf.pdf
———. 2011b. “Rural Poverty Report 2011.” Rome:
IFAD. http://www.ifad.org/rpr2011/report/e/print_
rpr2011.pdf
———. 2011c. “IFAD Conference on New
Directions for Smallholder Agriculture: Introduction
and Conference Overview.” Accessed 15 July

26
2012. http://www.ifad.org/events/agriculture/
background.htm#1
IFC (International Finance Corporation). 2012.
“Innovative Agricultural SME Finance Models.”
Washington D.C.: IFC.
———. 2011. “Scaling Up Access to Finance
for Agricultural SMEs: Policy Review and
Recommendations.” Washington D.C.: IFC. http://
www.ifc.org/ifcext/globalfm.nsf/AttachmentsByTitle/
G20_Agrifinance_Report/$FILE/G20_Agrifinance_
Report.pdf
Jaleta, Moti, Berhanu Gebremedhin, and Dirk
Hoekstra. 2009. “Smallholder Commercialization:
Processes, Determinants and Impact.” In Improving
Productivity and Market Success of Ethiopian Farmers
Improving Market Opportunities. Discussion Paper
No. 18. Addis Abeba, Ethiopia: International Livestock
Research Institute. http://edu.care.org/Foundational
R e s e a r c h / S m a l l h o l d e r C o m m e r c i a l i z a t i o n
Processes.pdf
Jayne, T. S., David Mather, and Elliot Mghenyi.
2010. “Principal Challenges Confronting
Smallholder Agriculture in Sub-Saharan Africa.”
World Development 38, no. 10: 1384–98.
Jessop, Reuben, Boubacar Diallo, Marjan Duursma,
Abdallah Mallek, Job Harms, and Bert van Manen.
2012. “Creating Access to Agricultural Finance:
Based on a Horizontal Study of Cambodia, Mali,
Senegal, Tanzania, Thailand, and Tunisia.” Prepared
for the Agence Française de Développement.
http://www.afd. f r/webdav/s i te/afd/shared/
PUBLICATIONS/RECHERCHE/Scientifiques/A-
savoir/14-VA-A-Savoir.pdf
Ledgerwood, Joanna, ed. 2013. The New
Microfinance Handbook: A Financial Market
Perspective. Washington, D.C.: World Bank.
Ligon, E., and E. Sadoulet. 2007. “Estimating
the Effects of Aggregate Agricultural Growth on
the Distribution of Expenditures.” Background
paper for the World Bank World Development
Report 2008: Agriculture for Development.
h t t p s : / / o p e n k n o w l e d g e . w o r l d b a n k . o r g /
bitstream/handle/10986/9096/WDR2008_0021.
pdf?sequence=1
M-Farm. Accessed 19 February 2013. http://mfarm.
co.ke/marketplace.
Meyer, Richard L. 2011. “Subsidies as an Instrument
in Agricultural Finance: A Review.” Washington,
D.C.: World Bank. http://siteresources.worldbank.
org/INTARD/Resources/Subsidies_as_Intrument_
AgFin.pdf
Miller, Calvin, and Linda M. Jones. 2010.
Agricultural Value Chain Finance: Tools and
Lessons. Rome: Practical Action Publishing and the
Food and Agriculture Organization of the United
Nations.
Morton, John F. 2007. “The Impact of Climate
Change on Smallholder and Subsistence
Agriculture.” Proceedings of the National
Academy of Sciences for the United States of
America, Vol. 104, No. 50. http://www.pnas.org/
content/104/50/19680.abstract
Mwangi, Peter Gakure. 2012. “How M-PESA Is
Transforming Kenya’s Economy.” http://www.
th inkm-pesa .com/2012/03/how-m-pesa- i s -
transforming-kenyas.html
Mwaura, Grace. 2012. “Enticing African Young
People to Agriculture Through Education, Training,
and Mentorship.” Prepared for the “Young People,
Farming and Food” conference, Accra, Ghana,
19–21 March. http://www.google.co.nz/url?sa=
t&rct=j&q=&esrc=s&source=web&cd=1&ved=
0CDAQFjAA&url=http%3A%2F%2Fwww.future-
agricultures.org%2Fpublications%2Fresearch-
and-analysis%2Fdoc_download%2F1500-enticing-
african-young-people-to-agriculture-through-
education-training-and-mentorship&ei=7IYlUZXH
H6GcjALf7IDABw&usg=AFQjCNFSzD4p4966n9
rCC3apMBf0TaFNIA&bvm=bv.42661473,d.cGE
and http://www.future-agricultures.org/ypff-
conference-resources/cat_view/1569-young-people-
farming-and-food-conference/1570-conference-
papers?start=20.

27
Nagarajan, Geetha, and Richard L. Meyer.
2005. “Rural Finance: Recent Advances and
Emerging Lessons, Debates, and Opportunities.”
Reformatted version of Working Paper No.
(AEDE-WP-0041-05). Columbus, Ohio: Department
of Agricultural, Environmental, and Development
Economics, Ohio State University. http://aede.
ag.ohio-state.edu/programs/RuralFinance/PDF%20
Docs/Publications%20List/Papers/05P01.pdf
Nagayets, Oksana. 2005. “Small Farms: Current
Status and Key Trends.” In The Future of Small Farms:
Proceedings of a Research Workshop, Wye College,
26–29 June. Washington, D.C.: International Food
Policy Research Institute, pp. 355–67. http://www.
ifpri.org/publication/future-small-farms
Ngigi, Margaret, Mohamed Abdelwahab Ahmed,
Simeon Ehui, and Yemesrach Assefa. 2010.
“Smallholder Dairying in Eastern Africa.” In Steven
Haggblade and Peter B. R. Hazell, eds. Successes
in African Agriculture: Lessons for the Future.
Baltimore: The Johns Hopkins University Press,
pp. 209–61.
OECD (Organization for Economic Cooperation and
Development). 2006. “Promoting Pro-Poor Growth:
Agriculture.” In Promoting Pro-Poor Growth: Policy
Guidance for Donors. Paris: OECD. http://www.
oecd.org/dataoecd/9/60/37922155.pdf
Orden, David, Maximo Torero, and Ashok
Gulati. 2004. “Agricultural Markets and the Rural
Poor.” Draft background paper for the Poverty
Reduction Network workshop, 5 March. http://
dfid-agriculture-consultation.nri.org/theme4/
keypapers/povnet_agricultural_markets_and_the_
rural_poor.pdf
Pisani, Francis. 2011. “M-Farm Lets Kenyan Farmers
Find Market Prices with SMS.” Posted 17 October
on Capgemini. Accessed 19 February 2013. http://
www.capgemini.com/winch5-blog/2011/10/mfarm-
lets-kenyan-farmers-find-market-prices-sms/
Rabo Development. 2011. “Stocktaking Study on
Agricultural Finance for the G20.” Utrecht: Rabo
Development.
Reuters. 2012. “Hershey’s CocoaLink Mobile
Phone Program Delivers 100,000 Farmer and
Family Messages During First Year in Ghana.”
Accessed 19 February 2013. http://www.reuters.
com/article/2012/08/06/idUS137424+06-Aug-
2012+BW20120806
Rutherford, Stuart. 2001. The Poor and Their
Money. Oxford: Oxford University Press.
Seville, Don, Abbi Buxton, and Bill Vorley. 2011.
“Under What Conditions Are Value Chains
Effective Tools for Pro-Poor Development?”
Sustainable Food Laboratory and International
Institute for Environment and Development.
http://www.linkingworlds.org/images/stories/PDF/
ValueChains_Paper_WEB.pdf
Staal, S. J., M. Owango, H. Muriuki, M. Kenyanjui,
B. Lukuyu, L. Njoroge, D. Njubi, I. Baltenweck, F.
Musembi, O. Bwana, K. Muriuki, G. Gichungu,
A. Omore, and W. Thorpe. 2001. “Dairy Systems
Characterisation of the Greater Nairobi Milk Shed.”
Smallholder Dairy Project Research Report. Nairobi:
International Livestock Research Institute. http://
cgspace.cgiar.org/bitstream/handle/10568/1590/
Staal%20et%20al-2001-Dairy%20systems%20
cha r%20grea te r%20Na i rob i%20mi l k shed .
pdf?sequence=1
Tadele, Getnet, and Asrat Ayalew. 2012. “’Last
Resort and Often Not an Option At All’: Youth,
Education, and Farming as Livelihood in Ethiopia.”
Prepared for the Young People, Farming and
Food conference, Accra, Ghana, 19–21 March.
http://www.google.co.nz/url?sa=t&rct=j&q=&e
src=s&source=web&cd=2&ved=0CDYQFjAB&
url=http%3A%2F%2Fwww.future-agricultures.
org%2Fypff -conference-resources%2Fdoc_
download%2F1503-last-resort-and-often-not-an-
option-at-all-youth-education-and-farming-as-
livelihood-in-ethiopia&ei=e4glUaSeNYGziQK4loG
ICw&usg=AFQjCNFo4-e6_sCBQb1fZ6Ha4MoGd_
uwWg&bvm=bv.42661473,d.cGE and http://
www.future-agricultures.org/ypff-conference-
r e s o u r c e s / c a t _ v i e w / 1 5 6 9 - y o u n g - p e o p l e -
farming-and-food-conference/1570-conference-
papers?start=10

28
Tefft, James. 2010. “Mali’s White Revolution:
Smallholder Cotton, 1960–2006.” In Steven
Haggblade and Peter B. R. Hazell, eds. Successes in
African Agriculture: Lessons for the Future. Baltimore:
The Johns Hopkins University Press, pp. 113–62.
Thirtle, Colin, Lin Lin, and Jennifer Piesse.
2003. “The Impact of Research-Led Agricultural
Productivity Growth on Poverty Reduction in Africa,
Asia, and Latin America.” World Development Vol.
31, No. 12, pp. 1959–75. ftp://gisweb.ciat.cgiar.
org/Agroecosystems/bfp_andes/WP1/Lit%20rev/
Poverty/Poverty%20General/The%20Impact%20
of%20Research-Led%20Agricultural.pdf
Torero, Maximo. 2011. “A Framework for Linking
Small Farmers to Markets.” Presented at the IFAD
Conference on New Directions for Smallholder
Agriculture, 24–25 January, Rome. http://www.ifad.
org/events/agriculture/doc/papers/torero.pdf
USAID (United States Agency for International
Development). 2010a. “FS Series #9: Enabling
Mobile Money Interventions.” Washington, D.C.:
USAID. http://egateg.usaid.gov/sites/default/
files/M_Banking_Primer.pdf
———. 2010b. “Using Mobile Money, Mobile
Banking to Enhance Agriculture in Africa.”
Washington, D.C.: USAID. http:// itac.
fhi360.org/Publications/facet-mobilemoney-
mobilebanking12-20-2010.pdf
———. 2011. “Rural and Agricultural Finance:
Taking Stock of Five Years of Innovations.”
Washington, D.C.: USAID. http://microlinks.kdid.
org/sites/microlinks/files/resource/files/Rural_
Agricultural_Finance_Innovations.pdf
———. 2012. “MACE Foods.” Washington, D.C.:
USAID. http://www.e-agriculture.org/sites/default/
files/uploads/media/Profile%20of%20Mace%20
Foods%27%20use%20of%20M-Pesa.pdf
Valdés, Alberto, William Foster, Gustavo Anriquez,
Carlo Azzarri, Katia Covarrubias, Benjamin Davis,
Stefania DiGiuseppe, Tim Essam, Tom Hertz,
Ana Paula de la O, Esteban Quinones, Kostas
Stamoulis, Paul Winters, and Alberto Zezza. 2009.
“A Profile of the Rural Poor.” Rome: Food and
Agriculture Organization of the United Nations.
http://www.fao.org/fileadmin/user_upload/riga/
pdf/ak423e00.pdf
von Braun, J. 2005. “Small-Scale Farmers in a
Liberalized Trade Environment.” In T. Huvio, J.
Kola, and T. Lundström, eds. Small-scale farmers
in Liberalised Trade Environment. Proceedings
of the seminar, Haikko, Finland, 18–19 October,
2004. Department of Economics and Management
Publications No. 38. Agricultural Policy. Helsinki:
University of Helsinki. http://www.fearp.usp.br/
fava/pdf/pdf247.pdf
Wakoba, Sam. 2012. “African Farmers Set for
Turnaround as Farmpal Promises Better Prospects.”
Accessed 23 August 2012. http://www.humanipo.
com/blog/192/African-farmers-set-for-turnaround-
as-FarmPal-promises-better-prospects
Winters, Paul, Benjamin Davis, Gero Carletto,
Katia Covarrbias, Esteban J. Quinones, Alberto Zezza,
Carlo Azzarri, and Kostas Stamoulis. 2009. “Assets,
Activities, and Rural Income Generation: Evidence
from a Multicountry Analysis.” World Development
37 (9): 1435–52. http://www.fao.org/fileadmin/user_
upload/riga/pdf/assets_activities_rural.pdf
White, Ben. 2012. “Agriculture and the Generation
Problem: Rural Youth, Employment and the Future
of Farming.” Prepared for the Young People,
Farming and Food conference, Accra, Ghana,
19–21 March. http://www.google.co.nz/url?sa=t
&rct=j&q=&esrc=s&source=web&cd=1&ved=0
CDAQFjAA&url=http%3A%2F%2Fwww.future-
agricultures.org%2Fcomponent%2Fdocman%2Fdoc_
download%2F1524-agriculture-and-the-generation-
problem-rura l -youth-employment-and-the-
future-of-farming&ei=VY0lUa7oOunSiwLy74Dg
AQ&usg=AFQjCNEDKKWrCGvRg1wW4LUIQc_
z3zkq_A&bvm=bv.42661473,d.cGE and http://www.
future-agricultures.org/ypff-conference-resources/
cat_view/1569-young-people-farming-and-food-
conference/1570-conference-papers
World Bank. 2007. “World Development
Report 2008—Agriculture for Development.”
Washington, D.C.: World Bank. http://siteresources.

29
worldbank.org/INTWDR2008/Resources/WDR_00_
book.pdf
———. 2010. “Urban and Rural Population Data.”
Washington, D.C.: World Bank. http://ddp-ext.worldbank.
org/ext/ddpreports/ViewSharedReport?REPORT_
ID=17838&REQUEST_TYPE=VIEW
———. 2012. “GAFSP: Improving Food Security for
the World’s Poor.” Washington, D.C.: World Bank.
Accessed 12 August 2012. http://web.worldbank.
org/WBSITE/EXTERNAL/TOPICS/EXTSDNET/0,,
contentMDK:23198127~menuPK:64885113~
pagePK:7278667~piPK:64911824~theSitePK:
5929282,00.html.


This Focus Note was researched and written by Robert Peck Christen, president of the Boulder Institute of Microfinance and professor of Practice at the Maxwell School of Syracuse University, and Jamie Anderson, independent consultant and former technical advisor for Rural Finance at IFAD. CGAP is grateful to USAID for its support for this research. The authors wish to thank Shari Berenbach and her staff (USAID), Renée Chao-Béroff (Centre International de Développement
et de Recherche), Michael Hamp (IFAD), Angela R. Hansen (Dalberg), Edward Heinemann (IFAD), Richard Meyer (Ohio State University), Panayotis Varangis (IFC), and Mark Wenner (IADB) for their valuable guidance and support throughout this research. This analysis was also strengthened by the insights and experience of many additional experts, including Jasmina Glisovic, Alexia Latortue, Kate McKee, Stephen Rasmussen, and Michael Tarazi of CGAP.
The suggested citation for this Focus Note is as follows:Christen, Robert Peck, and Jamie Anderson. 2013. “Segmentation of Smallholder Households: Meeting the Range of Financial Needs in Agricultural Families.” Focus Note 85. Washington, D.C.: CGAP, April.
Print: ISBN 978-1-62696-008-4 epub: ISBN 978-1-62696-010-7pdf: ISBN 978-1-62696-009-1 mobi: ISBN 978-1-62696-011-4
No. 85April 2013
Please share thisFocus Note with yourcolleagues or request
extra copies of thispaper or others in
this series.
CGAP welcomesyour comments on
this paper.
All CGAP publicationsare available on the
CGAP Web site atwww.cgap.org.
CGAP1818 H Street, NW
MSN P3-300Washington, DC
20433 USA
Tel: 202-473-9594Fax: 202-522-3744
Email:[email protected]
© CGAP, 2013
from the British peopleUKa