national survey and segmentation of smallholder households ... · segmentation of smallholder...
TRANSCRIPT
WORKING PAPER
National Survey and Segmentation of Smallholder Households in MozambiqueUnderstanding Their Demand for Financial, Agricultural, and Digital SolutionsMarch 2016

III
CONTENTS
A. INTRODUCTION AND KEY FINDINGS ...................................................1
B. ABOUT THE PROJECT ...........................................................................5
C. FINDINGS ............................................................................................10
1. Smallholder Household Dynamics: Who They Are ................................................102. Smallholder Household Dynamics: Income and Expenses .................................223. Risks and Mitigation ............................................................................................................324. Tools ...........................................................................................................................................405. Financial Inclusion ...............................................................................................................456. Tools and Financial Inclusion: Segmentation ...........................................................537. Desires and Aspirations .....................................................................................................76
ANNEX 1: METHODOLOGY AND DESIGN .................................................84
ANNEX 2: RANDOM FOREST .....................................................................89

1
National Survey and Segmentation of Smallholder Households in Mozambique
A. INTRODUCTION AND KEY FINDINGS
Introduction
Agriculture is the foundation of the economy in Mozambique. It contrib-utes 40 percent of the Gross National Product and 60 percent of export rev-enues; 80 percent of the population is involved in agricultural activities.1 Agricultural production is largely or-ganized in small, hand-cultivated units of land. Ninety-seven percent of pro-duction comes from 3.2 million sub-sistence farms, with an average size of 1.2 hectares.2 Smallholder farmers in Mozambique largely practice rain-fed agriculture and use traditional variet-ies of crops, low-intensity fertilizer, and minimal pesticides. Farming is largely done without mechanization and pro-ductivity of the land is typically low.
Mozambique is also a country that has invested in its financial sector, increasing access and use of more formal financial services to facilitate greater economic stability. Despite its ranking as one of the lowest per capita Gross Domestic Prod-uct countries in the world (180 out of 188 by the United Nations Development Programme’s index of human develop-ment) in 2014,3 Mozambique is also one of the fastest growing nations.
CGAP has been working to build an ev-idence base on the financial and agri-cultural lives of smallholder households and conducted Financial Diaries with 90 smallholder households in Nampula Province, Mozambique. Working close-ly with the Financial Sector Deepening Trust Mozambique (FSDMoç), CGAP also conducted a nationally representative household survey of smallholder house-holds between June and August 2015.
This survey sought to comprehensively map the many activities, interests, as-pirations, barriers, and pressures fac-ing smallholder households. The ques-tionnaire also explored nonagricultural household activities, financial practices and interests, as well as challenges and aspirations.
This working paper shares the findings, observations, and insights from the national survey of smallholder house-holds. It begins with an overview of the research approach, core program objectives, research questions, pre-liminary phases of development, and topics included in the questionnaire. It then profiles smallholder farmers in Mozambique, including their household demographics, farmographics, direc-tions of decision-making, how farmers self-identify and characterize their iden-tity, and what motivates them to do the work they do.
The report takes up how households manage their income and expenses, along with the issues they face that threaten income and often lead to financial instability. This paper then de-scribes financial inclusion in the small-holder sector, exploring household tools that are essential for financial in-clusion, including mobile phones and national identification documents, as well as adoption of financial products, awareness, barriers, and interests. The paper then outlines meaningful seg-ments of the smallholder population in Mozambique, mapping out groups of smallholder farmers that matter for fostering greater product adoption, and delving into their demand for various fi-nancial mechanisms. A full explanation
1 http://www.new-ag.info/en/country/profile.php?a=8552 Mozambique Agricultural Development Strategy Stimulating Smallholder Agricultural Growth, the World Bank, 23 February
2006.3 2015 Human Development Report, UNDP; http://hdr.undp.org/en/2015-report
2
National Survey and Segmentation of Smallholder Households in Mozambique
of the research methodology is included in Annex 1.
This document has three main goals:
1. Build the evidence base for those working in agricultural finance so that assumptions and/or isolated observations could be paired with known, reliable representative data about the population.
2. Connect readers with the unique realities of smallholder farmers in Mozambique that could otherwise be overlooked, oversimplified, or erroneously generalized from other smallholder farmer markets.
3. Catalyze conversations about “what next” for smallholder-farmer-centered strategies, products, and approaches that facilitate agriculture, as well as household finance.
The actual survey and full body of re-search will support a number of finan-cial and agricultural inquiries that arise within communities of practice, for both the near and long term.
Key findings
Smallholder farmers are passionate and committed to agriculture, navigating the many occupational realities that can threaten their daily life. They engage in agriculture, relying mostly on their own resources, with limited outside assis-tance. What little support they do solicit typically comes by way of family and friends, or other members of the com-munity. More formal entities, such as fi-nancial institutions, agricultural inputs providers, resellers, buyers, or other entities often a part of an agricultural value chain, play only a small part in the Mozambican smallholder ecosystem.
These and other key findings emerged from the comprehensive exploration into the lives of smallholder farming
households that sought to answer the following:
■■ What does the community of practice need to know or do to support small-holder farmer households build re-silient and productive livelihoods?
■■ How can financial mechanisms respond to the relevant needs and desires of smallholder households?
■■ What types of market strategies and approaches can cultivate uptake and use of financial mechanisms?
Important factors
Five fundamental characteristics of smallholder households can help the community of practice foster greater productivity and resiliency:
■■ Common farming practices char-acterize this population: The Mozambican smallholder farming sector is fairly homogenous. Agri-culture provides the main income stream into the household, and supports nearly all of the house-hold activities, but just barely. Fam-ilies consume what they grow, trade goods for other necessities, and sell their crops for income. One crop can be used in each of these ways, but even still, households often fall short of their monthly needs. Most of the households live at or below the pov-erty line, and many live in extreme poverty. They work hard, have big aspirations, and take pride in their accomplishments.
■■ There is promise with a new gen-eration of smallholder farmers: The smallholder farming communi-ty includes both tenured, seasoned, experienced farmers who have lived through both the pains and abun-dant yields that come with farming, as well as younger, newer farmers who bring with them more modern
3
National Survey and Segmentation of Smallholder Households in Mozambique
perspectives, vitality, and an ambi-tious mindset. Younger farmers are more educated, and some may con-sider leaving agriculture if a compel-ling alternative arises.
■■ The smallholder farming ecosys-tem is extremely informal and lacks financial and agricultural in-frastructure: Smallholders largely engage in agriculture without much connectivity to a value chain, or any formal suppliers. Involvement with buyers or resellers is often just as informal and in the context of loose value chains, meaning that the trans-actions happen without a contract in place. Farmers also have limited market access due to lack of trans-portation, and they know these con-straints mean they might not get the best market price for their goods.
■■ Exposure to any financial mecha-nism is limited: Not only do small-holder farmers operate without using formal financial services, such as bank accounts, mobile money, NBFIs, or microfinance institutions (MFIs), most are not even exposed to these institutions. The majority of small-holder farmers have never been in a bank and most are not aware of mo-bile money. They also lack the basic tools for digital financial services (DFS), such as mobile phones and identification documents. What’s more, smallholders often manage their household finances outside any informal channel. Very few rely on local, informal lending, savings cir-cles, or similar mechanisms.
■■ Risky practices run counter to fi-nancially sound desires: In prac-tice, smallholder households do not have savings, do not have access to funds in the event of an emergen-cy, and do not have insurance or any other way to mitigate risk. And their monthly expenses can outweigh their
monthly income. Their aspirations, however, reflect a financially astute, responsible, and even prosperous mindset. They want to save, they want to insure their activities, and they want to have more options for miti-gating risk. The appetite for financial security has not yet diminished due to lack of access and other realities.
Financial mechanisms
Perhaps the most important finding for identifying financial mechanisms that respond to the relevant needs and desires of smallholders comes out of understanding where and how small-holder farmers prioritize. While they are farmers at heart, and their profes-sion defines them, their focus is on their home. Smallholder farmers think about the homestead, home needs, and the family under their roof, and are driven by working toward a sustainable home.
To that end, they have the greatest appetite for two types of financial mech-anisms: those that help them afford agricultural inputs, such as seed and fertilizer, so they can grow the crops to sustain the homestead, and those that help them directly sustain their home. The latter can include mechanisms that help them improve the structure of their homes, afford school fees, or save money for future home needs.
Strategies
Four strategies emerge to cultivate uptake and use of relevant financial mechanisms:
■■ Equip smallholder households with mobile phones and identification cards, basic tools for financial in-clusion: Most smallholder households do not have their own mobile phone, a critical tool for digital finance. Digital finance is essential because brick-and-mortar institutions are too far from
4
National Survey and Segmentation of Smallholder Households in Mozambique
homes, and households lack adequate transportation. Phones are not only tools for transacting financially, they also are information channels for im-portant agricultural communications. Individuals within households also need to have national registration cards required to open accounts.
■■ Build meaningful awareness about financial mechanisms: Smallholder households generally do not know about mobile money, have not been inside a bank, and might not even be connected to an informal lending or savings circle. They need a ba-sic introduction to financial mecha-nisms followed by a meaningful value proposition.
■■ Pair immediate needs with long-term desires: The survey tested potential dual-mode products that combined both short- and long-term benefits to farmers. Loans that in-clude insurance, loans that include banking or savings accounts, mobile money accounts that include savings,
and similar bundled products can go a long way to appeal to the imme-diate needs and set the conditions for a desirable long-term practice. Further, farmers do not want to see their hard labor squandered due to bad weather or pests and, therefore, want access to insurance or even convenient and reliable information to avoid those risks.
■■ Think “economies of scale”: The vast majority of smallholder farmers can be characterized as “farming for sustenance.” The economic value for investors and providers is in both the size of the population and the lack of competition for the target audience’s attention.
Smallholder farmer households’ cir-cumstances and surrounding ecosystem might mean that they struggle day in and day out, live below the poverty line, and are tied into a rudimentary system. Their mindset, however, suggests com-mitment, diligence, and a desire for a prosperous future.
5
National Survey and Segmentation of Smallholder Households in Mozambique
B. ABOUT THE PROJECT
Working to build the evidence base on smallholder farming households, CGAP sought to explore in more detail the finan-cial and agricultural lives of smallholder families in Mozambique. This research project began with a comprehensive
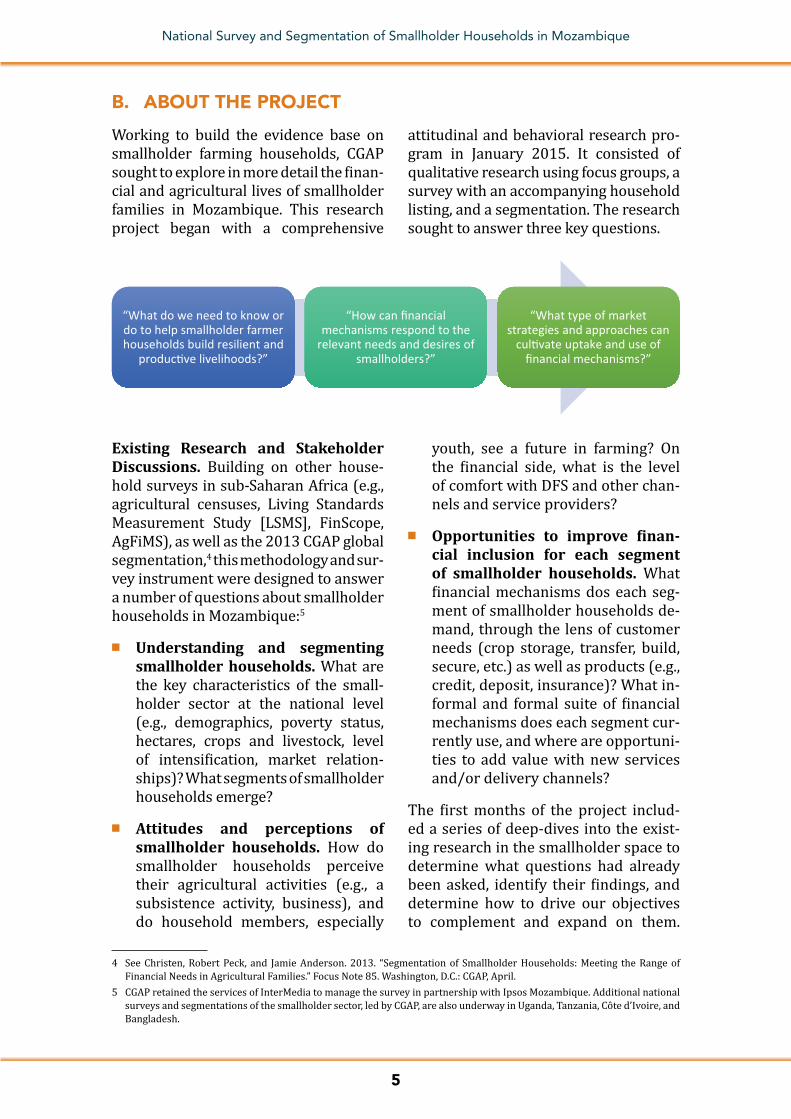
attitudinal and behavioral research pro-gram in January 2015. It consisted of qualitative research using focus groups, a survey with an accompanying household listing, and a segmentation. The research sought to answer three key questions.
“What do we need to know or do to help smallholder farmer households build resilient and
producve livelihoods?”
“How can financial mechanisms respond to the
relevant needs and desires of smallholders?”
“What type of market strategies and approaches can
culvate uptake and use of financial mechanisms?”
Existing Research and Stakeholder Discussions. Building on other house-hold surveys in sub-Saharan Africa (e.g., agricultural censuses, Living Standards Measurement Study [LSMS], FinScope, AgFiMS), as well as the 2013 CGAP global segmentation,4 this methodology and sur-vey instrument were designed to answer a number of questions about smallholder households in Mozambique:5
■■ Understanding and segmenting smallholder households. What are the key characteristics of the small-holder sector at the national level (e.g., demographics, poverty status, hectares, crops and livestock, level of intensification, market relation-ships)? What segments of smallholder households emerge?
■■ Attitudes and perceptions of smallholder households. How do smallholder households perceive their agricultural activities (e.g., a subsistence activity, business), and do household members, especially
youth, see a future in farming? On the financial side, what is the level of comfort with DFS and other chan-nels and service providers?
■■ Opportunities to improve finan-cial inclusion for each segment of smallholder households. What financial mechanisms dos each seg-ment of smallholder households de-mand, through the lens of customer needs (crop storage, transfer, build, secure, etc.) as well as products (e.g., credit, deposit, insurance)? What in-formal and formal suite of financial mechanisms does each segment cur-rently use, and where are opportuni-ties to add value with new services and/or delivery channels?
The first months of the project includ-ed a series of deep-dives into the exist-ing research in the smallholder space to determine what questions had already been asked, identify their findings, and determine how to drive our objectives to complement and expand on them.
4 See Christen, Robert Peck, and Jamie Anderson. 2013. “Segmentation of Smallholder Households: Meeting the Range of Financial Needs in Agricultural Families.” Focus Note 85. Washington, D.C.: CGAP, April.
5 CGAP retained the services of InterMedia to manage the survey in partnership with Ipsos Mozambique. Additional national surveys and segmentations of the smallholder sector, led by CGAP, are also underway in Uganda, Tanzania, Côte d’Ivoire, and Bangladesh.

6
National Survey and Segmentation of Smallholder Households in Mozambique
Several sources were consulted in the process, including IFC, Dalberg, Finmark Trust, FSDMoç, AgFiMS, FinScope, FAO, INE Mozambique, IFAD, and the World Bank. The secondary research brought a series of questions that informed dis-cussions with stakeholders.
Given its central role in advancing fi-nancial inclusion in Mozambique, FSDMoç was a close partner for this research with smallholder households. This coordination was important to inform the CGAP research, and its re-sults will contribute to FSDMoç’s mar-ket research and developing strategy. Several additional stakeholders and organizations also contributed valu-able insights and considerations into the design of the research project as key informants, and also took part in an informal technical working group to review and guide the research. Some of these key organizations included African Development Bank, Banco Terra (BTM), Financial Sector Deep-ening Trust Tanzania, Innovation for Agriculture (INOVAGRO), Internation-al Capital Corporation (ICC), USAID, Vodacom Mozambique, Banco Opor-tunidade Moçambique, TechnoServe, Carteira Móvel, the Bill & Melinda Gates Foundation, as well as World
Bank Group colleagues in the Maputo office and the LSMS team.
The extensive secondary research and discussions with stakeholders identified a gap in information about the actual needs, desires, and perceptions of small-holder households. There seemed to be significant amounts of data and insight into the habits of smallholder house-holds in Mozambique that examined either their agricultural activities or tracked their financial lives, but nothing to date had taken a more comprehensive view of the household. This research project also sought to connect the agri-cultural data to the financial data to dis-sect the interactions and intersections between the two.
Identifying Target Group of Small-holder Households. Discussions with consultants and stakeholders in sub- Saharan Africa and extensive desk re-search6 concluded there is no clear agreement on the characteristics that define a smallholder, due in part to the heterogeneity of this client group. As a result of both of these lines of investiga-tion, a matrix was developed of each of the key criteria that could be used to dis-tinguish smallholder households from other households (see Table 1).
TABLE 1. Key criteria in defining smallholder households
Key Criteria Considerations
Market orientation Subsistence vs. market-oriented vs. hybrid
Landholding size Threshold
Labor input Family vs. hired
Income Shared income from farming, multiple sources
Farming system Technology, irrigation
Farm management responsibility Owner, influence over how to farm
Capacity Storage, management, administration
Legal aspects Formal vs. informal
Level of organization Member of group—producer, supply chain, service provider
6 Defining Smallholders: Suggestions for a RSB smallholder definitions; Roundtable on Sustainable Biomaterials; October 2013.

7
National Survey and Segmentation of Smallholder Households in Mozambique
The desk research also found a range of definitions of a smallholder house-hold across countries, reflecting the variations in their agricultural sectors. Some governments define smallhold-ers solely by their landholding size. The range differed greatly across Asian and African countries—from a maximum of 2.5 hectares in India up to a maximum 46 hectares in Malaysia. In Mozambique, research from the Instituto Nacional de Estatística Moçambique pointed to smaller average farm sizes, which fur-ther reinforced the justification of our target group. In Mozambique, the av-erage farm size ranged between one and two hectares,7 and approximately three-quarters of all agricultural hold-ings managed less than two hectares.
InterMedia proceeded to develop a high watermark for identifying small-holder households to be as inclusive as possible, without diluting or dis-torting the population representation. The identification measure used two key criteria—landholding size and livestock count—as the starting point for identify-ing the target group for sample selection.
A series of self-identifying perception questions was also asked to ensure that each smallholder household selected in the study viewed agriculture as a mean-ingful part of the household’s livelihood, income, and/or consumption.
Before the survey, a household listing exercise was conducted to identify po-tential households to include in the survey sample. The listing exercise tar-geted smallholder households with the criteria shown in Figure 2.
Listing Operation and Methodology. InterMedia worked very closely with the Instituto Nacional de Estatística Moçambique to conduct a household listing operation in randomly selected enumeration areas from 2 May to 16 June 2015 to construct a reliable sam-pling frame. The listing operation was implemented by Ipsos Mozambique, InterMedia’s local field partner.
Then, using a stratified, multi-stage sample,8 each region was classified into urban and rural areas based on the 2014 population census; the sample was selected independently in each urban
FIGURE 1. Size of agricultural holdings in Mozambique
34% 37% 25% 3%
Less than 1 ha 1-2 ha 2-5 ha 5 ha or more
7 Censo Agro-Pecuário: Resultados Definitivos; Mozambique Instituto Nacional de Estatística; 2009–2010.8 The methodology and design are detailed in Annex 1.
FIGURE 2. Listing criteria to identify relevant smallholder households
Household with up to 5 hectaresOR
Farmers who have less than:50 heads of ca�le; or
100 goats/sheep/pigs; or1,000 chickens
AND
Agriculture provides a meaningful contribu on to the household
livelihood, income, or consump on(self-iden fied)

8
National Survey and Segmentation of Smallholder Households in Mozambique
and rural stratum. The 212 enumeration areas (EAs) were randomly selected as primary sampling units with probabili-ty proportional to the number of house-holds in the EAs, and then 15 smallholder households were selected in each EA with equal probability, which yielded a total of 3,158 smallholder households in the sample.
Questionnaire Design. The question-naire design process began by using the secondary research and stakehold-er discussions as core inputs into the measurements to shape the survey instrument. This process also involved defining the end goal of the research by doing the following:
■■ Drawing from existing survey instruments.
■■ Considering the objectives and needs of the project.
■■ Accounting for stakeholder interests and feedback.
■■ Learning from the ongoing financial diaries in-country.9
■■ Building from a series of focus groups conducted early on in the study.
These foundations led to a framework for the survey instrument for sharing across stakeholders, and ensured the research captured all of the necessary elements of a smallholder household. The framework was built around the sections shown in Table 2.
Survey Organization. The questionnaire was divided into three parts to capture
TABLE 2. Framework for the smallholder questionnaire
Section DemographicsHousehold economics
Agricultural practices
Mobile phones
Financial services
Examples of topics covered
Relationship Income Land ownership
Use (own or borrow)
Formal institutions
Marital status Jobs Crops grown Types of phones
Less than formal institutions
Age Government payments
Livestock Barriers Informal financial service providers
School attendance Saving Value chain Habits Importance
Income Investing Market relationship
Products Borrowing
Decision-making Emergency planning
Water Products
Financial situation Risk mitigation
Labor
Progress out of Poverty Index (PPI)
Inputs
Storage
Coping
9 Financial diaries with smallholder households in Mozambique were conducted by Bankable Frontier Associates (BFA) on behalf of CGAP. This research was ongoing during the development and design of this research project.
9
National Survey and Segmentation of Smallholder Households in Mozambique
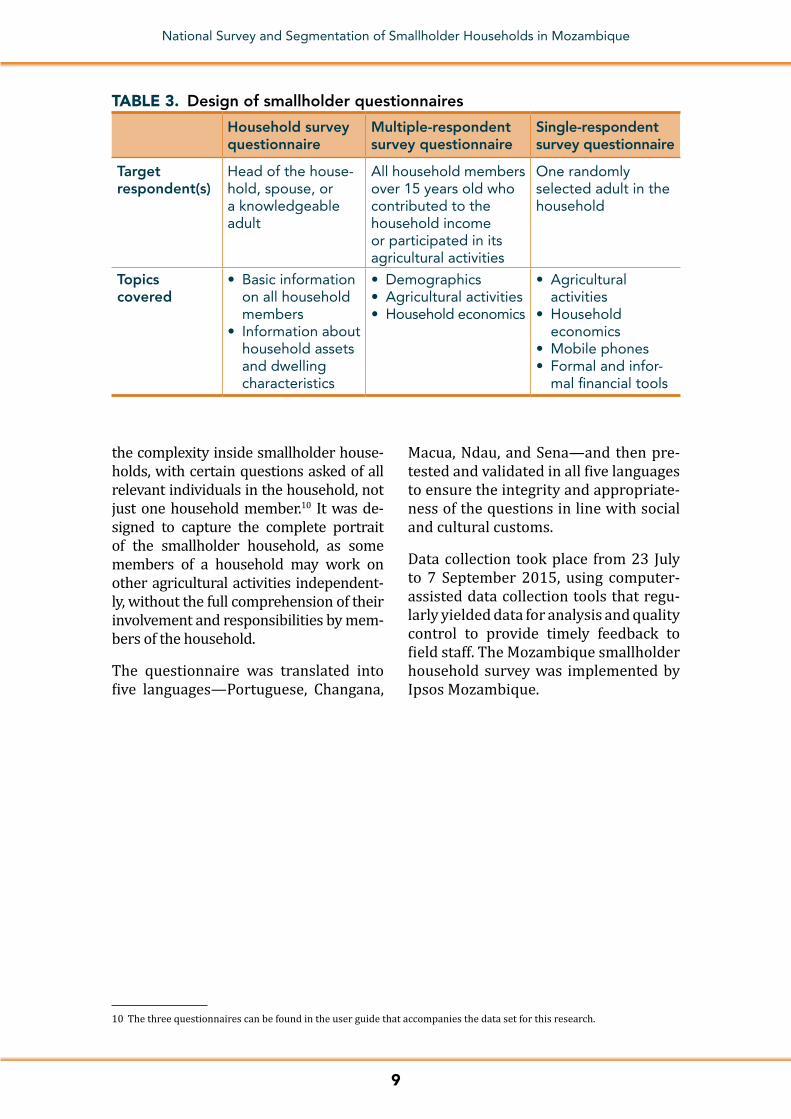
the complexity inside smallholder house-holds, with certain questions asked of all relevant individuals in the household, not just one household member.10 It was de-signed to capture the complete portrait of the smallholder household, as some members of a household may work on other agricultural activities independent-ly, without the full comprehension of their involvement and responsibilities by mem-bers of the household.
The questionnaire was translated into five languages—Portuguese, Changana,
Macua, Ndau, and Sena—and then pre-tested and validated in all five languages to ensure the integrity and appropriate-ness of the questions in line with social and cultural customs.
Data collection took place from 23 July to 7 September 2015, using computer- assisted data collection tools that regu-larly yielded data for analysis and quality control to provide timely feedback to field staff. The Mozambique smallholder household survey was implemented by Ipsos Mozambique.
TABLE 3. Design of smallholder questionnaires
Household survey questionnaire
Multiple-respondent survey questionnaire
Single-respondent survey questionnaire
Target respondent(s)
Head of the house-hold, spouse, or a knowledgeable adult
All household members over 15 years old who contributed to the household income or participated in its agricultural activities
One randomly selected adult in the household
Topics covered
• Basic information on all household members
• Information about household assets and dwelling characteristics
• Demographics• Agricultural activities• Household economics
• Agricultural activities
• Household economics
• Mobile phones• Formal and infor-
mal financial tools
10 The three questionnaires can be found in the user guide that accompanies the data set for this research.
10
National Survey and Segmentation of Smallholder Households in Mozambique
C. FINDINGS11
1. SMALLHOLDER HOUSEHOLD DYNAMICS: WHO THEY ARE
Smallholder farmer households are typically led by low-income-earning men who lack formal education and maintain a positive outlook on the future despite their dire financial realities.
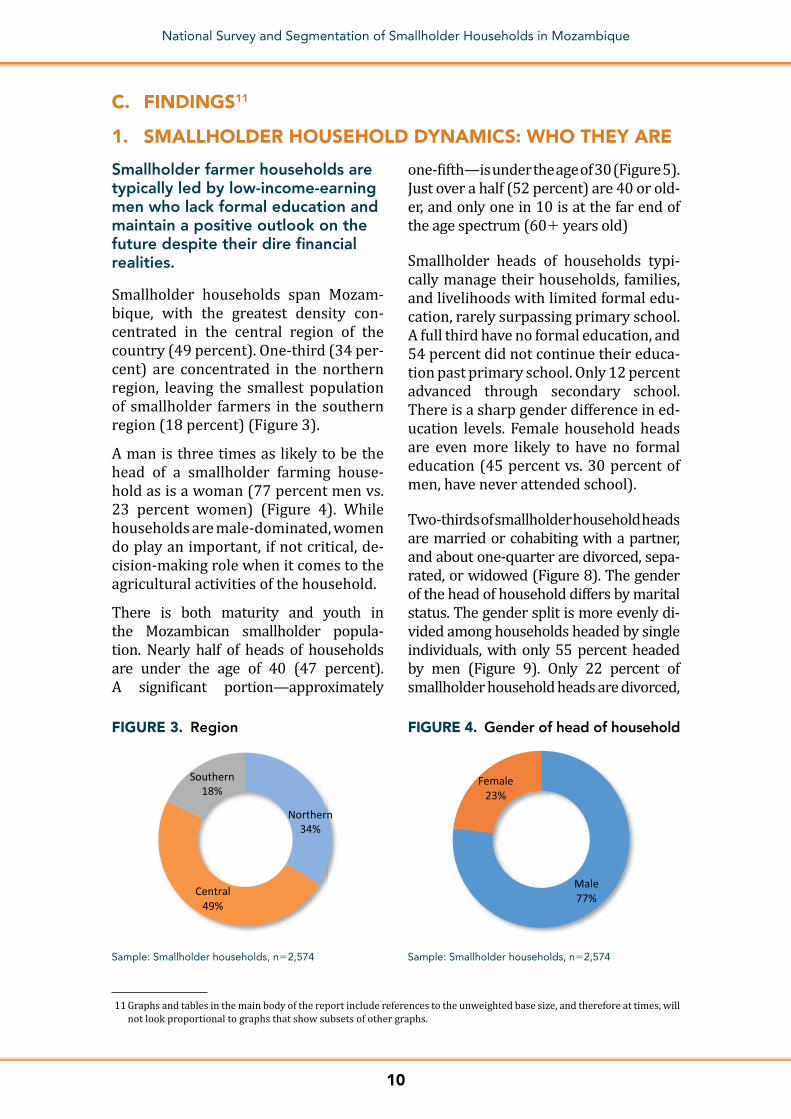
Smallholder households span Mozam-bique, with the greatest density con-centrated in the central region of the country (49 percent). One-third (34 per-cent) are concentrated in the northern region, leaving the smallest population of smallholder farmers in the southern region (18 percent) (Figure 3).
A man is three times as likely to be the head of a smallholder farming house-hold as is a woman (77 percent men vs. 23 percent women) (Figure 4). While households are male-dominated, women do play an important, if not critical, de-cision-making role when it comes to the agricultural activities of the household.
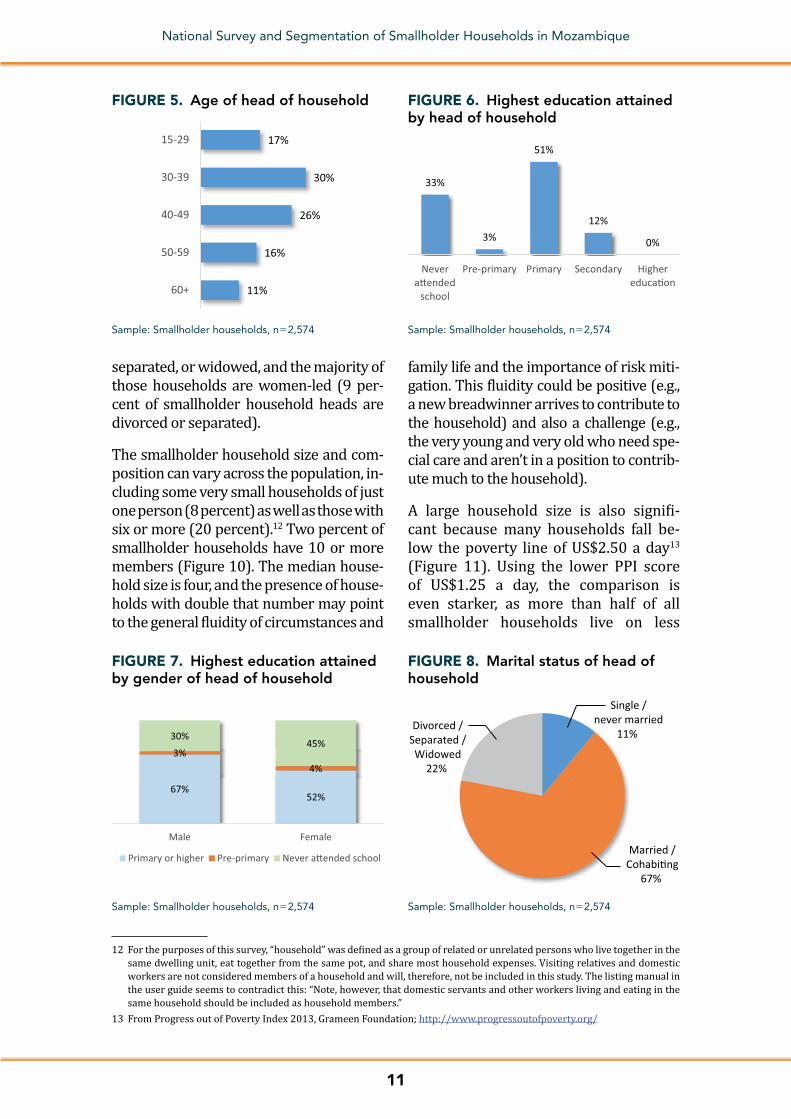
There is both maturity and youth in the Mozambican smallholder popula-tion. Nearly half of heads of households are under the age of 40 (47 percent). A significant portion—approximately
one-fifth—is under the age of 30 (Figure 5). Just over a half (52 percent) are 40 or old-er, and only one in 10 is at the far end of the age spectrum (601 years old)
Smallholder heads of households typi-cally manage their households, families, and livelihoods with limited formal edu-cation, rarely surpassing primary school. A full third have no formal education, and 54 percent did not continue their educa-tion past primary school. Only 12 percent advanced through secondary school. There is a sharp gender difference in ed-ucation levels. Female household heads are even more likely to have no formal education (45 percent vs. 30 percent of men, have never attended school).
Two-thirds of smallholder household heads are married or cohabiting with a partner, and about one-quarter are divorced, sepa-rated, or widowed (Figure 8). The gender of the head of household differs by marital status. The gender split is more evenly di-vided among households headed by single individuals, with only 55 percent headed by men (Figure 9). Only 22 percent of smallholder household heads are divorced,
Sample: Smallholder households, n52,574
Northern34%
Central49%
Southern18%
FIGURE 3. Region FIGURE 4. Gender of head of household
Male77%
Female23%
Sample: Smallholder households, n52,574
11 Graphs and tables in the main body of the report include references to the unweighted base size, and therefore at times, will not look proportional to graphs that show subsets of other graphs.
11
National Survey and Segmentation of Smallholder Households in Mozambique
separated, or widowed, and the majority of those households are women-led (9 per-cent of smallholder household heads are divorced or separated).
The smallholder household size and com-position can vary across the population, in-cluding some very small households of just one person (8 percent) as well as those with six or more (20 percent).12 Two percent of smallholder households have 10 or more members (Figure 10). The median house-hold size is four, and the presence of house-holds with double that number may point to the general fluidity of circumstances and
family life and the importance of risk miti-gation. This fluidity could be positive (e.g., a new breadwinner arrives to contribute to the household) and also a challenge (e.g., the very young and very old who need spe-cial care and aren’t in a position to contrib-ute much to the household).
A large household size is also signifi-cant because many households fall be-low the poverty line of US$2.50 a day13 (Figure 11). Using the lower PPI score of US$1.25 a day, the comparison is even starker, as more than half of all smallholder households live on less
Sample: Smallholder households, n52,574
11%
16%
26%
30%
17%
60+
50-59
40-49
30-39
15-29
FIGURE 5. Age of head of household FIGURE 6. Highest education attained by head of household
Sample: Smallholder households, n52,574
33%
3%
51%
12%
0%
Nevera�ended
school
Pre-primary Primary Secondary Highereduca�on
Sample: Smallholder households, n52,574
67%52%
3%4%
30%45%
Male Female
Primary or higher Pre-primary Never a�ended school
FIGURE 7. Highest education attained by gender of head of household
FIGURE 8. Marital status of head of household
Sample: Smallholder households, n52,574
Single /never married
11% Divorced /
Separated /Widowed
22%
Married /Cohabi�ng
67%
12 For the purposes of this survey, “household” was defined as a group of related or unrelated persons who live together in the same dwelling unit, eat together from the same pot, and share most household expenses. Visiting relatives and domestic workers are not considered members of a household and will, therefore, not be included in this study. The listing manual in the user guide seems to contradict this: “Note, however, that domestic servants and other workers living and eating in the same household should be included as household members.”
13 From Progress out of Poverty Index 2013, Grameen Foundation; http://www.progressoutofpoverty.org/

12
National Survey and Segmentation of Smallholder Households in Mozambique
than that amount per day (Figure 12). Smallholder farming households live without much of a cushion to absorb ad-ditional expenses. Roughly three-fifths of all smallholder households typically do not have enough money for food for their households, and a quarter have money only for food and clothes (Figure 13).
While living from income to income is a re-ality for most, it is not a widely embraced strategy. In fact, only 51 percent of small-holder farmers who participate in the household’s agricultural activities say they “just work to make ends meet,” suggesting their lives may take that turn even despite their best attempts to build more stability.
Smallholder farmers’ outlook on life and their agricultural work is in stark contrast to their households’ circumstances. Most take the position that they work hard to be among the best at what they do (86 per-cent), their actions determine their lives (75 percent), and their successes are due
to hard work (72 percent). They also align with the claim “I always look for oppor-tunities for improving my situation,” sug-gesting a proactive rather than a reactive approach to their lives (Figure 14). Far fewer farming households take a more passive approach, believing that it is not wise for them to plan too far ahead be-cause one’s luck might factor more heavily into the future than planning (51 percent).
Farm as income, source for subsistence, and trade
Typically, Mozambican smallholder farm-ers individually own their plots of land, ei-ther through a lease or certificate or under customary law. Almost half of these farms fall under customary law (Table 4), which means there is usually no official docu-mentation of ownership. State and com-munally owned farms are in the minority, and mostly concentrated in the southern and central regions.
FIGURE 9. Marital status by gender of head of household
Sample: Smallholder households, n52,574
55%
95%
33%
45%
5%
67%
Single / nevermarried
Married /Cohabi�ng
Divorced /Separated /Widowed
Male Female
FIGURE 10. Number of people in household
Sample: Smallholder households, n52,574
20%
16%
18%
22%
17%
8%
Six or more
Five
Four
Three
Two
One
$2.50 orabove a day
15%
Below$2.50 a day
85%
Sample: Smallholder households, n52,574
FIGURE 11. Poverty status of household FIGURE 12. Poverty status of household
Sample: Smallholder households, n52,574
Below$1.25a day55%
$1.25 orabovea day45%

13
National Survey and Segmentation of Smallholder Households in Mozambique
58%
23%12%
1%
Not enough money forfood
Enough money for foodand clothes only
Enough money for foodand clothes and can save abit, but not enough to buy
expensive goods
Afford to buy certainexpensive goods
FIGURE 13. Household’s current financial situation (self-assessed)
Sample: Smallholder households, n52,574
FIGURE 14. Do you agree or disagree with the following statements?
Sample: Smallholder farmers, n52,209
51%
72%
72%
75%
86%
34%
18%
18%
18%
10%
It is not always wise for me to plan too far ahead because manythings turn out to be a ma�er of good or bad fortune
When I get what I want, it is usually because I worked hard for it
I always look for opportuni�es for improving my situa�on
My life is determined by my own ac�ons
I always work hard to be among the best at what I do
Agree Disagree
TABLE 4. What is the form of ownership of your land?
Total Northern Central Southern
Individual ownership with lease or certificate
24% 25% 23% 24%
Individual ownership under customary law
44% 50% 42% 38%
Communal (resources are shared) 14% 6% 22% 2%
State ownership 2% 1% 1% 10%
Other 4% 7% 2% 1%
Don’t know 3% 5% 3% 0%
Sample: Smallholder farmers who participate in agricultural activities, n53,979
14
National Survey and Segmentation of Smallholder Households in Mozambique
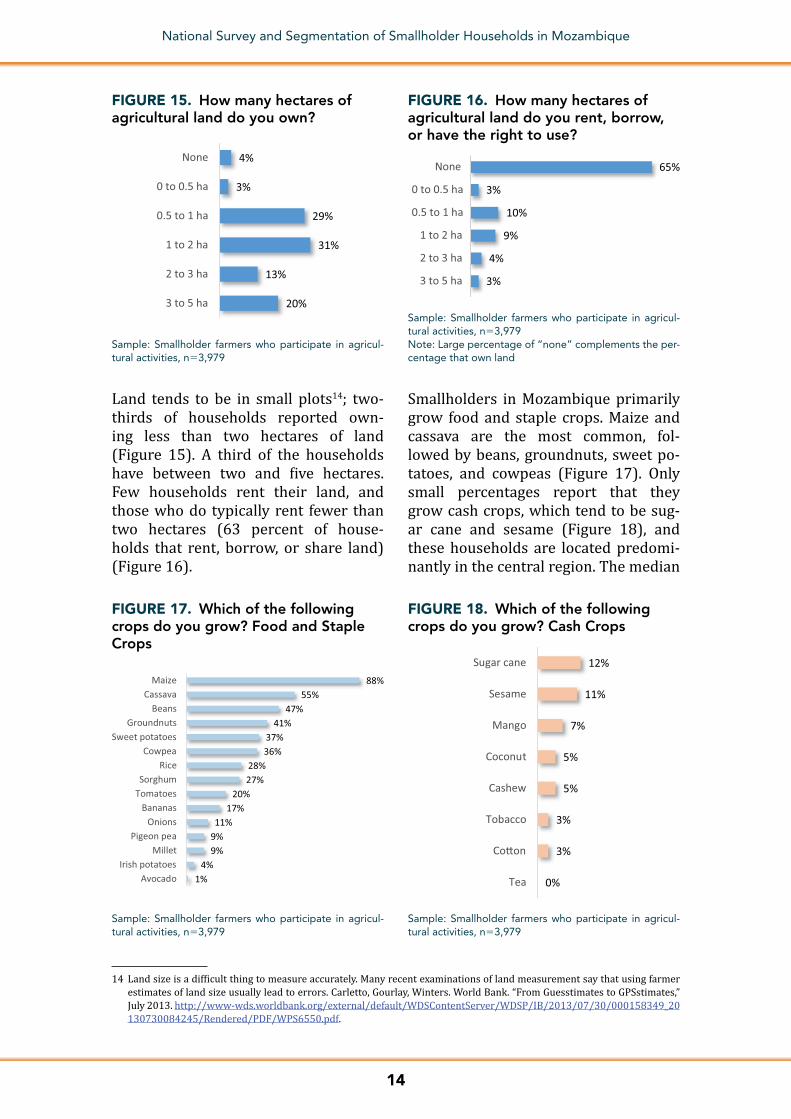
Land tends to be in small plots14; two-thirds of households reported own-ing less than two hectares of land ( Figure 15). A third of the households have between two and five hectares. Few households rent their land, and those who do typically rent fewer than two hectares (63 percent of house-holds that rent, borrow, or share land) (Figure 16).
Smallholders in Mozambique primarily grow food and staple crops. Maize and cassava are the most common, fol-lowed by beans, groundnuts, sweet po-tatoes, and cowpeas (Figure 17). Only small percentages report that they grow cash crops, which tend to be sug-ar cane and sesame (Figure 18), and these households are located predomi-nantly in the central region. The median
FIGURE 15. How many hectares of agricultural land do you own?
Sample: Smallholder farmers who participate in agricul-tural activities, n53,979
20%
13%
31%
29%
3%
4%
3 to 5 ha
2 to 3 ha
1 to 2 ha
0.5 to 1 ha
0 to 0.5 ha
None
6%
3%
4%
9%
10%
3%
65%
Don't know
3 to 5 ha
2 to 3 ha
1 to 2 ha
0.5 to 1 ha
0 to 0.5 ha
None
FIGURE 16. How many hectares of agricultural land do you rent, borrow, or have the right to use?
Sample: Smallholder farmers who participate in agricul-tural activities, n53,979Note: Large percentage of “none” complements the per-centage that own land
14 Land size is a difficult thing to measure accurately. Many recent examinations of land measurement say that using farmer estimates of land size usually lead to errors. Carletto, Gourlay, Winters. World Bank. “From Guesstimates to GPSstimates,” July 2013. http://www-wds.worldbank.org/external/default/WDSContentServer/WDSP/IB/2013/07/30/000158349_20130730084245/Rendered/PDF/WPS6550.pdf.
FIGURE 17. Which of the following crops do you grow? Food and Staple Crops
Sample: Smallholder farmers who participate in agricul-tural activities, n53,979
1%4%
9%9%11%
17%20%
27%28%
36%37%
41%47%
55%88%
AvocadoIrish potatoes
MilletPigeon pea
OnionsBananas
TomatoesSorghum
RiceCowpea
Sweet potatoesGroundnuts
BeansCassava
Maize
FIGURE 18. Which of the following crops do you grow? Cash Crops
Sample: Smallholder farmers who participate in agricul-tural activities, n53,979
0%
3%
3%
5%
5%
7%
11%
12%
Tea
Co�on
Tobacco
Cashew
Coconut
Mango
Sesame
Sugar cane
15
National Survey and Segmentation of Smallholder Households in Mozambique
number of crops per household is four, and under one-fifth (14 percent) grow eight or more crops.
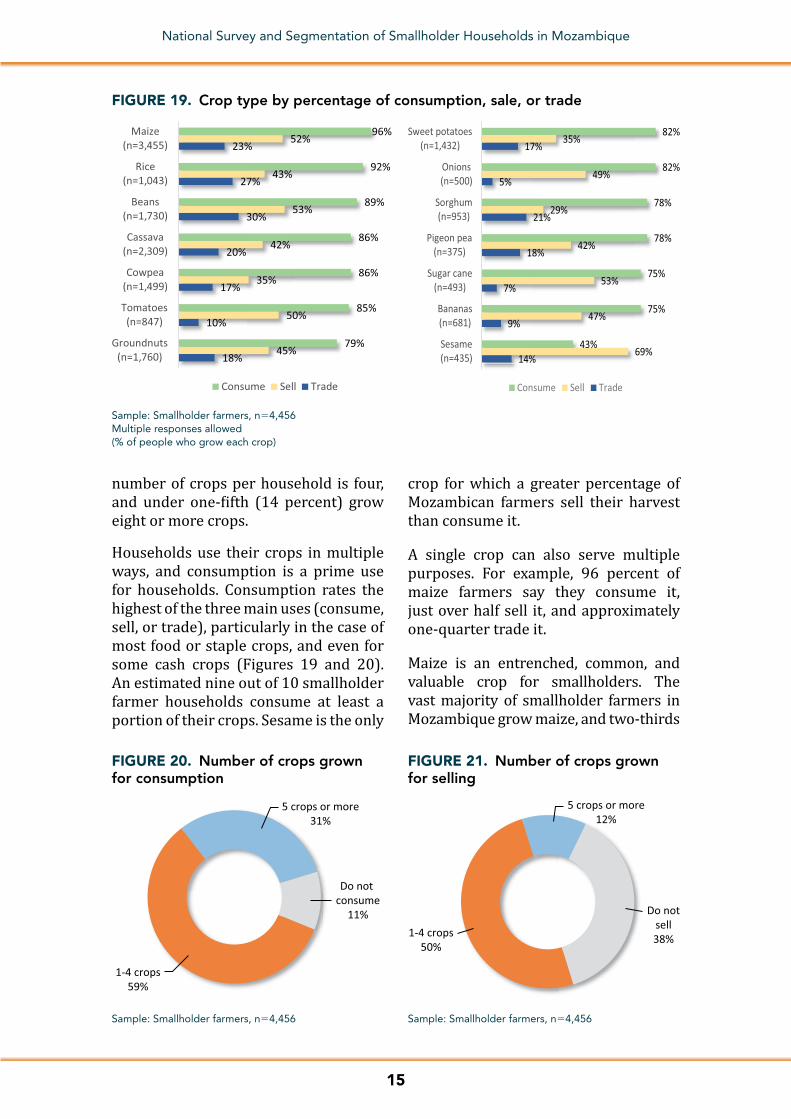
Households use their crops in multiple ways, and consumption is a prime use for households. Consumption rates the highest of the three main uses (consume, sell, or trade), particularly in the case of most food or staple crops, and even for some cash crops (Figures 19 and 20). An estimated nine out of 10 smallholder farmer households consume at least a portion of their crops. Sesame is the only
crop for which a greater percentage of Mozambican farmers sell their harvest than consume it.
A single crop can also serve multiple purposes. For example, 96 percent of maize farmers say they consume it, just over half sell it, and approximately one-quarter trade it.
Maize is an entrenched, common, and valuable crop for smallholders. The vast majority of smallholder farmers in Mozambique grow maize, and two-thirds
18%
10%
17%
20%
30%
27%
23%
45%
50%
35%
42%
53%
43%
52%
79%
85%
86%
86%
89%
92%
96%
Groundnuts(n=1,760)
Tomatoes(n=847)
Cowpea(n=1,499)
Cassava(n=2,309)
Beans(n=1,730)
Rice(n=1,043)
Maize(n=3,455)
Consume Sell Trade
14%
9%
7%
18%
21%
5%
17%
69%
47%
53%
42%
29%
49%
35%
43%
75%
75%
78%
78%
82%
82%
Sesame(n=435)
Bananas(n=681)
Sugar cane(n=493)
Pigeon pea(n=375)
Sorghum(n=953)
Onions(n=500)
Sweet potatoes(n=1,432)
Consume Sell Trade
FIGURE 19. Crop type by percentage of consumption, sale, or trade
Sample: Smallholder farmers, n54,456Multiple responses allowed(% of people who grow each crop)
Do not consume
11%
1-4 crops59%
5 crops or more31%
FIGURE 20. Number of crops grown for consumption
Sample: Smallholder farmers, n54,456
Do notsell38%1-4 crops
50%
5 crops or more12%
FIGURE 21. Number of crops grown for selling
Sample: Smallholder farmers, n54,456
16
National Survey and Segmentation of Smallholder Households in Mozambique
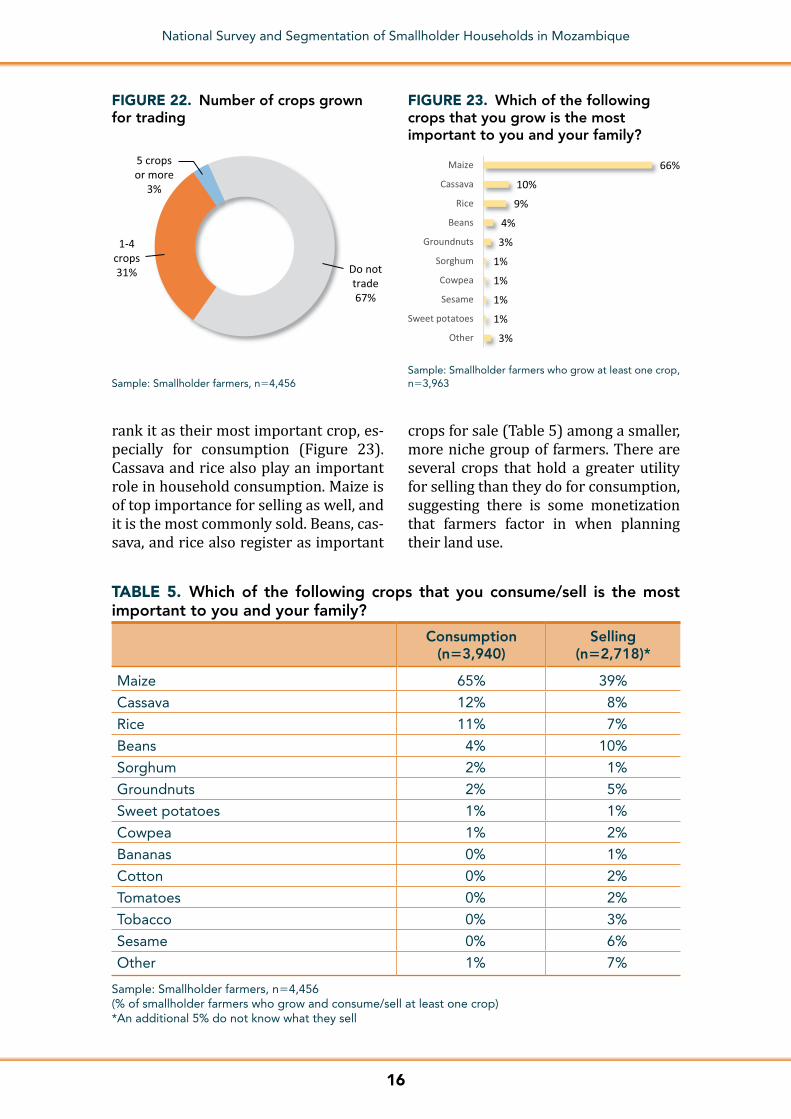
FIGURE 22. Number of crops grown for trading
Sample: Smallholder farmers, n54,456
5 cropsor more
3%
1-4crops31% Do not
trade67%
3%
1%
1%
1%
1%
3%
4%
9%
10%
66%
Other
Sweet potatoes
Sesame
Cowpea
Sorghum
Groundnuts
Beans
Rice
Cassava
Maize
Sample: Smallholder farmers who grow at least one crop, n53,963
FIGURE 23. Which of the following crops that you grow is the most important to you and your family?
rank it as their most important crop, es-pecially for consumption (Figure 23). Cassava and rice also play an important role in household consumption. Maize is of top importance for selling as well, and it is the most commonly sold. Beans, cas-sava, and rice also register as important
crops for sale (Table 5) among a smaller, more niche group of farmers. There are several crops that hold a greater utility for selling than they do for consumption, suggesting there is some monetization that farmers factor in when planning their land use.
TABLE 5. Which of the following crops that you consume/sell is the most important to you and your family?
Consumption (n53,940)
Selling (n52,718)*
Maize 65% 39%
Cassava 12% 8%
Rice 11% 7%
Beans 4% 10%
Sorghum 2% 1%
Groundnuts 2% 5%
Sweet potatoes 1% 1%
Cowpea 1% 2%
Bananas 0% 1%
Cotton 0% 2%
Tomatoes 0% 2%
Tobacco 0% 3%
Sesame 0% 6%
Other 1% 7%
Sample: Smallholder farmers, n54,456(% of smallholder farmers who grow and consume/sell at least one crop)*An additional 5% do not know what they sell
17
National Survey and Segmentation of Smallholder Households in Mozambique
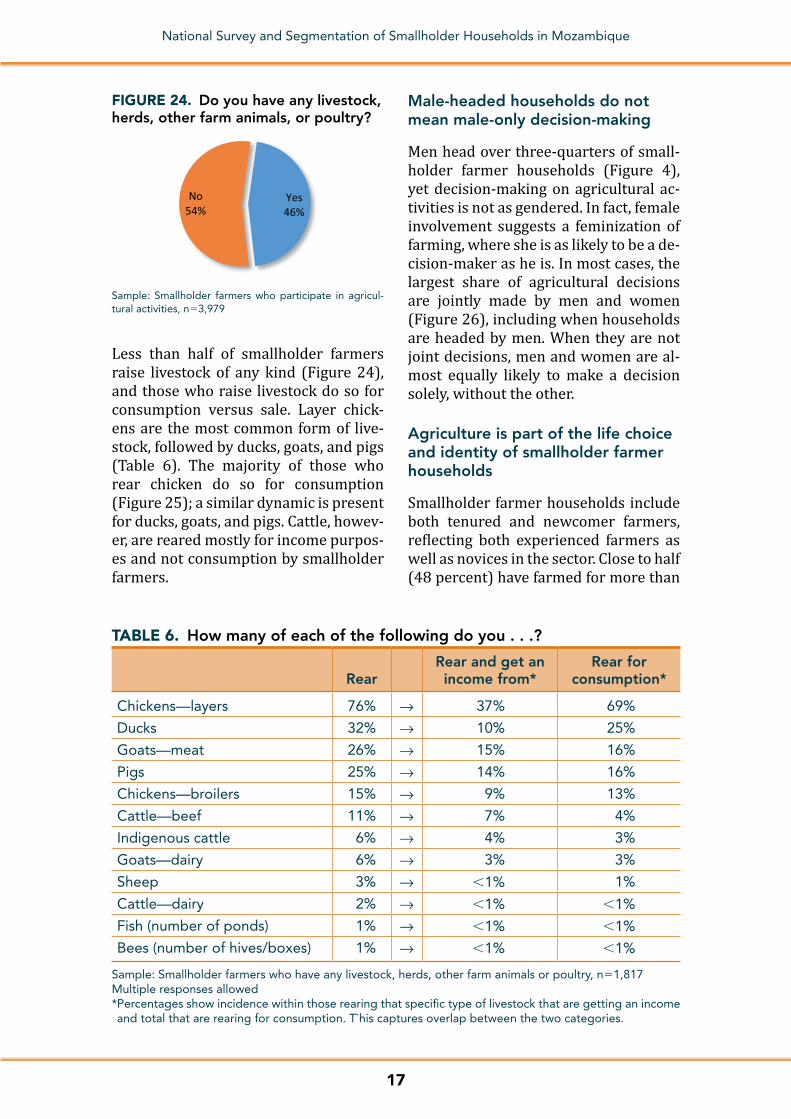
FIGURE 24. Do you have any livestock, herds, other farm animals, or poultry?
Sample: Smallholder farmers who participate in agricul-tural activities, n53,979
Yes46%
No54%
TABLE 6. How many of each of the following do you . . .?
RearRear and get an income from*
Rear for consumption*
Chickens—layers 76% → 37% 69%
Ducks 32% → 10% 25%
Goats—meat 26% → 15% 16%
Pigs 25% → 14% 16%
Chickens—broilers 15% → 9% 13%
Cattle—beef 11% → 7% 4%
Indigenous cattle 6% → 4% 3%
Goats—dairy 6% → 3% 3%
Sheep 3% → ,1% 1%
Cattle—dairy 2% → ,1% ,1%
Fish (number of ponds) 1% → ,1% ,1%
Bees (number of hives/boxes) 1% → ,1% ,1%
Sample: Smallholder farmers who have any livestock, herds, other farm animals or poultry, n51,817Multiple responses allowed* Percentages show incidence within those rearing that specific type of livestock that are getting an income and total that are rearing for consumption. T`his captures overlap between the two categories.
Less than half of smallholder farmers raise livestock of any kind (Figure 24), and those who raise livestock do so for consumption versus sale. Layer chick-ens are the most common form of live-stock, followed by ducks, goats, and pigs (Table 6). The majority of those who rear chicken do so for consumption (Figure 25); a similar dynamic is present for ducks, goats, and pigs. Cattle, howev-er, are reared mostly for income purpos-es and not consumption by smallholder farmers.
Male-headed households do not mean male-only decision-making
Men head over three-quarters of small-holder farmer households (Figure 4), yet decision-making on agricultural ac-tivities is not as gendered. In fact, female involvement suggests a feminization of farming, where she is as likely to be a de-cision-maker as he is. In most cases, the largest share of agricultural decisions are jointly made by men and women (Figure 26), including when households are headed by men. When they are not joint decisions, men and women are al-most equally likely to make a decision solely, without the other.
Agriculture is part of the life choice and identity of smallholder farmer households
Smallholder farmer households include both tenured and newcomer farmers, reflecting both experienced farmers as well as novices in the sector. Close to half (48 percent) have farmed for more than

18
National Survey and Segmentation of Smallholder Households in Mozambique
41%
63%
63%
79%
92%
65%
62%
57%
30%
52%
Rear ca�le (n=338)
Rear goats (n=567)
Rear pigs (n=515)
Rear ducks (n=595)
Rear chickens (n=1,577)
Rear and get an income from Rear for consump�on
FIGURE 25. Percentage of respondents who rear livestock for income and consumption
Sample: Smallholder farmers, n54,456Multiple responses allowed(% of smallholder farmers who rear livestock in each category)
10 years. As many (48 percent) range in experience from very new (less than two years [6 percent]) to moderately ex-perienced (six to 10 years [20 percent]) (Figure 27).
It is mostly the younger generations (younger than 39 years old) that are newer to farming, versus individuals adopting farming as a livelihood late in life (Figure 28).
Consistent across households, farming emerges as a life choice and part of an identity, which can give some insights into the motivations of this population,
24%
25%
25%
29%
30%
30%
31%
34%
19%
20%
19%
24%
25%
24%
23%
25%
24%
26%
24%
29%
32%
29%
28%
28%
26%
22%
25%
12%
8%
11%
12%
8%
Quan�ty of livestock to sell
Where to borrow money to supportagricultural produc�on
When to sell livestock
Quan�ty of crops to sell
Plan�ng �me
Purchase of farm inputs
When and where to sell crops
When to harvestBoth
Wife/girlfriend
Husband/boyfriend
Notapplicable
FIGURE 26. Generally, who makes decisions on the following agricultural activities?
Sample: Smallholder households, n52,574
6%
22%
20%
48%
5%Less than 2 years
2-5 years
6-10 years
More than 10years
Don't know
FIGURE 27. How many years have you been farming?
Sample: Smallholder farmers who participate in house-hold’s agricultural activities, n51,753
19
National Survey and Segmentation of Smallholder Households in Mozambique
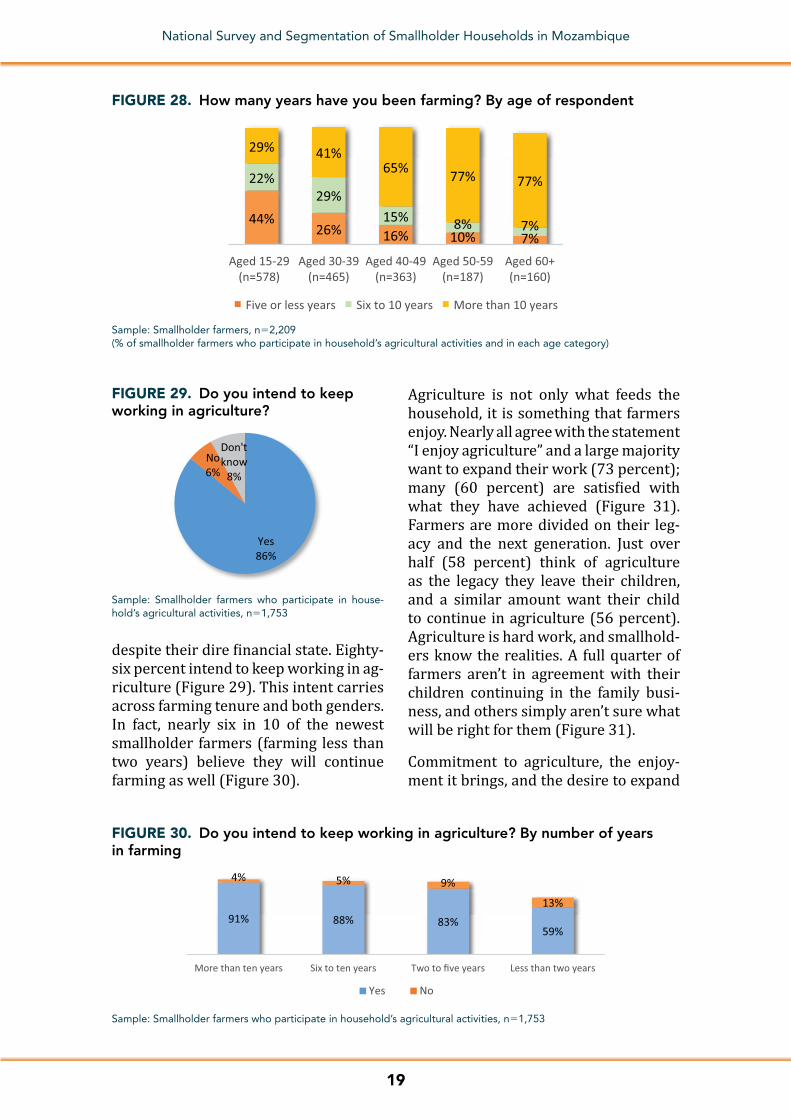
FIGURE 28. How many years have you been farming? By age of respondent
44%26% 16% 10% 7%
22%29%
15% 8% 7%
29% 41%65% 77% 77%
Aged 15-29(n=578)
Aged 30-39(n=465)
Aged 40-49(n=363)
Aged 50-59(n=187)
Aged 60+(n=160)
Five or less years Six to 10 years More than 10 years
Sample: Smallholder farmers, n52,209(% of smallholder farmers who participate in household’s agricultural activities and in each age category)
despite their dire financial state. Eighty-six percent intend to keep working in ag-riculture (Figure 29). This intent carries across farming tenure and both genders. In fact, nearly six in 10 of the newest smallholder farmers (farming less than two years) believe they will continue farming as well (Figure 30).
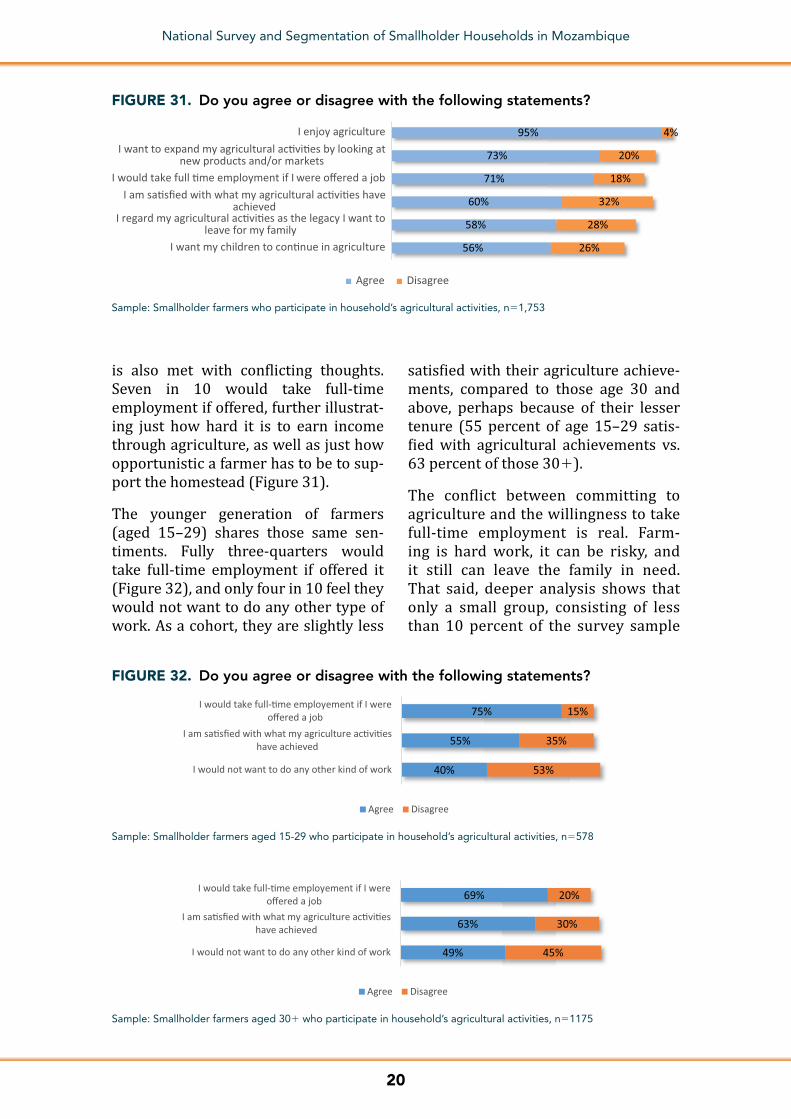
Agriculture is not only what feeds the household, it is something that farmers enjoy. Nearly all agree with the statement “I enjoy agriculture” and a large majority want to expand their work (73 percent); many (60 percent) are satisfied with what they have achieved (Figure 31). Farmers are more divided on their leg-acy and the next generation. Just over half (58 percent) think of agriculture as the legacy they leave their children, and a similar amount want their child to continue in agriculture (56 percent). Agriculture is hard work, and smallhold-ers know the realities. A full quarter of farmers aren’t in agreement with their children continuing in the family busi-ness, and others simply aren’t sure what will be right for them (Figure 31).
Commitment to agriculture, the enjoy-ment it brings, and the desire to expand
Yes86%
No6%
Don't know
8%
FIGURE 29. Do you intend to keep working in agriculture?
Sample: Smallholder farmers who participate in house-hold’s agricultural activities, n51,753
91% 88% 83%59%
4% 5% 9%
13%
More than ten years Six to ten years Two to five years Less than two years
Yes No
FIGURE 30. Do you intend to keep working in agriculture? By number of years in farming
Sample: Smallholder farmers who participate in household’s agricultural activities, n51,753
20
National Survey and Segmentation of Smallholder Households in Mozambique
56%
58%
60%
71%
73%
95%
26%
28%
32%
18%
20%
4%
I want my children to con�nue in agriculture
I regard my agricultural ac�vi�es as the legacy I want toleave for my family
I am sa�sfied with what my agricultural ac�vi�es haveachieved
I would take full �me employment if I were offered a job
I want to expand my agricultural ac�vi�es by looking atnew products and/or markets
I enjoy agriculture
Agree Disagree
FIGURE 31. Do you agree or disagree with the following statements?
Sample: Smallholder farmers who participate in household’s agricultural activities, n51,753
is also met with conflicting thoughts. Seven in 10 would take full-time employment if offered, further illustrat-ing just how hard it is to earn income through agriculture, as well as just how opportunistic a farmer has to be to sup-port the homestead (Figure 31).
The younger generation of farmers (aged 15–29) shares those same sen-timents. Fully three-quarters would take full-time employment if offered it (Figure 32), and only four in 10 feel they would not want to do any other type of work. As a cohort, they are slightly less
satisfied with their agriculture achieve-ments, compared to those age 30 and above, perhaps because of their lesser tenure (55 percent of age 15–29 satis-fied with agricultural achievements vs. 63 percent of those 301).
The conflict between committing to agriculture and the willingness to take full-time employment is real. Farm-ing is hard work, it can be risky, and it still can leave the family in need. That said, deeper analysis shows that only a small group, consisting of less than 10 percent of the survey sample
40%
55%
75%
53%
35%
15%
I would not want to do any other kind of work
I am sa�sfied with what my agriculture ac�vi�eshave achieved
I would take full-�me employement if I wereoffered a job
Agree Disagree
FIGURE 32. Do you agree or disagree with the following statements?
Sample: Smallholder farmers aged 15-29 who participate in household’s agricultural activities, n5578
49%
63%
69%
45%
30%
20%
I would not want to do any other kind of work
I am sa�sfied with what my agriculture ac�vi�eshave achieved
I would take full-�me employement if I wereoffered a job
Agree Disagree
Sample: Smallholder farmers aged 301 who participate in household’s agricultural activities, n51175
21
National Survey and Segmentation of Smallholder Households in Mozambique
TABLE 7. Do you agree or disagree with the following statements? “Want to get out of farming” Index Criteria
I would not want to do any other kind of work Disagree
I would take full time employment if I were offered a job Agree
I regard my agricultural activities as the legacy I want to leave for my family
Disagree
Sample: Smallholder farmers, n5245
TABLE 8. Do you agree or disagree with the following statements?
GroupAll smallholder farmers
n52,209Smallholder farmers who want to
“get out” n5245
Age 15–39 63% 71%
Age 401 37% 29%
Sample: Smallholder farmers
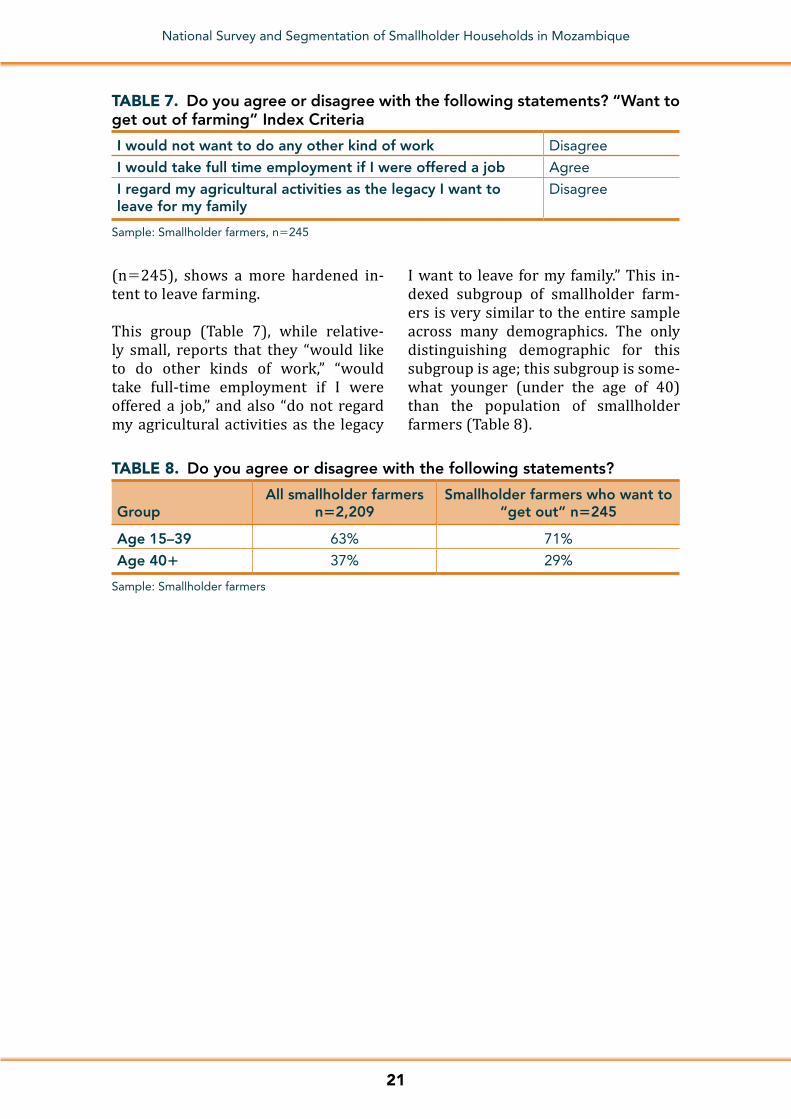
(n5245), shows a more hardened in-tent to leave farming.
This group (Table 7), while relative-ly small, reports that they “would like to do other kinds of work,” “would take full-time employment if I were offered a job,” and also “do not regard my agricultural activities as the legacy
I want to leave for my family.” This in-dexed subgroup of smallholder farm-ers is very similar to the entire sample across many demographics. The only distinguishing demographic for this subgroup is age; this subgroup is some-what younger (under the age of 40) than the population of smallholder farmers (Table 8).

22
National Survey and Segmentation of Smallholder Households in Mozambique
2. SMALLHOLDER HOUSEHOLD DYNAMICS: INCOME AND EXPENSES
One prime income source—farming
Most Mozambican smallholder house-holds have one primary income source—agriculture. Growing and sell-ing their crops generates most of their household income. It is likely the house-hold undertakes other activities to sup-plement income; however, none of the activities comes close to contributing to the household in proportion to the con-tribution made through farming.
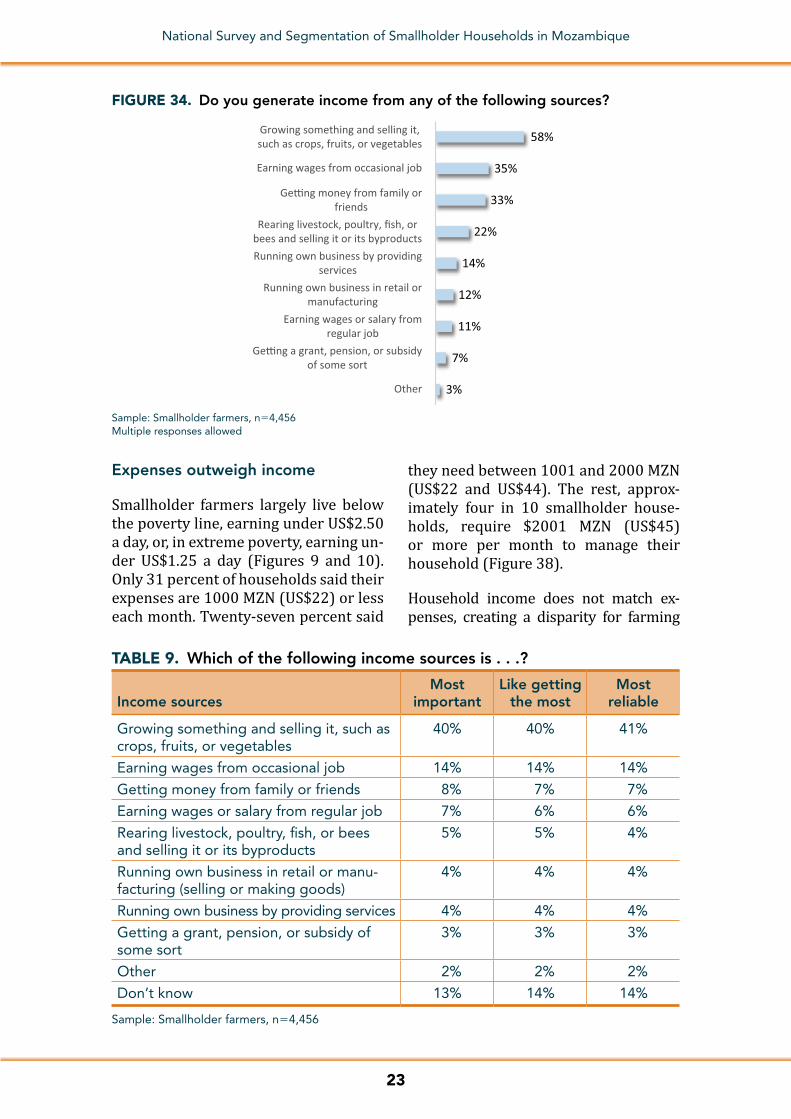
Four-fifths of farmers report that their primary job (i.e., where they spend the most of their time) is farming (Figure 33). Those who are also business or shop owners are only a small por-tion of smallholder farmers. Over one-third of farmers have occasional jobs that yield wages. A third receives mon-ey from family and friends (Figure 34). Only about one-fifth of farmers get in-come from rearing livestock, poultry, fish, or bees.
Income sources are relatively stable across demographics. There are small
differences by age for farming-related activities and getting money from fam-ily. Those under 30 are slightly more likely to generate income by getting money from friends and family (38 per-cent vs. 30 percent of those age 301). Those age 30 and older are more likely to earn income from growing and sell-ing crops (61 percent vs. 53 percent of those age 15–29) or rearing livestock, fish, poultry, bees for sale (25 percent vs. 15 percent of those age 15–29).
Smallholder farmers who contribute to the income of their households consis-tently shared that growing and selling crops are the most important, most re-liable, and most enjoyable farming ac-tivities (Table 9). By comparing these three concepts, data show that a large portion of smallholder farmers in Mo-zambique equate the most important income source with the one they like getting the most and with the one that is the most reliable. A much small-er percentage said the money they earn from occasional jobs is the most rewarding.
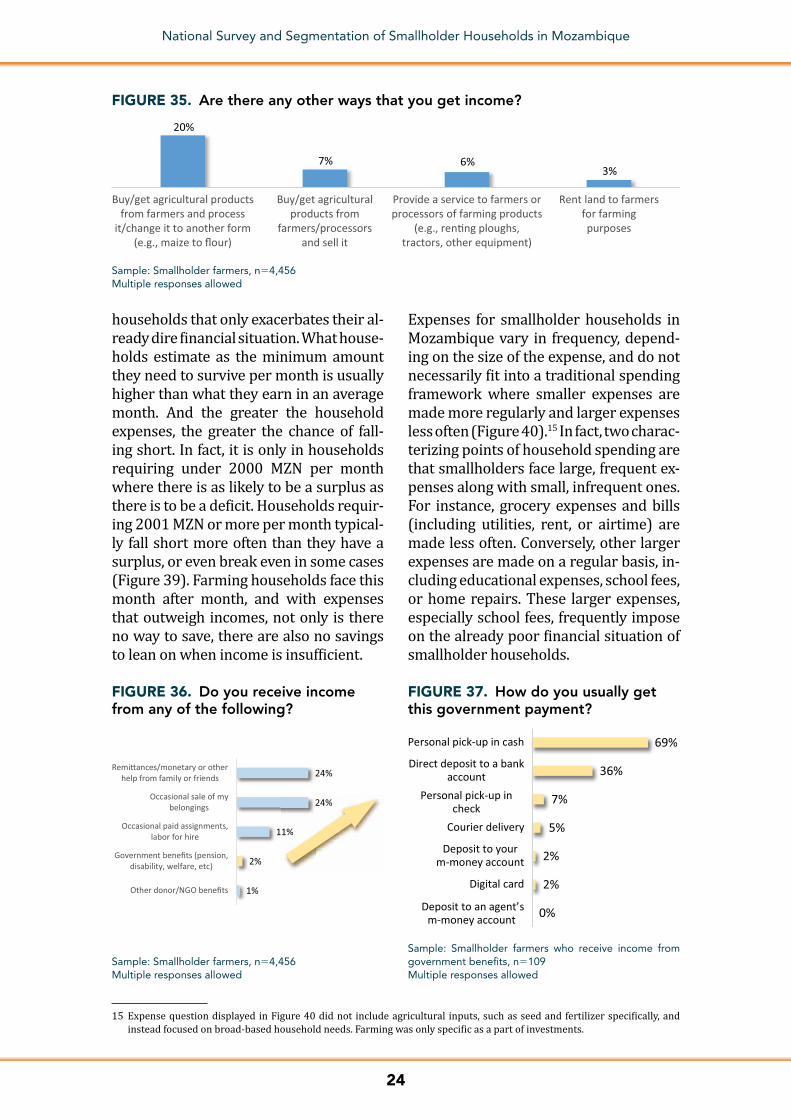
Aside from crop production and live-stock, some smallholder households earn income from other agricultur-al activities or sources (Figure 35). Less than one-quarter of farmers are involved in the processing of agricul-tural products. Smaller percentages resell or rent land to other farmers for growing crops.
More broadly, beyond agriculture, less than 5 percent of smallholder house-holds receive payments from the gov-ernment, such as pension, disability, or welfare (Figure 36). Of the small per-centage that does, the majority of farm-ers pick up the money in cash, in person, while one-third receive it in a bank ac-count (Figure 37).
80%
6%
3%3% 1%
8%
FarmerBusiness ownerProfessional (e.g. doctor, teacher)LaborerShop ownerOther
FIGURE 33. What is your primary job?
Sample: Smallholder farmers, n54,456
23
National Survey and Segmentation of Smallholder Households in Mozambique
TABLE 9. Which of the following income sources is . . .?
Income sourcesMost
importantLike getting
the mostMost
reliable
Growing something and selling it, such as crops, fruits, or vegetables
40% 40% 41%
Earning wages from occasional job 14% 14% 14%
Getting money from family or friends 8% 7% 7%
Earning wages or salary from regular job 7% 6% 6%
Rearing livestock, poultry, fish, or bees and selling it or its byproducts
5% 5% 4%
Running own business in retail or manu-facturing (selling or making goods)
4% 4% 4%
Running own business by providing services 4% 4% 4%
Getting a grant, pension, or subsidy of some sort
3% 3% 3%
Other 2% 2% 2%
Don’t know 13% 14% 14%
Sample: Smallholder farmers, n54,456
3%
7%
11%
12%
14%
22%
33%
35%
58%
Other
Ge�ng a grant, pension, or subsidyof some sort
Earning wages or salary fromregular job
Running own business in retail ormanufacturing
Running own business by providingservices
Rearing livestock, poultry, fish, orbees and selling it or its byproducts
Ge�ng money from family orfriends
Earning wages from occasional job
Growing something and selling it,such as crops, fruits, or vegetables
FIGURE 34. Do you generate income from any of the following sources?
Sample: Smallholder farmers, n54,456Multiple responses allowed
Expenses outweigh income
Smallholder farmers largely live below the poverty line, earning under US$2.50 a day, or, in extreme poverty, earning un-der US$1.25 a day (Figures 9 and 10). Only 31 percent of households said their expenses are 1000 MZN (US$22) or less each month. Twenty-seven percent said
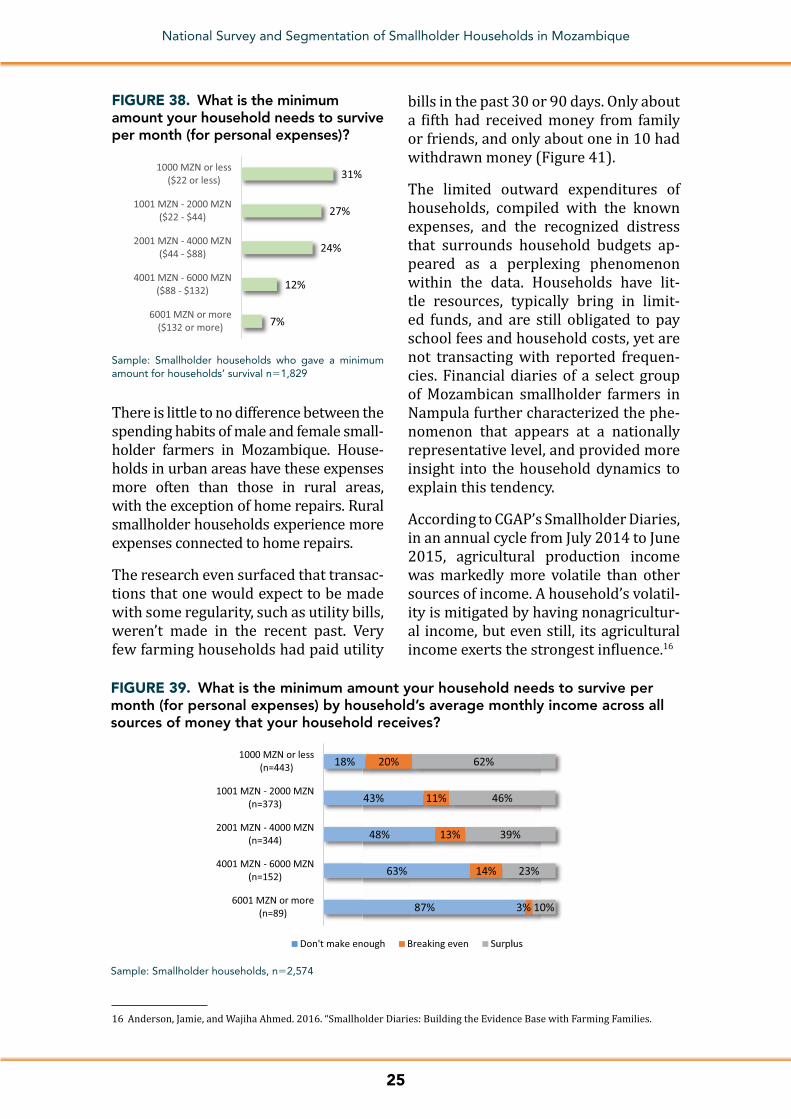
they need between 1001 and 2000 MZN (US$22 and US$44). The rest, approx-imately four in 10 smallholder house-holds, require $2001 MZN (US$45) or more per month to manage their household (Figure 38).
Household income does not match ex-penses, creating a disparity for farming
24
National Survey and Segmentation of Smallholder Households in Mozambique
1%
2%
11%
24%
24%
Other donor/NGO benefits
Government benefits (pension,disability, welfare, etc)
Occasional paid assignments,labor for hire
Occasional sale of mybelongings
Remi�ances/monetary or otherhelp from family or friends
1%
24%
FIGURE 36. Do you receive income from any of the following?
Sample: Smallholder farmers, n54,456Multiple responses allowed
0%
2%
2%
5%
7%
36%
69%
Deposit to an agent’sm-money account
Digital card
Deposit to yourm-money account
Courier delivery
Personal pick-up incheck
Direct deposit to a bankaccount
Personal pick-up in cash
FIGURE 37. How do you usually get this government payment?
Sample: Smallholder farmers who receive income from government benefits, n5109Multiple responses allowed
15 Expense question displayed in Figure 40 did not include agricultural inputs, such as seed and fertilizer specifically, and instead focused on broad-based household needs. Farming was only specific as a part of investments.
households that only exacerbates their al-ready dire financial situation. What house-holds estimate as the minimum amount they need to survive per month is usually higher than what they earn in an average month. And the greater the household expenses, the greater the chance of fall-ing short. In fact, it is only in households requiring under 2000 MZN per month where there is as likely to be a surplus as there is to be a deficit. Households requir-ing 2001 MZN or more per month typical-ly fall short more often than they have a surplus, or even break even in some cases (Figure 39). Farming households face this month after month, and with expenses that outweigh incomes, not only is there no way to save, there are also no savings to lean on when income is insufficient.
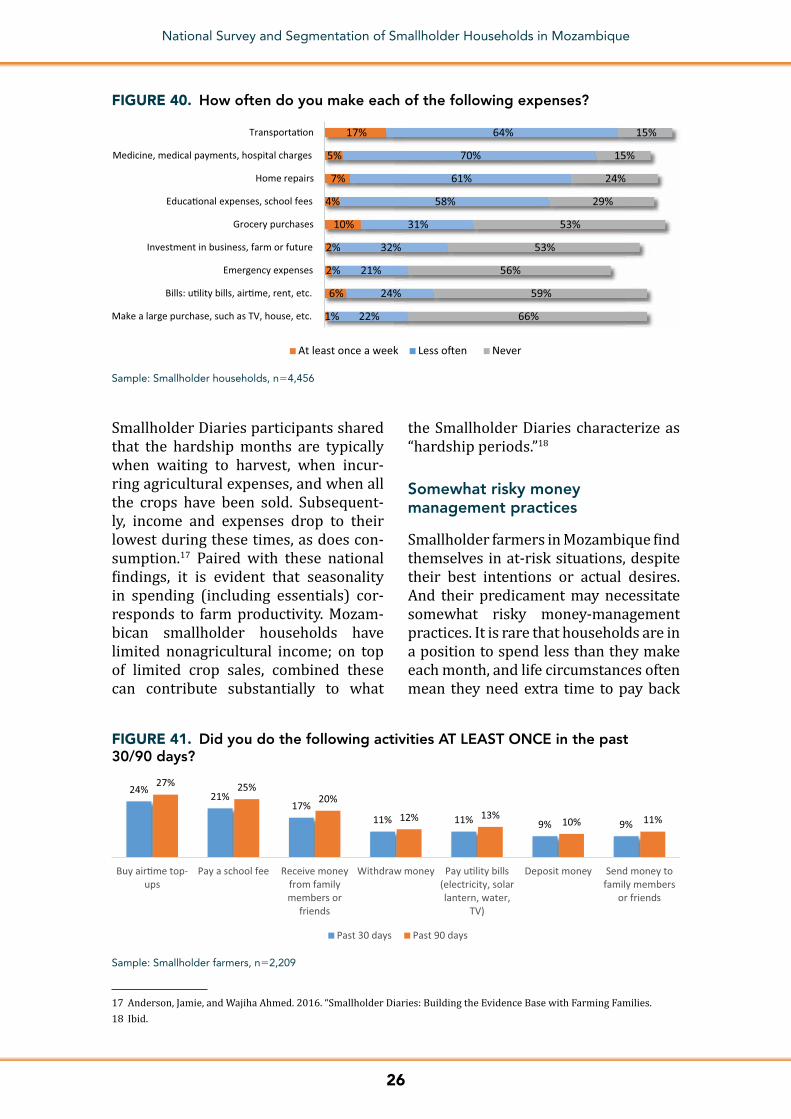
Expenses for smallholder households in Mozambique vary in frequency, depend-ing on the size of the expense, and do not necessarily fit into a traditional spending framework where smaller expenses are made more regularly and larger expenses less often (Figure 40).15 In fact, two charac-terizing points of household spending are that smallholders face large, frequent ex-penses along with small, infrequent ones. For instance, grocery expenses and bills (including utilities, rent, or airtime) are made less often. Conversely, other larger expenses are made on a regular basis, in-cluding educational expenses, school fees, or home repairs. These larger expenses, especially school fees, frequently impose on the already poor financial situation of smallholder households.
20%
7% 6%3%
Buy/get agricultural productsfrom farmers and process
it/change it to another form(e.g., maize to flour)
Buy/get agriculturalproducts from
farmers/processorsand sell it
Provide a service to farmers orprocessors of farming products
(e.g., ren�ng ploughs,tractors, other equipment)
Rent land to farmersfor farmingpurposes
FIGURE 35. Are there any other ways that you get income?
Sample: Smallholder farmers, n54,456Multiple responses allowed
25
National Survey and Segmentation of Smallholder Households in Mozambique
7%
12%
24%
27%
31%
6001 MZN or more($132 or more)
4001 MZN - 6000 MZN($88 - $132)
2001 MZN - 4000 MZN($44 - $88)
1001 MZN - 2000 MZN($22 - $44)
1000 MZN or less($22 or less)
FIGURE 38. What is the minimum amount your household needs to survive per month (for personal expenses)?
Sample: Smallholder households who gave a minimum amount for households’ survival n51,829
87%
63%
48%
43%
18%
3%
14%
13%
11%
20%
10%
23%
39%
46%
62%
6001 MZN or more(n=89)
4001 MZN - 6000 MZN(n=152)
2001 MZN - 4000 MZN(n=344)
1001 MZN - 2000 MZN(n=373)
1000 MZN or less(n=443)
Don't make enough Breaking even SurplusSurplus
FIGURE 39. What is the minimum amount your household needs to survive per month (for personal expenses) by household’s average monthly income across all sources of money that your household receives?
Sample: Smallholder households, n52,574
There is little to no difference between the spending habits of male and female small-holder farmers in Mozambique. House-holds in urban areas have these expenses more often than those in rural areas, with the exception of home repairs. Rural smallholder households experience more expenses connected to home repairs.
The research even surfaced that transac-tions that one would expect to be made with some regularity, such as utility bills, weren’t made in the recent past. Very few farming households had paid utility
bills in the past 30 or 90 days. Only about a fifth had received money from family or friends, and only about one in 10 had withdrawn money (Figure 41).
The limited outward expenditures of households, compiled with the known expenses, and the recognized distress that surrounds household budgets ap-peared as a perplexing phenomenon within the data. Households have lit-tle resources, typically bring in limit-ed funds, and are still obligated to pay school fees and household costs, yet are not transacting with reported frequen-cies. Financial diaries of a select group of Mozambican smallholder farmers in Nampula further characterized the phe-nomenon that appears at a nationally representative level, and provided more insight into the household dynamics to explain this tendency.
According to CGAP’s Smallholder Diaries, in an annual cycle from July 2014 to June 2015, agricultural production income was markedly more volatile than other sources of income. A household’s volatil-ity is mitigated by having nonagricultur-al income, but even still, its agricultural income exerts the strongest influence.16
16 Anderson, Jamie, and Wajiha Ahmed. 2016. “Smallholder Diaries: Building the Evidence Base with Farming Families.
26
National Survey and Segmentation of Smallholder Households in Mozambique
Smallholder Diaries participants shared that the hardship months are typically when waiting to harvest, when incur-ring agricultural expenses, and when all the crops have been sold. Subsequent-ly, income and expenses drop to their lowest during these times, as does con-sumption.17 Paired with these national findings, it is evident that seasonality in spending (including essentials) cor-responds to farm productivity. Mozam-bican smallholder households have limited nonagricultural income; on top of limited crop sales, combined these can contribute substantially to what
the Smallholder Diaries characterize as “hardship periods.”18
Somewhat risky money management practices
Smallholder farmers in Mozambique find themselves in at-risk situations, despite their best intentions or actual desires. And their predicament may necessitate somewhat risky money-management practices. It is rare that households are in a position to spend less than they make each month, and life circumstances often mean they need extra time to pay back
24%21%
17%11% 11% 9% 9%
27% 25%20%
12% 13%10% 11%
Buy air�me top-ups
Pay a school fee Receive moneyfrom familymembers or
friends
Withdraw money Pay u�lity bills(electricity, solarlantern, water,
TV)
Deposit money Send money tofamily members
or friends
Past 30 days Past 90 days
FIGURE 41. Did you do the following activities AT LEAST ONCE in the past 30/90 days?
Sample: Smallholder farmers, n52,209
1%
6%
2%
2%
10%
4%
7%
5%
17%
22%
24%
21%
32%
31%
58%
61%
70%
64%
66%
59%
56%
53%
53%
29%
24%
15%
15%
Make a large purchase, such as TV, house, etc.
Bills: u�lity bills, air�me, rent, etc.
Emergency expenses
Investment in business, farm or future
Grocery purchases
Educa�onal expenses, school fees
Home repairs
Medicine, medical payments, hospital charges
Transporta�on
At least once a week Less o�en Never
FIGURE 40. How often do you make each of the following expenses?
Sample: Smallholder households, n54,456
17 Anderson, Jamie, and Wajiha Ahmed. 2016. “Smallholder Diaries: Building the Evidence Base with Farming Families.18 Ibid.

27
National Survey and Segmentation of Smallholder Households in Mozambique
loans or lines of credit. Lack of a monthly surplus (either income or agricultural production) also means they do not have an emergency fund for unplanned ex-penses (Figure 42).
Most smallholder households in Mozam-bique do not have plans to manage un-expected expenses. Just over two in 10 have a plan to cover expenses associated with a death in the family (Figure 43). Much smaller numbers of farmers have plans to manage medical emergencies, events that affect their crops or live-stock, or the lack of food.
The lack of planning is mirrored by their saving habits in the past year. Few save,
and even fewer save at a financial insti-tution (Figure 44). Only 9 percent said they have saved at bank in the past 12 months; however, informal saving is higher, and almost one-quarter have saved with friends and family. Reflecting back on earlier observations, disparities between income and expenses limit their ability to put money away.
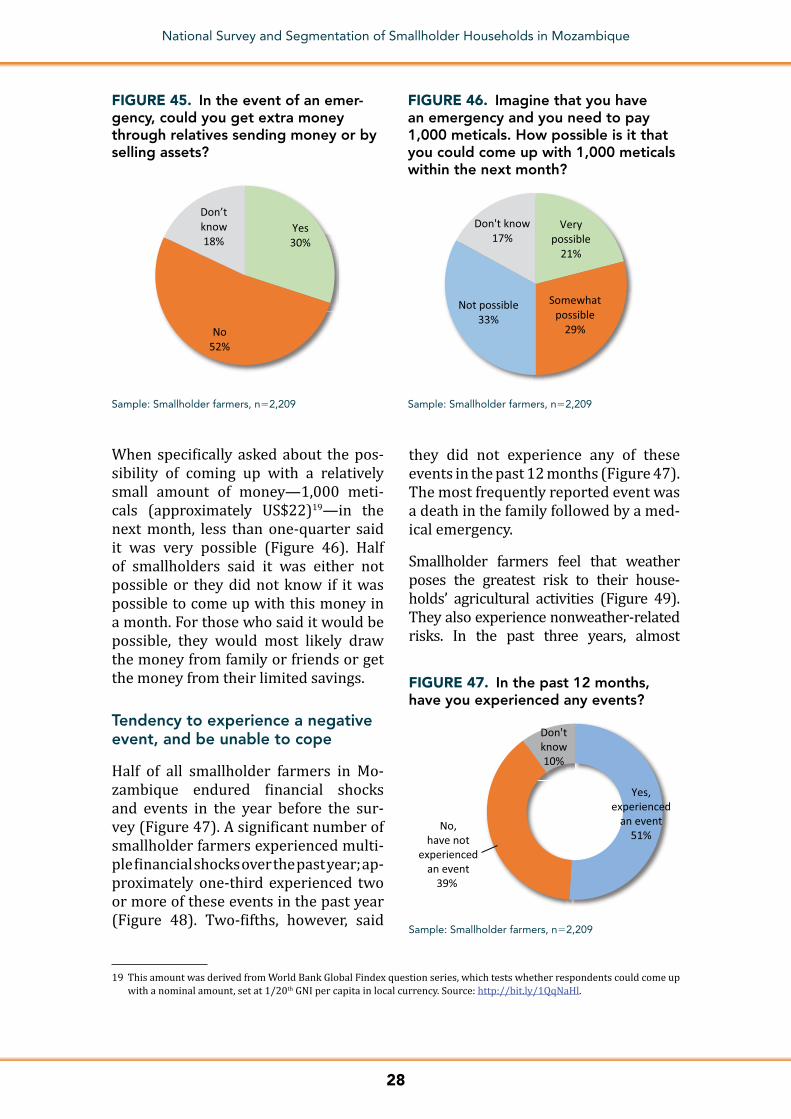
Limited savings leaves smallholder households in a very risky position, espe-cially because there are not many other options for liquidity. Less than one-third of smallholder farmers think they could get extra money from relatives sending money or by selling some of their assets in the event of an emergency (Figure 45).
17% 14% 11% 6%
28% 27%17% 22%
26% 26%
23% 26%
18% 23%30%
37%
I spend less money than Imake each month
I pay my bills on �me My savings are largerthan my debts
I have an emergency fundto cover for unplanned
expenses
Always / Most of the �me Some�mes Rarely Never
FIGURE 42. How often does the following apply to you?
Sample: Smallholder farmers, n52,209
Bankruptcy/loss of a job or abusiness
An extended period of �me withoutyour own food supply
Loss of property due to the� orburglary
Loss of a house due to fire, flood oranother natural disaster
Loss of harvest or livestock due toweather condi�ons or a disease
Major medical emergency, includingillness, injury and childbirth
Death in the family
9%
10%
11%
11%
12%
15%
22%
FIGURE 43. Does your family have a plan to manage these unexpected expenses, which might result from the following?
“Yes” answersSample: Smallholder farmers, n52,209
2%
3%
9%
11%
24%
Credit union
Microfinance ins�tu�on
Bank
Xi�que or savings andcredit group
Friends and family
FIGURE 44. In the past 12 months, have you saved money with any of the following groups?
“Yes” answersSample: Smallholder farmers, n52,209
28
National Survey and Segmentation of Smallholder Households in Mozambique
When specifically asked about the pos-sibility of coming up with a relatively small amount of money—1,000 meti-cals (approximately US$22)19—in the next month, less than one-quarter said it was very possible (Figure 46). Half of smallholders said it was either not possible or they did not know if it was possible to come up with this money in a month. For those who said it would be possible, they would most likely draw the money from family or friends or get the money from their limited savings.
Tendency to experience a negative event, and be unable to cope
Half of all smallholder farmers in Mo-zambique endured financial shocks and events in the year before the sur-vey (Figure 47). A significant number of smallholder farmers experienced multi-ple financial shocks over the past year; ap-proximately one-third experienced two or more of these events in the past year (Figure 48). Two-fifths, however, said
Yes30%
No52%
Don’t know18%
FIGURE 45. In the event of an emer-gency, could you get extra money through relatives sending money or by selling assets?
Sample: Smallholder farmers, n52,209
Very possible
21%
Somewhat possible
29%
Not possible33%
Don't know17%
FIGURE 46. Imagine that you have an emergency and you need to pay 1,000 meticals. How possible is it that you could come up with 1,000 meticals within the next month?
Sample: Smallholder farmers, n52,209
Yes,experienced
an event51%
No,have not
experiencedan event
39%
Don'tknow10%
FIGURE 47. In the past 12 months, have you experienced any events?
Sample: Smallholder farmers, n52,209
19 This amount was derived from World Bank Global Findex question series, which tests whether respondents could come up with a nominal amount, set at 1/20th GNI per capita in local currency. Source: http://bit.ly/1QqNaHl.
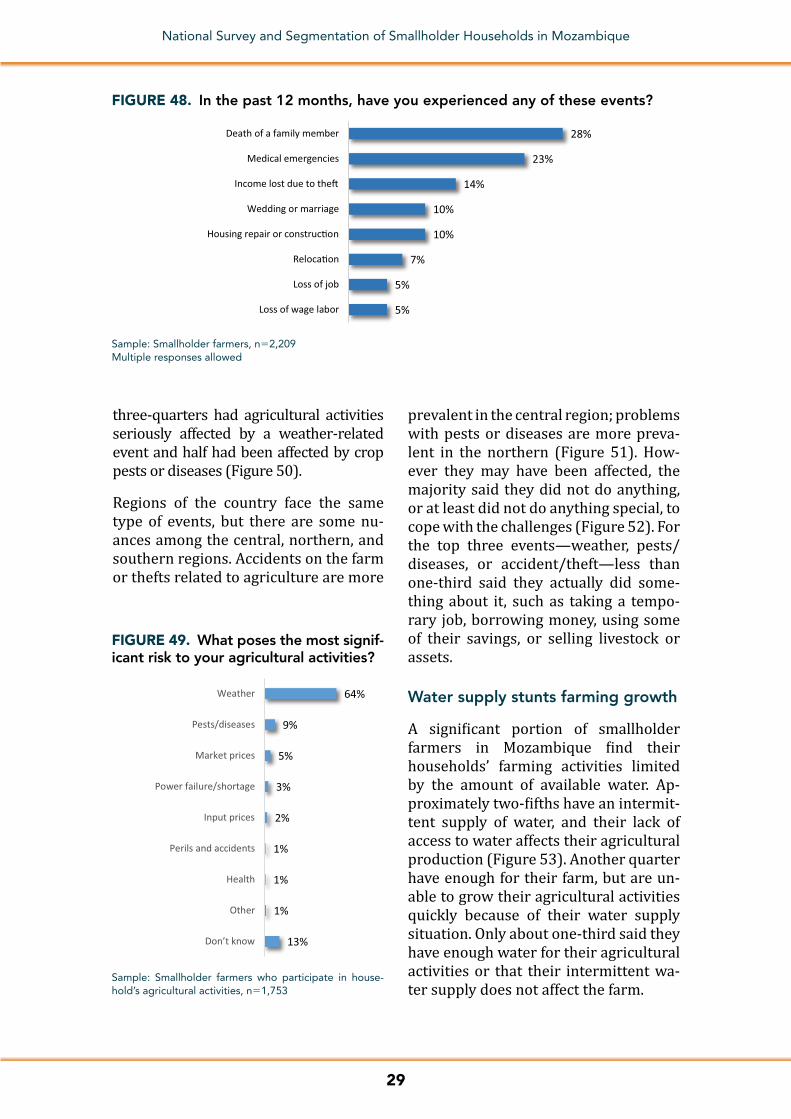
they did not experience any of these events in the past 12 months (Figure 47). The most frequently reported event was a death in the family followed by a med-ical emergency.
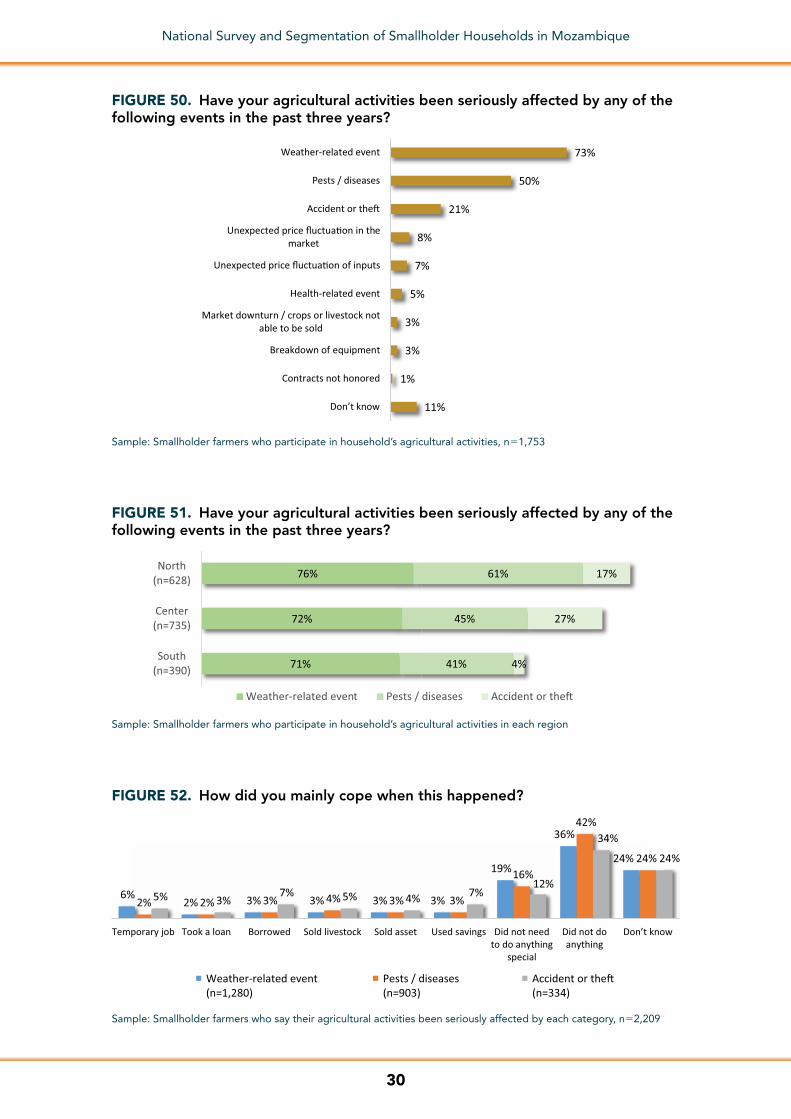
Smallholder farmers feel that weather poses the greatest risk to their house-holds’ agricultural activities (Figure 49). They also experience nonweather-related risks. In the past three years, almost
29
National Survey and Segmentation of Smallholder Households in Mozambique
5%
5%
7%
10%
10%
14%
23%
28%
Loss of wage labor
Loss of job
Reloca�on
Housing repair or construc�on
Wedding or marriage
Income lost due to the�
Medical emergencies
Death of a family member
FIGURE 48. In the past 12 months, have you experienced any of these events?
Sample: Smallholder farmers, n52,209Multiple responses allowed
13%
1%
1%
1%
2%
3%
5%
9%
64%
Don’t know
Other
Health
Perils and accidents
Input prices
Power failure/shortage
Market prices
Pests/diseases
Weather
FIGURE 49. What poses the most signif-icant risk to your agricultural activities?
Sample: Smallholder farmers who participate in house-hold’s agricultural activities, n51,753
three-quarters had agricultural activities seriously affected by a weather-related event and half had been affected by crop pests or diseases (Figure 50).
Regions of the country face the same type of events, but there are some nu-ances among the central, northern, and southern regions. Accidents on the farm or thefts related to agriculture are more
prevalent in the central region; problems with pests or diseases are more preva-lent in the northern (Figure 51). How-ever they may have been affected, the majority said they did not do anything, or at least did not do anything special, to cope with the challenges (Figure 52). For the top three events—weather, pests/diseases, or accident/theft—less than one-third said they actually did some-thing about it, such as taking a tempo-rary job, borrowing money, using some of their savings, or selling livestock or assets.
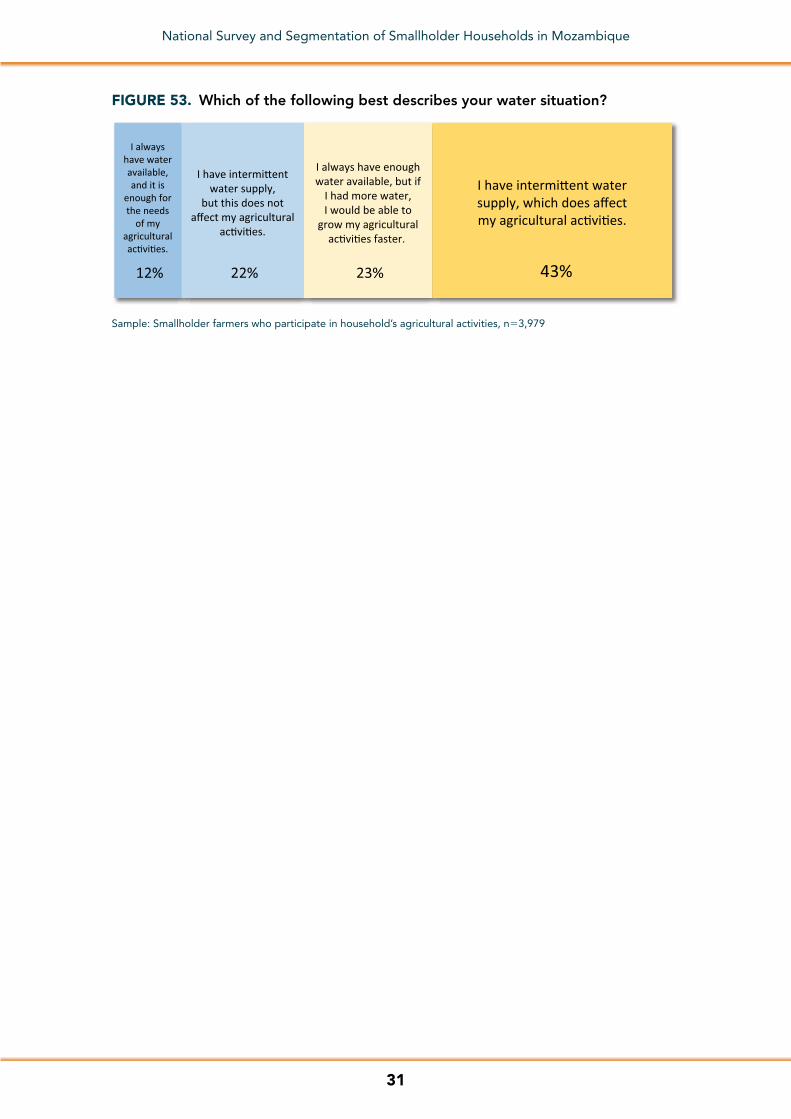
Water supply stunts farming growth
A significant portion of smallholder farmers in Mozambique find their households’ farming activities limited by the amount of available water. Ap-proximately two-fifths have an intermit-tent supply of water, and their lack of access to water affects their agricultural production (Figure 53). Another quarter have enough for their farm, but are un-able to grow their agricultural activities quickly because of their water supply situation. Only about one-third said they have enough water for their agricultural activities or that their intermittent wa-ter supply does not affect the farm.
30
National Survey and Segmentation of Smallholder Households in Mozambique
71%
72%
76%
41%
45%
61%
4%
27%
17%
South(n=390)
Center(n=735)
North(n=628)
Weather-related event Pests / diseases Accident or the�
FIGURE 51. Have your agricultural activities been seriously affected by any of the following events in the past three years?
Sample: Smallholder farmers who participate in household’s agricultural activities in each region
6%2% 3% 3% 3% 3%
19%
36%
24%
2% 2% 3% 4% 3% 3%
16%
42%
24%
5% 3%7% 5% 4% 7%
12%
34%
24%
Temporary job Took a loan Borrowed Sold livestock Sold asset Used savings Did not needto do anything
special
Did not doanything
Don’t know
Weather-related event(n=1,280)
Pests / diseases(n=903)
Accident or the�(n=334)
FIGURE 52. How did you mainly cope when this happened?
Sample: Smallholder farmers who say their agricultural activities been seriously affected by each category, n52,209
11%
1%
3%
3%
5%
7%
8%
21%
50%
73%
Don’t know
Contracts not honored
Breakdown of equipment
Market downturn / crops or livestock notable to be sold
Health-related event
Unexpected price fluctua�on of inputs
Unexpected price fluctua�on in themarket
Accident or the�
Pests / diseases
Weather-related event
FIGURE 50. Have your agricultural activities been seriously affected by any of the following events in the past three years?
Sample: Smallholder farmers who participate in household’s agricultural activities, n51,753
31
National Survey and Segmentation of Smallholder Households in Mozambique
43%23%22%12%
I alwayshave wateravailable,and it is
enough forthe needs
of myagriculturalac�vi�es.
I have intermi�entwater supply,
but this does notaffect my agricultural
ac�vi�es.
I always have enoughwater available, but if
I had more water,I would be able to
grow my agriculturalac�vi�es faster.
I have intermi�ent watersupply, which does affectmy agricultural ac�vi�es.
FIGURE 53. Which of the following best describes your water situation?
Sample: Smallholder farmers who participate in household’s agricultural activities, n53,979

32
National Survey and Segmentation of Smallholder Households in Mozambique
3. RISKS AND MITIGATION
Smallholder farmers would like to better mitigate their risks
Risk is a reality for smallholder farmers in Mozambique. Their life experienc-es have taught them to recognize their own vulnerabilities. Drought, flood, and disease, along with lower-than-expect-ed yield or insufficient crop storage are both known and real concerns.
In concert with smallholder farmer aspi-rations for themselves and their farms, there is an importance placed on risk mitigation as well as an aspiration to be better equipped to mitigate risk.
Majorities of smallholder farmers see the importance of keeping money aside for certain agricultural needs, most no-tably seeds and fertilizer (Figure 54). There is less perceived relevance in keeping money aside for security, fuel, and hiring extra staff or workers. There is, however, a large disparity between what they want to do and actual prac-tice when it comes to agricultural needs (Figure 55). There is a notable differ-ence between those smallholder farm-ers who want to keep money aside for their agricultural needs and those who currently do so. Smallholder farmers
may find something is important and may want to do it, but lack the means to do so.
Although they may not be keeping money aside for their agriculture needs, they are storing crops. Two-thirds of small-holder farmers currently store after the harvest (Figure 56). The most common-ly stored crop is maize, which is not sur-prising as most smallholder farmers in Mozambique grow this crop (Figure 57). Storage focuses almost exclusively on food or staple crops and not cash crops. The storage location is normally one of two places—either in a barn on their land or in the home (Figure 58). The main reason for storing crops is so the family can consume them later, further emphasizing the dependence on one’s farm for subsistence (Figure 59).
Approximately one-third of smallhold-er farmers do not store their crops after the harvest (Figure 60), and mostly be-cause there are no leftover crops after the harvest—either everything is sold, traded, or consumed by the family (Fig-ure 61). Less than one-quarter do not store crops because they lack access to a facility.
36%38%39%
51%57%58%59%
64%72%
79%
17%17%
18%16%
20%17%
13%14%
12%11%
29%29%24%
20%13%
13%16%
12%9%
7%
18%16%
19%13%
10%11%12%10%
7%4%
Hiring staff / workersFuel
SecurityFor future investment opportuni�es
EquipmentPes�cidesIrriga�on
Crop storage a�er harvestFer�lizer
Seeds
Very important Somewhat important Not important Don't know
FIGURE 54. How important is it to keep money aside for the following agricultural needs?
Sample: Smallholder farmers who participate in household’s agricultural activities, n51,753
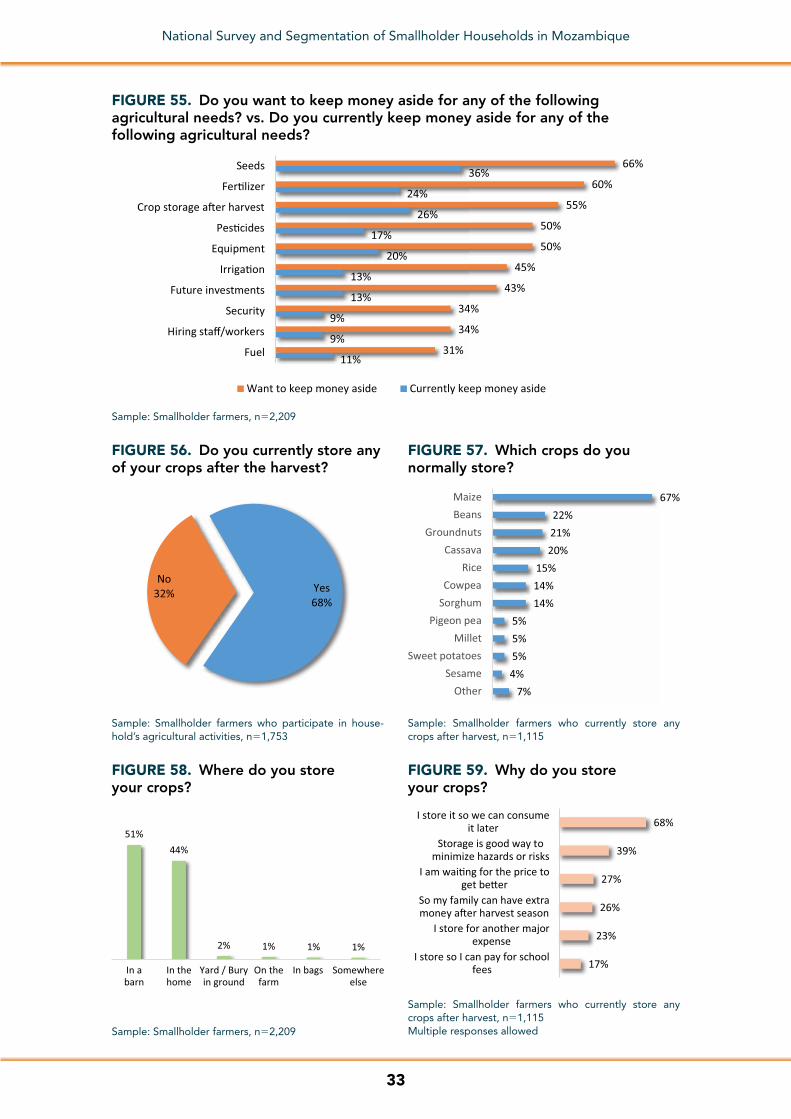
33
National Survey and Segmentation of Smallholder Households in Mozambique
11%
9%
9%
13%
13%
20%
17%
26%
24%
36%
31%
34%
34%
43%
45%
50%
50%
55%
60%
66%
Fuel
Hiring staff/workers
Security
Future investments
Irriga�on
Equipment
Pes�cides
Crop storage a�er harvest
Fer�lizer
Seeds
Want to keep money aside Currently keep money aside
FIGURE 55. Do you want to keep money aside for any of the following agricultural needs? vs. Do you currently keep money aside for any of the following agricultural needs?
Sample: Smallholder farmers, n52,209
Yes68%
No32%
FIGURE 56. Do you currently store any of your crops after the harvest?
Sample: Smallholder farmers who participate in house-hold’s agricultural activities, n51,753
7%4%5%5%5%
14%14%15%
20%21%22%
67%
OtherSesame
Sweet potatoesMillet
Pigeon peaSorghumCowpea
RiceCassava
GroundnutsBeansMaize
FIGURE 57. Which crops do you normally store?
Sample: Smallholder farmers who currently store any crops after harvest, n51,115
In abarn
In thehome
Yard / Buryin ground
On thefarm
In bags Somewhereelse
51%44%
2% 1% 1% 1%
FIGURE 58. Where do you store your crops?
Sample: Smallholder farmers, n52,209
17%
23%
26%
27%
39%
68%
I store so I can pay for schoolfees
I store for another majorexpense
So my family can have extramoney a�er harvest season
I am wai�ng for the price toget be�er
Storage is good way tominimize hazards or risks
I store it so we can consumeit later
FIGURE 59. Why do you store your crops?
Sample: Smallholder farmers who currently store any crops after harvest, n51,115Multiple responses allowed

34
National Survey and Segmentation of Smallholder Households in Mozambique
Investing in livestock also helps house-holds mitigate risk; yet the tendency to do so in Mozambique is limited. Only 14 percent have ever purchased live-stock as an investment, and an even smaller percentage said they currently have any (Figure 62).
Family is the first stop for risk mitigation
Smallholder farmers in Mozambique view their household’s agricultural ac-tivities as a family business. They tend to rely primarily on themselves and their families for labor to support all of these activities and use their family and friends as sources of information. They turn to family for help first, if they
look for help at all. The majority do not use any help to manage the land or live-stock (Figure 63). Of those who actually use hired labor (versus family labor), it is mostly for the early phase of the harvest, including plowing, preparing, and planting (Figure 64). Still, a large majority use labor for the harvesting and weeding phases of the agricultural cycle (65 percent use labor for harvest-ing, 61 percent use labor for weeding, 81 percent use labor for harvesting or weeding).
Farmers turn to their family and friends most often and frequently for informa-tion on agricultural activities, followed closely by messages coming across ra-dio waves (Table 10). All other sources
9%5%
86%
Yes, currentlyhave
Yes, do notcurrently have
No
FIGURE 62. Have you ever purchased livestock as an investment?
Sample: Smallholder farmers who participate in household’s agricultural activities, n51,753
Yes68%
No32%
13%
4%
4%
13%
16%
22%
60%
Don't know
Other
It is not a good idea to storecrops
Storage is too expensive
I need to use the money a�erthe harvest
There is no available storageplace nearby
There are no le�over crops tostore
FIGURE 60. Do you currently store any of your crops after the harvest?
Sample: Smallholder farmers who participate in house-hold’s agricultural activities, n51,753
FIGURE 61. Why do you not currently store any of your crops?
Sample: Smallholder farmers who currently do not store any crops after harvest, n5638Multiple responses allowed
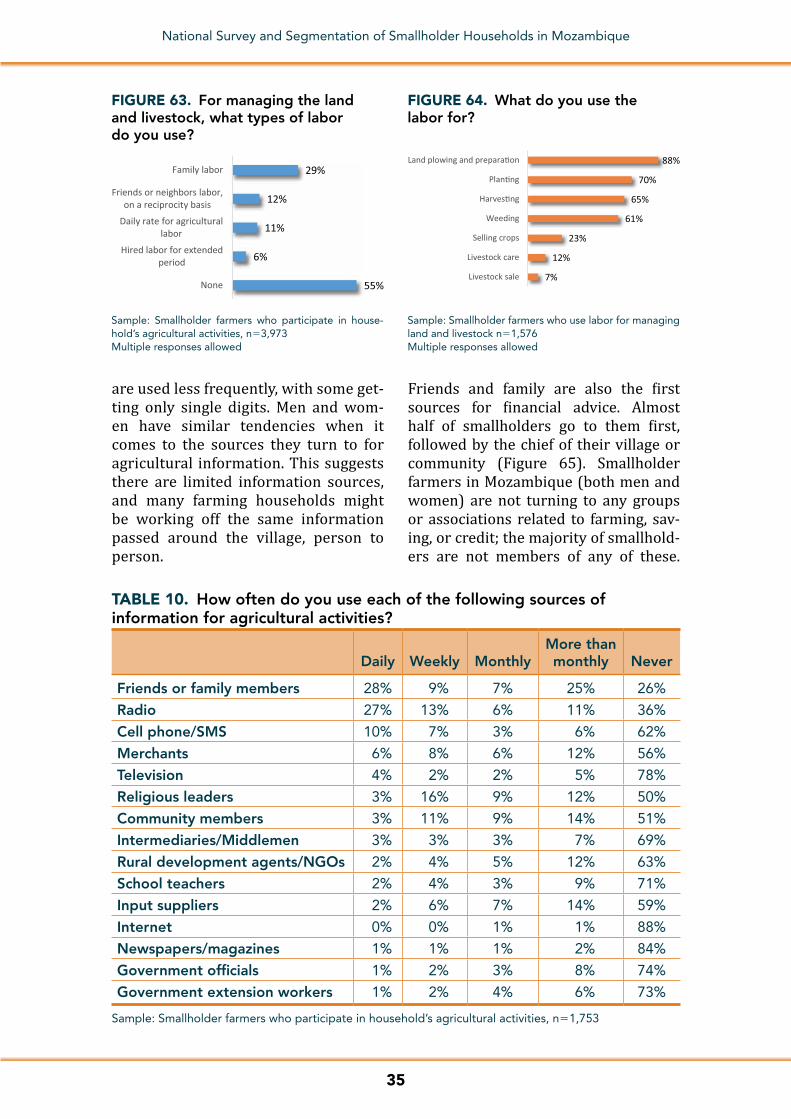
35
National Survey and Segmentation of Smallholder Households in Mozambique
are used less frequently, with some get-ting only single digits. Men and wom-en have similar tendencies when it comes to the sources they turn to for agricultural information. This suggests there are limited information sources, and many farming households might be working off the same information passed around the village, person to person.
Friends and family are also the first sources for financial advice. Almost half of smallholders go to them first, followed by the chief of their village or community (Figure 65). Smallholder farmers in Mozambique (both men and women) are not turning to any groups or associations related to farming, sav-ing, or credit; the majority of smallhold-ers are not members of any of these.
FIGURE 63. For managing the land and livestock, what types of labor do you use?
Sample: Smallholder farmers who participate in house-hold’s agricultural activities, n53,973Multiple responses allowed
55%
6%
11%
12%
29%
None
Hired labor for extendedperiod
Daily rate for agriculturallabor
Friends or neighbors labor,on a reciprocity basis
Family labor
FIGURE 64. What do you use the labor for?
Sample: Smallholder farmers who use labor for managing land and livestock n51,576Multiple responses allowed
7%
12%
23%
61%
65%
70%
88%
Livestock sale
Livestock care
Selling crops
Weeding
Harves�ng
Plan�ng
Land plowing and prepara�on
TABLE 10. How often do you use each of the following sources of information for agricultural activities?
Daily Weekly MonthlyMore than monthly Never
Friends or family members 28% 9% 7% 25% 26%
Radio 27% 13% 6% 11% 36%
Cell phone/SMS 10% 7% 3% 6% 62%
Merchants 6% 8% 6% 12% 56%
Television 4% 2% 2% 5% 78%
Religious leaders 3% 16% 9% 12% 50%
Community members 3% 11% 9% 14% 51%
Intermediaries/Middlemen 3% 3% 3% 7% 69%
Rural development agents/NGOs 2% 4% 5% 12% 63%
School teachers 2% 4% 3% 9% 71%
Input suppliers 2% 6% 7% 14% 59%
Internet 0% 0% 1% 1% 88%
Newspapers/magazines 1% 1% 1% 2% 84%
Government officials 1% 2% 3% 8% 74%
Government extension workers 1% 2% 4% 6% 73%
Sample: Smallholder farmers who participate in household’s agricultural activities, n51,753
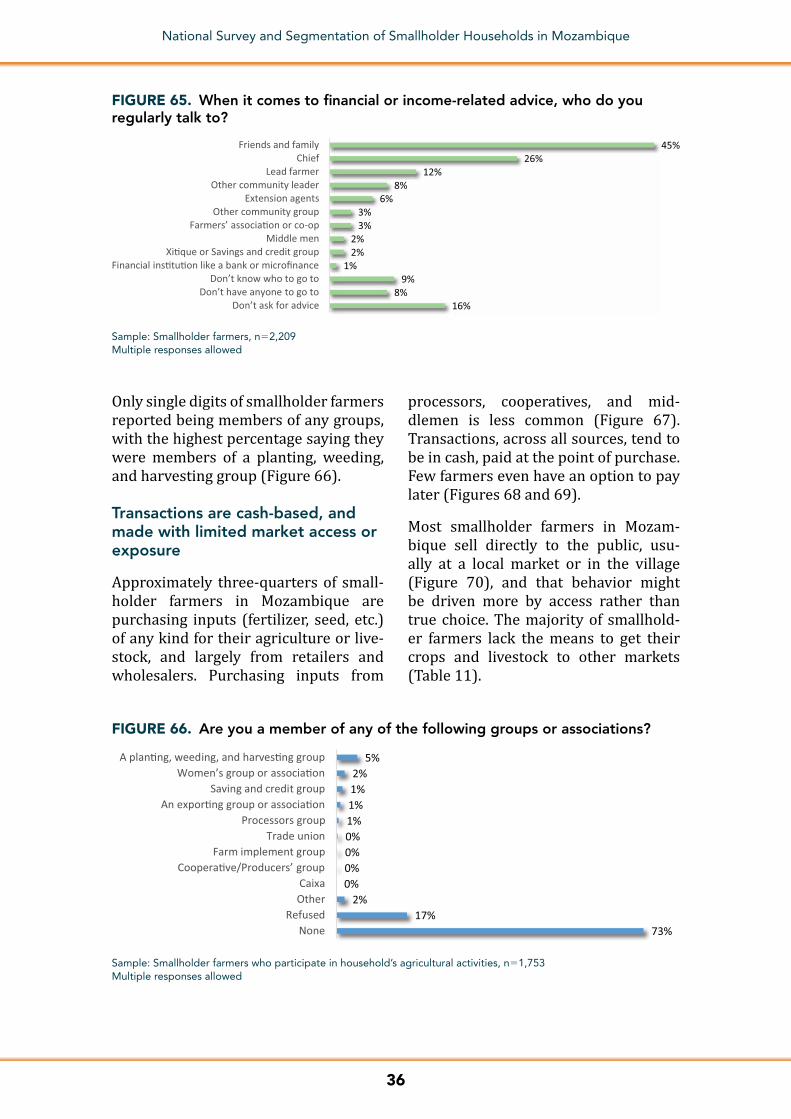
36
National Survey and Segmentation of Smallholder Households in Mozambique
16%8%
9%1%
2%2%
3%3%
6%8%
12%26%
45%
Don’t ask for adviceDon’t have anyone to go to
Don’t know who to go toFinancial ins�tu�on like a bank or microfinance
Xi�que or Savings and credit groupMiddle men
Farmers’ associa�on or co-opOther community group
Extension agentsOther community leader
Lead farmerChief
Friends and family
FIGURE 65. When it comes to financial or income-related advice, who do you regularly talk to?
Sample: Smallholder farmers, n52,209 Multiple responses allowed
FIGURE 66. Are you a member of any of the following groups or associations?
Sample: Smallholder farmers who participate in household’s agricultural activities, n51,753Multiple responses allowed
73%17%
2%0%0%0%0%1%1%1%2%
5%
NoneRefused
OtherCaixa
Coopera�ve/Producers’ groupFarm implement group
Trade unionProcessors group
An expor�ng group or associa�onSaving and credit group
Women’s group or associa�onA plan�ng, weeding, and harves�ng group
Only single digits of smallholder farmers reported being members of any groups, with the highest percentage saying they were members of a planting, weeding, and harvesting group (Figure 66).
Transactions are cash-based, and made with limited market access or exposure
Approximately three-quarters of small-holder farmers in Mozambique are purchasing inputs (fertilizer, seed, etc.) of any kind for their agriculture or live-stock, and largely from retailers and wholesalers. Purchasing inputs from
processors, cooperatives, and mid-dlemen is less common (Figure 67). Transactions, across all sources, tend to be in cash, paid at the point of purchase. Few farmers even have an option to pay later (Figures 68 and 69).
Most smallholder farmers in Mozam-bique sell directly to the public, usu-ally at a local market or in the village (Figure 70), and that behavior might be driven more by access rather than true choice. The majority of smallhold-er farmers lack the means to get their crops and livestock to other markets (Table 11).
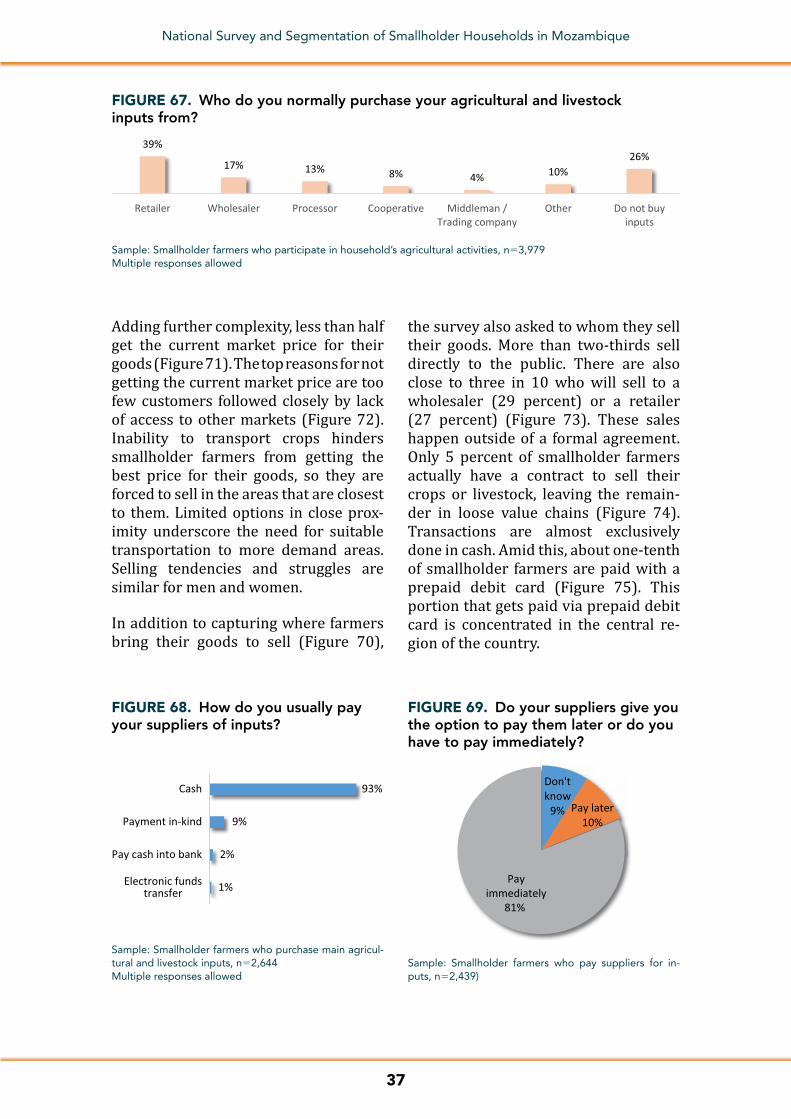
37
National Survey and Segmentation of Smallholder Households in Mozambique
FIGURE 67. Who do you normally purchase your agricultural and livestock inputs from?
Sample: Smallholder farmers who participate in household’s agricultural activities, n53,979Multiple responses allowed
39%
17% 13% 8% 4% 10%26%
Retailer Wholesaler Processor Coopera�ve Middleman /Trading company
Other Do not buyinputs
1%
2%
9%
93%
Electronic fundstransfer
Pay cash into bank
Payment in-kind
Cash
FIGURE 68. How do you usually pay your suppliers of inputs?
Sample: Smallholder farmers who purchase main agricul-tural and livestock inputs, n52,644 Multiple responses allowed
FIGURE 69. Do your suppliers give you the option to pay them later or do you have to pay immediately?
Sample: Smallholder farmers who pay suppliers for in-puts, n52,439)
Don't know
9% Pay later10%
Payimmediately
81%
Adding further complexity, less than half get the current market price for their goods (Figure 71). The top reasons for not getting the current market price are too few customers followed closely by lack of access to other markets (Figure 72). Inability to transport crops hinders smallholder farmers from getting the best price for their goods, so they are forced to sell in the areas that are closest to them. Limited options in close prox-imity underscore the need for suitable transportation to more demand areas. Selling tendencies and struggles are similar for men and women.
In addition to capturing where farmers bring their goods to sell (Figure 70),
the survey also asked to whom they sell their goods. More than two-thirds sell directly to the public. There are also close to three in 10 who will sell to a wholesaler (29 percent) or a retailer (27 percent) (Figure 73). These sales happen outside of a formal agreement. Only 5 percent of smallholder farmers actually have a contract to sell their crops or livestock, leaving the remain-der in loose value chains (Figure 74). Transactions are almost exclusively done in cash. Amid this, about one-tenth of smallholder farmers are paid with a prepaid debit card (Figure 75). This portion that gets paid via prepaid debit card is concentrated in the central re-gion of the country.

38
National Survey and Segmentation of Smallholder Households in Mozambique
TABLE 11. Why do you sell your crops and livestock at this location?
I do not have access to transport to other markets
57%
I get the best price at this market 43%
Poor road conditions to other markets
26%
I am not aware of prices at other markets
25%
Other reason 5%
Don’t know 9%
Sample: Smallholder farmers who know where crops and livestock were sold, n52,650Multiple responses allowed
Yes45% No
35%
Don't know20%
FIGURE 71. When you sell your crops and livestock, do you get the current market price?
Sample: Smallholder farmers who grow and sell crops, n52,718
12%
6%
14%
17%
39%
39%
57%
I do not know why
Corrup�on
Poor crop quality
I have to pay high commission rates tomiddlement
My customers take advantage of me
No access to transport to othermarkets
Too few customers
FIGURE 72. Why do you not get the current market price?
Sample: Smallholder farmers who do not get current market price for crops and livestock sold, n5973Multiple responses allowed
5%
13%
14%
72%
73%
Other
Regional market
At a farm to neighbor or travelingmerchant
In village
Local market
FIGURE 70. Where do you normally sell your crops and livestock?
Sample: Smallholder farmers who grow and sell crops, n52,718Multiple responses allowed
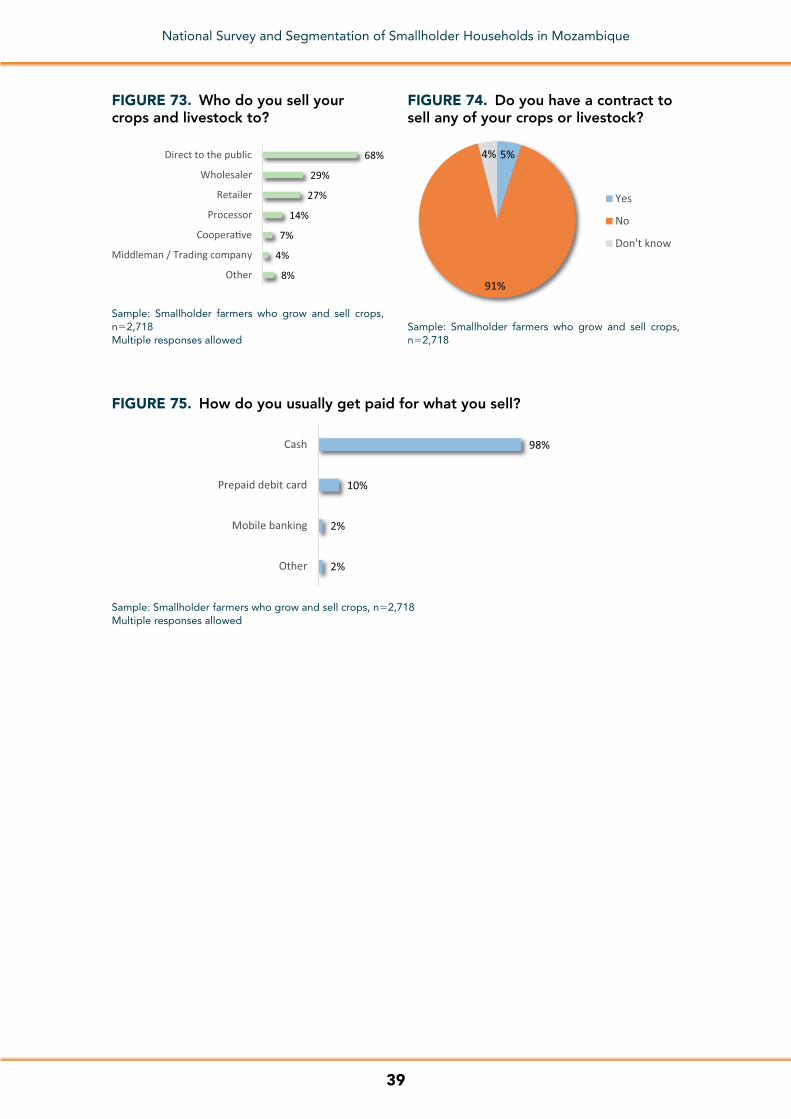
39
National Survey and Segmentation of Smallholder Households in Mozambique
2%
2%
10%
98%
Other
Mobile banking
Prepaid debit card
Cash
FIGURE 75. How do you usually get paid for what you sell?
Sample: Smallholder farmers who grow and sell crops, n52,718Multiple responses allowed
8%
4%
7%
14%
27%
29%
68%
Other
Middleman / Trading company
Coopera�ve
Processor
Retailer
Wholesaler
Direct to the public
FIGURE 73. Who do you sell your crops and livestock to?
Sample: Smallholder farmers who grow and sell crops, n52,718Multiple responses allowed
5%
91%
4%
Yes
No
Don't know
FIGURE 74. Do you have a contract to sell any of your crops or livestock?
Sample: Smallholder farmers who grow and sell crops, n52,718
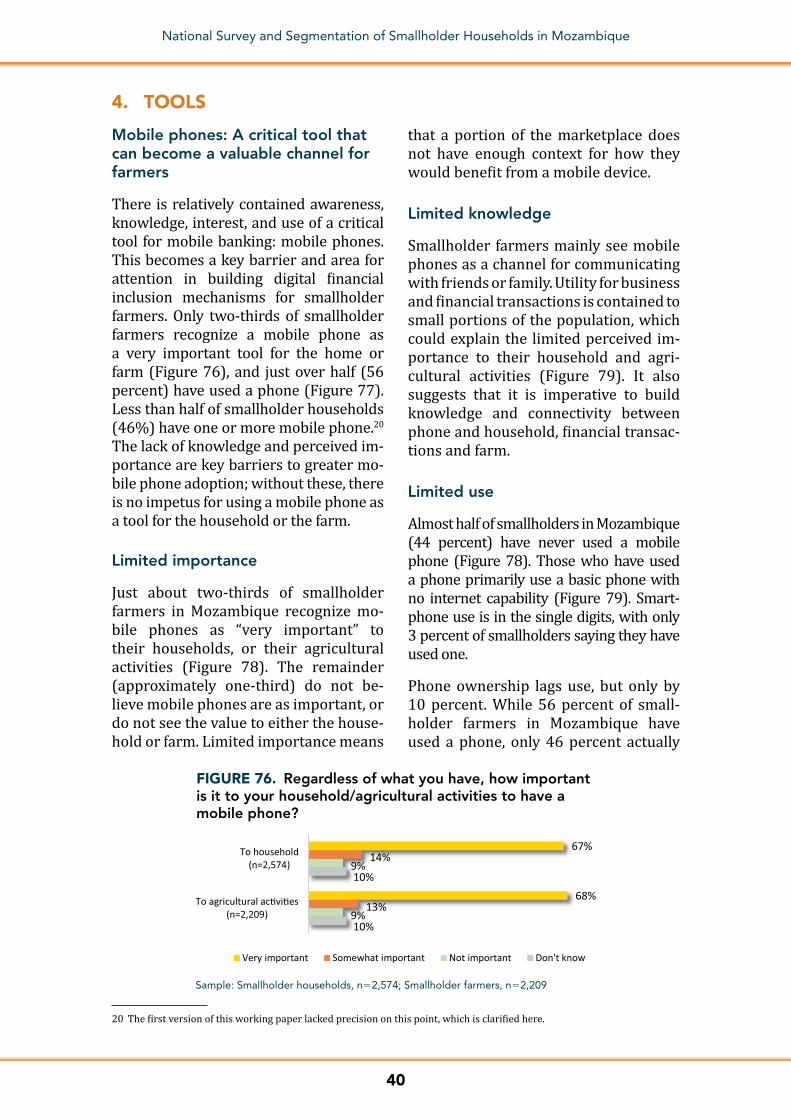
40
National Survey and Segmentation of Smallholder Households in Mozambique
4. TOOLS
Mobile phones: A critical tool that can become a valuable channel for farmers
There is relatively contained awareness, knowledge, interest, and use of a critical tool for mobile banking: mobile phones. This becomes a key barrier and area for attention in building digital financial inclusion mechanisms for smallholder farmers. Only two-thirds of smallholder farmers recognize a mobile phone as a very important tool for the home or farm (Figure 76), and just over half (56 percent) have used a phone (Figure 77). Less than half of smallholder households (46%) have one or more mobile phone.20 The lack of knowledge and perceived im-portance are key barriers to greater mo-bile phone adoption; without these, there is no impetus for using a mobile phone as a tool for the household or the farm.
Limited importance
Just about two-thirds of smallholder farmers in Mozambique recognize mo-bile phones as “very important” to their households, or their agricultural activities (Figure 78). The remainder (approximately one-third) do not be-lieve mobile phones are as important, or do not see the value to either the house-hold or farm. Limited importance means
that a portion of the marketplace does not have enough context for how they would benefit from a mobile device.
Limited knowledge
Smallholder farmers mainly see mobile phones as a channel for communicating with friends or family. Utility for business and financial transactions is contained to small portions of the population, which could explain the limited perceived im-portance to their household and agri-cultural activities (Figure 79). It also suggests that it is imperative to build knowledge and connectivity between phone and household, financial transac-tions and farm.
Limited use
Almost half of smallholders in Mozambique (44 percent) have never used a mobile phone (Figure 78). Those who have used a phone primarily use a basic phone with no internet capability (Figure 79). Smart-phone use is in the single digits, with only 3 percent of smallholders saying they have used one.
Phone ownership lags use, but only by 10 percent. While 56 percent of small-holder farmers in Mozambique have used a phone, only 46 percent actually
10%
10%
9%
9%
13%
14%
68%
67%
To agricultural ac�vi�es(n=2,209)
To household(n=2,574)
Very important Somewhat important Not important Don't know
FIGURE 76. Regardless of what you have, how important is it to your household/agricultural activities to have a mobile phone?
Sample: Smallholder households, n52,574; Smallholder farmers, n52,209
20 The first version of this working paper lacked precision on this point, which is clarified here.
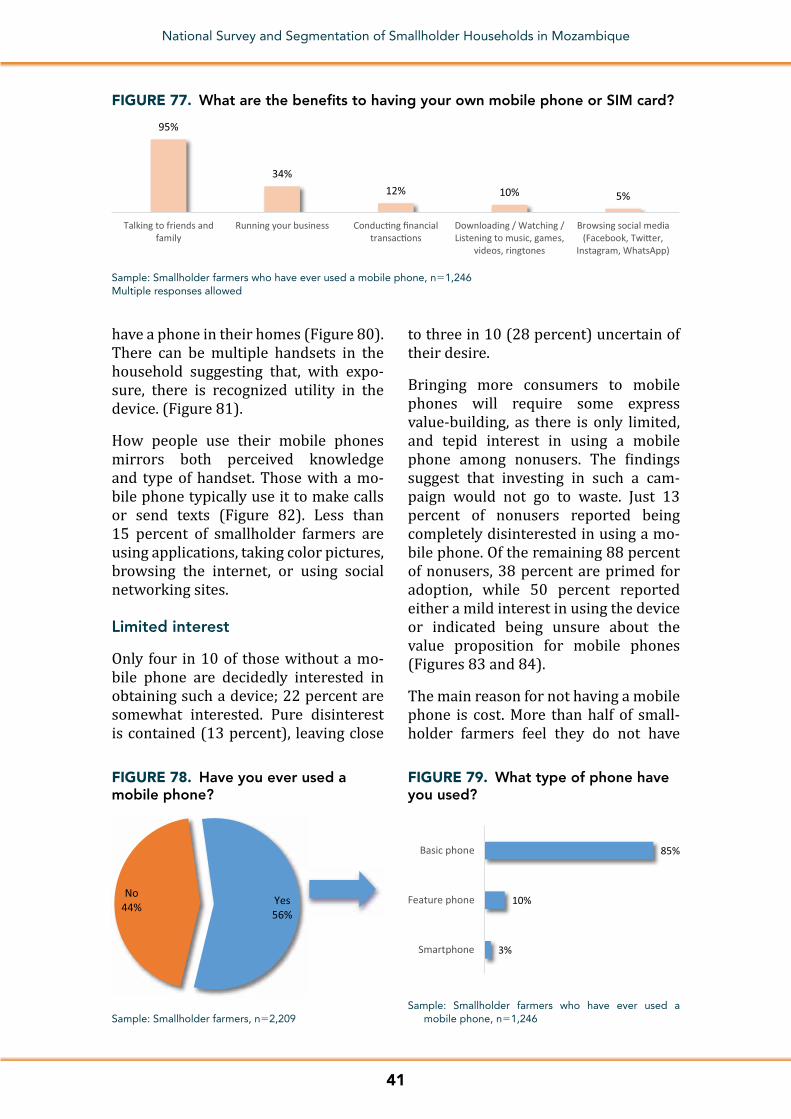
41
National Survey and Segmentation of Smallholder Households in Mozambique
have a phone in their homes (Figure 80). There can be multiple handsets in the household suggesting that, with expo-sure, there is recognized utility in the device. (Figure 81).
How people use their mobile phones mirrors both perceived knowledge and type of handset. Those with a mo-bile phone typically use it to make calls or send texts (Figure 82). Less than 15 percent of smallholder farmers are using applications, taking color pictures, browsing the internet, or using social networking sites.
Limited interest
Only four in 10 of those without a mo-bile phone are decidedly interested in obtaining such a device; 22 percent are somewhat interested. Pure disinterest is contained (13 percent), leaving close
to three in 10 (28 percent) uncertain of their desire.
Bringing more consumers to mobile phones will require some express value-building, as there is only limited, and tepid interest in using a mobile phone among nonusers. The findings suggest that investing in such a cam-paign would not go to waste. Just 13 percent of nonusers reported being completely disinterested in using a mo-bile phone. Of the remaining 88 percent of nonusers, 38 percent are primed for adoption, while 50 percent reported either a mild interest in using the device or indicated being unsure about the value proposition for mobile phones (Figures 83 and 84).
The main reason for not having a mobile phone is cost. More than half of small-holder farmers feel they do not have
Sample: Smallholder farmers who have ever used a mobile phone, n51,246Multiple responses allowed
95%
34%12% 10% 5%
Talking to friends andfamily
Running your business Conduc�ng financialtransac�ons
Downloading / Watching /Listening to music, games,
videos, ringtones
Browsing social media(Facebook, Twi�er,
Instagram, WhatsApp)
FIGURE 77. What are the benefits to having your own mobile phone or SIM card?
Yes56%
No44%
FIGURE 78. Have you ever used a mobile phone?
Sample: Smallholder farmers, n52,209
3%
10%
85%
Smartphone
Feature phone
Basic phone
FIGURE 79. What type of phone have you used?
Sample: Smallholder farmers who have ever used a mobile phone, n51,246

42
National Survey and Segmentation of Smallholder Households in Mozambique
54%
23%
14%
6% 4%
None One Two Three Four ormore
FIGURE 80. How many people in your household own a mobile phone?
Sample: Smallholder farmers, n52,574
8%
54%
38%
All householdmembers own amobile phone
No householdmembers own amobile phone
Some householdmembers own amobile phone
FIGURE 81. How many people in your household own a mobile phone?
Sample: Smallholder farmers, n52,574
40%
25%24% 24%
12% 10%14% 13%
2%
15%7%
12%
Made/received calls Sent/received text messages or photos
YesterdayIn the past 7 daysIn the past 30 daysMore than 30 days agoNeverDon't know
FIGURE 82. Apart from today, when was the last time you performed the following activities on the mobile phone you use?
Sample: Smallholder farmers who have ever used a mobile phone, n51,246
Yes56%
No44%
FIGURE 83. Have you ever used a mobile phone?
Sample: Smallholder farmers, n52,209
28%
13%
22%
38%
Don't know
Not interested
Somewhat interested
Very interested
FIGURE 84. How interested would you be in using a mobile phone?
Sample: Smallholder farmers who have never used a mobile phone, n5963
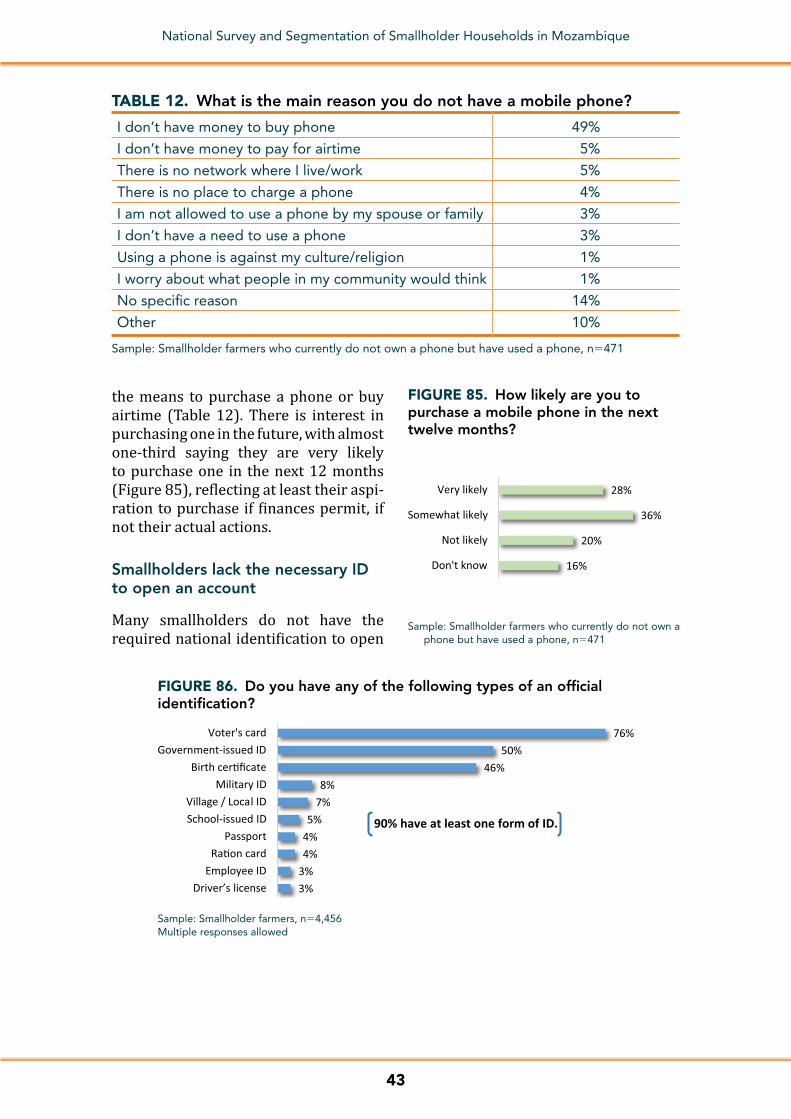
43
National Survey and Segmentation of Smallholder Households in Mozambique
the means to purchase a phone or buy airtime (Table 12). There is interest in purchasing one in the future, with almost one-third saying they are very likely to purchase one in the next 12 months (Figure 85), reflecting at least their aspi-ration to purchase if finances permit, if not their actual actions.
Smallholders lack the necessary ID to open an account
Many smallholders do not have the required national identification to open
TABLE 12. What is the main reason you do not have a mobile phone?
I don’t have money to buy phone 49%
I don’t have money to pay for airtime 5%
There is no network where I live/work 5%
There is no place to charge a phone 4%
I am not allowed to use a phone by my spouse or family 3%
I don’t have a need to use a phone 3%
Using a phone is against my culture/religion 1%
I worry about what people in my community would think 1%
No specific reason 14%
Other 10%
Sample: Smallholder farmers who currently do not own a phone but have used a phone, n5471
Sample: Smallholder farmers who currently do not own a phone but have used a phone, n5471
FIGURE 85. How likely are you to purchase a mobile phone in the next twelve months?
16%
20%
36%
28%
Don't know
Not likely
Somewhat likely
Very likely
Sample: Smallholder farmers, n54,456Multiple responses allowed
3%3%4%4%5%
7%8%
46%50%
76%
Driver’s licenseEmployee ID
Ra�on cardPassport
School-issued IDVillage / Local ID
Military IDBirth cer�ficate
Government-issued IDVoter's card
90% have at least one form of ID.
FIGURE 86. Do you have any of the following types of an official identification?
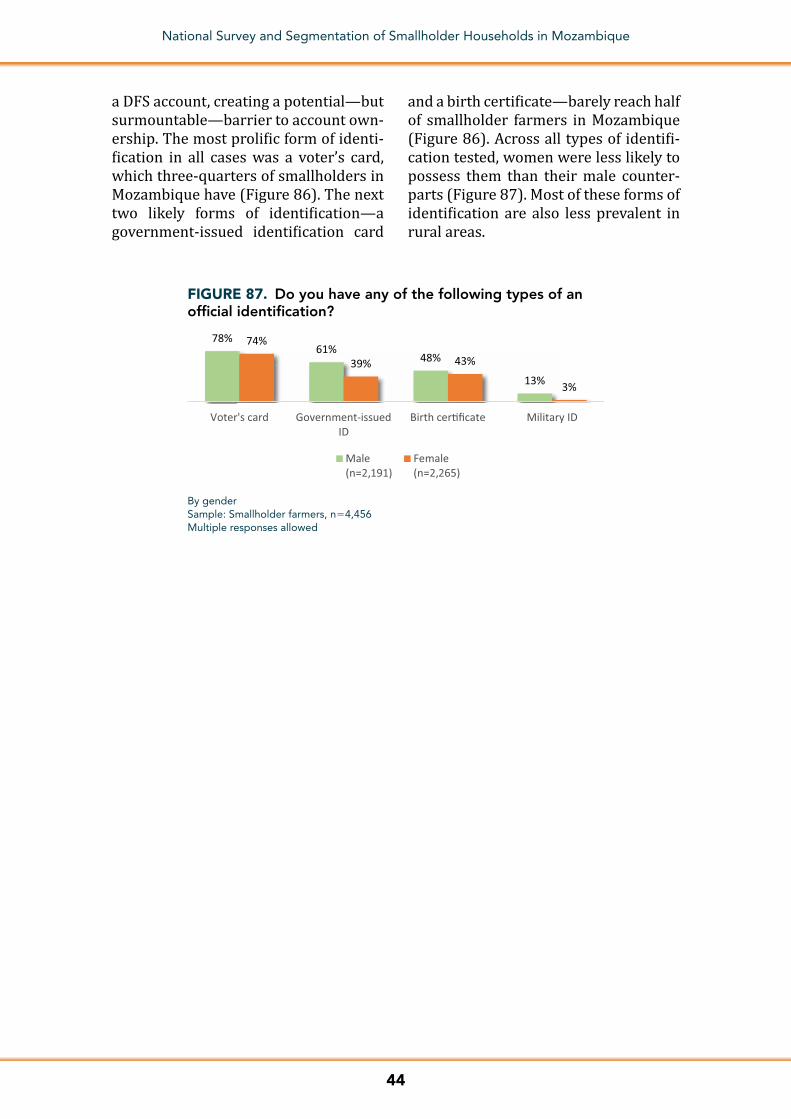
44
National Survey and Segmentation of Smallholder Households in Mozambique
78%61%
48%
13%
74%
39% 43%
3%
Voter's card Government-issuedID
Birth cer�ficate Military ID
Male(n=2,191)
Female(n=2,265)
FIGURE 87. Do you have any of the following types of an official identification?
By genderSample: Smallholder farmers, n54,456Multiple responses allowed
a DFS account, creating a potential—but surmountable—barrier to account own-ership. The most prolific form of identi-fication in all cases was a voter’s card, which three-quarters of smallholders in Mozambique have (Figure 86). The next two likely forms of identification—a government-issued identification card
and a birth certificate—barely reach half of smallholder farmers in Mozambique (Figure 86). Across all types of identifi-cation tested, women were less likely to possess them than their male counter-parts (Figure 87). Most of these forms of identification are also less prevalent in rural areas.

45
National Survey and Segmentation of Smallholder Households in Mozambique
5 FINANCIAL INCLUSION
Financial inclusion: Value of formal financial institutions is elusive to smallholders
Many improvements and advances have been made in Mozambique’s banking industry in recent years, and as a result, banks dominate the financial landscape of the country as a whole, according to “Enhancing Financial Capability and In-clusion in Mozambique: A Demand-Side Assessment” (World Bank). The limita-tions are mostly in rural areas, where there is far less bank presence than in the more urban or peri-urban areas.21
These limitations factor heavily into smallholder farmers’ limited access to banks. Less than one-quarter said they have ever been inside of a bank (Figure 88). The majority of smallholder farmers, re-gardless of whether they have been inside a bank, are unaware of the benefits of hav-ing a bank account (Figure 89). This low awareness will influence any kind of adop-tion of accounts. Almost one-third appreci-ated that a bank account would grant them the ability to save money, and 27 percent said they can use a bank account to save in a secure location. Sixty-four percent of smallholders, who have not been inside a bank, reported not knowing any bene-fits to having an account. The most well-known benefit of a bank account among those that have yet to enter a bank is the ability to save money (24 percent).
Only 10 percent of smallholder farmers have a bank account registered in their name (Figure 90). An additional 5 percent use a bank account that belongs to some-one else if they need it. Of those smallholder farmers who have a bank account regis-tered in their name, almost two-thirds have their accounts at Banco Internacio-nal de Moçambique and one-quarter have
21 Enhancing Financial Capability and Inclusion in Mozambique: A Demand-Side Assessment, World Bank, 2014, https://openknowledge.worldbank.org/handle/10986/19977.
Yes24%
No76%
FIGURE 88. Have you ever been inside a bank?
Sample: Smallholder farmers, n52,209
Don’t know
Ability to do more business
Ability to send or receivepayments
Avoid lengthy wait �mes for billpayments
Ability to send or receive moneyto/from family or friends
Saving money in a secureloca�on
Ability to save money
51%
11%
11%
14%
14%
27%
31%
FIGURE 89. What are the benefits to having a bank account?
Sample: Smallholder farmers, n52,209Multiple responses allowed
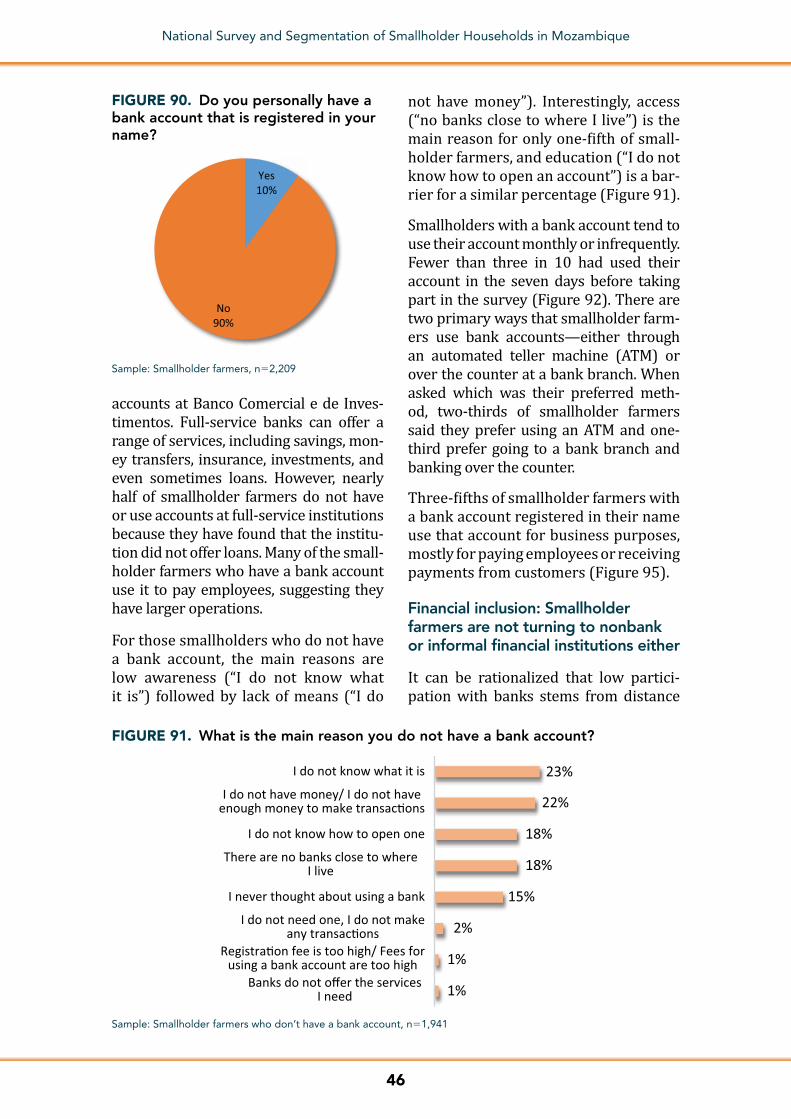
46
National Survey and Segmentation of Smallholder Households in Mozambique
accounts at Banco Comercial e de Inves-timentos. Full-service banks can offer a range of services, including savings, mon-ey transfers, insurance, investments, and even sometimes loans. However, nearly half of smallholder farmers do not have or use accounts at full-service institutions because they have found that the institu-tion did not offer loans. Many of the small-holder farmers who have a bank account use it to pay employees, suggesting they have larger operations.
For those smallholders who do not have a bank account, the main reasons are low awareness (“I do not know what it is”) followed by lack of means (“I do
not have money”). Interestingly, access (“no banks close to where I live”) is the main reason for only one-fifth of small-holder farmers, and education (“I do not know how to open an account”) is a bar-rier for a similar percentage (Figure 91).
Smallholders with a bank account tend to use their account monthly or infrequently. Fewer than three in 10 had used their account in the seven days before taking part in the survey (Figure 92). There are two primary ways that smallholder farm-ers use bank accounts—either through an automated teller machine (ATM) or over the counter at a bank branch. When asked which was their preferred meth-od, two-thirds of smallholder farmers said they prefer using an ATM and one-third prefer going to a bank branch and banking over the counter.
Three-fifths of smallholder farmers with a bank account registered in their name use that account for business purposes, mostly for paying employees or receiving payments from customers (Figure 95).
Financial inclusion: Smallholder farmers are not turning to nonbank or informal financial institutions either
It can be rationalized that low partici-pation with banks stems from distance
Yes10%
No90%
FIGURE 90. Do you personally have a bank account that is registered in your name?
Sample: Smallholder farmers, n52,209
Sample: Smallholder farmers who don’t have a bank account, n51,941
1%
1%
2%
15%
18%
18%
22%
23%
Banks do not offer the servicesI need
Registra�on fee is too high/ Fees forusing a bank account are too high
I do not need one, I do not makeany transac�ons
I never thought about using a bank
There are no banks close to whereI live
I do not know how to open one
I do not have money/ I do not haveenough money to make transac�ons
I do not know what it is
FIGURE 91. What is the main reason you do not have a bank account?
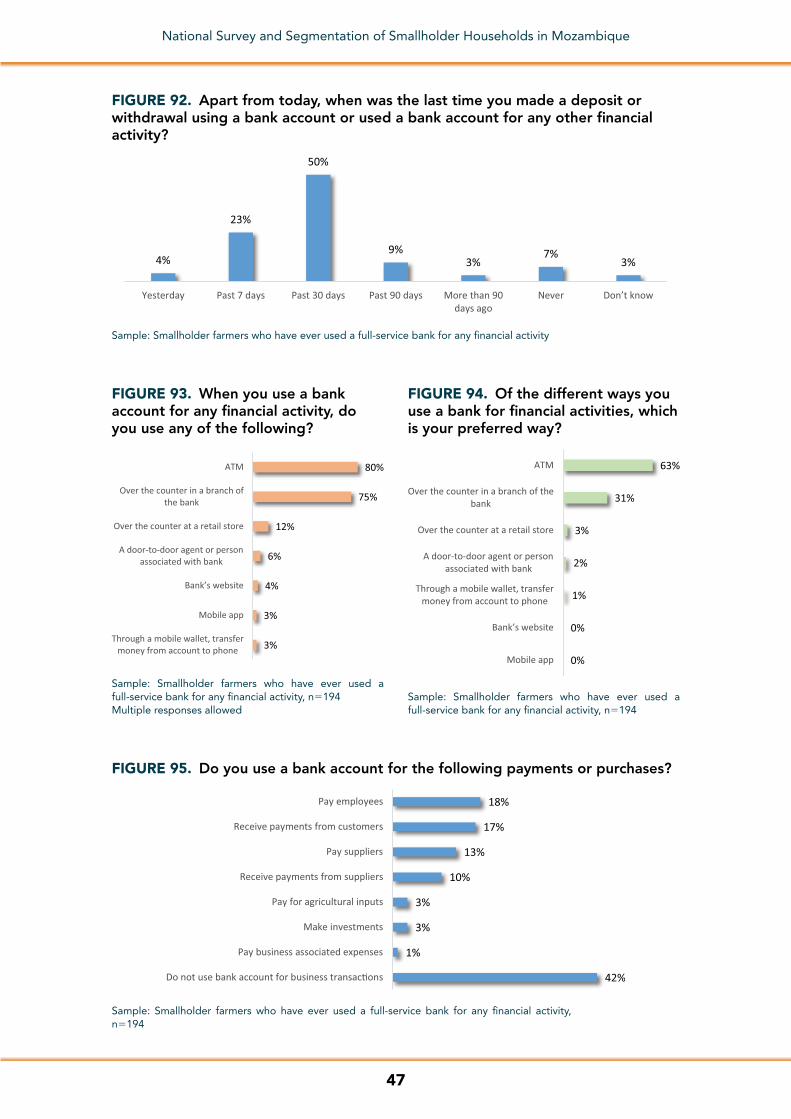
47
National Survey and Segmentation of Smallholder Households in Mozambique
4%
23%
50%
9%3%
7%3%
Yesterday Past 7 days Past 30 days Past 90 days More than 90days ago
Never Don’t know
FIGURE 92. Apart from today, when was the last time you made a deposit or withdrawal using a bank account or used a bank account for any other financial activity?
Sample: Smallholder farmers who have ever used a full-service bank for any financial activity
3%
3%
4%
6%
12%
75%
80%
Through a mobile wallet, transfermoney from account to phone
Mobile app
Bank’s website
A door-to-door agent or personassociated with bank
Over the counter at a retail store
Over the counter in a branch ofthe bank
ATM
FIGURE 93. When you use a bank account for any financial activity, do you use any of the following?
Sample: Smallholder farmers who have ever used a full-service bank for any financial activity, n5194Multiple responses allowed
0%
0%
1%
2%
3%
31%
63%
Mobile app
Bank’s website
Through a mobile wallet, transfermoney from account to phone
A door-to-door agent or personassociated with bank
Over the counter at a retail store
Over the counter in a branch of thebank
ATM
FIGURE 94. Of the different ways you use a bank for financial activities, which is your preferred way?
Sample: Smallholder farmers who have ever used a full-service bank for any financial activity, n5194
42%
1%
3%
3%
10%
13%
17%
18%
Do not use bank account for business transac�ons
Pay business associated expenses
Make investments
Pay for agricultural inputs
Receive payments from suppliers
Pay suppliers
Receive payments from customers
Pay employees
FIGURE 95. Do you use a bank account for the following payments or purchases?
Sample: Smallholder farmers who have ever used a full-service bank for any financial activity, n5194

48
National Survey and Segmentation of Smallholder Households in Mozambique
because farmers are typically located in rural areas, requirements that do not suit the smallholder, or simply lack of knowledge about options. These barriers to formal financial institutions can make way for the nonbank financial channels, such as MFIs, cooperatives, or credit unions, to be very popular in rural areas.
Smallholder farmers in Mozambique, however, are not turning to other NBFIs, such as credit unions, cooperatives, or MFIs. The highest use number for these types of institutions is 4 percent for mi-crofinance; account ownership is even less (Figure 96). This use figure for NBFIs is in reality even less, as the majority of smallholders have not used their accounts in the past month. A significant portion of smallholder farmers have stopped using these NBFIs accounts altogether.
Informal financial service providers are used at a much higher rate than NBFIs, with the highest numbers saying they have used a xitique (an informal sav-ings and credit group), moneylenders, and money guards (Figure 97). The smallholder farmers who use these pro-viders do so somewhat regularly, with about half saying they have used money guards and xitiques in the past month, and only about a third reporting they have used moneylenders in the past month (Figure 97). When asked to prioritize, the majority of smallholders chose xitiques
as the most important informal financial service provider (Figure 98).
The main reason smallholder farmers do not have membership in any informal financial service provider is mostly financial (Figure 99). More than half of smallholder farmers do not have any money to have a membership; one-fifth are unaware of these groups.
Financial inclusion: Mobile money awareness is very low
Roughly one-quarter of smallholder farmers say they have heard of mobile
Sample: Smallholder farmers, n52,209
0.3%
1%
3%
1%
2%
4%
Credit union
Coopera�ve
Microfinance ins�tu�on
Have used
Have account
FIGURE 96. Have you ever used any of the following? Do you have an account/membership in your name with any of the following?
1%
2%
6%
12%
17%
A digital card or rechargecard is not a�ached to a
bank or MFI account
Savings collectors
A money guard/ someonein workplace or
neighborhood that collectsand keeps savings deposits
Money lenders
Xi�que or saving andcredit group
FIGURE 97. Have you ever used any of the following?
Sample: Smallholder farmers, n52,209

49
National Survey and Segmentation of Smallholder Households in Mozambique
Sample: Smallholder farmers, n52,209
A money guard/someone in
workplace orneighborhood thatcollects and keepssavings deposits
(n=153)
Xi�que orsaving and
credit group(n=459)
Money lenders(n=246)
Past 7 days
Past 30days
More than30 days agoStoppedusing
Don't know17% 12% 12%
11% 17% 18%
17%26%
36%
40%37%
24%
16% 9% 10%
FIGURE 98. Apart from today when was the last time you used these services or service providers for any financial activity?
money (Figure 100), and the majority of them see benefits to having a mobile money account (Figure 101). The benefits they cited most often included avoiding lengthy wait times for bill payments and the ability to save money (Figure 102).
Roughly half of those who perceive benefits to having an account view mo-bile money as a secure location. Con-ducting business via a mobile money account does not seem to register as a benefit, as it was one of the lowest- scoring reasons.
56%
21% 16%6% 5% 5% 3%
13%
You don’t have any money
You don’t know about them
You don’t trust them
You have anaccount in a bankor other formal
ins�tu�on
People steal yourmoney
You don’t need any service from
them
Groups requiretoo much �me in
mee�ngs
Another reason
Sample: Smallholder farmers who do not have any membership with an informal financial service provider, n51,816Multiple responses allowed
FIGURE 99. Why do you not have a membership with any of these groups?
Yes27%
No73%
FIGURE 100. Have you ever heard of something called mobile money?
Sample: Smallholder farmers, n52,209
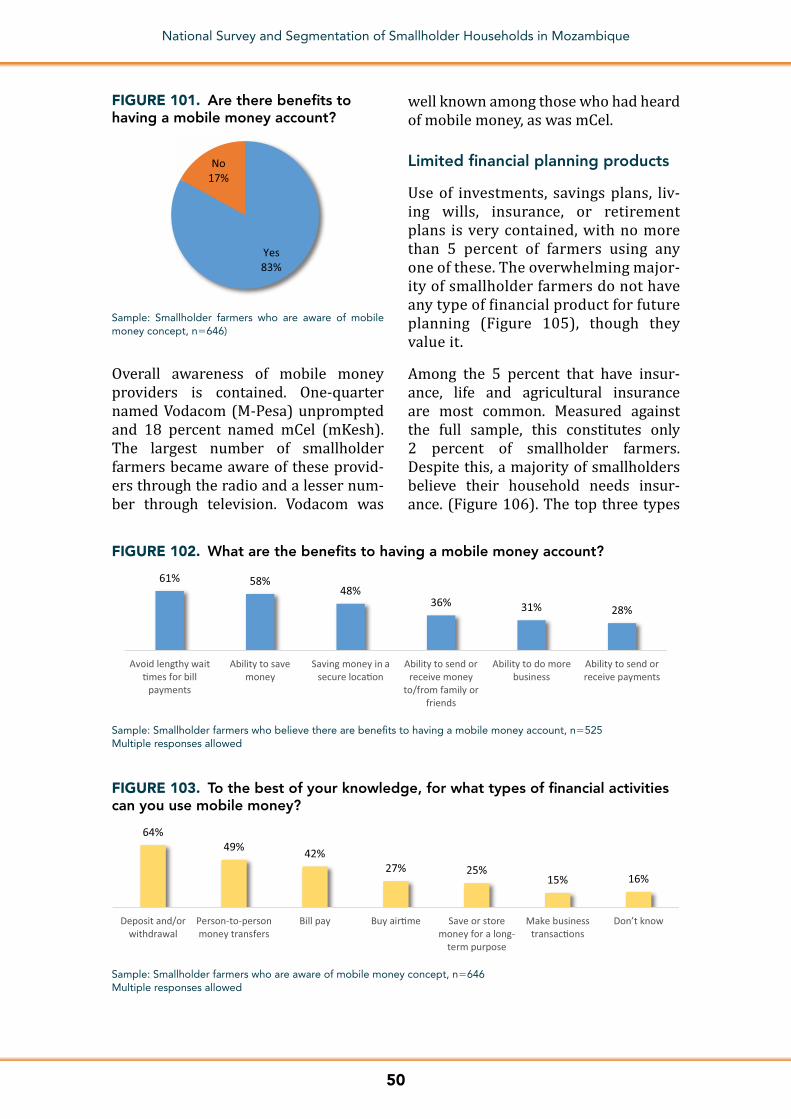
50
National Survey and Segmentation of Smallholder Households in Mozambique
Overall awareness of mobile money providers is contained. One-quarter named Vodacom (M-Pesa) unprompted and 18 percent named mCel (mKesh). The largest number of smallholder farmers became aware of these provid-ers through the radio and a lesser num-ber through television. Vodacom was
well known among those who had heard of mobile money, as was mCel.
Limited financial planning products
Use of investments, savings plans, liv-ing wills, insurance, or retirement plans is very contained, with no more than 5 percent of farmers using any one of these. The overwhelming major-ity of smallholder farmers do not have any type of financial product for future planning (Figure 105), though they value it.
Among the 5 percent that have insur-ance, life and agricultural insurance are most common. Measured against the full sample, this constitutes only 2 percent of smallholder farmers. Despite this, a majority of smallholders believe their household needs insur-ance. (Figure 106). The top three types
61% 58%48%
36% 31% 28%
Avoid lengthy wait�mes for bill
payments
Ability to savemoney
Saving money in asecure loca�on
Ability to send orreceive money
to/from family orfriends
Ability to do morebusiness
Ability to send orreceive payments
FIGURE 102. What are the benefits to having a mobile money account?
Sample: Smallholder farmers who believe there are benefits to having a mobile money account, n5525Multiple responses allowed
Sample: Smallholder farmers who are aware of mobile money concept, n5646Multiple responses allowed
64%49% 42%
27% 25%15% 16%
Deposit and/orwithdrawal
Person-to-personmoney transfers
Bill pay Buy air�me Save or storemoney for a long-
term purpose
Make businesstransac�ons
Don’t know
FIGURE 103. To the best of your knowledge, for what types of financial activities can you use mobile money?
Yes83%
No17%
FIGURE 101. Are there benefits to having a mobile money account?
Sample: Smallholder farmers who are aware of mobile money concept, n5646)

51
National Survey and Segmentation of Smallholder Households in Mozambique
23%
68%
92%
6%
18%
25%
Other
mCel
Vodacom
Overall awareness(n=2,209)
Aware of mobile money concept(n=646)
By overall awareness and awareness of mobile money conceptSample: Smallholder farmers, n52,209Multiple responses allowed
FIGURE 104. Please tell me the names of any mobile money providers that you are aware of?
85%
4%
4%
5%
5%
5%
None of the above
A re�rement plan that will help me live comfortablya�er I stop working
An insurance plan
A living will; I know what will happen to my money if Idie unexpectedly
A savings plan
An investment
FIGURE 105. Do you have any of the following?
Sample: Smallholder farmers, n52,209
Sample: Smallholder farmers, n52,209
61% 60%51%
42%
20%12%
Life Agriculture Medical House / property Unemployment /income protec�on
Car
FIGURE 106. Which of the following types of insurance do you feel your household needs the most?
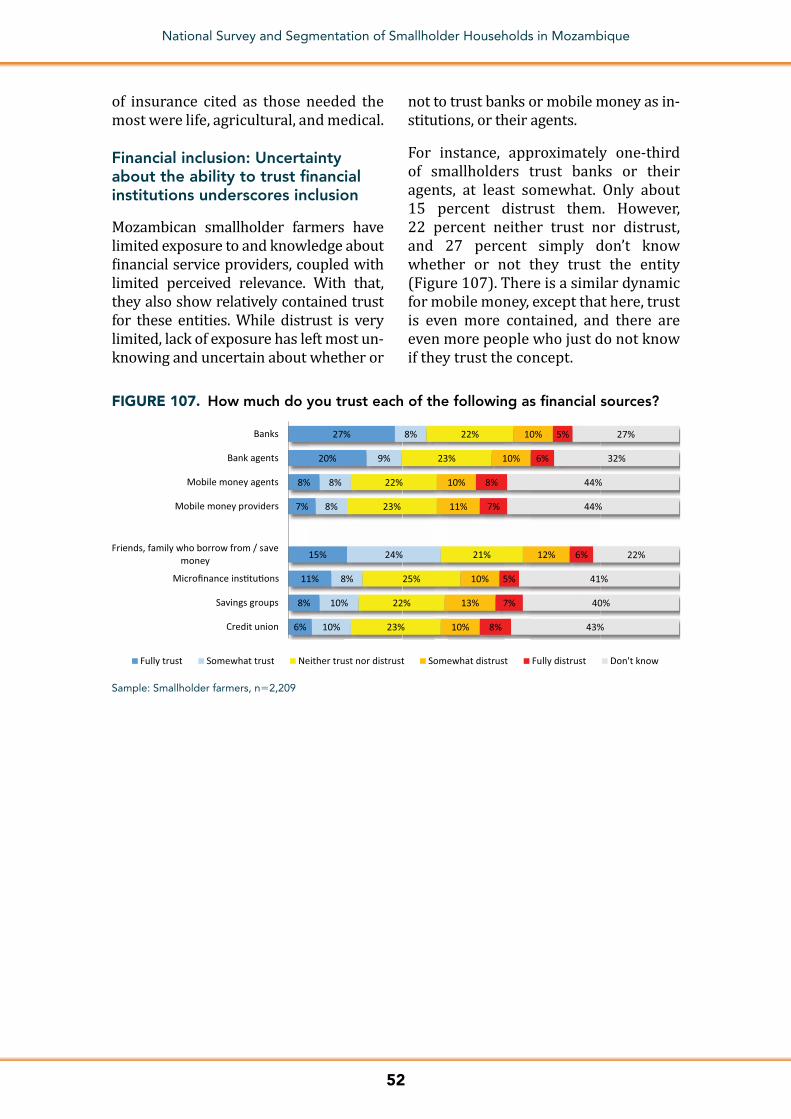
52
National Survey and Segmentation of Smallholder Households in Mozambique
6%
8%
11%
15%
7%
8%
20%
27%
10%
10%
8%
24%
8%
8%
9%
8%
23%
22%
25%
21%
23%
22%
23%
22%
10%
13%
10%
12%
11%
10%
10%
10%
8%
7%
5%
6%
7%
8%
6%
5%
43%
40%
41%
22%
44%
44%
32%
27%
Credit union
Savings groups
Microfinance ins�tu�ons
Friends, family who borrow from / savemoney
Mobile money providers
Mobile money agents
Bank agents
Banks
Fully trust Somewhat trust Neither trust nor distrust Somewhat distrust Fully distrust Don't know
Sample: Smallholder farmers, n52,209
FIGURE 107. How much do you trust each of the following as financial sources?
of insurance cited as those needed the most were life, agricultural, and medical.
Financial inclusion: Uncertainty about the ability to trust financial institutions underscores inclusion
Mozambican smallholder farmers have limited exposure to and knowledge about financial service providers, coupled with limited perceived relevance. With that, they also show relatively contained trust for these entities. While distrust is very limited, lack of exposure has left most un-knowing and uncertain about whether or
not to trust banks or mobile money as in-stitutions, or their agents.
For instance, approximately one-third of smallholders trust banks or their agents, at least somewhat. Only about 15 percent distrust them. However, 22 percent neither trust nor distrust, and 27 percent simply don’t know whether or not they trust the entity (Figure 107). There is a similar dynamic for mobile money, except that here, trust is even more contained, and there are even more people who just do not know if they trust the concept.
53
National Survey and Segmentation of Smallholder Households in Mozambique
6. TOOLS AND FINANCIAL INCLUSION: SEGMENTATION—MOZAMBIQUE’S FIVE UNIQUE SMALLHOLDER FARMING HOUSEHOLD SEGMENTS
The Segmentation Technique
Often a collection of demographic, psy-chographic, behavioral, and attitudinal dimensions can characterize unique groups within an overall population, more so than any singular factor or variable. The CGAP National Survey and Segmentation of Smallholder House-holds in Mozambique anticipated the complexity of smallholder households, expecting that there would be unique personas within the broader popula-tion.22 To that end, it sought to explore those key dimensions (attitudes, expec-tations, and behaviors) that underlie dif-ferent groups of smallholder households using a segmentation analysis.
Segmentation is a form of statistical multivariate analysis that groups people based on their psychographics,23 atti-tudes, expectations, or behaviors with re-spect to their own household dynamics. The groups, also referred to as clusters, that emerge from the analysis ultimately allow us to deepen our understanding of how various characteristics drive finan-cial inclusion. Classifying smallholder households by key attitudinal and be-havioral characteristics provides a bet-ter understanding of the population and the challenges on the path to financial inclusion.
The segmentation process used here uncovers various underlying structures that delineate groups of people. This clustering technique looks for homog-enous groups that exist within the sample of the population examined. It does not create these groups. Rather, the technique identifies groups by looking
at the responses given by each respon-dent in the sample to various questions, examining how respondents are similar to each other and how they differ.
Truly effective segmentation analyses are rooted in dimensions that lead to a common, desired, and shared goal for the population overall. This allows a segmentation analysis to be more ger-mane and better targeted, therefore, more useful for interested parties. In the case of the smallholder households in Mozambique, the common, shared goal is building strategies for bringing about more useful, reliable, trusted, consumer-focused, if not even formal financial services both connected to agriculture and meet the wide range of other household needs. Therefore, this segmentation is rooted in defining ele-ments that correlate with greater formal financial inclusion.
Living beyond the initial analysis, this segmentation can be repeated in fol-low-up or tangential studies, where the discerning indicators that define the seg-ments are included to create the same groups within the target audience. For instance, an organization bringing a fi-nancial mechanism to market can use these segments to do the following:
■■ Identify which segment poses the most potential for the organization and its intentions.
■■ Customize type of mechanism based on the needs of a desired segment.
■■ Fine-tune application and go-to market strategy based on market readiness of the segment.
22 Persons as profiles that create reliable and realistic representations of key audience segments for reference.23 Psychographics refer to behaviors, interests, activities, and acquisitions of a population. Together with demographics and
other attitudinal factors.
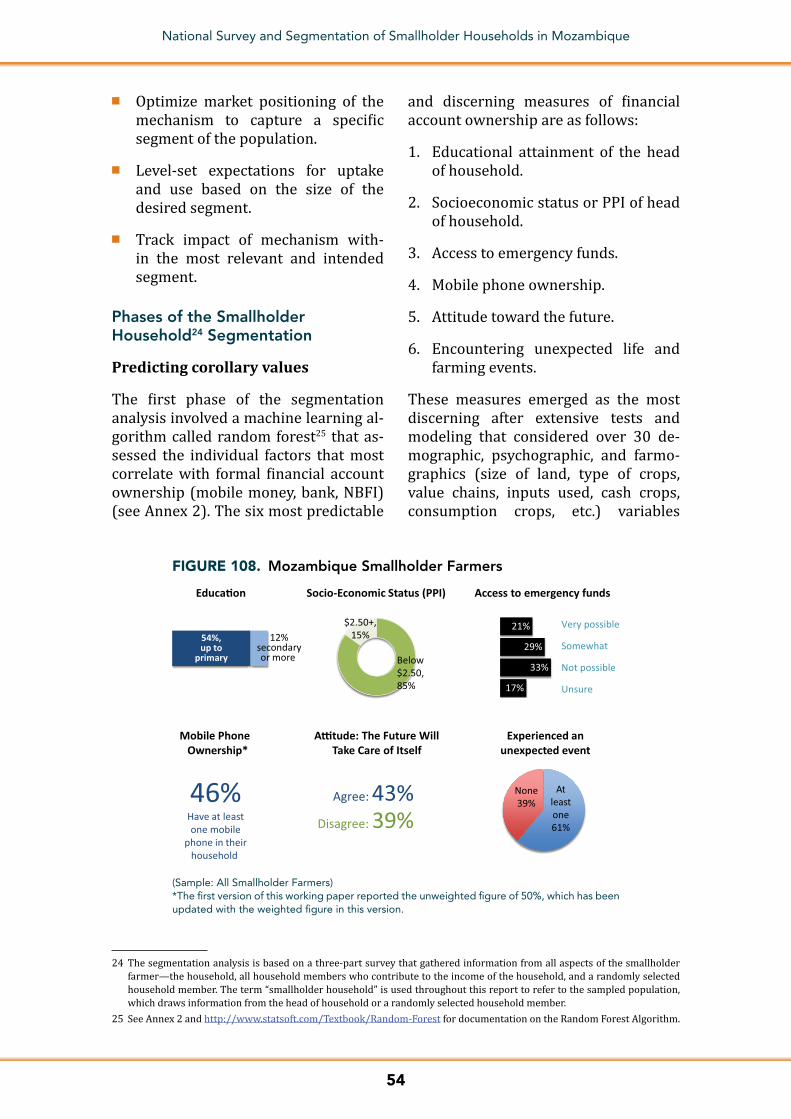
54
National Survey and Segmentation of Smallholder Households in Mozambique
■■ Optimize market positioning of the mechanism to capture a specific segment of the population.
■■ Level-set expectations for uptake and use based on the size of the desired segment.
■■ Track impact of mechanism with-in the most relevant and intended segment.
Phases of the Smallholder Household24 Segmentation
Predicting corollary values
The first phase of the segmentation analysis involved a machine learning al-gorithm called random forest25 that as-sessed the individual factors that most correlate with formal financial account ownership (mobile money, bank, NBFI) (see Annex 2). The six most predictable
and discerning measures of financial account ownership are as follows:
1. Educational attainment of the head of household.
2. Socioeconomic status or PPI of head of household.
3. Access to emergency funds.
4. Mobile phone ownership.
5. Attitude toward the future.
6. Encountering unexpected life and farming events.
These measures emerged as the most discerning after extensive tests and modeling that considered over 30 de-mographic, psychographic, and farmo-graphics (size of land, type of crops, value chains, inputs used, cash crops, consumption crops, etc.) variables
24 The segmentation analysis is based on a three-part survey that gathered information from all aspects of the smallholder farmer—the household, all household members who contribute to the income of the household, and a randomly selected household member. The term “smallholder household” is used throughout this report to refer to the sampled population, which draws information from the head of household or a randomly selected household member.
25 See Annex 2 and http://www.statsoft.com/Textbook/Random-Forest for documentation on the Random Forest Algorithm.
(Sample: All Smallholder Farmers)*The first version of this working paper reported the unweighted figure of 50%, which has been updated with the weighted figure in this version.
54%,up to
primary
12%secondaryor more Below
$2.50,85%
$2.50+,15%
Socio-Economic Status (PPI)Educa�on
Mobile Phone Ownership*
Access to emergency funds
17%
33%
29%
21% Very possible
Somewhat
Not possible
Unsure
46%Have at leastone mobile
phone in theirhousehold
Experienced an unexpected event
A�tude: The Future Will Take Care of Itself
Agree: 43% Atleastone61%
None39%
Disagree: 39%
FIGURE 108. Mozambique Smallholder Farmers
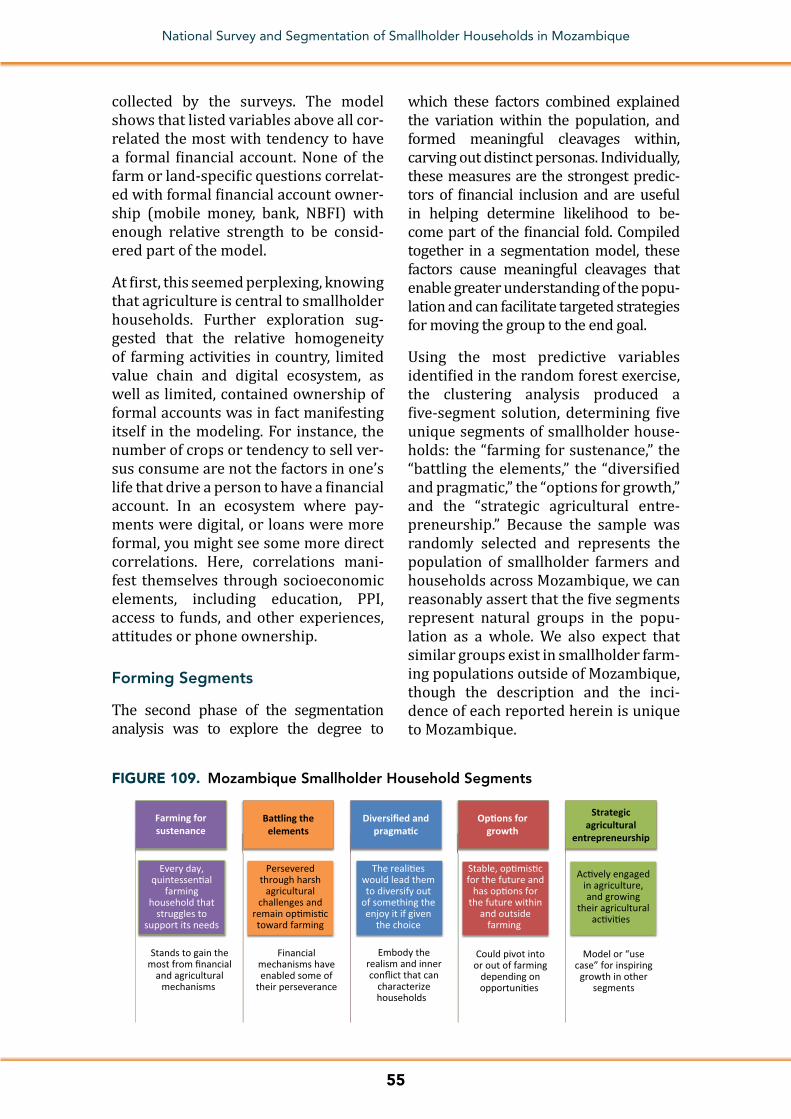
55
National Survey and Segmentation of Smallholder Households in Mozambique
collected by the surveys. The model shows that listed variables above all cor-related the most with tendency to have a formal financial account. None of the farm or land-specific questions correlat-ed with formal financial account owner-ship (mobile money, bank, NBFI) with enough relative strength to be consid-ered part of the model.
At first, this seemed perplexing, knowing that agriculture is central to smallholder households. Further exploration sug-gested that the relative homogeneity of farming activities in country, limited value chain and digital ecosystem, as well as limited, contained ownership of formal accounts was in fact manifesting itself in the modeling. For instance, the number of crops or tendency to sell ver-sus consume are not the factors in one’s life that drive a person to have a financial account. In an ecosystem where pay-ments were digital, or loans were more formal, you might see some more direct correlations. Here, correlations mani-fest themselves through socioeconomic elements, including education, PPI, access to funds, and other experiences, attitudes or phone ownership.
Forming Segments
The second phase of the segmentation analysis was to explore the degree to
which these factors combined explained the variation within the population, and formed meaningful cleavages within, carving out distinct personas. Individually, these measures are the strongest predic-tors of financial inclusion and are useful in helping determine likelihood to be-come part of the financial fold. Compiled together in a segmentation model, these factors cause meaningful cleavages that enable greater understanding of the popu-lation and can facilitate targeted strategies for moving the group to the end goal.
Using the most predictive variables identified in the random forest exercise, the clustering analysis produced a five-segment solution, determining five unique segments of smallholder house-holds: the “farming for sustenance,” the “battling the elements,” the “diversified and pragmatic,” the “options for growth,” and the “strategic agricultural entre-preneurship.” Because the sample was randomly selected and represents the population of smallholder farmers and households across Mozambique, we can reasonably assert that the five segments represent natural groups in the popu-lation as a whole. We also expect that similar groups exist in smallholder farm-ing populations outside of Mozambique, though the description and the inci-dence of each reported herein is unique to Mozambique.
FIGURE 109. Mozambique Smallholder Household Segments
Every day,quintessen�al
farminghousehold that
struggles tosupport its needs
Stands to gain themost from financial
and agriculturalmechanisms
Farming forsustenance
Perseveredthrough harsh
agriculturalchallenges and
remain op�mis�ctoward farming
Financialmechanisms haveenabled some of
their perseverance
Ba�ling theelements
The reali�eswould lead themto diversify out
of something theenjoy it if given
the choice
Embody therealism and innerconflict that can
characterizehouseholds
Diversified andpragma�c
Stable, op�mis�cfor the future and
has op�ons forthe future within
and outsidefarming
Could pivot intoor out of farming
depending onopportuni�es
Op�ons forgrowth
Ac�vely engagedin agriculture,and growing
their agriculturalac�vi�es
Model or “usecase” for inspiring
growth in othersegments
Strategicagricultural
entrepreneurship
56
National Survey and Segmentation of Smallholder Households in Mozambique
By segmentation variables only, the five clusters or segments are as follows:
1. Farming for sustenance: The “farm-ing for sustenance” segment rep-resents the everyday, quintessential Mozambican farming household. The segment indexes low on PPI, shows the highest on years in farming, and generally wants their children to con-tinue farming. This segment has the lowest household income of all five, and truly does live off of what the farm will produce, either consuming, selling, or trading the fruits of their agricultural labor. This is a highly vul-nerable group, and perhaps stands to gain the most from financial and agricultural mechanisms that can optimize their daily labor.
2. Battling the elements: The “battling the elements” segment is also a vul-nerable group, but as a group, it does not face the income limitations of the “farming for sustenance.” A greater portion generate income from agri-culture, and a greater portion of these households have multiple income sources. This segment is still chal-lenged by limited education, phone ownership, and the incidence of un-expected life or farm-related events. Experience with unexpected life events is somewhat greater for this group than others. Challenges have not dampened their future aspira-tions nor dissuaded them from work-ing hard. This group has persevered through those challenges sometimes using financial tools, making them a group that might better understand the value of having some form of a safety net. The biggest difference be-tween this group and “farming for sustenance” is a higher income and more unexpected life events.
3. Diversified and pragmatic: The “di-versified and pragmatic” segment re-flects the realism and inner conflict
that can characterize smallholder farming households. These house-holds grow more, sell more, earn more, have more income streams, and have more connectivity to financial mechanisms. In some ways, they have an aspirational profile such as “farm-ing for sustenance” and “battling the elements.” They haven’t suffered un-expected life events as much as other segments and have had resources to overcome what they do experience. The conflict that arises in this group is that despite enjoying farming, tak-ing pride in it, and looking for op-portunities’ to grow it, many would diversify out of agriculture if given the opportunity. They are empow-ered, but know that someone else, or circumstances might have more power than them. They think through decisions, but also know that reality can get in the way of best made plans. This is an important group, as it rep-resents smallholder households that have diversified within and outside of agriculture to best sustain their household needs.
4. Options for growth: The “options for growth” group earns a higher in-come, has more resources for when the unexpected occurs, and is even optimistic about their future, but their future could take them in either one of two directions: within agricul-ture or outside of agriculture. Their household income is equally split between agriculture and nonagricul-ture, they grow less and sell less, and they are equally as passionate about farming, continuity in farming, and satisfaction with farming as they are embracing of opportunities outside of farming. The youngest of all groups, this segment could pivot in either direction, depending on how they, themselves, are cultivated by policy makers, development organizations, and financial institutions.

57
National Survey and Segmentation of Smallholder Households in Mozambique
5. Strategic agricultural entrepre-neurship: The “strategic agricultural entrepreneurship” segment includes house holds that appear to be actively engaged at building their agricultural work with some indications of suc-cess or at least progress. The group is more enabled than others, having higher income, more education, ac-cess to emergency funds, and more financial mechanisms at their dis-posal. They’ve been impacted by the realities of farming and have been able to rely on their savings or other resources to get them through tough times. What characterizes them more definitively, though, is their mindset. The segment puts much thought into what it does, but it is also impulsive. It has big aspirations that include a future in agriculture. Farming is what they want to do, what satisfies them, where their legacy lives. They aren’t as likely to want out, or be willing to take work outside of agriculture. This is a group that can be a model or a use-case for carrying meaningful messages (or examples) for growth in other segments of the population.
There is greater definition and charac-terization of these segments when we explore more deeply how they behave, what they believe, and where their interests lie.
As a whole, these five segments behav-iorally characterize smallholder house-holds across Mozambique. The “farming for sustenance” group is the most pre-dominant in the country, comprising 77 percent of farming households. They differ slightly from the next larg-est group, the “battling the elements,” comprising 15 percent. The remaining 8 percent include the “diversified and pragmatic” segment, the “strategic ag-ricultural entrepreneurship,” and the “options for growth” segments, who rep-resent a very, very small but important component of the farming population.
Table 13 shows each segment and how it fairs in each of cluster-defining vari-ables: education, socioeconomic sta-tus, access to emergency funds, mobile phone ownership, attitude toward the future, and experience with unexpected events.
(Shown: All smallholder farmers)
Diversified andpragma�c, 4%
Op�ons for growth, 2%Strategic agriculturalentrepreneurship, 1%
Farming forsustenance, 77%
Ba�ling the elements,15%
FIGURE 110. Mozambique Smallholder Household Segments
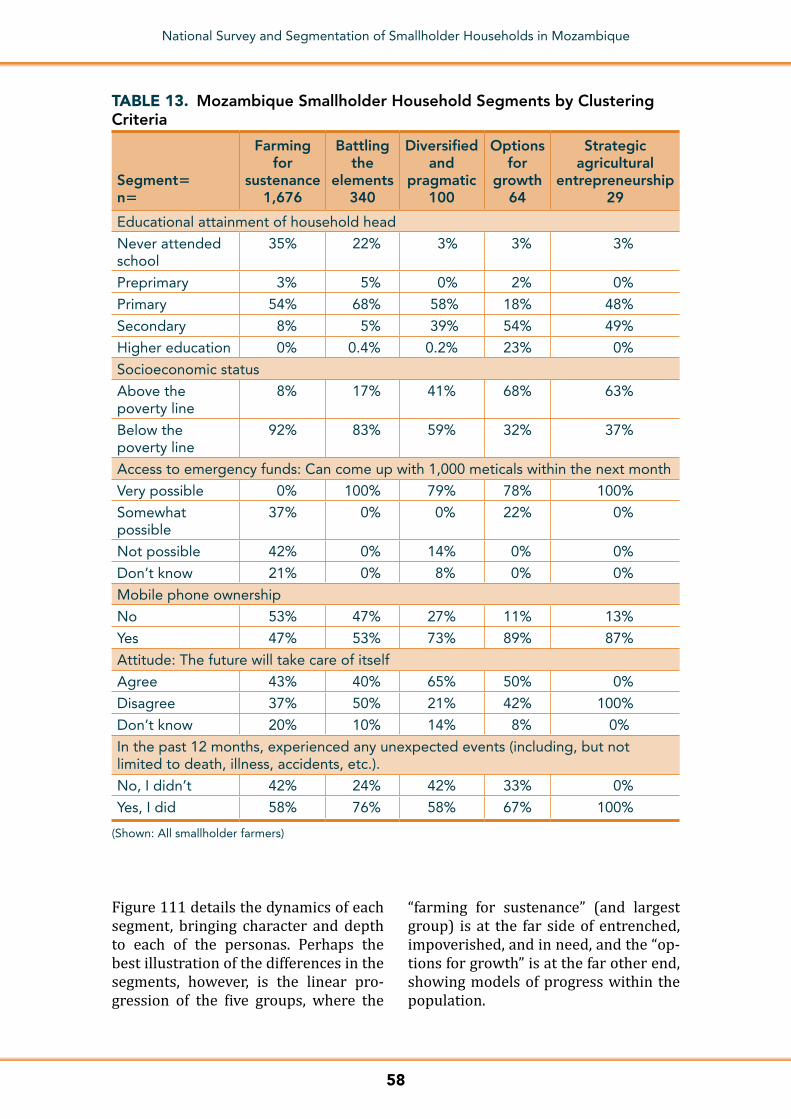
58
National Survey and Segmentation of Smallholder Households in Mozambique
TABLE 13. Mozambique Smallholder Household Segments by Clustering Criteria
Segment5 n5
Farming for
sustenance 1,676
Battling the
elements 340
Diversified and
pragmatic 100
Options for
growth 64
Strategic agricultural
entrepreneurship 29
Educational attainment of household head
Never attended school
35% 22% 3% 3% 3%
Preprimary 3% 5% 0% 2% 0%
Primary 54% 68% 58% 18% 48%
Secondary 8% 5% 39% 54% 49%
Higher education 0% 0.4% 0.2% 23% 0%
Socioeconomic status
Above the poverty line
8% 17% 41% 68% 63%
Below the poverty line
92% 83% 59% 32% 37%
Access to emergency funds: Can come up with 1,000 meticals within the next month
Very possible 0% 100% 79% 78% 100%
Somewhat possible
37% 0% 0% 22% 0%
Not possible 42% 0% 14% 0% 0%
Don’t know 21% 0% 8% 0% 0%
Mobile phone ownership
No 53% 47% 27% 11% 13%
Yes 47% 53% 73% 89% 87%
Attitude: The future will take care of itself
Agree 43% 40% 65% 50% 0%
Disagree 37% 50% 21% 42% 100%
Don’t know 20% 10% 14% 8% 0%
In the past 12 months, experienced any unexpected events (including, but not limited to death, illness, accidents, etc.).
No, I didn’t 42% 24% 42% 33% 0%
Yes, I did 58% 76% 58% 67% 100%
(Shown: All smallholder farmers)
Figure 111 details the dynamics of each segment, bringing character and depth to each of the personas. Perhaps the best illustration of the differences in the segments, however, is the linear pro-gression of the five groups, where the
“farming for sustenance” (and largest group) is at the far side of entrenched, impoverished, and in need, and the “op-tions for growth” is at the far other end, showing models of progress within the population.
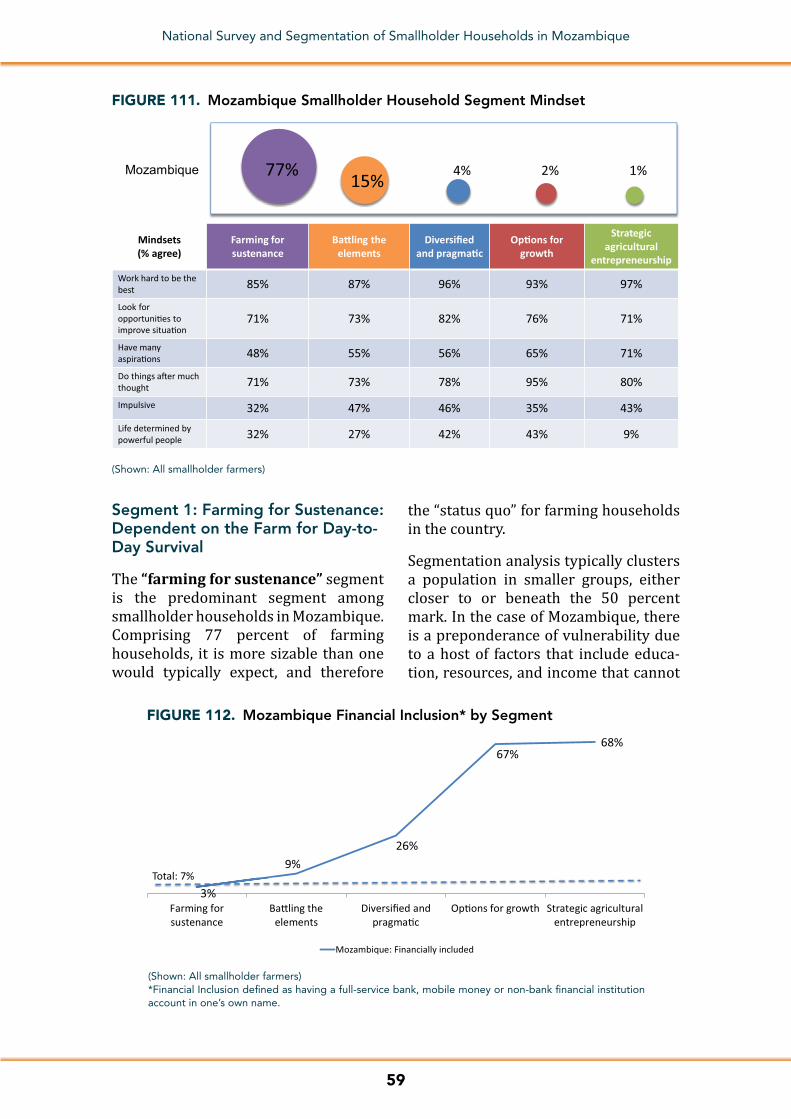
59
National Survey and Segmentation of Smallholder Households in Mozambique
Segment 1: Farming for Sustenance: Dependent on the Farm for Day-to-Day Survival
The “farming for sustenance” segment is the predominant segment among smallholder households in Mozambique. Comprising 77 percent of farming households, it is more sizable than one would typically expect, and therefore
the “status quo” for farming households in the country.
Segmentation analysis typically clusters a population in smaller groups, either closer to or beneath the 50 percent mark. In the case of Mozambique, there is a preponderance of vulnerability due to a host of factors that include educa-tion, resources, and income that cannot
Mindsets(% agree)
Farming for sustenance
Baling the elements
Diversifiedand pragma�c
Op�ons for growth
Strategicagricultural
entrepreneurship Work hard to be the best 85% 87% 96% 93% 97%
Look for opportuni�es to improve situa�on
71% 73% 82% 76% 71%
Have many aspira�ons 48% 55% 56% 65% 71%
Do things a�er much thought 71% 73% 78% 95% 80%
Impulsive 32% 47% 46% 35% 43%Life determined by powerful people 32% 27% 42% 43% 9%
Mozambique 77% 15% 4% 2% 1%
FIGURE 111. Mozambique Smallholder Household Segment Mindset
(Shown: All smallholder farmers)
3%
9%26%
67%68%
Farming forsustenance
Ba�ling theelements
Diversified andpragma�c
Op�ons for growth Strategic agriculturalentrepreneurship
Mozambique: Financially included
Total: 7%
FIGURE 112. Mozambique Financial Inclusion* by Segment
(Shown: All smallholder farmers)*Financial Inclusion defined as having a full-service bank, mobile money or non-bank financial institution account in one’s own name.

60
National Survey and Segmentation of Smallholder Households in Mozambique
be ignored, hidden, or even further segmented into anything meaningful when it comes to predicting financial inclusion. That alone tells us that ac-knowledging the income vulnerability and other unique aspects of this popula-tion will be critical to bringing financial mechanisms to scale in the country. It is more critical, because there is no other single or group of segments that comes close to the size of this segment.
Characterizing attributes: Comparisons to other segments
The “farming for sustenance” group tends to be older (49 percent 351) and more tenured in farming (50 percent, 101 years in farming) than other segments. They are less satisfied with their farming achievements (58 percent “satisfied”), yet still enjoy working in agriculture (94 percent) and intend to keep working in it (86 percent). Nearly half (47 percent) say they would not want to do any other kind of work.
Demographics: Nearly all households live in poverty, concentrated in the center region of the country, and largely headed by older farmers.
Compared to other segments, the “farming for sustenance” segment skews older, and within the segment, there is near equal distribution across age
groups. Almost exactly half (49 percent) of the “farming for sustenance” are over 35, leaving the balance in 35 and under. Just over half (56 percent) live in the central region of the country, leaving almost one-third (32 percent) in the north, and 12 percent in the south. Nearly all, 92 percent, live under the poverty line.
Farming: Experience, income, and crops
“Farming for sustenance” households are tenured in their craft. Half have been working in agriculture for more than 10 years. Nineteen percent have been part of agriculture for six to 10 years. Only 26 percent are newer to agriculture, working in it for under five years.
These households mostly intend to con-tinue working in agriculture (86 percent). They generally enjoy it (94 percent), and many would like to expand their capa-bilities (73 percent). That said, full-time employment could also be attractive to a smallholder household (72 percent). That fewer than six-in-10 (58 percent) of this segment are satisfied with what their ag-ricultural work has achieved (versus oth-er segments where over 60 percent are satisfied), suggests that they are critical of themselves, and perhaps wanted better outcomes that their circumstances could not support.
SEGMENT SYNOPSIS
Representing the everyday, quintessential Mozambican farming household, the “farming for sustenance” segment indexes low on PPI, shows the highest on years in farming, and generally wants their children to continue farming.
This segment truly does live off of what the farm will produce, either consuming, selling, or trading the fruits of its agricultural labor, without much else to sustain its household.
This is a highly vulnerable group, and perhaps stands to gain the most from finan-cial and agricultural mechanisms that can facilitate their daily labor.

61
National Survey and Segmentation of Smallholder Households in Mozambique
Eighty percent of “farming for suste-nance” households generate income from agriculture, and overall, these households tend to have fewer sources of income (14 percent one source of income, 20 percent two sources of in-come). Close to half of the segment generates income from occasional jobs, and 17 percent generates income from retail or manufacturing. Thirteen per-cent receive salary and wages from a regular job.
Collective reporting from all house-hold members active in agriculture shows that up to half of the households in “farming for sustenance” have two hectares of land or less. Up to 11 percent have between two and three hectares, and the rest have over three hectares of land.26
On average, the “farming for sustenance” segment is growing six crops (5.58 pre-cisely) each year on its land. They tend to sell on average three of the crops that they grow (2.74 precisely). Close to four-in-10 (38 percent) of “farming for sus-tenance” households are growing cash crops, leaving the majority (62 percent) growing stable crops.
Vulnerable to outside elements
Their vulnerability becomes even more apparent when comparing the per-centage generating income from agri-culture against the percentages whose agricultural events have been seriously affected by an outside element. Close to seven-in-10 (72 percent) were impacted by weather, pests and disease, acci-dents, market fluctuations, equipment failure, and/or their own health issues. Seventy-three percent were affected by
weather alone, and 49 percent faced pests and disease.
Among those that were seriously affect-ed by any of these events, close to one-third (30 percent) of affected farming households did nothing. In fact, there is no one solution that conjured over 4 percent. For instance, when coping with unexpected events:
■■ Only 4 percent coped by taking a temporary job
■■ 4 percent sold an asset
■■ Only 2 percent took a loan and 3 percent borrowed
■■ 3 percent sold livestock
■■ 3 percent used savings
Financial attitudes
The segmentation model itself is built off of predictors of financial inclusion defined as having a full-service, digital bank, mobile money, or NBFI account in their name. It follows, then, that or-dering segments from more vulnerable “farming for sustenance” and “battling the elements” groups to “strategic agri-cultural entrepreneurship” shows a lin-ear relationship with financial inclusion.
Extremely limited access to financial services
Overall, 7 percent of Mozambique smallholder households are financially included, meaning that they have a full-service, digital bank, mobile money, NBFI accounts in their name. The “farm-ing for sustenance” segment comes in lowest, with only 3 percent being
26 The land size measurement comes from the household survey where multiple members of the agricultural household offer up their recollection of various dynamics so as to capture full dynamics instead of relying on just one member’s knowledge of the household. An aggregate estimate of this measure was then created and appended to the segmentation, which is based on participant responses to the individual questionnaire (asked of just one randomly selected household member). These data are weighted accordingly. Use data with caution surrounding extrapolation and inferences. These should be used only as added descriptive measures.
62
National Survey and Segmentation of Smallholder Households in Mozambique
financially included. Since this segment is the largest, encapsulating 77 percent of the smallholder households in the country, it therefore is a driving force behind the overall financial inclusion number for the country.
Bank accounts are the most popu-lar formal financial means among the “farming for sustenance.” Five percent have a bank account. Overall, 9 percent can access a bank either through their own or through someone else’s account. Only 17 percent of “farming for sus-tenance” had ever been inside a bank. Two percent of “farming for sustenance” have an NBFI account. None of the small-holder households in the “farming for sustenance” segment reported having a mobile money account. Just over two-in-10 (21 percent) have heard of mobile money before the survey.
While more prevalent than formal, still only just over two-in-10 (22 percent) of the “farming for sustenance” have ac-cess to an informal financial mechanism. Fourteen percent have used a xitique or savings and credit group. Ten percent have used a moneylender, and 5 percent have used a money guard or someone who collects savings deposits.
Low perceived importance of financial practices
Separate from having financial mech-anisms, we also see a gap in perceived importance of financial behaviors, such as savings. Only about two-thirds (67 percent) feel it is important to save for future purchases or school (60 percent), and less find it important to save for the unexpected (58 percent) or regular pur-chases (51 percent). There also is a dis-connect on the importance of saving for the farm (47 percent very important). Versus other segments, importance is the most muted for the “farming for sustenance” group.
Members of this segment do not perceive as much importance in saving through financial mechanisms, formal or infor-mal. Instead, it is more important to save money within the home:
■■ 39 percent: Very important to save money in a financial institution.
■■ 21 percent: Very important to save with an informal group.
■■ 61 percent: Very important to save money at home.
Segment 2: “Battling the Elements”: Challenged, with Limited Resources but Perseverant
The “battling the elements” group is the second largest segment in Mozam-bique, comprising 15 percent of small-holder farming households. This seg-ment is more typical in size, and what we expect to see when leveraging a five-segment solution. This is an import-ant group, because these households are facing many of the limiting circum-stances of the “farming for sustenance,” but do not index as low on income. They are selling more of their crops and tak-ing better financial steps in their life, despite having less education and facing the brutal realities of farming.
Characterizing attributes—comparisons to other segments
Like the “farming for sustenance,” this group tends to be older (60 percent, 351) and more tenured in farming (43 percent, 101 years). Many are satisfied with their agricultural achieve-ments (67 percent) and generally enjoy (97 percent) and intend to continue working in agriculture (91 percent). There is some appeal to work outside of agriculture. Only 43 percent would not want to do any other kind of work, and 29 percent would not take another job if offered. Eighty-three percent live under

63
National Survey and Segmentation of Smallholder Households in Mozambique
the poverty line, a smaller portion com-pared with the “farming for sustenance” segment, but still substantial portion of the segment.
Demographics: A majority of households live in poverty, concentrated in the cen-tral and northern regions of the country, and is the oldest group of farmers.
Compared with other segments, the “battling the elements” group is the old-est. Within itself, more than half the seg-ment (60 percent) are over 35. Close to half (45 percent) live in the central region of the country, and a near equal part (41 percent) in the northern region. Fourteen percent come from the south-ern region. The vast majority, 83 per-cent, live under the poverty line.
Farming: Experience, income, and crops
“Battling the elements” households are also tenured in their craft. Nearly four-in-10 have been working in agriculture for more than 10 years (43 percent). Twenty-five percent have been part of agriculture for six to 10 years.
Only 29 percent are newer to agricul-ture, working in it five or less years.
Enjoyment of farming
These households mostly intend to con-tinue working in agriculture (91 percent). They generally enjoy it (97 percent), and many would like to expand their capa-bilities (72 percent). Close to two-thirds are satisfied with their farming achieve-ments (67 percent). That said, it is fair to point out that full-time employment could also be attractive to some house-holds (63 percent).
Over three-quarters (80 percent) of “battling the elements” households gen-erate income from agriculture, and over-all, these households tend to have fewer sources of income (7 percent have one source of income, 13 percent have two sources of income, 20 percent have three sources of income, and 36 percent have between four and seven sources), though skew slightly higher in income sources than the “farming for suste-nance.” Close to half (49 percent) earn
SEGMENT SYNOPSIS
The “battling the elements” segment is also a vulnerable group, but as a group, does not face the income limitations of the “farming for sustenance.” A greater portion generate income from agriculture, and a greater portion of these house-holds have multiple income sources. This segment is still challenged by limited education, phone ownership, and the incidence of unexpected life or farm-related events.
Experience with unexpected life events is somewhat greater for this group than others. Challenges have not dampened their future aspirations or dissuaded them from working hard.
This group has persevered through those challenges, sometimes using financial tools, making it a group that might better understand the value of having some form of a safety net.
The biggest difference between this group and the “farming for sustenance” group is that it manifests itself in Mozambique in a higher income and more unex-pected life events.
64
National Survey and Segmentation of Smallholder Households in Mozambique
wages from occasional jobs, and close to a quarter (24 percent) run a busi-ness in retain or manufacturing. Four-teen percent get wages or salary from a regular job.
Collective reporting from all household members active in agriculture shows that up to 40 percent of the households in “battling the elements” have two hect-ares of land or less. Up to 12 percent have between two and three hectares, and the rest have over three hectares of land.27 On average, the “battling the elements” group is growing five crops (5.21 precisely) each year on their land. They tend to sell from on average three crops that they grow (2.85 precisely). Close to four-in-10 (39 percent) of “battling the elements” households are growing cash crops, leaving the majority (61 percent) growing stable crops.
Vulnerable to weather
Their vulnerability becomes even more apparent when comparing the per-centage generating income from agri-culture against the percentages whose agricultural events have been seriously affected by an outside element (includ-ing weather, pests, illness, loss, acci-dents). Overall, nearly three-quarters (73 percent) were impacted by weather, pests and disease, accidents, market fluc-tuations, equipment failure, and/or their own health issues. Over three-quarters (75 percent) were affected by weather. More than half (53 percent) faced pests and disease issues.
Among those that were seriously affected by any of the above events, one-quarter (24 percent) of affected households did
nothing. In fact, there is no one solution that amounted to over 7 percent. When facing unexpected events:
■■ 6 percent sold livestock
■■ 6 percent used savings
■■ 5 percent coped by taking a tempo-rary job
■■ 5 percent took a loan from a financial service provider and five percent borrowed from others
■■ 4 percent sold an asset
Financial attitudes
The “battling the elements” segment comes in with the second lowest per-centage of those financially included of all the segments, meaning that they have a full-service, digital bank, mobile money, NBFI accounts in their name. Only 9 percent are financially included (compared to 7 percent of Mozambique smallholder households overall). This group is three times as likely to have for-mal financial mechanisms in place com-pared to the “farming for sustenance” group.
Some formal financial accounts
Here too, bank accounts are more prevalent among the financial mech-anisms than NBFIs or mobile money. Twelve percent have their own ac-count. And, 33 percent of the segment had ever been inside a bank. Seven percent have an account with an NBFI, and less than 1 percent have a mobile money account. Close to one-third are aware of mobile money, more than three
27 The land size measurement comes from the household survey where multiple members of the agricultural household offer up their recollection of various dynamics so as to capture full dynamics instead of relying on just one member’s knowledge of the household. An aggregate estimate of this measure was then created and appended to the segmentation, which is based on participant responses to the individual questionnaire (asked of just one randomly selected household member). These data are weighted accordingly. Use data with caution surrounding extrapolation and inferences. These should be used only as added descriptive measures.
65
National Survey and Segmentation of Smallholder Households in Mozambique
times the amount that are financially included.
Access to informal surpasses that of formal accounts, with 34 percent hav-ing accessed some informal financial service. Xitique or savings and credit groups are the most common informal service (23 percent have used), followed by moneylenders (17 percent have used). Seven percent have used money guards or someone who collects savings deposits.
Separate from having financial mech-anisms, we also see a gap in perceived importance of financial behaviors for the “battling the elements.” As with the “farming for sustenance,” only about two-thirds (67 percent) of the “battling the elements” feel it is very important to save for future purchases, or school fees (59 percent) and less find it important to save for the unexpected (45 percent) or regular purchases (55 percent). Fewer find it very important to invest money in the farm (39 percent very important).
There is a greater perceived importance in saving through financial mechanisms, both formal and informal versus the
“farming for sustenance,” still, having savings within the home is still critical. Within the “battling the elements,” we see:
■■ 49 percent: very important to save money in a financial institution
■■ 22 percent: very important to save with an informal group
■■ 72 percent: very important to save money at home
Segment 3: “Diversified and Pragmatic”: Realistic, Grounded and Plan Accordingly for the Realities of Agricultural Life
The “diversified and pragmatic” seg-ment, which includes just 4 percent of Mozambique’s smallholder households, is moving away from vulnerability and onto a path of stability. Perhaps what is most important in this group is its rela-tively small size, suggesting a lack of use cases and models in the marketplace for coming out of vulnerability. Its size is also important in level-setting expecta-tions on what financial and agricultural mechanisms meant for a less-entrenched
SEGMENT SYNOPSIS
The “diversified and pragmatic” segment reflects the realism and inner conflict that can characterize smallholder farming households. These households grow more, sell more, earn more, have more income streams, and have a broader portfolio of financial mechanisms.
In some ways, they have an aspirational profile for those that are more “battling the elements.” They haven’t suffered unexpected life events as much as other segments and have had resources to overcome what they do experience. The conflict that arises in this group is that despite enjoying farming, taking pride in it, and looking for opportunities’ to grow it, many would diversify out of agriculture if given the opportunity. They are empowered, but know that someone else, or circumstances might have more power than them. They think through decisions, but also know that reality can get in the way of best made plans.
This is an important group, as it represents smallholder households that have diversified within and outside of agriculture to best sustain their household needs.

66
National Survey and Segmentation of Smallholder Households in Mozambique
household might achieve. In time, this group can grow to be more substan-tial. For instance, 8 percent of Uganda’s smallholder households fall into the clas-sification of “diversified and pragmatic.”
Characterizing attributes—comparisons to other segments
Perhaps the most distinguishing ten-dency of the “diversified and pragmatic” is how so many of them look for oppor-tunities to improve their situation (82 percent). They also work hard to be the best (96 percent) and can be impulsive (46 percent), suggesting they tend to be risk takers. Despite their predisposition to being a risk-takers and opportuni-ty-seekers, a sizable portion feel their life is determined by other powerful people (42 percent), perhaps reflecting that they have emerged from circum-stances beyond their control.
Demographics: Just under half of all households live in poverty, concentrated in the central region of the country, and largely headed by younger farmers.
The “diversified and pragmatic” group tends to be younger (67 percent under 35).
Just over half (52 percent) live in the central region of the country, leaving close to one-third (30 percent) in the northern region, and 18 percent in the southern region.
Over half of this group (52 percent) live above the poverty line.
Farming: Experience, income, and crops
“Diversified and pragmatic” households are mostly experienced in farming. Close to a quarter have been farming for 10 or more years (22 percent), and 30 percent have been in it for six to 10 years. Versus the “battling the elements” groups, we see more people in that mid-category of six to 10 years compared with the more tenured, 10 years or more category.
Forty-two percent have been farming for five or less years.
These households mostly intend to con-tinue working in agriculture (80 per-cent), showing similar intentions as other segments. They generally enjoy it (94 percent), and many would like to ex-pand their capabilities (68 percent). That said, full-time employment could also be attractive to smallholder households (85 percent), reflecting their pragmatism. Farming is hard work and is susceptible to elements that make it unpredictable or difficult to grow professionally. Just over six-in-10 (60 percent) of this segment are satisfied with what their agricultural work has achieved (vs. the “options for the future” and “experienced agricultural entrepreneurs” segments where up-wards of eight in 10 are satisfied), sug-gests that they are critical of themselves and perhaps want better outcomes than their circumstances could support.
More sources of income
Over eight in 10 (83 percent) of “diver-sified and pragmatic” households gener-ate income from agriculture, and overall, these households tend to have more sources of income than the “battling the elements” groups (14 percent have three source of income, 20 percent have four sources of income, 28 percent have five to eight sources of income), reflecting their segment characterization as “di-versified.” Other sources of income for the “diversified and pragmatic” house-holds can include the following:
■■ Wages from an occasional job (46 percent)
■■ Salary from a regular job (38 percent)
■■ Running a retail or manufacturing business (28 percent)
Collective reporting from all household members active in agriculture shows
67
National Survey and Segmentation of Smallholder Households in Mozambique
that up to 45 percent of the households in the “diversified and pragmatic” seg-ment have two hectares of land or less. Up to 9 percent have between two and three hectares, and the rest have over three hectares of land.28
On average, the “diversified and prag-matic” households are growing five crops (5.48 precisely) each year on their land. They tend to sell from on average two crops that they grow (2.94 precisely). Four-in-10 (40 per-cent) are growing cash crops, leaving the majority (60 percent) not focusing on this area.
Less affected by outside elements
It’s within this group where we first see more households who earned in-come from agriculture than lost income due to events such as weather, pests and disease, accidents, market fluctu-ations, equipment failure and/or their own health issues. Just over eight in 10 (83 percent) earn income from agricul-ture, and only 54 percent of smallholder households have been seriously affected by an outside element. Over eight-in-10 of this segment (81 percent) were af-fected by weather alone. Almost half (44 percent) faced pests and disease issues.
Among those that were seriously affected by any of the above events, 16 percent of affected households did nothing. In fact, there is no one solution that conjured over 11 percent. For instance, when this group experienced an unexpected event:
■■ 14 percent coped by taking a tempo-rary job
■■ 4 percent took a loan and 6 percent borrowed
■■ 3 percent sold an asset
■■ 3 percent used savings
■■ 1 percent sold livestock
Financial attitudes
The segmentation model itself is built off of predictors of financial inclusion defined as having a full-service, dig-ital bank, mobile money, or NBFI ac-count in their name. Close to three-in-10 (26 percent) of the “diversified and pragmatic” segment is financially included, which is close to seven times that of the general population of farmers.
While a small portion of the population, this segment is the one that offers hope and aspiration that farming households can put their livelihood on a path to-ward greater stability and mechanisms for household management. With close to three-quarters of this segment not fi-nancially included, it suggests that tar-geted efforts might be well placed, and that the collective reach of those efforts might extend far beyond the people within the segment.
A “pragmatic” approach to finances
Bank accounts are the most popular for-mal financial mechanisms among the “diversified and pragmatic” households. Thirty-seven percent have a bank ac-count, and 52 percent can access a bank either through their own or through someone else’s account. Sixty-nine per-cent of “diversified and pragmatic” had ever been in a bank.
28 The land size measurement comes from the household survey where multiple members of the agricultural household offer up their recollection of various dynamics so as to capture full dynamics instead of relying on just one member’s knowledge of the household. An aggregate estimate of this measure was then created and appended to the segmentation, which is based on participant responses to the individual questionnaire (asked of just one randomly selected household member). These data are weighted accordingly. Use data with caution surrounding extrapolation and inferences. These should be used only as added descriptive measures.

68
National Survey and Segmentation of Smallholder Households in Mozambique
Seventeen percent of “diversified and pragmatic” have an NBFI account, and 2 percent of smallholder households in this segment reported having a mo-bile money account. Close to six-in-10 (59 percent) had heard of mobile money before taking the survey.
Access to informal still surpasses that of formal accounts, with over four-in-10 (44 percent) having access to some in-formal financial service. Xitiques are the most common form of informal financial services, used by 38 percent of this seg-ment. Eighteen percent had used mon-eylenders, and 11 percent had used a money guard or someone who collects savings and saving deposits.
Separate from having financial mecha-nisms, there is greater acknowledgment of the importance of financial behaviors, such as savings. Three-quarters (80 percent) feel it is important to save for future pur-chases, and many also find it important to save for school fees (65 percent). Few-er find it important to save for the unex-pected (57 percent) or regular purchases (66 percent). There also is a disconnect on the importance of investing in the farm (46 percent very important).
Unlike the “battling the elements” groups, in the “diversified and pragmatic” seg-ment we see saving at financial institu-tions either best or on par with informal savings options. For instance:
■■ 65 percent: Very important to save money in a financial institution
■■ 34 percent: Very important to save with an informal group
■■ 61 percent: Very important to save money at home
Segment 4: “Options for Growth”: Stable, Optimistic, and Building Various Paths for the Future29
Smallholder households in the segment comprise 2 percent of the smallholder population. Their biggest character-izing element is their higher income, and that distinguishes them from ev-ery other segment. They are better off, more “options for growth,” and even optimistic about their future. That they are optimistic does not mean there is no room for growth; it conveys that they have improved their current situation, largely because of their net income.
29 Caution: Small segment size limits analysis. Proceed with caution in extrapolating findings.
SEGMENT SYNOPSIS
The “options for growth” households earn a higher income, have more resources for when the unexpected occurs, and are even optimistic about their future, but their future could take them in either one of two directions: within agriculture or outside of agriculture.
The segment is equally split between earning household income through agricul-ture and nonagriculture. These households grow less and sell less, and they are equally as passionate about farming, continuity in farming, and satisfaction with farming as they are embracing of opportunities outside of agriculture.
The youngest of all groups, this segment could pivot in either direction depending on how they, themselves, are cultivated by policy makers, development organiza-tions, and financial institutions.
69
National Survey and Segmentation of Smallholder Households in Mozambique
Furthermore, it might not be farming income that helps stabilize their house-hold, as agriculture is part of the house-hold’s diverse revenue streams.
Here too, there is great significance in what the size of this segment suggests. It is very rare for a smallholder house-hold in Mozambique to earn enough income to smooth income fluctuations let alone build assets. While this should feel plausible, knowing the realities that smallholder households face, it is in-credibly stark compared with Uganda,30 where 20 percent of smallholder households are “options for growth,” suggesting the presence of prosperity is possible, even though not currently the case in Mozambique.
Characterizing attributes—comparisons to other segments
“Options for growth” households tend to be newer to farming and are looking to expand their agricultural activities. They already look to farming as a legacy, and something that they take pride in; how-ever, they may not necessarily want their children to default into farming without considering other opportunities.
The “options for growth” are also moti-vated and thoughtful. Sixty-five percent share that they have many aspirations, and nearly all (95 percent) take ac-tion after much thought. Very few are impulsive (35 percent) and a sizable portion are inclined to think that their life is determined by powerful people (43 percent).
Demographics
Less than one-third of households live in poverty, spread across all regions of the country, and tend to be younger farmers.
The “options for growth” group tends to be young, with a large majority under 45 (80 percent). This segment is evenly distributed across the three regions of the country, with almost a third in each region (central: 33 percent, northern: 34 percent, southern: 33 percent). Over two-thirds of this group (68 percent) live above the poverty line. It may seem counter-intuitive that some portion of a segment called “options for growth” falls below the poverty line. However, the segmentation modeling characterized these individuals as most closely aligned with this particular segment on all the other attributes, despite their lower PPI indexing.
Farming: Experience, income, and crops
“Options for growth” individuals are sig-nificantly newer to farming. Over half (55 percent) have been farming for five or less years, a stark contrast to other groups. Only 31 percent have been farm-ing for 10 or more years, with 5 percent being engaged in agriculture from six to 10 years.
These smallholder households mostly intend to continue working in agri-culture (89 percent), showing similar intentions as other segments. They gen-erally enjoy it (98 percent), and many would like to expand their capabilities (90 percent). In fact, they are even more likely to want to expand their capabili-ties than other segments.
Wanting to expand their agricultural activities
That said, full-time employment could also be equally attractive. As many who say they want to grow their farm-ing (90 percent) will at the same time
30 Nationally representative survey of smallholder households in Uganda conducted by InterMedia on behalf of CGAP. Findings yet to be formally published.
70
National Survey and Segmentation of Smallholder Households in Mozambique
say they would welcome full-time employment (94 percent), suggesting that they may, at some point, make a determination of the best path for their future.
Just over eight-in-10 (84 percent) of this segment are satisfied with what their agricultural work has achieved, exacer-bating this contradiction, but also a po-tential call to action in that if this group cannot be successful in farming, and do wind up with other options, they may change direction. The question becomes “how does one keep them in farming” given their success at it.
Collective reporting from all house-hold members active in agriculture shows that up to 46 percent of the households in “options for growth” have two hectares of land or less. Up to 16 percent have between two and three hectares, and the rest have over three hectares of land.31 This group tends to have larger amounts of land than other segments
Over half (55 percent) of “options for growth” households generate income from agriculture, and overall, these households tend to have multiple sourc-es of income (10 percent have three source of income, 12 percent have four sources of income, 37 percent have five to eight sources of income), suggesting that agriculture is among a collection of income sources, not the sole source en-abling their income.
Only a few crops
On average, the “options for growth” are growing the least number of crops—three crops (3.28 precisely) each year
on their land. They tend to sell on av-erage one crop that they grow (1.49 precisely). Only one-quarter (25 percent) are growing cash crops, leaving the majority (75 percent) not focusing on this area.
Fifty-five percent of the “options for growth” segment have been seriously affected by an outside element, including weather, pests and disease, accidents, market fluctuations, equipment failure, and/or their own health issues. Over six-in-10 (61 percent) were affected by weather alone. Over half (55 percent) faced pests and disease issues.
Financial attitudes
The segmentation model itself is built off of predictors of financial inclusion defined as having a full-service, digital bank, mobile money, or NBFI account in their name. It follows, then, that ordering segments from “battling the elements” to the more optimized groups shows a linear relationship with financial inclu-sion. Overall, 7 percent of Mozambique smallholder households are financially included, meaning that they have a full-service, digital bank, mobile money, NBFI accounts in their name.
Much higher financially included
Just over two-thirds (67 percent) of the “options for growth” segment is finan-cially included, which is three times that of the “diversified and pragmatic” group. While a small portion of the population, this segment is the one that offer hope and aspiration that smallholder house-holds can put their livelihood on a path toward greater stability and growth. It is here, in this segment, where we see
31 The land size measurement comes from the household survey where multiple members of the agricultural house-hold offer up their recollection of various dynamics so as to capture full dynamics instead of relying on just one member’s knowledge of the household. An aggregate estimate of this measure was then created and appended to the segmentation, which is based on participant responses to the individual questionnaire (asked of just one ran-domly selected household member). These data are weighted accordingly. Use data with caution surrounding extrapolation and inferences. These should be used only as added descriptive measures.
71
National Survey and Segmentation of Smallholder Households in Mozambique
formal account use surpass the use of informal services.
Bank accounts are the most popular for-mal financial means among the “diversi-fied and pragmatic.” Sixty-nine percent have a bank account, and 76 percent can access a bank either through their own or through someone else’s account. Eighty-seven percent of “diversified and pragmatic” had never been in a bank.
High mobile money awareness
Thirteen percent of “farming for suste-nance” have an NBFI account, and 4 per-cent of smallholder households in this segment reported having a mobile mon-ey account. Over eight in 10 (82 percent) have heard of mobile money before tak-ing the survey.
Close to two-thirds (64 percent) have ac-cess to an informal account. The most com-mon type of informal account is a xitique (43 percent) followed by a moneylender (33 percent). There is also some use of:
■■ Money guard/someone collecting savings deposits in the work place (19 percent)
■■ Savings collectors (12 percent)
■■ Digital card, recharge card NOT con-nected to an MFI (7 percent)
Separate from having financial mecha-nisms, there is acknowledgment of the importance of financial behaviors, such as savings. Nearly all (91 percent) feel it is important to save for future purchas-es, and many also find it very import-ant to save for school fees (90 percent). Fewer, but still most, find it important to save for the unexpected (75 percent) or regular purchases (84 percent). There also is a disconnect on the importance of investing in the farm (50 percent very important).
In the “options for growth” segment, saving at financial institutions is con-sidered more favorable than informal savings options, for instance:
■■ 79 percent: Very important to save money in a financial institution
■■ 55 percent: Very important to save money at home
■■ 32 percent: Very important to save with an informal group
SEGMENT SYNOPSIS
The “strategic agricultural entrepreneurship” segment includes households who appear to be actively engaged at building their agricultural work with some in-dications of success or at least progress. The group is more enabled than others, having higher income, more education, access to emergency funds, and more fi-nancial mechanisms at their disposal. They’ve been impacted by the realities of farming and have been able to rely on their savings or other resources to get through tough times.
What characterizes this segment more definitively, though, is its mindset. These households put much thought into what they do, but are also impulsive. They have big aspirations that include a future in farming. Farming is what they want to do, what satisfies them, where their legacy lives. They aren’t as likely to want out, or be willing to take work outside of agriculture.
This is a group that can be a model or a use-case for carrying meaningful messages (or examples) for growth in other segments of the population.
72
National Survey and Segmentation of Smallholder Households in Mozambique
Segment 5: “Strategic Agricultural Entrepreneurship”: Actively Engaged, Empowered and Growing Their Agricultural Activities32
The “strategic agricultural entrepre-neurship” segment includes just 1 per-cent of Mozambique’s smallholder house-holds, and comes in as the smallest of all five segments. This group, those who have emerged from life events empowered and enabled, are in one of the smallest minori-ties. As with the “diversified and prag-matic” and “income optimized” segments this tells us that there are limited exam-ples in the agricultural community about optimization and success.
As this is the smallest group, deeper anal-ysis is limited due to the small presence in the nationally representative sample.
Characterizing attributes—comparisons to other segments
The “strategic agricultural entrepreneur-ship” group is wealthier, more educat-ed, more prepared in the event of an emergency (having access to emergen-cy funds), and optimistic about their fu-ture. The group presents itself as having encountered—and emerged from—more unexpected events in their lifetime com-pared to other segments. Their experience appears to have served them well given their other desirable psychographics.
Like the “diversified and pragmatic” group, these smallholder households tend to be newer to farming and are looking to expand their agricultural ac-tivities. However, there is collectively less focus on agriculture as the path for future generations.
The “strategic agricultural entrepre-neurship” smallholder household is motivated, thoughtful in their work,
and empowered. They have many aspirations (71 percent), take action after much thought (80 percent), and only a very few feel that their life is de-termined by others (9 percent). They, like the “diversified and pragmatic” seg-ment, are also risk takers (43 percent).
Demographics
One-fifth of households live in poverty, heavily concentrated in the southern region of the country, and are the young-est group of farmers.
The “strategic agricultural entrepre-neurship” group tends to be young, with 37 percent under 34, 35 percent between 35 and 44, and the remaining 29 percent over 44. This segment is heavily concen-trated in the South (61 percent). Some are in the central region (24 percent) and the remaining 16 percent are in the North. The large majority, 63 percent, of the segment is above the poverty line, leaving just 37 percent below.
Farming: Experience, income, and crops
“Strategic agricultural entrepreneur-ship” individuals are relatively new to farming. One-third (27 percent) have been farming for five or less years, and 37 percent have been farming between six and 10 years. Over one-third (37 per-cent) have been farming for 10 years or more.
Continue working in agriculture
These smallholder households mostly intend to continue working in agri-culture (88 percent), showing similar intentions as other segments. Almost all enjoy it (94 percent), and many would like to expand their capabilities (84 percent). In fact, they are more likely
32 Caution: Small segment size limits analysis. Proceed with caution in extrapolating findings.
73
National Survey and Segmentation of Smallholder Households in Mozambique
to want to expand their capabilities than other segments.
That said, full-time employment could also be attractive to many in this segment (51 percent). Seven-in-10 (72 percent) of this segment are satisfied with what their agricultural work has achieved, showing a significant contradiction, but also a potential call to action in that if this group cannot be successful in farming, and do wind up with other op-tions, they may change direction. The question becomes “how does one keep them in farming” given their success at it.
Collective reporting from all household members active in agriculture shows that up to 38 percent of the households in “strategic agricultural entrepreneur-ship” have two hectares of land or less. Up to 17 percent have between two and three hectares, and the rest have over three hectares of land.33 This group tends to have the largest amount of land than any other group.
More sources of income
Close to two-thirds (88 percent) of “strate-gic agricultural entrepreneurship” house-holds generate income from agriculture, and overall, these smallholder households tend to have more sources of income than the “battling the elements” groups (23 percent have two source of income, 8 percent have three sources of income, 32 percent have four sources of income), suggesting that farming is a collection of income sources, not the sole source of optimizing their income. The data also show that half (50 percent) generate in-come from occasional jobs and close to four-in-10 (39 percent) generate income
from a regular job. Just over one-quarter (26 percent) generate income from run-ning a business providing services.
On average, the “strategic agricultural entrepreneurship” households are grow-ing four (4.95 precisely) crops each year on their land. They tend to sell on aver-age three crops that they grow (3.14 pre-cisely). Only 14 percent are growing cash crops, leaving the majority (86 percent) not focusing on this area. Seventy-six percent of the “strategic agricultural en-trepreneurship” segment have been se-riously affected by an outside element, including weather, pests and disease, ac-cidents, market fluctuations, equipment failure, and/or their own health issues.
Financial attitudes
Overall, 7 percent of Mozambique small-holder households across the country are financially included, meaning that they have a full-service, digital bank, mobile money, NBFI accounts in their name. The majority (68 percent) of the “strategic agricultural entrepreneur-ship” segment is financially included, and most (71 percent) have bank ac-counts. Nine percent also have mobile money accounts, and many (71 percent) have heard of mobile money.
Close to six-in-10 (59 percent) have ac-cess to an informal account. For instance:
■■ 40 percent have used an xitique or savings and credit group
■■ 28 percent have used a money guard or had someone in the workplace collect savings deposits
■■ 15 percent have used a moneylender
33 The land size measurement comes from the household survey where multiple members of the agricultural household offer up their recollection of various dynamics so as to capture full dynamics instead of relying upon just one member’s knowl-edge of the household. An aggregate estimate of this measure was then created and appended to the segmentation, which is based on participant responses to the individual questionnaire (asked of just one randomly selected household member). These data are weighted accordingly. Use data with caution surrounding extrapolation and inferences. These should be used only as added descriptive measures.

74
National Survey and Segmentation of Smallholder Households in Mozambique
Importance of saving
Separate from having financial mecha-nisms, we see greater acknowledgment of the importance of financial behaviors, such as savings. Most (83 percent) feel it is very important to save for future pur-chases, unexpected expenses (73 per-cent), and school fees (64 percent). There is also more emphasis on investing in the farm (53 percent).
And, it follows that saving with formal institutions outweighs informal options:
■■ 87 percent: Very important to save money in a financial institution
■■ 14 percent: Very important to save with an informal group
■■ 42 percent: Very important to save money at home
Market implications
In a population like smallholder farming households in Mozambique, where households share more attitudinal, be-havioral, and circumstantial common-alities than they have differences, this segmentation model offers a dynamically nuanced perspective so that uniqueness within a population can be appreciated, and even leveraged for positive market interventions.
While it is safe to say the population as a whole proceeds with their livelihoods without the use of formal financial mechanisms and/or facilitative tools for improving their household stability and agricultural yield, it’s really the “farm-ing for sustenance” and “battling the elements” groups that are the furthest away from those mechanisms and tools. And, these groups also lack context for why those mechanisms and tools can be so essential, what they can bring to their lives, or why they should adopt them if they were available.
It follows, then, that these are house-holds that will need a greater degree of conditioning or information about why certain financial mechanisms or agricul-tural tools are important for them. Their focal point is often the household and household needs (vs. their agricultural activities), and connecting to this target consumer and their household needs could present opportunities for building that needed relevance and importance.
What it takes to build inroads into these segments may feel laborious, especially given the low income of these individ-uals; however, these two groups also comprise “critical mass” being the two largest within the population, and there-fore the value may be in collective size of the market, instead of the yield of each person in the market.
The “diversified and pragmatic” and “options for growth” groups share characteristics with the others, but dis-tinguish themselves by their current juncture in farming. And, that could be a critical juncture. These groups have more options, and may give more se-rious consideration to leaving agricul-ture if a more profitable alternative presented itself. They take pride in their agricultural work, and enjoy it, but the pragmatic, realistic, and even futur-istic side of them suggests that they might need (and want) to pursue other paths.
In Mozambique, these segments are quite small, but their value is not in their size. Their value is in that they offer “use cases” for diversifying income, and liv-ing off the land in a way that is not as entrenched as it is for the “battling the elements” or “farming for sustenance” groups.
In addition, their willingness to make a decision about their path for the future could be an opportunity for financial
75
National Survey and Segmentation of Smallholder Households in Mozambique
or agricultural mechanisms that show them how to be more productive with their land.
The fifth group, “strategic agricultural entrepreneurship,” presents the best opportunity for deepening a household’s productive—and fruitful—commitment to agriculture. These are households who, while still diversified, are most com-mitted to staying in agriculture, growing their farm, building a legacy and future
in farming, and by many indications, currently doing it well. While it is also a small segment, their value rests in the fact that their persona is part of the agri-cultural community, as these households are also “use cases” or models for others in the community to emulate. Even in a more homogenous market, its multiple approaches and strategies combine to best position financial and agricultural mechanisms for meaningful uptake and use within a population.
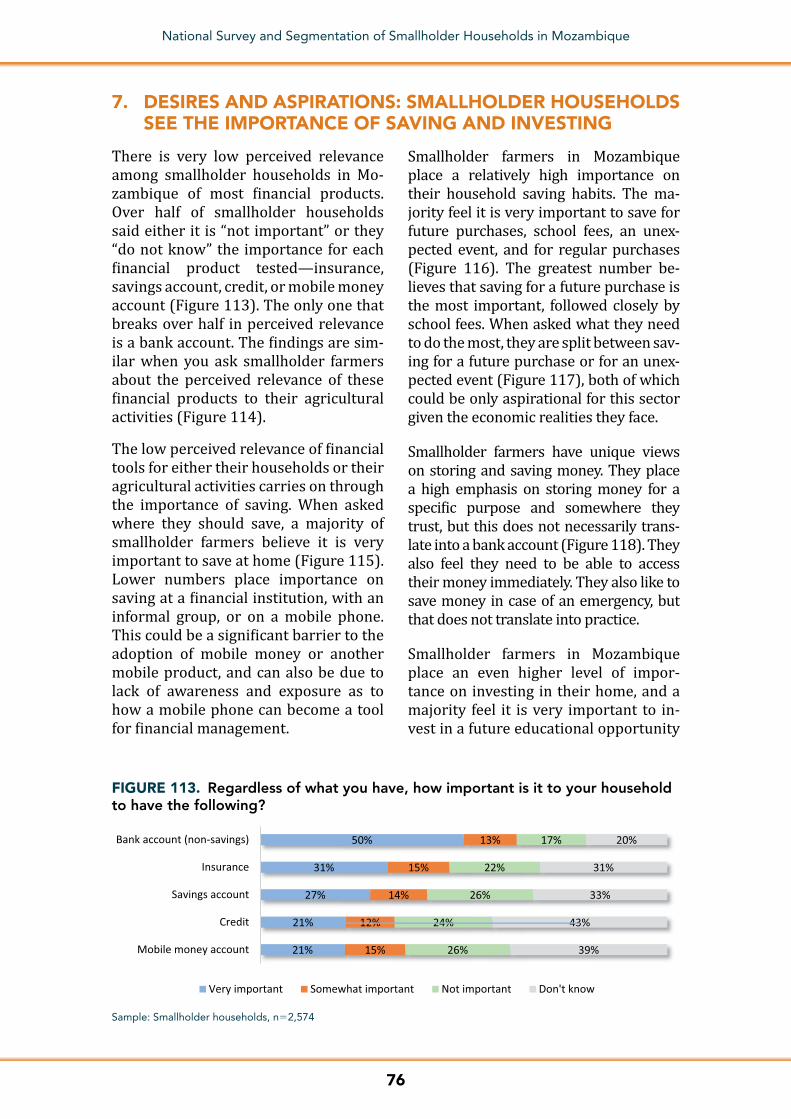
76
National Survey and Segmentation of Smallholder Households in Mozambique
7. DESIRES AND ASPIRATIONS: SMALLHOLDER HOUSEHOLDS SEE THE IMPORTANCE OF SAVING AND INVESTING
There is very low perceived relevance among smallholder households in Mo-zambique of most financial products. Over half of smallholder households said either it is “not important” or they “do not know” the importance for each financial product tested—insurance, savings account, credit, or mobile money account (Figure 113). The only one that breaks over half in perceived relevance is a bank account. The findings are sim-ilar when you ask smallholder farmers about the perceived relevance of these financial products to their agricultural activities (Figure 114).
The low perceived relevance of financial tools for either their households or their agricultural activities carries on through the importance of saving. When asked where they should save, a majority of smallholder farmers believe it is very important to save at home (Figure 115). Lower numbers place importance on saving at a financial institution, with an informal group, or on a mobile phone. This could be a significant barrier to the adoption of mobile money or another mobile product, and can also be due to lack of awareness and exposure as to how a mobile phone can become a tool for financial management.
Smallholder farmers in Mozambique place a relatively high importance on their household saving habits. The ma-jority feel it is very important to save for future purchases, school fees, an unex-pected event, and for regular purchases (Figure 116). The greatest number be-lieves that saving for a future purchase is the most important, followed closely by school fees. When asked what they need to do the most, they are split between sav-ing for a future purchase or for an unex-pected event (Figure 117), both of which could be only aspirational for this sector given the economic realities they face.
Smallholder farmers have unique views on storing and saving money. They place a high emphasis on storing money for a specific purpose and somewhere they trust, but this does not necessarily trans-late into a bank account (Figure 118). They also feel they need to be able to access their money immediately. They also like to save money in case of an emergency, but that does not translate into practice.
Smallholder farmers in Mozambique place an even higher level of impor-tance on investing in their home, and a majority feel it is very important to in-vest in a future educational opportunity
FIGURE 113. Regardless of what you have, how important is it to your household to have the following?
21%
21%
27%
31%
50%
15%
12%
14%
15%
13%
26%
24%
26%
22%
17%
39%
43%
33%
31%
20%
Mobile money account
Credit
Savings account
Insurance
Bank account (non-savings)
Very important Somewhat important Not important Don't know
Sample: Smallholder households, n52,574
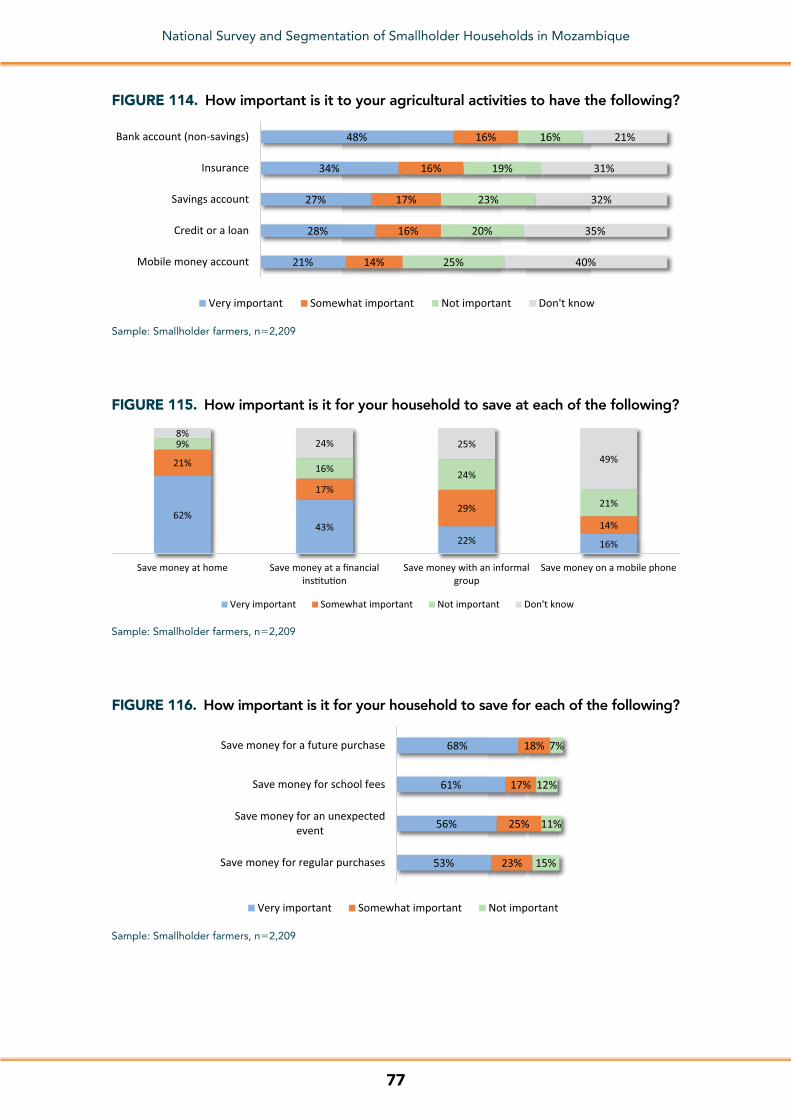
77
National Survey and Segmentation of Smallholder Households in Mozambique
FIGURE 114. How important is it to your agricultural activities to have the following?
Sample: Smallholder farmers, n52,209
21%
28%
27%
34%
48%
14%
16%
17%
16%
16%
25%
20%
23%
19%
16%
40%
35%
32%
31%
21%
Mobile money account
Credit or a loan
Savings account
Insurance
Bank account (non-savings)
Very important Somewhat important Not important Don't know
FIGURE 115. How important is it for your household to save at each of the following?
Sample: Smallholder farmers, n52,209
62%43%
22% 16%
21%
17%
29%
14%
9%
16% 24%
21%
8%24% 25%
49%
Save money at home Save money at a financialins�tu�on
Save money with an informalgroup
Save money on a mobile phone
Very important Somewhat important Not important Don't know
53%
56%
61%
68%
23%
25%
17%
18%
15%
11%
12%
7%
Save money for regular purchases
Save money for an unexpectedevent
Save money for school fees
Save money for a future purchase
Very important Somewhat important Not important
FIGURE 116. How important is it for your household to save for each of the following?
Sample: Smallholder farmers, n52,209

78
National Survey and Segmentation of Smallholder Households in Mozambique
(Figure 119). Investing in a home or a home improvement is also what they feel their household needs to do the most (Figure 120).
Desires and Aspirations: Smallholder households want to borrow from banks or friends and family
When they consider borrowing money, smallholder farmers in Mozambique rec-ognize the importance of borrowing from financial institutions instead of less for-mal institutions, with almost half saying it is very important (Figure 121). There is a sizeable portion of this population that
FIGURE 117. Which of the following do you feel your household needs to save for the most?
Sample: Smallholder farmers, n52,209
Save money for a future purchase
28%
Save money for an unexpected
event27%
Save money for regular purchases
16%
Save money for school fees
20%
Don't know
9%
FIGURE 118. Do you agree or disagree with the following statements?
Sample: Smallholder farmers, n52,209
38%
39%
49%
56%
62%
63%
78%
23%
35%
28%
26%
19%
20%
12%
39%
26%
23%
18%
19%
16%
10%
When my money is in an account, it is constantly working for me
Storing my money somewhere is easier than saving in an account
I like to save my money in an account because it is safer
I like to save my money in case of an emergency
I need to be able to access my money immediately
I like to store money somewhere for a specific purpose
I like to store my money somewhere I trust
Agree Disagree Don't know
FIGURE 119. How important is it for your household to invest in each of the following?
Sample: Smallholder farmers, n52,209
46%
58%
73%
21%
17%
14%
18%
13%
5%
Invest money in a farm
Invest money in a futureeduca�onal opportunity
Invest money in a home/homeimprovement
Very important Somewhat important Not important
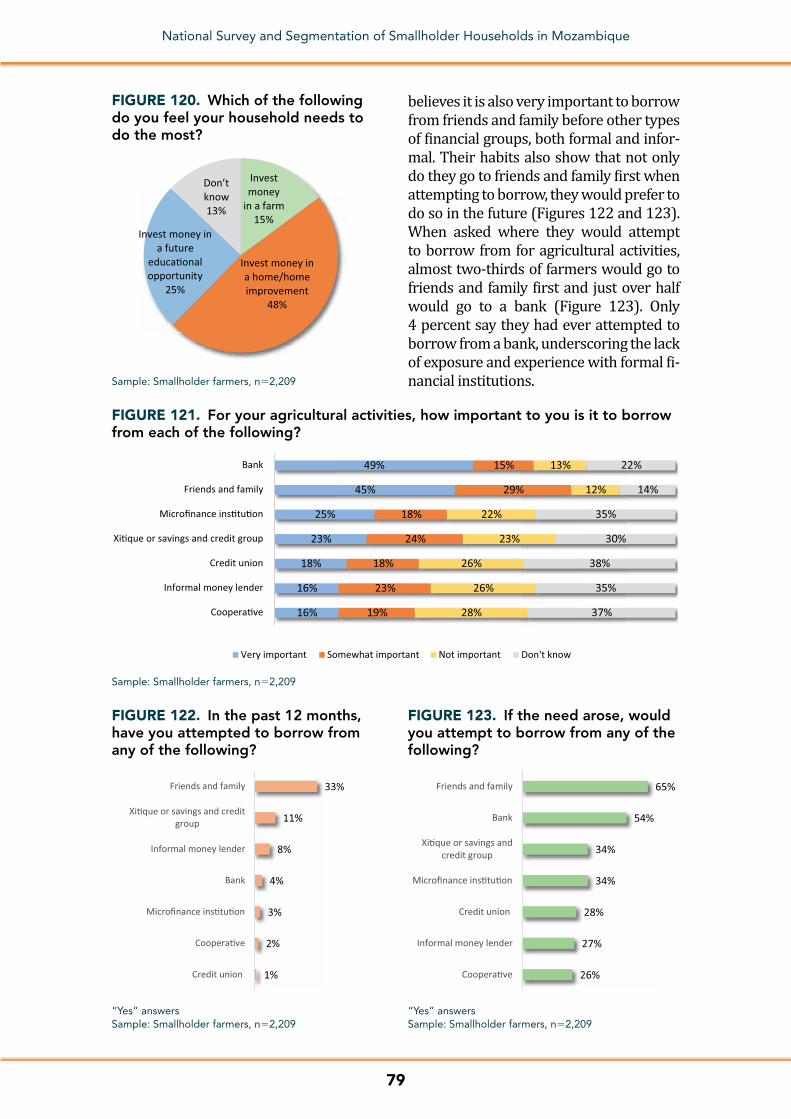
79
National Survey and Segmentation of Smallholder Households in Mozambique
believes it is also very important to borrow from friends and family before other types of financial groups, both formal and infor-mal. Their habits also show that not only do they go to friends and family first when attempting to borrow, they would prefer to do so in the future (Figures 122 and 123). When asked where they would attempt to borrow from for agricultural activities, almost two-thirds of farmers would go to friends and family first and just over half would go to a bank (Figure 123). Only 4 percent say they had ever attempted to borrow from a bank, underscoring the lack of exposure and experience with formal fi-nancial institutions.
FIGURE 120. Which of the following do you feel your household needs to do the most?
Sample: Smallholder farmers, n52,209
Invest money
in a farm15%
Invest money in a home/home improvement
48%
Invest money in a future
educa�onal opportunity
25%
Don’t know13%
FIGURE 121. For your agricultural activities, how important to you is it to borrow from each of the following?
Sample: Smallholder farmers, n52,209
16%
16%
18%
23%
25%
45%
49%
19%
23%
18%
24%
18%
29%
15%
28%
26%
26%
23%
22%
12%
13%
37%
35%
38%
30%
35%
14%
22%
Coopera�ve
Informal money lender
Credit union
Xi�que or savings and credit group
Microfinance ins�tu�on
Friends and family
Bank
Very important Somewhat important Not important Don't know
1%
2%
3%
4%
8%
11%
33%
Credit union
Coopera�ve
Microfinance ins�tu�on
Bank
Informal money lender
Xi�que or savings and creditgroup
Friends and family
FIGURE 122. In the past 12 months, have you attempted to borrow from any of the following?
“Yes” answersSample: Smallholder farmers, n52,209
26%
27%
28%
34%
34%
54%
65%
Coopera�ve
Informal money lender
Credit union
Microfinance ins�tu�on
Xi�que or savings andcredit group
Bank
Friends and family
FIGURE 123. If the need arose, would you attempt to borrow from any of the following?
“Yes” answersSample: Smallholder farmers, n52,209
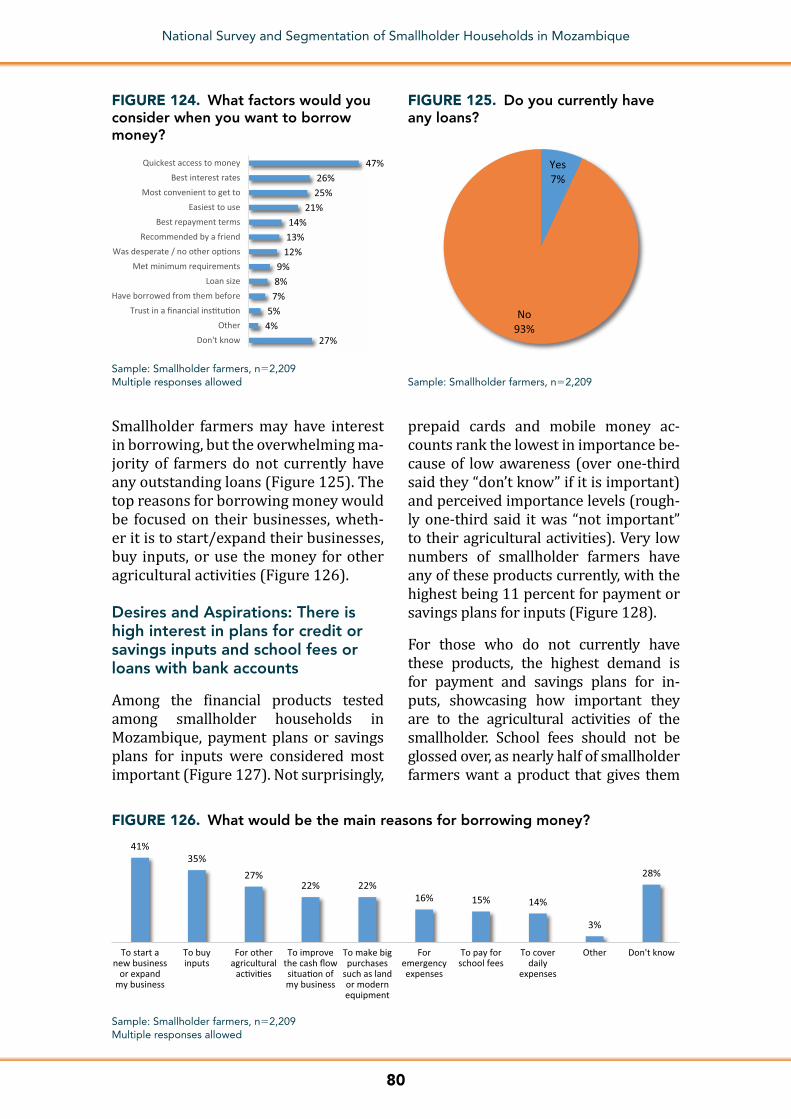
80
National Survey and Segmentation of Smallholder Households in Mozambique
Smallholder farmers may have interest in borrowing, but the overwhelming ma-jority of farmers do not currently have any outstanding loans (Figure 125). The top reasons for borrowing money would be focused on their businesses, wheth-er it is to start/expand their businesses, buy inputs, or use the money for other agricultural activities (Figure 126).
Desires and Aspirations: There is high interest in plans for credit or savings inputs and school fees or loans with bank accounts
Among the financial products tested among smallholder households in Mozambique, payment plans or savings plans for inputs were considered most important (Figure 127). Not surprisingly,
prepaid cards and mobile money ac-counts rank the lowest in importance be-cause of low awareness (over one-third said they “don’t know” if it is important) and perceived importance levels (rough-ly one-third said it was “not important” to their agricultural activities). Very low numbers of smallholder farmers have any of these products currently, with the highest being 11 percent for payment or savings plans for inputs (Figure 128).
For those who do not currently have these products, the highest demand is for payment and savings plans for in-puts, showcasing how important they are to the agricultural activities of the smallholder. School fees should not be glossed over, as nearly half of smallholder farmers want a product that gives them
FIGURE 124. What factors would you consider when you want to borrow money?
27%4%5%7%8%9%
12%13%14%
21%25%26%
47%
Don't knowOther
Trust in a financial ins�tu�onHave borrowed from them before
Loan sizeMet minimum requirements
Was desperate / no other op�onsRecommended by a friend
Best repayment termsEasiest to use
Most convenient to get toBest interest rates
Quickest access to money
Sample: Smallholder farmers, n52,209Multiple responses allowed
Yes7%
No93%
FIGURE 125. Do you currently have any loans?
Sample: Smallholder farmers, n52,209
FIGURE 126. What would be the main reasons for borrowing money?
Sample: Smallholder farmers, n52,209Multiple responses allowed
41%35%
27%22% 22%
16% 15% 14%
3%
28%
To start anew business
or expandmy business
To buyinputs
For otheragricultural
ac�vi�es
To improvethe cash flowsitua�on ofmy business
To make bigpurchases
such as landor modernequipment
Foremergencyexpenses
To pay forschool fees
To coverdaily
expenses
Other Don't know
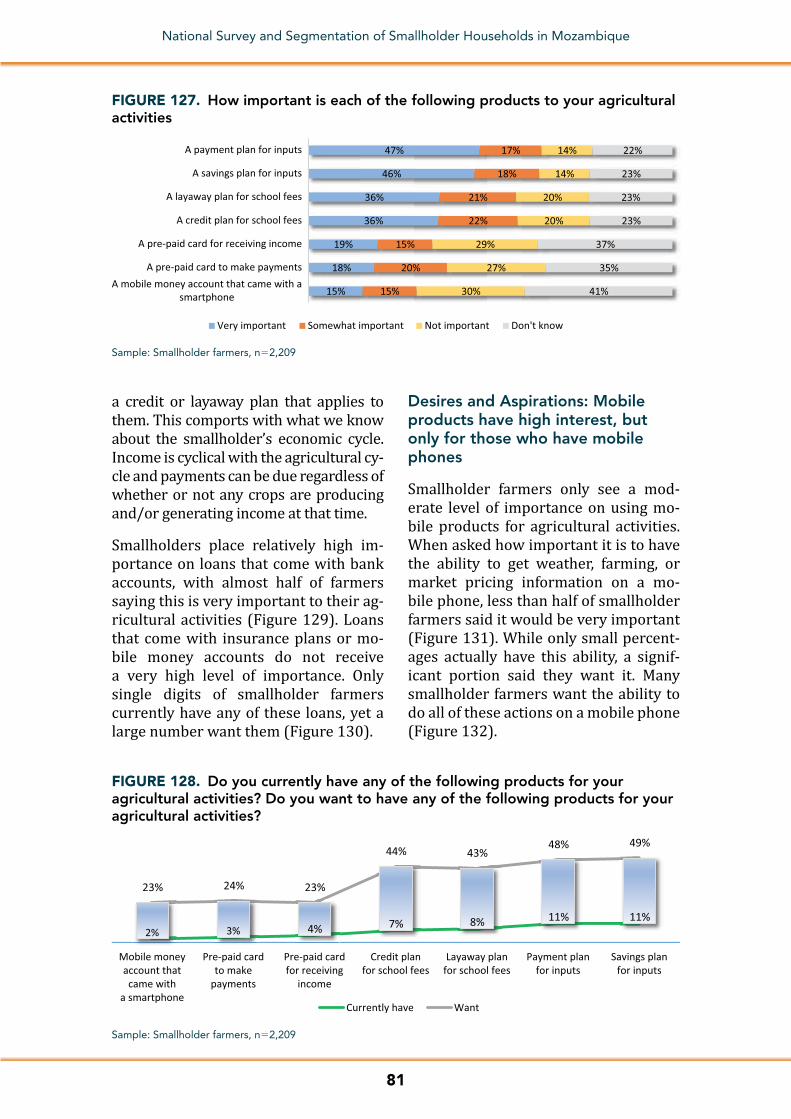
81
National Survey and Segmentation of Smallholder Households in Mozambique
a credit or layaway plan that applies to them. This comports with what we know about the smallholder’s economic cycle. Income is cyclical with the agricultural cy-cle and payments can be due regardless of whether or not any crops are producing and/or generating income at that time.
Smallholders place relatively high im-portance on loans that come with bank accounts, with almost half of farmers saying this is very important to their ag-ricultural activities (Figure 129). Loans that come with insurance plans or mo-bile money accounts do not receive a very high level of importance. Only single digits of smallholder farmers currently have any of these loans, yet a large number want them (Figure 130).
Desires and Aspirations: Mobile products have high interest, but only for those who have mobile phones
Smallholder farmers only see a mod-erate level of importance on using mo-bile products for agricultural activities. When asked how important it is to have the ability to get weather, farming, or market pricing information on a mo-bile phone, less than half of smallholder farmers said it would be very important (Figure 131). While only small percent-ages actually have this ability, a signif-icant portion said they want it. Many smallholder farmers want the ability to do all of these actions on a mobile phone (Figure 132).
FIGURE 127. How important is each of the following products to your agricultural activities
Sample: Smallholder farmers, n52,209
15%
18%
19%
36%
36%
46%
47%
15%
20%
15%
22%
21%
18%
17%
30%
27%
29%
20%
20%
14%
14%
41%
35%
37%
23%
23%
23%
22%
A mobile money account that came with asmartphone
A pre-paid card to make payments
A pre-paid card for receiving income
A credit plan for school fees
A layaway plan for school fees
A savings plan for inputs
A payment plan for inputs
Very important Somewhat important Not important Don't know
FIGURE 128. Do you currently have any of the following products for your agricultural activities? Do you want to have any of the following products for your agricultural activities?
Sample: Smallholder farmers, n52,209
2% 3% 4% 7% 8% 11% 11%
23% 24% 23%
44% 43%48% 49%
Mobile moneyaccount that
came witha smartphone
Pre-paid cardto make
payments
Pre-paid cardfor receiving
income
Credit planfor school fees
Layaway planfor school fees
Payment planfor inputs
Savings planfor inputs
Currently have Want

82
National Survey and Segmentation of Smallholder Households in Mozambique
FIGURE 129. How important is each of the following products to your agricultural activities
Sample: Smallholder farmers, n52,209
22%
28%
44%
20%
18%
18%
26%
23%
16%
32%
31%
23%
A loan that came with a mobile moneyaccount
A loan that came with an insurance plan
A loan that came with a bank account
Very important Somewhat important Not important Don't know
FIGURE 130. Do you currently have any of the following products for your agricultural activities? Do you want to have any of the following products for your agricultural activities?
Sample: Smallholder farmers, n52,209
3% 4% 6%
35%39%
51%
Loan that came with a mobilemoney account
Loan that came withan insurance plan
Loan that came witha bank account
Currently have Want
FIGURE 131. How important is each of the following abilities to your household’s agricultural activities?
Sample: Smallholder farmers, n52,209
38%
39%
39%
41%
44%
47%
17%
18%
17%
19%
17%
14%
19%
21%
20%
20%
18%
17%
26%
22%
24%
20%
20%
22%
Ability to charge my phone at a central loca�on
Ability to track shipments of inputs and crops on a mobilephone
Ability to buy and sell on a mobile phone
Ability to access market pricing informa�on on a mobilephone
Ability to access farming informa�on on a mobile phone
Ability to access weather informa�on on a mobile phone
Very important Somewhat important Not important Don't know

83
National Survey and Segmentation of Smallholder Households in Mozambique
FIGURE 132. Do you currently have any of the following abilities for your agricultural activities? Do you want to have any of the following abilities for your agricultural activities?
Sample: Smallholder farmers, n52,209
42% 40% 40% 40% 37%30%
8% 10% 9% 7% 10%15%
Ability to accessfarming
informa�on ona mobile phone
Ability to accessweather
informa�on ona mobile phone
Ability to accessmarket pricinginforma�on ona mobile phone
Ability to trackshipments of
inputs and crops ona mobile phone
Ability tobuy and sell ona mobile phone
Ability to charge myphone at a central
loca�on
Want Currently have

84
National Survey and Segmentation of Smallholder Households in Mozambique
ANNEX 1: METHODOLOGY AND DESIGN
Sample design. The smallholder house-hold survey in Mozambique is a na-tionally representative survey with a target sample size of 3,000 smallholder households. The sample was designed to provide reliable survey estimates at the national level and for the following groups of regions:
1. Northern region comprised of the provinces of Niassa, Cabo Delgado, and Nampula
2. Central region comprised of Zambe-zia, Tete, Sofala, and Manica
3. Southern region consisting of In-hambane, Maputo Province, Maputo City, and Gaza
A. Sampling Frame
The sampling frame for the smallholder household survey was the 2009–2010 Census of Agriculture and Livestock (Censo Agro-Pecuário, CAP II) conduct-ed by INE and based on the 2007 Cen-sus of Population and Housing (2007 RGPH). CAP II is a large sample that was designed to be representative at the district level and its sample of enu-meration areas (EAs) is considered as the “master sample” for the national agricultural surveys. EAs with less than 15 agricultural households (mostly in urban areas) were excluded from the sampling frame for CAP II. The sample allocation of the smallholder household survey was based on the distribution of
households per region and urban and rural (Table 1).
B. Sample allocation and selection
To take nonresponse into account, the target sample size was increased to 3,158 households assuming a household nonresponse rate of 5 percent observed in similar national households. The to-tal sample size was first allocated to the three regions based on the number of agricultural households. Within each region, the resulting sample was further distributed proportionally to urban and rural areas (Table 2).
Given that EAs were the primary sam-pling units, and 15 households were selected in each EA, a total of 212 EAs were selected (Table 3).
The sample for the smallholder survey is a stratified multistage sample. Stratifica-tion was achieved by separating urban and rural areas within each region.
At the first sampling stage for the small-holder survey, the CAP II sample EAs were selected systematically with prob-ability proportional to size (PPS) within each district, and rural and urban stra-tum, where the measure of size was the number of agricultural households in the census frame. In general, if EAs are selected with PPS at the first sampling stage, a subsample of EAs would be se-lected with equal probability within each stratum.
TABLE 1. Distribution of Agricultural Households by Region, Urban and Rural Strata (CAP II Sampling Frame Based on Mozambique RGPH 2007)
Urban Rural Total
Northern 175,340 1,125,111 1,300,451
Central 212,695 1,384,464 1,597,159
Southern 166,002 470,665 636,667
Mozambique 554,037 2,980,240 3,534,277
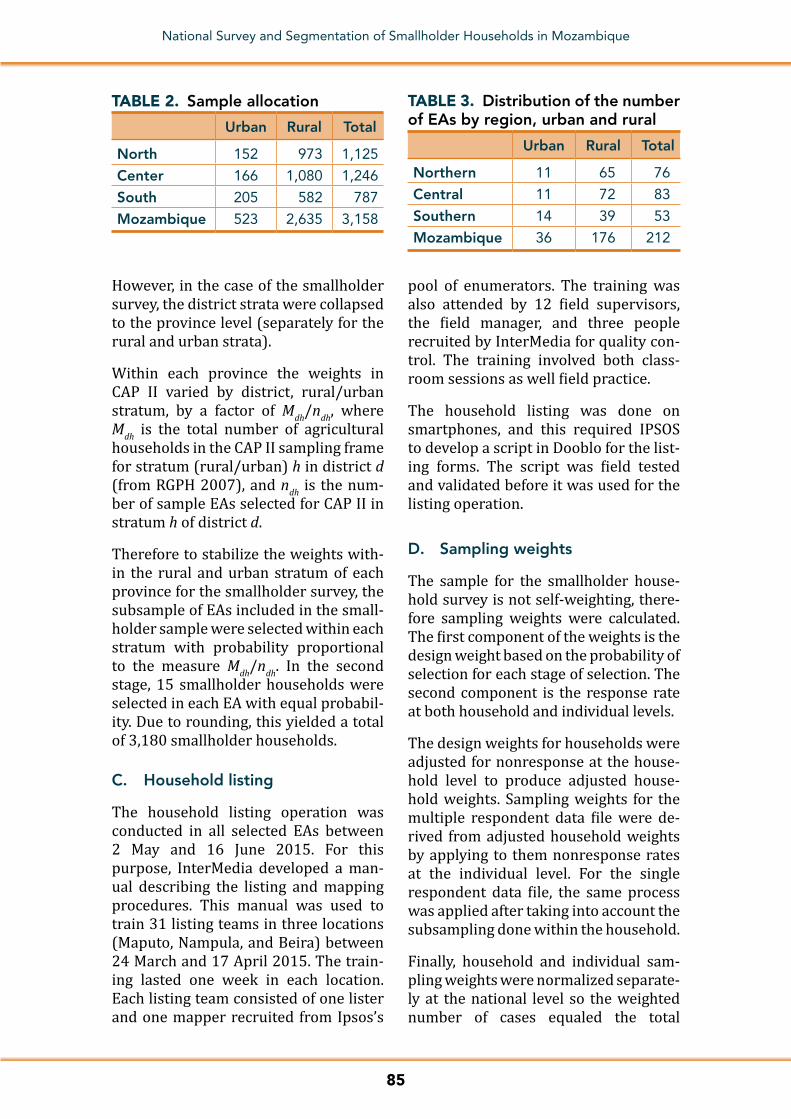
85
National Survey and Segmentation of Smallholder Households in Mozambique
However, in the case of the smallholder survey, the district strata were collapsed to the province level (separately for the rural and urban strata).
Within each province the weights in CAP II varied by district, rural/urban stratum, by a factor of Mdh/ndh, where Mdh is the total number of agricultural households in the CAP II sampling frame for stratum (rural/urban) h in district d (from RGPH 2007), and ndh is the num-ber of sample EAs selected for CAP II in stratum h of district d.
Therefore to stabilize the weights with-in the rural and urban stratum of each province for the smallholder survey, the subsample of EAs included in the small-holder sample were selected within each stratum with probability proportional to the measure Mdh/ndh. In the second stage, 15 smallholder households were selected in each EA with equal probabil-ity. Due to rounding, this yielded a total of 3,180 smallholder households.
C. Household listing
The household listing operation was conducted in all selected EAs between 2 May and 16 June 2015. For this purpose, InterMedia developed a man-ual describing the listing and mapping procedures. This manual was used to train 31 listing teams in three locations (Maputo, Nampula, and Beira) between 24 March and 17 April 2015. The train-ing lasted one week in each location. Each listing team consisted of one lister and one mapper recruited from Ipsos’s
pool of enumerators. The training was also attended by 12 field supervisors, the field manager, and three people recruited by InterMedia for quality con-trol. The training involved both class-room sessions as well field practice.
The household listing was done on smartphones, and this required IPSOS to develop a script in Dooblo for the list-ing forms. The script was field tested and validated before it was used for the listing operation.
D. Sampling weights
The sample for the smallholder house-hold survey is not self-weighting, there-fore sampling weights were calculated. The first component of the weights is the design weight based on the probability of selection for each stage of selection. The second component is the response rate at both household and individual levels.
The design weights for households were adjusted for nonresponse at the house-hold level to produce adjusted house-hold weights. Sampling weights for the multiple respondent data file were de-rived from adjusted household weights by applying to them nonresponse rates at the individual level. For the single respondent data file, the same process was applied after taking into account the subsampling done within the household.
Finally, household and individual sam-pling weights were normalized separate-ly at the national level so the weighted number of cases equaled the total
TABLE 2. Sample allocation
Urban Rural Total
North 152 973 1,125
Center 166 1,080 1,246
South 205 582 787
Mozambique 523 2,635 3,158
TABLE 3. Distribution of the number of EAs by region, urban and rural
Urban Rural Total
Northern 11 65 76
Central 11 72 83
Southern 14 39 53
Mozambique 36 176 212
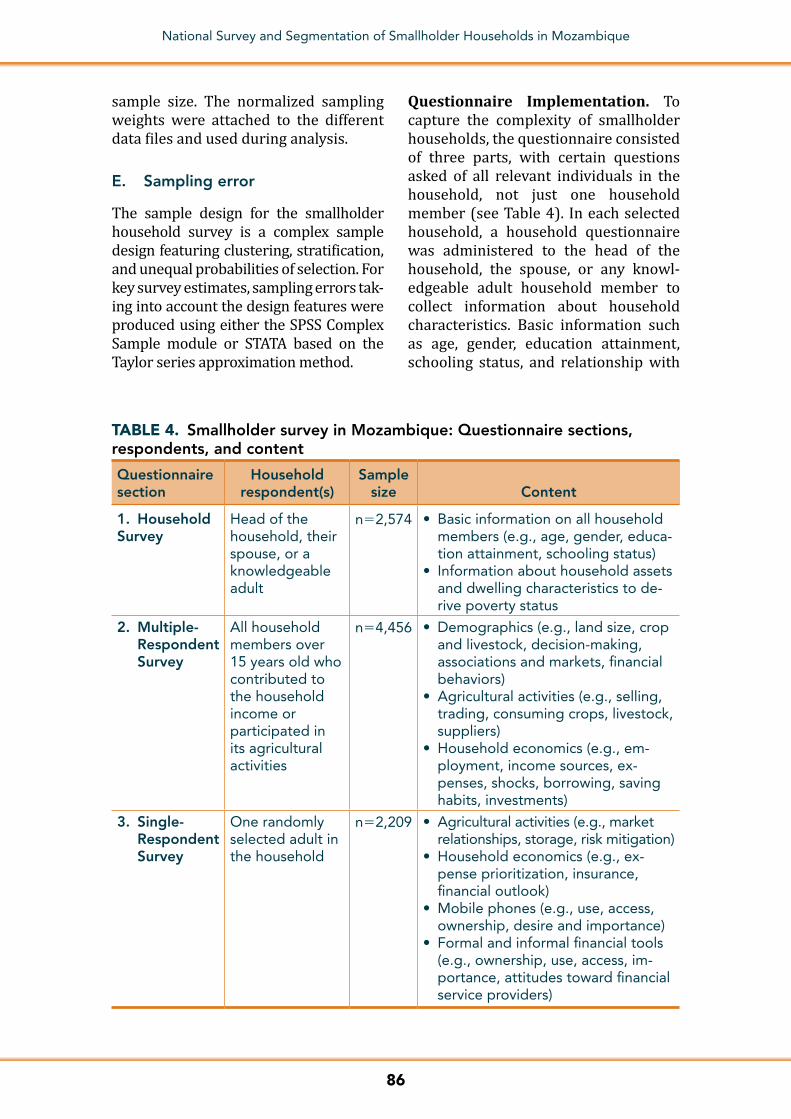
86
National Survey and Segmentation of Smallholder Households in Mozambique
sample size. The normalized sampling weights were attached to the different data files and used during analysis.
E. Sampling error
The sample design for the smallholder household survey is a complex sample design featuring clustering, stratification, and unequal probabilities of selection. For key survey estimates, sampling errors tak-ing into account the design features were produced using either the SPSS Complex Sample module or STATA based on the Taylor series approximation method.
Questionnaire Implementation. To capture the complexity of smallholder households, the questionnaire consisted of three parts, with certain questions asked of all relevant individuals in the household, not just one household member (see Table 4). In each selected household, a household questionnaire was administered to the head of the household, the spouse, or any knowl-edgeable adult household member to collect information about household characteristics. Basic information such as age, gender, education attainment, schooling status, and relationship with
TABLE 4. Smallholder survey in Mozambique: Questionnaire sections, respondents, and content
Questionnaire section
Household respondent(s)
Sample size Content
1. Household Survey
Head of the household, their spouse, or a knowledgeable adult
n52,574 • Basic information on all household members (e.g., age, gender, educa-tion attainment, schooling status)
• Information about household assets and dwelling characteristics to de-rive poverty status
2. Multiple- Respondent Survey
All household members over 15 years old who contributed to the household income or participated in its agricultural activities
n54,456 • Demographics (e.g., land size, crop and livestock, decision-making, associations and markets, financial behaviors)
• Agricultural activities (e.g., selling, trading, consuming crops, livestock, suppliers)
• Household economics (e.g., em-ployment, income sources, ex-penses, shocks, borrowing, saving habits, investments)
3. Single- Respondent Survey
One randomly selected adult in the household
n52,209 • Agricultural activities (e.g., market relationships, storage, risk mitigation)
• Household economics (e.g., ex-pense prioritization, insurance, financial outlook)
• Mobile phones (e.g., use, access, ownership, desire and importance)
• Formal and informal financial tools (e.g., ownership, use, access, im-portance, attitudes toward financial service providers)

87
National Survey and Segmentation of Smallholder Households in Mozambique
the household head was collected on all household members. The Household questionnaire also collected informa-tion on whether each household mem-ber contributes to the household income or participates in the household’s ag-ricultural activities. This information was later used to identify all household members eligible for the other two ques-tionnaires. Information on household assets and dwelling characteristics was also collected to derive the socioeco-nomic/poverty status of households. A Multiple-Respondent questionnaire was administered to all adult members in each selected household to collect infor-mation on their agricultural activities, financial behaviors, and mobile money use. In addition, in each participating household only one household member was selected using the Kish grid and was administered the Single-Respondent questionnaire.
The questionnaire was translated into five languages—Portuguese, Changana, Macua, Ndau, and Sena—and then pre-tested and validated in all languages. Before the start of fieldwork, all three questionnaires were pretested in all languages to make sure the questions were clear and could be understood by the respondents. The pretest took place 19–24 June 2015, in Maputo, and 17–20 July 2015, in Inhambane, Nampu-la, and Tete. In total, the pretest covered 79 households. At the end of the pretest, debriefing sessions were held with the pretest field staff, and the question-naires were modified based on the ob-servations from the pretest.
Following the finalization of question-naires, a script was developed to support data collection on mobile phones. The script was tested and validated before its use in the field. The questionnaires are found in the user guide accompa-nying the data set for this household survey.
Main Training, Fieldwork, Data Processing. InterMedia’s local field partner conducted the recruitment of interviewers and supervisors for the main fieldwork, taking into account their language skills. Following the recruitment of 64 field staff by InterMe-dia’s local field partner, two training ses-sions were conducted in Maputo from 29 June to 4 July 2015 and in Nampula 7–13 August 2015, and included instruc-tion on interview techniques and field procedures, a detailed review of the sur-vey questionnaires, mock interviews be-tween participants in the classroom, and a field practice with real respondents in the areas outside the sampled EAs. Four independent field quality control staff (“QC team”), directly hired by InterMe-dia, also attended the training and par-ticipated in the field practice.
Interviewing teams collected data for the survey via mobile phones. Each team consisted of one supervisor and four to five interviewers. Two staff members from InterMedia’s local field partner coordinated and supervised fieldwork activities in addition to the QC team. The QC team stayed with the survey teams during fieldwork to closely su-pervise and monitor them. Data were collected from 23 July to 4 September 2015. During data collection, InterMe-dia received weekly partial data from the field, which were analyzed for qual-ity control and used to provide timely feedback to field staff. The final data file was checked for inconsistencies and er-rors by InterMedia and corrections were made as necessary and where possible.
Response Rates. The questionnaire tables show household and individual response rates for the Mozambique smallholder household survey. A total of 3,041 households were selected for the sample, of which 2,782 were found to be occupied during data collection. Of these, 2,574 were successfully interviewed,
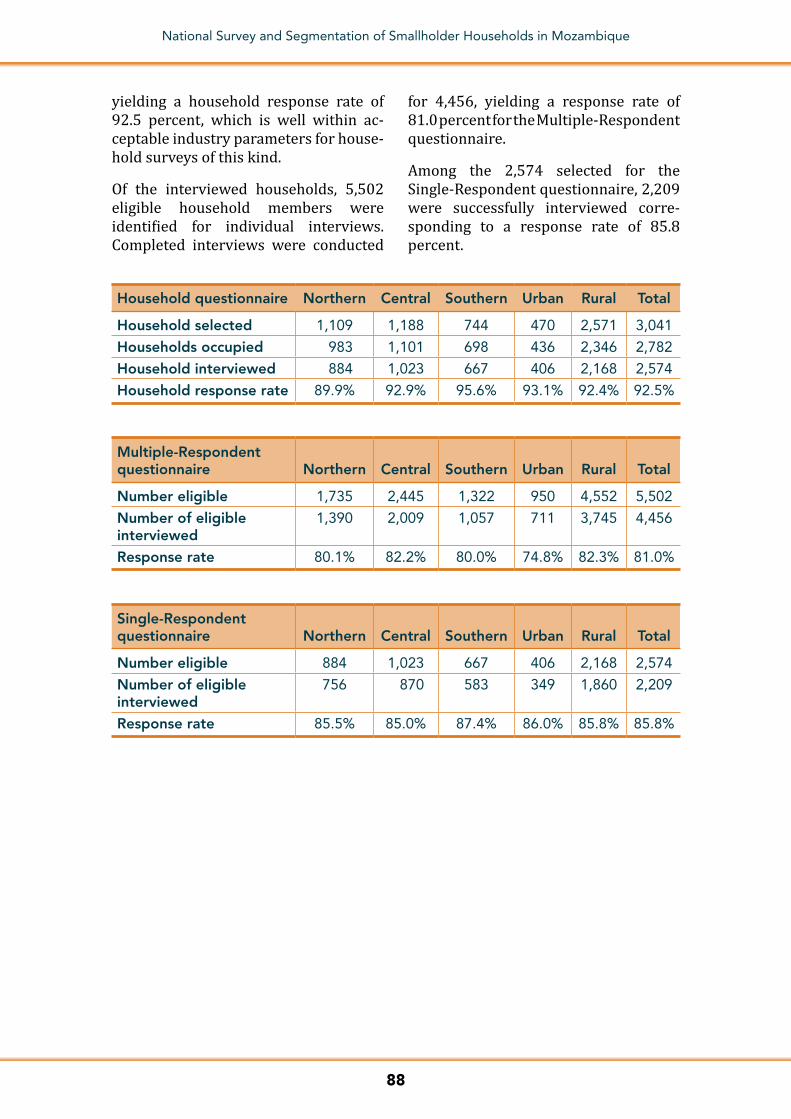
88
National Survey and Segmentation of Smallholder Households in Mozambique
yielding a household response rate of 92.5 percent, which is well within ac-ceptable industry parameters for house-hold surveys of this kind.
Of the interviewed households, 5,502 eligible household members were identified for individual interviews. Completed interviews were conducted
for 4,456, yielding a response rate of 81.0 percent for the Multiple-Respondent questionnaire.
Among the 2,574 selected for the Single-Respondent questionnaire, 2,209 were successfully interviewed corre-sponding to a response rate of 85.8 percent.
Household questionnaire Northern Central Southern Urban Rural Total
Household selected 1,109 1,188 744 470 2,571 3,041
Households occupied 983 1,101 698 436 2,346 2,782
Household interviewed 884 1,023 667 406 2,168 2,574
Household response rate 89.9% 92.9% 95.6% 93.1% 92.4% 92.5%
Multiple-Respondent questionnaire Northern Central Southern Urban Rural Total
Number eligible 1,735 2,445 1,322 950 4,552 5,502
Number of eligible interviewed
1,390 2,009 1,057 711 3,745 4,456
Response rate 80.1% 82.2% 80.0% 74.8% 82.3% 81.0%
Single-Respondent questionnaire Northern Central Southern Urban Rural Total
Number eligible 884 1,023 667 406 2,168 2,574
Number of eligible interviewed
756 870 583 349 1,860 2,209
Response rate 85.5% 85.0% 87.4% 86.0% 85.8% 85.8%
89
National Survey and Segmentation of Smallholder Households in Mozambique
34 See documentation on Random Forest Algorithm at http://www.statsoft.com/Textbook/Random-Forest.
ANNEX 2: RANDOM FOREST
A Random Forest consists of a collection or ensemble of simple tree predictors, each capable of producing a response when presented with a set of predictor values.34 For classification problems, this response takes the form of a class mem-bership, which associates, or classifies, a set of independent predictor values with one of the categories present in the dependent variable. Alternatively, for regression problems, the tree response is an estimate of the dependent variable given the predictors. The Random Forest algorithm was developed by Breiman.
A Random Forest consists of an arbitrary number of simple trees, which are used to determine the final outcome. For classifi-cation problems, the ensemble of simple trees vote for the most popular class. In the regression problem, their responses are averaged to obtain an estimate of the dependent variable. Using tree ensem-bles can lead to significant improvement in prediction accuracy (i.e., better ability to predict new data cases).
Technical details
The response of each tree depends on a set of predictor values chosen inde-pendently (with replacement) and with the same distribution for all trees in the forest, which is a subset of the predictor values of the original data set. The opti-mal size of the subset of predictor vari-ables is given by log2 M11, where M is the number of inputs.
For classification problems, given a set of simple trees and a set of random predictor variables, the Random Forest method defines a margin function that measures the extent to which the aver-age number of votes for the correct class exceeds the average vote for any other
class present in the dependent variable. This measure provides us not only with a convenient way of making predictions, but also with a way of associating a con-fidence measure with those predictions.
For regression problems, Random For-ests are formed by growing simple trees, each capable of producing a numerical response value. Here, too, the predictor set is randomly selected from the same distribution and for all trees. Given the above, the mean-square error for a Ran-dom Forest is given by:
mean error 5 (observed 2 tree response)2
The predictions of the Random Forest are taken to be the average of the pre-dictions of the trees:
Random Forest Predictions 5 1K ∑
K
K 5 1 K th tree response
where the index k runs over the individ-ual trees in the forest.
Typically, Random Forests can flexibly incorporate missing data in the predic-tor variables. When missing data are en-countered for a particular observation (case) during model building, the pre-diction made for that case is based on the last preceding (nonterminal) node in the respective tree. So, for example, if at a particular point in the sequence of trees a predictor variable is select-ed at the root (or other nonterminal) node for which some cases have no valid data, then the prediction for those cas-es is simply based on the overall mean at the root (or other nonterminal) node. Hence, there is no need to eliminate cas-es from the analysis if they have missing data for some of the predictors, nor is it necessary to compute surrogate split statistics.