sedimentology, statistics, and flow behavior for a tide ... of petroleum engineering, louisiana...
TRANSCRIPT
Sedimentology, Statistics, and FlowBehavior for a Tide-influenced DeltaicSandstone, Frontier Formation,Wyoming, United States
Christopher D. White
The Craft and Hawkins Department of Petroleum Engineering, Louisiana State University, BatonRouge, Louisiana, U.S.A.
Brian J. Willis
Department of Geology and Geophysics, Texas A&M University, College Station, Texas, U.S.A.
Shirley P. Dutton
Bureau of Economic Geology, John A. and Katherine G. Jackson School of Geosciences,University of Texas at Austin, Austin, Texas, U.S.A.
Janok P. Bhattacharya
Department of Geosciences, University of Texas at Dallas, Richardson, Texas, U.S.A.
Keshav Narayanan
Landmark Graphics Corp., Austin, Texas, U.S.A.
ABSTRACT
Astudy of a tide-influenced deltaic sandstone investigated geologic variations that
affect hydrocarbon production in analogous reservoirs. The Cretaceous-aged
Frewens Allomember was deposited by a delta prograding into a narrow shoreline
embayment between an older, wave-dominated delta lobe to the south and a basin-floor
ridge created by subtle structural uplift to the north. The Frewens Allomember is exposed
in outcrops of the Frontier Formation in central Wyoming (United States). It comprises
two 5-km-wide by 20-km-long upward-coarsening sandstone bodies. Each body contains
basinward-dipping internal beds. Heterolithic beds capped by extensive shale drapes
record episodic tidal deposition in the lower portions of the sandstone bodies, whereas
sandier cross-stratified beds in the upper parts of bodies record stronger and more uni-
formly ebb-directed currents. During diagenesis, calcite concretions formed preferentially
at the top of the upper sandstone body as water circulated down from overlying shales.
7White, C. D., B. J. Willis, S. P. Dutton, J. P. Bhattacharya, and K. Narayanan,
2004, Sedimentology, statistics, and flow behavior for a tide-influenced deltaicsandstone, Frontier Formation, Wyoming, United States, in Integration ofoutcrop and modern analogs in reservoir modeling: AAPG Memoir 80,p. 129–152.
129

Diagrams of bedding, facies, calcite concretions, and bed-draping shales were com-
piled from high-resolution photomosaics and field observations. Sedimentologic logs,
field permeameter measurements, and thin-section observations describe petrophysical
properties of facies in the delta lobes. Variograms quantify the spatial correlation of
permeability in lithofacies. The lengths of bed-draping shales were estimated from out-
crop data using a termination frequency model. The spatial distribution of concretions
was modeled with indicator geostatistics.
Flow models integrated bedding geometry, lithofacies, and petrophysical proper-
ties in an appropriate structure for reservoir simulation. These models were used to
analyze sensitivity of reservoir behavior to different geologic features and to inves-
tigate methods for modeling and upscaling interwell-scale heterogeneity. Intrafacies
variability of permeability has negligible effects at the sandstone-body scale but sig-
nificant effects at the bed scale. Shale lengths increase toward the lateral margins and
toward the base of the sandstone bodies. Inclined shales reduce upscaled permeability,
recovery efficiency, and breakthrough time. Calcite concretions decrease upscaled
permeability. An upscaling method based on flow simulation and response-surface
models accurately and efficiently represents the effects of geologic heterogeneity and
flow rate on a coarse simulation grid.
INTRODUCTION
Production prediction, field development, andeconomic evaluation rely on quantitative models ofreservoir geometry and rock properties. Where the dis-tribution of reservoir and sealing units in the subsurfaceis complex, naively averaged models cannot adequatelypredict reservoir performance or uncertainty. Reser-voir simulators can predict reservoir behavior in thepresence of known geologic heterogeneities, but de-scription and prediction of all scales of geologic var-iability that may influence subsurface fluid flow is adaunting task. Although small-scale rock-property var-iations are evident in cores and well logs, and larger scaleheterogeneities are detectable by seismic surveys andcan be correlated between wells, interwell-scale varia-tions are difficult to quantify in reservoirs. Outcrop ana-log studies bridge this interwell-scale gap in definingreservoir variability.
Although sequence-stratigraphic and facies modelsdefine large-scale reservoir units and describe patternsof small-scale subsurface variability, these models sparse-ly predict spatial variability of reservoir properties. Engi-neering models must predict fine- and interwell-scaleheterogeneity in reservoirs. Deterministic and stochastictechniques may be used in concert to predict hetero-geneity in complex reservoirs (Rossini et al., 1994).Developing and testing models of interwell-scale varia-bility requires quantitative geologic data from demon-strably analogous outcrops to define the geometry,distribution, and magnitude of geologic variations thatcan affect subsurface fluid flow.
Reservoir simulation studies are time-consumingand expensive because each reservoir is a unique case,consisting of specialized geologic measurement andinference methods, sensitivity analysis, and simulationprocedures. Situations that might require such modelsinclude high-cost areas (e.g., turbidite reservoirs in theGulf of Mexico; Lerch et al., 1996), complex reservoirsfor which simple descriptions are inadequate (e.g., tide-influenced reservoirs in Venezuela; Ambrose et al.,1995), reservoirs with complex recovery processes (e.g.,miscible gas displacements; Hewett and Behrens, 1993),and exceptionally valuable assets (e.g., Prudhoe Bay;Tye et al., 1999). As knowledge of heterogeneity indifferent depositional environments improves, mod-els become more standardized and easier to use. Ascomputing technology continues to advance, reservoirsimulation and associated technologies will be usedincreasingly often to evaluate alternative reservoir de-velopment strategies and to quantify economic uncer-tainty (Begg et al., 2001). Studies of outcrop analogshelp develop efficient, accurate models for reservoirdescription, simulation, and evaluation.
A particular geologic feature may or may not com-plicate prediction of reservoir behavior. Some types ofgeologic variability can be represented adequately usingsimple averages, whereas predicting effects of othertypes requires detailed spatial descriptions. Where het-erogeneities are complex and occur at multiple scales, itis difficult to discern a priori which features exert thegreatest influence on reservoir behavior or to defineaveraging rules for flow properties. Flow simulationsof high-resolution outcrop data quantify effects and
130 White et al.

interactions of different types and scales of heteroge-neity. Experimental design helps construct efficient,accurate sensitivity studies (Kjønsvik et al., 1992). Iden-tifying the geologic features that have significant effectson reservoir behavior focuses data collection and mod-eling efforts to improve reservoir description.
Fine-grid, interwell-scale geologic models usuallymust be upscaled to be feasible for use in fieldwidesimulation studies. Geostatistical models and upscalingmethods can be tested against data-rich outcrop datasets. In oil and gas reservoirs, engineering parameterssuch as fluid properties and production rates influencethe relative importance of geologic features. For exam-ple, the impact of permeability heterogeneity com-monly varies as the flow rate or direction varies (Dake,1978; Durlofsky, 1997). Such interactions between en-gineering and geologic factors affect sensitivities, per-formance predictions, and estimates of coarse-grid orupscaled properties. Screening, upscaling, and predic-tion methods should capture these dependencies.
This chapter describes an outcrop study of a tide-influenced sandstone exposed in central Wyoming. TheFrewens Allomember is analogous to lithologically com-plex reservoirs in the North Sea (Brandsæter et al., 2001),South America (Ambrose et al., 1995), and Southeast Asia(Kurniawan et al., 2001). Outcrop studies of reservoiranalogs integrate data from many specialties to (1) estab-lish the sequence-stratigraphic framework and deposi-tional environments of the deposits to identify analo-gous settings, (2) quantify sedimentologic and petrophys-ical variations on a hierarchy of depositional strata, (3)determine the burial history and diagenetic overprint,thereby separating depositional and diagenetic controls,(4) identify the most important geologic features defin-ing reservoir heterogeneity, (5) develop models that canbe used to predict the distribution of important hetero-geneities in reservoirs, and (6) verify that geologic mod-els and upscaling methods correctly characterize fine-,interwell-, and large-scale effects on reservoir behavior.
In the following sections, the regional stratigraphy,sedimentology, and diagenesis of the Frewens sand-stone are discussed first. Methods to quantify geologicvariability are then addressed. Subsequent sections de-scribe methods to predict heterogeneities in the sub-surface, and flow simulations illuminate sensitivitiesand upscaling. The chapter concludes with a discussionof how these data can be used to improve reservoirmodels and performance predictions.
GEOLOGIC SETTING
Regional Scale
The Frontier Formation is an Upper Cretaceous(Cenomanian age) clastic wedge that prograded east-
ward from the Sevier orogenic belt into a forelandbasin flooded by the Western Interior Seaway of NorthAmerica (Figure 1A, B; Barlow and Haun, 1966; Dymanet al., 1994). The Mowry and Cody shales, thick ma-rine mudstones deposited during widespread transgres-sions, bound the Frontier Formation below and above,respectively (Figure 1C). The Frontier Formation thinseastward from a kilometer-thick fluvial and shorelinesuccession in western Wyoming. In central Wyoming,it is a few hundred meters–thick succession that is cut byseveral major unconformities and composed of gradu-ally upward-coarsening, shallow-marine sandstonesinterbedded with thick marine mudstones (Barlowand Haun, 1966; McGooky et al., 1972). The basal partof this clastic wedge, the lower Belle Fourche Member ofthe Frontier Formation, contains four unconformity-bounded, upward-coarsening successions (termed Har-lan, Willow, Frewens, and Posey Allomembers, Figure1C), each of which records the progradation of shore-lines across the low-gradient floor of the CretaceousInterior Seaway. Erosion surfaces at the tops of theseallomembers placed sealing offshore mudstones di-rectly over the sandstones.
The distal ends of sandstones capping allomem-bers outcrop on the western edge of the Powder RiverBasin in central Wyoming (Figure 1A, B; Merewetheret al., 1979; Tillman and Merewether, 1994, 1998;Bhattacharya and Willis, 2001). Lower Belle Fourcheallomembers were mapped from outcrops southeast ofthe Bighorn Mountains and hundreds of well logs inthe adjacent Powder River Basin (Figure 1D, E). Theallomembers have broad lobate shapes, gradationalbases with underlying shales, upward-coarsening fa-cies, internal basinward-dipping beds, and basinward-radiating paleocurrents (Bhattacharya and Willis,2001).
Geometries, lithologies, paleocurrents, and the po-sition in the basin suggest that the lower Belle Four-che allomembers were deposited on lowstand deltasmany hundreds of kilometers from highstand shore-lines to the west. Erosion surfaces capping allomembersare interpreted to record transgressive ravinement thatremoved all delta-top facies, leaving only delta-frontand prodelta sediments. The lack of distributary chan-nel deposits, flood-plain or tidal-flat mudstones, andcoals at the top of deltaic sandstones contrasts withobservations of highstand delta systems (Barton, 1994).The thickest parts of successive delta sandstones arelaterally offset (Figure 1F), indicating a low accommo-dation setting. Subtle tectonic warping of the basinfloor influenced the site of delta deposition and theextent of ravinement during subsequent transgressions(Bhattacharya and Willis, 2001).
Most of the lower Belle Fourche allomembers (Har-lan, Willow, and Posey) contain wave-dominated del-ta deposits with open-marine styles of bioturbation
Sedimentology, Statistics, and Flow Behavior for a Tide-influenced Deltaic Sandstone 131

132 White et al.

(Bhattacharya and Willis, 2001). These deposits coars-en upward and have gradual lateral facies changes.The deposits of the Frewens Allomember are generallymore heterogeneous than the Harlan, Willow, and Po-sey Allomembers.
The Frewens Allomember is interpreted to be a tide-influenced delta formed in an embayment betweenthe wave-dominated lobes of the Willow Allomemberand a tectonic uplift (Figure 1F). The tidal deposits ofthe Frewens Allomember have pronounced internalheterogeneities related to tidal deposition and postdep-ositional diagenesis. These tide-influenced delta depos-its were the focus of this reservoir analog study.
Depositional Variations in theFrewens Allomember
A 30–50-m-thick succession of tidal deposits com-prises the 5-km-wide and at least 20-km-long sand-stone bodies of the Frewens Allomember (Figure 1E, F).To the northwest, these deposits were uplifted longafter deposition and exposed at the edge of the BighornMountains (Figure 1B). To the southeast, they grade overseveral kilometers into marine mudstones.
Heterogeneities in the Frewens Allomember occurin a hierarchy of depositional strata. At the largest scale,the allomember contains two upward-coarsening sand-stone bodies, each as much as 35 m thick (Figure 1F).Both bodies have gradational bases and erosional con-tacts with overlying shales. Like the entire Frewens Al-lomember, the internal sandstone bodies are elongatealong a northwest-southeast axis (Figure 1D). Deposi-tional paleoflows are dominantly southeastward alongthis trend. The ratio of sandstone to mudstone, thegrain size of sandstones, and sandstone bed thicknessincrease upward and toward the axis of each body. The
two bodies are laterally juxtaposed; the upper is posi-tioned to the northeast of the lower (Figure 1D, F). Theupper body thins along strike and becomes heterolithic(i.e., centimeter-scale interbedded shale and sand-stone), where the lower body is thickest and most sand-stone rich.
Each body contains beds that are inclined basin-ward at as much as 5–158 (Figure 2B) and are near hori-zontal in strike view (Figure 2A). In outcrops exposingdip views, steeply dipping beds in the upper parts ofsandstone bodies tangentially decrease in dip to thebase of the sandstone body. Bed geometries changealong dip over hundreds of meters from thin and gentlyinclined downdip to progressively thicker and moresteeply inclined updip. Finer-grained beds generallyhave lower dip angles, and they are usually continuousover long distances as nearly horizontal strata alongthe base of the sandstone body (Figure 2B, C). Steeper,sandier beds downlap onto these finer-grained beds,and the sandier beds are less continuous laterally.Along strike, sandier beds are lens shaped and stack inan offlapping pattern away from axes of the sand-stone body (Figure 2A).
The gradual upward-coarsening within bodies isinterpreted to reflect conformable deposition duringshoreline regression, whereas the eroded tops reflectravinement during transgression. The general patternof sandstone-body growth recorded by inclined bedsindicates that sediment accreted basinward during pro-gradation rather than by lateral migration of a large-scale bedform. Each sandstone body is interpreted torecord progradation of a tide-influenced delta lobe intoa narrow embayment (Figure 1F). Deposits are richer insandstone upward within bodies and toward their axesbecause of more energetic currents where watersshoaled onto these deltas. Bedding in sandstone bodiesrecords the delta’s shape. Steeper-dipping delta-front
Sedimentology, Statistics, and Flow Behavior for a Tide-influenced Deltaic Sandstone 133
FIGURE 1. Study location and allomember geometry. (A) Paleogeographic map of the Cenomanian Seaway showinglocation of Wyoming in the developing foreland (Bhattacharya and Willis, 2001). (B) The Frewens Allomember is exposedin the Laramide Powder River Basin in central Wyoming. (C) Age and stratigraphic units in the Frontier Formation ofcentral Wyoming. (D) The Frewens Allomember outcrops in cliffs near Frewens Castle, overlooking the South Forkof the Powder River. The sandstone bodies are elongate along their northwest-southeast–trending axes. Measuredsections (dots on map) compiled sedimentologic data and were used to correlate bedding surfaces (Figure 2). Dashednorthwest-southeast–trending lines show where the sandy portions of the upper and lower sandstone bodies are morethan 5 m thick. (E) Isolith map of two Lower Belle Fourche allomembers shows the lobate shape of the Willow Allo-member and elongate shape of the Frewens Allomember. The map was constructed from outcrop sections on thewestern edge of the Powder River Basin (triangles) and subsurface logs located east of the outcrop belt (unfilledcircles). The two sandstone bodies in the Frewens Allomember are not differentiated in this map (simplified fromBhattacharya and Willis, 2001). Paleoflows for both sandstones are skewed south relative to the sandstone body axes.(F) A cross section perpendicular to the axis of the Frewens Allomember shows two laterally offset sandstone bodies,each about 3 km wide. The sandstones overlie the wider Willow Allomember. The Frewens Allomember is deposited in anarrow embayment between a tectonic uplift to the north and the earlier Willow Allomember to the south. This crosssection was constructed from outcrop sections projected into plane AA0 (part E). A bentonite bed above this stratigraphicinterval was used as the elevation datum (Willis et al., 1999; Bhattacharya and Willis, 2001).

beds occur where the delta prograded fastest along itsaxis, whereas gentler-dipping beds occur in slower-grow-ing areas near the delta margins. These bedding patternsrecord localized deposition on the delta front, perhapsrelated to the growth of individual tidal-channel mouthbars.
Individual beds are defined by decimeter- to meter-thick variations between sandier and more heterolithiclithofacies. Episodes of delta progradation that depos-ited the sandier lithofacies alternated with quiescentperiods, when tides reworked delta fronts and depos-
ited the more heterolithic lithofacies. Erosion locallyremoved shale drapes capping beds, especially in theupper part of sandstone bodies. Thus, shales tend to beless continuous in upper and axial parts of bodies rel-ative to basal and marginal parts.
Lithofacies in beds reflect varying wave and tidalcurrent action during individual depositional eventson the delta. Where an inclined bed is traced upward ina sandstone body, deposits generally change throughfive lithofacies (Figure 3): (1) centimeter-thick inter-beds of sandstone and shale recording transport of
134 White et al.
FIGURE 2. Bedding and lithofacies distribution in sandstone bodies. (A) The strike-parallel exposure of the lowersandstone body from cliffs along the South Fork of the Powder River (Figure 1D, aa0) shows lobate bed geometry, withbeds offlapping away from the sandstone body axis. Facies have a coarsening-upward trend. (B) A dip-parallel view fromthe north wall above Frewens Draw (Figure 1D, bb0) shows basinward-shingled bedding. Bed dip decreases downward.(C) The central wall (Frewens Castle) exposes the upper sandstone body in both dip-parallel and strike-parallel views(Figure 1D, cc0; Figure 4; Willis et al., 1999).
FIGURE 3. Lithofacies descriptions. Variations in bed thickness, sedimentary structures, and abundance of fine-scaledraping shales are used to divide the deposits into five lithofacies: (1) thinly interbedded, wave- and current-rippledsandstones and mudstones; (2) decimeter-thick cross-sets isolated in lithofacies 1; (3) meter-thick beds of heterolithiccross-sets with abundant evidence of tidal modulation of depositional flows; (4) meter-thick beds of relatively homo-geneous, cross-stratified sandstones; and (5) meter-thick cross-sets of homogeneous sandstone. Higher-numberedlithofacies are coarser grained on average and have higher permeability geometric means and coefficients of variation.The net-to-gross of facies 1 is approximately 50%, facies 2 and 3 have net-to-gross greater than 90%, and facies 4 and 5have net-to-gross near 100%. On the permeability plots, n is the number of samples, gm is the geometric mean, m is thearithmetic mean, sd is the standard deviation, sk is skewness, and cv is the coefficient of variation (Willis et al., 1999).

Sedimentology, Statistics, and Flow Behavior for a Tide-influenced Deltaic Sandstone 135

rippled sandstone sheets to the distal end of the sand-stone body; (2) decimeter-thick sandstones recordingsand transported in starved dune fields; (3) heterolithiccross-strata recording the aggradation of dunes thatwere frequently reworked by tidal currents; (4) sandy,decimeters-thick cross-strata formed by dunes that mi-grated more consistently basinward; and (5) meters-thick sandy cross-strata formed on larger-scale dunes orsteep-faced, basinward-migrating bars (Willis et al.,1999). The upward change in lithofacies reflects increas-ing sediment supply and stronger ebb-oriented cur-rents higher on the delta front.
Although beds generally coarsen and become lessheterolithic when traced upward along depositionaldip in the sandstone body, at any specific locationmost beds fine upward. High in the sandstone bodies,beds generally have erosional bases and contain severalmeters of facies 5, abruptly overlain by approximately acentimeter of facies 1 or the basal erosion surface andmud-chip lag of the overlying bed. Central parts of bedsare composed of meters of facies 4 that grade upwardinto a similarly thick interval of facies 1–3. The distaltoes of beds are composed of decimeters to meters offacies 1–3 that grade downdip (over hundreds of metersto a kilometer) into approximately 1 dm of facies 2isolated by a thicker layer of facies 1.
Composition and Diagenesis of theFrewens Allomember
The Frewens sandstones are lithic arkoses with anaverage composition of Q42F31R27 (Dutton et al., 2000);orthoclase and plagioclase feldspars are approximatelyequally abundant. Chert is the most abundant rockfragment; volcanic, metamorphic, and plutonic rockfragments also are present. The lower sandstone body isslightly richer in plagioclase and volcanic rock frag-ments than the upper sandstone body. Both sandstonescontain volcanic quartz grains. Diagenesis in most Frew-ens sandstones has been relatively minor, except forprecipitation of iron-bearing calcite cement localizedin large, tabular concretions (Dutton et al., 2000). Clay,probably mixed-layer illite/smectite, rims some detritalgrains. There are small overgrowths on some quartzgrains, but the average volume of quartz cement is only1%. Kaolinite (less than 2%) occurs in both primary andsecondary pores.
Calcite in many concretions has partly dissolved,and hematite has precipitated in the resulting pores.The hematite stains the concretions with a reddish color,so that they can be distinguished from uncementedsandstones (Figure 4A, E). Petrographic and isotopic datasuggest calcite cement in the Frewens sandstone pre-cipitated near the maximum burial depth of the sand-stones (1.5 km) from evolved meteoric water or mixed
meteoric and marine pore waters (the d18O composi-
tion of the calcite ranges from �9.3 to �12.4% Peedeebelemnite [PDB], and the d13C composition ranges from+0.1 to �14.2% PDB; Dutton et al., 2000). The d
13C com-position indicates that the source of carbon was mostlybiogenic carbonate, with a contribution of 13C-depletedcarbon derived from oxidation or decarboxylation oforganic matter. No fossil fragments or molds of dis-solved fossils and very few trace fossils occur in theFrewens sandstone. This indicates that little internalbiogenic carbonate was present. Instead, shell-bearingmarine shales above the upper Frewens sandstone areinterpreted to be the source of the biogenic carbonate(Dutton et al., 2000).
Calcite concretions occur in both the upper andlower Frewens sandstone bodies, but they are moreabundant in the upper body, particularly in the high-permeability, cross-stratified facies in the upper part ofthe sandstone body (Figure 4A, E). A greater concentra-tion of cement in the most porous and permeablesandstones was observed on a larger scale as well. Cal-cite cement is more abundant where successive bedsbecome thicker, sandier, and more steeply inclinedalong a dip cross section. Similarly, calcite cement ismore abundant in the sand-rich deposits at the axes ofthe sandstone bodies than in the finer-grained depositsalong their margins.
QUANTITATIVE DESCRIPTIONOF HETEROGENEITIES
Qualitative descriptions of depositional and diage-netic heterogeneity in the Frewens Allomember in-dicate the style of interwell-scale facies variations andbedding geometry, but they do not provide data topredict heterogeneities in analogous reservoirs. Out-crops provide data for features and scales that cannot beobserved in subsurface reservoirs. Quantitative datamust be obtained from well-exposed outcrops wherethe stratigraphic setting can be inferred, strata can bedelineated, lithologies can be mapped, and rock prop-erties can be measured. Methods to compile quantita-tive data for the geologic heterogeneities in the FrewensAllomember are described below.
The Frewens Allomember Database
Sandstones of the Frewens Allomember are bestexposed in and adjacent to Frewens Castle, along theSouth Fork of the Powder River in central Wyoming(Figure 1D). The lower sandstone body outcrops in a 3-kmstrike section that exposes its axis and northern margin.The upper sandstone body outcrops in a kilometer-long
136 White et al.

dip section along its axis and in smaller adjacent out-crops exposing its margins. Frewens Castle exposesboth dip and strike sections of the upper sandstonebody. Photomosaics of these outcrops were constructedby digitally splicing a succession of photographs takenon medium-format film from a helicopter (e.g., Figure4A). The photographs were corrected using an image-processing program and survey data to remove as muchperspective distortion as possible.
Photomosaics were used to map bedding, facies,shale drapes, and calcite concretions on separate trans-parent overlays (Figure 4). Sedimentologic logs mea-sured about every hundred meters along these outcrops(Figures 1D, 4B) initially delineated lithofacies, andpositions on these logs were tied to outcrop photo-mosaics. Permeabilities were measured along many ofthese sedimentologic logs with a probe permeameter(Goggin, 1993; Barton, 1994; Willis, 1998). The data-base records grain size, facies type, mean bed thickness,and permeability measurements made every 0.2 malong each vertical log. The transparent overlays weredigitized into different layers of a standard drafting
program to align bedding, facies, and shale maps and tospecify log tie points (Willis and White, 2000).
Additional permeability measurements recordfine-scale horizontal variability in each lithofacies type.Horizontal traverses measured permeability every 0.2 malong representative beds of each lithofacies overdistances of 30–100 m. Short vertical logs and logs fol-lowing inclined strata in these lithofacies were tied tothese long horizontal traverses. Detailed photomosaicsof smaller-scale strata, shales, and concretions in litho-facies also were produced. These finer scale studiesfocused on heterolithic cross-sets of facies 3 (Willis andWhite, 2000; White et al., 2001). Internal heterogene-ity in this lithofacies was expected to have a greater im-pact on flow predictions than in lithofacies 4 and 5,which are more homogeneous. Lithofacies 1 and 2 areunlikely to be major flow conduits because of theirlower permeability and continuity.
Cliffs, positions of logs, and sites of the more de-tailed lithofacies studies were surveyed using a theod-olite with laser range finder (a ‘‘total station’’) toposition them in a consistent coordinate system. The
Sedimentology, Statistics, and Flow Behavior for a Tide-influenced Deltaic Sandstone 137
FIGURE 4. Detailed bedding and lithofacies distribution of the dip-parallel wall of Frewens Castle (Figures 1D, 2C).Different geologic features were recorded on separate overlays for statistical and reservoir-simulation studies. (A) Photo-mosaics were prepared by digitally splicing and editing to reduce perspective distortions. The deposit coarsens upward to acapping erosion surface that is overlain by shale. (B) The database combined sedimentologic logs, bedding diagrams, andother data to produce gridded models. Areas where data were cropped or extrapolated are shown by the limits of outcropexposure and the flow model boundaries. The coordinate systems of bedding diagrams and positions of rock propertysamples on vertical logs (labeled c1–c8) were rectified using beds correlated between adjacent logs and log tie points onbedding diagrams. (C) The bedding diagram includes 697 beds. (D) The deposits are divided into five lithofacies withdifferent internal heterogeneity and permeability distribution. Facies labeled by higher numbers and shown by coarserstippling are generally coarser grained, less heterolithic, and more permeable (Figure 3). (E) Calcite concretions weremapped based on a reddish stain (part A), permeability measurements, and field observations. (F) Thin shale drapes onbed boundaries were mapped using photomosaics and field observations. Gray-shaded areas are shale-rich zones (Willisand White, 2000).

final database had a highly structured format (Whiteand Barton, 1999; Willis and White, 2000). Beddingdiagrams (Figure 4C) are specified as a set of line seg-ments defined by irregularly spaced (x,z) points honor-ing these rules: (1) bedding surfaces end only at thediagram boundaries or at another bedding surface, (2)bedding surfaces cannot cross, and (3) no bedding sur-face can circle back on itself in the horizontal direc-tion. Line segments define bed-draping shales, witheach shale precisely overlying a bed boundary in thebedding diagram. Closed polygons that entirely coverthe bedding diagram describe the distribution of litho-facies (Figure 4D). Concretions also are mapped asclosed polygons (Figure 4E). Small differences betweenthicknesses recorded by vertical logs and the beddingdiagrams are resolved by linearly interpolating log databetween tie points to the bedding diagram.
The large-scale outcrop maps of lithofacies (gen-erally hundreds of meters in horizontal extent) averageout smaller-scale variations in individual beds. Gen-eralized mapping of lithofacies is required because it isimpossible to record every facies transition where dep-ositional beds are very thin. This convention elimi-nates variation in map resolution with local changesin outcrop quality. However, thin, laterally continuous
shales often have important influences on flow behav-ior. For this reason, these shales were included in thedatabase by mapping them separately from the faciespolygons as line segments lying on bedding surfaces(Figure 4F).
Several two-dimensional ground-penetrating radar(GPR) transects over the upper Frewens sandstone bodywere collected to test the ability of this method toimage heterogeneities observed in the outcrop cliffs(e.g., Figure 5). GPR data with a nominal frequency of100 MHz delineated beds and sets of beds in the uppersandy part of the deposit but was unable to resolvebedding in the more heterolithic facies lower in thedeposit (Figure 5D). At its best, the resolution of thisGPR record (several decimeters) is coarser than manyof the features examined in outcrop studies (particu-larly bed-draping shales, Figure 5C). Even where thedeposits were quite sandy, the depth of penetration sel-dom exceeded 10 m (about one-third of the sandstone-body thickness). GPR traverses across exposed beddingplanes kilometers away from the outcrops were moredifficult to interpret than those adjacent to outcrops.Many bedding planes in areas adjacent to the outcropsare covered by loamy soils that block GPR penetra-tion into the underlying sandstone body. High-reso-
lution seismic wouldhave greater depth ofpenetration than GPR(more than 100 m at1 kHz), but resolutionis poorer (approximate-ly 0.5 m; Nissen et al.,1999). This resolutionis adequate to deline-ate sandstone-body di-mensions, but it cannotdefine the distributionof smaller-scale hetero-geneities.Althoughgeo-physical methods canhelp establish a three-dimensional frameworkto aid translation of out-crop data into three di-mensions (McMechanet al., 1997; Corbeanuet al., 2001), these meth-ods complement ratherthan replace detailedoutcrop studies to de-fine interwell-scale het-erogeneities.
This database wasthe foundation of thequantitative outcropstudy. It was used to
138 White et al.
FIGURE 5. Ground-penetrating radar (GPR) traverse measured about 100 m behind a dip-parallel outcrop of the upper Frewens sandstone body. (A–C) Heterogeneities observed inoutcrop can be compared with (D) variations in the GPR record. The radar record was collectedwith a 1000-v PulseEKKO transmitter and 100 MHz antennas. Larger-scale bedding trendsin sandier deposits located in the upper 5–8 m of the outcrop are imaged well by GPR, butbedding in heterolithic deposits observed lower in the outcrop are poorly imaged. High-anglehyperbolic reflectors dominating the lower part of the record show the location of verticaljoints passing through the outcrop.

(1) define large-scale vertical trends in each sandstonebody, (2) construct geostatistical models of permeabilityvariations across the outcrop exposures, (3) estimate thelength distribution of shale beds, (4) predict thedistribution of calcite concretions, and (5) constructreservoir simulation models. These investigations arediscussed in the following sections.
Permeability Variations inSandstone Bodies
The lithofacies based on sedimentologic character-istics also group rocks in terms of their fluid-transportproperties. The permeabilities of lithofacies commonlyvary by several orders of magnitude, whereas porositiesgenerally vary only a few percent. Higher-numberedlithofacies (i.e., facies 4 and 5) are generally coarsergrained, more permeable, and thicker bedded (Figure3). The more heterolithic lithofacies (facies 1–3) havelower geometric mean permeability and greater coeffi-cients of variation than the more homogeneous litho-facies. The permeability distributions of lower-num-bered lithofacies are positively skewed, whereas perme-ability distributions for facies 4 and 5 are approximatelysymmetric.
Vertical rock-property trends in sandstone bodieswere quantified with datum-aligned averages of all
logs measured in each of the two Frewens sandstonebodies (Figure 6). Grain size and the amount of thick-bedded, homogeneous lithofacies increase upward ineach body. In the lower body, mean permeability alsoincreases upward, whereas in the upper body, perme-ability decreases upward. Calcite concretions concen-trated near the top of the upper sandstone body (Fig-ure 4E) cause this difference in permeability trends. Toseparate permeability variations caused by depositionalprocesses from those caused by diagenetic processes,rock-property data from the lower, relatively uncemen-ted sandstone body were used to characterize variationsin individual lithofacies.
Semivariograms describing permeability variationsin each lithofacies were computed using normal-scoretransformed permeability data from vertical and hor-izontal permeability logs (Deutsch and Journel, 1998).Heterolithic cross-sets have systematic lateral perme-ability variations spanning meters to tens of meters;this reflects the lateral variation from coarser-grainedsediments deposited in the lee of actively growingdunes to finer-grained sediments deposited when dunespaused and troughs filled (facies 3 semivariogram,Figure 7A). In more homogeneous cross-stratified litho-facies, spatial correlation of permeability was not assignificant (facies 5 semivariogram, Figure 7B). Thesevariograms were used to krige or simulate permeabilityvalues across the broader outcrop lithofacies maps.
These spatial models ofpermeability will be dis-cussed in the section onflow modeling below.
Shale LengthDistributions
Upscaled verticalpermeability (Prats,1972; Begg and King,1985; Desbarats, 1987),upscaled horizontal per-meability (Narayanan,1999), and recoverybehavior (Jackson andMuggeridge, 2000; Wil-lis and White, 2000) areaffected by shale loca-tions and properties.Modelers have used dis-tributions tabulated di-rectly from outcrop data(Haldorsen and Lake,1984), indicator geosta-tistics (Desbarats, 1987),and methods to correct
Sedimentology, Statistics, and Flow Behavior for a Tide-influenced Deltaic Sandstone 139
FIGURE 6. Vertical property trends for the Frewens Allomember sandstone bodies. The trendswere computed by averaging all measured sections for each sandstone body (Figure 1D). (A)The upper sandstone (spanned by 20 measured sections) coarsens and thickens upward, andhigher-numbered facies are more abundant higher in the sandstone body. The permeabilitydecreases because of calcite concretions that are abundant near the top of the upper sand-stone body (Figure 4A, E). (B) The lower sandstone body (spanned by 16 measured sections)has consistent trends of upward-increasing grain size, permeability, bed thickness, and faciesquality (Willis et al., 1999).

observed length distributions for bias in sampling anddimensionality (Geehan and Underwood, 1993; Visserand Chessa, 2000).
More than 6000 shales longer than 1 m weremapped on 14 outcrop exposures of the Frewens Allo-member, in both dip- and strike-oriented cliffs and inaxial and marginal portions of the upper and lowersandstone bodies (White and Willis, 2000). The shalesare shorter at the sandstone-body axis than at themargins (Figure 8). The shales also are shorter higherin the sandstone body. The decreased length of shalesprobably reflects higher depositional energy and, con-sequently, less deposition and preservation of shalesin these areas. At the sandstone-body margins, manyshales extend beyond outcrop boundaries (Figure 8B).Geehan and Underwood (1993) computed a ‘‘typical’’length for the shales extending beyond the bounds ofoutcrop exposures. Visser and Chessa (2000) estimatedthe complete distribution for partially observed shalesin rectangular sample windows. However, outcrop shapesoften are irregular, and this is certainly true for most ofthe Frewens sandstone exposures (Figures 4, 8). Restrict-
ing the analysis to an inscribed rectangle decreases thedata set size, motivating the termination frequencymodel. The termination frequency t is the number ofshale terminations observed in the outcrop divided bythe total length of shale observed,
t ¼PN
i¼1nti
PN
i¼1‘i;
where N is the total number of shales observed, nti isthe number of terminations exposed for the ith shale,and ‘i is the exposed or observed length of the ith shale.The termination frequency is unbiased regardless ofoutcrop shape, and for any length distribution, ‘ ¼ 2
t isan unbiased estimate of the mean length (White andWillis, 2000).
Termination frequency models for length distribu-tions are compared with the observed distributions inFigure 9. The observed distributions have been approx-imately debiased (Geehan and Underwood, 1993).The model distributions are not regression fits but arestatistical models with parameters computed directlyfrom observations. These models are composite lengthdistributions, the sum of two termination-frequencymodels determined by Bayes’ rule (White and Willis,2000). The observed and modeled length distributionsfor the axial location (Figure 9A) are similar because theaverage shale length is much less than the outcroplength; the model mean is 16% larger than the observedmean. In contrast, the computed distribution for theoutcrop exposure at the sandstone-body margin (Fig-ure 9B) contains many more long shales than were
140 White et al.
FIGURE 7. Horizontal semivariograms of permeability.Semivariograms are for the normal-score transform ofpermeability. (A) The semivariogram for facies 3 has cor-relation to more than 5 m, reflecting active and aban-donment phases of dune deposition. (B) Facies 5 has littlecorrelation beyond 2 m, reflecting greater uniformity indepositional conditions compared to facies 3. Facies 5 hasa larger nugget effect than facies 3, which indicates lesserspatial correlation of facies 5. Semivariograms also werecomputed for the vertical direction and other facies(Willis and White, 2000).
FIGURE 8. Shale maps. (A) Near the axis of the lowersandstone body (point a in Figure 1D), shales are rela-tively short, and few extend beyond the limits of expo-sure. (B) Toward the margin (point a0 in Figure 1D) of thelower sandstone body, the shales are much longer, andmany extend beyond the outcrop limits (White andWillis, 2000).
�

observed, and the model mean is 45% greater thanthe observed mean. The large difference between ob-served and modeled distributions at the margin isexpected because the termination frequency modelcorrects for finite outcrop length, and this correction issignificant when the outcrop is not long compared tothe mean shale length (White and Willis, 2000). Theincrease in the estimated proportion of long shales bythe model compared with observations is likely to beimportant in analogous reservoirs: the longest shaleshave the greatest effects on flow.
The termination frequency and, thus, the meanlength and length distribution vary along strike (Fig-ures 8, 9) and vertically (Figure 10). The inferred meanlength at the margin is 6.5 times greater than at theaxis. No trend was observed along dip. The terminationfrequency is low near the bottom of the outcrop, re-flecting the greater deposition and preservation ofshales in deeper water at the base of the delta. The ter-
mination frequency is correlated vertically, reflectingcyclic variation in sediment supply, erosion, or locus ofdeposition. These variations in shale distribution implythat upscaled properties vary throughout the reservoir.This variability should be considered in reservoir models.
The effects of shale depend upon the number ofshales as well as their location (Begg and King, 1985).Further, the effects will be significantly different ifshales are inclined and especially if shales converge,creating poorly connected compartments (Jackson andMuggeridge, 2000). These effects were observed in theFrewens sandstone (Narayanan, 1999; Willis and White,2000; White et al., 2001).
Calcite Concretion Distribution
Nodular calcite concretions like those observed inthe Frewens sandstone can be detected in cores or geo-physical logs (particularly density and neutron logs;Walderhaug et al., 1989; Worden and Matray, 1998),and their abundance and vertical distribution can bequantified from these data. Predicting the lateral di-mensions and distribution of calcite concretions inthe subsurface is more difficult. This motivated ad-ditional calcite concretion statistical description andmodeling.
Cement distribution was quantified for a 362-m-long dip-parallel outcrop wall (Figure 4) and an ad-jacent 216-m-long strike-parallel wall of the upperFrewens sandstone. Median dimensions of the concre-tions are 0.6 m thick (T), 4.2 m long (L), and 5.3 mwide (W) (Dutton et al., 2000). The median aspect ratio(T/L) of the concretions is 0.11. Concretions comprise
Sedimentology, Statistics, and Flow Behavior for a Tide-influenced Deltaic Sandstone 141
FIGURE 10. Vertical trend in termination frequency. Thistrend was computed using the strike-parallel face adjacentto the dip face shown in Figure 4 (Figures 1D, 2C). Ter-mination frequency increases upward in the sandstonebody (shale length decreases upward). In addition to theoverall upward-increasing trend, termination frequencyoscillates with a wavelength of approximately 10 m, per-haps reflecting cyclic deposition on the prograding delta(White and Willis, 2000).
FIGURE 9. Histograms of shale length. The length scalesare different for the two histograms. (A) Near the axis, theshales are relatively short, and the model predicts few shaleslonger than those observed because few shales extendbeyond the outcrop (Figure 8A). (B) Near the margin,the model predicts longer shales compared with theobservations because many shales extend beyond theoutcrop limits (Figure 8B). Shale lengths generally in-crease toward the sandstone-body margins (White andWillis, 2000).

12% of the area of the dip-parallel outcrop wall (Figure4A, E). A horizontal profile of the outcrop (measuringthe fraction of the thickness of the upper Frewenssandstone cemented by calcite) has no distinct trend,whereas a vertical profile of the cemented fraction in-creases toward the top of the outcrop (Figure 11). Theaverage spacing of concretion centers is approximate-ly 1 per 70 m2 of outcrop face, and their position in theoutcrop can be approximated by a Poisson-distributedrandom variable (Dutton et al., 2002). The upward-increasing trend in cemented fraction (Figure 11) iscaused by the upward increase in the size of theconcretions. Concretions in the lower 10 m of the dip-parallel outcrop wall have an average area of 1.6 m2,whereas those in the upper part of the outcrop average7.7 m2.
A geostatistical simulation method was developedto distribute concretions in subsurface reservoirs (Dut-ton et al., 2002). Indicator semivariograms quantifyvertical and horizontal correlation of the concretiondistribution in the Frewens sandstone. In this calcu-lation, concretion occurrence was modeled using anindicator variable with a value of 1 if calcite cement issignificant at a given location and 0 if not significant.The horizontal semivariogram has a range of about 30m, and the vertical semivariogram has a range of about2.5 m (Figure 12). These variogram ranges correspondapproximately to the size of the largest concretions inthe Frewens sandstone (Dutton et al., 2002). The non-
stationary indicator variogram was transformed to thevariogram for the related Gaussian variable, and thetrend (Figure 11) was incorporated via a proportion curve(Matheron et al., 1987).
Sequential Gaussian simulation with truncationcreated images with statistically correct correlation andtrends and honoring conditioning data (Matheron et al.,1987; Deutsch and Journel, 1998). The conditionallysimulated images were postprocessed with simulatedannealing (Deutsch and Journel, 1998) and multipointstatistical simulation (Caers et al., 2000) to improveconformance to the observed variogram and imagetexture. The reference image from the outcrop face(Figure 13A) and a conditional geostatistical simulation(Figure 13B) share many features: the overall proportionof concretions is the same, the vertical trend in cem-ented fraction is the same, and the average angle ofinclination of the concretions is similar. Simulatedannealing ensures that the variograms are similar aswell. Suites of flow simulations demonstrated that thegeostatistical models accurately reproduce the effects ofthe concretions on fluid flow (Dutton et al., 2002).
GEOLOGIC HETEROGENEITIESAND FLOW OF FLUIDS
Heterogeneities in the Frewens sandstone (dis-cussed above) affect the flow of hydrocarbons anddisplacing fluids. To understand these effects, flowmust be simulated for a range of feasible models. Thesuite of flow models can be used for sensitivity analysis,
142 White et al.
FIGURE 11. Vertical trend in concretion fraction. Theproportion of concretions (relative to total area) wasaveraged at each elevation throughout the sandstonebody. The concretion fraction increases upward. Thisprofile was computed using data from the outcrop ex-posure shown in Figure 4. No lateral trend was observed(Dutton et al., 2002).
FIGURE 12. Horizontal and vertical semivariograms forthe concretion indicator. The observations were com-puted using a regularly gridded array of concretionindicators (1 for concretions, 0 for no apparent calcitecement; Figure 13A). The horizontal and vertical rangesare approximately 30 and 2.5 m, respectively. The ver-tical lag is plotted on the axis at the top of the figure(Dutton et al., 2002).

testing of geologic models, and upscaling. The flowmodels used in this study were much more detailedthan typical field-scale models. In this study, blockswere about a decimeter thick and 2 m long, whereasblocks in field-scale models are often meters thick anda hundred meters or more in horizontal extent. Toincorporate the effects of fine-scale features in field-scale models, the fine-scale models must be upscaled.
Commercial reservoir simulation programs (Schlum-berger Technology, 1997; Computer Modeling Group,1999) were used to examine the flow behavior of modelsbased on the Frewens Allomember. The cornerpointsimulation grid conforms to observed bedding (Willisand White, 2000). The simulation grid (Figure 14A) of thesandstone body in this study retains all the featuresshown in the high-resolution bedding diagram (Figure4) with 713 layers and 181 x-direction grid blocks. Thereare more simulation layers than geologic layers; thevertical refinement improves resolution of lithofaciesvariations and flow phenomena. The models are two-dimensional; there is no variability or flow in the thirddimension. Of the 130,000 total grid blocks, only 13,000were active. The remaining 117,000 were void gridblocks used to represent areas in layers where beds haveterminated. Void grid blocks require few computational
resources compared to active grid blocks. Permeabilityand porosity were assigned based on outcrop measure-ments with a probe permeameter (Willis and White,2000) and thin-section point counts (Dutton et al., 2000).Water was injected across the full vertical interval at theleft end of the model, and oil and water were producedfrom the full vertical interval at the right. The simulatorwell models assigned uniform potential (Dake, 1978) ateach end of the flow model. The displacement veloc-ity � ¼ qwir
A� was 0.3 m/day; qwir is the water injection rateat bottomhole conditions, A is the cross-sectional area offlow, and � is the porosity. The upper and lower edges ofthe model are impermeable. Water-wet relative perme-ability curves were used to model the dependence of oiland water permeability on water saturation (Honarpouret al., 1982). Capillary pressure is very low for such high-permeability sandstones.
Effects of geologic heterogeneities in a 25-m-thicksandstone are illustrated by adding different featurescumulatively to successive flow simulation models. Thefirst example is a displacement of oil by water through agrid with uniform single-phase permeability defined bythe geometric mean of all permeability measurements(Figure 15A). In the absence of permeability contrastsand other heterogeneity, water sinks to the bottom ofthe cross section because it is denser than oil. The sa-turation distribution reflects the interaction of gravityand viscous forces; gravity segregation decreases as flowrate increases.
Varying permeability by lithofacies (Figure 14C)draws the water upward into the high-permeabilitylithofacies near the top of the sandstone body (cf. Fig-ure 15A, B). Viscous force gradients caused by the rockheterogeneity lift the advancing water in opposition togravity segregation. Upscaled permeabilities were com-puted by the pressure-solver method with no-fluxlateral boundary conditions (Desbarats, 1987). Theupscaled permeability is higher if facies-specific perme-abilities (Figure 14C) are used instead of the global geo-metric mean (820 md for the global geometric meanversus 1700 md if permeability is assigned using facies-specific means; Willis and White, 2000). The globalgeometric mean underestimates permeability becauseof the high lateral continuity of the high-permeabilitystrata in the top of the sandstone body; this is theexpected result for horizontal permeability (Li et al.,1999).
If intrafacies permeability variations are geostatis-tically simulated using the facies-specific semivario-grams (Figure 14D), the displacement front is slightlymore dispersed compared with the models usinglithofacies-specific geometric means (cf. Figure 15B,C). Mixing caused by small-scale permeability fluctua-tions has little effect because the intrafacies perme-ability-correlation ranges are short compared to thedimensions of the lithofacies polygons (Figures 14C, D,
Sedimentology, Statistics, and Flow Behavior for a Tide-influenced Deltaic Sandstone 143
FIGURE 13. Concretion images. (A) The observed con-cretion map (Figure 4E) was discretized onto a regularrectangular grid. (B) A conditional geostatistical simu-lated image was prepared using truncated sequentialGaussian simulation, simulated annealing, and multi-point statistics. The simulated image reproduces thesmoothed trend (Figure 11), variogram (Figure 12) andinclination of concretions in the reference image. Thereference and simulated images (A and B) match at theleft and right ends where the simulation was condi-tioned (Dutton et al., 2002).

15B, C), and the displacement is stable (Dake, 1978). Theupscaled permeability is nearly the same, whether per-meability is assigned by facies or by geostatisticalsimulation (2.4% difference). Thus, for waterflood dis-placements through this tide-influenced sandstone,geometric averaging in facies is sufficiently accurate atthe horizontal scale of about 400 m.
Low-permeability inclined shales have a pro-nounced effect on flow patterns. They shunt flow alongthe clinoforms (Figures 14B, 15D). Compared to thecase without shales (Figure 15C), the shales reduce the
upscaled permeability by27% (to 1200 md) and recov-ery efficiency by 16%. Someshale effects depend on flowdirection. For basinward-directed flow, both gravityand shale inclination causethe water to flow lower inthe section. If the displace-ment direction is landward(opposite to bed dip), shaleshunting and gravity forceson the water are opposed:the shales push water up-ward, whereas gravity drawsthe water downward. Theupward coarsening of litho-facies also draws fluids outof the base of the sandstonebody (Figure 15B). In com-bination, lithofacies trend,gravity segregation, and in-clined shales lower recoveryefficiency by 4% for updip-directed flow compared withdowndip-directed flow (Willisand White, 2000). This effectvaries with flow velocity. Al-though small-scale relativepermeability is not direction-al, the reservoir architecturecauses waterflood behaviorto depend on flow direction.Therefore, upscaled relativepermeability is directional.
The concretions were in-cluded as altered regions inthe permeability grid (Figure14E). The locations of con-cretions in this grid weretaken directly from outcropobservations. Upscaled per-meability is dramatically re-duced because the concre-tions occur preferentially in
the highest-permeability part of the sandstone body(Figure 14E). In this example, a model based on dep-ositional lithofacies alone significantly overestimatesupscaled permeability (1200 md without concretionsversus 670 md with concretions; Willis and White,2000). Therefore, it is important to include diageneticfactors in detailed reservoir models. Although concre-tions make flow paths more tortuous (compare Figure15D, E), the reduction of recovery efficiency caused byconcretions (6%) is modest compared to the reductionin permeability.
144 White et al.
FIGURE 14. Grid and permeability distributions for flow models. (A) The cornerpointsimulation grid conforms to the bedding observed in the outcrop exposure (Figure 4C).(B) Bed-draping shales were mapped (Figure 4F) and included as separate features usingtransmissibility multipliers rather than block properties. Gray-shaded areas (near thebase of the outcrop) indicate shale-rich zones. (C) In some models, permeabilities wereassigned using the geometric mean permeability for each facies. (D) In other models,semivariograms (e.g., Figure 7) were used to create sequential Gaussian simulations ofthe permeability distribution. (E) Calcite concretions were added to the permeabilitymodel based on outcrop observations (Figure 4E). Concretion permeability is 0.1 md(Willis and White, 2000).

Upscaling Complex Geologic Models
Many petrophysical measurements and geologicfeatures are too fine to be included explicitly in thecoarse grids that conventionally are used for field-scaleperformance prediction. However, these data shouldbe integrated into predictive models. Consequently, theeffects of these features must be averaged or upscaled.An upscaling method has been formulated using theFrewens sandstone data set as a test case.
Upscaled properties can bederived from fine-scale propertiesby semianalytic approximations(e.g., Li et al., 1999), limitingapproximations based on flowregimes (e.g., Coats et al., 1971;Pickup, 1998) or flow simulation(Kyte and Berry, 1975). The up-scaled properties generally de-pend not only on the pattern ofgeologic heterogeneity but alsoon factors including flow veloc-ity, grid-block size, and bound-ary conditions (Durlofsky, 1997).The dependence of upscaled prop-erties on flow rate and geologicvariability causes difficultieswhen upscaling: upscaled frac-tional flow functions are differentfor every grid block and, in gen-eral, change if the flow velocity orpressure field changes. Usually,the modeling team chooses asmall subset of grid blocks thatare ostensibly representative ofthe range of reservoir heterogene-ity and simulates flow subject toboundary conditions that are con-sidered representative of the as-yet unknown large-scale flow pat-terns. The modeling team thenuses the upscaled properties (com-puted for a few grid blocks and fora few of the manifold possibleflow conditions) throughout thereservoir simulation grid.
Response surfaces provide analternative approach: the variationsof upscaled properties caused bygeologic and engineering factorsare included explicitly. Response-surface models compute upscaledproperties appropriate for the het-erogeneity of each grid block andlocal flow conditions based on asmall set of simulations chosen by
experimental design. After performing a relativelysmall set of flow simulations (in this study, about100), the properties for all coarse grid blocks in a field-scale model (often 10,000 or more blocks) are esti-mated from the response surfaces. Response-surfacemodels are simple polynomials instead of complexphenomenological models. Although they are approx-imate and empirical, response-surface models arequicker and less expensive than numerical simulation.Experimental design and response-surface methods
Sedimentology, Statistics, and Flow Behavior for a Tide-influenced Deltaic Sandstone 145
FIGURE 15. Effects of heterogeneities on flow. All models are for a two-dimensionalwater-displacing-oil simulation, with injection over the full vertical interval onthe left and production from the full vertical interval on the right. The watersaturation after one-half pore volume of water injection is shown in all figures.(A) In a homogeneous model, gravity draws water toward the bottom of thesandstone body. (B) If permeability is assigned by facies (Figure 14C), viscous forcesdraw oil upward into higher-permeability regions near the top of the model, counterto gravity forces. (C) Intrafacies variability of permeability simulated geostatistically(Figure 14D) changes the front shape only slightly (compare with B). (D) Shales(Figure 14B) shunt flow downward along the clinoforms and make sweep lessuniform. This model uses geostatistical permeability distributions (Figure 14D).(E) Calcite concretions decrease upscaled permeability and make sweep less uniform.This model includes shales (Figure 14B) and geostatistical permeability assignment(Figure 14E; Willis and White, 2000).
have been used widely in process design and optimiza-tion (Box and Draper, 1987), and reservoir engineershave used the methods for steamflood design (Chu,1990), uncertainty analysis (Damsleth et al., 1992),sensitivity analysis (Kjønsvik et al., 1992), upscaling(Narayanan, 1999), regression (Eide et al., 1994),parameter estimation (White et al., 2001), and inte-grated project management (Begg et al., 2001).
The uncertain or variable geologic and engineeringparameters (e.g., concretion permeability and injectionrate) are the factors. Combinations of factor settings orvalues (e.g., low concretion permeability and highinjection rate) are selected by experimental design. Thegoal of experimental design is to choose the smallestpossible set of factor combinations that accuratelydescribes flow behavior of the model over the rangesof all factors. There are many experimental designs,including two-level factorials (Kjønsvik et al., 1992),D-optimal designs (Damsleth et al., 1992), and Box-Behnken designs (Narayanan, 1999). The analysis pre-sented below uses a Box-Behnken design (Box andBehnken, 1960).
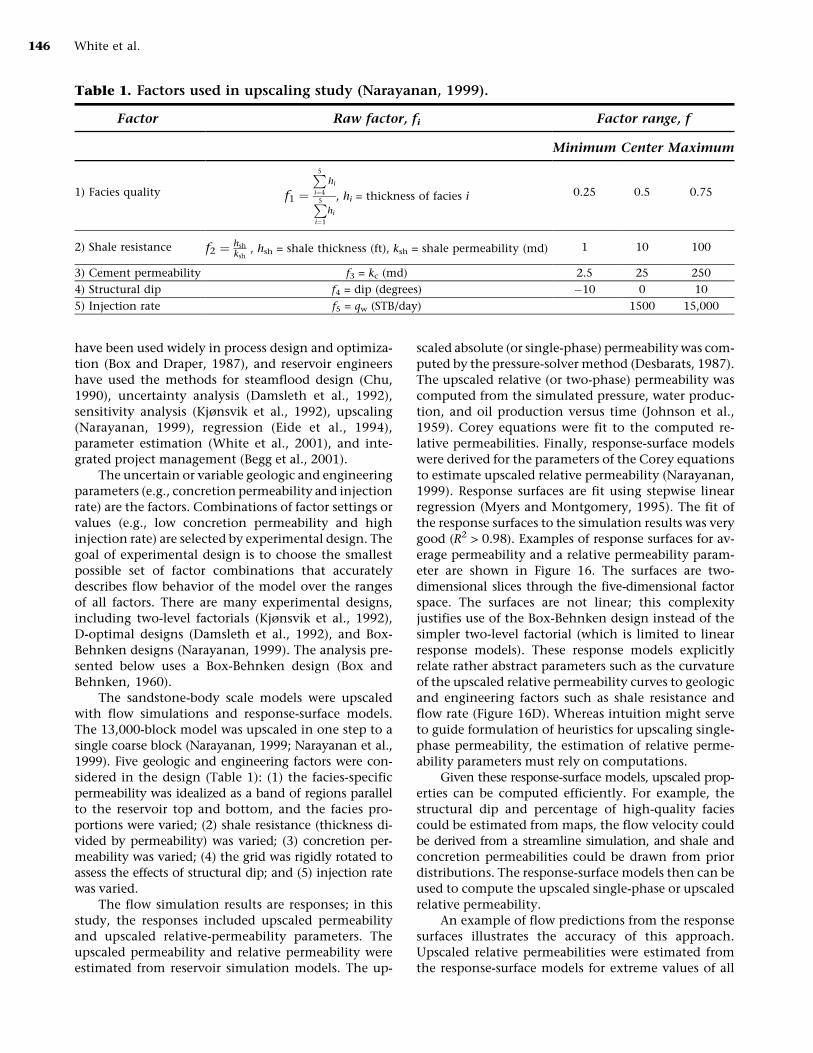
The sandstone-body scale models were upscaledwith flow simulations and response-surface models.The 13,000-block model was upscaled in one step to asingle coarse block (Narayanan, 1999; Narayanan et al.,1999). Five geologic and engineering factors were con-sidered in the design (Table 1): (1) the facies-specificpermeability was idealized as a band of regions parallelto the reservoir top and bottom, and the facies pro-portions were varied; (2) shale resistance (thickness di-vided by permeability) was varied; (3) concretion per-meability was varied; (4) the grid was rigidly rotated toassess the effects of structural dip; and (5) injection ratewas varied.
The flow simulation results are responses; in thisstudy, the responses included upscaled permeabilityand upscaled relative-permeability parameters. Theupscaled permeability and relative permeability wereestimated from reservoir simulation models. The up-
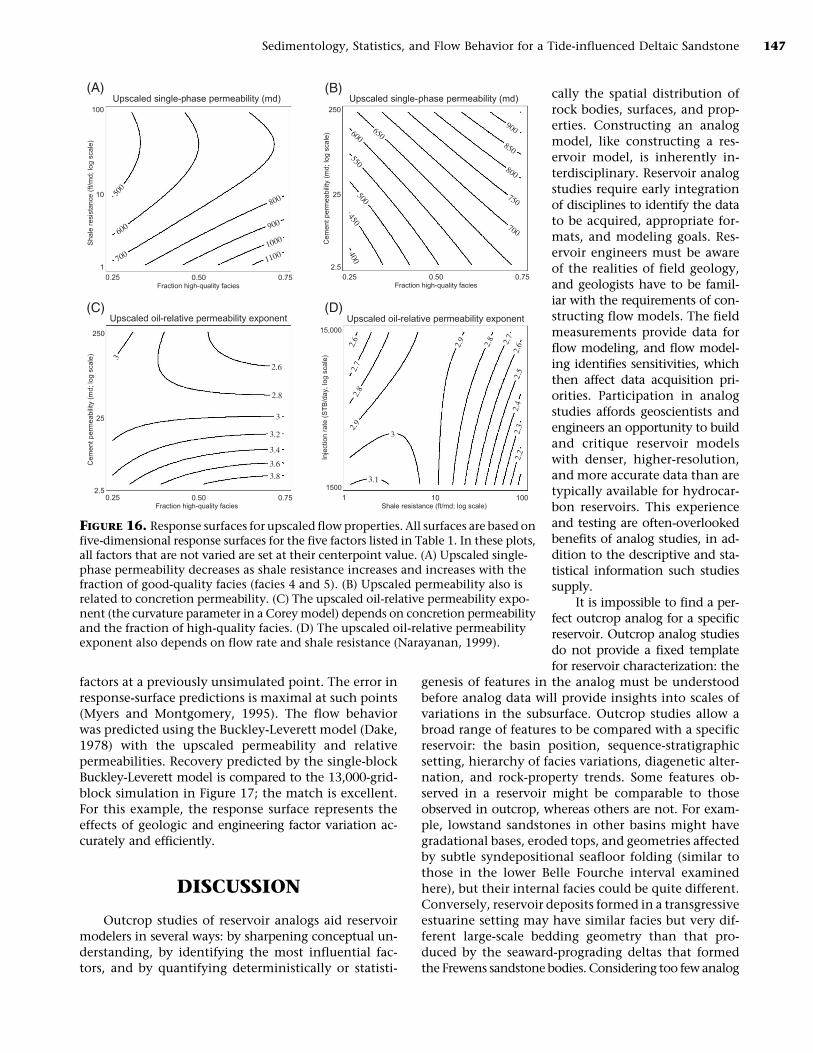
scaled absolute (or single-phase) permeability was com-puted by the pressure-solver method (Desbarats, 1987).The upscaled relative (or two-phase) permeability wascomputed from the simulated pressure, water produc-tion, and oil production versus time (Johnson et al.,1959). Corey equations were fit to the computed re-lative permeabilities. Finally, response-surface modelswere derived for the parameters of the Corey equationsto estimate upscaled relative permeability (Narayanan,1999). Response surfaces are fit using stepwise linearregression (Myers and Montgomery, 1995). The fit ofthe response surfaces to the simulation results was verygood (R2 > 0.98). Examples of response surfaces for av-erage permeability and a relative permeability param-eter are shown in Figure 16. The surfaces are two-dimensional slices through the five-dimensional factorspace. The surfaces are not linear; this complexityjustifies use of the Box-Behnken design instead of thesimpler two-level factorial (which is limited to linearresponse models). These response models explicitlyrelate rather abstract parameters such as the curvatureof the upscaled relative permeability curves to geologicand engineering factors such as shale resistance andflow rate (Figure 16D). Whereas intuition might serveto guide formulation of heuristics for upscaling single-phase permeability, the estimation of relative perme-ability parameters must rely on computations.
Given these response-surface models, upscaled prop-erties can be computed efficiently. For example, thestructural dip and percentage of high-quality faciescould be estimated from maps, the flow velocity couldbe derived from a streamline simulation, and shale andconcretion permeabilities could be drawn from priordistributions. The response-surface models then can beused to compute the upscaled single-phase or upscaledrelative permeability.
An example of flow predictions from the responsesurfaces illustrates the accuracy of this approach.Upscaled relative permeabilities were estimated fromthe response-surface models for extreme values of all
146 White et al.
Table 1. Factors used in upscaling study (Narayanan, 1999).
Factor Raw factor, fi Factor range, f
Minimum Center Maximum
1) Facies quality f1 ¼
P5
i¼4
hi
P5
i¼1
hi
, hi = thickness of facies i 0.25 0.5 0.75
2) Shale resistance f2 ¼ hsh
ksh, hsh = shale thickness (ft), ksh = shale permeability (md) 1 10 100
3) Cement permeability f3 = kc (md) 2.5 25 250
4) Structural dip f4 = dip (degrees) �10 0 10
5) Injection rate f5 = qw (STB/day) 1500 15,000
factors at a previously unsimulated point. The error inresponse-surface predictions is maximal at such points(Myers and Montgomery, 1995). The flow behaviorwas predicted using the Buckley-Leverett model (Dake,1978) with the upscaled permeability and relativepermeabilities. Recovery predicted by the single-blockBuckley-Leverett model is compared to the 13,000-grid-block simulation in Figure 17; the match is excellent.For this example, the response surface represents theeffects of geologic and engineering factor variation ac-curately and efficiently.
DISCUSSION
Outcrop studies of reservoir analogs aid reservoirmodelers in several ways: by sharpening conceptual un-derstanding, by identifying the most influential fac-tors, and by quantifying deterministically or statisti-
cally the spatial distribution ofrock bodies, surfaces, and prop-erties. Constructing an analogmodel, like constructing a res-ervoir model, is inherently in-terdisciplinary. Reservoir analogstudies require early integrationof disciplines to identify the datato be acquired, appropriate for-mats, and modeling goals. Res-ervoir engineers must be awareof the realities of field geology,and geologists have to be famil-iar with the requirements of con-structing flow models. The fieldmeasurements provide data forflow modeling, and flow model-ing identifies sensitivities, whichthen affect data acquisition pri-orities. Participation in analogstudies affords geoscientists andengineers an opportunity to buildand critique reservoir modelswith denser, higher-resolution,and more accurate data than aretypically available for hydrocar-bon reservoirs. This experienceand testing are often-overlookedbenefits of analog studies, in ad-dition to the descriptive and sta-tistical information such studiessupply.
It is impossible to find a per-fect outcrop analog for a specificreservoir. Outcrop analog studiesdo not provide a fixed templatefor reservoir characterization: the
genesis of features in the analog must be understoodbefore analog data will provide insights into scales ofvariations in the subsurface. Outcrop studies allow abroad range of features to be compared with a specificreservoir: the basin position, sequence-stratigraphicsetting, hierarchy of facies variations, diagenetic alter-nation, and rock-property trends. Some features ob-served in a reservoir might be comparable to thoseobserved in outcrop, whereas others are not. For exam-ple, lowstand sandstones in other basins might havegradational bases, eroded tops, and geometries affectedby subtle syndepositional seafloor folding (similar tothose in the lower Belle Fourche interval examinedhere), but their internal facies could be quite different.Conversely, reservoir deposits formed in a transgressiveestuarine setting may have similar facies but very dif-ferent large-scale bedding geometry than that pro-duced by the seaward-prograding deltas that formedthe Frewens sandstone bodies. Considering too few analog
Sedimentology, Statistics, and Flow Behavior for a Tide-influenced Deltaic Sandstone 147
FIGURE 16. Response surfaces for upscaled flow properties. All surfaces are based onfive-dimensional response surfaces for the five factors listed in Table 1. In these plots,all factors that are not varied are set at their centerpoint value. (A) Upscaled single-phase permeability decreases as shale resistance increases and increases with thefraction of good-quality facies (facies 4 and 5). (B) Upscaled permeability also isrelated to concretion permeability. (C) The upscaled oil-relative permeability expo-nent (the curvature parameter in a Corey model) depends on concretion permeabilityand the fraction of high-quality facies. (D) The upscaled oil-relative permeabilityexponent also depends on flow rate and shale resistance (Narayanan, 1999).

examples when characterizing a reservoir can lead tomisapplication of analog data. Access to a wide range ofanalog data can help modeling teams avoid this error.
The Frewens sandstone bodies formed in a low-stand setting where low accommodation forced differ-ent delta lobes to be offset along strike. In the studyarea, datums provided by bentonite beds and onlaprelationships between adjacent deltas observed in out-crops allowed deposits of different deltas to be dis-tinguished (Bhattacharya and Willis, 2001). In whollysubsurface deposits, these divisions would be moredifficult to resolve. Tide-dominated deposition in thissetting appears to be localized by the interaction of sea-bed topography and probably by funneling of tidalcurrents into shoreline embayments at the start of aregional transgression. Erosion of abandoned deltas bymarine currents removed delta-top facies in this setting,and sandstone-body shapes reflect a combination ofdepositional patterns and subsequent marine erosion(Bhattacharya and Willis, 2001). The major boundingdiscontinuities defining stratigraphic breaks in lithictrends in the lower Belle Fourche deposits are marineravinement surfaces. The Frewens tide-influenced sand-stone bodies, elongate perpendicular to the shoreline,are positioned adjacent to the underlying lobatesandstone (the Willow Allomember) instead of cuttingthrough the thickest part, as might be expected for avalley cut by the delta-feeding river and then filledduring transgression. Without knowledge of the inter-nal facies and bedding geometry, the elongate Frewenssandstone bodies also could be misinterpreted as a trans-gressive barrier sand deposited along the edge of anabandoned delta lobe or an offshore bar deposited inshelfal water depths.
Large-scale variations in sandstone bodies reflectupward-coarsening facies trends, lateral trends frombody axes to margins, and beds dipping parallel tothe sandstone-body elongation — all features formedduring the seaward progradation of sediments. Barriersands and offshore bars are generally less heterolithicthan the Frewens sandstone bodies and usually haveinclined beds approximately perpendicular to sandbody elongation. Broad lithologic trends may be easyto define in analogous reservoirs, whereas the lateralextent of smaller-scale variations across beds andsets of beds probably would have to be inferred fromvertical logs and analog data. It is notoriously dif-ficult to integrate variograms defined by small-scalefeatures measured in outcrop into subsurface modelsbecause of differences in scale and outcrop weath-ering; nonetheless, the pattern of decreasing correla-tion range in higher-quality facies probably is repre-sentative of tidal deltas. Horizontal and vertical trendsin shale length (Figure 10) and the vertical trendin calcite-cemented fraction (Figure 11) probably arevery common in analogous reservoirs. There are fewother studies that quantify the shape and distributionof calcite concretions in deltaic deposits, but in theabsence of reservoir-specific data or other analogs, itis reasonable to use the data presented here to infersubsurface calcite concretion distributions in deltaicsandstone without internal, depositional sources ofcalcite cement (Dutton et al., 2002). Statistical studiesof flow behavior indicate that concretion models musthonor the observed trend and mean of cemented frac-tion, but for these concretions, the inclination is notparticularly important (Dutton et al., 2002).
The simulation results must be applied to analo-gous reservoirs with care because differences in rockand fluid properties cause changes in flow behaviorof reservoirs with analogous depositional architecture.That said, it is likely that the highly significant factors,such as shale resistance, would remain highly signif-icant in reservoir-specific studies. Similarly, the in-trafacies permeability variations likely will remainrelatively insignificant at the scale of hundreds ofmeters, at least for stable displacements. It is moredifficult to speculate about factors with intermediatesignificance, such as permeability variations at thescale of meters. Overall, the results clearly illustratethe importance of thin, inclined shales, which areoften not characterized or modeled carefully. Finally,the methods for assessing sensitivities and upscalingproperties can be used in subsurface studies with onlyslight modifications; such analysis will reveal the keyparameters for rock and fluid properties expected in aparticular reservoir.
The geostatistical models and flow simulationsdiscussed in this chapter are all two-dimensional.Although intersecting cliff faces (e.g., on Frewens
148 White et al.
FIGURE 17. Comparison of simulation and responsesurface predictions. Upscaled flow properties were com-puted for a previously unsimulated point using responsesurface models (e.g., Figure 16). Production behavior waspredicted at this point using the upscaled properties andBuckley-Leverett theory. Flow was then simulated for themodel, and the predictions compare well (Narayanan,1999).

Castle) provide statistics that are approximately dip-and strike-parallel, adjacent two-dimensional expo-sures do not provide three-dimensional data. It isdifficult to infer anisotropy of shale, concretion, andbed dimensions from two-dimensional outcrop expo-sures because individual features cannot be accuratelymapped throughout the intervening volume. Becausethe flow models in this study are two-dimensional,they will tend to overestimate the effects of barriersrelative to three-dimensional models (Jackson andMuggeridge, 2000).
Like subsurface studies, outcrop analog studiesproceed iteratively. In this study, early field observa-tions revealed the prevalence of calcite concretions inthe upper sandstone body, and these features weretherefore investigated petrographically, mapped onthe outcrops, characterized petrophysically, and in-vestigated with flow simulations. Because such con-cretions cannot be mapped deterministically in thesubsurface, geostatistical descriptions for concretiondistribution were developed and verified by compar-ing flow-model predictions for the observed and geo-statistically simulated concretion distributions. Sim-ilarly, the considerable time required for outcrop per-meameter measurements motivated a sensitivity analysisof the importance of these data. That analysis revealedthat it is not important to characterize the high-permeability facies in detail, but that the more hetero-lithic cross-stratified facies (facies 3) should be char-acterized carefully (Willis and White, 2000). Quali-tative observations of trends in shale length led todevelopment of methods to characterize length dis-tributions. Because the outcrop shapes are irregular, thenew method had to be accurate for nonrectangularexposures. In characterizing these geologic features,there was repeated feedback between observations andmodeling. This flexibility and in-depth analysis is pos-sible only with a team of diverse expertise committedto a multiyear study.
CONCLUSIONS
The Frewens Allomember was deposited in a low-accommodation setting at the distal end of a forelandbasin clastic wedge. The location, geometry, anddepositional setting of these deposits were controlledby changes in relative sea level and by basin-floortopography associated with the older deltaic depositsand subtle structures. These deposits were interpretedas tide-influenced deltas that prograded into a localshoreline embayment based on a detailed correlationof surfaces and facies trends across regionally exten-sive outcrops and a three-dimensional grid of subsur-face wells. These deltas deposited beds that dip steeply
at their landward end and are thinner, more hetero-lithic, and have lower dip farther offshore.
Grain size, permeability, and porosity were char-acterized from sedimentologic logs, probe permeame-ters, and thin sections. Reservoir quality and bed dipsincrease upward and toward the sandstone-body axis,as expected for a prograding delta. Shale drapes relatedto tidal modulation of deposition are more commonand longer lower in sandstone bodies and toward theirmargins. Calcite nodules are common in facies withgreater primary permeability, particularly along the up-per part of the deposit.
Facies distribution, bedding geometry, calciteconcretions, shale drapes, structural dip, and flow rateall have significant effects on flow behavior in theFrewens sandstone. Shale effects were particularlysignificant, making flow nonhorizontal and reducingupscaled permeability. However, intrafacies perme-ability variations had little influence on upscaled prop-erties on the scale of hundreds of meters. Upscaledrelative permeability depends on flow rate and direc-tion, as well as geologic heterogeneity. The dependenceof upscaled properties on geologic and engineeringfactors can be accurately represented using response-surface models.
This study developed a process to improve modelsof hydrocarbon reservoirs using data from analogousoutcrops. The techniques include compilation of aconsistent, structured database of geometric andpetrophysical data; distribution models for shales onlypartially exposed in irregularly shaped outcrops;geostatistical models for spatial distribution of calciteconcretions; construction of flow models that con-form to bedding and honor petrophysical and geosta-tistical data; experimental design to select simulations;and response-surface methods for sensitivity analysis,upscaling, and parameter estimation. The results ofthis study include improved stratigraphic and sedi-mentologic models of tide-influenced reservoirs to aidexploration, mapping, and development; facies mod-els to aid in reservoir characterization; geostatisticaldescriptions of shale length, permeability distribution,and calcite concretion distribution; methods andresults for flow property upscaling; and a sensitivityanalysis identifying the most influential geologicfeatures. These results aid in exploring, exploiting,and modeling analogous tide-influenced reservoirs.
ACKNOWLEDGMENTS
This work was sponsored by the Clastic ReservoirGroup, Bureau of Economic Geology, the University ofTexas at Austin and by the Craft and HawkinsDepartment of Petroleum Engineering, Louisiana State
Sedimentology, Statistics, and Flow Behavior for a Tide-influenced Deltaic Sandstone 149

University. Financial support to the Clastic ReservoirsGroup was provided by Amoco Production, BritishPetroleum International, Chevron Petroleum Tech-nology, Conoco, Elf Aquitaine Production, ExxonProduction Research, Intevep, Japan National Oil,Maxus Energy, Occidental International Explorationand Production, Oryx Energy, OXY USA, Saga Petro-leum, Statoil, and Unocal Oil of California. ComputerModeling Group and Schlumberger Technology pro-vided reservoir simulation software. Sharon Gabel,Chris Sweezey, and Charl Brouquet assisted withfieldwork and interpretation. Yugong Gao and JirapaSkolnakorn helped draft bedding diagrams. Collectionof GPR data was funded by a grant from the AdvancedTechnology Program of the Texas Higher EducationalCoordinating Board, and George Tsoflias and James E.Lundy assisted in collection of these data. DjuroNovakovic performed flow simulations. We are grate-ful to Sharon Gabel for comments on an earlier draftof this paper, and to Bryan Bracken, Paul M. (Mitch)Harris, and F. Jerry Lucia for their insightful reviewsfor AAPG. We dedicate this work to the late CharlBrouquet, whose friendship, enthusiasm, and energyduring fieldwork are greatly missed.
REFERENCES CITED
Ambrose, W. A., E. R. Ferrer, S. P. Dutton, F. P. Wang, A.Padron, W. Carrasquel, J. S. Yeh, and N. Tyler, 1995,Production optimization of tide-dominated deltaicreservoirs of the lower Misoa Formation (lowerEocene), LL-652 area, Lagunillas field, Lake Maracai-bo, Venezuela: University of Texas at Austin, Bureauof Economic Geology Report of Investigations no.226, 46 p.
Barlow, J. A., and J. D. Haun, 1966, Regional stratigra-phy of Frontier Formation and relation to Salt Creekfield, Wyoming: AAPG Bulletin, v. 50, p. 2185–2196.
Barton, M. D., 1994, Outcrop characterization of archi-tecture and permeability structure in fluvial-deltaicsandstones within a sequence-stratigraphic frame-work, Cretaceous Ferron sandstone, Utah: Ph.D.dissertation, University of Texas at Austin, 260 p.
Begg, S. H., and P. R. King, 1985, Modelling the effects ofshales on reservoir performance: Calculation ofeffective permeability: 1985 Society of PetroleumEngineers Reservoir Simulation Symposium, Dallas,Texas, February 10–13; SPE Paper no. 13529, p. 331–344.
Begg, S. H., R. B. Bratvold, and J. M. Campbell, 2001,Improving investment decisions using a stochasticintegrated asset model: 2001 Society of PetroleumEngineers Annual Technical Conference and Exhibi-tion, New Orleans, September 30–October 3, SPEPaper no. 71414, CD-ROM, 16 p.
Bhattacharya, J. P., and B. J. Willis, 2001, Lowstand deltas
in the Frontier Formation, Powder River Basin,Wyoming: AAPG Bulletin, v. 85, p. 261–294.
Box, G. E. P., and D. W. Behnken, 1960, Some new threelevel designs for the study of quantitative variables:Technometrics, v. 2, no. 4, p. 455–475.
Box, G. E. P., and N. R. Draper, 1987, Empirical modelbuilding and response surfaces: New York, Wiley,669 p.
Brandsæter, I., P. S. Ringrose, C. T. Townsend, and S. Omdal,2001, Integrated modeling of geological heterogeneityand fluid displacement: Smørbukk gas-condensatefield, offshore Mid-Norway: 2001 Society of Petro-leum Engineers Reservoir Simulation Symposium,Houston, Texas, February 11–14, SPE Paper no.66391, CD-ROM, 8 p.
Caers, J. K., S. Srinivasan, and A. G. Journel, 2000, Geo-statistical quantification of geological informationfor a fluvial-type North Sea reservoir: Society of Petro-leum Engineers Reservoir Evaluation and Engineer-ing, v. 3, no. 5, p. 457–467.
Chu, C. F., 1990, Prediction of steamflood performancein heavy oil reservoirs using correlations developedby factorial design method: Society of PetroleumEngineers 60th California Regional Meeting, Ven-tura, California, SPE Paper no. 20020, p. 67–78.
Coats, K. H., J. R. Dempsey, and J. H. Henderson, 1971,The use of vertical equilibrium in two-dimensionalreservoir performance: Society of Petroleum Engi-neers Journal, v. 11, no. 1, p. 63–71.
Computer Modeling Group, 1999, IMEX Version 1999User’s Guide, Calgary, Alberta, Canada.
Corbeanu, R. M., K. Soegaard, R. B. Szerbiak., J. B. Thur-mond, G. A. McMechan, D. Wang, S. Snelgrove, C. B.Forster, and A. Menitove, 2001, Detailed internal ar-chitecture of a fluvial channel sandstone determinedfrom outcrop, cores, and 3-D ground penetratingradar: Example from the middle Cretaceous Ferronsandstone, east-central Utah: AAPG Bulletin, v. 85,p. 1583–1608.
Dake, L. P., 1978, Fundamentals of reservoir engineering:Amsterdam, Elsevier Scientific Publishing, 443 p.
Damsleth, E., A. Hage, and R. Volden, 1992, Maximuminformation at minimum cost: A North Sea fielddevelopment study with experimental design: Journalof Petroleum Technology, v. 44, no. 12, p. 1350–1360.
Desbarats, A. J., 1987, Numerical estimation of effectivepermeability in sand-shale formations: Water Re-sources Research, v. 23, no. 2, p. 273–286.
Deutsch, C. V., and A. G. Journel, 1998, GSLIB:Geostatistical software library and user’s guide: NewYork, Oxford University Press, 369 p.
Durlofsky, L. J., 1997, Use of higher moments for thedescription of upscaled, process independent relativepermeabilities: Society of Petroleum Engineers Jour-nal, v. 2, no. 4, p. 474–485.
Dutton, S. P., B. J. Willis, C. D. White, and J. P. Bhatta-charya, 2000, Outcrop characterization of reservoirquality and interwell-scale cement distribution in atide-influenced delta, Frontier Formation, Wyoming,USA: Clay Minerals, v. 35, p. 95–105.
Dutton, S. P., C. D. White, B. J. Willis, and D. Novakovic,
150 White et al.

2002, Calcite cement distribution and its effect onfluid flow in a deltaic sandstone, Frontier Formation,Wyoming: AAPG Bulletin, v. 86, p. 2007–2021.
Dyman, T. S., E. A. Merewether, C. M. Molenaar, W. A.Cobban, J. D. Obradovich, R. J. Weimer, and W. A.Bryant, 1994, Stratigraphic transects for Cretaceousrocks, Rocky Mountains and Great Plains Regions, inM. V. Caputo, J. A., Peterson, and K. J. Franczyk, eds.,Mesozoic systems of the Rocky Mountain region,USA: Rocky Mountain Section, Society for Sedimen-tary Geology (SEPM), p. 365–292.
Eide, A. L., L. Holden, E. Reiso, and S. Aanononsen, 1994,Automatic history matching by use of responsesurfaces and experimental design: 1994 EuropeanConference on the Mathematics of Oil Recovery,Roros, Norway, June 7–10, 14 p.
Geehan, G., and J. Underwood, 1993, The use of lengthdistributions in geological modeling: The geologicalmodeling of hydrocarbon reservoirs and outcropanalogues, in S. S. Flint and I. D. Bryant, eds.,International Association of Sedimentologists SpecialPublication 15: Oxford, Blackwell Scientific Publica-tions, p. 205–212.
Goggin, D. J., 1993, Probe permeametry: Is it worth theeffort?: Marine and Petroleum Geology, v. 10, p. 299–308.
Haldorsen, H. H., and L. W. Lake, 1984, A new approach toshale management in field scale simulation models:Society of Petroleum Engineers Journal, v. 24, no. 4,p. 447–457.
Hewett, T. A., and R. A. Behrens, 1993, Considerationsaffecting the scaling of displacements in heteroge-neous permeability distributions: Society of Petro-leum Engineers Formation Evaluation, v. 7, p. 258–266.
Honarpour, M., L. F. Koederitz, and H. A. Harvey, 1982,Empirical equations for estimating two-phase relativepermeability in consolidated rock: Journal of Petro-leum Technology, v. 34, p. 2905–2908.
Jackson, M. D., and A. H. Muggeridge, 2000, Effects ofdiscontinuous shales on reservoir performance dur-ing horizontal waterflooding: Society of PetroleumEngineers Journal, v. 5, no. 4, p. 446–455.
Johnson, E. F., D. P. Bossler, and V. O. Naumann, 1959,Calculation of relative permeability from displace-ment experiments: Transactions of the AmericanInsitute of Mining, Metallurgical, and PetroleumEngineers, v. 216, p. 370–372.
Kjønsvik, D., T. Jacobsen, and A. Jones, 1992, The effectsof sedimentary heterogeneities on production fromshallow marine reservoirs— what really matters?:Society of Petroleum Engineers 1992 EuropeanPetroleum Conference, London, SPE Paper no.28445, p. 27–40.
Kurniawan, A. Syaefuddin, T. Bailey, and H. H. Santoso,2001, Geological modelling: Backbone in developinga mature oil field (Jorang field case): 2001 Society ofPetroleum Engineers Asia Pacific Oil and Gas Con-ference and Exhibition, Jakarta, Indonesia, April 17–19, SPE Paper no. 68640, CD-ROM, 6 p.
Kyte, J. R., and D. W. Berry, 1975, New pseudofunctions
to control numerical dispersion: Society of PetroleumEngineers Journal, v. 15, no. 4, p. 269–285.
Lerch, C. S., K. W. Bramlett, W. H. Butler, J. N. Scales, andT. B. Stroud, 1996, Integrated 3-D reservoir-modelingat Ram-Powell field: A turbidite reservoir in the east-ern Gulf of Mexico: 1996 Society of Petroleum Engi-neers Annual Technical Conference and Exhibition,Denver, Colorado, October 6–9, SPE Paper no. 36729,p. 477–492.
Li, D., B. Beckner, and A. Kumar, 1999, A new efficientaveraging technique for scale-up of multimillion-cellgeologic models: 1999 Society of Petroleum Engi-neers Annual Technical Conference and Exhibition,Houston, Texas, October 3–6, SPE Paper no. 56554,CD-ROM, 15 p.
Matheron, G., H. Beucher, C. de Fouquet, and A. Galli,1987, Conditional simulation of the geometry offluvio-deltaic reservoirs: 62nd Annual TechnicalConference and Exhibition of the Society of Petro-leum Engineers, Dallas, Texas, September 27–30, SPEPaper no. 16753, p. 591–599.
McGooky, D. P., J. D. Haun, L. A. Hale, H. G. Goodell, D.G. McCubbin, R. J. Weimer, and G. R. Wulf, 1972,Cretaceous systems, in W. W. Mallory, ed., Geologi-cal atlas of the Rocky Mountain region, United Statesof America: Denver, Colorado, Rocky Mountain Asso-ciation of Geologists, p. 190–228.
McMechan, G. A., G. C. Gaynor, and R. B. Szerbiak, 1997,Use of ground-penetrating radar for 3-D sedimento-logical characterization of outcrop analogs: Geophys-ics, v. 62, p. 786–796.
Merewether, E. A., W. A. Cobban, and E. T. Cavanaugh,1979, Frontier Formation and equivalent rocks ineastern Wyoming: The Mountain Geologist, v. 16,p. 67–101.
Myers, R. H., and D. C. Montgomery, 1995, Responsesurface methodology: Process and product optimiza-tion using designed experiments: New York, Wiley,700 p.
Narayanan, K., 1999, Applications for response surfacesin reservoir engineering: Unpublished M.S. thesis,University of Texas at Austin, 90 p.
Narayanan, K., C. D. White, L. W. Lake, and B. J. Willis,1999, Response surface methods for upscaling het-erogeneous geologic models: 15th Society of Petro-leum Engineers Symposium on Reservoir Simulation,Houston, Texas, February 14–17, SPE Paper no.51923, p. 333–334.
Nissen, S. E., J. M. Combes, and A. G. Nekut, 1999,Acquisition, processing, and analysis of shallow,high-resolution seismic data from the outer con-tinental shelf and upper slope, offshore Louisiana:Journal of Sedimentary Research, v. 69, no. 2, p. 300–316.
Pickup, G. E., 1998, Steady state upscaling: From lamina-scale to full-field model: 1998 Society of PetroleumEngineers European Conference, The Hague, TheNetherlands, October 20–22, SPE Paper no. 50628,p. 527–535.
Prats, M., 1972, The influence of oriented arrays of thinimpermeable shale lenses or of highly conductive
Sedimentology, Statistics, and Flow Behavior for a Tide-influenced Deltaic Sandstone 151

natural fractures on apparent permeability anisotropy:Journal of Petroleum Technology, v. 24, p. 1219–1222.
Rossini, C., F. Brega, L. Piro, M. Rovollini, and G. Spotti,1994, Combined geostatistical and dynamic simula-tions for developing a reservoir management strat-egy: A case history: Journal of Petroleum Technology,v. 46, p. 979–985.
Schlumberger Technology, 1997, Eclipse 100 ReferenceManual, unpaginated.
Tillman, R. W., and E. A. Merewether, 1994, Field guidefor valley-fill, estuarine, and shelf ridge sandstones,mid-Cretaceous Frontier Formation, central Wyoming:Denver, Colorado, AAPG Annual Meeting Field TripGuidebook, 90 p.
Tillman, R. W., and E. A. Merewether, 1998, Bayhead-delta and estuary-mouth bars of early Cenomanianage in the mid-Cretaceous Frontier Formation, Wyom-ing (abs): AAPG Annual Meeting Program, 4 p.
Tye, R. S., J. P. Bhattacharya, J. A. Lorsong, S. T. Sindelar,D. G. Knock, D. D. Puls, and R. A. Levinson, 1999,Geology and stratigraphy of fluvio-deltaic deposits inthe Ivishak Formation: Applications for developmentof Prudhoe Bay field, Alaska: AAPG Bulletin, v. 83,p. 1588–1623.
Visser, C. A., and A. G. Chessa, 2000, A new method forestimating lengths of partially exposed features:Mathematical Geology, v. 32, no. 1, p. 109–126.
Walderhaug, O., P. A. Bjørkum, and H. M. NordgardBolas, 1989, Correlation of calcite-cemented layers inshallow-marine sandstones of the Fensfjord Forma-tion in the Brage field, in J. D. Collinson, ed.,
Correlation in hydrocarbon exploration: London,Graham & Trotman, p. 367–375.
White, C. D., and M. D. Barton, 1999, Translatingoutcrop data to flow models, with applications tothe Ferron sandstone: Society of Petroleum EngineersReservoir Evaluation and Engineering, v. 2, no. 4,p. 341–350.
White, C. D., and B. J. Willis, 2000, A method to estimatelength distributions from outcrop data: Mathemati-cal Geology, v. 32, no. 4, p. 389–419.
White, C. D., B. J. Willis, and K. Narayanan, 2001,Identifying and estimating significant geologic pa-rameters with experimental design: Society of Pe-troleum Engineers Journal, v. 6, no. 3, September,p. 311–324.
Willis, B. J., 1998, Permeability structure of a compoundvalley fill in the Cretaceous Fall River Formation ofSouth Dakota: AAPG Bulletin, v. 82, p. 206–227.
Willis, B. J., and C. D. White, 2000, Quantitative outcropdata for flow simulation: Journal of SedimentaryResearch, v. 70, p. 788–802.
Willis, B. J., J. P. Bhattacharya, S. L. Gabel, and C. D.White, 1999, Architecture of a tide-influenced deltain the Frontier Formation of central Wyoming:Sedimentology, v. 46, p. 667–688.
Worden, R. H., and J. M. Matray, 1998, Carbonate cementin the Triassic Chaunoy Formation of the Paris Basin:Distribution and effect on flow properties, in S.Morad, ed., Carbonate cementation in sandstones:International Association of Sedimentologists SpecialPublication 26, p. 163–177.
152 White et al.