sediment production and yield from an alluvial gully in ... · sediment production and yield from...
TRANSCRIPT

EARTH SURFACE PROCESSES AND LANDFORMSEarth Surf. Process. Landforms (2013)Copyright © 2013 John Wiley & Sons, Ltd.Published online in Wiley Online Library(wileyonlinelibrary.com) DOI: 10.1002/esp.3414
Sediment production and yield from an alluvialgully in northern Queensland, AustraliaJeffrey G. Shellberg,* Andrew P. Brooks and Calvin W. RoseAustralian Rivers Institute, Griffith University, Nathan, Queensland, Australia
Received 13 September 2012; Revised 8 February 2013; Accepted 21 February 2013
*Correspondence to: Jeffrey Shellberg, Room 1.19A, Building N13, 170 Kessels Road, Nathan, Queensland, 4111, Australia. E-mail: [email protected]
ABSTRACT: Sediment production, transport and yield were quantified over various timescales in response to rainfall and runoffwithin an alluvial gully (7 �8 ha), which erodes into dispersible sodic soils of a small floodplain catchment (33 ha) along the MitchellRiver, northern Australia. Historical air photographs and recent global positioning system (GPS) surveys and LiDAR data documentedlinear increases in gully area and volume, indicating that sediment supply has been relatively consistent over the historic period.Daily time lapse photography of scarp retreat rates and internal erosion processes also demonstrated that erosion from rainfall andrunoff consistently supplied fine washload (< 63 mm) sediment in addition to coarse lags of sand bed material. Empirical measure-ments of suspended sediment concentrations (10 000 to >100 000 mg/L) and sediment yields (89 to 363 t/ha/yr) were high for bothAustralian and world data. Total sediment yield estimated from empirical washload and theoretical bed material load was dominatedby fine washload (< 63 mm). A lack of hysteresis in suspended sediment rating curves, scarp retreat and sediment yield correlated torainfall input, and an equilibrium channel outlet slope supported the hypothesis that partially or fully transport-limited conditionspredominated along the alluvial gully outlet channel. This is in contrast to sediment supply-limited conditions on uneroded flood-plains above gully head scarps. While empirical data presented here can support future modelling efforts to predict suspended sed-iment concentration and yield under the transport limiting situations, additional field data will also be needed to better quantifysediment erosion and transport rates and processes in alluvial gullies at a variety of spatial and temporal scales. Copyright © 2013John Wiley & Sons, Ltd.
KEYWORDS: alluvial gully erosion; gully scarp retreat; suspended sediment concentration; sediment yield; sediment transport-limited
Introduction
Alluvial gullies are defined as incisional fluvial featuresentrenched into alluvium not previously incised since initialdeposition (Brooks et al., 2009). Alluvial gullies have beeninconsistently described and quantified in the literature asvalley-bottom gullies, bank gullies, ravines, fan and fingergullies, and alluvial breakaways depending on their locationin Australia (Simpson and Doutch, 1977; Payne et al., 1979;Condon, 1986; Pickup, 1991; Pringle et al., 2006; Brookset al., 2008, 2009; McCloskey, 2010), India (Haigh, 1984;Singh and Dubey, 2000; Yadav and Bhushan, 2002), the UnitedStates (Brice, 1966; Piest et al., 1975), Europe (Poesen, 1993;Vandekerckhove et al., 2000) and Africa (Oostwoud Wijdenesand Bryan, 2001). Only a handful of key studies have empiri-cally quantified sediment yields or erosion processes from allu-vial gullies over time (e.g. Piest et al., 1975; Bradford and Piest,1980; Singh and Dubey, 2000; OostwoudWijdenes and Bryan,2001; Oostwoud Wijdenes et al., 2001; Vandekerckhove et al.,2001, 2003; Thomas et al., 2004; Shellberg et al., 2013). This isin contrast to the abundant literature on sediment yield fromhillslope, colluvial, or ephemeral gullies and soft-rock badlands(e.g. Prosser and Winchester, 1996; Poesen et al., 2003, 2006,and references cited therein). Research in the Mitchell River
catchment in northern Australia suggest that alluvial gulliesare a major sediment source (Brooks et al., 2008, 2009;Rustomji et al., 2010; Shellberg, 2011; Caitcheon et al.,2012). However, the dearth of empirical data and theoreticalmodels on erosion and sediment yield from these gullies limitsthe creation of robust and detailed sediment budgets for thelarge river floodplains of northern Australia where alluvialgullies are widespread.
To further the understanding of alluvial gully erosion ratesand processes, one small alluvial gully catchment along theMitchell River in northern Australia was chosen for detailedempirical analysis. The specific objectives of this research wereto empirically quantify (1) rainfall and water runoff, (2) sedi-ment production at the gully head scarp, and (3) sedimentconcentrations, transport and yield over various timescales incomparison to regional, national and international data.
Material and Methods
Study area
The gully study catchment (WPGC2a) is located in remotenorthern Queensland, Australia (–16�28’16", 143�46’36";

J. G. SHELLBERG, A. P. BROOKS AND C. W. ROSE
Shellberg et al., 2013). WPGC2a is one alluvial gully of thou-sands delineated and described by Brooks et al. (2008, 2009)on the Mitchell River fluvial megafan, where alluvial gulliescover an area> 129 km2. WPGC2a has an internal gully areaof 7 �8 ha (c. 2008) of exposed soils below the active headscarp, and a 33 ha catchment surface area dominated by flatfloodplain topography (Figure 1). It is one tributary catchmentof a large complex of alluvial gully erosion (~100 ha) thaterodes into the high floodplain of the Mitchell River 1 to 2km from the river thalweg (Shellberg et al., 2013).Direct rainfall and local water runoff dominate erosion at
WPGC2a (Shellberg et al., 2013), with only infrequent riverbackwater and overbank flood inundation compared to othergullies further downstream on the megafan. The tropicalmonsoon climate is highly seasonal, with> 80% of its annualrainfall (mean 1015 mm; range 500 to 2100 mm) fallingbetween December to March. Rainfall intensity and erosivity(R-factors) are moderately high, as are potential and actualevapotranspiration (Shellberg et al., 2013).The alluvial silt/clay soils of WPGC2a are situated on a
gradient of coarser, lower, and more active floodplain sur-faces towards the Mitchell River (sands and gravels cappedby silt) and finer, higher, and older silt/clay floodplainsdistally, which WPGC2a is actively eroding into. ThesePleistocene red- and yellow-earths are dense in bulk (>1800 kg/m3), hard-setting during the dry season andbetween storm events, alkaline at depth, and sodic (Exchange-able Sodium Percentage (ESP)> 6) (Shellberg et al., 2013). Thesesodic soils are highly prone to soil dispersion, loss of the thin A-horizon, scalding, and reduction of surface infiltration capacity,which accelerate surface and gully erosion. The only partialprotection these soils have from the intense tropical rainfall,when unvegetated, comes from patchy surface lags of pisolithsof ferricrete and calcrete, which readily form on the surface ofexposed gullies after initial soil mottles and solutes perma-nently oxidize (Pain and Ollier 1992; Shellberg, 2011).The dominant land-use for the area is low density cattle
grazing (1 beast/20 ha on average) across savanna wood-lands and grasslands (Arnold, 1997). Cattle grazing intensity(1 beast/8 ha) and impacts (grass cover, soil disturbance,tracks/pads, weeds) are heavily concentrated along water-way frontages or riparian zones of main rivers and creeks,where animals congregate for water and feed duringthe long dry season. Many of the alluvial gullies acrossthe Mitchell megafan initiated post-European settlement dur-ing the period when cattle numbers increased significantlyfrom the 1880s onwards (Shellberg et al., 2010; Shellberg,2011). Gully initiation points were located at relatively steep
Figure 1. (a) Planform map of LiDAR hillshade showing the surface catchmview of WPGC2a catchment with gully scarp boundary highlighted. This fig
Copyright © 2013 John Wiley & Sons, Ltd.
slopes of stream banks, rounded precursor gullies on streambanks, and/or within unchannelled floodplain-hollows,which evolved into large alluvial gullies that consumed therelatively flat high floodplain (Brooks et al., 2009; Shellberg,2011; Shellberg et al., 2013).
Gully area and volume change
To measure head scarp retreat rates and gully area change overrecent times, the head scarp location around WPGC2a was sur-veyed annually between 2006 and 2010 using a differential globalpositioning system (GPS) with �50 cm accuracy (Trimble withOmnistar HP) (Brooks et al., 2009). For area change over thehistoric period, georeferenced air photographs from 1949 and1960 were used to estimate historic scarp locations (�2 m).
For more detailed recent change detection at a 100 m indexscarp section (2 � 7% of the total 3700 m scarp perimeter ofWPGC2a), a digital time-lapse camera was mounted on a stabletree and used to take oblique daily photographs of the scarp loca-tion between 2009 and 2011 (Figure 1a). Digital photographs(2848 x 2136 pixels, 6 MP) were internally rectified to each otherin a geographic information system (GIS) using ground controlpoints. The gully scarp edge was digitized daily after intervalsof observable change. Due to the oblique angle, only a relativechange in gully area at the scarp edge could be measured, whichwas calculated as the percentage of daily change divided by thetotal change over the period of record. To estimate actual plan-form change, the percentage of daily change divided by the totalchange was multiplied against the horizontal area change mea-sured during annual GPS surveys (Shellberg et al., 2013).
For gully volume estimates, Light Detection and Ranging(LiDAR) topographic data were collected in 2008 and used tocreate a 1 m2 ground-surface digital elevation model (DEM)(Figure 1a). To estimate the pre-gully erosion surface, an inversedistance weighted (IDW) algorithm (power 2; 500 point searchradius) was used to interpolate across the eroded gully fromelevation data at uneroded points along the external perimeterand internal pedestals. The 2008 gully volume was calculated bysubtracting the LiDAR DEM elevations from the interpolated pre-gully surface elevations. Earlier gully volume estimates (1949,1960, 2006, 2007) were similarly calculated, but the DEMs wereclipped to gully area extent for those periods. Thismethod assumesa vertical head scarp, complete export of sediment, and nochanges in gully floor storage, which are first order assumptionsfor a gully eroding into dispersible silts and clays. Additionalvolume changes into 2009 and 2010 were estimated from themeasured area change multiplied by a measured 1 �5 m averagescarp depth. LiDAR data were also used to plot multiple
ent area, key gully features, and a linear fenceline, and (b) oblique over-ure is available in colour online at wileyonlinelibrary.com/journal/espl
Earth Surf. Process. Landforms, (2013)

SEDIMENT PRODUCTION AND YIELD FROM AN ALLUVIAL GULLY
longitudinal profiles of the main gully thalweg and major tribu-taries to define gully form and elucidate erosion processes.
Hydrological measurements
Rainfall was measured at WPGC2a with an automated tippingbucket during water year (October to September) WY 2009 andWY 2010. A continuous water stage gauge was operated at 15minute intervals to measure water depth (D) in a semi-confinedsand-bed channel reach at the bottom of WPGC2a (Figures 1and 2). This gauge is located just upstreamof knownMitchell Riverbackwater conditions during major overbank floods, which wasmeasured by a downstream stage gauge (Shellberg et al., 2013).Measurements of discharge (Q) were made on the rising and
falling stages of several flood events using standard currentmeter techniques, which were supplemented with indirect esti-mates of Q using slope-area techniques (Rantz, 1982). Before,during, and after each wet season, elevation cross-sections,thalweg profiles, and peak flood marks were surveyed over adistance greater than 10 channel widths. A one-dimensional(1D) HEC-RAS hydraulic model (Brunner, 2010) was createdfor the reach for several slightly different boundary conditions.The model was calibrated using direct D andQ measurements.Calculated composite Manning’s n roughness values (~0 �035)were used in the model to predict discharge values at highstages. The D–Q rating curves used both measured andmodelled data. Errors in Q from current meter measurementswere taken as �10% while slope-area estimates were �20%.
Sediment load definitions and approaches toestimation
Fundamental to any sediment transport/yield research is thedefinition of how sediment load is transported, measured inthe field, and/or modelled, by source or mode of transport(Knighton, 1998; Hicks and Gomez, 2003):
• Total particle load=bedload+ suspended load (i.e. load bymode of transport)
• Total particle load= bed material load +washload (i.e. loadby source)
For this study, field efforts concentrated on the measurementof suspended load at a gauge station (load by mode of trans-port). Sand bedload was not measured in this study. Thus,direct measurements of total load by mode of transport couldnot be made. Due to the difficulty in theoretical modelling just
Figure 2. Cross-section at WPGC2s gauge station during the (a) dry seawileyonlinelibrary.com/journal/espl
Copyright © 2013 John Wiley & Sons, Ltd.
sand bedload transport along or near the bed separated frombed material in suspension, we used readily available modelsof theoretical bed material load (Ackers andWhite, 1973; Yang,1973; Yang and Wan, 1991) to estimate sediment transportsourced from the local bed material and transported bothalong the bed and in suspension. To estimate total load bysource, we empirically estimated washload from measuredsuspended load by adopting the frequently used but arbitrarywashload cutoff of<63 mm (sand versus silt/clay), to whichwe added theoretical estimates of bed material load for bedparticles> 63 mm.
Empirical measurements of suspended load
Due to the remote location, single-stage suspended-sedimentsamplers (US U59C; Colby, 1961) were installed across across-section at staggered elevations, in order to automaticallycollect suspended sediment concentration (SSC) samples fromspecific points in the cross-section during rising stage condi-tions during WY 2009 and WY 2010 (Colby, 1961; Edwardsand Glysson, 1998). Additional width- and depth-integratedsamples of mean SSC were collected manually by wading dur-ing several flood events in WY 2010 using an isokinetic USDH-48 SSC sampler and the equal-width-increment method(Edwards and Glysson, 1998). The DH-48 sampler does notsample the near bed zone< 9 cm above the bed, which consti-tutes the bedload and unsampled zones. All samples wereanalysed using the SSC analysis protocol of the total samplevolume via evaporation and dissolved salt correction(American Society for Testing and Materials, ASTM, 2002),which avoided negative sand biases associated with sub-sampling (i.e. TSS protocol; Gray et al., 2000). Error in SSClaboratory measurements were taken as �1%.
Suspended sediment loads were calculated as the product ofQ and SSC, where SSC was predicted from Q–SSC ratingcurves and Q predicted from D–Q curves for discrete timeintervals. The total standard error (dT) relative to the sedimentload (�T ) was calculated as:
dT�T
¼ffiffiffiffiffiffiffiffiffiffiffiffiffiffiffiffiffiffiffiffiffiffiffiffiffiffiffiffiffiffiffiffiffiffiffiffiffiffiffiffiffiffiffiffiffiffiffiffiffiffiffiffiffiffiffiffiffiffiffiffiffiffiffiffiffiffiffiffiffiffiffiffiffiffiffiffiffiffiffiffiffiffiffiffiffiffiffiffiffiffiffiffiffiffiffidQQ�
� �þ dSSC�SSC
� �þ dQ/D
�Q / D
� �þ dSSC/Q
�SSC / Q
� �s(1)
where dQ is the standard error in field Q measurement usingeither current meter methods (WY 2010, dQ /Q=0.10) orslope-area methods (WY 2009, dQ /Q=0.20), dSSC is the labora-tory error in SSC measurement (dSSC /SSC=0.01), dQ/D is thestandard error between the Q and D relationship, and dSSC/Q
is the standard error between the SSC and Q relationship.
son, and (b) wet season. This figure is available in colour online at
Earth Surf. Process. Landforms, (2013)

J. G. SHELLBERG, A. P. BROOKS AND C. W. ROSE
Particle size distributions
Suspended load particle sizeThe naturally high dispersibility of the sodic soils at theWPGC2a gully head scarps and internal gully surfacespromoted the disaggregation of any soil aggregates into theirparticle state. Stream turbulence and agitation along flowpaths from source to SSC collection points also promoted fulldispersion. Therefore for comparative consistency, sedimentparticle size distribution was analysed rather than aggregatesize distribution, which in the case of these dispersible soilsshould provide a good approximation to the real state oftransported sediment.SSC samples collected during flood events were wet sieved
at 63 mm to determine the percent sand (> 63 mm) and silt/clay(< 63 mm) contributions to the total SSC. This cutoff was alsoused to estimate the proportion of washload to total suspendedsediment load. More detailed particle size distributionswere measured in duplicate on SSC samples collected duringwidth- and depth-integrated sampling, using a Coulter Multisizerfollowing the methods of McTainsh et al. (1997). For particlesbetween 1 mm and 256 mm, a four tube Coulter Multisizeranalysis was conducted within a sodium hexametaphosphateliquid electrolyte, while the percent of total sediment by dryweight> 256 mmwas measured by wet sieving. Any soil aggre-gates not already dispersed by the initial erosion and transportprocesses, and subsequent SSC particle size splitting via wetsieving, would have been fully dispersed in the Coulter analy-sis liquid electrolyte.Suspended-sediment particle-size distributions were converted
to settling velocity distributions using the relationships in Cheng(1997). The mean settling velocities ( �f ) derived from thesuspended sediment distributions were correlated to respectiveQ values during SSC collection, which were used in conjunctionwith sediment rating curves to define changes in suspended sed-iment properties with increasing discharge.
Source material particle sizeBed material in the sand-bed channel near the gauge(Figure 1) consisted of disaggregated mineral sands and
Table I. Changes in WPGC2a gully parameters over time above the gauge
Year Area (m2)a Perimeter (m)
Meanretreat(m/yr)
Maximumretreat(m/yr)
Gullyvolume(m3)
1949 10,491 12,726 1,137 — — 36,1668,256
1960 21,641 24,398 1,391 0 � 80 3 � 50 68,20318,884
2006 77,071 78,548 3,100 0 � 54 2 � 51 172,15375,593
2007 78,139 79,699 3,257 0 � 34 10 � 26 174,44476,579
2008 78,506 80,263 3,694 0 � 11 4 � 88 175,78876,750
2009 79,391 81,188 3,788 0 � 24 6 � 50 177,70777,594
2010 80,106 81,810 3,671 0 � 19 0 � 96 179,13778,402
aUpper and lower area error margins are�2 m historic and�50 cm recent,bSite average bulk density of 2035 kg/m3.cRainfall data for WY 2008–2010 were measured at WPGC2a; WY 2007 da(BOM) monthly interpolated 5-km (0 � 05�) gridded rainfall data, while the1950–1960 and WY 1961–2006.
Copyright © 2013 John Wiley & Sons, Ltd.
fragments of ferricrete and calcrete. The bed materialparticle size distribution was measured from bulk samples(> 1 kg) using wet sieving at half phi intervals down to38 mm.
The major source materials for finer sediment and washloadwithin the WPGC2a gully are the sodic silt/clay soils atgully scarps. For these soils, the Coulter Multisizer andsodium hexametaphosphate were again utilized to measuredisaggregated particle size distributions to ensure comparabilitywith the suspended sediment particle size analysis above. Ninesediment samples from three vertical scarp profiles and threedepths (30, 100, 200 cm) were analysed. Duplicate analyseswere conducted to ensure consistency of results. The averageparticle size distribution of all samples was used to characterizematerial sourced from gully scarps. Additionally, one samplefrom the surface of an actively accreting gully inset-floodplainnear the gauge was used to quantify the size distribution ofrecent deposition.
Theoretical estimates of total bed material load
For a theoretical estimate of the total bed material load(bedload + suspended bed material), the empirically-calibrated equations of Yang (1973) and Ackers and White(1973) were employed. These models estimate the averagebed material load concentration, regardless of transportmechanism of bed material along the bed or in suspension.The empirical D–Q relationship and cross-section data wereused to estimate hydraulic parameters in the models at discretetime intervals, along withQ for load estimation in conjunctionwith modelled concentrations. Initially, the full particle sizedistribution of bed material was used to simply estimate amedian (d50) particle size for model use, in addition to usingequations in Cheng (1997) to estimate mean settling velocity.As a more robust alternative, transport concentrations usingthe Yang (1973) model were computed by size fraction (12classes) of a truncated particle size distribution (> 63 mm) tocalculate a weighted sum of particle size concentrations (Yangand Wan, 1991).
location
Mean gullydepth (m)
tonnes/yrscarp erosionb
w/recentGPS data
tonnes/yrscarp erosiona
Long-termphotos only
Annualrainfall (mm)c
3 �44 — — —
3 �15 5, 926 5,926 8,959 9862,893
2 �23 4, 599 — 952
2 �23 4, 664 — 1,037
2 �24 2, 736 4,561 5,096 1,2174,026
2 �24 3, 903 — 1,235
2 �24 2, 911 — 590
which also translates to error in estimated scarp erosion.
ta were estimated for WPGC2a from Australian Bureau of Meteorologyaverage BOM interpolated rainfall was calculated for the periods WY
Earth Surf. Process. Landforms, (2013)

Figure 3. Gully planform area change measured with GPS at thetime-lapse camera index site (see Figure 1a for location). The perimeterof this index scarp section (small gully lobe) represents 100 m or 2 � 7%of the total 3700 m scarp perimeter of WPGC2a.
SEDIMENT PRODUCTION AND YIELD FROM AN ALLUVIAL GULLY
Results
Gully area and volume change
The area of WPGC2a had increased 7 � 6 times its initial 1949size by 2010 (Figure 1a and Table I). The trend in area waslinear (r2 = 0 � 99), but the relationship is weakened by lack ofdata between 1960 and 2006. Recent annual GPS survey dataat WPGC2a continued to measure increased area growth(Table I and Figure 3), but area error margins often overlapped.This uncertainty was a result of survey error (�50 cm) and over-lap along slowly retreating inter-lobe zones of the scarp, com-pared to more active concave lobes (in planform) wheredistinct annual change was evident (Figure 3; Brooks et al.,2009; Shellberg et al., 2013). However over longer decadalscales, the entire gully scarp eventually retreated as one frontwhen active lobes merged, disconnected interfluves wereabandoned, and these remnant pedestals weathered in situ.Before 1949, the planform shape of WPGC2a was predomi-
nantly linear as one main headcut progressed upstream into anunchannelled floodplain hollow (Figure 1a; Shellberg, 2011).This is also a pattern seen recently at incipient gullies adjacentto WPGC2a using a location-for-time substitution (Figure 1a;Brooks et al., 2009). Subsequently as the gully matured andmore dispersible sub-soils were uncovered at depth anddistally, the gully planform expanded in width as much as
Figure 4. Longitudinal profiles of the main channel thalweg andmajor tributary channels of WPGC2a derived from 2008 LiDAR data.The main channel trendline was fit to the thalweg profile up to the baseof the head scarp, beyond which is was extrapolated toward the highfloodplain to highlight the future erosion wedge.
Copyright © 2013 John Wiley & Sons, Ltd.
length and developed into an amphitheatre form (sensu Brookset al., 2009) with a tortuous scarp front, individual globularlobes of activity, and less active inter-lobe zones (Figures 1aand 3). As gully area expanded, the perimeter of the activescarp also increased, but the ratio of area to perimeter did notstay constant (Table I). The mean retreat rate (area/perimeter)and mean depth (volume/area) subsequently decreased, asthe perimeter expanded in a tortuous fashion and the erosionwedge (and scarp height) decreased, respectively. The decreasein gully depth and scarp height with advancement ishighlighted by longitudinal profiles derived from LiDAR(Figure 4). The profiles also highlight equilibrium slope of themain channel outlet and the erosion wedge for future gullyexpansion.
Gully volume also increased at a linear rate (r2 = 0 �99),suggesting that changes in area likely dominate volumetric sed-iment yield if the volumetric calculation assumptions are true.However this trend is also weakened by lack of data between1960 and 2006. The estimated scarp erosion yield (in t/yr)decreased over time, but this trend is influenced by theoverlapping error margins around recent GPS data. When onlythe 1949, 1960, and 2008 air photographs are used over muchlonger time intervals, along with the 2008 LiDAR data forvolume calculation, the estimated long-term sediment yieldsoverlap within error margins (Table I). These yield data providean order of magnitude estimate of sediment production at thegully scarp to compare to gully gauge data.
Daily delineation of index scarp locations from obliquephotographs demonstrated that the total scarp retreat was thecumulative sum of numerous and variable daily changes overeach wet season, most often as discrete failures of overhangingsoil blocks. Both direct rainfall and infiltration-excess runoffdominated scarp retreat at WPGC2a, in contrast to groundwa-ter seepage and pore water pressure (Shellberg et al., 2013).Shallow overland flow from the low-gradient vegetated flood-plain above the scarp was relatively clear compared to theturbid water runoff following erosion on the scarp face, indicat-ing that ungullied parts of the catchment are not major sourcesof sediment. However, the relatively flat floodplain catchmentabove the scarp did contribute much infiltration-excess waterrunoff to the scarp face, enhancing erosion there in additionto direct rainfall erosion. Oblique changes in area at the indexscarp, corrected to planform area, showed strong correlationsto 24-hour rainfall total (r2 = 0 � 77) (Figure 5). Detectiblechanges in scarp location did not occur until the 24-hour rain-fall exceeded at least 10 mm. The 24-hour rainfall metric best
igure 5. Correlation between estimated daily change in planformrea (in m2) from time-lapse photographs and 24-hour rainfall total ate WPGC2 gully index scarp section (see Figure 1a for location) (mod-ied with permission from Shellberg et al., 2013).
Fathif
Earth Surf. Process. Landforms, (2013)
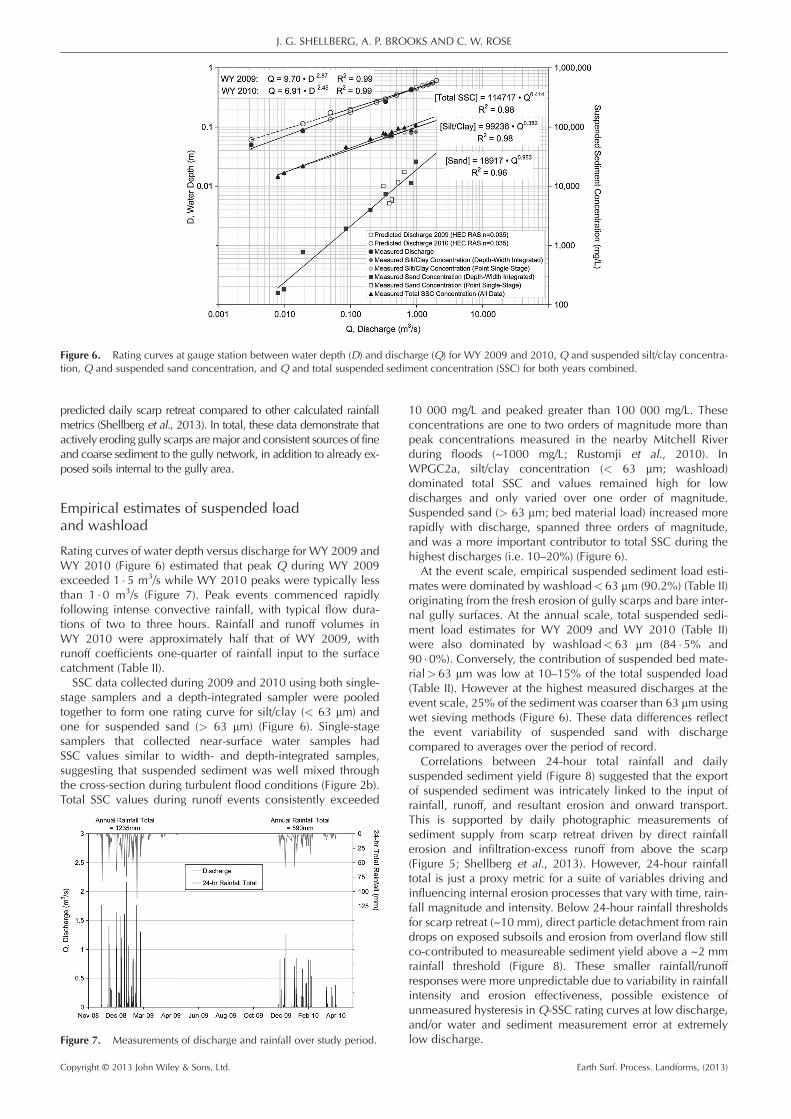
Figure 6. Rating curves at gauge station between water depth (D) and discharge (Q) for WY 2009 and 2010, Q and suspended silt/clay concentra-tion, Q and suspended sand concentration, and Q and total suspended sediment concentration (SSC) for both years combined.
J. G. SHELLBERG, A. P. BROOKS AND C. W. ROSE
predicted daily scarp retreat compared to other calculated rainfallmetrics (Shellberg et al., 2013). In total, these data demonstrate thatactively eroding gully scarps aremajor and consistent sources of fineand coarse sediment to the gully network, in addition to already ex-posed soils internal to the gully area.
Empirical estimates of suspended loadand washload
Rating curves of water depth versus discharge for WY 2009 andWY 2010 (Figure 6) estimated that peak Q during WY 2009exceeded 1 � 5 m3/s while WY 2010 peaks were typically lessthan 1 �0 m3/s (Figure 7). Peak events commenced rapidlyfollowing intense convective rainfall, with typical flow dura-tions of two to three hours. Rainfall and runoff volumes inWY 2010 were approximately half that of WY 2009, withrunoff coefficients one-quarter of rainfall input to the surfacecatchment (Table II).SSC data collected during 2009 and 2010 using both single-
stage samplers and a depth-integrated sampler were pooledtogether to form one rating curve for silt/clay (< 63 mm) andone for suspended sand (> 63 mm) (Figure 6). Single-stagesamplers that collected near-surface water samples hadSSC values similar to width- and depth-integrated samples,suggesting that suspended sediment was well mixed throughthe cross-section during turbulent flood conditions (Figure 2b).Total SSC values during runoff events consistently exceeded
Figure 7. Measurements of discharge and rainfall over study period.
Copyright © 2013 John Wiley & Sons, Ltd.
10 000 mg/L and peaked greater than 100 000 mg/L. Theseconcentrations are one to two orders of magnitude more thanpeak concentrations measured in the nearby Mitchell Riverduring floods (~1000 mg/L; Rustomji et al., 2010). InWPGC2a, silt/clay concentration (< 63 mm; washload)dominated total SSC and values remained high for lowdischarges and only varied over one order of magnitude.Suspended sand (> 63 mm; bed material load) increased morerapidly with discharge, spanned three orders of magnitude,and was a more important contributor to total SSC during thehighest discharges (i.e. 10–20%) (Figure 6).
At the event scale, empirical suspended sediment load esti-mates were dominated by washload< 63 mm (90.2%) (Table II)originating from the fresh erosion of gully scarps and bare inter-nal gully surfaces. At the annual scale, total suspended sedi-ment load estimates for WY 2009 and WY 2010 (Table II)were also dominated by washload< 63 mm (84 �5% and90 �0%). Conversely, the contribution of suspended bed mate-rial> 63 mm was low at 10–15% of the total suspended load(Table II). However at the highest measured discharges at theevent scale, 25% of the sediment was coarser than 63 mm usingwet sieving methods (Figure 6). These data differences reflectthe event variability of suspended sand with dischargecompared to averages over the period of record.
Correlations between 24-hour total rainfall and dailysuspended sediment yield (Figure 8) suggested that the exportof suspended sediment was intricately linked to the input ofrainfall, runoff, and resultant erosion and onward transport.This is supported by daily photographic measurements ofsediment supply from scarp retreat driven by direct rainfallerosion and infiltration-excess runoff from above the scarp(Figure 5; Shellberg et al., 2013). However, 24-hour rainfalltotal is just a proxy metric for a suite of variables driving andinfluencing internal erosion processes that vary with time, rain-fall magnitude and intensity. Below 24-hour rainfall thresholdsfor scarp retreat (~10 mm), direct particle detachment from raindrops on exposed subsoils and erosion from overland flow stillco-contributed to measureable sediment yield above a ~2 mmrainfall threshold (Figure 8). These smaller rainfall/runoffresponses were more unpredictable due to variability in rainfallintensity and erosion effectiveness, possible existence ofunmeasured hysteresis inQ-SSC rating curves at low discharge,and/or water and sediment measurement error at extremelylow discharge.
Earth Surf. Process. Landforms, (2013)

Figure 8. Correlation between local 24-hour total rainfall anddaily suspended sediment yield at the catchment outlet estimated fromD-Q-SSC rating curves in Figure 6 for WY 2009 and WY 2010.
Table II. Summary of rainfall-runoff measurements and sediment load estimates
January 29–30, 2010 WY 2009 WY 2010
Total rainfall (mm) 36 � 6 1235 590Total runoff (mm) (from 33 ha surface catchment area) 12 327 157Total runoff (m3) 3855 109,213 52,501Runoff coefficient 0 � 33 0 �26 0 � 27Empirical total suspended sediment loada 206.1 �53% 10, 931 �63% 2, 823 �53%
Tonnes of sand/silt/clay in suspensionEmpirical washloada 185.8 �51% 9, 241 �60% 2, 542 �51%
Tonnes of silt/clay <63 mm in suspension (percent total suspended load) (90 �2%) (84 � 5%) (90 �0%)Empirical suspended bed material loada 20.3 �72% 1, 690 �78% 281 �72%
Tonnes sand>63 mm in suspension (percent total suspended load) (9 � 8%) (15 � 5%) (10 �0%)Theoretical bed material load 4 � 7 608 65
Ackers and White, 1973, d50 = 220 mm (percent total load =washload+bed material load)
(2 � 5%) (6 � 2%) (2 �5%)
Theoretical bed material load 6 � 6 623 93Yang, 1973, d50 = 220 mm, �’s ¼ 0:032 m/s (percent total load=washload+ bed material load)
(3 � 4%) (6 � 3%) (3 �5%)
Theoretical bed material loadYang, 1973; Yang and Wan, 1991 28 � 9 2,747 403By fraction of particle size distribution>63 mm (percent total load=washload+ bed material load)
(13 �4%) (22 � 9%) (13 �7%)
aUpper and lower standard error margins calculated using Equation 1.
SEDIMENT PRODUCTION AND YIELD FROM AN ALLUVIAL GULLY
Particle size and settling velocity analysis
The particle size distribution of local bed material (wet sieving)provided support for the 63 mm value used as a cutoff betweenwashload and suspended-bed-material load (Figure 9), whereonly 12% of the bed material was less than 63 mm. Additionallyduring small runoff events when turbulent suspension of sandbed material load was not active in the outlet channel, 95%of the sediment washed off gully surfaces and transported insuspension was< 63 mm (Coulter analysis) (Figure 9).In comparing particle size results from the Coulter analysis
and basic wet sieving during SSC analysis, some incon-stancies became apparent for samples where sand was com-mon. For the SSC sample at 0 � 97 m3/s, the wet sieve split at63 mm before SSC analysis indicated that ~25% of the sedi-ment was coarser than 63 mm (Figure 6), while the Coulteranalysis suggested that ~40% was coarser than 63 mm(Figure 9). Intuitively the Coulter analysis should result inreduced coarse sediment due to additional aggregate disper-sion; however the opposite was true. Despite consistentresults from duplicate samples for Coulter analysis, theseinconsistencies in different methodologies are likely a resultof (1) sand bias during Coulter sub-sampling (several water
Copyright © 2013 John Wiley & Sons, Ltd.
drops from over 150 mL of water during intense stirring),and (2) the degree and length of washing samples duringwet sieving. Further experimentation will be needed touncover exact sources of bias by method.
The average particle size distribution of soils from the gullyhead scarp (Coulter analysis) estimated 60% of the sedimentwas finer than 63 mm (Figure 9). After erosion from scarp retreator direct rainfall impacts, the finer fraction is readily exportedas washload. The coarser fraction of sand and recentlyindurated ferricrete and calcrete pisoliths readily settle as lagdeposits in gully channels and inset-floodplains, as indicatedby their coarser particle size distributions (Figure 9). Duringpeak runoff (0 �97 m3/s), the particle size of suspended sedi-ment closely matched the average distribution of scarp soils(Figure 9). This suggests a direct and inherent connection atthe event scale between head-scarp sediment supply and sedi-ment transport in the outlet channel 600 m away, at least for thefiner fractions of sediment. Coarse lags of sand (> 63 mm) onthe gully floor and outlet channel were also suspended duringthese larger events, but the particle size distribution ofsuspended sediment was not enriched with sand particlesbeyond the degree that it already existed in the scarp parentmaterial (Figure 9). During smaller discharges, suspendedparticle sizes lowered toward the fine silt fraction, during whichmean settling velocities reduced below 0 �0005 m/s and waterremained concentrated with fine suspended clays (Figures 9and 10).
The relationship between discharge (Q) and mean settlingvelocity ( �f ) of suspended sediment followed an exponentialtrend over the measurement range up to 1 �0 m3/s (Figure 10).The rapid increase in mean settling velocity above 0 �8 m3/scan largely be attributed to the suspension of sand bed mate-rial (> 63 mm) due to increases in bed shear stress, turbulence,and eddy velocity. The slope of the sand rating curve wassteeper than the silt/clay curve (Figure 6), with the proportion ofsand concentration to the total SSC increasing with discharge.Empirical data are lacking to confirm mean settling velocity char-acteristics at high discharges (> 1 � 0m3/s); however it is clear thatthe exponential trend in Figure 10 will not continue indefinitelywith discharge. It is hypothesized that the particle size distribu-tion of the bed material (Figure 9) will represent the maximumrange of potential suspended sediment, which when converted
Earth Surf. Process. Landforms, (2013)

Figure 9. Particle size distributions measured using a CoulterMultisizer for fine soil and suspended sediment material and wet siev-ing for channel bed material.
J. G. SHELLBERG, A. P. BROOKS AND C. W. ROSE
to a mean settling velocity (�f ) has a value of 0 �032 m/s. Alterna-tively, additional soil detachment/failure from the gully scarp du-ring extreme events could dilute suspended-sand bed-materialand keep (�f ) closer to that of the average scarp soil (Figure 9),which has a value of 0 � 00876 m/s. Empirically or theoreticallypredicting mean settling velocity (�f ) changes with discharge willbe important to modelling suspended sediment transport andyield from alluvial channels under transport-limited conditions(Bagnold, 1966; Hairsine and Rose, 1992; Rose, 1993).
Bed material load
Theoretical estimates of total bed material load (bedload+suspended bed material) using methods of Yang (1973) andAckers and White (1973) and median particles sizes from bedmaterial samples underestimated the potential total bed mate-rial load for WPGC2a. This was indicated by theoretical resultsfor total bed material load that were less than measured andempirical estimates of suspended bed material (i.e. suspendedsand>63 mm) (Figure 11). These empirical suspended sandloads did not account for the unmeasured bedload and thuswere a minimum (Table II). More sensible estimates using theYang (1973) model were obtained by calculating weightedbed material concentrations using 12 size fractions of a trun-cated particle size distribution (> 63 mm) (Yang, 1973; Yangand Wan, 1991) (Figure 11; Table II). These latter resultsprovided a theoretical reference value for sand bed materialload using equations and methods often used in the literature.
Figure 10. Empirical relationship between measured discharge (Q)and the measured mean settling velocity ( �f ) of suspended sedimentduring several flood events in WPGC2a, without extrapolation of thetrend beyond 1 m3/s due to a lack of supporting empirical data.
Copyright © 2013 John Wiley & Sons, Ltd.
Combined estimates for total load
To estimate total load output of all sediment from WPGC2a,empirical washload estimates were summed with theoreticaltotal bed material load estimates. The resultant total andspecific load estimates for WPGC2a (Table III) were high com-pared to both Australian and global data on gully erosion(see Discussion section; Figure 12). The effective specific-yields from the internal gully area (378 to 1537 t/ha/yr) weremuch higher than the total catchment specific-yields (89 to363 t/ha/yr; Table III), which is expected from the extremedifferences in erosion above and below the scarp. Specificsediment yields estimated from historic air photographs werewithin the same order of magnitude as the recent GPS andgauge data (Table III). The estimated sediment input from gullyscarps (GPS surveys) was 33% of the gauged output in WY2009 and 99% of output in WY 2010 (Table III). These dataare influenced by the inherent measurement error of scarpretreat (Table I), sediment output (Table II), and unmeasuredinternal sediment sources and sinks. However, the low percent-age of scarp erosion contribution (33%) to gauge output in WY2009 highlights the importance of internal gully sedimentsources such as partially eroded internal gully slopes, remnantpedestals, and bank erosion (Figure 1).
Similarly, sediment budgeting at the catchment scale has esti-mated 154 t/ha/yr for the internal gully pixel (271 m� 271 m) atWPGC2a (Brooks et al., 2008; Rustomji et al., 2010; Shellberg,2011), derived from the ASTER-satellite estimated gully perime-ter, historic catchment median erosion rate from air photographs,1 � 5 m scarp depth, and average bulk density of 2000 kg/m3.These data are less than gauged specific-yields from the internalarea, in addition to the internal-gully specific-yields from GPS forWY 2009 and WY 2010, with the latter due to large differencesin estimated gully perimeter and annual variation in scarp retreat(Table III). However at the catchment scale, these satellite and airphotograph based estimates are reasonable first-order approxi-mations of long-term erosion rates.
Discussion
Scarp retreat and sediment supply
The utilization of both GPS surveys and historic air photo-graphs provided a useful temporal measure of changes in allu-vial gully area and sediment supply over long scarp distancesand different timescales (e.g. Brooks et al., 2009; Shellberget al., 2010; Shellberg, 2011). However, GPS error (�50 cm)and overlap between annual surveys suggest that more accu-rate (but expensive and time consuming) techniques arewarranted. Measurement of short-term changes in scarp loca-tion, internal gully morphology, and volumetric sediment sup-ply could be measured from repeat surveys by airborneLiDAR, terrestrial LiDAR, and/or large-scale photogrammetry.Gaps in historic air photo time-series and erosion rate estimatescould also be filled by other indirect dating techniques for gullyerosion, such as tree dating and optically stimulated lumines-cence dating of stratigraphic layers (Shellberg, 2011).
Gully planform changes often follow negative exponentialdecay with rapid initial change followed by a longer relaxationperiod, due to numerous intrinsic or extrinsic factors and com-plex response (e.g. Graf, 1977; Schumm, 1979; Rutherfurd etal., 1997; Nachtergaele et al., 2002; Vandekerckhove et al.,2003; Thomas et al., 2004). However, one- or two-dimensionalplanform changes should be interpreted with caution forhypotheses on sediment yield (i.e. Graf, 1977), as three-dimensional volumetric change is the key metric from a gully
Earth Surf. Process. Landforms, (2013)

Figure 11. Comparison of point measurement and empirical (rating curve) estimates of suspended silt/clay (< 63 mm) and sand (> 63 mm) loads (kg/s) for January 29, 2010, in addition to theoretical total bed material loads (Ackers and White, 1973; Yang, 1973; Yang and Wan, 1991). Final theoret-ical total bed material loads were estimated from Yang (1973) and Yang andWan (1991) by calculating concentrations and loads by size fractions for aparticle size distribution truncated at>63 mm.
SEDIMENT PRODUCTION AND YIELD FROM AN ALLUVIAL GULLY
evolution and sediment yield perspective. Additional historic airphotograph data from 18 other alluvial gully complexes acrossthe Mitchell River megafan documented both linear and expo-nential decay trends in growth rates of gully area and volume(Shellberg et al., 2010; Shellberg, 2011). Linear trends in areaand volume growth at WPGC2a, as well as roughly similar spe-cific sediment yields from the scarp and channel outlet histori-cally and recently (Table III), do suggest that the sedimentsupply has been relatively consistent and abundant over thehistoric period for this gully. For WPGC2a, this is perhaps dueto long relaxation times following initial historical disturbance,highly erodible soils, lack of bedrock or catchment controls, alarge relative relief and potential energy, and fairly consistentmonsoonal climate (Shellberg, 2011; Shellberg et al., 2013).Once moisture thresholds were exceeded, 24-hour total rain-
fall was an important predictor of both scarp retreat and
Table III. Summary of total load estimates, specific sediment yields, and sed(7 �8 ha in 2008) and catchment surface area (33 ha).
Gauge total load (tonnes/yr) 1Empirical washload+ theoretical bed material load (by size fraction,Yang, 1973; Yang and Wan, 1991)
Gauge specific sediment yield (t/ha/yr)Internal gully area =7 � 8 ha
Gauge specific sediment yield (t/ha/yr)Catchment surface area =33 ha
GPS scarp retreat (tonnes/yr)(percent of input compared to output)
GPS scarp retreat, specific sediment yield (t/ha/yr)Internal gully area =7 �8 ha
GPS scarp retreat, specific sediment yield (t/ha/yr)Catchment surface area = 33 ha
Air photo scarp retreat, specific sediment yield (t/ha/yr)Internal gully area =7 �8 ha
Air photo scarp retreat, specific sediment yield (t/ha/yr)Catchment surface area = 33 ha
Long-term scarp specific sediment yield (t/ha/yr)Brooks et al. (2008) for WPGC2a gully pixel (271 m�271 m) �ASTERscarp perimeter�historic catchment median erosion rate(0 � 34 m/yr)� scarp depth (2 �0 m)�bulk density (2000 kg/m3)
Copyright © 2013 John Wiley & Sons, Ltd.
sediment yield at the outlet. Thus, rainfall could be used asan independent variable to model sediment yield from alluvialgullies using distributed catchment models, as long as someinherent geomorphic, edaphic, and hydraulic conditions areknown. However, 24-hour total rainfall is just a proxy metricfor a whole suite of measured and unmeasured variablesinfluencing erosion. The input of kinetic/momentum energyfrom rainfall/runoff can detach particles during rain dropimpact, slake/disperse soil aggregates, erode sediment duringoverland flow, and dismantle failed soil blocks for onwardfluvial transport, which influence scarp retreat and sedimentyield. The remaining variability between rainfall and scarpretreat is likely explained by seasonal variations in vegetativecover and water runoff, and intrinsic thresholds of geotechnicalstability such as near-surface pore-water pressure, tension-crackdevelopment, and antecedent conditions (Shellberg et al., 2013).
iment production from scarp retreat calculated for the internal gully area
WY 2009 WY 2010 WY 1950– 1960 WY 1961– 2006
1, 988�60% 2, 945�51% — —
1, 537�60% 378�51% — —
363�60% 89�51% — —
3,903 2,911 — —(33%) (99%)500 373 — —
118 88 — —
— — 760 585
— — 180 138
— — 154 154
Earth Surf. Process. Landforms, (2013)

Figure 12. Comparison of specific sediment yields (t/ha/yr) by catchment area (ha) for hillslope erosion plots, small gully catchments, small streamcatchments, and larger rivers from the following data sources. World Riversa (FAO, 2010), Australiab (plot, gully, stream, river database of Wasson,1994; review by Prosser and Winchester, 1996; Armstrong and Mackenzie, 2002), Asiac (diCenzo and Luk, 1997; Singh and Dubey, 2000; Huanget al., 2003; Yu, 2005; Chen and Cai, 2006; Fang et al., 2008; Rustomji et al., 2008), USAd (Piest et al., 1975; Welch, 1986; Thomas et al., 2004;Nearing et al., 2007; Kuhnle et al., 2008), Africae (Ondieki, 1995; Oostwoud Wijdenes and Bryan, 2001; Walling et al., 2001), Mediterraneanf
(Seginer, 1966; Bufalo and Nahon, 1992; Oostwoud Wijdenes et al., 2001; Mathys et al., 2003; Martinez-Casasnovas, 2003; Martinez-Casasnovaset al., 2003; Avni, 2005; Nyssen et al., 2008), WPGC2a Gauge Yieldg (this study using 33 ha catchment area, Table III), WPGC2a Scarp Productionh
(this study, production estimates using 33 ha catchment area, Table I), Mitchell River SS Yieldi (fine suspended washload only from surface TSS data,Queensland Department of Natural Resources database), Mitchell Gully Productionj [pixel (271 m�271 m) based sediment production from Brookset al. (2008, 2009) across the Mitchell megafan, using 2000 kg/m3 for catchment average bulk density]. This figure is available in colour online atwileyonlinelibrary.com/journal/espl
J. G. SHELLBERG, A. P. BROOKS AND C. W. ROSE
Internal erosion/deposition processes
Internal erosion and deposition processes within the gullycomplex below the scarp face highlight the partially or fullytransport-limited nature of the sediment yield. Field and LiDARobservations indicate that scarp retreat is often incompletespatially, with many partially eroded features remaining withinthe gully complex such as remnant pedestals and unerodedslopes and ridgelines (Figure 1). Thus scarp retreat is a minimumestimate of sediment supply to a gully outlet.Quantitative data sug-gest that erosion at the head scarp does not always dominate theoutput of sediment during wet years (WY 2009), but can duringdry years at least in net terms (WY 2010). Internal gully sedimentsources and sediment storage on gully floors can vary in spaceand time according to local geomorphic forms, different erosionprocesses, and variability in rainfall and discharge magnitude.Depositional features such as gully inset-floodplains develop
from coarser lags of sand and ferricrete pisoliths, which can re-erode during bank erosion along the outlet channel. The longitudi-nal profile of the WPGC2a outlet channel below the active scarpzone is generally linear and appears to be at a quasi-equilibriumslope (Figure 4; Shellberg, 2011). However, ongoing changes in sin-uosity through bank erosion and avulsion across inset-floodplainssuggest that the channel can adjust toward an equilibrium slopein response to the episodic supply and transport of water and coarsesediment. Therefore, internal erosional and depositional featuresand processes within the gully complex are important in supplyingand metering coarse sediment, which warrant further investigation.
Supply-limited versus transport-limited conditions
Overall at the scale of the internal gully area, the highlyerodible nature of these alluvial soils once devegetated evi-dently produced an abundant supply of suspended sediment
Copyright © 2013 John Wiley & Sons, Ltd.
to the catchment outlet relative to the sediment transportcapacity. The empirical data analyzed here document (1) littlehysteresis in SSC-Q rating curves, (2) scarp retreat andsuspended sediment yield correlated to rainfall input, and (3)an equilibrium channel outlet profile. From these data, it ishypothesized that partially or fully transport-limited conditions(sensu Bravo-Espinosa et al., 2003) predominate along thealluvial gully outlet channel for most grain sizes. Transport-limited conditions likely dominate for lag deposits of coarsesand and ferricrete pisoliths along the gully bed, while thesupply and yield of fine suspended sediment is likely closerto equilibrium conditions at the event and annual scale. Incontrast above gully head scarps on uneroded floodplains,erosion and sediment supply appeared to be supply-limited(sensu Bravo-Espinosa et al., 2003) due to reduced slope andpotential energy, increased soil cohesion and protection bygrass cover, and soil surface sealing during intense rainfall.This resulted in the transfer of excess energy and overland flowmomentum to the scarp face. Observations of relatively clearrunoff above scarps compared to turbid water below suggestthat gully scarps are compressed transition zones betweensediment supply- and transport-limited conditions.
Along gully channel outlets where conditions are partially orfully transport-limited as supported by little hysteresis in sedi-ment rating curves, sediment transport could be modeled by the-oretical equations such as those of Bagnold (1966), Hairsine andRose (1992), and Rose (1993), which predict the maximumequilibrium SSC at the transport limit during specific dischargeconditions. This will be the topic of forthcoming research efforts.
Sediment yield
The modest water and sediment gauging effort at WPGC2awas essential to empirically measure the magnitude of
Earth Surf. Process. Landforms, (2013)

SEDIMENT PRODUCTION AND YIELD FROM AN ALLUVIAL GULLY
sediment yield from a rapidly eroding alluvial gully. Thesedata will also be useful for calibrating and updating theoreti-cal suspended sediment transport models for transport-limited conditions (e.g. Hairsine and Rose, 1992; Rose,1993). Sediment rating curve data and particle size analysisgenerally supported a singleQ–SSC relationship, which providedsupport for the concept of a transport limited system where sedi-ment transport consistently responded to supplied transportcapacity. However, additional SSC data on the rising and fallinglimbs of dozens of discharge events across seasons are neededto strengthen these observations, confirm the complete lack ofhysteresis, and better define sediment supply- and transport-limiting conditions at the gully outlet.The event variability in Q–SSC relationships in gullies and
rivers channels can vary from common clockwise hysteresisloops (depletion of supply during event), to less common anti-clockwise (delayed supply from distance sources) or singlecurve (unlimited local supply) relationships (Olive andRieger, 1985; Williams, 1989; Nistor and Church, 2005). Forgullies globally, Q–SSC relationships are complicated bythresholds for specific particle size detachment or motion, sea-sonal influences (e.g. wetting–drying; freeze–thaw; vegetationcover), episodic or chronic land-use disturbance, antecedentflood or moisture conditions, and changes in sediment sourcesand erosion processes (i.e. gully head versus gully side-wallversus hillslope erosion) (Piest et al., 1975; Olive and Rieger,1985; de Boer and Campbell, 1989; Oostwoud Wijdenes andBryan, 2001; Armstrong and Mackenzie, 2002; Nistor andChurch, 2005; Fang et al., 2008). Furthermore, the locationand scale of measurement can influence determinations ofsediment availability, with small hillslope catchments oftenbeing supply limited compared to larger catchments down-stream that integrate sediment from the multiple sourcesnested upstream (Smith and Dragovich, 2009; Bartley et al.,2006, 2010). Thus for more detailed water and sedimentyield measurements from alluvial gullies, a more robusthierarchically-nested gauging system is warranted thatintegrates improved infrastructure such as compound weirs,continuous stage and turbidity (or other surrogate) measure-ments (Gray and Gartner, 2009), threshold-triggered pump-samplers for automatic event sampling, additional manualwidth- and depth-integrated SSC and Q measurements, andthe calculation of suspended sediment load estimates at theevent scale (e.g. Lewis, 1996).Measured peak SSC values >100 g/L at WPGC2a were
higher than commonly reported for Australia (e.g. Olive andRieger, 1985; Dunkerley and Brown, 1999; Armstrong andMackenzie, 2002; Bourke, 2002; Bartley et al., 2006, 2010),but these peak values are still well below non-Newtonianhyperconcentrated flow conditions (> 400 g/L or 40% byweight) (Beverage and Culbertson, 1964). For example,measured concentration in gullied loess terrain in China canaverage 600 g/L and peak well above 1000 g/L (e.g. Huang etal., 2003; Fang et al., 2008). However, specific sediment yieldsfrom the WPGC2a drainage area (88–350 t/ha/yr) arecomparable to other high erosion areas of the world(Figure 12). The large annual rainfall and runoff volumesat WPGC2a in the monsoonal tropics, combined with mod-estly high SSC values, produced specific sediment yieldscomparable to average values in loess terrain of China,where unit rainfall and runoff volumes are at least half ofthose in northern Queensland (Huang et al., 2003; Chenand Cai, 2006; Fang et al., 2008). The specific sedimentyields from alluvial gullies in India are more directly compa-rable to WPGC2a, perhaps due to similar monsoonalclimates and alluvial gully geomorphology (Figure 12; Singhand Dubey, 2000).
Copyright © 2013 John Wiley & Sons, Ltd.
Conclusions
The increase in planform area of an alluvial gully in the lowerMitchell River of northern Australia has been monitored overfive years, and the hydrology and sediment yield over two wa-ter years, showing that specific sediment production and yieldare comparable to erosional hotspots on the world scale. Thesetypes of alluvial gullies are major concentrated sources ofsediment to the aquatic environments, and can dominatecatchment sediment budgets (Brooks et al., 2008, 2009;Rustomji et al., 2010; Shellberg, 2011; Caitcheon et al., 2012).
The relationship between total SSC and discharge displayedlittle hysteresis, which was also the case for silt/clay and sandcomponents. These data along with measurements of highlydispersible soils, scarp retreat and sediment yield correlatedto rainfall input, and a graded channel outlet profile, suggestthat transport-limited conditions predominate along the alluvialgully outlet channel for most grain sizes. This transport limitingsituation holds promise for future modeling efforts using steadystate theory to predict SSC at the transport limit during specificdischarge conditions (Bagnold, 1966; Hairsine and Rose, 1992;Rose, 1993).
This study identified the need for expanded empirical inves-tigations across a range of alluvial gully types and sizes in thefollowing areas: (1) improved measurements of event sedimentsupply from scarp retreat and internal gully surfaces, (2) morerobust measurements of event water and sediment yield at gullyoutlets, (3) particle size differentiation at gully scarps for load-by-source analysis, (4) vertical profiles of water velocity,sediment concentration and size distribution over a range ofdischarges, and (5) investigation of the more complex erosionand transport situation where river backwater and overbankflooding occur (Shellberg et al., 2013). These data will helpimprove our understanding of sediment erosion, transportmechanisms and sediment yield from complex gully systems,as well as aid the empirical determination of key model param-eters such as average settling velocity and the fraction of streampower effective at sediment transport (Bagnold, 1966; Rose,1993; Thomas et al., 2004).
Acknowledgments—This research is dedicated to the memory, culturalperseverance, and field assistance of Vivian Lane, aboriginal GuguMini elder of the central Mitchell River catchment. Access to WrothamPark field sites was provided by Ian Rush and Jock Warriner, who theauthors thank for their time talking about the challenges of managingthe Mitchell landscape for both private and public benefit. Fieldassistance was provided by John Spencer, Vivian Lane, and Luke andLeon Kingsley, while laboratory assistance was provided by DanielBorombovits and Kyle Barton. Jorg Hacker (Airborne ResearchAustralia) collected and processed the raw LiDAR data. Bob Wassonprovided the Australian database on specific sediment yields. Fundingwas provided by the Australian Government Caring for Our Countryprogram managed by the Northern Gulf Resource Management Group,the Australian Tropical Rivers and Coastal Knowledge (TRaCK) program,and Griffith University.
ReferencesAckers P, White WR. 1973. Sediment transport: new approach andanalysis. Journal of Hydraulics Division, American Society of CivilEngineers 99: 2041–2060.
American Society for Testing and Materials (ASTM). 2002. StandardTest Methods for Determining Sediment Concentrations in WaterSamples (Reapproved 2002), D3977-97-Annual Book of ASTMStandards, v. 11.01. ASTM International: West Conshohocken, PA;395–400.
Armstrong JL, Mackenzie DH. 2002. Sediment yields and turbidityrecords from small upland subcatchments in the Warragamba Dam
Earth Surf. Process. Landforms, (2013)

J. G. SHELLBERG, A. P. BROOKS AND C. W. ROSE
Catchment, Southern New South Wales. Australian Journal of SoilResearch 40: 557–579. DOI. 10.1071/SR01065
Arnold G. 1997. Grazier experience with Stylosanthes technology. III.Wrotham Park, 1963–1988. Tropical Grasslands 31: 522–526.
Avni Y. 2005. Gully incision as a key factor in desertification in an aridenvironment, the Negev highlands, Israel. Catena 63: 185–220. DOI.10.1016/j.catena.2005.06.004
Bagnold RA. 1966. An Approach to the Sediment Transport Problemfrom General Physics, US Geological Survey Professional Paper422-I. US Geological Survey: Reston, VA.
Bartley R, Roth CH, Ludwig J, McJannet D, Liedloff A, Corfield J,Hawdon A, Abbott B. 2006. Runoff and erosion from Australia’stropical semi-arid rangelands: influence of ground cover for differingspace and time scales. Hydrological Processes 20: 3317–3333. DOI.10.1002/hyp.6334
Bartley R, Wilkinson SN, Hawdon AA, Abbott BN, Post DA. 2010. Im-pacts of improved grazing land management on sediment yields part2: catchment response. Journal of Hydrology 389: 249–259. DOI.10.1016/j.jhydrol.2010.06.014
Beverage JP, Culbertson JK. 1964. Hyperconcentrations of suspendedsediment. Journal of the Hydraulic Division, Proceedings of theAmerican Society of Civil Engineers 90: 117–128.
de Boer DH, Campbell IA. 1989. Spatial scale dependence of sedi-ment dynamics in a semi-arid badland drainage basin. Catena16: 277–290. DOI. 10.1016/0341-8162(89)90014-3
Bourke MC. 2002. Suspended sediment concentrations and thegeomorphic effect of sub-bankfull flow in a central Australian stream.In The Structure, Function and Management Implications of FluvialSedimentary Systems, Dyer FJ, Thoms MC, Olley JM (eds).Proceedings, Alice Springs, 2002, IAHS Publication 276. IAHS Press:Wallingford; 315–324.
Bradford JM, Piest RF. 1980. Erosional development of valley bot-tom gullies in the upper midwestern United States. In Thresholdsin Geomorphology, Coates DR, Vitek JD (eds). Allen and Unwin:London; 75–101.
Bravo-Espinosa M, Osterkamp WR, Lopes VL. 2003. Bedload transportin alluvial channels. Journal of Hydraulic Engineering 129: 783–795.DOI. 10.1061/(ASCE)0733-9429(2003)129:10(783)
Brice JC. 1966. Erosion and Deposition in the Loess-Mantled GreatPlains, Medicine Creek Drainage Basin, Nebraska, US Geologi-cal Survey Professional Paper 352-H. US Geological Survey:Reston, VA.
Brooks AP, Spencer J, Shellberg JG, Knight J, Lymburner L. 2008. Usingremote sensing to quantify sediment budget components in a largetropical river – Mitchell River, Gulf of Carpentaria. In SedimentDynamics in Changing Environments, (Proceedings, Christchurch,2008), Schmidt J, Cochrane T, Phillips C, Elliot S, Davies T, BasherL (eds). IAHS Publication 325. IAHS Press: Wallingford; 225–236.
Brooks AP, Shellberg JG, Spencer J, Knight J. 2009. Alluvial gullyerosion: an example from the Mitchell fluvial megafan, Queensland,Australia. Earth Surface Processes and Landforms 34: 1951–1969.DOI. 10.1002/esp.1883. With 2010 Erratum. Earth Surface Processesand Landforms 35: 242–245. DOI. 10.1002/esp.1993
Brunner GW. 2010. HEC-RAS River Analysis System: User ManualVersion 4.1, CPD68. US Army Corps of Engineers, Institute for WaterResources, Hydrologic Engineering Center: Davis, CA.
Bufalo M, Nahon D. 1992. Erosional processes of Mediterraneanbadlands – a new erosivity index for predicting sediment yield fromgully erosion. Geoderma 52: 133–147. DOI. 10.1016/0016-7061(92)90079-M
Caitcheon GC, Olley JM, Pantus F, Hancock G, Leslie C. 2012. Thedominant erosion processes supplying fine sediment to three majorrivers in tropical Australia, the Daly (NT), Mitchell (Qld) and Flinders(Qld) Rivers. Geomorphology 151–152: 188–195. DOI. 10.1016/j.geomorph.2012.02.001
diCenzo PD, Luk SH. 1997. Gully erosion and sediment transport in asmall subtropical catchment, South China. Catena 29: 161–176.DOI. 10.1016/S0341-8162(96)00053-7
Chen H, Cai Q. 2006. Impact of hillslope vegetation restoration ongully erosion induced sediment yield. Science in China Series D(Earth Sciences) 49: 176–192. DOI. 10.1007/s11430-005-0177-4
Cheng NS. 1997. Simplified settling velocity formula for sedimentparticles. Journal of Hydraulic Engineering, American Society of
Copyright © 2013 John Wiley & Sons, Ltd.
Civil Engineers 123: 149–152. DOI. 10.1061/(ASCE)0733-9429(1997)123:2(149)c
Colby BC. 1961. The single-stage sampler for suspended sediment:Report No. 13. In A Study of Methods Used in Measurement andAnalysis of Sediment Loads in Streams. Federal Inter-Agency Sedi-mentation Project (FSIP), St Anthony Falls Hydraulic Laboratory,Field Technical Committee of the Subcommittee on Sedimentationof the Inter-Agency Committee on Water Resource: Minneapolis,MN; 105. http://fisp.wes.army.mil/Report%2013.pdf
Condon RW. 1986. A Reconnaissance Erosion Survey of part of theVictoria River District, N.T. Hassall & Associates: Canberra.
DunkerleyD, BrownK. 1999. Flowbehaviour, suspended sediment trans-port and transmission losses in a small (sub-bank-full) flow event in anAustralian desert stream.Hydrological Processes 13: 1577–1588. DOI.10.1002/(SICI)1099-1085(19990815)13:11<1577::AID-HYP8273.0.CO;2-L
Edwards TK, Glysson GD. 1998. Field Methods for Measurement ofFluvial Sediment. Techniques of Water-Resources Investigations forthe US Geological Survey. US Geological Survey: Reston, VA; Book3, Chapter C2.
Fang HY, Cai QG, Chen H, Li QY. 2008. Temporal changesin suspended sediment transport in a gullied loess basin: thelower Chabagou Creek on the Loess Plateau in China. EarthSurface Processes and Landforms 33: 1977–1992. DOI.10.1002/esp.1649
Food and Agriculture Organization (FAO). 2010. World River SedimentYields Database. Created by HR Wallingford, UK, for the FAO Landand Water Development Division, Food and Agriculture Organiza-tion of the United Nations. http://www.fao.org/landandwater/aglw/sediment/default.asp [August 2010]
Graf WL. 1977. The rate law in fluvial geomorphology. AmericanJournal of Science 277: 178–91. DOI. 10.2475/ajs.277.2.178
Gray JR, Gartner JW. 2009. Technological advances in suspended-sedimentsurrogate monitoring. Water Resources Research 45: W00D29, DOI.10.1029/2008WR007063
Gray JR, Glysson GD, Turcios LM, Schwarz GE. 2000. Comparability ofSuspended-Sediment Concentration and Total Suspended SolidsData. US Geological Survey, Water Resources Investigations Report00-4191. US Geological Survey: Reston, VA.
Haigh MJ. 1984. Ravine erosion and reclamation in India. Geoforum15: 543–561. DOI. 10.1016/0016-7185(84)90024-1
Hairsine PB, Rose CW. 1992. Modelling water erosion due to overlandflow using physical principles: I. Uniform flow. Water ResourcesResearch 28: 237–243.
Hicks DM, Gomez B. 2003. Sediment transport. In Tools in FluvialGeomorphology, Kondolf GM, Piegay H (eds). John Wiley & Sons:Chichester; 425–461.
Huang M, Gallichand J, Zhang P. 2003. Runoff and sediment responsesto conservation practices: loess plateau of China. Journal of theAmerican Water Resources Association 39: 1197–1207. DOI.10.1111/j.1752-1688.2003.tb03702.x
Knighton AD. 1998. Fluvial Forms and Processes: A New Perspective.Arnold: London.
Kuhnle RA, Bingner RL, Alonso CV, Wilson CG, Simon A. 2008.Conservation practice effects on sediment load in the GoodwinCreek Experimental Watershed. Journal of Soil and WaterConservation 63: 496–503. DOI. 10.2489/jswc.63.6.496
Lewis J. 1996. Turbidity-controlled suspended sediment samplingfor runoff-event load estimation. Water Resources Research32: 2299–2310. DOI. 10.1029/96WR00991
Martinez-Casasnovas JA. 2003. A spatial information technologyapproach for the mapping and quantification of gully erosion. Catena50: 293–308. DOI. 10.1016/S0341-8162(02)00134-0
Martinez-Casasnovas JA, Anton-Fernandez C, Ramos MC. 2003.Sediment production in large gullies of the Mediterranean area(NE Spain) from high-resolution digital elevation models andgeographical information systems analysis. Earth Surface Processesand Landforms 28: 443–456. DOI. 10.1002/esp.451
Mathys N, Brochot S, Meunier M, Richard D. 2003. Erosionquantification in the small marly experimental catchments ofDraix (Alpes De Haute Provence, France): calibration of theETC rainfall–runoff–erosion model. Catena 50: 527–548. DOI.10.1016/S0341-8162(02)00122-4
Earth Surf. Process. Landforms, (2013)

SEDIMENT PRODUCTION AND YIELD FROM AN ALLUVIAL GULLY
McCloskey GL. 2010. Riparian Erosion Morphology, Processes andCauses along the Victoria River, Northern Territory, Australia PhDThesis, Charles Darwin University.
McTainsh GH, Lynch AW, Hales R. 1997. Particle-size analysis of aeo-lian dusts, soils and sediments in very small quantities using a Coultermultisizer. Earth Surface Processes and Landforms 22: 1207–1216.DOI. 10.1002/(SICI)1096-9837(199724)22:13<1207::AID-ESP8203.0.CO;2-K
Nachtergaele J, Poesen J, Oostwoud Wijdenes DO, Vandekerckhove L.2002. Medium-term evolution of a gully developed in a loess-derived soil. Geomorphology 46: 223–239. DOI. 10.1016/S0169-555X(02)00075-2
Nearing MA, Nichols MH, Stone JJ, Renard KG, Simanton JR. 2007.Sediment yields from unit-source semiarid watersheds at WalnutGulch. Water Resources Research 43(W06426): 1–10. DOI.10.1029/2006WR005692
Nyssen J, Poesen J, Moeyersons J, Haile M, Deckers J. 2008. Dynamicsof soil erosion rates and controlling factors in the Northern EthiopianHighlands – towards a sediment budget. Earth Surface Processes andLandforms 33: 695–711. DOI. 10.1002/esp.1569
Olive LJ, Rieger WA. 1985. Variation in suspended sedimentconcentration during storms in five small catchments in southeastNew South Wales. Australian Geographical Studies 23: 38–51.DOI. 10.1111/j.1467-8470.1985.tb00477.x
Ondieki CM. 1995. Field assessment of flood event suspendedsediment transport from ephemeral streams in the tropical semi-aridcatchments. Environmental Monitoring and Assessment 35: 43–54.DOI. 10.1007/BF02396409
Oostwoud Wijdenes D, Bryan R. 2001. Gully-head erosion processeson a semi-arid valley floor in Kenya: a case study into temporal var-iation and sediment budgeting. Earth Surface Processes andLandforms 26: 911–933. DOI. 10.1002/esp.225
Oostwoud Wijdenes D, Poesen J, Vandekerckhove L, Ghesquiere M.2001. Spatial distribution of gully head activity and sediment supplyalong an ephemeral channel in a Mediterranean environment.Catena 39: 147–167. DOI. 10.1016/S0341-8162(99)00092-2
Pain CF, Ollier CD. 1992. Ferricrete in Cape York Peninsula, NorthernQueensland. BMR Journal of Australian Geology and Geophysics13: 207–212.
Payne AL, Kubicki A, Wilcox DG, Short LC. 1979. A Report on theErosion and Range Condition in the West Kimberley Area of WesternAustralia, Department of Agriculture of Western Australia, TechnicalBulletin No. 42. Department of Agriculture of Western Australia:South Perth, WA.
Pickup G. 1991. Event frequency and landscape stability on the flood-plain systems of arid central Australia. Quaternary Science Reviews10: 463–473. DOI. 10.1016/0277-3791(91)90007-H
Piest RF, Bradford JM, Wyatt GM. 1975. Soil erosion and sedimenttransport from gullies. Journal of the Hydraulics Division,Proceedings of the American Society of Civil Engineers 101: 65–80.
Poesen J. 1993. Gully typology and gully control measures in theEuropean loess belt. In Farm Land Erosion in Temperate PlainsEnvironment and Hills, Wicherek S (ed). International Symposiumon Farm Land Erosion, Paris, France, 25–29 May 1992. Elsevier:Amsterdam; 221–239.
Poesen J, Valentin C, Nachtergaele J, Verstraeten G. 2003. Gullyerosion and environmental change: importance and research needs.Catena 50: 91–133. DOI. 10.1016/S0341-8162(02)00143-1
Poesen J, Vanwalleghem T, de Vente J, Knapen A, Verstraeten G, Martinez-Casasnovas JA. 2006. Gully erosion in Europe. In Soil Erosion in Europe,Boardman J, Poesen J (eds). John Wiley & Sons: Chichester; 515–536.
Pringle HJR, Watson IW, Tinley KL. 2006. Landscape improvement,or ongoing degradation – reconciling apparent contradictionsfrom the rangelands of Western Australia. Landscape Ecology21: 1267–1279. DOI. 10.1007/s10980-006-0015-x
Prosser IP, Winchester SJ. 1996. History and processes of gully initiationand development in eastern Australia. Zeitschrift fur GeomorpholigieSuppl Bnd 105: 91–109.
Rantz SE. 1982. Measurement and Computation of Streamflow, USGeological Survey, Water Supply Paper 2175. US Geological Survey:Washington, DC.
Rose CW. 1993. Erosion and sedimentation. In Hydrology and WaterManagement in the Humid Tropics: Hydrological Research Issues
Copyright © 2013 John Wiley & Sons, Ltd.
and Strategies for Water Management Bonell M, Hufschmidt MM,Gladwell JS (eds), International Hydrology Series. CambridgeUniversity Press: Cambridge; 301–343.
Rustomji P, Zhang XP, Hairsine PB, Zhang L, Zhao J. 2008. River sedimentload and concentration responses to changes in hydrology and catch-ment management in the Loess Plateau region of China.Water ResourcesResearch 44: W00A04. DOI. 10.1029/2007WR006656
Rustomji P, Shellberg J, Brooks A, Spencer J, Caitcheon G. 2010. ACatchment Sediment and Nutrient Budget for the Mitchell River,Queensland, a report to the Tropical Rivers and CoastalKnowledge (TRaCK) Research Program, CSIRO Water for a HealthyCountry National Research Flagship: Canberra. http://track.gov.au/publications/registry/876
Rutherfurd ID, Prosser IP, Davis J. 1997. Simple approaches topredicting rates and extent of gully development. In Proceedings ofthe Conference on Management of Landscapes Disturbed by ChannelIncision, Wang SSY, Langendoen EJ, Shields FDJ (eds). The Centre forComputational Hydroscience and Engineering, The University ofMississippi: Oxford, MS; 1124–1130.
Schumm SA. 1979. Geomorphic thresholds: the concept and itsapplications. Transactions of the Institute of British Geographers4: 485–515.
Seginer I. 1966. Gully development and sediment yield. Journal ofHydrology, 4: 236–2253.
Shellberg JG. 2011. Alluvial Gully Erosion Rates and Processes acrossthe Mitchell River Fluvial Megafan in Northern Queensland,Australia. PhD Thesis, Griffith University, Brisbane, Qld, AUS.
Shellberg J, Brooks A, Spencer J. 2010. Land-use change from indigenousmanagement to cattle grazing initiates the gullying of alluvial soils innorthern Australia, 19th World Congress of Soil Science, Soil Solutionsfor a Changing World, 1–6 August 2010, Brisbane; 59–62.
Shellberg JG, Brooks AP, Spencer J, Ward D. 2013. Thehydrogeomorphic influences on alluvial gully erosion along theMitchell River fluvial megafan, northern Australia. HydrologicalProcesses. 27: 1086–1104. DOI. 10.1002/hyp.9240
Simpson CJ, Doutch HF. 1977. The 1974 wet-season flooding of thesouthern Carpentaria Plains, northwest Queensland. BMR Journalof Australian Geology and Geophysics 2: 43–51.
Singh S, Dubey A. 2000. Temporal variations in the network of man-impacted gully basins in the sub-humid tropical alluvial riverineenvironment – a case study of Deoghat gullies of AllahabadDistrict, India. Zeitschrift für Geomorphologie 44: 175–194.
Smith HG, Dragovich D. 2009. Interpreting sediment delivery processesusing suspended sediment-discharge hysteresis patterns from nestedupland catchments, south-eastern Australia. Hydrological Processes23: 2415–2426. DOI. 10.1002/hyp.7357
Thomas JT, Iverson NR, Burkart MR, Kramer LA. 2004. Long-termgrowth of a valley-bottom gully, western Iowa. Earth SurfaceProcesses and Landforms 29: 995–1009. DOI. 10.1002/esp.1084
Vandekerckhove L, Poesen J, Oostwoud Wijdenes D, Gyssels G,Beuselinck L, de Luna E. 2000. Characteristics and controlling fac-tors of bank gullies in two semi-arid Mediterranean environments.Geomorphology 33: 37–58. DOI. 10.1016/S0169-555X(99)00109-9
Vandekerckhove L, Gyssels G, Poesen J, Oostwoud Wijdenes D. 2001.Short-term bank gully retreat rates in Mediterranean environments.Catena 44: 133–161. DOI. 10.1016/S0341-8162(00)00152-1
Vandekerckhove L, Poesen J, Govers G, 2003. Medium-term gullyheadcut retreat rates in southeast Spain determined from aerialphotographs and ground measurements. Catena 50: 329–352.DOI. 10.1016/S0341-8162(02)00132-7
Walling DE, Collins AL, Sichingabula HM, Leeks GJL. 2001. Integratedassessment of catchment suspended sediment budgets: a Zambianexample. Land Degradation and Development 12: 387–415. DOI.10.1002/ldr.461
Wasson RJ. 1994. Annual and decadal variation of sediment yield inAustralia, and some globalcomparisons. In Variability in StreamErosion and Sediment Transport, (Proceedings Canberra 1994) OliveLJ, Loughran RJ, Kesby JA (eds). IAHS Publication 224. IAHS Press:Wallingford; 269–279.
Welch NH. 1986. Sediment yield from a gully, Proceedings, 4th FederalInteragency Sedimentation Conference, Las Vegas; 3-142–3-151.http://pubs.usgs.gov/misc/FISC_1947-2006
Earth Surf. Process. Landforms, (2013)

J. G. SHELLBERG, A. P. BROOKS AND C. W. ROSE
Williams GP. 1989. Sediment concentration versus water dischargeduring single hydrologic events in rivers. Journal of Hydrology111: 89–106.DOI. 10.1016/0022-1694(89)90254-0
Yadav RC, Bhushan LS. 2002. Conservation of gullies in susceptibleriparian areas of alluvial soil regions. Land Degradation andDevelopment 13: 201–219. DOI. 10.1002/ldr.493
Yang CT. 1973. Incipient motion and sediment transport. Journal ofHydraulic Engineering 99: 1679–1704.
Copyright © 2013 John Wiley & Sons, Ltd.
Yang CT, Wan S. 1991. Comparisons of selected bed-material loadformula. Journal of Hydraulic Engineering 117: 973–989. DOI.10.1061/(ASCE)0733-9429(1991)117:8(973)
Yu B. 2005. Process-based erosion modelling: promise and prog-ress. In Forests, Water and People in the Humid Tropics: Past,Present and Future Hydrological Research for Integrated Landand Water Management, Bonell M, Bruijnzeel LA (eds). CambridgeUniversity Press: Cambridge; 790–810.
Earth Surf. Process. Landforms, (2013)