sediment mixing at nonda rock: investigations of stratigraphic integrity at an early archaeological...
TRANSCRIPT

JOURNAL OF QUATERNARY SCIENCE (2007) 22(5) 449–479Copyright 2007 John Wiley & Sons, Ltd.Published online in Wiley InterScience
(www.interscience.wiley.com) DOI: 10.1002/jqs.1136Sediment mixing at Nonda Rock: investigations ofstratigraphic integrity at an early archaeologicalsite in northern Australia and implications for thehuman colonisation of the continentBRUNO DAVID,1* RICHARD G. ROBERTS,2 JOHN MAGEE,3 JEROME MIALANES,4 CHRIS TURNEY,2 MICHAEL BIRD,5
CHRIS WHITE,1 L. KEITH FIFIELD6 and JOHN TIBBY71 School of Geography and Environmental Science, Monash University, Clayton, Victoria, Australia2 GeoQuEST Research Centre, School of Earth and Environmental Sciences, University of Wollongong, Wollongong, New SouthWales, Australia3 Department of Earth and Marine Sciences, Australian National University, Canberra, ACT, Australia4 The Centre for Classics and Archaeology, The University of Melbourne, Victoria, Australia5 School of Geography and Geosciences, University of St Andrews, St Andrews, Fife, Scotland, UK6 Department of Nuclear Physics, Research School of Physical Sciences and Engineering, Australian National University, Canberra,ACT, Australia7 Geographical and Environmental Studies, Faculty of Humanities and Social Sciences, University of Adelaide, South Australia, Australia
David, B., Roberts, R. G., Magee, J., Mialanes, J., Turney, C., Bird, M., White, C., Fifield, L. K. and Tibby, J. 2007. Sediment mixing at Nonda Rock: investigations ofstratigraphic integrity at an early archaeological site in northern Australia and implications for the human colonisation of the continent. J. Quaternary Sci., Vol. 22pp. 449–479. ISSN 0267–8179.
Received 4 December 2006; Revised 7 March 2007; Accepted 9 March 2007
ABSTRACT: Archaeological excavations in sediments dating to between 60000 and 40000 years agoare rare in Australia. Yet this is precisely the period inwhichmost archaeologists consider that Aboriginalpeople arrived on the continent. In the few cases where such early sites have been investigated,questions have invariably been raised as to the reliability of stratigraphic associations between culturalitems and the surrounding sediments. This paper describes amethod for examining sedimentmixing in astratigraphic sequence using the optically stimulated luminescence (OSL) signals from individualsand-sized grains of quartz. We apply this method to the archaeological site of Nonda Rock (north
Queensland), in combination with radiocarbon dating of charcoal fragments, to construct chronologiesfor human occupation and for the preceding, culturally sterile, deposits. Our age estimates haveimplications for the timing of first human arrival in Australia. Copyright# 2007 JohnWiley & Sons, Ltd.Supplementary electronic material for this paper is available in Wiley InterScience at http://www.mrw.interscience.wiley.com/suppmat/0267-8179/suppmat/v22.html
KEYWORDS: Pleistocene archaeology; north Queensland; human colonisation; Australian archaeology; early occupation sites; sediment mixing;
optically stimulated luminescence (OSL); single-grain dating; radiocarbon dating.
Introduction
In the December 2003 issue of Australian Archaeology, JimAllen and James O’Connell reported that most Australianarchaeologists suspect that Aboriginal people first arrived inAustralia sometime between 60 000 and 40 000 years ago.y Anumber of reports have appeared in the literature with claims
* Correspondence to: B. David, School of Geography and Environmental Science,Monash University, Clayton, Victoria 3800, Australia.E-mail: [email protected] this paper, reference to ‘years ago’ means that we are reporting eithercalibrated radiocarbon ages, or OSL/TL ages, which are in calendar years. Wefollow Gillespie’s (2002) calibrations for previously published radiocarbon agesfrom sites other than Nonda Rock.
for pre-50 000-year-old artefacts: Jinmium (>116000 12 000years ago; Fullagar et al., 1996), Nauwalabila I (60 300 6700to 53 400 5400 years ago; e.g. Bird et al., 2002; Roberts et al.,1994), Malakunanja II (61 000 8000 to 52 000 8000 yearsago; Roberts et al., 1990, 1998b; Roberts and Jones, 1994),Huon Peninsula (61 400 600 to 44 500 700 years ago;Allen and O’Connell, 2003; Chappell, 2002; Chappell et al.,1996; Groube et al., 1986), and Lake Mungo (62 000 6 000years ago; Grun et al., 2000; Thorne et al., 1999).In each case, however, doubt has been cast by some
researchers as to the integrity, and therefore reliability, ofsuggested associations between the ages (radiocarbon, thermo-luminescence (TL) or optically stimulated luminescence (OSL))and the deepest cultural materials (e.g. Allen and O’Connell,2003; Bowdler, 1991; Bowler et al., 2003; Bowler and Magee,
450 JOURNAL OF QUATERNARY SCIENCE
2000; Cosgrove, 2007; Gillespie and Roberts, 2000; Gillespie,2002; Gillespie et al., 2006; Roberts et al., 1998a). The gravestconcerns are related to the stratigraphic integrity of the deepestdeposits or of the materials dated within those deposits, andthereby to the integrity of reported associations between thecultural and the dated materials.Initial uncertainties regarding dating technicalities have, in
large part, now been resolved (e.g. Gillespie, 2002; Robertset al., 1998b; Roberts and Jones, 2001), and some of theapparently very early sites—with ages older than 50 000 yearsBP—have now been convincingly shown to be younger thaninitially claimed (in particular Jinmium and Lake Mungo; e.g.Bowler et al., 2003; Roberts et al., 1998a). That is, in manycases, the problem now does not lie with the age of the datedmaterials (such as sand grains or carbon-bearing material), butwith how these relate to the deepest and oldest cultural items—the archaeological objects of interest.It is clear from these debates that detailed investigations of
sediment mixing are needed for those archaeological sites onthe edge of established knowledge—be they sites associatedwith colonisation models, megafaunal extinction or any otheraspect of the past. We note in this context that all sites containsome degree of mixing, but this can vary in spatial scale byseveral orders of magnitude (millimetre to metre) depending oncontext and contingency. The challenge is to determine thedegree and nature of such mixing at each site. The first majoraim of this paper is to address this challenge by presentingdetails of a methodology to investigate sediment mixing usingthe OSL emissions from single grains of quartz sandincorporated in stratigraphic sequences.Along with these debates concerning the antiquity of the
earliest sediments that, at first appearance, seem to containin situ cultural materials, there has also been a troublingawareness of a paucity of archaeological investigations withinsediments firmly dated to the critical period 60 000–50 000years ago. Few sedimentary contexts relating to this period oftime have been examined by archaeologists. When suchinvestigations have occurred, such as in the Lake Eyre Basin, theWillandra Lakes (earliest broadly accepted cultural materials:50 000–46 000 years old; e.g. Bowler et al., 2003) and Devil’sLair (earliest broadly accepted cultural materials: 48 000 yearsold; Turney et al., 2001), no cultural materials were found inreliable stratigraphic contexts prior to 50 000 years ago at theearliest (see Roberts (1997) and Gillespie (2002) for reviews ofthe earliest dated archaeological sites in Australia).The Lake Mungo case is particularly important: Bowler et al.
(2003) clearly show that the earliest occupation is between50 000 and 46 000 years old. Moreover, while the underlyingsediments are stated to be sterile, they were also subaqueouslydeposited in the context of a developing/emerging offshorebarrier. At the Joulni site, towards the southern end of LakeMungo, sedimentation commenced below water level in anoffshore barrier system around 60 000 years ago, near the startof the lacustral phase. Evidence for occupation, in the form ofstone artefacts, appears as soon as the barrier built up to close towater level, 50 000–46 000 years ago. It is entirely possible thatearlier occupation existed in the region, but no site continu-ously above water from the initiation of the lacustral phase60 000 years ago has yet been investigated—much lesscomprehensively dated by OSL techniques.This absence of positive evidence for earlier cultural
materials has led many researchers to question the presenceof people on the continent before 50 000 years ago, preferringinstead a human arrival sometime between 50 000 and 45 000years ago. Some—such as Miller et al. (1999), Roberts et al.(2001), Gillespie et al. (2006) and Brook et al. (2007)—havenoted the close coincidence of the earliest apparent ages for
Copyright 2007 John Wiley & Sons, Ltd.
human occupation of Australia and the timing of extinction ofthe megafauna sometime between 51 200 and 39 800 yearsago. They argue that this coincidence suggests that Australiawas first settled by Aboriginal people not long before themegafauna’s demise—a proposition consistent with the age ofthe earliest widely accepted cultural deposits at Lake Mungo,Allen’s Cave (Roberts et al., 1996), Devil’s Lair, Swan River(Pearce and Barbetti, 1981), Carpenter’s Gap (O’Connor,1995), Riwi (Balme, 2000), Huon Peninsula and NgarrabullganCave (David et al., 1997).
Given the paucity of systematically reported early sedimentsand early sites, any new archaeological site with sedimentsdating to the critical interval between 60 000 and 40 000 yearsago is of relevance to questions concerning the colonisation ofAustralia—be it to confirm the presence of people during thattime (positive evidence) or to question it through absence ofevidence. Similarly, investigation of sediments depositedshortly before 60 000 years ago would also be useful to furthertest whether or not there is evidence for people in Australia ataround that time. One such site with deposits in the timeinterval of interest is Nonda Rock, a rockshelter in northeasternAustralia. And here lies this paper’s second major aim: toexplore the nature of the archaeological, chronostratigraphicand geomorphological evidence at this site. Bringing togetherour two major aims, we present the results of a detailedinvestigation to establish whether or not stone artefacts atNonda Rock are contemporaneous with the charcoal fragments(radiocarbon dated to >50 000 years BP) and quartz grains(optically dated to ca. 67 000 years) with which they initiallyappeared to be associated.
Nonda Rock
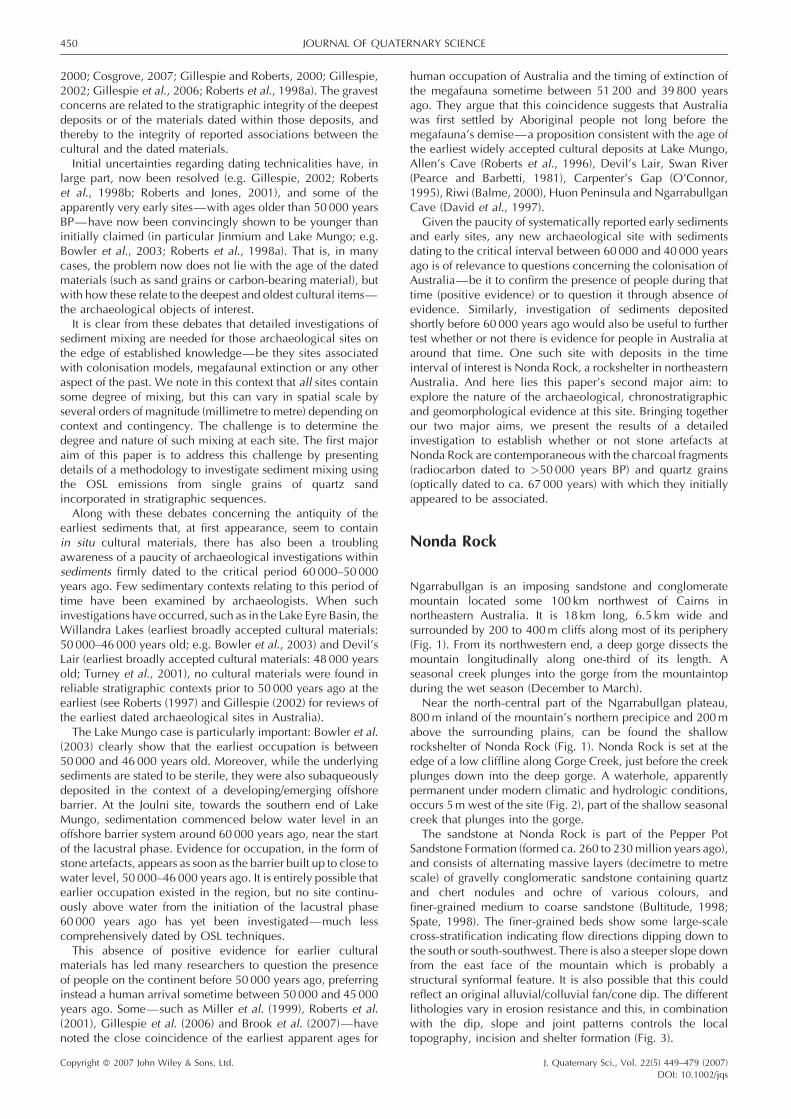
Ngarrabullgan is an imposing sandstone and conglomeratemountain located some 100 km northwest of Cairns innortheastern Australia. It is 18 km long, 6.5 km wide andsurrounded by 200 to 400m cliffs along most of its periphery(Fig. 1). From its northwestern end, a deep gorge dissects themountain longitudinally along one-third of its length. Aseasonal creek plunges into the gorge from the mountaintopduring the wet season (December to March).
Near the north-central part of the Ngarrabullgan plateau,800m inland of the mountain’s northern precipice and 200mabove the surrounding plains, can be found the shallowrockshelter of Nonda Rock (Fig. 1). Nonda Rock is set at theedge of a low cliffline along Gorge Creek, just before the creekplunges down into the deep gorge. A waterhole, apparentlypermanent under modern climatic and hydrologic conditions,occurs 5m west of the site (Fig. 2), part of the shallow seasonalcreek that plunges into the gorge.
The sandstone at Nonda Rock is part of the Pepper PotSandstone Formation (formed ca. 260 to 230million years ago),and consists of alternating massive layers (decimetre to metrescale) of gravelly conglomeratic sandstone containing quartzand chert nodules and ochre of various colours, andfiner-grained medium to coarse sandstone (Bultitude, 1998;Spate, 1998). The finer-grained beds show some large-scalecross-stratification indicating flow directions dipping down tothe south or south-southwest. There is also a steeper slope downfrom the east face of the mountain which is probably astructural synformal feature. It is also possible that this couldreflect an original alluvial/colluvial fan/cone dip. The differentlithologies vary in erosion resistance and this, in combinationwith the dip, slope and joint patterns controls the localtopography, incision and shelter formation (Fig. 3).
J. Quaternary Sci., Vol. 22(5) 449–479 (2007)DOI: 10.1002/jqs

Figure 1 Map of Ngarrabullgan (Mt Mulligan), showing locations of excavated sites
SEDIMENT MIXING AT NONDA ROCK 451
In the vicinity of the shelter at Nonda Rock, there are twonick-points formed by massive, more resistant conglomeraticsandstone layers, one at the head of the gorge, downstream ofthe shelter, and one just upstream of the shelter. Upstreamnick-point retreat occurs by a process of preferential jointerosion and block separation followed by displacement andcollapse, as is very evident just upstream from the shelter. Someundercutting and collapse via lateral erosion of the lessresistant, finer-grained lithology also occurs. This is thedominant process at the margins of the gorge and valley belowthe lower nick-point, and was responsible for the formation ofthe shelter.
Copyright 2007 John Wiley & Sons, Ltd.
The rockshelter at Nonda Rock is today 12m wide, 3.5mdeep, and 3m high at the dripline. However, the overhang wasonce larger—probably around 20m wide and perhaps 5mdeep based on the spatial extent of roof-fall and remnant sheltermorphology—but at some unknown time in the past much ofthe overhang collapsed, leaving on the ground large rock slabsbelow their original, overhanging positions (Fig. 4).Nonda Rock today possesses a small area of soft deposits
(15m2) protected, during creek floodspills in the wet season(December–March; Fig. 2), by surrounding large boulders fromthe collapsed roof. Along the shelter’s back wall are also foundeight faded, non-figurative red paintings and three faded red
J. Quaternary Sci., Vol. 22(5) 449–479 (2007)DOI: 10.1002/jqs

Figure 2 Nonda Rock with permanent waterhole (excavation in progress immediately behind the tripod). The collapsed sandstone roof of ancientNonda Rock can be seen in the right-hand half of the photo
Figure 3 Top : Plan view of the creek in the vicinity of Nonda Rock, showing locations of (bottom left) cross-section (A1–A2) across the creek at theshelter; and (bottom right) long-section (B1–B2)
Copyright 2007 John Wiley & Sons, Ltd. J. Quaternary Sci., Vol. 22(5) 449–479 (2007)DOI: 10.1002/jqs
452 JOURNAL OF QUATERNARY SCIENCE

Figure 4 Map and cross-section of Nonda Rock
SEDIMENT MIXING AT NONDA ROCK 453
hand stencils; seven faded and partly exfoliated red handstencils occur away from the area of soft surface deposit, in apart of the shelter crammed with roof-fall, a part that is nowdifficult to access and whose rock-art may well date to beforethe roof-fall.
Archaeology at Nonda Rock
Prior to excavating at Nonda Rock, archaeological excavationsat nearby Ngarrabullgan Cave (1.2 km to the west of NondaRock, also on the plateau) had previously revealed culturalmaterials dated to 39 900 1350 years ago (David, 2002); wethus already knew that long cultural sequences occurred in the
Copyright 2007 John Wiley & Sons, Ltd.
area. Archaeological excavations at Nonda Rock were under-taken over two field seasons, in 1997 and again in 2002. In1997 four juxtaposed 50 50 cm squares were excavated—D6, D7, E6 and E7—only E7 proceeding to bedrock (Figs 4–6).The excavations were situated near the centre of the soft surfacesediments, 70 cm from the back wall. Very old (>50000 yearsBP) radiocarbon determinations were obtained for near-basalExcavation Units at Nonda Rock—old age estimates occurringimmediately below flaked stone artefacts, and at the time inambiguous stratigraphic association because of their closestratigraphic proximity coupled with the small size of theexcavation—so the decision was made to resolve the site’schronostratigraphy in greater detail. In 2002, the 1997back-filled pit was reopened and the already partly excavatedsquare E6 was excavated to bedrock, at 117 cm below groundsurface the deepest excavated square.
J. Quaternary Sci., Vol. 22(5) 449–479 (2007)DOI: 10.1002/jqs

454 JOURNAL OF QUATERNARY SCIENCE
Excavation methods were similar during both field seasons.Excavations proceeded in arbitrary Excavation Units (XU)within Stratigraphic Units (SU), attempting to keep the amountof sediments from each XU to less than a 10 L bucket—each XUaveraged 6.7 L or 2.7 cm in thickness. All cultural objectsobserved in situ were plotted in three dimensions and baggedindividually. The excavated sediments were sieved using 3mmmesh and bagged for subsequent sorting in the laboratory.Sediment samples from the <3mm fraction were collectedfrom each XU of each square. A number of in situ charcoalsamples were plotted in three dimensions and individuallybagged from each XU when observed during the course of theexcavation. Oriented (micromorphology) sediment sampleswere collected from the eastern wall of squares E6 and E7 afterthe 2002 excavations (Figs 5 and 6).
Figure 5 East section, Nonda Rock excavation squares E7 and E6. The SU(demarcating interfaces); the XU are shown by the white lines. The locations orespectively) are also shown
Copyright 2007 John Wiley & Sons, Ltd.
Nonda Rock possesses three major Stratigraphic Unitssubdivided into six subunits, each grading rather than sharplygiving way to a distinct layer (Figs 5 and 6). Each SU isdescribed in Table 1.
Sediment micromorphology
With Nonda Rock’s complex chronostratigraphic questions inmind, the site’s sediments were subjected to various geomor-phological analyses to determine their sources and the nature ofsubsequent intrusions, disturbances and developments, includ-ing particle size analysis of the <3mm sediment fraction,diatom analysis, pH determinations and micromorphology (seeSupplementary Information (http://www.mrw.interscience.
boundaries are represented by the black lines and associated arrowsf OSL and oriented sediment (thin section) samples (‘NR’ and ‘TS’ series,
J. Quaternary Sci., Vol. 22(5) 449–479 (2007)DOI: 10.1002/jqs

0 cm
10
20
30
1B
2A
1A
2B
2C
3
40
50
60
70
80
90
100
110
D7 E7
XU 32
XU 31XU 30
XU 29
XU 28
XU 27
XU 26C
XU 26A XU 26B
XU 25
XU 24
XU 23
XU 22
XU 21
XU 20
XU 19
XU 18
XU 17
XU 16
XU 15
XU 14
XU 13
XU 12
XU 11
XU 10
XU 9
XU 8XU 7XU 6
XU 5
XU 4XU 3XU 2
XU 1
XU 13
XU 12
XU 11
XU 10
XU 9
XU 8
XU 7
XU 6XU 5
XU 4XU 3
XU 2
XU 1
38,200 ±1400 BP
51,000 BP
0 cm
10
20
30
1B
2A
1A 5
2B
2C
3
Roots
Charcoal
Rock
40
50
60
70
80
90
100
110
D7 E7
650±50 BP
8870±50 BP
3420±45 BP
7980±80 BP
10,170±60 BP
11,300±60 BP
18,030±100 BP
22,400±150 BP
22,350±240 BP
22,550±150 BP
21,660±430 BP
22,600±150 BP
26,200±450 BP
31,700±300 BP
23,300±350 BP
Excavation unit(with conventional radiocarbon date, Waikato)(with AMS radiocarbon date, ANU)AMS radiocarbon date
(ANSTO)
25,300 BP+195–200
>55,000 BP
+2500–3600
50,450
BP +1450–1784
+2800–4348
A
B
Figure 6 North section, Nonda Rock excavation squares D7 and E7. Above: The SU boundaries are represented by the black lines and associatedarrows (demarcating interfaces); the XU are shown by the white lines. Below: The locations and ages of the radiocarbon samples are shown
Copyright 2007 John Wiley & Sons, Ltd. J. Quaternary Sci., Vol. 22(5) 449–479 (2007)DOI: 10.1002/jqs
SEDIMENT MIXING AT NONDA ROCK 455

Table 1 Description of stratigraphic units
Stratigraphicunit
Description
1a Loose, surface sandy sediments. Dry at time of excavation. Some leaf litter, but no plant growth, although numeroussmall rootlets are present. Ashy, charcoal-rich sediments. Charcoal concentrations are greater in slight depressionson the ground surface; this charcoal appears to be the result of bushfires or burning logs rather than hearths. Thecharcoal is spread across the site, from the back wall to the front of the very large boulder at the entrance to the siteand beyond. Gray to Dark Gray in Dry Munsell colour.
1b Dry, ashy sand, reasonably compact (not loose) but only slightly consolidated. Numerous small rootlets are present.Boundary with overlying SU1a is fairly well marked, taking place over a vertical distance of 1 cm. Sediments arefairly homogeneous across the square. Brown in Dry Munsell colour.
2a Fairly compact, dry and reasonably consolidated sand, homogeneous throughout the square. Boundary withoverlying SU1b takes place over a vertical distance of 2 cm, although it is clearly visible in the excavationsections. Some rocks occur within this SU, especially in square D6. Light Yellowish Brown in Dry Munsell colour.
2b Gravelly sand, fairly dry, generally very compact and consolidated. Charcoal is most concentrated towards the upperlevels of this SU, where it meets with SU2a (i.e. the old surface at the commencement of SU2a). SU2b is verycompact in most places, but every now and then some localised areas are less compact and consolidated. Some rocksoccur within SU2b, especially in square D6. Sometimes, small gaps of 2 2 2 cm appear between wedged gravelsand rocks. SU2b is mottled yellowish-green, reminiscent of the colour of wasp and termite nests presently occurringin the vicinity of the excavations. Pieces of charcoal sometimes occur within these mottles.During the excavation, the upper surface of SU2b was easily and quickly identified; this surface appeared to represent
a noticeable sedimentary change from SU2a. The mottles in SU2b appear to be harder than the surrounding sedimentmatrix—they appear to be more ‘cemented’. The changeover between SU2a and SU2b was marked during theexcavation, but as the walls dried this stratigraphic change became less visible. Light Brown to Strong Brown inDry Munsell colour.
2c The changeover between SU2b and SU2c is not marked, and largely reflects looser sediments in SU2c than in SU2b.This difference was noted during excavation, but the change between these two sub-layers is not clearly evidentin the sections. For this reason it is represented as a dotted line on the section drawings (Figs 5 and 6). Apart from thischange in consolidation, sediments are similar in SU2b and SU2c. However, quantities of charcoal are less in SU2cthan in SU2b. Light Brown to Strong Brown in Dry Munsell colour.
3 Sandy gravel. Sediments dry at time of excavation. SU3 represents a major stratigraphic change, which was easilyidentified during excavation. The changeover between SU2c and SU3 is marked, taking place over a vertical distanceof 2 to 3 cm. Sediments in SU3 are very gravelly, but the gravel size is relatively homogeneous (unlike those ofSU2b and SU2c which ranged from very small to rocks more than 10 cm long). The sediment matrix in SU3 isnoticeably darker and more ‘smoky’ in colour than SU2c. This difference was easily identified during the course ofthe excavation. SU3 lies immediately on top of ‘bedrock’. This ‘bedrock’ consists of a flat surface that slopesdownwards towards the back wall of the site. This hard ‘bedrock’ surface is a gravelly sandstone, showing noevidence of in situ disintegration. The ‘bedrock’ surface is aligned with the slope of the massive boulder at theentrance to the site (Fig. 4); it is therefore interpreted as a massive boulder surface rather than bedrock proper.SU3—the sediments immediately above this rock surface—appeared to be culturally sterile during the course of theexcavation. Strong Brown in Dry Munsell colour.
456 JOURNAL OF QUATERNARY SCIENCE
wiley.com/suppmat/0267-8179/suppmat/v22.html) for detailedresults). The Nonda Rock thin sections (see Fig. 5 for location ofsediment thin section samples) were most unusual in that therewas nothing in them which really could be called typical ofarchaeological sediments other than a moderate abundance ofcharcoal and/or carbonised plant tissue in the upper unit.Absolutely no food remains such as bone, shell, eggshell or thelike were evident microscopically; nor were other biogeniccarbonate fragments (such as land snail shells). It is possible thatthis is a result of preservational conditions given the universalsub-5.5 pH values. However, we do not favour a preservationalcause, as some sites on and at the base of Ngarrabullgan, insimilar geological contexts, do contain well-preserved bonessometimes in contexts older than 30 000 years old (David et al.,1997, 1998). In some Holocene sites on the mountain, macroplant remains, including carbonised and uncarbonised seedsand reasonably large amounts of paperbark lining earth ovens,have been found (David et al., 1998). Therefore we suggest thata total absence of archaeological traces other than charcoal,burnt earth, ochre and stone artefacts at Nonda Rock is at leastpartly due to other causes (see below).In reality the Nonda Rock thin sections could have been a
suite of sections from a regolith profile with no archaeologicalcontext. We interpret this lack of an archaeological context to
Copyright 2007 John Wiley & Sons, Ltd.
the sediments as strong support for conclusions made below,from other evidence, that the site was visited casually forreasons other than subsistence.
Also mostly lacking are small angular fragments of micro-crystalline silica rocks, which could be interpreted asmicroflakes lost in stone reduction. Some chert fragments existwhich could be thus interpreted, but we saw no rhyolite—animportant exotic stone artefact raw material in other archae-ological sites at Ngarrabullgan—in the thin sections. Again thisprobably supports the same conclusion—the site was not usedfor subsistence activities and little on-site stone reductionoccurred (see below and Supplementary Information).
While the sediments may have been archaeologically bleak,there were some interesting sedimentological features. Firstly,one intriguing 1–1.5 cm object in SU2a had a hollow centre inan inner core of crystalline quartz surrounded by complexlayers of opaline or chalcedonic silica. Some sort of microgeoidor agate of a kind we have never seen.
Secondly, the sediments have a low silt content, whichsuggests that very little of the sediment has been deposited inthe shelter from overbank sedimentation during extreme floodevents in the creek inundating the shelter.
Thirdly, boundaries between stratigraphic units were notobvious in thin section, even where sections were supposed to
J. Quaternary Sci., Vol. 22(5) 449–479 (2007)DOI: 10.1002/jqs

SEDIMENT MIXING AT NONDA ROCK 457
be straddling them. This supports the field descriptions ofgradational boundaries.Fourthly, and interestingly, sections of both local wasp nest
and termite material were fairly bland. They both consist of anabundance of sand clasts of the same sort as evident in theshelter sediments in a fairly structureless clay-rich matrix. Nospecific characteristics were seen in either that could be takenas diagnostic features, which would have enabled recognitionof them as specific components in the shelter sediments. Theonly exception was a definite increased abundance of ‘scruffy’amorphous iron/organic-rich material in the matrix of thetermite material—presumably detritus from termite chewingand digestion. But wherever there were specific matrix-richaggregates or nodules (presumably like the ‘mottles’ describedduring field notes as reminiscent of the colour of wasp ortermite nests in SU2b in Table 1), these always contained somepedogenic structure in the matrix and are thus reworkedintraclasts (i.e. clumps of reworked shelter sediment), not waspor termite material. Reworking of intraclast clumps ischaracteristic of archaeological sediments, but is much lessevident at Nonda Rock than is typical of archaeologicaldeposits. The greatest abundance of these occurred in the upperpart of SU2b in thin section 4.Fifthly, in the description of SU3 in Table 1, we made the
field observation that the rock underlying the base of the unit‘shows no sign of in situ disintegration’. But the same rockwhere it was exposed at the surface at the front of the shelterhad a very noticeable weathering patina. The apparent absenceof this same patination on the rock underneath the sheltersediments implies that deposition of the sediment started verysoon after the rock fell.
Table 2 Radiocarbon determinations, Nonda Rock. Where more than one rawas collected separately from that XU during excavation (i.e. the ages do notages are conventional radiocarbon determinations on bulk charcoal from th
Depth belowground surface (cm)
SU Square XU Radiocarbonage (years BP
0–3 1aþ1b E7 2 650509–11 2a E7 6 3420 4515 2a E7 8 8870 50
16–18 2a E7 9 7980 8028 2a E7 13 101706039 2aþ2b E7 17 113006044 2b E7 18 1803010047 2b E7 19 2240015050 2b E7 20 2230025058 2b E7 23 2255015059–66 2b E7 24 2166043069 2bþ 2c E7 25 2260015089–92 2c E6 38 2319035089–92 2c E6 38 2521040080 2bþ 2cþ3 E7 26c 2620045082–86 2cþ3 E7 27 25300 (þ195/289 2cþ3 E7 28 2330035088 2cþ3 E7 28 3170030092–96 2cþ3 E6 39 2730050090–95 2cþ3 E7 29 >5500098–100 2cþ3 E7 31 38200 140098–100 2cþ3 E7 31 51000 (þ2500/398–100 2cþ3 E7 31 >55000100–104 2cþ3 E7 32 50450 (þ2800/4100–104 2cþ3 E7 32 51700 (þ1450/1
Copyright 2007 John Wiley & Sons, Ltd.
The cultural sequence
The Nonda Rock excavations revealed in total 743 flaked stoneartefacts, two pieces of use-worn red ochre (with striations andbevelling), and 18 pieces of earth pigment without any signs ofuse-wear. All of the earth pigments are red except for one redand yellow piece and two small fragments of white pigment(probably kaolinite). The two pieces of ochre with use-striationsand bevelling come from a level between 32.7 and 39.4 cmbelow ground level, dated by the accelerator mass spectrom-etry (AMS) radiocarbon technique to between 11 300 60(OZD 875) and 10 170 60 years BP (OZD 874), and locatedat the very top of SU2b (see below for details of radiocarbonsequence). There are faded red paintings on the rock wallimmediately adjacent to the excavation squares, and onewould expect pieces of ochre relating to these paintings tooccur within the excavation, given the proximity of thepaintings to the excavation—such an association has beenrevealed in nearly all of the excavations so far undertaken in theregion (e.g. David, 2002). By association, and given a paucity ofevidence for much cultural activity at the site, we suggest thatthe rock paintings now visible at Nonda Rock probably date tobetween ca. 13 500 and 11 500 cal. yr BP (see Table 2 forcalibration details and Tables 3 and 4 for lists of excavatedcultural materials).The stone artefact, charcoal and burnt earth sedimentation
rates peak during the most recent cultural phase (as defined bythe spread of calibrated radiocarbon and optical ages), dated tothe last 3650 cal. yr BP (see Supplementary Information fordetails). The fact that the stone artefact, charcoal and burntearth deposition rates are similar in each of the two analysed
diocarbon age has been obtained in a given XU, each piece of charcoalrepresent sub-samples from the same piece of charcoal). The four Wk-e sieves; all others are AMS ages on single pieces of charcoal
)Laboratorynumber
Calibrationprobability (greatestprobability range)
Mean age(cal. years BP) (2 d)
Wk-6190 0.954 609 60Wk-6025 0.769 3650 88OZE-676 0.838 10018162
0.116 9805 50Wk-6792 0.954 8812 213OZD-874 0.858 11865313OZD-875 0.857 13297171OZE-677 0.954 21449685OZE-678 0.954 25950700OZD-876 0.954 25850700OZE-679 0.852 26350500Wk-7586 0.954 25 200 1250OZE-680 0.895 26350500ANUA-23608 0.954 26 950 1000ANUA-23617 0.954 29250900OZC-913 0.94 29650700
00) ANUA-15502 0.954 29150500OZC-914 0.941 27150900OZE-681 0.785 35750800ANUA-23614 0.954 31 200 1350ANUA-15503 ?OZD-877 0.954 41 950 1700
600) ANUA-12308 0.954 ?ANUA-13003 ?
350) ANUA-13408 0.756 50 450 5300800) ANUA-15504 0.922 ?
J. Quaternary Sci., Vol. 22(5) 449–479 (2007)DOI: 10.1002/jqs

Table 3 Details of excavation units, square E6
Excavation details
XU SU Mean Depth
Below Surface
at Top (cm)
Mean Depth
Below Surface
at Centre (cm)
Mean Depth
Below Surface
at Base (cm)
Mean
Thickness
of XU (cm)
Area
(m2)
Volume
(l)
Weight
(kg)
Weight
of >3mm
Non-Cultural
Sediments
(kg)
kg per
Litre
Compaction
(litres/m3)
pH Dry Munsell
1 1a 0.0 0.1 0.1 0.1 0.25 1.0 1.5 <0.5 1.5 4000 4.55 10YR4/1
2 1aþ 1b 0.1 0.8 1.4 1.3 0.25 3.0 4.0 0.5 1.3 900 4.91 10YR5/1
3 1b 1.4 2.4 3.4 2.0 0.25 4.0 6.0 0.5 1.5 800 5.38 10YR5/3
4 1bþ 2a 3.4 4.4 5.3 1.9 0.25 5.0 7.0 1.0 1.4 1100 5.39 10YR5/4
5 1bþ 2a 5.3 6.3 7.2 1.9 0.25 5.0 7.0 0.5 1.4 1100 5.57 10YR5/4
6 1bþ 2a 7.2 8.3 9.3 2.1 0.25 5.0 8.0 0.5 1.6 1000 5.33 10YR5/4-10YR6/4
7 2a 9.3 10.2 11.1 1.8 0.25 4.5 7.0 0.5 1.6 1000 5.39 10YR6/4
8 2a 11.1 12.2 13.3 2.2 0.25 5.0 7.5 0.5 1.5 900 5.25 10YR6/4
9 2a 13.3 14.5 15.7 2.4 0.25 5.0 7.0 0.5 1.4 800 5.18 10YR6/4
10 2a 15.7 16.8 17.8 2.1 0.25 ? ? 0.5 ? ? 5.15 10YR6/4
11 2a 17.8 18.9 19.9 2.1 0.25 10.0 16.5 6.5 1.7 1900 5.20 10YR6/4
12 2a 19.9 21.2 22.4 2.5 0.25 6.0 8.5 1.0 1.4 1000 5.18 10YR6/4
13 2a 22.4 23.7 25.0 2.6 0.25 5.0 8.0 1.0 1.6 800 5.10 10YR6/4
14 2a 25.0 26.1 27.2 2.2 0.25 7.0 11.0 3.0 1.6 1300 5.03 10YR6/4
15 2a 27.2 28.1 29.0 1.8 0.25 5.0 8.0 1.5 1.6 1100 5.12 10YR6/4
16 2a 29.0 31.1 33.2 4.2 0.25 9.0 13.5 2.5 1.5 900 5.06 10YR6/4
17 2a 33.2 34.4 35.5 2.3 0.25 7.5 11.0 2.5 1.5 1300 5.05 10YR6/4
18 2aþ 2b 35.5 36.5 37.5 2.0 0.25 6.0 9.5 2.5 1.6 1200 5.23 10YR6/4
19 2b 37.5 38.5 39.4 1.9 0.25 6.0 9.5 3.0 1.6 1300 5.20 10YR6/4
20 2b 39.4 40.6 41.8 2.4 0.25 7.0 9.5 3.0 1.4 1200 5.24 10YR6/4-7.5YR6/4
21 2b 41.8 43.0 44.2 2.4 0.25 7.0 11.5 4.0 1.6 1200 5.29 7.5YR6/4
22 2b 44.2 45.7 47.2 3.0 0.25 9.0 12.5 4.0 1.4 1200 5.33 7.5YR6/4
23 2b 47.2 48.5 49.7 2.5 0.25 8.0 12.0 3.0 1.5 1300 5.44 7.5YR6/4
24 2b 49.7 51.0 52.2 2.5 0.25 6.0 10.0 2.5 1.7 1000 5.35 7.5YR6/4
25 2b 52.2 52.8 53.4 1.2 0.25 2.0 4.0 1.0 2.0 700 5.32 7.5YR6/4
26 2b 53.4 54.9 56.3 2.9 0.25 9.0 11.0 6.5 1.2 1200 5.30 7.5YR6/4
27 2b 56.3 57.6 58.9 2.6 0.25 8.0 10.0 6.0 1.3 1200 5.58 7.5YR6/4-7.5YR5/6
28 2b 58.9 60.4 61.8 2.9 0.25 9.0 12.0 7.0 1.3 1200 5.37 7.5YR6/4-7.5YR5/6
29 2b 61.8 63.2 64.6 2.8 0.25 8.5 11.5 5.5 1.4 1200 5.35 7.5YR6/4-7.5YR5/6
30 2b 64.6 66.2 67.8 3.2 0.25 8.5 12.0 7.5 1.4 1100 5.42 7.5YR6/4-7.5YR5/6
31 2b 67.8 69.5 71.2 3.4 0.25 9.0 13.0 4.5 1.4 1100 5.37 7.5YR6/4-7.5YR5/6
32 2b 71.2 72.8 74.4 3.2 0.25 9.0 12.0 8.0 1.3 1100 5.33 7.5YR6/4-7.5YR5/6
33 2bþ 2c 74.4 76.0 77.5 3.1 0.25 9.5 14.0 8.5 1.5 1200 5.35 7.5YR6/4-7.5YR5/6
34 2c 77.5 79.0 80.5 3.0 0.25 8.0 11.0 6.5 1.4 1100 5.26 7.5YR6/4-7.5YR5/6
35 2c 80.5 82.0 83.5 3.0 0.25 6.0 11.0 8.5 1.8 800 5.23 7.5YR6/4-7.5YR5/6
36 2c 83.5 85.3 87.0 3.5 0.25 8.0 11.0 6.0 1.4 900 5.28 7.5YR6/4-7.5YR5/6
37 2c 87.0 88.1 89.1 2.1 0.25 6.0 9.0 5.5 1.5 1100 5.31 7.5YR6/4-7.5YR5/6
38 2c 89.1 90.6 92.1 3.0 0.25 7.0 9.0 5.5 1.3 900 5.19 7.5YR6/4-7.5YR5/6
39 2cþ 3 92.1 94.0 95.8 3.7 0.25 9.5 13.0 8.0 1.4 1000 5.25 7.5YR5/6
40 2cþ 3 95.8 97.2 98.6 2.8 0.25 7.0 11.0 6.5 1.6 1000 5.05 7.5YR5/6
41 2cþ 3 98.6 100.3 102.0 3.4 0.25 7.0 10.0 6.5 1.4 800 5.02 7.5YR5/6
42 2cþ 3 102.0 102.9 103.7 1.7 0.25 5.5 8.0 5.5 1.5 1300 4.95 7.5YR5/6
43 2cþ 3 103.7 105.6 107.4 3.7 0.21 7.0 10.0 7.5 1.4 900 4.88 7.5YR5/6
44 3 107.4 108.8 110.1 2.7 0.15 4.0 7.0 4.5 1.8 1000 4.82 7.5YR5/6
45 3 110.1 111.8 113.5 3.4 0.13 3.0 5.0 3.0 1.7 700 4.80 7.5YR5/6
46 3 113.5 115.0 116.5 3.0 0.07 1.5 2.0 1.5 1.3 700 4.79 7.5YR5/6
Copyright 2007 John Wiley & Sons, Ltd. J. Quaternary Sci., Vol. 22(5) 449–479 (2007)DOI: 10.1002/jqs
458 JOURNAL OF QUATERNARY SCIENCE

14C determinations Contents
14C age
(years BP)
Laboratory
number
Depth below
ground (cm)
Charcoal
(g)
Burnt
Earth (g)
Flaked
Artefacts (#)
Flaked
Artefacts (g)
Pigments Roots &
Leaf
Litter (g)
Rodent
Faeces (g)
Termite
Nest (g)
Red with
Use-Striations
& Bevelling (#)
Red with
Use-Striations
& Bevelling (g)
Red without
Use-Striations
or Bevelling (#)
Red without
Use-Striations
or Bevelling (g)
2.4 14.8 2 9.1 47.2 0.2 2.7
45.7 5.7 6 3.0 12.9 0.4 3.3
80.1 17.3 6 4.7 19.2 1.0 0.7
100.6 5.0 7 2.8 25.6 0.7 0.1
72.2 2.4 13 4.5 13.4 0.5 0.3
43.3 14 127.0 11.2 0.3 0.9
31.2 3 3.0 19.9 0.4 0.5
24.8 3.5 1 0.1 30.5 0.3 0.5
13.8 1 1.8 1 2.2 16.4 0.8
21.3 2 0.4 1.2 0.7
33.9 4 8.8 7.1 0.6
25.6 0.7 4 0.4 74.9
22.1 5 8.0 7.6 0.7
23.3 8 29.0 7.8 0.5
14.4 4 3.0 6.0 0.2
30.6 <0.1 12 11.6 19.9 0.1
17.3 4 2.5 4.0 <0.1 0.5
13.9 7 2.0 4 6.4 5.6 0.2 <0.1
7.7 3 73.3 1 12.0 4.7 0.1 <0.1
4.2 6 6.6 4.5 <0.1
2.0 12 17.6 2 3.1 4.6 <0.1
8.7 12 14.7 0.9
8.9 9 13.1 1.1 <0.1
7.4 22 22.2 0.7
2.8 7 0.6 0.2
14.2 9 2.2 2.4
14.7 17 7.2 1.1
14.7 9 5.7 0.7
13.0 4 0.3 1.0
7.8 15 7.0 1.0
2.9 7 12.5 1.2
3.1 8 8.5 1 0.7 0.3
5.9 10 10.0 0.7
1.8 5 9.6 0.8
0.9 1 0.2 0.6
1.4 2 3.3 3.0
0.6 10 10.7 1.0
23 190 350 ANUA-23608 89–92 1.6 3 2.9 0.4
25 210 400 ANUA-23617 89–92
27 300 500 ANUA-23614 92–96 0.8 1.6
0.7 1.8
1.0 1.6
0.9 2.2
2.6 11.3
0.7 23.6
0.1 22.9
11.7
Copyright 2007 John Wiley & Sons, Ltd. J. Quaternary Sci., Vol. 22(5) 449–479 (2007)DOI: 10.1002/jqs
SEDIMENT MIXING AT NONDA ROCK 459

Table 4 Details of excavation units, square E7
Excavation Details Age determinations
XU SU Mean
Depth
Below
Surface at
Top (cm)
Mean
Depth
Below
Surface at
Centre (cm)
Mean
Depth
Below
Surface at
Base (cm)
Mean
Thickness
of XU (cm)
Area
(m2)
Volume
(l)
Weight
(kg)
Weight
of >3mm
Non-Cultural
Sediments (g)
kg per
Litre
Compaction
(litres/m3)
14C age
(years BP)
Laboratory
number
Depth
below
ground
surface (cm)
1 1a 0.0 0.2 0.3 0.3 0.25 0.5 0.5 105 1.0 700
2 1aþ 1b 0.3 1.5 2.6 2.3 0.25 5.0 6.5 627 1.3 900 65050 Wk-6190 0–3
3 1aþ 1bþ 2a 2.6 3.5 4.4 1.8 0.25 5.0 7.0 574 1.4 1100
4 1bþ 2a 4.4 5.5 6.6 2.2 0.25 5.0 7.5 588 1.5 900
5 1bþ 2a 6.6 7.9 9.1 2.5 0.25 6.5 9.0 690 1.4 1000
6 2a 9.1 10.2 11.3 2.2 0.25 5.5 8.5 570 1.5 1000 3420 45 Wk-6025 9–11
7 2a 11.3 12.4 13.5 2.2 0.25 6.0 9.5 528 1.6 1100
8 2a 13.5 14.9 16.3 2.8 0.25 6.0 9.5 470 1.6 900 8870 50 OZE-676 15
9 2a 16.3 17.4 18.4 2.1 0.25 6.0 9.0 545 1.5 1100 7980 80 Wk-6792 16–18
10 2a 18.4 20.0 21.6 3.2 0.25 8.5 12.0 923 1.4 1100
11 2a 21.6 23.1 24.5 2.9 0.25 7.0 10.5 1585 1.5 1000
12 2a 24.5 25.8 27.0 2.5 0.25 8.0 12.0 1810 1.5 1300
13 2a 27.0 28.4 29.7 2.7 0.25 8.0 12.5 2050 1.6 1200 10170 60 OZD-874 28
14 2a 29.7 31.2 32.7 3.0 0.25 8.5 13.5 2234 1.6 1100
15 2aþ 2b 32.7 34.2 35.6 2.9 0.25 9.0 12.5 3103 1.4 1200
16 2aþ 2b 35.6 36.8 37.9 2.3 0.25 7.5 11.0 2187 1.5 1300
17 2aþ 2b 37.9 39.7 41.4 3.5 0.25 9.5 13.5 3060 1.4 1100 11300 60 OZD-875 39
18 2b 41.4 42.9 44.4 3.0 0.25 9.0 14.0 3203 1.6 1200 18030100 OZE-677 44
19 2b 44.4 46.1 47.8 3.4 0.25 9.0 14.0 4250 1.6 1100 22400150 OZE-678 47
20 2b 47.8 49.9 52.0 4.2 0.25 12.5 20.0 6064 1.6 1200 22300250 OZD-876 50
21 2b 52.0 52.8 53.5 1.5 0.25 5.0 8.5 2479 1.7 1300
22 2b 53.5 55.3 57.0 3.5 0.25 8.0 13.0 3105 1.6 900
23 2b 57.0 58.2 59.4 2.4 0.25 10.5 16.0 4543 1.5 1800 22550150 OZE-679 58
24 2b 59.4 62.7 65.9 6.5 0.24 15.0 21.5 5972 1.4 1000 21660430 Wk-7586 59–66
25 2bþ 2c 65.9 67.6 69.2 3.3 0.25 9.0 14.0 3260 1.6 1100 22600150 OZE-680 69
26a 2cþ 3 69.2 72.7 76.1 6.9 0.12 8.5 14.0 3501 1.6 1000
26b 2bþ 2c 74.3 76.2 78.1 3.8 0.24 11.0 19.0 3910 1.7 1200
26c 2bþ 2cþ 3 78.1 80.2 82.3 4.2 0.24 9.0 15.5 3033 1.7 900 26 200450 OZC-913 80
27 2cþ 3 82.3 84.1 85.8 3.5 0.25 9.0 15.0 4306 1.7 1000 25300 (þ195/200) ANUA-15502 82–86
28 2cþ 3 85.8 87.7 89.6 3.8 0.25 8.0 13.5 5216 1.7 800 23 300350 OZC-914 89
31700300 OZE-681 88
29 2cþ 3 89.6 92.2 94.7 5.1 0.25 11.0 18.0 6966 1.6 900 >55000 ANUA-15503 90–95
30 2cþ 3 94.7 96.2 97.6 2.9 0.25 5.5 10.0 3993 1.8 800
31 2cþ 3 97.6 98.7 99.8 2.2 0.23 4.0 8.0 3675 2.0 800 38 200 1400 OZD-877 98–100
51000 (þ2500/3600) ANUA-12308 98–100
>55000 ANUA-13003 98–100
32 2cþ 3 99.8 102.1 104.4 4.6 0.14 3.5 6.5 2890 1.9 500 50 450 (þ2800/4350) ANUA-13408 100–104
51700 (þ1450/1800) ANUA-15504 100–104
Copyright 2007 John Wiley & Sons, Ltd. J. Quaternary Sci., Vol. 22(5) 449–479 (2007)DOI: 10.1002/jqs
460 JOURNAL OF QUATERNARY SCIENCE

Contents
Charcoal
(g)
Burnt
Earth (g)
Flaked
Artefacts (#)
Flaked
Artefacts (g)
Red
Ochre with
Use-Striations
& Bevelling (#)
Red
Ochre with
Use-Striations
& Bevelling (g)
Red
Ochre without
Use-Striations
or Bevelling (#)
Red Ochre
without
Use-Striations
or Bevelling (g)
White
Pigment
without
Use-Striations
or Bevelling (#)
White
Pigment
without
Use-Striations
or Bevelling (g)
Roots &
Leaf
Litter (g)
Rodent
Faeces (g)
Termite
Nest (g)
7.7 40.3 2 0.8 7.1 1.7
52.6 5.6 13 20.6 8.6 3.3
61.7 13.9 14 13.4 12.1 0.1 1.1
61.3 36 9.9 12.1 <0.1 1.0
50.9 12 8.8 8.6 0.1 0.7
27.8 12 14.1 16.5 0.1 0.9
23.5 6 31.6 20.1 <0.1 0.3
27.7 0.1 7 1.9 4.0 <0.1 1.1
19.8 4 0.1 7.6 <0.1 0.7
31.0 2 0.8 6.9 1.9
24.9 3 3.1 23.5 0.2 0.5
33.8 5 10.5 4.5 0.1 0.5
27.1 3 1.0 1 0.4 4.3 0.4 0.7
24.8 6 2.1 2.8 0.3
26.9 11 53.4 1 2.2 7.0 0.4
24.7 15.9 4 0.8 0.6
24.5 19 20.0 1.5
22.3 22 5.5 1.2 3.7
8.2 18 69.4 1.7 0.3
16.3 21 16.7 1.7 0.4
7.3 4 0.6 0.5
11.2 7 10.4 0.3 0.4
9.1 17 48.6 1.1 1.1
16.1 28 37.2 3.6 0.4
9.9 17 10.2 1 2.9 5 56.9 3.4 0.2
6.2 13 6.9 1.4
12.7 13 7.4 2 37.7 1.8
2.6 8 9.7 0.4
0.6 8 5.0 1.9 0.2
0.8 1 0.1 1 0.1 1.7
0.2 6.4 1.9
1.5 2.5
0.4 0.8
0.8 2.5
Copyright 2007 John Wiley & Sons, Ltd. J. Quaternary Sci., Vol. 22(5) 449–479 (2007)DOI: 10.1002/jqs
SEDIMENT MIXING AT NONDA ROCK 461

462 JOURNAL OF QUATERNARY SCIENCE
squares (E6 and E7), and that therefore the trends for the variousitems are similar in each square, indicates that they can withgood likelihood be interpreted as representative of historicaltrends for this small site. Understanding these patternsmotivated a more detailed examination of stone artefactreduction strategies.Analyses of the stone artefacts (see Supplementary Infor-
mation for details) suggest that a major technologicalreorganisation took place during the late Holocene in responseto new settlement patterns, specifically a relatively low-intensity use of the mountaintop between ca. 40 000 and3650 years ago, followed by higher-intensity (more frequent?)use thereafter (these late Holocene increases may be in theorder of three- to six-fold, if stone artefact deposition rates areany indication). By then, however, visitors to the mountaincame with their toolkits made largely from raw materials foundand already flaked off the mountain; while no formal tool typeswere recovered from the excavations, during the last 3650years there was an increase in proportions of retouched flakesmade from local sources such as chert, although such artefactsmade of local raw materials are not particularly abundantduring this time. It is unlikely that visitors to Nonda Rock stayedmore than a few days on the mountain, given a lack of meatfoods there, and a predominance of poorly curated stone toolsobtained off the mountain both at this site and at other sites onthe plateau (Mialanes, 2005).
Dating the site
For Nonda Rock, we have obtained 25 radiocarbon determi-nations on charcoal, and quartz grains from three sedimentsamples were analysed using OSL techniques. Twenty-one ofthe radiocarbon ages are AMS determinations on single piecesof charcoal; the remaining four are conventional ages on bulkcharcoal recovered from the sieves (Table 2). While our aimwas to date the entire cultural sequence, we paid particularattention to the age of earliest cultural deposits, represented byXU38 in square E6, and by XU28 in square E7.
Figure 7 Calibrated radiocarbon ages, and inferred depth–age curve
Copyright 2007 John Wiley & Sons, Ltd.
AMS radiocarbon dating
Radiocarbon dating was undertaken on hand-picked charcoalfragments that were first prepared using either the standard ABA(acid–base–acid) or ABOX (acid–base–wet oxidation) pro-cedures. ABA samples were bulk combusted, graphitised andmeasured by AMS at ANSTO, or by liquid scintillationspectrometry at the Waikato laboratory (OZ- and Wk-seriesof ages, respectively, in Table 2). ABOX involves the sequentialpretreatment of samples with HCl, HF, and NaOH followed bya K2Cr2O7/H2SO4 oxidation at 608C for up to 14 h (Bird et al.,1999). The remaining material was step-combusted at 330,650, and 850 or 9208C in a vacuum line insulated fromatmospheric contamination by a secondary backing vacuum.Graphite targets were produced from the CO2 at eachtemperature step, and samples from the 650 and 850/9208Csteps were measured using the 14UD AMS facility at theAustralian National University. Previous results indicate that, atmost sites, contamination can beminimised to levels close to orbeyond the background of the ANU AMS facility (ca. 55 000years BP) at the 3308C combustion step, permitting a highdegree of confidence to be placed in the final ABOXstep-combustion (ABOX-SC) ages (Turney et al., 2001). Forpurposes of constructing a depth–age curve (Fig. 7), and forcomparisons with the optical ages, the radiocarbon determi-nations were calibrated with INTCAL98 and Calib 4.4 (http://depts.washington.edu/qil/calib/) for ages of 18 000 years BPand less, while the older ages were calibrated using thecalibration curve published by Hughen et al. (2004), importingthe Cariaco data into the OxCal calibration program (http://c14.arch.ox.ac.uk/oxcal/OxCalPlot.html). We have used theprobability method (rather than the intercept method) for bothsets of ages. As a conservative measure, we have estimated theerror ranges at two standard deviations and plotted the highestprobability values obtained (Table 2).
The Nonda Rock radiocarbon ages closely match the majorstratigraphic breaks. The lowest XUs, devoid of culturalmaterials, are compact and consolidated sandy gravels withsignificant clay and silt contents, and are associated withradiocarbon determinations older than 50 450þ2800/4350
J. Quaternary Sci., Vol. 22(5) 449–479 (2007)DOI: 10.1002/jqs

SEDIMENT MIXING AT NONDA ROCK 463
years BP. The five oldest AMS samples, eachwith amean age of50 000 years BP or older, were pretreated with the ABOXtechnique that had been explicitly devised to minimisecontamination of ‘old’ charcoal samples by more moderncarbon. By contrast, the AMS sample dated to 38 200 1400years BP (OZD-877), from near the SU2C-SU3 boundary, waspretreated using standard ABA chemistry; we reject this latterage because of the problematic nature of ABA chemistry forsuch old samples, and suggest that SU3 pre-dates 50 000 yearsBP. We also treat all of the finite radiocarbon ages >50 000years BP with caution and as minimum ages, for two reasons:firstly, >55 000 years BP radiocarbon ages are also found inthose same stratigraphic contexts; and secondly, such deter-minations lie at the limits of reliable 14C dating, even withABOX pretreatment, so that the smallest amount of residualcontamination will significantly affect the radiocarbon resultsfrom such samples.The base of SU2 is radiocarbon-dated to around 32 000 years
BP (31 700 300 years BP [OZE-681]) and contains theearliest evidence of human occupation at this site. Animplication of the radiocarbon chronostratigraphy is thatsediments are mostly or entirely missing for the period from>50 000 to 32000 years BP. Cultural materials are absentfrom the lowest sediments—the SU3 sediments beginningbefore 55 000 years BP and ending around 36 000 cal. yr BP(32 000 years BP)—but are present from ca. 36 000 cal. yr BPonwards. A possible explanation for this absence of sedimentsbetween>50 000 and 36 000 cal. yr BP is that this was a periodof erosion.However, such an explanation does not sit comfortably with
the geomorphological evidence. Firstly, there is absolutely nomicromorphological or macroscopic evidence for erosion ofthe shelter sediments. There is no sharp erosional break abovethe pre-50 000-year-old sediments, and no evidence of floodsubmergence of the pre-50 000-year-old sediments (such asgraded silt and clay deposition in voids seen elsewhere influvial sediments). Secondly, based on the location andgeomorphic setting of the shelter, if high floods did reach thatlevel, we would expect to see deposition of overbank fines—equivalent to slackwater deposits—rather than scour. Thirdly,there is no reason to expect the period from >50 000 to 36 000years ago in this part of Cape York to have been extremely wet.The Willandra Lakes and Riverine Plain regions of southernAustralia were wet during Marine Isotope Stage 3, between60 000 and 43 000 years ago (Bowler et al., 2003), but thispossibly represents enhanced winter westerly precipitationbecause monsoon records (from Lake Woods, Lake Eyre andriver basins draining into Lake Eyre) show only very modestenhancement from 50000 to 30 000 years ago. Vegetation atLynch’s Crater, situated in the highlands to the immediatesoutheast of Ngarrabullgan, indicates that there was morerainfall than just before or during the LGM (e.g. Kershaw, 1986),but this was unlikely to be a major wet phase. The latter isespecially true for the western slopes of the Great DividingRange, which are more remote from rainfall affected byconvergence.A more likely explanation for the apparent lack of sediments
at Nonda Rock between >50 000 and ca. 36 000 years ago isthat minor initial sedimentation occurred at the excavation site(possibly after the initial fall of the big boulder), followed bylittle or no sedimentation at the site until people began toconsistently occupy the rockshelter around 36 000 years ago.Then, as is typical of occupation shelters, the sedimentationrate increased as site and regional occupational intensitiesincreased.The implications of this scenario, coupled with an absence of
cultural materials in the oldest, pre-50 000 cal. yr BP sediments
Copyright 2007 John Wiley & Sons, Ltd.
but their sustained presence from 36000 cal. yr BP onwards,are that:
1 p
eople probably did not frequent the area around NondaRock during the earliest sedimentary phase, dated throughradiocarbon to some unknown time before 50 000 cal. yr BP,but2 p
eople were in the area by 36 000 cal. yr BP.We will now turn to optical dating of quartz grains to furtherexplore the chronostratigraphic sequence at Nonda Rock andto better define the age of the pre-50,000 year-old sediments –and, thus, obtain a maximum possible age for the presence ofpeople at this site.
Optical dating
Methods.Optical dating provides an estimate of the time elapsed sinceluminescent minerals, such as quartz and feldspar, were lastexposed to heat or sunlight (Huntley et al., 1985; Aitken, 1998;Lian and Roberts, 2006). In this study, the application is tonaturally deposited sediments, so the event being dated is thelast time that grains of sand-sized quartz were bleached bysunlight. Buried grains will accumulate the effects of thenuclear radiation flux to which they are exposed, and the burialdose (‘palaeodose’, using the terminology of Aitken (1998)) canbe measured using the OSL signal. Optical ages werecalculated from the palaeodose divided by the ‘dose rate’,which is the rate of supply of ionising radiation to the sampleover the period of burial.We extracted and prepared quartz grains of 90–125 and
180–212mm diameter from samples NR5a, NR5b and NR6under dim red illumination using standard procedures,including etching by HF acid to remove the externalalpha-dosed layer and feldspars (Aitken, 1998). Grains of90–125mm in diameter were mounted on stainless-steel disks,using silicone oil spray as adhesive, to create ‘large’ aliquots(800 grains per disk) or ‘small’ aliquots (80 grains per disk).Grains of 180–212mm in diameter were loaded ontoaluminium disks that were drilled with a 10 10 array ofchambers, each 300mm in depth and 300mm in diameter, sothat each chamber contained only one grain. In all cases,palaeodoses were estimated using the modified single-aliquotregenerative-dose (SAR) protocol of Olley et al. (2004a) and thestatistical models (common age, central age, minimum age andfinite-mixture models) described elsewhere (Galbraith et al.,1999; Roberts et al., 2000).As regards experimental conditions, multi-grain aliquots
were stimulated using8mW cm2 of blue (470 30 nm) lightfor 100 s at 1258C. This form of optical stimulation is known as‘continuous wave’ (CW), because the illumination intensity iskept constant, and gives rise to the gradual decay of OSL signalwith increasing stimulation time (Fig. 8). By contrast, singlegrains were stimulated using a focused 10mW green (532nm)laser for 30 s at 1258C, with the power being steadily (linearly)increased from 0 to 90% over the period of stimulation. Thelatter technique is referred to as ‘linear modulation’ (LM), andthe resulting peaks in the LM-OSL signal can be related to thedifferent components of quartz OSL: the latter include ‘fast’,‘medium’ and several ‘slow’ components, although not all ofthem are present in all samples or single grains (Fig. 9). Thenames of these components reflect their sensitivity to opticalstimulation, so that the fast component is observed first in theLM-OSL signal, followed by the less light-sensitive com-
J. Quaternary Sci., Vol. 22(5) 449–479 (2007)DOI: 10.1002/jqs

Figure 8 ‘Continuous wave’ optically stimulated luminescence (CW-OSL) signals for a small aliquot (80 quartz grains) of sample NR5a stimulatedby blue light. In themain plot, the solid line shows the decay of the natural signal, while the signal induced by a regenerative dose of 30Gy is plotted asa dashed line. Note the rapid decay to background over the first 20 s of stimulation. The lower inset plot shows the first 40 s of decay of the natural signal(using a log scale for the y-axis), together with the exponential decays of the separated ‘fast’, ‘medium’ and ‘slow’ components ( f, m and s,respectively); the sum of these fitted components is denoted by the smooth curve superimposed on the measured OSL. The upper inset plot shows thedose-response curve for this aliquot, from which a palaleodose of 56.31.5Gy is obtained by interpolation of the natural signal (shown as an opencircle on the y-axis). A repeat dose of 60Gy was given to this aliquot at the start and end of the experiment: the resulting ‘recycling ratio’ of 1.020.02is consistent with a value of unity, which indicates that the test-dose sensitivity correction procedure has performed well on this aliquot. Also, the OSLsignal measured at zero applied dose is a small fraction (1.2%) of the natural OSL intensity, indicating that the extent of preheat-induced thermaltransfer is insignificant in this aliquot
464 JOURNAL OF QUATERNARY SCIENCE
ponents. The same components occur (in the same order) in theCW-OSL decay curve, but they are less visually apparent andmathematical procedures are needed to separate them (Fig. 8).The thermal treatment (‘preheat’) given to the natural and
regenerative doses before optical stimulation was chosen onthe basis of ‘preheat plateau’ and ‘dose recovery’ tests(described below), and the test doses (which are used tocorrect for any sensitivity changes) were heated to 1608C, butnot held at this temperature (hence the term ‘cut-heat’), beforeoptical stimulation. In addition, the blue and green stimulationswere immediately preceded by an infrared bleach of 100 s at1258C to minimise the contribution to the OSL from anyinfrared-sensitive minerals (e.g. feldspars) internal to the quartzgrains (Olley et al., 2004a). The ultraviolet OSL emissions weredetected using an Electron Tubes Ltd 9235QA photomultipliertube fitted with 7.5mm of Hoya U-340 filter, and laboratorydoses were given using a calibrated 90Sr/90Y beta source.For the multi-grain aliquots, palaeodoses were estimated
from the first 3 s of CW-OSL to maximise the contribution fromthe most easily bleached (fast) component, using the count rateover the final 30 s as background. For single grains, the LM-OSLcounts for the fast- and slow-dominated components wereobtained from the initial 5 s and final 5 s of signal, respectively,and the background counts were estimated for the same timeintervals from a second laser stimulation following eachLM-OSLmeasurement (Yoshida et al., 2003; Olley et al., 2006).A conservative uncertainty of 3.5% was added (in quadrature)to each LM-OSL measurement error to reflect the reproduci-bility with which the laser beam can be positioned (Truscottet al., 2000). Dose-response curves were fitted to the back-ground- and sensitivity-corrected CW-OSL and LM-OSL datausing a saturating-exponential-plus-linear function, with thestandard error on the palaeodose determined by Monte Carlo
Copyright 2007 John Wiley & Sons, Ltd.
simulation (Yoshida et al., 2003). Examples of multi-grainaliquot and single-grain dose-response curves are shown inFigs 8 and 9, respectively.
The total dose rates were calculated as the sum of thebeta-particle and gamma-ray dose rates due to238U, 235U, 232Th (and their decay products) and40K. Measurements were made on dried and powderedsamples (150 g mass) by high-resolution gamma-ray spec-trometry, using the same equipment and calibration standardsas Olley et al. (1996, 1997). The radionuclide activities wereconverted to dose rates, using the conversion factors given inAdamiec and Aitken (1998) and Stokes et al. (2003), andallowance was made for beta-dose attenuation (Mejdahl, 1979)and sample water content (Aitken, 1985). In view of thesheltered location of the deposit, we consider the present-daymeasured water contents of 4.6–5.1% (Table 5) to berepresentative of the average for the entire period of sampleburial, and accordingly used a value of 5 1% for all threesamples; the total dose rates will decrease (and the optical ageswill increase) by 1% for each 1% increase in water content.Account was also taken of the cosmic-ray contribution,adjusted for site altitude, geomagnetic latitude, thickness andwater content of overlying sediment, and density, thicknessand geometry of sandstone shielding (Readhead, 1987; Prescottand Hutton, 1994). A value of 0.03 0.01mGy per year wasincluded in the total dose rate for the effective internalalpha-particle contribution, based on measurements made onquartz grains from southeastern Australia (Bowler et al., 2003).
Results.Dose rates. For all three samples, a condition of secularequilibrium currently exists in the 232Th decay series(represented by 228Ra and 228Th in Table 5), and the
J. Quaternary Sci., Vol. 22(5) 449–479 (2007)DOI: 10.1002/jqs

Figure 9 ‘Linearly modulated’ optically stimulated luminescence (LM-OSL) signals for a single grain of quartz from sample NR5a stimulated by greenlight. The solid line in the main figure shows the natural LM-OSL signal, and the dashed line is the instrument background measured immediatelyafterwards. The prominent peak corresponds to the ‘fast’ component of quartz OSL, but there is also a small ‘slow’ component signal distinguishableabove background at longer stimulation times. The palaeodoses for the fast and slow components were estimated from the initial 5 s and final 5 s ofsignal, respectively, and the corresponding dose-response curves are plotted below the main figure (where the open circles on the y-axis denote thenatural signals). Both components passed the SAR criteria for acceptable protocol performance and yielded concordant palaeodoses (fast: 374Gy;slow: 35 9Gy). This ‘dual signal’ grain is one of only nine of the 900 grains analysed in this study that contained fast and slow components with thesame palaeodose. The inset plot in the main figure shows the natural LM-OSL signal (solid line) and instrument background (dashed line) for a grainfrom sample NR5a with a larger relative amount of ‘medium’ component. This grain, and others like it, did not satisfy the SAR acceptance criteria andwere excluded from further consideration
SEDIMENT MIXING AT NONDA ROCK 465
238U decay series (represented by 238U, 226Ra and 210Pb) showsonly slight evidence for disequilibrium, with 210Pb/226Ra ratiosof 0.79–0.91; the latter are consistent with 9–21% loss of radon(222Rn) gas to atmosphere. Similar findings have been reportedfor other archaeological deposits in Australia (Roberts et al.,1990, 1994, 1996, 1998a; David et al., 1997; Olley et al.,1997; Turney et al., 2001). To calculate the optical ages, weassumed that the measured radionuclide activities haveprevailed throughout the period of sample burial.Two further remarks should be made about the radionuclide
data. First, the samples are separated vertically by up to 10 cmbut all three have very similar radionuclide activities and totaldose rates, which suggests that this part of the deposit isradioactively homogeneous at the scale of several centimetres.The uranium and thorium decay series contribute about 32%and 41%, respectively, to the total dose rates, with theremainder being contributed by potassium (16%), cosmic rays(9%) and radioactive inclusions internal to the quartz grains(3%).
Copyright 2007 John Wiley & Sons, Ltd.
Second, we cannot be certain about the homogeneity of thebeta dose rate to individual grains, for which the relevant spatialscale is a fewmillimetres. Beta particles can travel up to2mmthrough sedimentary deposits, so a quartz grain coated inmaterial of low radioactivity (e.g. carbonate) will experience amuch lower beta dose rate than one surrounded by silts andclays (which are comparatively high in radioactivity) or onesituated next to radioactive minerals, such as zircon andpotassium feldspar (Murray and Roberts, 1997; Olley et al.,1997; Nathan et al., 2003; Mayya et al., 2006). By contrast, thegamma dose rate is effectively uniform for all grains in asample, because gamma rays can penetrate up to 30 cmthrough most soils and sediments.To calculate the single-grain optical ages in this study, we
have estimated the palaeodoses for individual grains and thendivided these values by themean dose rate for the bulk samples,rather than use the true dose rate specific to each grain (which isimpracticable to measure). We might expect, therefore, thatsome of the observed spread in the palaeodoses and ages
J. Quaternary Sci., Vol. 22(5) 449–479 (2007)DOI: 10.1002/jqs

Tab
le5
Dose
rate
data,
palaeodosesan
doptica
lag
esforsedim
entsamplesfrom
NondaRock
Number
of
grainsper
aliquot
Grain
diameter
(mm)
Rad
ionuclideac
tivities
a(Bqkg
1)
Totaldose
rate
b,c
(Gyka
1)
Palaeodose
d(G
y)No.of
aliquots
orgrains,
and
proportion(%
)e
sbf(%
)Optical
ageb
(ka)
238U
226Ra
210Pb
228Ra
228Th
40K
Sample
NR5a
800
90–1
25
20.11.7
23.6
0.3
18.6
2.1
29.80.8
27.70.5
57.72.3
1.120.05
733
(73)
10/12
75
654
80
90–1
25
1.120.05
673
(67)
16/24
173
604
1180–2
12
1.090.05
444
Fast
47/300
426
414
203
F1136
19W2
433
F26512
40W3
769
F32211
70W9
1180–2
12
1.090.05
327
Slow
15/300
6616
306
102
S12312
102
455
S27712
415
Sample
NR5b
80
90–1
25
22.31.9
23.8
0.3
21.7
2.4
30.50.8
28.60.5
56.22.3
1.180.05
784
(77)
11/24
174
665
1180–2
12
1.150.05
584
Fast
44/300
366
504
365
F13112
31W4
735
F26912
64W5
1180–2
12
1.150.05
7510
Slow
17/300
4411
659
255
S11710
225
927
S28310
807
Sample
NR6
800
90–1
25
23.31.9
23.7
0.3
21.1
2.3
29.30.7
28.90.5
63.82.6
1.190.05
573
(54)
9/12
105
483
80
90–1
25
1.190.05
545
(55)
9/24
266
465
1180–2
12
1.170.05
423
Fast
60/300
526
363
232
F1308
20W2
465
F24412
39W4
789
F32612
67W8
1180–2
12
1.170.05
607
Slow
16/300
2712
516
588
S1100
507
aMeasuremen
tsmad
eondried
andpowdered
samplesbyhigh-resolutionga
mma-rayspectrometry.D
rydose
ratesca
lculatedfrom
theseac
tivities
weread
justed
forawater
contento
f51%
(exp
ressed
aspercentage
of
dry
massofsample),whichreflec
tsthemea
sured(field)water
contentsof4.6%
(NR5a),4.9%
(NR5b)an
d5.1%
(NR6).
bMea
ntotalunce
rtainty
(68%
confiden
ceinterval),ca
lculatedas
thequad
raticsum
oftherandom
andsystem
atic
unce
rtainties.Theag
esshownin
bold
typeareco
nsidered
themostreliab
leestimates.1ka
¼1000
calendar
years.
cIncludes
cosm
ic-ray
dose
rate
of0.100.01Gyka
1an
dan
assumed
internal
alphadose
rate
of0.030.01Gyka
1.
dW
eigh
tedmea
nrandom
unce
rtainty(68%
confiden
ceinterval),estimated
usingthece
ntralag
emodel(G
albraithetal.,1999)o
rthefinitemixture
model(Robertsetal.,2000).Thetotalu
nce
rtaintyincludes
asystem
atic
componen
tof
2%
associated
withlaboratory
beta-sourceca
libration.T
hemed
ianpalae
odose
isshownin
paren
theses
forthemulti-grainaliquots.‘Fa
st’and‘Slow’d
enotethece
ntralag
emodelestimates
ofp
alaeodose
obtained
from
thefast-an
dslow-dominated
OSL
componen
tsofthesingle-graindatasets,respec
tive
ly.T
helatter
werealso
fitted
usingthefinitemixture
model
toestimatethenumber
ofd
ose
populationspresentinea
chsample,an
dtheirrelative
proportions.
Thenumbersassign
edto
thefast(F)an
dslow
(S)co
mponen
tsarein
rankorder
from
smallest
tolargestpalaeodose.
eNumber
ofm
ulti-grainaliquotsorindividual
grainsusedforpalaeodose
determination/totaln
umber
ofa
liquotsorgrainsan
alysed
,andrelative
proportionofg
rainsin
each
Fan
dSdose
population(shownin
italics).
fRelativestan
darddev
iation(ove
rdispersion)o
fthepalaeodose
distributionafterallowingformea
suremen
tunce
rtainties,d
enotedas
sb(followingGalbraithet
al.,2005).Anoverdispersionva
lueof1
5%
was
usedin
the
finitemixture
model
toestimatethenumber
ofFan
dSdose
populations,theco
rrespondingpalaeodosesan
dtherelative
proportionofgrainsin
each
population.
Copyright 2007 John Wiley & Sons, Ltd. J. Quaternary Sci., Vol. 22(5) 449–479 (2007)DOI: 10.1002/jqs
466 JOURNAL OF QUATERNARY SCIENCE

SEDIMENT MIXING AT NONDA ROCK 467
obtained from single grains will be due to beta-dose variations,and not necessarily to other factors such as partial bleaching,post-depositional mixing, or measurement error.
Protocol validation test. We began by conducting a ‘preheatplateau’ test on six natural aliquots of sample NR6 composed of800 quartz grains of 90–125mm diameter and preheats of1608C or 2808C for 10 s (both with a test-dose cut-heat of1608C). This test revealed no significant difference in measuredpalaeodose for the two preheats (1608C: 57 3Gy; 2808C:60 7Gy). We then carried out ‘dose recovery’ tests using sixsmall (80 grain) aliquots of each of the three samples. Aliquotswere bleached by blue light for 250 s at room temperaturebefore any SAR measurements were made, and then given abeta dose of 60Gy (i.e. comparable to the palaeodosemeasured for sample NR6 in the preheat plateau test). This‘surrogate natural’ dose was then measured using a preheat of2408C for 10 s and a test-dose cut-heat of 1608C. We rejectedthe few aliquots (one per sample) that failed the SAR criteria foracceptable protocol performance; the latter being defined asthermally-transferred signals <5% of the natural OSL at zeroapplied dose, and ‘recycling ratios’ for duplicate regenerativedoses consistent with unity at the 95% confidence interval.Correct dose estimates were obtained for all three samples, withratios of 0.97 0.04 (NR5a), 1.04 0.05 (NR5b) and0.99 0.02 (NR6) for the measured/given doses. Given thisfavourable outcome, we used these measurement conditionsfor all subsequent experiments.
Multi-grain palaeodose distributions. We next measured 12large (800 grain) natural aliquots of samples NR5a and NR6,and used the central age model (Galbraith et al., 1999) tocalculate the weighted mean palaeodoses from all aliquots thatmet our acceptance criteria (Table 5). The palaeodosedistributions are displayed as radial plots in Fig. 10, and therelative spread in palaeodose remaining after taking measure-
Figure 10 Radial plots (Galbraith et al., 1999) of the palaeodoses obtained frThe measured palaeodose (in Gy) for any aliquot can be read by tracing a lineaxis (log scale) on the right-hand side. The corresponding standard error for thx-axis. The latter has two scales: the relative standard error of the palaeodose (with the highest precisions and the smallest relative errors plot closest to the rafurthest to the left. For each sample, the shaded band extends2 units on the ythe central age model (see Table 5). This band should capture 95% of the pacases, only a single estimate falls outside the band, so the radial plots provaccounted for solely on the basis of measurement uncertainties. Numerical co10 5% (NR6), which fall within the range reported for several other well-ble
Copyright 2007 John Wiley & Sons, Ltd.
ment uncertainties into account (the ‘overdispersion’, sb) wasestimated using the central age model. The values of 7 5%(NR5a) and 10 5% (NR6) are consistent with zero over-dispersion at the 95% confidence interval. Even at the upperbounds of this interval, both values fall in the range (0–20%)reported previously for multi-grain aliquots and single grains ofnatural quartz that had been fully bleached in the field (or in thelaboratory) and not mixed with older or younger grains duringthe period of burial (e.g. Roberts et al., 1998b, 2000; Jacobset al., 2003a, 2003b, 2006; Olley et al., 2004b, 2006; Galbraithet al., 2005; Anderson et al., 2006; Feathers et al., 2006b; Lianand Roberts, 2006; Prideaux et al., 2007).These data could be interpreted as indicating that the quartz
grains had been well-bleached at the time of deposition andremained undisturbed thereafter. But it has previously beenshown (Olley et al., 1999) that major differences in burial dosebetween grains in the same sample, arising from factors such asincomplete bleaching before burial or sediment mixing afterburial, are apt to be concealed using large aliquots, becauseany grain-to-grain differences will be averaged out on aliquotscomposed of800 grains. Much smaller aliquots, composed offewer than 100 grains, are needed to discern any underlyingstructure in palaeodose distributions, with single-grain analysisbeing the surest means—and sometimes the only means—ofidentifying and addressing problems due to heterogeneousbleaching or post-depositional disturbance (e.g. Roberts et al.,1998a, 1998b; Olley et al., 1999, 2004a, 2004b, 2006;Feathers, 2003; Jacobs et al., 2003b, 2006; Yoshida et al., 2003;Feathers et al., 2006a, 2006b; Porat et al., 2006; Arnold et al.,2007; Bateman et al., 2007).Accordingly, we undertook OSL measurements on 24
aliquots of samples NR5a, NR5b and NR6, where each aliquotconsisted of only 80 quartz grains (90–125mm in diameter).Using the same acceptance criteria as above, we obtainedpalaeodose distributions (Fig. 11) that are overdispersed by17–26%, which is at the high end of the range of overdispersion
om large (800 grain) aliquots of (a) sample NR5a, and (b) sample NR6.from the y-axis origin through the point until the line intersects the radiale palaeodose can be read by extending a line vertically to intersect thein percent) and the reciprocal standard error (‘Precision’). Hence, valuesdial axis on the right of the diagram, and the least precise estimates plot-axis and is centred on the weighted mean palaeodose calculated usinglaeodose estimates if they are consistent with a common dose. In bothide a visual indication that most of the spread in palaeodose can benfirmation is given by the overdispersion values of 75% (NR5a) andached samples of quartz (Galbraith et al., 2005; Lian and Roberts, 2006)
J. Quaternary Sci., Vol. 22(5) 449–479 (2007)DOI: 10.1002/jqs

Figure 11 Radial plots of the palaeodoses obtained from small (80 grain) aliquots of (a) sampleNR5a, (b) sampleNR5b, and (c) sampleNR6. In eachcase, the shaded band is centred on the weighted mean palaeodose calculated using the central age model. The palaeodose distributions areoverdispersed by 17 3, 174 and 26 6%, respectively
468 JOURNAL OF QUATERNARY SCIENCE
values reported for well-bleached quartz grains. As measure-ment errors are accounted for in the estimation of over-dispersion, the extra spread in palaeodose observed among thesmall aliquots must be due to some other effect, such as partialbleaching, post-depositional mixing, dose rate heterogeneity atthe scale of individual grains, or a combination of these factorsand others (see Galbraith et al., 2005).An indication that partial bleaching is not a serious issue for
these samples is given by the internal consistency of theweighted mean palaeodoses for the large and small aliquots ofsamples NR5a andNR6 (Table 5). These values were calculatedusing the central age model and represent the geometric meanof the true (i.e. in the absence of measurement errors)palaeodoses; the median palaeodoses are very similar(Table 5). For both of these samples, the geometric meanpalaeodoses for the large and small aliquots are statisticallyindistinguishable, and the median palaeodoses are likewisecomparable. By contrast, if partial bleaching were a problemthen the expected outcome would be an increase in positiveskewness with decreasing aliquot size (Olley et al., 1999), so
Copyright 2007 John Wiley & Sons, Ltd.
that small aliquots would have returned the smallest geometricmean (and median) palaeodoses. This result is not observed,despite a ten-fold difference in the number of grains containedon the large and small aliquots.
Single-grain palaeodose distributions. To further investigatethis issue, we measured 300 individual grains of quartz(180–212mm in diameter) from each sample using the linearmodulation technique (Bulur, 1996; Yoshida et al., 2003; Olleyet al., 2006). Grains were rejected using the same two criteria aspreviously and/or if they did not produce a measurable OSLsignal in response to the test dose; the latter is a common featureof natural quartz grains, the vast majority of which do not emitany detectable OSL. For the remaining grains (5–20% of thetotal number analysed), palaeodoses were determined separ-ately for the fast and slow LM-OSL components (Fig. 12). Foreach sample, the weighted mean palaeodoses for the twocomponents overlap at the 95% confidence interval, but themeaning of these ‘average’ values is called into question by thehigh overdispersions of the palaeodose distributions: 36–52%
J. Quaternary Sci., Vol. 22(5) 449–479 (2007)DOI: 10.1002/jqs

Figure 12 Radial plots of the palaeodoses obtained from the ‘fast’ and ‘slow’ OSL signals for single grains of (a), (b) sample NR5a, (c), (d) sampleNR5b, and (e), (f) sample NR6. The lines radiating from the y-axis intersect the radial axis at the component doses indicated by the finite mixture modelas the best-fit estimates when the overdispersion value is fixed at 15%
Copyright 2007 John Wiley & Sons, Ltd. J. Quaternary Sci., Vol. 22(5) 449–479 (2007)DOI: 10.1002/jqs
SEDIMENT MIXING AT NONDA ROCK 469

470 JOURNAL OF QUATERNARY SCIENCE
for the fast component and 27–66% for the slow component(Table 5).Such high overdispersions could reflect the post-depositional
mixing of grains due to past anthropogenic activities at the siteand/or the movement of grains by natural processes, such asbioturbation and pedogenesis. The finite mixture model,developed originally for fission track dating (Galbraith andGreen, 1990; Galbraith, 2005) and adapted for optical datingby Roberts et al. (2000), offers a formal statistical means toexamine the structure of a palaeodose distribution in caseswhere mixing is thought to have occurred. This model providesan estimate of the number of discrete dose populations in amixture, their corresponding palaeodoses, and the relativeproportion of grains in each population. The finite mixturemodel should only be applied to single-grain palaeodosedistributions, becausemulti-grain aliquots may consist of grainsdrawn from more than one dose population, and this couldresult in spurious populations being identified by the model(e.g. a fictitious population located between two of thesingle-grain dose populations). Statistical details of the modelare given in Galbraith (2005: ch. 5) and other examples of itsapplication to archaeological sites can be found in Roberts et al.(2001) and Jacobs et al. (2006, 2007). Of course, statisticalmodelling should not be conducted in isolation from thescientific context and purpose of the study; the depositionalenvironment of a sample, stratigraphic considerations and anyother pertinent field and laboratory information (e.g. indepen-dent age control) should also be taken into account (Galbraithet al., 1999, 2005; Galbraith, 2005).The finite mixture model requires that the user specifies two
values: the overdispersion parameter for each dose population,and the number of expected dose populations. The latter is thequantity of interest, but the model cannot distinguish between,for example, one or two highly overdispersed populations andthree or more populations with much smaller overdipersions.So, it is important to fit the model using an appropriateoverdispersion value (and an accurate measurement error foreach palaeodose) to correctly determine the number of dosecomponents present. Ideally, an independent estimate of theoverdispersion parameter would be available fromwell-bleached grains of quartz of similar burial age at thestudy site.We do not have such data for Nonda Rock, but we dohave the results of the ‘dose recovery’ test made on small (80grain) aliquots, which showed that grains that had beenbleached and then given an identical laboratory dose yieldeddose distributions that were overdispersed by 6.7 3.0%(NR5a), 9.3 3.4% (NR5b) and 2.1 1.5% (NR6). As doserecovery data represent a ‘best case’ scenario for naturalsamples (Galbraith et al., 2005), we considered that thepalaeodose overdispersions of the Nonda Rock samples beforemixing would have been not less than 10%, and could perhapshave been as high as 20%, based on the range of valuesreported for other samples of quartz that have been fullybleached at deposition. However, as we cannot be certainabout the actual value, we ran a sensitivity test of the modelusing values of 10%, 15% and 20%, under the assumption thateach dose population is overdispersed to the same relativeextent. The latter may not always be true (e.g. for fluvialdeposits, where distinct populations of grains may have beenbleached to differing extents at the time of deposition), but it is areasonable assumption to make when incomplete bleaching ofgrains is thought not to be an issue (e.g. Nonda Rock).We used several criteria to decide on the number of discrete
dose populations present in each sample. For each of thechosen overdispersion values (10%, 15% and 20%), we ran themodel with the number of dose components (k) set at 2, 3 and 4,and obtained the corresponding estimates of maximum log
Copyright 2007 John Wiley & Sons, Ltd.
likelihood (MLL) and Bayes Information Criterion (BIC)(Table 6). The smallest number of dose components neededto explain a palaeodose distribution can be inferred from theMLL value, which should increase substantially (by at least 2)when an extra component is added that improves the fit to thedata; the MLL value will continue to increase with the additionof each new component, but redundancy is indicated when theincrease is small (Roberts et al., 2000; Galbraith, 2005). TheBIC value takes into account the MLL estimate, together withthe number of fitted dose components. BIC will decrease ascomponents are added and the fit is improved, but will then risewhen the continued increase in MLL is outweighed by theaddition of further (redundant) components. Hence, thesmallest BIC indicates the minimum number of dose com-ponents needed to achieve the optimum fit (Galbraith, 2005).We also checked for other signs of over-fitting, such asduplication of the component palaeodoses; components withrelative proportions close to zero; non-convergence of themodel to a single solution; and singularity in the calculatedcovariance matrix. Lastly, we overlaid the ‘best fit’ componentestimates on a radial plot with the individual single-grainpalaeodoses, to provide a visual check on the validity of thenumerical modelling (Fig. 12).
TheMLL and BIC values listed in Table 6were obtained using100 iterations of the finite mixture model, where the best-fitvalues are shown in bold type; the results obtained from fittingjust one component (mathematically identical to the centralage model) are also shown for comparison. Overall, the MLLand BIC scores agree on the minimum number of componentsneeded to fit the fast- and slow-dominated LM-OSL datasets foreach sample, with the latter systematically requiring fewercomponents than the former. This outcome is at least partly dueto the fast LM-OSL signals being much brighter than their slowLM-OSL counterparts (Fig. 9), so that the correspondingpalaeodoses are measured with generally higher precision(Fig. 12). This enables the model to more readily distinguishbetween grains that belong to different dose populations,whereas the less precise palaeodoses obtained from the slowLM-OSL signal cannot be confidently separated into as manydose populations.
Table 6 also shows that the number of dose components isinsensitive to the chosen overdispersion value; that is, the samenumber of components is identified for overdispersions of 10%,15% or 20%, which reflect the values reported for other naturalquartz sediments. This result is particularly advantageous in thepresent context, where we do not have strong independentevidence of the correct overdispersion value to use. To furtherassess the robustness of the model, Table 7 lists the palaeodosesobtained for each component, and the relative proportion ofeach component, for the various best-fit (bold type) outcomesshown in Table 6. Importantly, the palaeodoses and mixingproportions of the different components are not dependent onthe choice of overdispersion value, which shows that thisparameter can be discounted as exerting a significant influenceon the final fits. We also excluded other potential compli-cations by verifying the values in Table 7 using 500 iterations ofthe finite mixture model, as well as alternative starting values,to check that the model did not converge on any local maxima.No such problems were encountered. The palaeodoseestimates used subsequently to calculate the optical ages areshown in bold type in Table 7, and are plotted in Fig. 12 as thelines radiating from the origin of the standardised estimate axis.
There are some similarities, as well as differences, betweenthe fast and slow LM-OSL palaeodose populations for each ofthe three samples. Sample NR5a is dominated by a populationof grains that have palaeodoses of 44Gy, and that constitutebetween two-thirds and three-quarters of the number of grains
J. Quaternary Sci., Vol. 22(5) 449–479 (2007)DOI: 10.1002/jqs

Table 6 Finite mixture model estimates of the maximum log likelihood (MLL) and Bayes Information Criterion (BIC) for the ‘fast’ and ‘slow’ LM-OSLsingle-grain datasetsa
Number of components (k) sb¼10% sb¼15% sb¼ 20%
MLL BIC MLL BIC MLL BIC
Sample NR5aFast (n¼47)
1 92.7 189.2 68.4 140.6 53.0 109.92 50.0 111.6 41.3 94.1 36.9 85.33 S34.6 88.4 S34.2 87.6 S34.3 87.94 34.5 96.0 34.2 95.3 34.3 95.6Slow (n¼15)
1 38.6 79.8 33.5 69.7 29.2 61.22 S13.7 35.4 S14.0 36.1 S14.4 36.93 13.7 40.8 14.0 41.5 14.4 42.3Sample NR5bFast (n¼44)
1 56.8 117.4 43.1 89.9 34.7 73.22 27.1 65.6 S25.8 62.9 S25.5 62.43 S24.2 67.3 25.1 69.1 25.5 70.04 24.2 74.9 25.1 76.6 25.5 77.5Slow (n¼17)
1 26.8 56.4 23.4 49.7 20.8 44.32 S10.7 29.9 S11.0 30.5 S11.6 31.83 10.7 35.5 11.0 36.1 11.6 37.4Sample NR6Fast (n¼60)
1 146.6 297.3 113.8 231.7 93.3 190.72 76.3 164.9 69.0 150.2 65.3 142.83 S64.6 149.6 S63.2 146.9 S62.9 146.44 64.6 157.8 63.2 155.1 62.9 154.5Slow (n¼16)
1 S11.2 25.2 S10.7 24.1 S10.2 23.32 9.5 27.4 9.6 27.6 9.8 27.93 9.5 32.9 9.6 33.1 9.8 33.4
aNumber of grains in each dataset is shown by the n value in parentheses. The finite mixture model (Roberts et al., 2000) involved 100 iterations withuser-defined overdispersion values (sb, following Galbraith et al., 2005) of 10%, 15% or 20%. The term ‘overdispersion’ refers to the relative standarddeviation of the palaeodose distribution after allowing formeasurement uncertainties; that is, the between-grain variation in true palaeodose (Galbraithet al., 2005). The best-fit values are shown in bold type.
SEDIMENT MIXING AT NONDA ROCK 471
analysed. The remainder of this sample is comprised of grainswith larger palaeodoses (76Gy), recognised only in the fastLM-OSL dataset, or smaller palaeodoses. The latter dosepopulation is estimated as either 20Gy (fast) or 10Gy(slow), but consists of just a few grains in each dataset. Onegrain with a palaeodose of 10.9 2.0Gy is present in the fastLM-OSL dataset (Fig. 12), but its precision and abundance aretoo low to form a discrete population.There is one further point to mention in regard to the fast
LM-OSL dataset of sample NR5a. The MLL and BIC valuesdisagree on the optimum number of dose components neededto fit the data when the overdispersion parameter is fixed at20%. The MLL indicates three components, whereas the BICscore suggests only two are required. They concur on theexistence of a discrete population at 20Gy, but the higherdose component of 51Gy obtained when k¼ 2 falls betweenthe 44Gy and 76Gy dose-populations identified by MLL.The same result was achieved for the fast LM-OSL dataset ofsample NR6. For these samples, it appears that theMLL and BICgoodness-of-fit criteria differ in their assessment of whetherdata that are overdispersed by 20% are consistent with one ortwo high dose populations. We favour the latter in bothinstances, because an inspection of the radial plots shows thatthe BIC higher-dose component falls in a ‘gap’ in the measuredpalaeodose distribution, whereas the MLL components providea better visual fit to the data. The fact that a unique solution wasnot achieved for either sample when sb¼ 20%, and that the
Copyright 2007 John Wiley & Sons, Ltd.
BIC scores are smaller at this overdispersion value than at 10%or 15% (and, thus, could be interpreted as the optimum fits),highlights the dangers of relying on any single statisticalcriterion to evaluate goodness-of-fit.In sample NR5b, up to one-third of the grains analysed
belong to a population with a palaeodose of 30Gy (the fastand slow values being in accord at the 95% confidenceinterval), but at least two-thirds of this sample consists of grainswith palaeodoses of 73 5Gy (fast) or 92 7Gy (slow). Thesetwo estimates also overlap at the 95% confidence interval, butwe consider the fast LM-OSL palaeodose to be the morereliable, because the fast LM-OSL signals were measured withgenerally higher precision (Fig. 12). This sample, in contrast tothe other pair, shows a disagreement between MLL and BIC inrespect to the optimum number of dose components required tofit the data when the overdispersion parameter is set at 10%.We cannot discount the possible existence of the three MLLcomponents from an examination of the radial plot, becausethey would appear to fit the data at least as well as the two BICcomponents. But we are reluctant to place too much weight onthe MLL result because the minimum overdispersion value forthis sample, as indicated by dose recovery tests on multi-grainaliquots, is 9.3 3.4%, so spurious dose populations might beidentified by the finite mixture model if the overdispersionvalue is fixed at 10% or less.Based on the fast LM-OSL signal, sample NR6 appears to
comprise three dose populations, with about half of the
J. Quaternary Sci., Vol. 22(5) 449–479 (2007)DOI: 10.1002/jqs

Table 7 Component palaeodoses and their proportions for the best-fit finite mixturemodel estimates of the number of components (k) in the ‘fast’ and‘slow’ LM-OSL single-grain datasetsa
Number of components (k),overdispersion (sb in %)
Component 1 Component 2 Component 3
Dose (Gy) Proportion (%) Dose (Gy) Proportion (%) Dose (Gy) Proportion (%)
Sample NR5aFast (n¼47)
k¼3, sb¼ 10% 20.41.8 136 42.6 2.2 6411 77.6 7.1 2310k¼3, sb¼ 15% 20.3W2.3 136 43.3W2.8 6512 75.8W9.0 2211k¼3, sb¼ 20% 20.33.0 137 43.8 4.2 6516 7312 2216k¼2, sb¼ 20% 21.83.3 178 51.4 3.1 838Slow (n¼15)
k¼2, sb¼ 10% 10.41.8 2312 45.5 3.9 7712k¼2, sb¼ 15% 10.4W1.9 2312 45.2W4.4 7712k¼2, sb¼ 20% 10.42.1 2312 45.1 5.0 7712Sample NR5bFast (n¼44)
k¼3, sb¼ 10% 31.93.4 219 57.2 4.8 4414 85.9 6.1 3513k¼2, sb¼ 10% 37.13.6 3511 76.4 4.1 6511k¼2, sb¼ 15% 35.9W4.6 3112 73.4W4.7 6912k¼2, sb¼ 20% 35.45.5 2813 71.0 5.2 7213Slow (n¼17)
k¼2, sb¼ 10% 25.14.7 1710 92.0 5.6 8310k¼2, sb¼ 15% 25.0W5.1 1710 91.8W6.5 8310k¼2, sb¼ 20% 25.05.6 1710 91.7 7.6 8310Sample NR6Fast (n¼60)
k¼3, sb¼ 10% 23.11.3 31 7 45.7 3.1 4111 77.5 6.8 2810k¼3, sb¼ 15% 22.8W1.7 30 8 46.1W4.4 4412 78.2W9.0 2612k¼3, sb¼ 20% 22.62.5 29 9 46.2 6.9 4715 7713 2417k¼2, sb¼ 20% 23.72.1 35 8 56.5 3.4 658Slow (n¼16)
k¼1, sb¼ 10% 57.76.8 100k¼1, sb¼ 15% 58.4W8.0 100k¼1, sb¼ 20% 5911 100
aNumber of grains in each dataset is shown by the n value in parentheses. The final fits were obtained from 500 iterations of the finite mixture modelusing the overdispersion (sb) values listed in the first column. A range of starting values was also used to ensure that the model consistently gave thesame fitted values and did not converge on any local maxima. The palaeodose estimates used to calculate the optical ages are shown in bold type.
472 JOURNAL OF QUATERNARY SCIENCE
analysed grains having palaeodoses of 46Gy. The remaininggrains are split equally between those with a lower palaeodose(23Gy) and those with a high palaeodose (78Gy). Grainswith each of these component palaeodoses also occur in theslow LM-OSL dataset, but the estimates are too imprecise and/or too few in number for the model to identify them as discretedose populations (Fig. 12). Instead, a single dose componentcentred on 58Gy is obtained, which falls mid-way betweenthe larger pair of palaeodose estimates for the fast LM-OSLpopulations. For single-dose populations, it is preferable tocalculate the palaeodose using the central age model, whichtakes into account the measured overdispersion, rather than theassigned value; for the slow LM-OSL dataset of sampleNR6, thecentral age model yields a palaeodose of 60 7Gy with anestimated overdispersion of 27 12% (Table 5).It is not appropriate to compare the palaeodoses between
samples in Table 7, because the dose rate is different for eachsample, but it is valid to compare the corresponding ages. Theseare listed in Table 5 for each of the dose components identifiedby the finite mixture model when the overdispersion parameteris fixed at 15%. We chose the latter value to calculate theoptical ages because: (a) it falls mid-way in the range of valuestested (10–20%), and there appears to be no significantdependency of estimated palaeodose across this range(Table 7); (b) it is representative of the overdispersion valuesreported for individual grains of well-bleached quartz inprimary context at other field sites; and (c) MLL and BIC
Copyright 2007 John Wiley & Sons, Ltd.
consistently identify the same number of dose componentswhen an overdispersion value of 15% is used (Table 6).
The following discussion is focused on the age-populationsobtained from the fast component, because the datasets arelarger and apt to be more reliable than their slow-componentcounterparts due to the greater OSL intensity of thefast-component signal. The latter results in a greater proportionof grains giving a measurable OSL signal in response to the testdose. As a consequence, the finite mixture model was fitted to44–60 and 15–17 fast- and slow-component palaeodoses,respectively, for each sample. The measurement precisionassociated with the individual fast-component estimates is alsogenerally higher: 59 of the total of 151 (39%) obtained in thisstudy have relative errors of better than 20%, compared to just10 of the 48 (21%) slow-component palaeodoses (Fig. 12).Nonetheless, as discussed above, there are many similarities inthe general outcomes from the two components.
There are some striking consistencies among the threesamples. All three have an age-component centred on67 000years ago, which constitutes 69 12% of sample NR5b (thedeepest of the three samples) and 24 8% of samples NR5aand NR6 (calculated as the weighted mean of the two separateestimates, which are statistically indistinguishable). As themajority of sample NR5b consists of grains of this age, itsmulti-grain optical age is, as expected, in agreement(66 000 5000 years ago). But such grains also represent asubstantial fraction of samples NR5a and NR6, so that taking
J. Quaternary Sci., Vol. 22(5) 449–479 (2007)DOI: 10.1002/jqs

SEDIMENT MIXING AT NONDA ROCK 473
the weighted mean of their multi-grain palaeodoses results ingreatly inflated apparent burial ages. Given that sample NR5bwas collected from only 2 cm below sample NR5a, we interpretthe significant difference in proportion of ca. 67 000-year-oldgrains as reflecting a major stratigraphic break at, or close to,the XU28/29 contact in square E7. This interpretation issupported by the 14C chronology for square E7, where 14C agesfor XU29 and the underlying excavation units are either infiniteor at the limits of the technique, even when ABOX-SCpretreatment and graphitisation methods are used (Table 2).The remaining one-third of the dated grains in sample NR5b
belongs to a single population with an optical age of31 000 4000 years ago. A component of slightly older age(but not significantly so) is present in samples NR5a and NR6(40 000 3000 and 39 000 4000 years ago, respectively),and constitutes the largest age-component of both thesesamples (65% and 44%, respectively). These two samplesalso contain a third age-component centred on ca. 20 000 yearsago, which comprises 13% of sample NR5a and 30% ofsample NR6. Over a depth interval of 10 cm, therefore, wecan discern a major change in the age-composition of thesediments: at the XU28/29 contact in square E7 (stratigraphi-cally equivalent to XU38/39 in square E6), two-thirds of thedeposit consists of grains that were last exposed to sunlight ca.67 000 years ago, whereas three-quarters of the deposit inXU28 and XU26C contains grains that were last bleached ca.40 000 or ca. 20 000 years ago, with the relative proportion ofthe youngest component increasing with distance away fromthe XU28/29 contact (i.e. increasing upwards).As a further test of the reliability of our age-component
reconstruction, we examined the dose distribution for individ-ual grains that contained both fast and slow LM-OSL signalswith compatible palaeodoses (e.g. Fig. 9). This ‘dual signal’approach has been used previously to identify Australian quartzgrains that were fully bleached at deposition (Yoshida et al.,2003; Olley et al., 2004b, 2006). That is, given the difference insensitivity to optical stimulation of the two signals, theirpalaeodoses will only agree if the grains had been exposed tosufficient sunlight for the slow component to be reduced to thesame low (residual) level as the fast component. Partiallybleached grains would yield smaller palaeodoses from the fastcomponent than from the slow component (i.e. fast/slow ratios
Figure 13 Radial plots of (a) the fast/slow palaeodose ratios obtained for ‘duand (b) the optical ages for those grains (n¼9) with ratios consistent with uniy-axis in (b) correspond to the ages of the two components (38 0004000 andthe overdispersion value is fixed at 15%
Copyright 2007 John Wiley & Sons, Ltd.
of <1), and the same is true for fully bleached grains in whichthe fast component is underlain by a significant and thermallyunstable medium component (Li and Li, 2006). The converseapplies (i.e. fast/slow ratios of>1) to samples in which the slowcomponent is dominated by the thermally unstable S2 type(using the terminology of Singarayer and Bailey (2003)). Thereis the possibility that the thermally unstable medium and S2components occur in the same grain, resulting in similarapparent palaeodoses from the first 5 s and last 5 s of opticalstimulation (the time intervals used to estimate the fast and slowLM-OSL palaeodoses). But any complications associated withthe S2 component should beminor in the Nonda Rock samples,because its relative contribution to the LM-OSL signal isdepleted by the 2408C preheat given to the grains before opticalstimulation (Singarayer and Bailey, 2003). Mathematicalseparation of the different LM-OSL components is not apracticable option for these single grains, because of theirgenerally weak LM-OSL emissions.A total of 11 of the 900 individual grains measured in this
study contained both fast and slow LM-OSL signals of sufficientintensity to be distinguished above background. The fast/slowratios for these grains are shown in Fig. 13(a), from which it canbe seen that nine grains have ratios consistent with unity at the95% confidence interval. The palaeodoses and optical agesobtained from these ‘dual signal’ grains are listed in Table 8 andplotted in Fig. 13(b). Taken as a whole, and bearing in mind therestricted number of data, the three samples reveal the presenceof the same three age-populations as were identified inthe much larger fast-component datasets: a single grain (insample NR5b) of 25 000 5000 years ago, five grains with agesconsistent with 40 000 years ago, and three grains with agesconsistent with 67 000 years ago. To formally estimate thenumber of discrete age-components, we fitted the finite mixturemodel to the composite dataset (n¼ 9) using an overdispersionvalue of 15% (the validity of this analysis rests on theassumption that all three samples are composed of grainsderived from the same, original age-components and mixedtogether in differing proportions). This indicated populations at38 000 4000 and 63 000 12,000 years ago, with relativeproportions of 73 20% and 27 20%, respectively. Thepredominance of the younger age-component reflects thegreater relative contribution to the composite dataset of ‘dual
al signal’ grains in samples NR5a (n¼4), NR5b (n¼2) and NR6 (n¼ 5),ty at the 95% confidence interval (Table 8). The lines radiating from the6300012,000 years ago) indicated by the finite mixture model when
J. Quaternary Sci., Vol. 22(5) 449–479 (2007)DOI: 10.1002/jqs

Table 8 ‘Dual signal’ palaeodoses and optical ages obtained for theindividual grains (n¼9) that yielded statistically indistinguishablepalaeodoses from both the fast- and slow-dominated LM-OSL com-ponents. The latter estimates were combined in quadrature using thecommon age model (Galbraith et al., 1999) to calculate the weightedmean ‘dual signal’ palaeodose and associated standard error for eachgrain
Palaeodose (Gy) Age (ka)
Sample NR5a36.4 3.4 33.43.542.6 3.2 39.13.449.0 5.1 45.05.180 11 7311
Sample NR5b28.4 4.9 24.74.465.7 7.1 57.16.8
Sample NR644.7 4.3 38.34.146.5 5.5 39.85.178 26 6723
474 JOURNAL OF QUATERNARY SCIENCE
signal’ grains from samples NR5a and NR6, in which ca.40 000-year-old grains are the most abundant (Table 5).In summary, therefore, the fast-component and ‘dual signal’
LM-OSL results suggest an age-structure for the deposit that isconsistent with the proposition that three sedimentaryage-components have been mixed together, in varyingproportions, at depths of 80–90 cm (i.e. from XU26c to theXU28/29 interface) in square E7. The deepest sample (NR5b) isdominated by grains derived from the underlying deposit,whereas samples NR5a and NR6 are composedmostly of muchyounger grains. This overall pattern is reflected also in the14C chronology for square E7, where the first infinite(ABOX-SC) age is obtained for XU29, which is overlain byexcavation units (XU19-28) with 14C ages of between ca.26 000 and ca. 36 000 cal. yr BP (Table 2). The latter ages do notseparate into two discrete populations at ca. 20 000 and ca.40 000 years ago, as identified by optical dating of individualquartz grains. However, we do not view the latter age-population as necessarily erroneous, because sedimentationcould have taken place ca. 40 000 years ago (atop a mucholder, ca. 67 000-year-old, surface) and these thin (10 cm deep)deposits were then intruded by charcoal pieces, as a result ofanthropogenic disturbance, when people first arrived at NondaRock about 36 000–40 000 years ago. In this scenario, the14C and OSL chronologies relate to different events.It is less easy, however, to explain the population of ca.
20 000-year-old grains in samplesNR5a andNR6, as the closestcalibrated 14C ages of similar age in square E7 occur in XU18,which is 37 cm higher in the sequence. The ca.20 000-year-old component is represented especially stronglyin sample NR6, but it seems highly unlikely that 30% of thegrains could have intruded from XU18. Even when the numberof fast LM-OSL components is restricted to k¼ 2 for samplesNR5a andNR6—that is, selecting the lowest BIC score with theoverdispersion parameter fixed at 20% (Table 6)—a single-grain population of ca. 20 000 years ago emerged as one of thetwo identified components (Table 7). So we explored thepossibility that the ca. 20 000-year-old component is anexperimental artefact of inaccurate dose rate determinationfor individual grains. Almost56% of the total dose rate for thebulk samples is contributed by gamma and cosmic rays, whichdeposit an effectively homogeneous dose in all grains within a
Copyright 2007 John Wiley & Sons, Ltd.
sample. There is also likely to be little variation in gamma doserate between these three samples, because they are sufficientlydistant (>20 cm) from the underlying bedrock that>95% of thegamma dose is derived from the sediments, which areradioactively homogeneous (Table 5). Any substantial doserate variations at the single-grain level must, therefore, arisefrom the beta-particle contribution, which accounts for41–42% of the total dose rate in these samples.
Olley et al. (1997) showed that there can be a 20-folddifference in the beta dose rate to individual quartz grains,depending on the composition of the deposit. Recent modellingstudies (Nathan et al., 2003; Mayya et al., 2006) have suggestedthat significantly asymmetric palaeodose distributions can beexpected if large non-radioactive inclusions are scatteredamong the quartz grains (e.g. when 1 cm diameter carbonateclasts occupy 10% of the deposit) or if high-radioactivityminerals are dispersed in low abundance among the quartzgrains (e.g. when <25% of the deposit consists of 200mmdiameter potassium feldspar grains). In the ‘carbonate’example, quartz grains will return ages that are too small ifthey abut, or are coated by, carbonate and the average dose ratefor the bulk sample is used instead of the (lower) dose ratespecific to those grains. In the ‘feldspar’ case, the palaeodosedistribution will be positively skewed, with most grains yieldingages that are too young using the sample-average dose rate.Could either of these potential complications explain theexistence of an apparent ca. 20 000-year-old population ofgrains in the Nonda Rock samples?
When the sample-average beta dose rate is set to zero (so thatthe total dose rate consists only of the gamma, cosmic andinternal dose rate contributions), the apparent ca. 20 000-year-old component increases in age to 32 000 4000 (NR5a) and34 000 3000 years (NR6). This calculation shows that the ca.20 000-year-old population could conceivably be as old as ca.33 000 years old, which would be consistent with the 14C agesof 26 000–36000 cal. yr BP, if all of the constituent grains wereheavily coated in carbonate or situated next to a largecarbonate lump (or some other non-radioactive substance).We consider this to be highly improbable because there is noobvious source or evidence of carbonate material in therelevant stratigraphic unit (SU2c). Nonda Rock is a sandstonerockshelter, so the deposits do not contain large carbonateclasts, and examination of the micromorphology revealed thatthe quartz grains are not coated in carbonates. Other materialsmade of carbonate (e.g. bone and shell) are similarly absent,which may be due to the acidic nature of the deposit (pH 5.3in SU2c). We consider it more likely, however, that bone andshell were never present at this site, given that: (a) terrestrialmammals are rare on the mountain, and edible riverineshellfish are absent (David et al., 1998); and (b) faunal remainsare absent at most sites on the mountain, but when present,are well preserved in mid- to late-Holocene deposits withcomparable chemical and sedimentological characteristics tothose at Nonda Rock (e.g. Ngarrabullgan Cave, DragonflyHollow).
Let us now examine the ‘feldspar’ case. Mayya et al. (2006)constructed a model in which the 40K content in the bulksample is due principally to the presence, in low abundance, ofgrains of potassium feldspar, which have internal40K concentrations of 14%. Quartz grains located in closeproximity to these potassium ‘hotspots’ will experienceabove-average beta dose rates, but the majority of quartzgrains will experience below-average beta dose rates becauseof the combined effect of the low concentration of hotspots andthe decrease in the beta dose from the hotspot as the inversesquare of distance. The net result is a positively skewedpalaeodose distribution, with the lowest group of values
J. Quaternary Sci., Vol. 22(5) 449–479 (2007)DOI: 10.1002/jqs

SEDIMENT MIXING AT NONDA ROCK 475
representing quartz grains that were located furthest from thehotspots. Mayya et al. (2006) then propose a model to obtainthe correct ages from the hotspot-distant grains, which involvesdividing the measured palaeodoses by the appropriatelyreduced total dose rate.We have applied their model to the palaeodose distributions
obtained from the fast LM-OSL signal of individual grains.There are several other causes of overdispersion, aside frombeta-dose heterogeneity (Galbraith et al., 2005); for example,beta-dose heterogeneity is not an issue in ‘dose recovery’experiments, yet we obtained dose overdispersions of up to9% frommulti-grain aliquots. So we used the lowest, discretedose component identified by the finite mixture model (withsb¼ 15%) as our estimate of the statistically smallestpalaeodose in each sample. We inserted these values intoequation (20) of Mayya et al. (2006), together with the totaldose rates listed in Table 5, d¼ 0.2 (estimated from theirFig. 3a for a 40K concentration of 0.2% (60Bq kg1) in thebulk samples) and f¼ 0.88 (estimated from the radionuclideactivities given in Table 5). The latter parameter represents thefractional contribution to the total dose rate from beta particlesemitted by the uranium and thorium decay series, from gammarays emitted by both these decay series plus potassium, fromcosmic rays and from alpha particles emitted by radioactiveinclusions within the quartz grains; these contributors areassumed to deliver a spatially uniform dose to all grains in asample (this assumption is an oversimplification with respect tothe internal dose rate for individual quartz grains (Murray andRoberts, 1997; Zhao and Li, 2005), but setting the internal doserate to zero reduces the total dose rates, and increases theoptical ages (including those of grains in the ca.20 000-year-old population) by less than 3%).The resulting optical age of the lowest dose component in
each of the three samples increases by10% to 21 000 3000(NR5a), 35 000 5000 (NR5b) and 22 000 2000 years ago(NR6), which are within error of the original age determinations(Table 5). Accordingly, we cannot increase the ca.20 000-year-old component in samples NR5a and NR6 to anage that would match the 14C chronology by invoking lowconcentrations of feldspar contaminants among the quartzgrains. Moreover, the case for feldspar grains, or any otherhigh-radioactivity minerals, in the Nonda Rock samples isweakened by the results of the micromorphology investi-gations, which showed that the composition of SU2c isdominated by quartz and similar materials, as expected for asedimentary deposit in a sandstone rockshelter.At the present time, therefore, we cannot explain the
discrepancy between the 14C and optical ages for the depositbetween 80 and 90 cm depth in square E7. If one accepts the14C chronology, then the oldest artefacts are between about26 000 and 36 000 years in age. On the other hand, the OSLchronology indicates that the artefact-bearing sediments werelast exposed to sunlight between about 20 000 and 40 000 yearsago (i.e. the two youngest age-components identified by thefinite mixture model), with the proportion of older grainsincreasing with depth. At, or close to, the interface betweenXU28 and XU29 in square E7, there is amajor change in the ageof the sediments (ca. 67 000 years ago) and incorporatedcharcoal fragments (>50 000 years BP). Importantly, nocultural items were recovered from the basal excavation units(XU29-32) in square E7, so we can discount human occupationof Nonda Rock at or before ca. 67 000 years ago. This findingsupports the evidence from Malakunanja II rockshelter inwestern Arnhem Land that humans first arrived in northernAustralia not earlier than ca. 60 000 years ago (Roberts et al.,1990a, 1998b; Roberts and Jones, 2001).
Copyright 2007 John Wiley & Sons, Ltd.
Discussion
We conclude from the OSL and radiocarbon evidence thatpeople first arrived at Nonda Rock most likely around 40 000years ago (following the OSL chronology) or 36 000 years ago(following the 14C chronology). This is consistent with thepresence of people at Ngarrabullgan Cave, 1.2 km away on theNgarrabullgan plateau, by 39 900 1350 years ago. Initialoccupation at Nonda Rock is thus archaeologically contem-poraneous with initial occupation at Ngarrabullgan Cave. Wenote also that while we have investigated in considerable detailthe occurrence of sediment mixing at Nonda Rock usingsingle-grain OSL methods, the admixture of different-agecharcoal fragments may also afflict the 14C chronology tosome extent. That is, multiple age determinations on differentfragments from a single XU could produce a two- orthree-component mixture (as with the single-grain OSL data);indeed, the two ages of ca. 27 000 and ca. 36 000 cal. yr BPfrom XU28 in square E7 hint at exactly this phenomenon. Ingeneral, the 14C chronology is based on just one sample per XU,so it is more likely than not that this sample will have beendrawn from the dominant age-component for that particularXU.No definite cultural materials apart from stone artefacts,
ochre and rock-art were recovered during the excavation atNonda Rock, in line with trends from other sites onNgarrabullgan. Of the 11 rockshelters excavated on themountain (one of which does not possess any evidence ofhuman occupation), only Ngarrabullgan Cave has revealedanimal bone remains, cultural plant remains and hearths; noother site has revealed any cultural materials except for stoneartefacts, ochre and, perhaps, charcoal and burnt earth (detailsin David, 2002: ch. 3). It is unlikely that the absence of animalbones and other food remains at Nonda Rock is entirely due topost-depositional taphonomic factors, given that:
1 T
he animal bones at nearby Ngarrabullgan Cave are in agood state of preservation all the way down to the basalcultural layer, dated to 39 900 1350 cal. yr BP(35 200 690 years BP), with the calibration uncertaintyexpressed at the 95% confidence interval. Some of theseAMS 14C ages are based on ABOX, rather than ABA, samplepretreatments, increasing our confidence in their chronos-tratigraphic accuracy. The Nonda Rock sediments arechemically and physically similar to those at NgarrabullganCave.2 A
t Ngarrabullgan Cave, plant remains have survived well inthe late Holocene levels.3 T
hree rockshelter excavations (Kookaburra Rock, CourtyardRock and Dragonfly Hollow) at the base of the mountainhave revealed numerous animal bones. The rock matrix andsediments at these sites are similar to those of the excavateddeposits on top of the mountain.4 T
here are few faunal resources on top of the mountain. Afterthree years of systematic zoological surveys by a team of nineexperienced zoologists and more than 20 trained volunteersusing pit-traps, Elliott traps and spotlights at night, the onlyterrestrial mammals sighted on the mountain have been twoRufous Bettongs (Aepyprymnus rufescens) (Hall et al., 1998).This near-total absence of terrestrial mammals on the moun-tain is likely to have a considerable antiquity, given: (a) thepresence of fine, undisturbed stratigraphy at NgarrabullganCave, including an undisturbed surface which remainedexposed for over 25 000 years (David et al., 1998); and(b) the lack of major environmental change in the lastJ. Quaternary Sci., Vol. 22(5) 449–479 (2007)DOI: 10.1002/jqs

476 JOURNAL OF QUATERNARY SCIENCE
7000 years, or more, as indicated by pollen cores fromnearby Lake Koongirra on the mountaintop (Butler, 1998).
Given the paucity of cultural materials at Nonda Rock, weinterpret the cultural sequence as evidence of short-term visitsduring forages on, and travels across, the mountain, perhaps inassociation with specialised use of themountain. Nonda Rock’sproximity to permanent water at Lake Koongirra, and to per-manent waterholes alongGorge Creek (including thewaterholelocated 5m from the site), was undoubtedly a key factor to itscontinued visitation. But a general lack of faunal resourcesprobably militated against prolonged periods of occupation,both at the site and on the mountain more broadly.Some plant foods, such as Nonda Plum (Parinari nonda),
Cocky Apple (Planchonia careya), Conkerberry (Carissa sp.),Fig (Ficus obliqua), Kids Lollies (Cassytha rufa), Sugar CaneGrass (Hetrapogon triticeum), Lemon Grass (Cymbopogon sp.),Water Lily (Nymphoides indica) and Yams (Dioscorea sp.) growtoday at or near the site, and such resources would undoubtedlyhave been important dietary sources in the past while on themountain. Other potentially important mountain resources areGrass Tree (Xanthorrhoea johnsonii) and Spinifex (Triodiamicrostachya) resins—each known to have been used duringthe 19th and 20th centuries in various parts of Australia to fixobjects onto wooden shafts or handles, such as spears and spearthrowers—and the Soap Tree (Alphitonia excelsa), used as acleanser during ethnographic times. The resins and the SoapTree are only found on the mountaintop and slopes, and not onthe surrounding plains or hills, potentially attracting people toNgarrabullgan for their specialised extraction (for domestic useand/or trade; Shaw and Wason, 1998).Relatively high-quality red, yellow and white earth pigments
are also only available on the mountain and its slopes,occurring as rounded nodules in creek beds. Camping onNgarrabullgan—including Nonda Rock—would, thus, prob-ably have involved specialised use or extraction of resourcesnot commonly available elsewhere, and was probably veryshort-term throughout the site’s history, but possibly more soafter 3650 cal. yr BP than between 40 000 and 26 000 cal. yr BP(see Supplementary Information for details of stone artefactanalyses). Nevertheless, the three-fold increase in number ofoccupied sites (from five to 15) after ca. 5000 cal. yr BP (ca.4400 years BP) indicates increased intensities of regional landuse, expressed by an expansion onto the mountain during themid- to late-Holocene, in line with similar increases anddemographic expansions elsewhere in Australia at that time(see David (2002) for a discussion of this trend).The degree to which people came to the mountain—or
left—because of spiritual reasons associated with Ngarrabull-gan’s place in indigenous cosmologies remains unknown forthe distant past, although we note that the mountain was rarelyvisited during the last 600 years because of the presence ofdangerous spirits there, as recorded during the ethnographicperiod (David, 2002). David and Wilson (1999) and David(2002) have suggested that the beginning of abandonment ofthe mountain around 600 years ago probably signals thebeginning of the ethnographically documented ‘Dreaming’signification of Ngarrabullgan.
Conclusion
As we have attempted to show in this paper, assessing thedegree of sediment mixing can be crucial to the properunderstanding of the chronostratigraphy of archaeological
Copyright 2007 John Wiley & Sons, Ltd.
sites, particularly (but not limited to) those sites at the limits ofreliable radiocarbon dating. As a result of such investigations,the Nonda Rock excavations have revealed an absence ofevidence for human occupation in this part of northeasternAustralia before ca. 67 000 years ago (based on the opticalages). Although some apparently finite 14C determinations ofaround 50 000 years BP were obtained from the basal levels atNonda Rock, these should conservatively be treated asminimum age estimates, given the general difficulties ofobtaining reliable 14C ages of such antiquity. A direct indicationof the challenges involved in consistently obtaining reliable14C ages from ‘old’ charcoal at this site is given by the twoinfinite ages (>55 000 years BP) recorded for the basal levels.
We interpret the optical and 14C chronologies as suggestingthe commencement of human occupation at Nonda Rocksometime between ca. 67 000 and ca. 40 000 years ago. It is notpossible for us to specify exactly when people first arrivedduring this time interval, because sediments of relevant age arenot preserved in the excavated part of the deposit. We considerthe absence of artefacts before ca. 67 000 years ago to indicatethat people had certainly not occupied the site by this time, andwere probably not present elsewhere in the area. The latterproposition is based on the presence of a waterhole near NondaRock that would probably have made this site an attractivechoice for early inhabitants, and the fact that occupation ofsuch antiquity is not recorded either at Ngarrabullgan Cave,which is situated just 1.2 km to the northeast of Nonda Rock onthe same well-defined, table-top mountain (David et al., 1997).But we note that the oldest preserved evidence for initial humanoccupation of these two sites is about 40 000 years, with theestimate for Ngarrabullgan Cave being based on an ABOX-SC14C age of 39 900 1350 cal. yr BP (35 200 690 years BP),which is confirmed by other, similar results from that site.
These observations have some bearing on the timing of initialhuman colonisation of Australia, and on the subsequent spreadof people across the continent. The timing of earliest knownoccupation at Nonda Rock andNgarrabullgan Cave (ca. 40 000years ago) is consistent with the earliest uncontested culturalevidence from elsewhere in Greater Australia—notably Devil’sLair, Lake Mungo, Huon Peninsula, Carpenter’s Gap, Riwi,Allen’s Cave and, more indirectly, the Lake Eyre Basin.However, human arrival in this part of north Queensland at anearlier date (i.e. between 67 000 and 40 000 years ago) wouldnot be incompatible with the TL and optical ages of 61 000 to52 000 years for first appearance of people at the Nauwalabila Iand Malakunanja II rockshelters in the top end of the NorthernTerritory, which some have argued represents the time of initialhuman colonisation of Australia (Roberts et al., 1990, 1994,1998b; Roberts and Jones, 2001).
The Nonda Rock evidence also suggests that it is mostunlikely that the colonisation event took place before 67,000years ago, because sediments of that age were deposited, andhave been preserved, at the site but contain no traces ofmaterial culture or other signs of human activity. Ourinterpretations, based on the Nonda Rock data and theirregional context, are generally in linewith the recent argumentsof Roberts et al. (2001), Gillespie (2002), Allen and O’Connell(2003) and Bowler et al. (2003) for initial colonisation of thecontinent within the last 50 000 5000 calendar years—anestimate that sits comfortably with the emerging story for northQueensland.
Acknowledgements We warmly thank the staff and members of theKuku Djungan Aboriginal Corporation for inviting us to researchDjungan history at Ngarrabullgan. Most dearly we thank the late ElderMr Sam Wason; this paper is dedicated to his memory, and to histeachings of country. We also thank the Djungan participants in the
J. Quaternary Sci., Vol. 22(5) 449–479 (2007)DOI: 10.1002/jqs

SEDIMENT MIXING AT NONDA ROCK 477
2002 fieldtrip, Elders Alf Neal and Sam Wason, and Maxwell Under-wood, Colin Wason, Kenny Wason, Vincent Wason and WayneWhiting; Peter Kershaw, Heather Builth and Simon Haberle kindlyassisted with fieldwork. The 1997 fieldtrip was funded by Earthwatch,and fieldwork was undertaken with community and scientific staff, andEarthcorps participants, all of whom we thank: Sam Wason, Alf Neal,John I. Grainer and John Grainer (all Djungan), Chris Clarkson (archae-ology), Catriona Murray (archaeology), Justine Shaw (botany), L. Slater(zoology), Nic Dolby (wood analyses), Henry Walt (rock-art), ConradMacrokanis (zoology), John Stanisic (zoology), Glen Ingram (zoology),Bob Bultitude (geology), Bridgid Cassidy, Dylan Cassidy-David,Francoise Passard, Dave Currie, Connie Hastert, Leslie Lihou, JillOhlsen, John Watkins, Susan Fishur, Therese Meyer, Judith Hampton,Genevieve Roberts, Charlotte Buswell, Gillian Buswell, Daniel Talonn,Margaret Simonsen, Ian McDonnell, Aaron Hendry, John Watkins,Connull Leslie, Patricia Craig, Ian Archer, Cherry de Wolf, AlanMurphy, Amy Edwards, Sam Tarlington, Lisa Hamilton, DavidWheelerand Susan Fisher. The 2002 fieldtrip was funded by the AustralianInstitute of Aboriginal and Torres Strait Islander Studies. Some of theANSTOAMS radiocarbon determinations were funded by an AustralianInstitute of Nuclear Science and Engineering grant.We thank CassandraRowe for the pH measurements, assisted by Ursula Pietrzak; JohnVickers (Earth and Marine Sciences, ANU) for making superb thinsections from difficult samples; Ian McNiven for commenting on anearlier draft of this paper; the Australian Research Council for the awardof a Senior Research Fellowship to R.G.R.; Jose Abrantes and HiroyukiYoshida for preparation and OSL measurement of the quartz grains; JonOlley for high-resolution gamma-ray spectrometry measurements; RexGalbraith for statistical advice; Lee Arnold for drawing Figs 8 and 9;Kara Valle and Gary Swinton for drafting various figures; and GeoffDuller and James Scourse for useful comments on an earlier draft.
References
Adamiec G, Aitken M. 1998. Dose-rate conversion factors: update.Ancient TL 16: 37–50.
Aitken MJ. 1985. Thermoluminescence Dating. Academic Press:London.
Aitken MJ. 1998. An Introduction to Optical Dating. Oxford UniversityPress: Oxford.
Allen J, O’Connell JF. 2003. The long and the short of it: archaeologicalapproaches to determining when humans first colonised Australiaand New Guinea. Australian Archaeology 57: 5–19.
Anderson A, Roberts R, Dickinson W, Clark G, Burley D, de Biran A,Hope G, Nunn P. 2006. Times of sand: sedimentary history andarchaeology at the Sigatoka Dunes, Fiji. Geoarchaeology 21:131–154.
Arnold LJ, Bailey RM, Tucker GE. 2007. Statistical treatment of fluvialdose distributions from southern Colorado arroyo deposits.Quatern-ary Geochronology 2: 162–167.
Balme J. 2000. Excavations revealing 40,000 years of occupation atMimbi Caves in south central Kimberley of Western Australia.Australian Archaeology 51: 1–5.
Bateman MD, Boulter CH, Carr AS, Frederick CD, Peter D, Wilder M.2007. Detecting post-depositional sediment disturbance in sandydeposits using optical luminescence. Quaternary Geochronology 2:57–64.
Bird MI, Ayliffe LK, Fifield LK, Turney CSM, Cresswell RG, Barrows TT,David B. 1999. Radiocarbon dating of ‘old’ charcoal using a wetoxidation, stepped-combustion procedure. Radiocarbon 41:127–140.
Bird MI, Turney CSM, Fifield LK, Jones R, Ayliffe LK, Palmer A,Cresswell RG, Robertson S. 2002. Radiocarbon analysis of the earlyarchaeological site of Nauwalabila I, Arnhem Land, Australia:implications for sample suitability and stratigraphic integrity. Qua-ternary Science Reviews 21: 1061–1075.
Bowdler S. 1991. Some sort of dates at Malakunanja II: a reply toRoberts et al. Australian Archaeology 32: 50–51.
Bowler J, Magee J. 2000. Redating Australia’s oldest human remains: askeptic’s view. Journal of Human Evolution 38: 719–726.
Copyright 2007 John Wiley & Sons, Ltd.
Bowler J, Johnston H, Olley JM, Prescott JR, Roberts RG, Shawcross W,Spooner NA. 2003. New ages for human occupation and climaticchange at Lake Mungo, Australia. Nature 421: 837–840.
Brook BW, Bowman DMJS, Burney DA, Flannery TF, Gagan MK,Gillespie R, Johnson CN, Kershaw P, Magee JW, Martin PS, MillerGH, Peiser B, Roberts RG. 2007. Would the Australian megafaunahave become extinct if humans had never colonised the continent?Quaternary Science Reviews 26: 560–564.
Bultitude RJ. 1998. Geology. In Ngarrabullgan: Geographical Investi-gations in Djungan Country, Cape York Peninsula, David B (ed.).Monash Publications in Geography and Environmental Science 51,Monash University: Melbourne; 27–54.
Bulur E. 1996. An alternative technique for optically stimulated lumi-nescence (OSL) experiment. Radiation Measurements 26: 701–709.
Butler D. 1998. Environmental change in the Quaternary. In Ngarra-bullgan: Geographical Investigations in Djungan Country, Cape YorkPeninsula, David B (ed.). Monash Publications in Geography andEnvironmental Science 51, Monash University: Melbourne; 78–91.
Cosgrove R. 2007. Global expansion 300,000–8000 years ago, Aus-tralia. In Encyclopedia of Quaternary Science, Elias SA (ed.). Elsevier:Oxford; 118–129.
Chappell J. 2002. Sea level changes forced ice breakouts in the LastGlacial cycle: new results from coral terraces. Quaternary ScienceReviews 21: 1229–1240.
Chappell J, Omura A, Esat T, McCulloch M, Pandolfi J, Ota Y, Pillans B.1996. Reconciliation of late Quaternary sea levels derived from coralterraces at Huon Peninsula with deep sea oxygen isotope records.Earth and Planetary Science Letters 141: 227–236.
David B. 2002. Landscapes, Rock-art and the Dreaming. LeicesterUniversity Press: London.
David B,WilsonM. 1999. Re-reading the landscape: place and identityin NE Australia during the late Holocene. Cambridge ArchaeologicalJournal 9: 163–188.
David B, Roberts R, Tuniz C, Jones R, Head J. 1997. New optical andradiocarbon dates from Ngarrabullgan Cave, a Pleistocene archae-ological site in Australia: implications for the comparability of timeclocks and for the human colonization of Australia. Antiquity 71:183–188.
David B, McNiven I, Bekessy L, Bultitude R, Clarkson C, Lawson E,Murray C, Tuniz C. 1998. More than 37,000 years of humanoccupation. In Ngarrabullgan: Geographical Investigations in Djun-gan Country, Cape York Peninsula, David B (ed.). Monash Publi-cations in Geography and Environmental Science 51, MonashUniversity: Melbourne; 157–178.
Feathers JK. 2003. Use of luminescence dating in archaeology.Measurement Science and Technology 14: 1493–1509.
Feathers JK, Rhodes EJ, Huot S, McAvoy JM. 2006a. Luminescencedating of sand deposits related to late Pleistocene human occupationat the Cactus Hill site, Virginia, USA. Quaternary Geochronology 1:167–187.
Feathers JK, Holliday VT, Meltzer DJ. 2006b. Optically stimulatedluminescence dating of Southern High Plains archaeological sites.Journal of Archaeological Science 33: 1651–1665.
Fullagar RLK, Price DM, Head LM. 1996. Early human occupationof northern Australia: archaeology and thermoluminescence datingof Jinmium rockshelter, northern Australia. Antiquity 70: 751–773.
Galbraith RF. 2005. Statistics for Fission Track Analysis. Chapman &Hall/CRC Press: Boca Raton, FL.
Galbraith RF, Green PF. 1990. Estimating the component ages in a finitemixture. Nuclear Tracks and Radiation Measurements 17: 197–206.
Galbraith RF, Roberts RG, Laslett GM, Yoshida H, Olley JM. 1999.Optical dating of single and multiple grains of quartz from Jinmiumrock shelter, northern Australia: Part I, Experimental design andstatistical models. Archaeometry 41: 339–364.
Galbraith RF, Roberts RG, Yoshida H. 2005. Error variation in OSLpalaeodose estimates from single aliquots of quartz: a factorialexperiment. Radiation Measurements 39: 289–307.
Gillespie R. 2002. Dating the first Australians. Radiocarbon 44:455–472.
Gillespie R, Roberts RG. 2000. On the reliability of age estimates forhuman remains at Lake Mungo. Journal of Human Evolution 38:727–732.
J. Quaternary Sci., Vol. 22(5) 449–479 (2007)DOI: 10.1002/jqs

478 JOURNAL OF QUATERNARY SCIENCE
Gillespie R, Brook BW, Baynes A. 2006. Short overlap of humans andmegafauna in Pleistocene Australia. Alcheringa Special Issue 1:163–186.
Groube L, Chappell J, Muke J, Price D. 1986. A 40,000 year-old humanoccupation site at Huon Peninsula, Papua New Guinea.Nature 324:453–455.
Grun R, Spooner NA, Thorne A, Mortimer G, Simpson JJ, McCulloughMT, Taylor L, Curnoe D. 2000. Age of the Lake Mungo 3 skeleton: areply to Bowler and Magee and to Gillespie and Roberts. Journal ofHuman Evolution 38: 733–741.
Hall L, Whittier J, Schulz M, Macrokanis C. 1998. Up on a rock:mammals and birds. In Ngarrabullgan: Geographical Investigationsin Djungan Country, Cape York Peninsula, David B (ed.). MonashPublications in Geography and Environmental Science 51, MonashUniversity: Melbourne; 130–142.
Hiscock P. 1985. The need for a taphonomic perspective in stoneartefact analysis. Queensland Archaeological Research 2: 82–97.
Holden A. 1999. A technological analysis of the lithic assemblage fromHay Cave, SE Cape York Peninsula: considering diachronic vari-ations in patterns of ‘intensity of site use’. BA Honours thesis, TheUniversity of Queensland, St Lucia.
Hughen KA, Baillie MGL, Bard E, Beck JW, Bertrand CJH, BlackwellPG, Buck CE, Burr GS, Cutler KB, Damon PE, Edwards RL, FairbanksRG, Friedrich M, Guilderson TP, Kromer B, McCormac FG, ManningS, Bronk Ramsey C, Reimer PJ, Reimer RW, Remmele S, Southon JR,Stuiver M, Talamo S, Taylor FW, Van der Plicht J, Weyhenmeyer CE.2004.Marine04 radiocarbon age calibration, 0–26 cal kyr BP. Radio-carbon 46: 1059–1086.
Huntley DJ, Godfrey-Smith DI, Thewalt MLW. 1985. Optical dating ofsediments. Nature 313: 105–107.
Jacobs Z, Wintle AG, Duller GAT. 2003a. Optical dating of dune sandfrom Blombos Cave, South Africa: I—Multiple grain data. Journal ofHuman Evolution 44: 599–612.
Jacobs Z, Duller GAT, Wintle AG. 2003b. Optical dating of dune sandfrom Blombos Cave, South Africa: II—Single grain data. Journal ofHuman Evolution 44: 613–625.
Jacobs Z, Duller GAT, Wintle AG, Henshilwood CS. 2006. Extendingthe chronology of deposits at Blombos Cave, South Africa, back to140 ka using optical dating of single and multiple grains of quartz.Journal of Human Evolution 51: 255–273.
Jacobs Z, Wintle AG, Duller GAT, Roberts RG, Wadley L. 2007. Newages for the post-Howiesons Poort, late and final Middle Stone Age atSibudu, South Africa. Journal of Archaeological Science (submitted).
Kershaw AP. 1986. Climatic change and Aboriginal burning in north-east Australia during the last two glacial/interglacial cycles. Nature322: 47–49.
Lamb L. 1996. Investigating changing stone technologies, site use andoccupational intensities at Fern Cave, north Queensland. AustralianArchaeology 42: 1–7.
Li B, Li S-H. 2006. Comparison of De estimates using the fast com-ponent and the medium component of quartz OSL. RadiationMeasurements 41: 125–136.
Lian OB, Roberts RG. 2006. Dating the Quaternary: progress inluminescence dating of sediments. Quaternary Science Reviews25: 2449–2468.
Mayya YS, Morthekai P, Murari MK, Singhvi AK. 2006. Towardsquantifying beta microdosimetric effects in single-grain quartz dosedistribution. Radiation Measurements 41: 1032–1039.
Mejdahl V. 1979. Thermoluminescence dating: beta-dose attenuationin quartz grains. Archaeometry 21: 61–72.
Mialanes J. 2005. 50,000 years of occupation at Ngarrabullgan (south-east Cape York Peninsula, North Queensland): the stone artefacttechnological evidence. PhD thesis, University of Melbourne, Mel-bourne.
Miller GH, Magee JW, Johnson BJ, Fogel ML, Spooner NA, McCullochMT, Ayliffe LK. 1999. Pleistocene extinction of Genyornis newtoni:human impact on Australian megafauna. Science 283: 205–208.
Murray AS, Roberts RG. 1997. Determining the burial time of singlegrains of quartz using optically stimulated luminescence. Earth andPlanetary Science Letters 152: 163–180.
Nathan RP, Thomas PJ, Jain M, Murray AS, Rhodes EJ. 2003. Environ-mental dose rate heterogeneity of beta radiation and its implications
Copyright 2007 John Wiley & Sons, Ltd.
for luminescence dating: Monte Carlo modelling and experimentalvalidation. Radiation Measurements 37: 305–313.
O’Connor S. 1995. Carpenter’s Gap Rockshelter 1: 40,000 years ofAboriginal occupation in the Napier Ranges, Kimberley, WA. Aus-tralian Archaeology 40: 58–59.
Olley JM, Murray A, Roberts RG. 1996. The effects of disequilibria inthe uranium and thorium decay chains on burial dose rates in fluvialsediments. Quaternary Science Reviews 15: 751–760.
Olley JM, Roberts RG, Murray AS. 1997. Disequilibria in the uraniumdecay series in sedimentary deposits at Allen’s Cave, Nullarbor Plain,Australia: implications for dose rate determinations. RadiationMeasurements 27: 433–443.
Olley JM, Caitcheon GG, Roberts RG. 1999. The origin of dosedistributions in fluvial sediments, and the prospect of dating singlegrains from fluvial deposits using optically stimulated luminescence.Radiation Measurements 30: 207–217.
Olley JM, Pietsch T, Roberts RG. 2004a. Optical dating of Holocenesediments from a variety of geomorphic settings using single grains ofquartz. Geomorphology 60: 337–358.
Olley JM, De Deckker P, Roberts RG, Fifield LK, Yoshida H, HancockG. 2004b. Optical dating of deep-sea sediments using single grains ofquartz: a comparison with radiocarbon. Sedimentary Geology 169:175–189.
Olley JM, Roberts RG, Yoshida H, Bowler JM. 2006. Single-grainoptical dating of grave-infill associated with human burials at LakeMungo, Australia. Quaternary Science Reviews 25: 2469–2474.
Pearce RH, Barbetti M. 1981. A 38,000 year-old archaeological site atUpper Swan,WesternAustralia.Archaeology inOceania 16: 173–178.
Porat N, Rosen SA, Boaretto E, Avni Y. 2006. Dating the RamatSaharonim Late Neolithic desert cult site. Journal of ArchaeologicalScience 33: 1341–1355.
Prescott JR, Hutton JT. 1994. Cosmic ray contributions to dose rates forluminescence and ESR dating: large depths and long-term timevariations. Radiation Measurements 23: 497–500.
Prideaux GJ, Roberts RG, Megirian D, Westaway KE, Hellstrom JC,Olley JM. 2007. Mammalian responses to Pleistocene climatechange in southeastern Australia. Geology 35: 33–36.
Readhead ML. 1987. Thermoluminescence dose rate data and datingequations for the case of disequilibrium in the decay series. NuclearTracks and Radiation Measurements 13: 197–207.
Roberts RG. 1997. Luminescence dating in archaeology: from origins tooptical. Radiation Measurements 27: 819–892.
Roberts RG, Jones R. 1994. Luminescence dating of sediments: newlight on the human colonisation of Australia. Australian AboriginalStudies 2: 2–17.
Roberts RG, Jones R. 2001. Chronologies of carbon and of silica:evidence concerning the dating of the earliest human presence innorthern Australia. In Humanity from African Naissance to ComingMillennia: Colloquia in Human Biology and Palaeoanthropology,Tobias PV, Raath MA, Moggi-Cecchi J, Doyle GA (eds). FirenzeUniversity Press, Firenze andWitwatersrand University Press: Johan-nesburg; 239–248.
Roberts RG, Jones R, SmithMA. 1990. Thermoluminescence dating of a50,000 year-old human occupation site in northern Australia.Nature345: 153–156.
Roberts RG, Jones R, Spooner NA, Head MJ, Murray AS, Smith MA.1994. The human colonisation of Australia: optical dates of 53,000and 60,000 years bracket human arrival at Deaf Adder Gorge,Northern Territory. Quaternary Science Reviews 13: 575–583.
Roberts RG, Spooner NA, Jones R, Cane S, Olley JM, Murray AS, HeadMJ. 1996. Preliminary luminescence dates for archaeological sedi-ments on the Nullarbor Plain, South Australia. Australian Archae-ology 42: 7–16.
Roberts R, Bird M, Olley J, Galbraith R, Lawson E, Laslett G, Yoshida H,Jones R, Fullagar R, Jacobsen G, Hua Q. 1998a. Optical and radio-carbon dating at Jinmium rock shelter in northern Australia. Nature393: 358–362.
Roberts R, Yoshida H, Galbraith R, Laslett G, Jones R, Smith M. 1998b.Single-aliquot and single-grain optical dating confirm thermolumi-nescence age estimates at Malakunanja II rock shelter in northernAustralia. Ancient TL 16: 19–24.
Roberts RG, Galbraith RF, Yoshida H, Laslett GM, Olley JM.2000. Distinguishing dose populations in sediment mixtures:
J. Quaternary Sci., Vol. 22(5) 449–479 (2007)DOI: 10.1002/jqs

SEDIMENT MIXING AT NONDA ROCK 479
a test of single-grain optical dating procedures using mixturesof laboratory- dosed quartz. Radiation Measurements 32: 459–465.
Roberts RG, Flannery TF, Ayliffe LK, Yoshida H, Olley JM, Prideaux GJ,Laslett GM, Baynes A, Smith MA, Jones R, Smith BL. 2001. New agesfor the last Australian megafauna: continent-wide extinction about46,000 years ago. Science 292: 1888–1892.
Shaw JD, Wason S. 1998. Useful plants. In Ngarrabullgan: Geographi-cal Investigations in Djungan Country, Cape York Peninsula, David B(ed.). Monash Publications in Geography and Environmental Science51, Monash University: Melbourne; 92–97.
Singarayer JS, Bailey RM. 2003. Further investigations of the quartzoptically stimulated luminescence components using linear modu-lation. Radiation Measurements 37: 451–458.
Spate A. 1998. Landscapes. In Ngarrabullgan: Geographical Investi-gations in Djungan Country, Cape York Peninsula, David B (ed.).Monash Publications in Geography and Environmental Science 51,Monash University: Melbourne; 57–71.
Stokes S, Ingram S, Aitken MJ, Sirocko F, Anderson R, Leuschner D.2003. Alternative chronologies for Late Quaternary (Last Intergla-
Copyright 2007 John Wiley & Sons, Ltd.
cial–Holocene) deep sea sediments via optical dating of silt-sizequartz. Quaternary Science Reviews 22: 925–941.
Thorne A, Grun R, Mortimer G, Spooner NA, Simpson JJ, McCulloughMT, Taylor L, CurnoeD. 1999. Australia’s oldest human remains: ageof the Lake Mungo 3 skeleton. Journal of Human Evolution 36:591–612.
Truscott AJ, Duller GAT, Bøtter-Jensen L, Murray AS, Wintle AG. 2000.Reproducibility of optically stimulated luminescence measurementsfrom single grains of Al2O3:C and annealed quartz. RadiationMeasurements 32: 447–451.
Turney CSM, Bird M, Fifield LK, Roberts RG, Smith M, Dortch CE, GrunR, Lawson E, Ayliffe LK, Miller GH, Dortch J, Cresswell RG. 2001.Early human occupation at Devil’s Lair, southwestern Australia,50,000 years ago. Quaternary Research 55: 3–13.
Yoshida H, Roberts RG, Olley JM. 2003. Progress towards single-grainoptical dating of fossil mud-wasp nests and associated rock art innorthern Australia. Quaternary Science Reviews 22: 1273–1278.
Zhao H, Li S-H. 2005. Internal dose rate to K-feldspar grains fromradioactive elements other than potassium. Radiation Measurements40: 84–93.
J. Quaternary Sci., Vol. 22(5) 449–479 (2007)DOI: 10.1002/jqs