secular stagnation on the supply side: u.s. … · secular stagnation on the supply side: ... for...
TRANSCRIPT

Secular Stagnation on the Supply Side:
U.S. Productivity Growth in the Short and Long Run
Robert J. Gordon Northwestern University and NBER
Bank of Canada and European Central Bank, Conference on the Underwhelming Global Post-Crisis
Growth Performance Ottawa, June 8, 2015

Secular Stagnation: Applies Not Just to US but Canada,
EU-15, Japan
• Secular Stagnation: slow growth not no growth
• Most of my talk is about the U.S. • But almost everything here applies to Canada
and the EU-15 • At the end: charts comparing Canada, the
U.S., and the EU-15 for output per hour, output per capita, and hours per capita

Secular Stagnation 1938 and 2015 As the Mirror Image
• Sources emanate from supply side: – Hansen in 1938: slowing population growth and end of
territorial expansion • “the whole new outfit of capital formerly needed by the added
population is now no longer needed” – Today 2015: slowing potential GDP growth
• Potential Output per Hour • Potential Hours of Work
– Working-age Population – Falling Labor-force Participation Rate (LFPR) reduces Hours per capita
– Actual real GDP growth: 1974-2004 3.12, 2004-14 1.55 • “the whole new outfit of capital formerly needed by the added
population is now no longer needed”
• Mirror-image Interpretation, Hansen 1938 vs. U.S. now

Chains of Causation
• AS Effects directly reduce output per capita growth: – Declining LFPR – Declining productivity growth
• For any given rate of output per capita growth – Slower population growth reduces potential GDP growth
• Implies Lower Net Investment – Basic idea: long-run steady state with fixed capital-
output ratio – Slower output growth means slower growth in capital to
maintain fixed capital-output ratio • Lower net investment: reduces aggregate demand
and feeds back to lower productivity growth

Employment-Population Ratio and GDP Gap, 1919-1941

Decline in Population Growth As Seen From 1938 and 2015

Why Hansen Wasn’t Worried About Productivity Growth

Preview: Primary Source of Secular Stagnation is Slowing Productivity
Growth • Since Solow 1957: The history of TFP growth is the
best guide to the importance of innovation • The best organizing principle to think about
innovation is to distinguish among the industrial revolutions (IR #1, IR #2, IR #3).
• IR #2 was without compare in its impact in creating rapid TFP growth for a full half century
• IR #3 has changed our lives but has raised TFP growth less, for only a decade instead of a half-century.

To Understand TFP History, We Need Definitions of the Three IR’s
• The 1st IR occurred 1770-1840, continued impact through 1900 • Steam engine, railroad, steamships, wood=>steel
– The 2nd IR occurred 1870-1920, continued impact through 1970 along at least 6 dimensions • Electricity, light, elevators, machines, air conditioning • Internal combustion engine, vehicles, air transport • EICT: Telephone, phonograph, movies, radio, TV • Running water, sewer pipes, and the conquest of infant
mortality • Chemicals, plastics, antibiotics, modern medicine • Utter change in working conditions, job & home

Third Industrial Revolution
• Since 1960 the “EICT” Revolution (one dimension compared to the six dimensions of IR #2)
• Everything on this list has already happened; to continue TFP growth of 1970-2014 there must be a steady stream of innovations that are of similar importance – Entertainment: TV – color, cable, time shifting, HDTV, streaming – Information Tech – mainframes, minis, PCs, web browsers, e-
commerce – Communications: mobile phones, smart phones – Productivity enhancers: ATM, bar-code scanning, lightning-fast
credit card authorization – Search tools provide free information, both public and
proprietary inside the firm

The Standard of Living Is Not the Same as Productivity Growth
• Total Output or GDP (Y). • Total Hours of Work (H). • Total Population (N). • The Output Identity Y/N Ξ Y/H * H/N

Real GDP Per Capita Is Not the Same As TFP And Does Not Measure
Innovation

Per-capita Real GDP Growth Now Is Below Pessimistic Trend

Per-Capita Income Growth Does Not Equal Productivity Growth

The Same History, Just for Productivity (Y/H) Growth

Growth in Labor Productivity Over Three Eras

The Effect of Education and Capital Deepening
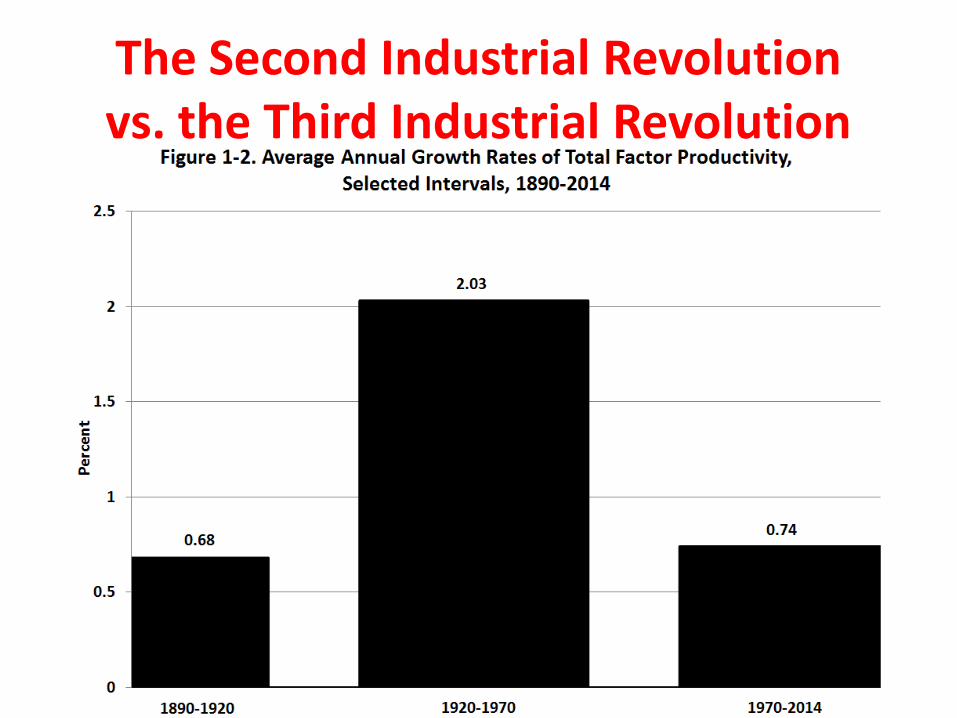
The Second Industrial Revolution vs. the Third Industrial Revolution

The Powerful But Delayed Effect of IR #2 on TFP Growth

IR #2 Created “Big Green” TFP; IR #3 Created “Little Green” TFP

IR #3 Has Failed the TFP Test
• Failure #1: TFP growth post-1970 barely 1/3 of
1920-70 • Failure #2: IR #3 boosted TFP growth only briefly
1996-2004 • Brynjolfsson and McAfee: “We’re at a point of
inflection of accelerating productivity growth” • My response: “Could the productivity benefits of
IR #3 be almost over?”

The IR #3 Changed Business Practices Completely 1970-2005
• Transformation in offices completed by 2005.
– 1970 mechanical calculators, repetitive retyping, file cards, filing cabinets
– 1970s and 1980s. Memory typewriters, electronic calculators, PCs with word processing and spreadsheets. E-mail.
– 1990s. T-1 lines, in-house software. The web, search engines, e-commerce
– 2000-05 flat screens, revolution in business practices was over • Transformation in retailing completed by 2005
– 1980s and 1990s Wal-Mart led big box revolution with innovations in supply chain and inventory management
– Check-out revolution: bar-code scanners, credit/debit card authorization technology

More Achievements Completed by 2005
• Finance and Banking – 1970s and 1980s, ATM machines – 1980s and 1990s. Transition from multi-million
share trading days to multi-billion share days
• How Long Ago Were the Creations: – Amazon 1994, Google 1998, Wiki and i-tunes
2001, Facebook 2004, iphone 2007

Summary: Stasis Everywhere You Look
• Offices use desktop computers and proprietary information as they did 10-15 years ago – The Northwestern econ department staff, 1998 vs. 2015
• Retail stasis. Shelves stocked by humans, meat sliced at service counters, checkout bar-code scanning. Maybe card authorization a bit faster
• Medicine: electronic medical records largely rolled out,
little or no change in what nurses and doctors do • Higher Education: cost inflation comes from rising
ratio of administrative staff to instructional staff
Stasis in Consumer Electronics
• NYT on Consumer Electronics Show, January 2014 • This show was a far cry from the shows of old . . .
Over the years it has been the place to spot some real innovations (VCR 1970, CD 1981, HDTV 1998)
• This year’s crop of products seemed a bit underwhelming by comparison
• Editor of gadget website: “This industry that employs all of these engineers . . . Needs you to throw out your old stuff and buy new stuff – even if that new stuff is only slightly upgraded.

Additional Evidence of Diminishing Returns
• Decline in Business “Dynamism” – Decline over last 30 years in creation of new
firms – In recent years more exiting firms than entering
firms
• Decline in labor market “Fluidity” – Decline in job and worker reallocation rates

Business “Dynamism” Represented by New Firm Entry

Stagnation Symptom #2: Declining Rate of Net Investment

Stagnation Symptom #3: Growth in Manufacturing Capacity

Stagnation Symptom # 4: The Most Dynamic Part of
Manufacturing Has Disappeared
0
1
2
3
4
5
6
7
8
9
1972 1977 1982 1987 1992 1997 2002 2007 2012
Share of ICT Manufacturing Value-Added in Total Manufacturing Sector, 1972-2013
Share as a Percentage

#5 and #6: Computer Prices and the Demise of “Moore’s Law”

Innovations Continue But How Important Are They?
• Medical and Pharmaceutical – Continuous slow but steady progress in advancing life
expectancy (but US vs. Canada) – Coming collision between physical wellness and mental
illness (Alzheimers) – Increasing costs of drug development, fewer important
new drugs • Small Robots and 3-D Printing
– Robots date back to 1961, continued development is evolutionary not revolutionary
– Amazon robots are not as smart as you might think – 3-D printing useful for development prototypes, not mass
production

Innovations Continue But How Important Are They?
• Big Data and Artificial Intelligence – Predominant uses of big data are in marketing, zero-sum
game – Application to legal searches, radiology reading
evolutionary, not revolutionary – Next wave of replacement of humans: personal financial
services (“Robo-advice”) and insurance agents • Driverless Cars and Trucks
– Truck drivers don’t just drive trucks, they unload them and stock the shelves
– Wholesale trade isn’t just gee-whiz Amazon warehouses. Most of it involves delivering bread, coke, and beer

Slower Growth Goes Beyond Innovation
• The educational plateau -- Increase in educational attainment coming to an end – Goldin and Katz 0.35 percent contribution of education – Jorgenson -0.30 downward adjustment to education’s
contribution, i.e., close to zero • U.S. steady decline in league tables of high-school
completion, four-year college completion – Poor preparation for college. International PISA test
scores rank out of 34 OECD countries: US #17 in reading, 20th in science, 27th in math
• New issues of college affordability and $1.2 trillion of student debt

The Effect of Education and Capital Deepening

Socioeconomic Changes with Adverse Future Implications
• Changes 1982 to 2008, children born out of wedlock – White high school grads 4 to 34 percent – White high school dropouts 21 to 42 percent – Black high school grads 48 to 74 percent – Black high school dropouts 76 to 96 percent
• Change 1960-2010, bottom 1/3 of white population – For 40-year-old women percent of children living
with both biological parents declined from 95 to 34 percent

Socioeconomic Changes with Adverse Future Implications
• Future consequences of single-parent households – More children growing up in poverty – Greater likelihood of future high-school dropping
out – Greater likelihood of criminal activity
• Additional adverse effects: 1979-2009 percent with prison records – white high school dropouts with prison records 4
to 28 percent blacks 15 to 68 percent

Trend in Labor Productivity Growth When Unemployment Rate is Fixed

Potential Output Growth (at a Constant Unemployment Rate)

Productivity Growth in the Short Run: Implications for the Future


Conclusions • 70 percent of all TFP growth since 1890 occurred
1920-70 • The big impacts on TFP of IR #3 were largely
completed by 2005 – Innovation continues but is less important in its
impact on labor productivity and TFP than in 1996-2004
• Educational plateau and socioeconomic decay subtract from future productivity growth
• Even if productivity growth returns to its 2004-14 average of 1.1, adding 0.4 points for hours yields potential output growth is only 1.5
• Implications of slow growth for fiscal solvency, debt-GDP ratio

Comparing Canada and the US: The Output Identity Again
• Total Output or GDP (Y). • Total Hours of Work (H). • Total Population (N). Y&H refer to total economy • The Productivity Identity Y/N Ξ Y/H * H/N

Ratios, PPP-Adjusted, Canada to US, Y/N, Y/H, and H/N, 1950-2013
70
75
80
85
90
95
100
105
110
115
120
1950 1955 1960 1965 1970 1975 1980 1985 1990 1995 2000 2005 2010
Perc
ent
Ratio of Canada to U.S., Hours per Person, Output per Person, and Output per Hour, 1950-2013
Hours per Person
Output per Person
Output per Hour

Productivity Growth Rates, 5-YR MA, Canada and the US, 1955-2013
0
0.5
1
1.5
2
2.5
3
3.5
4
1955 1960 1965 1970 1975 1980 1985 1990 1995 2000 2005 2010
Perc
ent
Five-Year Moving Average Growth Rate of Output per Hour, Canada and the U.S., 1955-2013
Canada
U.S.

Canada and the EU-15 Output per Hour Relative to the U.S., 1950-2013
30
40
50
60
70
80
90
100
1950 1955 1960 1965 1970 1975 1980 1985 1990 1995 2000 2005 2010
Ratio of Canada and EU15 to U.S., Output per Hour, 1950-2013
Canada
EU-15

Output per Hour, Ratio of the EU-15 to Canada, 1950-2013
40
50
60
70
80
90
100
110
1950 1955 1960 1965 1970 1975 1980 1985 1990 1995 2000 2005 2010
Ratio of EU15 to Canada, Output per Hour, 1950-2013

Ratios, Canada to US, Y/N, Y/H, and H/N
70
75
80
85
90
95
100
105
110
115
120
1950 1955 1960 1965 1970 1975 1980 1985 1990 1995 2000 2005 2010
Perc
ent
Ratio of Canada to U.S., Hours per Person, Output per Person, and Output per Hour, 1950-2013
Hours per Person
Output per Person
Output per Hour

Ratios Canada to U.S., Components of H/N, 1976-2013
90
95
100
105
110
1976 1981 1986 1991 1996 2001 2006 2011
Perc
ent
Ratio of Canada to U.S., Hours per Employee, LFPR, and Employment Rate, 1976-2013
LFPR
Employment Rate Hours per Employee

Five Dimensions of Superiority of Canada to the U.S.
• A Labor Market That Has Escaped a Precipitous Decline in Labor-Force Participation
• Medical Care as a Right of Citizenship • A University System without Exorbitant
Tuition or Mountains of Student Debt • An Immigration System Based on Skills • A Well-Regulated and Stable Financial System