secular stagnation: facts, causes and cures · e a voxeu.org book secular stagnation: facts, causes...
TRANSCRIPT

e
A VoxEU.org Book
Secular Stagnation: Facts, Causes and Cures
Edited by Coen Teulings and Richard Baldwin
Centre for Economic Policy Research
77 Bastwick Street, London EC1V 3PZTel: +44 (0)20 7183 8801 Email: [email protected] www.cepr.org
Six years after the Global Crisis, the recovery is still anaemic despite years of near-zero interest
rates and extraordinary central bank manoeuvres. Is ‘secular stagnation’ to blame?
This eBook gathers the thinking of leading economists including Larry Summers, Paul Krugman,
Robert Gordon, Olivier Blanchard, Richard Koo, Barry Eichengreen, Ricardo Caballero, Ed
Glaeser and a dozen others. A fairly strong consensus emerged on four points.
• Secular stagnation (SecStag) means that negative real interest rates are needed to
equate saving and investment at full-employment output levels.
• The key worry is that SecStag will make it hard to achieve full employment with low
inflationandfinancialstabilityusingmacroeconomicpolicyasitiscurrentlystructured
and operated.
• It is too early to tell whether secular stagnation is to blame, but uncertainty is not
an excuse for inaction. Policymakers should start thinking about solutions; if secular
stagnation sets in, today’s toolkit will be inadequate.
• Europe has more to fear from the possibility of secular stagnation than the US, given
its slower overall growth and its lack of pro-growth reforms and more constrained
policy framework.
The authors point to two classes of solutions: ‘Prevention’ (raising long-run growth potentials)
and‘symptomatictreatment’(raisingtheinflationtargettoalleviatethezerolowerbound
problem,andusingfiscalpolicytoaddressbalance-sheetrecessions).
Secular Stagnation: Facts, Causes and C
ures
aCEPR Press
aCEPR Press9 781907 142772
ISBN 978-1-907142-77-2


Secular Stagnation: Facts, Causes, and Cures
A VoxEU.org eBook

Centre for Economic Policy Research (CEPR)
Centre for Economic Policy Research3rd Floor77 Bastwick StreetLondon, EC1V 3PZUK
Tel: +44 (0)20 7183 8801Email: [email protected]: www.cepr.org
ISBN: 978-1-907142-77-2
© CEPR Press, 2014

Secular Stagnation: Facts, Causes, and Cures
A VoxEU.org eBook
edited by
Coen Teulings and Richard Baldwin
abcdeCEPR Press

Centre for Economic Policy Research (CEPR)
The Centre for Economic Policy Research (CEPR) is a network of almost 900 research economists based mostly in European universities. The Centre’s goal is twofold: to promote world-class research, and to get the policy-relevant results into the hands of key decision-makers. CEPR’s guiding principle is ‘Research excellence with policy relevance’. A registered charity since it was founded in 1983, CEPR is independent of all public and private interest groups. It takes no institutional stand on economic policy matters and its core funding comes from its Institutional Members and sales of publications. Because it draws on such a large network of researchers, its output reflects a broad spectrum of individual viewpoints as well as perspectives drawn from civil society.
CEPR research may include views on policy, but the Executive Committee of the Centre does not give prior review to its publications. The opinions expressed in this report are those of the authors and not those of CEPR.
Chair of the Board Guillermo de la DehesaPresident Richard PortesDirector Richard BaldwinResearch Director Kevin Hjortshøj O’Rourke

Contents
Introduction 1Richard Baldwin and Coen Teulings
Opening the debate
1 Reflectionsonthe‘NewSecularStagnation Hypothesis’ 27Laurence H Summers
Threeissues:Potentialgrowth,effectivedemand,andsclerosis
2 Secularstagnation:Areviewoftheissues 41Barry Eichengreen
3 Theturtle’sprogress:Secularstagnationmeetstheheadwinds 47Robert J Gordon
4 Fourobservationsonsecularstagnation 61Paul Krugman
5 Secularjoblessness 69Edward L Glaeser

vi
Furtheronpotentialgrowth
6 Secularstagnation?Notinyourlife 83Joel Mokyr
7 Secularstagnation:UShypochondria,European disease? 91Nicholas Crafts
Furtheroneffectivedemand
8 Aprolongedperiodoflowrealinterestrates? 101Olivier Blanchard, Davide Furceri and Andrea Pescatori
9 Ontheroleofsafeassetshortagesinsecular stagnation 111Ricardo J Caballero and Emmanuel Farhi
10 Amodelofsecularstagnation 123Gauti B. Eggertsson and Neil Mehrotra
11 Balance sheet recession is the reason for secular stagnation 131Richard C Koo
12 Monetarypolicycannotsolvesecularstagnation alone 143Guntram B Wolff
Furtheronsclerosis
13 Secularstagnation:AviewfromtheEurozone 153Juan F. Jimeno, Frank Smets and Jonathan Yiangou

vii
Richard Edward Baldwin is Professor of International Economics at the Graduate
Institute, Geneva since 1991, a part-time visiting research professor at the University of
Oxford since 2012, Director of CEPR since 2014, and Editor-in-Chief of Vox since he
founded it in June 2007. He was Co-managing Editor of the journal Economic Policy
from 2000 to 2005, Policy Director of CEPR since 2006, and Programme Director
of CEPR’s International Trade programme from 1991 to 2001. Before that he was a
Senior Staff Economist for the President’s Council of Economic Advisors in the Bush
Administration (1990-1991), on leave from Columbia University Business School where
he was Associate Professor. He did his PhD in economics at MIT with Paul Krugman
and has published a half dozens articles with him. He was visiting professor at MIT
in 2002/03 and has taught at universities in Australia, Italy, Germany and Norway. He
has also worked as consultant for the numerous governments, the Asian Development
Bank, the European Commission, OECD, World Bank, EFTA, and USAID. The author
of numerous books and articles, his research interests include international trade,
globalisation, regionalism, and European integration.
A citizen of France, Olivier Blanchard has spent his professional life in the US. After
obtaining his PhD in Economics at the MIT in 1977, he taught at Harvard University,
returning to MIT in 1982. He was chair of the department from 1998 to 2003, retired
in 2013, and is now Robert Solow Professor Emeritus. He is currently the Economic
Counsellor and Director of the Research Department of the IMF. He has worked on
a wide set of macroeconomic issues. He is the author of many books and articles,
including two textbooks on macroeconomics, one at the graduate level with Stanley
Fischer and one at the undergraduate level. He is a fellow and past council member of
the Econometric Society, a past vice president of the American Economic Association,
and a member of the American Academy of Sciences.
About the contributors

viii
Secular Stagnation: Facts, Causes, and Cures
Ricardo J Caballero is the Ford International Professor of Economics and Director
of the World Economic Laboratory at MIT, an NBER Research Associate, an advisor
of QFR Capital Management LP, and a board member of LATAM Airlines and CEP.
Caballero was the Chairman of MIT’s Economics Department (2008-2011). Among
his major awards, he received the 2002 Frisch Medal of the Econometric Society and
the Smith Breeden Prize by the American Finance Association in 2008. Caballero is
a Fellow of the Econometric Society of the American Academy of Arts and Sciences.
Nicholas Crafts is Professor of Economic History and Director of the ESRC Research
Centre on Competitive Advantage in the Global Economy (CAGE) at Warwick
University. He is a Fellow of the British Academy. His earlier career included positions
at UC Berkeley, London School of Economics, Stanford and Oxford. His research
interests focus on comparative long-run economic growth and the economic history
of the 1930s. Recent publications include “Returning to Growth: Policy Lessons from
History” in Fiscal Studies (2013), and “20th-Century Growth” in Aghion and Durlauf
(eds), Handbook of Economic Growth (2014, with Kevin O’Rourke).
Gauti B Eggertsson is an Associate Professor at Brown University. He received his
PhD in Economics from Princeton University in 2004. He has worked at Research
Departments of the International Monetary Fund and the Federal Reserve Bank of New
York and taught at Princeton and Yale University.
Barry Eichengreen is George C. Pardee and Helen N. Pardee Professor of Economics
at the University of California, Berkeley; CEPR Research Fellow; and Research
Associate of the NBER. His most recent book is the forthcoming Hall of Mirrors:
The Great Recession, the Great Depression, and the Uses – and Misuses – of History
(Oxford University Press).
Emmanuel Farhi is a Professor of Economics at Harvard University and an NBER
Research Associate. His research focuses on macroeconomics, finance, international
economics, and public finance. He received his PhD from MIT in 2006.

About the contributors
ix
Davide Furceri is an economist at the Research Department of the International
Monetary Fund. He holds a PhD in Economics from the University of Illinois and a
doctoral degree in Regional Economics from the University of Palermo, from which
he is currently on leave. He previously worked as an economist at the Fiscal Policy
Division of the European Central Bank, and at the Macroeconomic Analysis Division
of the OECD. His research covers a range of issues in the area of macroeconomics,
public finance and international macroeconomics.
Edward Glaeser is the Fred and Eleanor Glimp Professor of Economics in the Faculty
of Arts and Sciences at Harvard University, where he has taught since 1992. He is
also Director of the Rappaport Institute for Greater Boston. He regularly teaches
microeconomic theory, and occasionally urban and public economics. He has published
dozens of papers on cities, economic growth, and law and economics. In particular, his
work has focused on the determinants of city growth and the role of cities as centres of
idea transmission. He received his PhD from the University of Chicago in 1992.
Robert J Gordon is Stanley G Harris Professor in the Social Sciences at Northwestern
University. His claim that future US economic growth will be substantially slower
than its historical performance has caused a worldwide controversy. His forthcoming
book, Beyond the Rainbow: The Rise and Fall of Growth in the American Standard
of Living, analyses the sources and effects of the rapid rise in the quality of life of
ordinary people over the century after 1870 and of slowing growth since 1970. Gordon
is a Distinguished Fellow of the American Economic Association, a Fellow of the
Econometric Society and also of the American Academy of Arts and Sciences.
Juan F Jimeno (PhD in Economics, MIT, 1990) is Head of the Research Division of
Banco de España since October 2004. Previously, he was Professor of Economics at
Universidad de Alcalá (Madrid), Senior Researcher at FEDEA, and Lecturer at the
London School of Economics. He is also a Research Fellow of CEPR and IZA, and
eEditor of the IZA Journal of Labor Policy. Currently, he is visiting DG-Research of
the ECB under a Duisenberg fellowship.
x
Secular Stagnation: Facts, Causes, and Cures
Richard C Koo is the Chief Economist of Nomura Research Institute (Tokyo) and a
Senior Advisor to Center for Strategic and International Studies (Washington, DC). Best
known for developing the concept of balance sheet recession, he has advised successive
Japanese prime ministers and taught at Waseda University as a Visiting Professor from
1998 to 2010. Prior to joining Nomura, he was an economist with the Federal Reserve
Bank of New York, and was a Doctoral Fellow of the Board of Governors of the Federal
Reserve System. His latest book, The Holy Grail of Macroeconomics - Lessons from
Japan’s Great Recession (John Wiley & Sons, 2008), has been sold in six different
languages.
Paul Krugman is professor of economics and international affairs at Princeton
University, Centenary Professor at the London School of Economics and an op-ed
columnist for The New York Times. In December 2008, he received the Nobel Memorial
Prize in Economic Sciences for 2008, honouring his work in international trade patterns.
He is the author or editor of 23 books and more than 200 professional journal articles,
many of them on international trade and finance. He is a Fellow of the Econometric
Society, a Research Fellow of CEPR, Research Associate of the NBER, and a member
of the Group of Thirty. He has served as a consultant to the Federal Reserve Bank of
New York, the World Bank, the International Monetary Fund, the United Nations, as
well as to a number of countries including Portugal and the Philippines.
Neil Mehrotra is an Assistant Professor of Economics at Brown University specialising
in macroeconomics, finance and labour markets. He received an AB (cum laude) in
Economics from Princeton University and his PhD in Economics from Columbia
University in 2013. Prior to his graduate studies at Columbia University, he worked
from 2005 to 2007 in the Investment Research division of Goldman Sachs in New York.
Joel Mokyr is the Robert H Strotz Professor of Arts and Sciences and Professor of
Economics and History at Northwestern University and Sackler Professor (by special
appointment) at the Eitan Berglas School of Economics at the University of Tel Aviv.
He specialises in economic history and the economics of technological change and

About the contributors
xi
population change. He is a director of the NBER and serves as chair of the advisory
committee of the Institutions, Organizations, and Growth programme of the Canadian
Institute of Advanced Research.
Andrea Pescatori is an economist in the North American division of the Western-
hemisphere department of the IMF. Previously, he spent four years at the Research
Department of the IMF. Prior to joining the IMF, he was an economist at the Research
Department of the Federal Reserve Bank of Cleveland and a visiting economist at the
International Finance Division of the Federal Reserve Board. Mr Pescatori was also
visiting fellow at the Riksbank and Ente L Einaudi (Banca d’Italia). He graduated
from Universitat Pompeu Fabra under the supervision of Jordi Galí and has published
extensively on monetary and fiscal policy issues, with particular emphasis on credit
frictions, the housing channel, and the role commodity prices.
Frank Smets is Adviser to the President of the ECB. He was Head of Research at the
ECB from 2008 until 2013. He is Professor at the Centre for Economic Studies of the
KU Leuven and honorary Duisenberg Professor at the University of Groningen. He is
a CEPR Research Fellow. He has published extensively on monetary, macroeconomic,
financial and international issues mostly related to central banking. He was Managing
Editor of the International Journal of Central Banking from 2008 till 2010. He holds a
PhD in Economics from Yale University.
Lawrence H. Summers is the Charles W. Eliot University Professor at Harvard
University and the Weil Director of the Mossavar-Rahmani Center for Business &
Government at Harvard’s Kennedy School. During the past two decades, he has served
in a series of senior policy positions in Washington, D.C., including the 71st Secretary
of the Treasury for President Clinton, Director of the National Economic Council for
President Obama and Vice President of Development Economics and Chief Economist
of the World Bank.
He received a bachelor of science degree from the Massachusetts Institute of Technology
in 1975 and was awarded a Ph.D. from Harvard in 1982. In 1983, he became one of
xii
Secular Stagnation: Facts, Causes, and Cures
the youngest individuals in recent history to be named as a tenured member of the
Harvard University faculty. In 1987, Mr. Summers became the first social scientist ever
to receive the annual Alan T. Waterman Award of the National Science Foundation
(NSF), and in 1993 he was awarded the John Bates Clark Medal, given every two years
to the outstanding American economist under the age of 40.
Coen Teulings is Professor of Economics at the University of Cambridge and part-
time Professor of Economics at the University of Amsterdam. He served for seven
years as president of CPB, the Netherlands Bureau for Economic Policy Analysis.
Previously, he was CEO of SEO Economic Research in Amsterdam from 2004 until
2006, Professor of Economics at the Erasmus University Rotterdam and Director of the
Tinbergen Institute from 1998 until 2004.
He earned his Masters in Economics cum laude at the University of Amsterdam in
1985 and in 1990 he received his PhD. His main publications are in the field of labour
economics (minimum wages, returns to education and income inequality, job search,
marriage markets in cities, and recently on returns to seniority).
Guntram Wolff is the Director of Bruegel. His research focuses on the European
economy and governance, on fiscal and monetary policy and on global finance. He
regularly testifies to the European Finance Ministers’ ECOFIN meeting, the European
Parliament and national parliaments and is a member of the French prime minister’s
Conseil d’Analyse Economique. Previously, he worked for the European Commission
and Deutsche Bundesbank. He holds a PhD from University of Bonn and taught at
Universities of Pittsburgh and Brussels.
Jonathan Yiangou is Principal Economist in the Counsel to the Executive Board of
the ECB. Previously he worked as an economist in European Institutions Division of
the ECB and at the European Commission. He holds a BA from the University of
Cambridge and an MSc from the London School of Economics.

1
Introduction
Coen Teulings andRichardBaldwin1
University of Cambridge and CEPR; Graduate Institute, Geneva and CEPR
Six years after the Crisis and the recovery is still anaemic despite years of zero interest
rates. Is ‘secular stagnation’ to blame? This eBook gathers the views of leading
economists including Larry Summers, Paul Krugman, Bob Gordon, Olivier Blanchard,
Richard Koo, Barry Eichengreen, Ricardo Caballero, Ed Glaeser and a dozen others. It
is too early to tell whether secular stagnation is really secular, but if it is, current policy
tools will be obsolete. Policymakers should start thinking about potential solutions.
Six years after the Global Crisis exploded and the recovery is still not going well. Pre-
Crisis GDP levels have been surpassed, but few advanced economies have returned to
pre-Crisis growth rates despite years of near-zero interest rates. Worryingly, the recent
growth is fragranced with hints of new financial bubbles.
The length of the Great Recession, and the extraordinary measures necessary to combat
it, created a widespread but ill-defined sense that something had changed. This ill-
defined sense was given a name when Larry Summers re-introduced the term ‘secular
stagnation’ in late 2013. But what does secular stagnation really mean? What has
changed? And if this is secular stagnation for real, what should be done about it?
With these questions in mind, we assembled a group of leading economists to offer
their views on secular stagnation. This is far from a homogenous group – they come
from different continents and different schools of thought. Their contributions were
1 We thank Axel Gottfries for skilful technical assistance and the Centre for MacroEconomics for financial support.

Secular Stagnation: Facts, Causes, and Cures
2
uncoordinated and they do not entirely agree, but a fairly strong consensus has emerged
on three points.
• First, a workable definition of secular stagnation is that negative real interest rates
are needed to equate saving and investment with full employment.
• Second, the key worry is that secular stagnation makes it much harder to achieve
full employment with low inflation and a zero lower bound (ZLB) on policy interest
rates.
Larry Summers’ chapter adds in financial stability: “It may be impossible for an economy
to achieve full employment, satisfactory growth and financial stability simultaneously
simply through the operation of conventional monetary policy”.
• Third, it is too early to know if secular stagnation is more than just old-fashioned
slow growth, but economists and policymakers should start thinking hard about
what should be done if secular stagnation materialises – the old macroeconomic
toolkit is inadequate.
Another important point concerns the US-Europe distinction. “Europeans should be
much more afraid than Americans”, Nick Crafts notes in his chapter. “The depressing
effects of slower growth of productive potential will probably be felt more keenly in
Europe.” Juan Jimeno, Frank Smets, and Jonathan Yiangou also make similar arguments
in their chapter.
The rest of our introduction structures the secular stagnation (SecStag for short) debate.
Section 1 disentangles various interpretations of SecStag as a roadmap for the rest of
this eBook. Section 2 digs deeper into the evolution of one variable that turns out to
be crucial to the debate: the real interest rate. Section 3 deals with a potentially nasty
consequence of low real interest rates: the emergence of bubbles. Section 4 sketches
the policy implications of the debate. Many engrained policy concepts fail in a SecStag
world. New economic thinking is needed. We trust the chapters of this book will offer
plenty of inspiration.

Introduction
3
1 Secularstagnation:Whatitisandwhyitmatters
In 1938, nine years after the beginning of the Great Depression, Alvin Hansen delivered
his presidential address, “Economic Progress and Declining Population Growth”.
Hansen held his talk after an era of unprecedented expansion of the US economy, both
in terms of population and the land available. The end of this period and the experience
of the Great Depression led Hansen to wonder whether there would be sufficient
investment demand to sustain future economic growth.
Larry Summers recently resurrected this idea in his November 2013 speech to the IMF
Forum – fleshing out his thinking in a February 2014 speech to the National Association
for Business Economics (Summers 2014). The ‘secular stagnation’ term struck a chord.
As Barry Eichengreen puts it in his perceptive contribution to this eBook: “The idea
that America and the other advanced economies might be suffering from more than the
hangover from a financial crisis resonated with many observers.”
The resonance, however, did not produce harmony. As Barry Eichengreen observes:
“But while the term ‘secular stagnation’ was widely repeated, it was not widely
understood. Secular stagnation, we have learned, is an economist’s Rorschach Test. It
means different things to different people.” Fortunately, Macroeconomics 101 provides
a straightforward way of structuring the various views.
1.1 Organising the SecStag discussion
Basic macroeconomics provides a three-pillar framework for thinking about an
economy’s future growth. First is the economy’s long-run potential growth rate. Second
is the deviation of actual growth from its potential. Third is one-off changes in the level
of GDP without a change in the long-run growth rate. All the various contributions
stress one or more of these. We address the pillars in turn.

Secular Stagnation: Facts, Causes, and Cures
4
Diminished long-run growth potential
• The first pillar focuses on Solow-Romer factors – growth may be low since the
long-run potential growth rate has fallen.
The first pillar comprises two blocks, since an economy’s growth potential depends
on: (i) the growth in productive inputs, and (ii) the growth in the efficiency with which
inputs are combined to produce output.
Bob Gordon’s chapter presents a thorough analysis of the pillar-one reasons for slow
future growth for the US. Going beyond his earlier work, Gordon stresses that his
2012 piece (Gordon 2012) is commonly misperceived as focusing only on technology.
His chapter also refines his view on technology: “In my numbers there is no forecast
of a future technological slowdown – productivity growth adjusted for educational
stagnation is predicted to be just as fast during 2007-32 as during 1972-2007.” His
argument is not that technological progress has stopped, but rather that it has returned to
its (low) historical norm. For the three decades before 1930 and the four decades since
1980, US total factor productivity (TFP) growth averaged about 0.5% annually. The
aberration was the intervening five decades where TFP grew three times faster.
Beyond technology, he focuses on four structural ‘headwinds’.
1. Demography: The population is stagnant, life expectancy is increasing rapidly.
2. Education: The mass education revolution is complete, no further increase in the
average US education level is to be expected.
3. Inequality: The raising share of the top 10% of the income distribution has deprived
the middle class of income growth since 1980.
4. Public debt: The gloomy outlook for public debt makes current public services
unsustainable.

Introduction
5
These will, he projects, knock off 1.2% from the 1891-2007 average US per capita
growth rate of 2.0%. On top of this, he deducts an additional 0.6% for productivity
growth that he views as being slower in coming decades than it has been in the past.
Joel Mokyr, Ed Glaeser, and Nick Crafts cast serious doubts on his technology
projections. In his chapter, Mokyr claims that IT, biotech, and new materials are
going revolutionise the world. He claims that the contribution of IT to our wellbeing
is not evident from the productivity statistics because the way “we measure GPD and
productivity growth is well designed for the wheat-and-steel economy”. It works when
pure quantities matter; it does not for measuring the fruits of the IT revolution. Or
as Glaeser puts it: “During the first ten years of my life (1967-1977), the only major
technological innovation that I observed entering our apartment was colour TV, and that
TV broadcast roughly the same set of channels over the decade. How can such a world
possibly be compared with innovations of the past decade?”
Glaeser’s chapter also introduces a fascinating twist on the faltering-innovation idea.
While rejecting the notion that human inventiveness has stalled, he questions whether
today’s inventions bring widespread benefits. “Perhaps, we are just experiencing an era
in which innovation benefits the few rather than the many”, he writes. New technology
impacts people as consumers and producers. Pre-1990 innovations tended to benefit
ordinary citizens as both consumers and producers. But today, he notes, “[h]ighly paid
workers work constantly to improve a service that is provided freely to hundreds of
millions of poorer users”. While he doesn’t tie this “inversion of the traditional nature of
innovation” to secular stagnation, it surely links up with Gordon’s inequality headwind.
Persistent GDP gaps
• The second pillar of the SecStag discussion is firmly Keynesian with all its modern
amendments and refinements – growth may be low since it is below its long-run
potential growth rate.

Secular Stagnation: Facts, Causes, and Cures
6
This was the basic premise of Summers’ 2013 remarks.2 As he put it: “Suppose that
the short-term real interest rate that was consistent with full employment had fallen to
negative two or negative three percent sometime in the middle of the last decade. …
[W]e may well need, in the years ahead, to think about how we manage an economy
in which the zero nominal interest rate is a chronic and systemic inhibitor of economic
activity, holding our economies back below their potential.”
This aggregate-demand-shortage view is also stressed in Paul Krugman’s chapter:
“Secular stagnation is the proposition that periods like the last five-plus years, when
even zero policy interest rates aren’t enough to restore full employment, are going to be
much more common in the future…”
Summers’ chapter in this eBook is plainly in the second-pillar, Keynesian camp, but it
shows an evolution of this thinking. His well-known 2014 address mentions financial
instability only once. His chapter in this eBook makes it part of the fundamental
policymaking predicament. “Macroeconomic policy as currently structured and
operated may have difficulty maintaining a posture of full employment and production
at potential”, he writes, “and if these goals are attained there is likely to be a price paid
in terms of financial stability.” In short, SecStag may force policymakers to choose
between sluggish growth and bubbles.
One long-lasting source of excess savings – and one that is particularly relevant to
European nations like Ireland and Spain – is the ‘balance-sheet recession’ notion
stressed by Richard Koo in his chapter. When a debt-financed bubble bursts, firms
and households simultaneously attempt to pay down their debt. While sensible at the
individual level, the result is an enduring lack of aggregate demand. If the new savings
fail to find new investment opportunities, GDP may fall and Keynes’s paradox-of-thrift
can worsen balance sheets, thus prolonging the recession.
2 A transcript is available at https://m.facebook.com/notes/randy-fellmy/transcript-of-larry-summers-speech-at-the-imf-economic-forum-nov-8-2013/585630634864563. The video is available at https://www.youtube.com/watch?v=KYpVzBbQIX0.

Introduction
7
One-off supply-side damage
• The third pillar in our Macro 101 framework emphasises levels rather than growth
rates – especially one-off, crisis-linked damage to the economy’s potential output.
This part of the SecStag discussion draws on a much older literature on labour market
hysteresis. In their seminal paper, Blanchard and Summers (1986) coined the term
‘Eurosclerosis’, as they viewed hysteresis as a European problem. After each recession,
unemployment jumped up, never to return to its pre-recession level.
Glaeser shows that up to 1970, the share of US prime-aged males without jobs was 5%
in good times and 8% in downturns. After 1970, a ratchet effect kicked in; recession-
linked rises in joblessness were not fully reversed during recoveries. The damage is
permanent, according to Glaeser: “Human capital depreciates off-the-job, so talent is
lost.” This sort of one-off supply-side damage could account for why US growth seems
to have converged back to its pre-Crisis rate, but not to its pre-Crisis trajectory. Gordon’s
chapter cites recent research showing that about half the US decline in participation
comes from ageing and the other half is from declining participation within age groups,
due in part to weak economic conditions.
Importantly, ratchet-like labour participation problems don’t seem to be the story in
Europe, as Figure 1 shows. Employment rates in old sclerotic France improved, while
those in the US worsened.

Secular Stagnation: Facts, Causes, and Cures
8
Figure 1 Employment rate, ages 25-54, US and France
70%
72%
74%
76%
78%
80%
82%
84% 19
99
1999
20
00
2001
20
02
2003
20
04
2004
20
05
2006
20
07
2008
20
09
2009
20
10
2011
20
12
2013
Employment rate, aged 25-54,all persons for France
Employment rate, aged 25-54, all persons for the US
Source: FRED online database, http://research.stlouisfed.org/
Indeed, the left panel of Figure 2 shows that the US is an outlier among the four largest
economies (US, China, Japan, and Germany) and the Eurozone (EZ). The data show
the clear secular decline for the US, with US participation now by far the lowest among
the world’s four largest individual economies (although it is similar to the Eurozone’s
overall average). More than one in five prime-aged American men are without a job.
Figure 2 Labour force participation rate of men aged 15-64, 1990 – 2012.
Ireland Italy
Greece Portugal
Spain
70 72 74 76 78 80 82 84 86 88 90
1990
19
92
1994
19
96
1998
20
00
2002
20
04
2006
20
08
2010
20
12
China Germany
Japan
US EZ
70 72 74 76 78 80 82 84 86 88 90
1990
19
92
1994
19
96
1998
20
00
2002
20
04
2006
20
08
2010
20
12
Notes: The figure focuses on prime-aged males to avoid issues regarding changes in the societal views on child-care governing female labour supply and issues regarding the take-up of education and retirement.
Source: World Bank online database, series SL.TLF.ACTI.MA.ZS.

Introduction
9
The right panel of the chart shows the same figures for European countries hit severely
by the Crisis. Here again, the US ratchet pattern is missing, with Italy being perhaps
the exception. Spain, Portugal, Greece, and Ireland experienced recession-linked dips
in labour force participation, but these are not particularly marked compared to the
early 1990s recession, though a particularly high share of labour is unemployed in both
Spain and Greece. Given the importance of employment rates in the SecStag debate,
this striking transatlantic difference surely deserves further attention.
2 Lowrealinterestrates:Whytheymatterandwhytheyfell
Krugman’s chapter shows that the US real interest rates averaged over peak-to-peak
business cycles dropped from 5% in the 1980s, to 2% in the 1990s, and to just 1% in
the 2000s. Since the Lehman collapse, they have averaged about -1%. Figure 3 shows
the long-run decline in the US and the recent decline in the Eurozone, as well as their
connection to inflation.
Figure 3 Real interest rates in the US and the Eurozone
-10
-5
0
5
10
15
1980
19
82
1984
19
86
1988
19
90
1992
19
94
1996
19
98
2000
20
02
2004
20
06
2008
20
10
2012
20
14
US real interest rates Real rate
Inflation
30yr
-4
-2
0
2
4
6
1994
1996
1998
2000
2002
2004
2006
2008
2010
2012
2014
EZ real interest rates Real rate
Inflation
Note: The US chart depicts both the real interest rate calculated as the difference between overnight interest rate and inflation and the rate for 30-year inflation-linked bonds. The latter is less sensitive to business cycle fluctuations and therefore provides a cleaner picture of the decline.
Source: ECB and Bloomberg.
Secular Stagnation: Facts, Causes, and Cures
10
2.1 Why low interest rates matter
Low real interest rates play a linchpin role in the secular stagnation debate for two
reasons.
• First, if real rates are low in normal times, adverse macroeconomic shocks are more
likely to require negative real rates to restore a full-employment investment-savings
balance.
In today’s low-inflation environment, this tends to undermine the effectiveness of
monetary policy.
• Second, low nominal and real interest rates undermine financial stability.
Summers lists three channels through which low rates may foster instability: (i) they
increase risk-taking as investors reach for yield; (ii) they promote irresponsible lending
as coupon obligations become very low and easy to meet; and (iii) they make Ponzi
financial structures more attractive as interest rates look low relative to expected growth
rates. “Something of this kind was surely at work during the 2003-07 period”, he asserts.
2.2 Why real interests have fallen
A bouquet of contributions focuses on why equilibrium real interest rates have fallen
steadily over the past few decades. Standard determinants of the ‘natural’ or ‘Wicksellian’
rate are: (i) the savings-supply schedule, (ii) the investment-demand schedule, and (iii)
the relative demand for safe versus risky assets.3 The chapter by Olivier Blanchard,
Davide Furceri and Andrea Pescatori looks at determinants of the natural rate of decline
from a global perspective, while the chapter by Juan Jimeno, Frank Smets and Jonathan
Yiangou focuses on the Eurozone.
3 In the short run, monetary policy can also influence the real rate. But Blanchard, Furceri and Pescatori find that “the monetary policy stance of most advanced economies was on average neutral, contributing little to the determination of long-term real interest rates”.

Introduction
11
We consider these factors in turn.
The supply of loanable funds
An outward shift in the supply of loanable funds could help explain the lower real
interest rates. Such shifts are tied to demographics assuming people saving to smooth
lifetime consumption. The chapter by Gauti Eggertsson and Neil Mehrotra chapter is
theoretical, but the demography-savings link can be quantified.
In Table 1 we have calibrated their model to calculate the stock of saving required for
consumption-smoothing for the world’s four largest economies – assuming that there
were no pay-as-you-go (PAYG) transfers between generations. The numbers show that
the demographic shift has led to a dramatic increase in the required stock of savings in
all four countries over the past 40 years.
For example, required savings rose from almost two times GDP in 1970 to three and
a quarter times GDP in 2010 for Germany. Three factors contributed to this increase:4
the increase in life expectancy (see Table1), the lower retirement age, and the decline
in the growth rate of the population. The increase in years of education is the only
factor pushing in the other direction. The latter explains why the US has seen the most
dramatic increase in the required savings despite its demography shifting the least. By
1970, the education revolution was almost over in the US, while in other countries the
take-up of education by new cohorts has gone up substantially since 1970.
Our rough calculations suggest that there was sizeable swing between 1970 and 2010 in
the required stock of savings necessary to smooth lifetime consumption. Given the size
of the nations listed (40% of world GDP) and the fact that the rest of Europe resembles
Germany and many developing nations resemble China, it seems clear that the increase
in the required stock of savings has been a global phenomenon.
4 Tables for each of these variables are available here.

Secular Stagnation: Facts, Causes, and Cures
12
Table 1 The implications of demographic change for the required stock of savings
Share of world GDP
(%)Life expectancy (years)
Required stock of savings (share of GDP)
2010 1970 1990 2010 1970 1990 2010
US 23.37 70.90 75.30 78.60 -2.28 -0.20 0.52China 9.26 62.90 69.50 74.90 -0.40 -0.48 0.86Japan 8.58 72.00 78.90 82.90 -1.76 -0.27 1.19Germany 5.17 70.60 75.30 80.50 1.89 2.49 3.25
Note: The required-savings calculation assumes perfect consumption-smoothing from the age of ten until expected death, using life expectancy. The calculation takes into account the years of education before the start of the labour market career, the age of retirement, and the population growth rate. The formula used for the calculation can be found here.
Source: IMF, OECD and own calculations for required savings stock.
Demand for loanable funds
Blanchard, Furceri and Pescatori attribute little explanatory power to the investment
side. But Glaeser makes some interesting points about how the heightened role of IT
sectors could shift the investment demand schedule. The key is that the development
of high value-added services by Google, Microsoft, Amazon, Facebook and the like
require relatively little investment. Summers (2014) makes a similar point in noting
that WhatsApp has a greater market value than Sony but required next to no capital
investment to achieve it. More detailed work is needed, but the rough numbers suggest
it could be important. According to PwC’s Global Top 100 companies, IT companies
account for 25% of the market capitalisation of the top 100 companies in 2014.5
Relative demand for safe assets
Most real interest rate calculations are based ultimately on the nominal return to safe
assets such as US Treasury bills. The price of such bonds depends, inter alia, on their
5 IT includes Amazon (which is classified by PwC as Consumer Services). The grand total excludes Financial Services to avoid double-counting.

Introduction
13
supply and the safety preferences of financial investors. There are good reasons for
supposing that both have shifted.
Ricardo Caballero and Emmanuel Farhi show in their chapter that the supply of safe
assets fell from 37% of world GDP in 2007 to 18% in 2011. The financial crisis carved
out almost half of the supply of safe assets. The main culprits are the collapse of the
market for asset and mortgage-backed securities and the downgrading of sovereign debt
from Italy and Spain. The financial technology for producing risk-free assets proved to
be inadequate.
On the demand side of the market, an opposite trend hit. Pension funds, banks, and
insurance companies were forced by regulators to increase their holdings of safe assets.
This led to massive excess demand for safe assets. Not surprisingly, the risk-free interest
dropped to a historic trough.
3 Bubblesandlowinterestrates
Beyond ZLB issues, which have been the main concern in the SecStag discussion to
date, low real rates can produce bubbles and foster financial instability – as Summers
argues forcefully in his chapter. When the real rate, r, falls to values close to the
economy’s growth rate, g, asset prices start to explode in a ‘rational’ way (as pointed
out by Tirole 1985).
A typical example is gold. If the gold supply is fixed and everyone invests a fixed share
of their rising income in gold, the price of gold will rise at the income growth rate, g. As
long as g is at least as high as the alternative real interest rate r, we get a rational bubble
– defining a bubble as an asset whose price exceeds the present value of its associated

Secular Stagnation: Facts, Causes, and Cures
14
income stream.6 But even without such extreme outcomes, low r tends to encourage
bubbly asset prices, as Summers argues.
Bubbles are an alternative way for society to deal with excess saving when fiscal policy
does not take up the challenge. Buying bubbly assets with the intention of selling
them at a later date is an alternative route of saving for future consumption. When
nobody wants to invest because r is below g, and hence buys bubbly assets, the price of
these assets goes up, yielding windfall profits to their sellers who are therefore able to
increase their consumption. This additional consumption restores the balance between
supply and demand for loanable funds on the capital market. This explains why so
many high-valued apartments in Shanghai are vacant. They are just bubbly assets,
stores of value. This fits theory: g is high in China, r is not, and rational bubbles are
thus likely to emerge.
Richard Koo stresses in his contribution the necessity for fiscal policy to absorb the
excess saving after a bubble has burst and the private sector has to deleverage. The
above argument takes this reasoning one step further: fiscal policy should help to avoid
rational bubbles to emerge. This is the paradox of ageing societies. Ageing leads – other
things being equal – to an increase in the required stock of savings (see Table 1). A
greater supply of savings is one of the Wicksellian forces pushing the real interest rate
down. Hence, ageing societies might run a greater risk of bubbles popping up.
As Blanchard, Furceri and Pescatori show, the capital market has become increasingly
globalised. From that perspective, dealing with excess saving is a global issue, as
demonstrated in the years prior to the Great Recession, when the US housing market
absorbed China’s excess saving. However, in times of crisis capital tends to repatriate
to its country of origin. From that perspective, China and Europe – the two parts of the
world economy that have the most excess saving – should solve their saving problem
6 The real estate bubbles in Spain and Ireland were irrational, at least in retrospect. One could know that there would be no demand for such a high construction volume. The more price elastic the supply of a bubbly asset, the greater the risk that a bubble goes bust, as more and more people start investing in the production of the bubbly asset. This makes real estate in the centre of prime cities an attractive bubbly asset – its supply is limited by the availability of land in the city centre (see the analysis of debt-financed bubbles in Koo’s contribution).

Introduction
15
themselves. Other parts of the world are unlikely to provide the investment opportunities
they are looking for.
Such issues, however, deserve more attention. As Summers writes: “There is important
work to be done elucidating the idea of secular stagnation in an open economy context.”
4 Policyresponses
Slow growth is hardly a novel policy problem; why should calling it ‘secular stagnation’
change anything? The analysis of many authors in this eBook provides a clear rejection
of this scepticism.
• Secular stagnation is different since it undermines the most powerful and flexible
tool we have for keeping growth near its potential rate – standard monetary policy.
A workable definition for secular stagnation is that negative real interest rates are needed
to equate saving and investment with full employment. As such, secular stagnation
raises the likelihood that full employment cannot be achieved because low inflation and
the ZLB on nominal interest rates keep real rates firmly positive.
Krugman goes further: “The idea that the liquidity trap is temporary has shaped
the analysis of both monetary and fiscal policy. … [T]he real possibility that we’ve
entered an era of secular stagnation requires a major rethinking of macroeconomic
policy.” If monetary policy continues to be constrained by the ZLB, “we’d expect the
world to look a lot more like that envisioned by Hansen than that envisioned by most
macroeconomists during the Great Moderation era”.
Summers goes even further in summarising his chapter: “I explain why a decline in the
full employment real interest rate (FERIR), coupled with low inflation, could indefinitely
prevent the attainment of full employment. I argue that even if it were possible for the
FERIR to be attained, this might involve substantial financial instability.”

Secular Stagnation: Facts, Causes, and Cures
16
Advanced economy central banks have demonstrated admirable creativity in overcoming
the ZLB problem with their balance sheets. But raising central bank assets by several
trillion dollars is not a trick that is going work frequently – or at least vastly more
research is needed if quantitative easing is to become the new modus operandi of G7
central banks.
• Fiscal policy may also need a rethink.
Krugman argues that temporary fiscal stimulus to support demand while the private
sector gets back to spending normally may not be enough if negative natural rates are
persistent. Koo argues that governments may have to provide stimulus for years to offset
the drag of prolonged private-sector balance-sheet repair: “Any premature withdrawal
of fiscal stimulus would unleash the deflationary forces as unborrowed savings are
allowed to become a leakage in the economy’s income stream. Indeed, the US in 1937,
Japan in 1997 and the UK and Eurozone in 2010 all experienced serious double-dip
recessions when their governments pursued fiscal consolidation while their private
sectors were still in the process of repairing balance sheets.”
4.1 Difficultbutuncontroversialpolicyresponses
The policy responses suggested by the authors form a rich and varied assemblage.
There is, however, a set of policy that almost all would agree upon – the set of pro-
growth policies that economists have urged for years. But this is not just old wine in
new bottles. These policies take on a new hue when viewed through secular stagnation
glasses.
The point rests on two simple premises. First, as most saving behaviour is slow moving,
boosting investment is one way of eluding the ZLB. Second, Macro 101 tells us that
the steady-state capital stock grows at the sum of the growth rates of productivity and
labour inputs. Thus, policies that stimulate innovation and increase efficiency and those
that boost hours worked will raise the natural rate and help us elude the ZLB problem.

Introduction
17
For authors like Gordon and Glaeser, who are largely untroubled by negative natural
rates and liquidity traps, pro-growth reforms are a good idea without any reference to
secular stagnation. For those like Summers and Krugman who worry about systematic
saving-investment mismatches, the reforms are especially meritorious since they build a
buffer against the difficulty of pushing real rates below zero. The corresponding policy
responses correspond to the first pillar of the Macro 101 frame in that they aim to raise
economies’ long-run growth potential. They include the following:
• Improving the education system.
• Investing in the physical infrastructure.
• Removing barriers for labour mobility between firms by trimming down employment
protection legislation.
• Increasing incentives for low-skilled workers to participate on the labour market.
• Simplifying procedures for starting up businesses.
• Applying anti-monopoly policies to reduce the profit margins in new IT industries.
These new IT industries are characterised by large network externalities and hence low
investment demand. Anti-monopoly policies increase the share of profits available for
less monopolistic parts of the value chain, thereby enhancing investment demand.
A correlation of desiderata
These policies are usually clustered under the heading of ‘structural reform’ or supply-
side policies, but they also help if the ‘lack of effective demand’ version of secular
decline turns out to be correct. As Jimeno, Smets and Yiangou make the point: “The
same policies that will help avoid secular stagnation in the future will help boost
demand in the current environment. … Investment is not only tomorrow’s supply, but
also today’s demand.”

Secular Stagnation: Facts, Causes, and Cures
18
4.2 Reformsrequiringapolicyrethink
Until just a few years ago, macroeconomic policymaking had settled on a clear received
wisdom. Monetary policy should be run by politically independent, inflation-targeting
central banks, and fiscal policy should be aimed at keeping debt and deficits within
prudential limits. The consensus was shaken but not shattered when the US’s Subprime
Crisis metastasised into the Global Crisis in 2008. The only major amendments to the
received wisdom were the addition of macroprudential policies and a firm concern
about financial stability.
The dangers of secular stagnation – and the spectre of the US and Europe suffering
Japan-like lost decades – lead some of the authors to propose bold challenges to
the received wisdom. Perhaps the boldest is also the most logically straightforward
(Krugman 2014, Blanchard et al. 2010). Summers explicitly backs this in his chapter.
• If the natural rate will frequently be negative, and policy rates are bound to the posi-
tive real line, why not raise the inflation target to, say, 4%?
The dreadful experience of the 1980s and the positive experience of the 1990s have
shown that a stable inflation target yields high benefits. However, there are no good
economic theories that run against an inflation target of 4% instead of 2%, while there
are many good economic arguments in favour of a 4% target. Moving from 2% to 4%
seems unlikely to undermine the credibility of the target as such. History has shown that
monetary policy can stop inflation.
The main argument against moving the target is the German disgust at its 1923
hyperinflation. Germany’s respect for its own history has made the world a better place
to live in. It should therefore not be denounced lightly. Reflecting a view strongly held
in parts of the Eurozone, Guntram Wolff writes: “I would advise against changing
the ECB’s inflation target … for two reasons. For one, such a step would severely
undermine trust in a young institution. … It would constitute a break in the contract
under which Germany subscribed to the monetary union. Second, changing the target

Introduction
19
in current circumstances would be largely ineffective: already the current target will not
be achieved in the relevant time horizon and a higher target would only increase this
gap.” Eggertsson and Mehrotra dispute this second observation: “We find that a high
enough inflation target can – if credible – always do away with the slump altogether
as it accommodates a negative natural interest rate. Importantly, however, an inflation
target which is below what is required has no effect in this context.”
Challenging the macroeconomic policymaking consensus is not the only controversial
reform suggested by the authors as a redress or insurance against secular stagnation.
Others include:
• Raising the retirement age.
The paradox of ageing societies is that – other things equal – real interest rates will be
low, increasing the risk of bubbles. Hence, other things should not be kept constant. A
higher retirement age reduces saving. There simply is a limit to the extent to which we
can save today in exchange for leisure and high consumption tomorrow. Somebody has
to do the work tomorrow; we cannot all be retired by that time.
• Extending PAYG public pensions and health care insurance systems, or if they are
already there, enhancing their credibility.
This is particularly relevant for high-growth emerging economies like China and India.
PAYG health care insurance has the additional advantage that it reduces the need for
precautionary saving. Hence, it is more effective in reducing excess saving then PAYG
pension systems.
• Conducting prolonged countercyclical fiscal policy.
This recommendation extends the previous one. Extending PAYG systems is equivalent
to an implicit increase in public debt; fiscal policy is an explicit increase. Obviously,
there is a sustainability limit. However, reductions in public debt can only be realised
when there is no excess saving. In periods of excess saving, forced sovereign debt

Secular Stagnation: Facts, Causes, and Cures
20
reductions aggravate the problem (see Koo’s vivid description of Japan’s experience
after its financial crisis in 1991).
• Revising the European Fiscal Stability Treaty.
The current version requires countries to reduce their public debt below 60% of GDP in
20 years. In some countries, this would require a massive tightening in a time of excess
saving. The target for the structural deficit of 1% of GDP implies a long-run value of
public debt between 25% and 33% of GDP, assuming the nominal growth of GDP to
be between 3% and 4%. This low level of public debt would aggravate excess saving
and lead to an acute shortage of save assets (see the chapter by Caballero and Farhi).
• Reducing policy uncertainty, as uncertainty enhances precautionary saving.
The debate on the debt ceiling in the US or the redenomination risk due to the threat
of the break-up of the Eurozone, for example, add to uncertainty. The same applies to
unrealistic fiscal rules (see the previous bullet).
• Revising regulations that force institution investors to invest in triple A assets.
This proposal is fleshed out in the chapter by Caballero and Farhi. As an example, the
regulation in the US that pension wealth be fully annuitised at the date of retirement
(applied likewise in several other countries) is both inefficient for the individual retiree
(he would be better off if part of his wealth were invested in risky assets) and it distorts
the risk-free rate downwardly (further aggravating the cost for the individual retiree).
• Not using monetary policy to avoid bubbles.
The fall in the real interest rate may well lead to bubbles. However, bubbles are not
necessarily irrational. On the contrary, they might be a natural response of capital
markets to a low real return on investment when fiscal policy does not respond to it.
Hence:
• Addressing the excess saving, not fighting the bubbles.

Introduction
21
Fighting bubbles keeps capital markets from balancing the supply and demand for
loanable funds.
• Globalising financial markets.
While Japan and the North Atlantic economies may face diminishing returns on
profitable investment opportunities, the world’s capital-labour is very low compared to
those of the G7 nations. Massive international capital flows have often ended in tears,
but given that savings-investment imbalances are critical to the SecStag debate, the
current account is one obvious solution mechanism.
Economies with excess savings
The final bullets reveal that policymakers in an economy with excess saving face a
major dilemma.
• Either they set monetary policy to allow the interest rate to fall until the point at
which rational bubbles emerge to absorb the excess saving, or
• they avoid the interest rate from falling that far by using fiscal policy for the absorp-
tion of the saving.
There are profound differences in the distributional impacts of the two. Using monetary
policy favours the current owners of bubbly assets, predominantly the richer elderly;
using fiscal policy allows for a broader spreading of the benefits. But trying to avoid
this dilemma by picking neither of the two will lead to a failure of the capital market
to clear and hence to a long, dragged-out Keynesian recession, as shown by Japan’s
experience since 1990.
Richard Koo observes that democracies might not be best equipped to handle this
dilemma. “(T)he Chinese government implemented a 4 trillion RMB fiscal stimulus in
November 2008 when it was facing a sharp fall in both domestic asset prices and exports.
As a percentage of GDP, the stimulus was more than double the size of President Barak

Secular Stagnation: Facts, Causes, and Cures
22
Obama’s $787 billion package unleashed three months later. At that time, western
observers were laughing when the Chinese government announced that they were going
to maintain 8% growth. China’s growth soon reached 12% and nobody was laughing.”
Handling a balance sheet recession requires centralised political power. Japan struggled
for 20 years to find a workable solution. The fragmented decision-making process in
Europe might cause even more difficulty in finding a way out.
5 Concluding comments
Is secular stagnation something to worry about, or just another passing fad? Will growth
in the next decade or two be much lower than it was in the past? Predictions are hard
to make, in particular about the future. However, the market offers a simple tell-tale:
the level of the real interest rate. Nobody can reliably predict whether it will stay this
low for the next decade. However, its current level is a clear sign of excess saving. For
this situation, Eggertsson and Mehrotra have a simple piece of advice: “In line with
the literature that emphasises deleveraging shocks that have short-term effects, we find
that, in this economy, a long slump is one in which usual economic rules are stood on
their head.”
References
Blanchard, O and L H Summers (1986), “Hysteresis and the European Unemployment
Problem,” in S Fischer (ed), NBER Macroeconomics Annual, Vol. 1, Cambridge: MIT
Press, pp. 15-78.
Blanchard, B, G Dell’Ariccia and P Mauro (2010), “Rethinking Macroeconomic
Policy”, IMF Staff Position Note SPN/10/03.
Gordon, R (2012), “Is US Economic Growth Over? Faltering Innovation Confronts the
Six Headwinds”, NBER Working Paper No. 18315.

Introduction
23
Hansen, A (1938), speech published as Hansen, A H (1939), “Economic Progress and
Declining Population Growth”, American Economic Review 29: 1-15.
Krugman, P (2014), “Inflation Targets Reconsidered”, paper presented to ECB Forum,
Sintra Portugal,
PwC (2014), Global Top 100 Companies by market capitalisation, 13 March update.
Summers, L (2014), “US Economic Prospects: Secular Stagnation, Hysteresis and
the Zero Lower Bound”, speech delivered to the National Association for Business
Economics’ Economic Policy Conference, 24 February 24.
Tirole, J (1985), “Asset Bubbles and Overlapping Generations”, Econometrica 53(6):
1499-1528.


Openingthedebate


27
Reflectionsonthe‘NewSecularStagnationHypothesis’
LaurenceHSummersHarvard University
The Great Recession has cast doubt on the idea that, with or without policy intervention,
the workings of the market will eventually eliminate output gaps. This chapter explains
why a decline in the full-employment real interest rate (FERIR) coupled with low
inflation could indefinitely prevent the attainment of full employment. A variety of
factors suggest that the FERIR has declined substantially over the last several decades
in the industrial world. The chapter concludes by discussing the relationship between
secular stagnation and hysteresis, global aspects, and policy implications.
Just seven years ago, all seemed well in the field of macroeconomics. The phrase
‘Great Moderation’ captured the reality that business cycle volatility seemed way
down from levels of the first part of the post-war period. A broad methodological
consensus supported the use of DSGE (dynamic stochastic general equilibrium) models
to understand macroeconomic fluctuations and to evaluate macroeconomic policies.
There was widespread support for the idea that the primary concern of independent
central banks should be maintaining appropriate inflation targets and reacting to
cyclical developments to minimise the amplitude of fluctuations.
The economic crisis has led to a crisis in the field of macroeconomics. The idea that
depressions were a concept of only historic interest has been belied by the Global Crisis
and the Great Recession. Figures 1a and 1b depict the gap between actual and potential
output estimated as of various dates for both the US and the Eurozone. It is apparent
that output is far short of where its potential was expected to be as of 2008. Even more

Secular Stagnation: Facts, Causes, and Cures
28
troubling is the observation that most of the gap is expected to represent a permanent
loss, as potential output has been revised sharply downwards. For the Eurozone, GDP
is almost 15% below its 2008-estimated potential, and potential output has been written
down by almost 10%. As Figure 2 illustrates, Europe’s output shortfall is almost
identical to the one Japan experienced when the bursting of its ‘bubble economy’
triggered a financial crisis.
Figure 1a Actual and potential GDP in the US
15
16
17
18
19
20
21
22
2007 2008 2009 2010 2011 2012 2013 2014 2015 2016 2017
Trill
ions
of 2
013
Dolla
rs
Actual and Potential GDP
Actual
20072008
200920102011201220132014
YearEstimated:
Potential GDP Estimates
Sources: Congressional Budget Office, Bureau of Economic Analysis.
Figure 1b Actual and potential GDP in the Eurozone
8
8.5
9
9.5
10
10.5
11
2007 2008 2009 2010 2011 2012 2013 2014 2015 2016 2017
Trill
ions
of 2
005
Euro
s
Eurozone Actual and Potential GDP
Actual
2008
YearEstimated:
Potential GDP Estimates
2010 2012
2014
Sources: IMF World Economic Outlook Databases, Bloomberg.

Reflections on the ‘New Secular Stagnation Hypothesis
29
Figure 2 Japan and the Eurozone, forecast vs reality
501983 1988 1993 1998 2003 2008 20132000 2005 2010 20 15
100
150
Japan Actual
Euro Actual
14% BelowExpectation
13% BelowExpectation
100=
1991
(Japa
n) a
nd 2
007
(Eur
o Ar
ea)
(Log
Sca
le)
Japan and Euro Area, Forecast Versus Reality
Sources: OECD 1992 “Long Term Prospects for the World Economy, IMF 2007 & 2014 WEO Database.
The experience of Japan in the 1990s and now that of Europe and the US suggests that
– for the purpose of understanding and combating important fluctuations – theories
that take the average level of output and employment over a long time period as given
are close to useless. Unfortunately, almost all work in both the New Classical and New
Keynesian traditions has focused on the second moment (the variance) of output and
employment. This thinking presumes that, with or without policy intervention, the
workings of the market will eventually restore full employment and eliminate output
gaps. The only questions are about the volatility of output and employment around
their normal levels. What has happened in the last few years suggests that the second
moment is second-order relative to the first moment – the average level of output and
employment through time.
The ‘new secular stagnation hypothesis’ responds to recent experience and the
manifest inadequacy of conventional formulations by raising the possibility that it
may be impossible for an economy to achieve full employment, satisfactory growth,
and financial stability simultaneously simply through the operation of conventional
monetary policy. It thus provides a possible explanation for the dismal pace of recovery

Secular Stagnation: Facts, Causes, and Cures
30
in the industrial world, and also for the emergence of financial stability problems as an
increasingly salient concern.
Plan of the chapter
The remainder of this chapter focuses on the idea of secular stagnation. After noting
the apparent difficulty that industrial economies are having in achieving financially
stable growth with full employment, I explain why a decline in the full-employment
real interest rate – FERIR, for short – coupled with low inflation could indefinitely
prevent the attainment of full employment. I argue that even if it were possible for the
FERIR to be attained, this might involve substantial financial instability. Having made
the case that a decline in the FERIR would explain much of what we observe, I then
adduce a variety of factors suggesting that the FERIR has declined substantially over
the last several decades in the industrial world. I conclude by discussing the relationship
between secular stagnation and hysteresis, global aspects, and policy implications.
1 Thesecularstagnationhypothesisandrecentevents
It has now been more than five years since the US economy reached its trough in the
second quarter of 2009, and close to five years since evidence of systemic financial
risk – as reflected in LIBOR spreads, the need for government bailouts, or elevated risk
premiums on bank debt – has been pervasive. Yet US economic growth has averaged
only 2% over the last 5 years, despite having started from a highly depressed state. In a
similar vein, credit spreads in Europe have come way down and fears of the dissolution
of the Eurozone have been sidelined, yet growth has been glacial over the past several
years and is not expected to rapidly accelerate.
Upon reflection, these patterns should be surprising. If a financial crisis represents a
kind of power failure, one would expect growth to accelerate after its resolution as those
who could not express demand because of a lack of credit were enabled to do so.

Reflections on the ‘New Secular Stagnation Hypothesis
31
Troublemaskedbyunsustainablefinances
Unfortunately, it appears that the difficulty that has arisen in recent years in achieving
adequate growth has been present for a long time, but has been masked by unsustainable
finances. Here it is instructive to consider the performance of the US and Eurozone
economies prior to onset of financial crisis in 2007.
Let us begin with the US. It is certainly fair to say that growth was adequate – perhaps
even good – during the 2003–2007 period. It would not be right to say either that
growth was spectacular or that the economy was overheating during this period. And
yet this was the time of vast erosion of credit standards, the biggest housing bubble in
a century, the emergence of substantial budget deficits, and what many criticise as lax
monetary and regulatory policies.
Imagine that US credit standards had been maintained, that housing had not turned into
a bubble, and that fiscal and monetary policy had not been simulative. In all likelihood,
output growth would have been manifestly inadequate because of an insufficiency of
demand. Prior to 2003, the economy was in the throes of the 2001 downturn, and prior
to that it was being driven by the internet and stock market bubbles of the late 1990s.
So it has been close to 20 years since the American economy grew at a healthy pace
supported by sustainable finance.
Making judgements for Europe is more difficult because of the problem of evaluating
structural constraints on growth. But in retrospect it is clear that much of the strength
of the economies of the periphery prior to 2010 was based on the availability of
inappropriately cheap credit, and that much of the strength of the economies of Northern
Europe was derived from exports that were financed in unsustainable ways.
Understandinganaemicgrowthintheabsenceofunsustainablefinancing
How might one understand why growth would remain anaemic in the absence of major
financial concerns? Suppose that a substantial shock took place – for reasons that I

Secular Stagnation: Facts, Causes, and Cures
32
will describe subsequently – and that this tended to raise private saving propensities
and reduce investment propensities. How would growth be affected? The normal
answer to this question is that one would expect interest rates to fall (driven either by
market forces or policy actions) until the saving and investment rate were equated at
the full-employment level of output. That is to say, changes in saving and investment
propensities, or for that matter, in government deficits might be expected to impact an
economy’s FERIR, but not its level of output and employment. But this presupposes full
flexibility of interest rates. In fact, in modern economies short-term safe interest rates
cannot fall appreciably below zero because of the possibility of currency substitution.
So interest rates are not fully flexible in modern economies. Note that interest rates
that include term or credit premia will never fall to zero, but only to a level that reflects
these premia.
Hence the possibility exists that no attainable interest rate will permit the balancing of
saving and investment at full employment. This is the secular stagnation hypothesis
first put forward by Alvin Hansen in the 1930s. Notice that as Keynes, Tobin, and
subsequently Brad Delong and I have emphasised, wage and price flexibility may well
exacerbate the problem. The more flexible wages and prices are, the more they will be
expected to fall during an output slowdown, leading to an increase in real interest rates.
Indeed, there is the possibility of destabilising deflation, with falling prices leading to
higher real interest rates leading to greater output shortfalls leading to more rapidly
falling prices, and onwards in a vicious cycle.
Lowratesandfinancialinstability
Even if the zero interest rate constraint does not literally bind, there is the possibility that
the positive interest rate consistent with full employment is not consistent with financial
stability. Low nominal and real interest rates undermine financial stability in various
ways. They increase risk-taking as investors reach for yield, promote irresponsible
lending as coupon obligations become very low and easy to meet, and make Ponzi

Reflections on the ‘New Secular Stagnation Hypothesis
33
financial structures more attractive as interest rates look low relative to expected growth
rates. So it is possible that even if interest rates are not constrained by the zero lower
bound, efforts to lower them to the point where cyclical performance is satisfactory
will give rise to financial stability problems. Something of this kind was surely at work
during the 2003–2007 period.
2 WhathashappenedtotheFERIR?
So far I have argued that if the FERIR declined substantially one might expect to
see an unfortunate combination of unsatisfactory cyclical performance and financial
instability, much like what has been observed recently. Is it reasonable to suppose
that FERIR levels have declined in major industrial countries? A variety of structural
changes summarised in Summers (2014) suggest that FERIR levels may have declined
substantially. These include:
• Slower population and possibly technological growth means a reduction in the de-
mand for new capital goods to equip new or more productive workers.
Throughout the industrial world levels of labour force growth are way down, with
labour force shrinkage already underway in Japan and soon to come in large parts of
Europe.
• Lower-priced capital goods means that a given level of saving can purchase much
more capital than was previously the case.
Information technology continues to decline rapidly in price and to account for a larger
share of total capital investment. It is revealing that the iconic cutting-edge companies
have traditionally needed to go the market to support expansion. Today, leading-edge
companies like Apple and Google are attacked for holding on to huge cash hoards.
• Rising inequality operates to raise the share of income going to those with a lower
propensity to spend.

Secular Stagnation: Facts, Causes, and Cures
34
Closely related, a rising profit share operates to transfer income to those with a lower
propensity to spend.
• Increasing friction in financial intermediation associated with greater risk-aversion
in the wake of the financial crisis and increased regulatory burdens operates to raise
the wedge between safe liquid rates and rates charged to borrowers.
In general equilibrium this drives down safe rates. The same effect is present if debt
overhangs or increased uncertainty discourages borrowing.
• A rising desire on the part of central banks and governments to accumulate reserves
coupled with conservative investment strategies operates to raise the demand for
safe assets, driving down safe interest rates.
This effect is reinforced by requirements that encourage pension funds and insurance
companies to hold their assets in safe bonds as to best match liabilities.
• Ongoing disinflation which means that at any given real interest rate, real after-tax
interest rates are higher.
To the extent that it is after-tax real interest rates that matter for investment decisions (as
for example with tax-deductible mortgages), this operates to shift investment demand
inwards, resulting in a pre-tax real interest rate lower than it was before (see Summers
2014 for details).
Evidence from FERIR estimates
The importance of these considerations is suggested by the available empirical evidence
on actual real rates and on estimates of the FERIR. Figure 3 shows trends in indexed
bond yields for a number of countries. It is clear that they have trended down over
the last 15 years. Even more relevant for the US economists at the Fed, Laubach and
Williams (2003) have attempted to estimate the FERIR using data on actual real interest
rates and measures of where the economy is relative to its potential. While many issues

Reflections on the ‘New Secular Stagnation Hypothesis
35
can be raised with respect to their calculations, Figure 4 illustrates their estimate of a
substantial long-term decline in the FERIR.
Figure 3 World average real interest rate
-1
0
1
2
3
4
5
1985 1990 1995 2000 2005 2010
Real
Inte
rest
Rat
e
World Real Interest Rate
Source: Meryvn King, “Measuring the World Interest Rate”.
Figure 4 US natural rate of interest
-1
0
1
2
3
4
5
6
1961 1966 1971 1976 1981 1986 1991 1996 2001 2006 2011
Real
Inte
rest
Rat
e
Natural Rate of Interest
Sources: Thomas Laubach and John Williams, “Measuring the Natural Rate of Interest”.
The IMF in its most recent World Economic Outlook has examined trends in real
interest rates in industrial countries and has also considered a variety of factors bearing
on real rates. It has reached conclusions similar to the ones I have reached here – that

Secular Stagnation: Facts, Causes, and Cures
36
the FERIR has likely declined in recent years. This observation, together with the
observation that lower US inflation – and in Europe declining rates of inflation – makes
it more difficult than previously to reduce real interest rates. This in turn suggests that
the zero lower bound and secular stagnation are likely to be more important issues in the
future than in the past. At a minimum the analysis suggests that if full employment is
to be maintained in the years ahead, real interest rates in the industrial world will likely
be lower than they have been historically – a development that may have important
implications for financial stability.
3 Conclusions and implications
The case made here, if valid, is troubling. It suggests that monetary policy as currently
structured and operated may have difficulty maintaining a posture of full employment
and production at potential, and that if these goals are attained there is likely to be a
price paid in terms of financial stability. A number of questions come to mind:
• How great are the risks?
Alvin Hansen proclaimed the risk of secular stagnation at the end of the 1930s, only
to see the economy boom during and after World War II. It is certainly possible that
some major exogenous event will occur that raises spending or lowers saving in a way
that raises the FERIR in the industrial world and renders the concerns I have expressed
irrelevant. Short of war, it is not obvious what such events might be. Moreover, most
of the reasons adduced for falling FERIRs are likely to continue for at least the next
decade. And there is no evidence that potential output forecasts are being increased,
even in countries like the US where there is some sign of growth acceleration.
• What about hysteresis?
On their own, secular stagnation ideas do not explain the decline in potential output
that has been a major feature of the experience throughout the industrial world. The
available evidence though is that potential output has declined almost everywhere, and

Reflections on the ‘New Secular Stagnation Hypothesis
37
in near lockstep with declines in actual output – see Ball (2014) for a summary. This
suggests a way in which economies may equilibrate in the face of real rates above the
FERIR. As hysteresis theories – which emphasise the adverse effects of recessions on
subsequent output – predict, supply potential may eventually decline to the level of
demand when enough investment is discouraged in physical capital, work effort, and
new product innovation.
Perhaps Say’s dubious law has a more legitimate corollary – “Lack of Demand creates
Lack of Supply”. In the long run, as the economy’s supply potential declines, the FERIR
rises, restoring equilibrium – albeit not a very good one.
• What about global aspects?
There is important work to be done elucidating the idea of secular stagnation in an open
economy context. The best way to think about the analysis here is to treat it as referring
to the aggregate economy of the industrial world where – because of capital mobility –
real interest rates tend to converge (though not immediately because of the possibility
of expected movements in real exchange rates). If the FERIR for the industrialised
economies were low enough one might expect capital outflows to emerging markets,
which would be associated with declining real exchange rates for industrial countries,
increased competitiveness, and increased export demand. The difficulty is that this is
something that emerging markets will accept only to a limited extent. Their response is
likely to be either resistance to capital inflows or efforts to manage currency values to
maintain competitiveness. In either case the result will be further downward pressure
on interest rates in industrial countries.
4 Whatistobedone?
Broadly, to the extent that secular stagnation is a problem, there are two possible
strategies for addressing its pernicious impacts.
• The first is to find ways to further reduce real interest rates.

Secular Stagnation: Facts, Causes, and Cures
38
These might include operating with a higher inflation rate target so that a zero
nominal rate corresponds to a lower real rate. Or it might include finding ways such
as quantitative easing that operate to reduce credit or term premiums. These strategies
have the difficulty of course that even if they increase the level of output, they are also
likely to increase financial stability risks, which in turn may have output consequences.
• The alternative is to raise demand by increasing investment and reducing saving.
This operates to raise the FERIR and so to promote financial stability as well as increased
output and employment. How can this be accomplished? Appropriate strategies will vary
from country to country and situation to situation. But they should include increased
public investment, reductions in structural barriers to private investment and measures
to promote business confidence, a commitment to maintain basic social protections so
as to maintain spending power, and measures to reduce inequality and so redistribute
income towards those with a higher propensity to spend.
References
Summers, L (2014), “U.S. Economic Prospects: Secular Stagnation, Hysteresis, and the
Zero Lower Bound”, Business Economics 49(2).
Laubach, T and J C Williams (2003), “Measuring the Natural Rate of Interest”, Review
of Economics and Statistics 85(4): 1063–1070.

Three issues: Potential growth, effective demand, and sclerosis


41
Secular stagnation: A review of the issues1
Barry EichengreenUniversity of California, Berkeley and CEPR
Pessimists have been predicting slowing rates of invention and innovation for centuries,
and they have been consistently wrong. This chapter argues that if the US does
experience secular stagnation over the next decade or two, it will be self-inflicted. The
US must address its infrastructure, education, and training needs. Moreover, it must
support aggregate demand to repair the damage caused by the Great Recession and
bring the long-term unemployed back into the labour market.
When late last year, former US treasury secretary Lawrence Summers suggested that
the advanced economies, and the US in particular, might be suffering from “secular
stagnation,” his remarks struck a chord. The idea that the US and the other advanced
economies might be suffering from more than the handover from a financial crisis
resonated with many observers.
But while the term ‘secular stagnation’ was widely repeated, it was not widely
understood. Secular stagnation, we have learned, is an economist’s Rorchach Test. It
means different things to different people. In weighing the question of whether slow
growth in the US and other advanced countries reflects some kind of ongoing stagnation
problem, it’s important to be clear on the concept.
A first possible explanation for slow growth is that all the great inventions have been
made. The respected Northwestern University macroeconomist Robert Gordon (2012)
1 Light revision and extension of a piece that originally appeared in Caixin and Caixin Online (March 2014).

Secular Stagnation: Facts, Causes, and Cures
42
argues that electricity, the internal combustion engine and indoor plumbing were
infinitely more important for boosting productivity and enhancing living standards than
anything produced by the dot.com boom. Personal electronics may be great for playing
games, but they are not so good for raising productivity. And there is no great invention
equivalent to electricity or the internal combustion engine on the horizon.
For economic historians, this argument flies in the face of 200 years of experience.
Pessimists have now been predicting slowing rates of invention and innovation for
centuries, and they have been consistently wrong. Looking ahead, it seems clear that
the productive potential of robotics and the human genome, for example, have only
begun to be realised. Evidence that we are learning how to use intelligent machines to
replace first unskilled and eventually skilled labour suggests that we have a distribution
problem, not a growth problem.
Gordon bases his argument on the fact that productivity growth, in the US in particular,
has been slower in the four decades since the early 1970s than in the century (or a
bit less) that preceded them. Only the decade from 1995 to 2005, when, paraphrasing
Robert Solow (1987), “you could see the computer age everywhere…. [including] in
the productivity data,” did the rate of total factor productivity growth rival what had
been achieved over the prior century.
This conclusion, in my view, ignores the fact that the preceding century, Gordon’s
golden age of technical progress, also saw periods of slow productivity growth, notably
when new network technologies were being rolled out but the economy had not yet
adapted to their availability. (The period of electrification starting in the 1890s stands as
a classic case in point.) This is an argument for not making too much of the slowdown
prior to 1995, when adaptation to the availability of computers and the internet first got
underway, or of slow productivity growth now, when we are potentially on the eve of a
robotics and human genome revolution.
A second version of secular stagnation argument holds that we have a problem of
stagnant aggregate demand – that households are not spending enough and firms are

Secular stagnation: A review of the issues
43
not investing enough even at near-zero interest rates. Those with very high incomes
have a relatively low propensity to consume, and virtually all the income gains in
the US have gone to those with very high incomes. (There’s that pesky problem of
income distribution again.) The result is a glut of savings that firms are unable to
invest at a positive interest rate. The advanced countries therefore find themselves with
extraordinarily low interest rates as this glut of savings floods the market, and yet with
not enough investment to absorb it or to sustain a respectable rate of growth.
This appears to be the version of the argument that Professor Summers prefers. I have
my doubts. What matters for interest rates is not US saving but global saving, since
funds in the 21st century can move across borders. And, in fact, global saving has
basically held stable for the last decade and a half at 23 to 24% of global GDP. At
most, global saving rates have risen only modestly. And looking ahead, with China
rebalancing its economy toward consumption, there is every reason to think that the
global saving rate will come down.
One can of course argue that the ratio of global savings to global GDP is determined in
general equilibrium – that the numerator as well as the denominator is an endogenous
variable. But that only reinforces the point. In a situation of near-zero interest rates and
deficient demand (the current situation and the one that secular stagnationists foresee
for the medium term), an increase in savings will have a negative impact on GDP. That
effect will be unusually strong, because interest rates can’t fall further and because the
global economy is closed to trade, increasing the size of the multiplier.
In this situation, an increase in global savings will have a sharp negative impact on global
GDP. Imagine, for example, an aggregate-demand multiplier of two. When savings rise
by, say, 1% of initial GDP, that GDP then declines by 2%, and the resulting saving rate,
as measured, is more than 1% greater than before. But this means that the change in the
ex ante savings rate (the shock ostensibly responsible for secular stagnation) is smaller
than the change in the ex post savings rate that is actually observed. And the increase

Secular Stagnation: Facts, Causes, and Cures
44
in the savings rate we observe in the data, as already noted, is small (globally, 1-2% of
GDP).
Even taking general equilibrium effects into account, then, changes in global savings
do not appear to be a major factor in the persistently low level of interest rates and slow
rate of economic growth.
A third version of the argument suggests that output and total factor productivity growth
are stagnant because of the failure of countries like the US to invest in infrastructure,
education and training. I have considerable sympathy for this view, given how
nondefence, non-entitlement federal government spending, which is devoted heavily to
infrastructure, education and training, has been cut to the bone. The empirical literatures
on infrastructure, education and economic growth are less than fully conclusive.
Intuitively we know that there is something here; we just don’t know how much.
A fourth and final version of the secular stagnation hypothesis argues that the US
economy’s supply-side potential has been permanently reduced by the Great Recession
and the slow recovery that followed. The failure of output growth to recover to the
pre-Great Recession trend, instead moving in parallel with this trend at persistently
lower levels, is consistent with this view. The mechanism in question is then high
unemployment, which has permanently impaired the productive potential of the labour
force through forgone on-the-job training and the atrophy of skills.
High long-term unemployment and a large number of discouraged workers are
prominent features of the current recovery. The question is whether the damage to
human capital accumulation due to being out of work is permanent or temporary –
whether the effects are reversed easily or only with difficulty. This debate is raging
within the corridors of the Federal Reserve System as we speak. The question there is
whether many of the long-term unemployed have become essentially unemployable, in
which case their being out of work does little to moderate upward pressure on wages,
making the headline unemployment rate the best measure of slack in the labour market.

Secular stagnation: A review of the issues
45
Here, neither contemporary nor historical evidence is definitive. Nick Crafts’ studies
of long-term unemployment in Britain in the 1930s (e.g. Crafts 1989) confirm that the
long-term unemployed had little impact on the behaviour of wages, as if those out of
work for extended periods became effectively detached from the labour market. On the
other hand, studies of the US during World War II by none other than Robert Gordon
show that a positive labour-demand shock, if sufficiently strong, can draw the long-
term unemployed back into work and quickly reduce the natural rate of unemployment
to earlier low levels (Gordon and Krenn 2010).
So is there a secular stagnation problem? Yes, there are reasons to worry that the
US’s growth rate over the next 10 or 20 years will disappoint by the standards of the
20th century. But this is not inevitable. It will not be because all the great inventions
have been made or because there is a dearth of attractive investment projects and an
overabundance of savings.
If the US experiences secular stagnation, the condition will be self-inflicted. It will
reflect the country’s failure to address its infrastructure, education and training needs. It
will reflect its failure to take steps to repair the damage caused by the Great Recession
and support aggregate demand in an effort to bring the long-term unemployed back into
the labour market. These are concrete policy problems with concrete policy solutions. It
is important not to accept secular stagnation, but instead to take steps to avoid it.
References
Crafts, N (1989), “Long Term Unemployment and the Wage Equation in Britain, 1925-
1939”, Economica 56(222): 247-254.
Gordon, R and R Krenn (2010), “The End of the Great Depression 1939-31: Fiscal
Multipliers, Capacity Constraints and Policy Contributions”, NBER Working Paper
No. 16380.

Secular Stagnation: Facts, Causes, and Cures
46
Gordon, R (2012), “Is US Economic Growth Over? Faltering Innovation Confronts the
Six Headwinds”, NBER Working Paper No. 18315.
Solow, R (1987), “We’d Better Watch Out”, The New York Times Book Review, 12 July.

47
Theturtle’sprogress:Secularstagnation meets the headwinds1
Robert J GordonNorthwestern University and CEPR
US real GDP has grown at a turtle-like pace of only 2.1% per year in the last four
years, despite a rapid decline in the unemployment rate from 10% to 6%. This column
argues that US economic growth will continue to be slow for the next 25 to 40 years
– not because of a slowdown in technological growth, but rather because of four
‘headwinds’: demographics, education, inequality, and government debt.
1 Distinguishingbetweensecularstagnationandslowlong-termgrowth
No single image captures the present concern about secular stagnation and slowing
long-term economic growth better than the Economist cover of 19 July 2014, showing
a frustrated jockey dressed in the colours of the US flag frantically trying to get some
movement from the gigantic turtle that he is riding. US real GDP growth has grown at
a turtle-like pace of only 2.1% per year in the last four years, despite a rapid decline
in the unemployment rate from 10% to 6%. Almost all of that improvement in the
unemployment rate has been offset by an unprecedented decline in labour-force
participation, so that the ratio of employment to the working-age population has hardly
improved at all since the trough of the recession.
1 This contribution provides additional perspective on the debate about the future of economic growth in the US and in several dimensions goes beyond the main points of my recent NBER Working Paper (Gordon 2014a). Burke Evans contributed the graph and incisive suggestions about the exposition.
Secular Stagnation: Facts, Causes, and Cures
48
I have recently (Gordon 2014a) restated the case for slow growth over the long run
of the next 25 to 40 years. At the same time, Larry Summers (2013) has signalled his
alarm about a return of ‘secular stagnation’, a term associated with a famous 1938
Presidential Address to the American Economic Association by the Harvard economist
Alvin Hansen (see also Hansen 1939). However, Summers and I are talking about
different aspects of the current US growth dilemma. His analysis concerns the demand
side, “about how we manage an economy in which the zero nominal interest rate is a
chronic and systemic inhibitor of economic activity, holding our economies back below
their potential”.2 In contrast, my version of slow future growth refers to potential output
itself.
As the US unemployment rate declines toward the normal level consistent with steady
non-accelerating inflation, by definition actual output catches up to potential output. I
have provided (Gordon 2014b) a layman’s guide to the numbers that link the performance
of real GDP and the unemployment rate and have concluded that US potential real GDP
over the next few years will grow at only 1.4 to 1.6% per year, a much slower rate that
is built into current US government economic and budget projections. My analysis
suggests that the gap of actual performance below potential that concerns Summers is
currently quite narrow and that the slow growth he observes is more a problem of slow
potential growth than a remaining gap.
Hansen’s 1938 version of secular stagnation was written prior to the invention of
the concept of potential GDP, and indeed of real GDP itself.3 Because there was no
comprehensive measure of real economic activity, there was no notion of aggregate
productivity or its growth rate. When we look at today’s statistical rendering of the US
economy in the late 1930s, we see that Hansen was writing about an economy with
2 These are the final words from the transcript of his speech given last autumn at the IMF (see Summers 2013).3 The term “secular stagnation” was introduced not in Hansen’s Presidential Address, but rather four years earlier in
Hansen (1934, p. 19).

The turtle’s progress: Secular stagnation meets the headwinds
49
healthy potential GDP growth but a large gap of roughly 20% separating the levels of
actual and potential GDP.4
Some have dismissed Hansen’s concerns by pointing to the rapid growth in productivity
that was occurring as he wrote during what Alex Field (2003) has called the 20th
century’s “most technologically progressive decade”. Some optimistic writers have
pointed to the upsurge in productivity growth that occurred in the 1930s and 1940s as
offering the possibility that history might repeat itself and lead to faster productivity
growth over the next two decades than even during the productivity heyday of 1996-
2004.5
The reality of 2014 is far grimmer than faced Hansen’s US of 1938, because the US
was about to receive a succession of lucky breaks that utterly transformed late 1930s
gloom into post-war prosperity. Hitler’s invasion of Poland created a doubling of export
orders in the winter of 1939-40. After the fall of France, the US government pushed the
ignition switch on the Arsenal of Democracy, and before Pearl Harbor the share of total
government spending in GDP had doubled. Real GDP grew at an annual rate of 12.8%
between 1939:Q4 and 1941:Q4. By 1944, real GDP had doubled from its 1939 level.
Most amazingly, the economy did not slide back into depression conditions when this
huge dose of fiscal stimulus was removed; labour productivity was actually higher in
1950 than in 1944.
4 Current NIPA data for nominal GDP register $104.6 billion in 1929, $57.2 in 1933, and $87.4 in 1938. Gordon and Krenn (2010) estimate the GDP gap for 1938:Q4 to be 23.1%, implying that nominal potential GDP was $113 billion in 1938. Potential GDP grew between 1928 and 1941 at 3.1% per year, and labour productivity grew at 2.7% per year, more than double the rate achieved in 2004-14.
5 Syverson (2013, Chart 1) cleverly displays the level of labour productivity with two horizontal axes, one extending from 1890 to 1940 and the other aligned 80 years later to extend from 1970 to 2020. This 80-year displacement implies a parallel between 1932 and 2012 and overtly suggests that productivity growth will speed up radically after 2012, as it did after 1932. He ignores the fact that much of the upsurge of productivity growth after 1932 was cyclical and related to the doubling of real GDP between 1939 and 1944.

Secular Stagnation: Facts, Causes, and Cures
50
2 Thedemiseofgrowthoriginatesinheadwinds,nottechnology
My forecast of growth over the 25 to 40 years is measured from 2007, not from now.
The sources of slow growth do not involve technological change, which I assume will
continue at a rate similar to that of the last four decades. Instead, the source of the
growth slowdown is a set of four headwinds, already blowing their gale-force to slow
economic progress to that of the turtle. These four barriers to growth are demographics,
education, inequality, and government debt. These will reduce growth for real GDP per
capita from the 2.0% per year that prevailed during 1891-2007 to 0.9% per year from
2007 to 2032. Growth in the real disposable income of the bottom 99% of the income
distribution is projected at an even lower 0.2% per year.
While many authors acknowledge the demographic headwind, its long-term quantitative
impact on economic growth remains open to debate. By definition growth in output
per capita equals growth in labour productivity times growth in hours per capita. The
slowdown in productivity growth that began 40 years ago was partly offset between
1972 to 1996 by an increase in the labour-force participation rate of 0.4% per year, as
females and baby-boom teenagers entered the labour force. In contrast during 2004-
2014 the participation rate has declined at an annual rate of 0.5%, and over the shorter
2007-2014 interval at an annual rate of 0.8%. This transition from a 0.4% increase to
a 0.8% decline accounts for a 1.2% reduction in the growth of per-capita real GDP for
any given growth rate of labour productivity.
Recent research (Hall 2014) has shown that about half of the 2007-14 decline in
participation is due to the ageing of the population as the baby-boom generation retires.
The other half is due to declining participation within age groups, due in part to weak
economic conditions. Even if the decline in participation slows from 0.8 to 0.4% per
year, the portion attributable to baby-boom retirement, that is still enough to make it
impossible for real GDP per capita to match productivity growth.
The turtle’s progress: Secular stagnation meets the headwinds
51
The second headwind is education. Throughout most of the 20th century, rising high-
school completion rates permanently changed the productive capacity of US workers,
but this transition was over by 1970. Further increases in high school completion rates
are prevented by dropping out, especially of minority students, as the US slides to
number 16 in an international league table of secondary school completion among
developed countries. Similarly, the US is number 16 in college completion rates and
there are new problems – over $1 trillion in student debt combined with the inability
of 40% of college graduates to find jobs requiring a college education, spawning a new
generation of indebted baristas and taxi drivers.
The third headwind is income inequality that continues to grow inexorably as salaries
for CEOs and celebrities march ever upwards, augmented by the creation of trillions
of dollars in stock market wealth. Below the 90th percentile, corporations are working
overtime to reduce wages, reduce benefits, convert defined benefit pension plans to
defined contribution, and to use Obamacare as an excuse to convert full-time jobs to
part-time status.
The fourth headwind is the predicted upward creep in the ratio of federal government
debt to GDP. The official CBO data greatly understate the gravity of the problem,
because the CBO estimate of future potential GDP growth is out of touch with reality.
Because potential real GDP growth is already much slower than the CBO estimates
(Gordon 2014b), future tax revenue will grow more slowly, boosting the debt in the
numerator of the debt/GDP ratio, while the denominator will grow more slowly, thus
further increasing the ratio. The federal debt/GDP ratio could well reach 150% by
the late 2030s, and this does not take into account the apparently intractable pension
burdens in some of the largest state and local governments.
For the disposable (after tax) incomes of the bottom 99%, it is hard to find any room
for growth at all. Indeed official measures of median wage and household income have
not grown for several decades. While these measures may understate income growth,
my exercise in taking the historical record of growth of real GDP per capita and then

Secular Stagnation: Facts, Causes, and Cures
52
subjecting it to ‘an exercise in subtraction’ avoids the problem that some of the median
wage and household income data exclude elements that are included in the data on GDP
and personal disposable income.
3 Nobodydebatestheheadwinds,insteadtheydebatetechnological progress
My forecast of slow future growth after 2007 does not rely on any slowing of future
technological change. My ‘exercise in subtraction’ deducts 1.2% from the realised
1891-2007 per-capita output growth rate of 2.0% for the combined impact of the four
headwinds. Then I deduct an additional 0.6% for the fact that productivity change
slowed markedly from the 80 years before 1972 to the 40+ years since 1972. In my
numbers, there is no forecast of a future technological slowdown – productivity growth
adjusted for educational stagnation is predicted to be just as fast during 2007-2032 as
during 1972-2007.
Critics of my growth forecasts have largely ignored the fact that I am not suggesting that
the pace of innovation will slow in the future compared to the achievements of 1972-
2014. What the Economist cover called today’s “loss of oomph” in the US economy
occurred after 1972, that is, after the first century of implementing the rainbow of
benefits from the inventions of the Second Industrial Revolution. In the early post-war
years the spread of air conditioning, commercial air travel, and the interstate highway
system represented the final implementation of technologies invented in the 1870s.
After 1972 the slowdown was visible in the data and has continued to the present.

The turtle’s progress: Secular stagnation meets the headwinds
53
Figure 1 Annual growth rate of TFP for ten years preceding years shown, years
ending in 1900 to 2012
0
0.5
1
1.5
2
2.5
3
3.5
1900 1910 1920 1930 1940 1950 1960 1970 1980 1990 2000 2012
Per
cent
per
yea
r
For decades, macroeconomists struggled to understand the post-1970 productivity
growth slowdown. But in fact our entire generation has been asking the wrong question.
Instead of wondering why there was a productivity growth slowdown after 1972, we
should have asked: “Can we explain the productivity miracle that occurred in the US
economy between 1920 and 1970?” While I join most analysts in preferring to compare
productivity growth data between years when unemployment and utilisation were
‘normal’, nevertheless it is interesting to look at the raw data for each of the 12 decades
since 1890 (Figure 1). Any techno-optimist must look at this history with dismay. The
future is not going to be better than the past, because the economy during 1920-70
achieved growth in total factor productivity (TFP) of a different order of magnitude in
these ‘green’ decades than during the ‘blue’ decades before 1920 and since 1970.6
6 Total factor productivity (TFP) is defined as a weighted average of the ratio of output to labour input and the ratio of output to capital input, where both types of input are adjusted for quality changes. The TFP data displayed in Figure 1 are derived from scratch in Chapter 10 of my forthcoming book (Gordon 2015). They combine labour and GDP data from the BEA, BLS, and Kendrick (1961), but they are also revised to change the concept of capital input to allow for variable retirement ages and to include certain types of government-financed capital input.

Secular Stagnation: Facts, Causes, and Cures
54
A debate has raged over the past two years about the future of economic growth – will
it speed up or slow down? The case for a revival in growth is made most emphatically
by two MIT economists, Erik Brynjolfsson and Andrew McAfee (2013), and by my
Northwestern colleague Joel Mokyr (2014). The techno-optimists focus entirely on
their hopes and dreams of unprecedented future breakthroughs in technology that
centre on the benefits of artificial intelligence, big data, small robots, medical miracles,
and driverless cars and trucks. They ignore the headwinds and thereby have nothing
to say about the core of my case that future disposable income growth for the bottom
99% will be slower than in the past, a slowdown that already began years ago when the
headwinds began to gain momentum.
These techno-optimist forecasts are useful only along one dimension. They give us
hope that innovation might proceed at the same pace in the next few decades as in
the last four. Yet they are utterly unconvincing that the pace of technological change
will be faster over the next 25 years than over the last 40. Consider what they are up
against that has happened within the last 40 years since 1972: the mainframe era that
eliminated routine clerical jobs of endlessly retyping contracts, bills, and legal briefs;
the invention of the personal computer that allowed many professionals to write their
papers without the aid of a secretary; the invention of game-changing technologies
in the retail sector including the ATM machine, barcode scanning, self checkout, and
airline automated check-in kiosks; Amazon and e-commerce; wiki and the availability
of free information everywhere; the obsolescence of the hard-copy library catalogue,
the auto parts catalogue, the print dictionary and encyclopaedia.
The pessimism in my forecasts of future economic growth is based on the headwinds,
not a faltering of technology. I am dubious that the nirvana of artificial intelligence, big
data, robots, driverless cars, and so on will match the achievements enumerated above
of the last 40 years. By basing my productivity forecast on a continuation of the 1972-
2014 pace of innovation, I am deliberately suppressing my skepticism.

The turtle’s progress: Secular stagnation meets the headwinds
55
The techno-optimists differ in the nature of their concerns. Brynjolfsson and McAfee
(2013) are admirable in their social concern that their abundant robots and big data
will eliminate millions of jobs. Mokyr is not interested in jobs or headwinds. He
predicts hypothetical future breakthroughs without any contact with the historical data,
a remarkable position for an economic historian. He does not appear to care about the
drama shown in Figure 1 above of the TFP speed-up during the period 1920-70 and its
subsequent relentless slowdown.
Mokyr’s sole comment about the headwinds (2014, p. 14) is that the unprecedented
decline in the labour-force participation rate is partly offset by an increase in leisure.
However we have long known that leisure time during the working week experienced
by the unemployed or by those who would prefer to work has far less value than leisure
time on weekends and during vacations. Labour-force participation has been declining
in large part because many people are forced to retire without adequate finances and
others give up looking for jobs after a desperate and endless search. He punctuates his
dismissal of declining hours per capita with a remarkable quote: “But it may well be
that a leisurely life is the best ‘monopoly profit’”. He forgets his history – from the
standpoint of the increasing marginal disutility of work, the real welfare-enhancing
transition involving leisure occurred in the first half of the 20th century when the 60-
hour manufacturing workweek of 1900 fell to 40 hours per week by 1950.7
The optimists, both Brynjolfsson and McAfee and Mokyr, share a common reaction to
any display of historical productivity data such as contained in Figure 1. They claim
that GDP is fundamentally flawed because it does not include the fact that information
is now free due to the growth in internet sources such as Google and Wikipedia. A
complementary statement is that numerous items have disappeared from GDP because
they are already provided for free with a smart phone – not only the print dictionary or
encyclopaedia, but the music-playing capability that makes the separate iPod obsolete,
7 Mokyr’s claim that valuable leisure time partly or entirely offsets the lost income of the unemployed (and of those out of the labour force who would prefer to work) is sharply contradicted by a recent survey of the emotional well-being of the unemployed during the recent recession and slow recovery (see Krueger and Mueller 2011).
Secular Stagnation: Facts, Causes, and Cures
56
the restaurant locator that makes the printed Zagat guide obsolete, the growth in
companies like Uber and Lyft that may make the urban taxi obsolete, and many more.
Two responses are appropriate about the unmeasured GDP made possible by the smart
phone. The most obvious is that TFP growth sagged decades before the popularisation
of smart phones and the internet. The most important event of the digital age was the
marriage of personal computers and communications in the mid-to-late 1990s in the
form of the internet, web browsing, and e-mail. Many of the sources of consumer
surplus and free information were established more than a decade ago, including
Amazon in 1994, Google in 1998, as well as Wikipedia and iTunes in 2001. While
progress has continued in the past decade with smart phones, gmail, Google Maps, and
other applications, these innovations are second-order inventions compared to the great
marriage of computers and communication of the late 1990s, and the slow growth of
TFP reflects that.
The much more important response is that GDP has always been understated. Henry
Ford reduced the price of his Model T from $900 in 1910 to $265 in 1923 while
improving its quality. Yet autos were not included in the CPI until 1935. Think of what
GDP misses: the value of the transition from gas lights, that produced dim light and
pollution and were a fire hazard, to much brighter electric lights turned on by the flick
of a switch; the elevator that bypassed flights of stairs; the electric subway that could
travel at 40mph compared to the 5mph of the horse-drawn streetcar; the replacement of
the urban horse by the motor vehicle that emitted no manure; the end of disgusting jobs
of human beings required to remove the manure; the networking of the home between
1870 and 1940 by five new types of connections (electricity, telephone, gas, water, and
sewer); the invention of mass marketing through the department store and mail order
catalogue; and the development of the American South made possible by the invention
of air conditioning.
Perhaps the most important omission from real GDP was the conquest of infant
mortality, which by one estimate added more unmeasured value to GDP in the 20th

The turtle’s progress: Secular stagnation meets the headwinds
57
century, particularly in its first half, than all measured consumption (Nordhaus 2003).
The list goes on. The invention of air conditioning and commercial air travel may have
created more consumer surplus for more people than the provision of free information
over the internet.
While Mokyr is not concerned about the destruction of jobs implied by his hypothetical
technological revolution, Brynjolfsson and McAfee are overly worried because they are
too optimistic about the future reach of robots into the vast US service sector. Retail
supermarkets are in stasis – the one-time benefit of the barcode scanner 30 years ago
has not changed the need for a human checkout clerk, and supermarket shelves are
still restocked by humans, not robots. The higher education sector has vastly inflated
its costs by adding layers of administration without changing the nature of instruction.
One wonders why the US needs 97,000 bank branches, but the 1977 invention of the
ATM machine has apparently not eliminated them.
4 ThefutureofgrowthintheUnitedStates
Larry Summers’ “secular stagnation” concern with the inability of policymakers to
close the gap between actual and potential real GDP is almost obsolete, because the
gap is steadily shrinking. Now is the time to start trying to understand why the future
pace of potential real GDP appears to be so slow, and whether anything can be done
about the headwinds – particularly demography, inequality, and debt – that drag income
growth for the bottom 99% down so far below the slowing rate of overall growth. The
techno-optimists are whistling in the dark, ignoring the rise and fall of TFP growth over
the past 120 years. The techno-optimists ignore the headwinds, seeming ostrich-like in
their refusal to face reality.
The Economist of 19 July 2014 got it right. America is riding on a slow-moving turtle.
There is little that politicians can do about it. My standard list of policy recommendations
includes raising the retirement age in line with life expectancy, drastically raising the
quotas for legal immigration, legalising drugs and emptying the prisons of non-violent

Secular Stagnation: Facts, Causes, and Cures
58
offenders, and learning from Canada how to finance higher education. The US would
be a much better place with a medical system as a right of citizenship, a value-added
tax to pay for it, a massive tax reform to eliminate the omnipresent loopholes, and an
increase in the tax rate on dividends and capital gains back to the 1993-97 Clinton
levels.
But hypothetical legislation, however politically improbable, has its limits. The
headwinds that are slowing the pace of the US’s future economic growth have been
decades in the making, entrenched in many aspects of our society. The reduction of
inequality and the eradication of roadblocks in our educational system defy the cure-all
of any legislation signed at the stroke of a pen. Innovation, even at the pace of 1972-
2014, cannot overcome the ongoing momentum of the headwinds. Future generations of
Americans who by then will have become accustomed to turtle-like growth may marvel
in retrospect that there was so much growth in the 200 years before 2007, especially
in the core half century between 1920 and 1970 when the US created the modern age.
References
Brynjolfsson, E and A McAfee (2013), The Second Machine Age: Work, Progress, and
Prosperity in a Time of Brilliant Technologies, New York and London: Norton.
Field, A J (2003), “The Most Technologically Progressive Decade of the Century”,
American Economic Review 93(4): 1399-1413.
Gordon, R J (2014a), “The Demise of U.S. Economic Growth: Restatement, Rebuttal,
and Reflections”, NBER Working Paper No. 19895.
Gordon, R J (2014b), “Current and Future Growth in Potential Real GDP: The
Conundrum Posed by Declining Unemployment”, initial draft, 19 July.
Gordon, R J (2015), Beyond the Rainbow: The Rise and Fall of Growth in the American
Standard of Living, Princeton NJ: Princeton University Press, forthcoming.
The turtle’s progress: Secular stagnation meets the headwinds
59
Gordon, R J and R Krenn (2010), “The End of the Great Depression 1939-41: Fiscal
Multipliers and Policy Contributions”, NBER Working Paper No. 16380.
Hall, R E (2014), “Quantifying the Lasting Harm to the U.S. Economy from the
Financial Crisis”, NBER Working Paper No. 20183.
Hansen, A H (1934), “Capital Goods and the Restoration of Purchasing Power”,
Proceedings of the Academy of Political Science 16(1): 11-19.
Hansen, A H (1939), “Economic Progress and Declining Population Growth”, American
Economic Review 29(1): 1-15.
Kendrick, J W, assisted by M R Pech (1961), “Productivity Trends in the United States”,
National Bureau of Economic Research (NBER) General Series No. 71, Princeton, NJ:
Princeton University Press.
Krueger, A B and A Mueller (2011), “Job Search, Emotional Well-Being, and
Job Finding in a Period of Mass Unemployment: Evidence from High-Frequency
Longitudinal Data”, Brookings Papers on Economic Activity 42(1): 1-57.
Mokyr, J (2014), “The Next Age of Invention: Technology’s Future Is Brighter Than
Pessimists Allow”, City Journal (Winter): 12-20.
Nordhaus, W D (2003), “The Health of Nations: The Contribution of Improved Health
to Living Standards”, in K M Murphy and R H Topel (eds), Measuring the Gains from
medical Research: An Economic Approach, Chicago: University of Chicago Press for
NBER, 9-40.
Summers, L (2013), “IMF Economic Forum: Policy Responses to Crises”, speech at the
IMF Fourteenth Annual Research Conference, Washington, DC, 9 November.
Syverson, C (2013), “Will History Repeat Itself? Comments on “Is the Information
Technology Revolution Over?”, International Productivity Monitor 25: 37-40.


61
Four observations on secular stagnation
Paul KrugmanPrinceton University and CEPR
Larry Summers’ speech at the IMF’s 2013 Annual Research Conference raised the
spectre of secular stagnation. This chapter outlines three reasons to take this possibility
seriously: recent experience suggests the zero lower bound matters more than previously
thought; there had been a secular decline in real interest rates even before the Global
Crisis; and deleveraging and demographic trends will weaken future demand. Since
even unconventional policies may struggle to deal with secular stagnation, a major
rethinking of macroeconomic policy is required.
I was very annoyed when Larry Summers made a big splash talking about secular
stagnation at the IMF’s 2013 Annual Research Conference – annoyed not at Larry but at
myself. You see, I had been groping toward more or less the same idea, and had blogged
in that general direction (Krugman 2013) – but it wasn’t forceful, and Larry rightly gets
credit for making the topic a front-burner issue.
The larger point, of course, is that if you’re following events and looking at the data it’s
actually quite natural to raise once again the concerns Alvin Hansen raised 65 years ago,
when he worried that low population growth would produce a situation of persistently
inadequate demand. In what follows, I’ll lay out four reasons why secular stagnation
deserves the buzz it’s now getting.

Secular Stagnation: Facts, Causes, and Cures
62
Observation#1:The zero lower bound matters much more than we thought
Secular stagnation is the proposition that periods like the last five-plus years, when
even zero policy interest rates aren’t enough to restore full employment, are going to be
much more common in the future than in the past — that the liquidity trap is becoming
the new normal. Why might we think that?
One answer is simply that this episode has gone on for a long time. Even if the Fed raises
rates in 2015, which is far from certain, at that point we will have spent seven years —
roughly a quarter of the time since we entered a low-inflation era in the 1980s — at the
zero lower bound. That’s vastly more than the 5% or less probability economists at the
Federal Reserve used to consider reasonable for such events.
Suppose that we were to expect the future, on average, to look like the past – specifically,
the past since price stability in the modern sense of low stable inflation became the
norm. Even then, we would, on current evidence, expect to see a lot of problems with
monetary policy at the zero lower bound; that is, we’d expect the world to look a lot
more like that envisioned by Hansen than that envisioned by most macroeconomists
during the Great Moderation era.
Beyond that, a look at the data suggests that there has been an ongoing trend making
ZLB events more likely.
Observation#2:There seems to be a downward trend in real interest rates
It’s not widely remembered now, but there was some discussion of a possible liquidity
trap during the 1990-1 recession and the jobless recovery that followed, and much
more discussion in the slow recovery after the 2001 recession. And there was a reason:
a look at the data suggests that it was getting steadily harder to get monetary traction
even before the 2008 crisis. The IMF (2014) has shown that there appears to have been

Four observations on secular stagnation
63
a downward trend in long-term real interest rates over the era of the Great Moderation;
the trend is even more visible if you look at short-term rates. Figure 1 shows the Fed
funds rate minus core inflation, averaged over business cycles (peak to peak; I treat the
double-dip recession of the early 1980s as one cycle). This in turn suggests that my
crude calculation above of the odds of hitting the zero lower bound was too optimistic;
the downward trend implies that the odds are substantially higher now than they were
in the past.
And even that is almost surely too optimistic.
Figure 1 Real interest rate
Business cycle averages
12
10
8
6
4
2
0
-2
-4
Observation#3:The fundamentals have shifted in a major way
since the 2000-7 cycle
As I showed in Figure 1, the average real interest rate over the 2000-7 business cycle
was very low by historical standards. Yet the environment of the time was far more
favourable for spending than the environment is likely to be looking forward, for at
least two reasons.
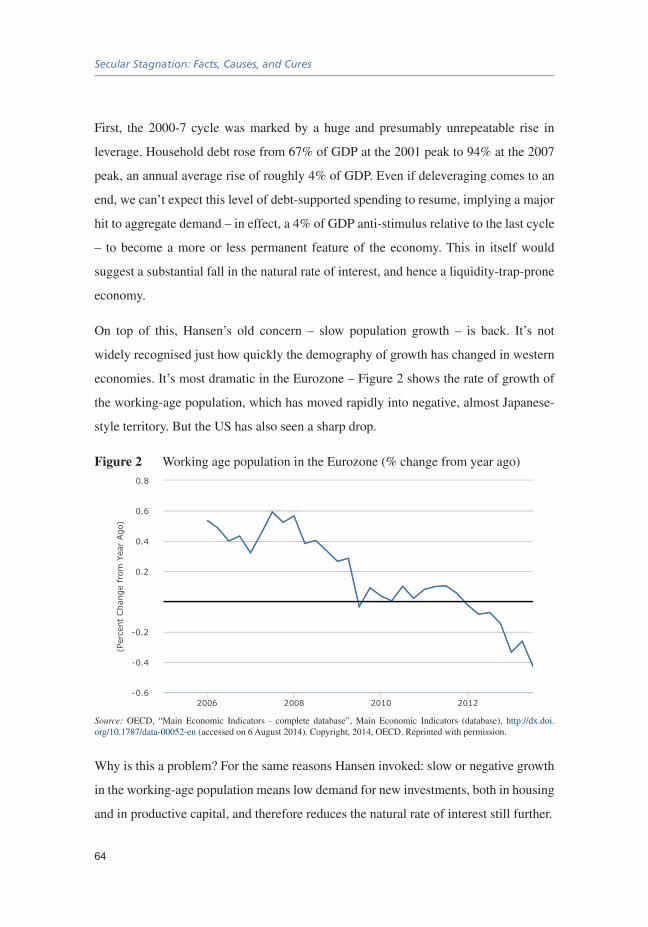
Secular Stagnation: Facts, Causes, and Cures
64
First, the 2000-7 cycle was marked by a huge and presumably unrepeatable rise in
leverage. Household debt rose from 67% of GDP at the 2001 peak to 94% at the 2007
peak, an annual average rise of roughly 4% of GDP. Even if deleveraging comes to an
end, we can’t expect this level of debt-supported spending to resume, implying a major
hit to aggregate demand – in effect, a 4% of GDP anti-stimulus relative to the last cycle
– to become a more or less permanent feature of the economy. This in itself would
suggest a substantial fall in the natural rate of interest, and hence a liquidity-trap-prone
economy.
On top of this, Hansen’s old concern – slow population growth – is back. It’s not
widely recognised just how quickly the demography of growth has changed in western
economies. It’s most dramatic in the Eurozone – Figure 2 shows the rate of growth of
the working-age population, which has moved rapidly into negative, almost Japanese-
style territory. But the US has also seen a sharp drop.
Figure 2 Working age population in the Eurozone (% change from year ago)
-0.6
-0.4
-0.2
0.2
0.4
0.6
0.8
2006 2008 2010 2012
(Per
cent
Cha
nge
from
Yea
r Ago
)
Source: OECD, “Main Economic Indicators - complete database”, Main Economic Indicators (database), http://dx.doi.org/10.1787/data-00052-en (accessed on 6 August 2014). Copyright, 2014, OECD. Reprinted with permission.
Why is this a problem? For the same reasons Hansen invoked: slow or negative growth
in the working-age population means low demand for new investments, both in housing
and in productive capital, and therefore reduces the natural rate of interest still further.
Four observations on secular stagnation
65
So put these items together:
1. A much higher probability of hitting the zero lower bound than we used to think.
2. A secular downward trend in real interest rates even before the 2008 crisis.
3. Changes in fundamentals – an end to ever-rising leverage and a sharp demographic
slowdown – that imply still weaker demand looking forward.
Taken together, these factors don’t prove that secular stagnation is here, because other
things can happen, but they do make the case for such stagnation alarmingly plausible.
And this creates significant problems for policy.
Observation#4:Even unconventional policies have problems dealing with secular stagnation
If you look at the extensive theoretical literature on the zero lower bound since Japan
became a source of concern in the 1990s, you find that just about all of it treats liquidity-
trap conditions as the result of a temporary shock. Something – most obviously, a burst
bubble or deleveraging after a credit boom – leads to a period of very low demand, so
low that even zero interest rates aren’t enough to restore full employment. Eventually,
however, the shock will end.
The idea that the liquidity trap is temporary has shaped the analysis of both monetary
and fiscal policy. And that analysis now looks much more problematic.
Start with monetary policy. The most persuasive story about how monetary policy can
work at the zero lower bound is that it can gain traction if you can convince the public
that there has been a regime change, that the central bank will maintain expansionary
monetary policy even after the economy recovers, in order to generate high demand
and some inflation. As I put it a long time ago (Krugman 1998), the central bank must
“credibly promise to be irresponsible”.
But if we are talking about Japan, exactly when do we imagine that this period of
high demand, when the zero lower bound is no longer binding, is going to begin?

Secular Stagnation: Facts, Causes, and Cures
66
And now we are talking seriously about secular stagnation in Europe and the US as
well, which means that it could be a very long time before ‘normal’ monetary policy
resumes. Now, even in this case you can get traction if you can credibly promise higher
inflation, which reduces real interest rates. But what does it take to credibly promise
inflation? It has to involve a strong element of self-fulfilling prophecy: people have
to believe in higher inflation, which produces an economic boom, which yields the
promised inflation. A necessary (though not sufficient) condition for this to work is that
the promised inflation be high enough that it will indeed produce an economic boom if
people believe the promise will be kept. If it is not high enough, then the actual rate of
inflation will fall short of the promise even if people do believe in the promise, which
means that they will stop believing after a while, and the whole effort will fail.
Figure 3 A timidity trap?
2%
Phillips curve
Aggregate demand
Infla�on
Output
Figure 3 offers a way to illustrate this problem, which I have come to think of as the
‘timidity trap’. Of the two curves shown, one is a hypothetical (but I think realistic)
non-accelerationist Phillips curve, in which the rate of inflation depends on output
and the relationship gets steep at high levels of utilisation. The other is an aggregate
demand curve that depends positively on expected inflation, because this reduces real
interest rates at the zero lower bound. I have drawn the graph so that if the central bank

Four observations on secular stagnation
67
announces a 2% inflation target, the actual rate of inflation will fall short of 2 %, even
if everyone believes the bank’s promise – which they will not do for very long, in any
case.
So you see my concern. Suppose that the economy really needs a 4% inflation target,
but the central bank says: “That seems kind of radical, so let’s be more cautious and
only target 2%”. This sounds prudent, but it may actually guarantee failure. In other
words, the problem of getting effective monetary policy, always difficult at the zero
lower bound, gets even harder if we have entered an era of secular stagnation.
What about fiscal policy? Here the standard argument is that deficit spending can
serve as a bridge across a temporary problem, supporting demand while, for example,
households pay down debt and restore the health of their balance sheets, at which point
they begin spending normally again. Once that has happened, monetary policy can take
over the job of sustaining demand while the government goes about restoring its own
balance sheet. But what if a negative real natural rate isn’t a temporary phenomenon? Is
there a fiscally sustainable way to keep supporting demand?
In this chapter I’ll leave these questions hanging. The crucial point, for now, is that
the real possibility that we’ve entered an era of secular stagnation requires a major
rethinking of macroeconomic policy.
References
Hansen, A (1939), “Economic Progress and Declining Population Growth”, American
Economic Review 29(1): 1–15.
International Monetary Fund (2014), World Economic Outlook, April.
Krugman, P (1998), “It’s Baaack: Japan’s slump and the return of the liquidity trap”,
Brookings Papers on Economic Activity 29(2): 137-206.

Secular Stagnation: Facts, Causes, and Cures
68
Krugman, P (2013), “Bubbles, regulation, and secular stagnation”, The New York Times
blog, 25 September.
69
Secular joblessness
EdwardLGlaeserHarvard University
The wonders of the internet age cast doubt on the idea that technological progress is
stagnating. Worryingly, however, some fraction of US job losses has become permanent
after almost every recession since 1970. This chapter argues that persistent joblessness
is unlikely to be a purely macroeconomic phenomenon. Although the US welfare
system remains less generous than many European ones, it has become substantially
more generous over time. Alongside targeted investments in education and training,
radical structural reforms to America’s safety net are needed to ensure it does less to
discourage employment.
US investment and innovation – the most standard ingredients in long-run economic
growth – are not declining. The technological world that surrounds us is anything but
stagnant. Yet we can have little confidence that the continuing flow of new ideas will
solve the US’s most worrying social trend: the 40-year secular rise in the number and
share of jobless adults. Past history suggests that such joblessness will persist, even
during the most robust recovery, unless there are serious structural reforms involving
the social safety net and the formation of human capital.

Secular Stagnation: Facts, Causes, and Cures
70
Figure 1 GDP growth rates and male employment, 1947-2012
−.02
0.0
2.0
4.0
6 Real G
DP per capita grow
th
.8.8
5.9
.95
Em
ploy
men
t/pop
ulat
ion
ratio
for
mal
es a
ged
25−5
4
19451950
19551960
19651970
19751980
19851990
19952000
20052010
2015
Employment/population ratio for males aged 25−54Growth in real GDP per capita (3-year moving avg.)
Notes: Shaded areas indicate US recessions.
Source: Bureau of Economic Analysis, Bureau of Labor Statistics and US Census.
Figure 1 shows the time series of the growth in real GDP per capita and the non-
employment rate for males aged 25 to 54. The figure illustrates that GDP growth has
indeed been quite sluggish since 2006, which makes the secular stagnation hypothesis
credible. The recession was awful and the recovery has been weak. Moreover, the recent
decline in growth rates seems to fit a larger downward trend; real per capita growth
averaged about 2.5% between 1947 and 1969 and has averaged less than 2% since then.
Yet it is hard to know whether the past painful eight years represent the trend or
the cycle. Things looked far worse in 1938 and pretty bleak in 1982, but if you had
predicted permanent stagnation at either time, you would have been woefully wrong. I
don’t mean to suggest that the GDP numbers alone rule out the possibility of permanent
stagnation – but rather that the time periods are short and full of confounding forces.
Moreover, when we turn to the ingredients that theoretically determine longer-term
growth, including innovation and investment, there seems to be little cause for concern.
A decade ago, the US granted 187,000 patents, which was then a historical high. In

Secular joblessness
71
2013, the number of patents granted passed 300,000. Perhaps, modern patents are less
important. Perhaps, the patent office has become more permissive, but that isn’t what
the world feels like to me.
During the first ten years of my life (1967-1977), the only major technological
innovation that I observed entering our apartment was colour TV, and that TV broadcast
roughly the same set of channels over the decade. How can such a world possibly be
compared with innovations of the past decade?
The giants of the internet age – Amazon, Facebook and Google – were either far
smaller or non-existent in 2004. Apple had introduced the iPod in 2001, but not the
iPhone (2007) or the iPad (2010). Skype was first released in 2003. My 2005 Subaru
has neither a GPS system, nor Bluetooth, nor any sensors that tell me when I’m about
to ding a neighbouring car. Robotics have continued to improve, sometimes with life-
saving impacts in surgery.
Indeed, this proliferation of inventions should make us quite nervous about the price
indices used to compute GDP figures. The theory of price indices is that an individual
should be indifferent between living today and living in the past with the same real
income. How many people would really be indifferent between earning $23,000 in
1984 and earning $50,000 in 2014? You could surely buy the same amount of most
basic commodities in 1984, but you would forgo the use of thousands of significant
innovations, some of which improve life expectancy and others which are just fun.
Thebeneficiariesofinnovation
While it seems almost absurd to argue that human inventiveness has stalled, there
are serious questions over which inventions bring widespread benefits. For much of
human history, per capita incomes were relatively stagnant, despite frequent bursts of
imagination. Perhaps, we are just experiencing an era in which innovation benefits the
few rather than the many.

Secular Stagnation: Facts, Causes, and Cures
72
Since almost all of us are both consumers and producers, technological change can
impact most of us in both capacities, positively or negatively. One can reasonably argue
that many of the innovations prior to 1750, and most global trade, was targeted towards
Europe’s most elite consumers. For example, when the Conquistadors discovered red
cochineal dye being used in the Aztec court, this innovation may have brightened the
clothes of Europe’s aristocracy but it did little for common people (unless they were
dyers). Before the printing press, literary innovations necessarily had a small, elite
consumer base and employed even fewer writers. Painting may have reached a broader
audience, but it still seems unlikely that even monumental artistic innovations, such
as Masaccio’s use of linear perspective in Renaissance Florence, provided widespread
consumption benefits during their own age.
The 17th century Dutch trade empire initially specialised in providing goods demanded
by the wealthy, such as spices, yet that innovative empire eventually benefited the
people of the Netherlands as producers. According to the Maddison data (Bolt and
van Zanden 2013), the Netherlands was the wealthiest nation on the planet during the
1600s. Similarly, innovations in the global luxury goods trade today, like the Hermes
Birkin bag, benefit only a modest number of consumers, but if Hermes’ press is to be
believed, the labour demanded by such items can be considerable.
At its best, the industrial revolution generated innovations that benefitted masses of
ordinary people as both consumers and producers. Henry Ford’s Model T provided
inexpensive transport for millions of ordinary Americans and $5 a day wages for his
workers. The earlier innovations in Lancashire’s cotton mills were associated with
often horrific working conditions, but eventually demand for English labour appears to
have boosted earnings dramatically (Clark 2010)
Figure 2 presents a two-by-two box that categorises the beneficiaries of different
forms of innovations. It is hard to think of any innovations before the modern age that
increased demand for the most skilled workers while providing consumer benefits for
the masses. Indeed, for such a thing to occur, one must imagine a world in which highly

Secular joblessness
73
paid elite workers toil for the benefit of services that will be used by the poor. Could
such a thing be imaginable in pre-revolutionary France or in Ming China? Yet that is
exactly what happens at Google or Facebook. Highly paid workers work constantly to
improve a service that is provided freely to hundreds of millions of poorer users.
Figure 2 A Categorisation of the beneficiaries of innovation
The skilled benefit as producers
Widespread benefit as producers
Elite consumer benefitsPre-modern artistic innovations
Medieval fancy dyes
Dutch Trade Empire
Labour-intensive luxury goods
Widespread consumer benefits
Model T Cars
Industrial Revolution generally
This inversion of the traditional nature of innovations represents the rise of superstar-
like technologies (Rosen 1981) that enable the highly competent to provide their
services as almost a public good, with no congestion in use. The most natural precursor
to this modern inversion was well-paid artists, such as writers and movie stars, who
entertained the masses. The inversion also happened when Fred Astaire and Ginger
Rogers danced for depression-era movie audiences.
The essentially zero marginal cost of providing internet-related services means that
they are often monetised through the advertising of goods with a positive marginal
cost. It is free to use Google, but their search engine will nudge users towards their
advertisers. The free nature of these services has meant a democratisation of access to
information; a fact that is rarely considered in attempts to measure inequality.
Innovation seems unrelenting, at least to me, and I believe that such innovation is the
stuff of longer-term economic growth (Romer 1986). Therefore, I cannot help but
think that stagnation is likely to be temporary. I also believe that the benefits of future
innovation will continue to flow to a wide swath of humanity, at least in their capacity
Secular Stagnation: Facts, Causes, and Cures
74
as consumers, because the internet seems to strongly favour free – or low cost – delivery
of services and content.
Yet I do not think that all is well. The dysfunction in the labour market is real and
serious, and seems unlikely to be solved by any obvious economic trend.
EurosclerosisintheUS
Figure 1 shows the rise in joblessness among males between the ages of 25 and 54,
which includes both unemployment and being out of the labour market for other
reasons. I focus on men because non-employment for women is more complicated and
far more likely to be related to childrearing. I do not mean to suggest that chronic
joblessness among women cannot also be a major problem.
Until the end of the 1960s, this figure was relatively steady, averaging approximately
5% in good times and 8% during downturns. There was no trend. After the upward
bursts of a recession, joblessness fell back to normal.
After 1970, however, there has been an irregular but strongly positive trend. Joblessness
has typically soared during recessions, but unlike the earlier post-war period, those rises
were not fully reversed during recoveries. Some fraction of the recessionary joblessness
rise has become permanent after almost every post-1970 downturn.
The 2007 recession was particularly severe and at its peak, prime-aged male joblessness
rose to almost 20%. Today, the rate has fallen to 16.6%. It seems reasonable to believe
that the rate will continue to fall somewhat, but if past recoveries provide any guide, a
greater share of prime-aged males will be jobless at the end of the recovery than at the
beginning of the recession.
The consequences of so much long-term joblessness seem terrible for both the
individuals concerned and society as a whole. Human capital depreciates off-the-job,
so talent is lost. For decades, researchers have documented a profound connection

Secular joblessness
75
between unhappiness and unemployment (Clark and Oswald 1994), perhaps because of
the social isolation and self-doubt associated with joblessness (Hetschko et al. 2014).
Extreme joblessness may be only one aspect of increased inequality, but it is among the
most troubling features of a more unequal world. If one in five adults is disconnected
from the productive side of the economy, what will this mean for their voting behaviour,
or their sense of connection with the country’s larger economic goals? Can this lead to
a self-reinforcing process where this group votes regularly for larger jobless benefits
which in turn increase the level of joblessness? We are, unfortunately, just beginning to
understand the potential impact of the sea change in American life.
Why did joblessness rise in the US? The explanation that seems to fit the time series
best is the interaction between institutions and labour demand shocks proposed by
Blanchard and Wolfers (2000). Over time, less skilled American workers have been
hit by a series of adverse labour demand shocks, like workers in many other wealthy
countries. These shocks may well have increased joblessness even if America’s social
safety net had not evolved since 1960, but their impact was exacerbated because of
institutional changes that made joblessness less painful and increased the incentives to
stay out of work.
While the US social welfare system remains less generous than many European
safety nets, it has become substantially more generous over time. The US has a bevy
of social programmes – including Medicaid, the Supplemental Nutrition Assistance
Program (food stamps), Temporary Aid to Needy Family, Section 8 Housing vouchers
and insurance for both disability and unemployment – that have generally increased in
generosity over time, often for quite laudable reasons. These programmes also sharply
reduce the incentives to work, often by directly taxing earnings (both food stamps
and Section 8 vouchers carry an independent 30% tax on earnings) and by making
joblessness less miserable.
Perhaps the most important programme connected to long-term joblessness is disability
insurance. In 2010, 16.6% of Americans between 21 and 64 reported being disabled, and
Secular Stagnation: Facts, Causes, and Cures
76
11.4% reported a severe disability (Brault 2012). In 1970, 1.5 million Americans were
receiving Federal disability insurance; in 2013, 8.9 million Americans received such
aid (Social Security Administration 2014). This increase in disability is particularly
startling given the general increase in US health over the same time period, and surely
institutional changes, including those meant to reduce unemployment, have played
some role in this dramatic increase (Autor and Duggan 2003).
Another way of looking at the secular rise in joblessness is that it represents a failure of
entrepreneurial imagination. Why haven’t smart innovators figured out ways to make
money by employing the jobless? One explanation is that current technological trends
just don’t favour products made with less skilled labour. The second explanation is
that the safety net has just made this labour too expensive relative to more mechanised
alternatives. I now turn to policies that might mitigate the secular rise in joblessness.
Publicpolicyandjoblessness
If the problem is perceived as secular stagnation, then policy thoughts move towards
macroeconomic interventions aimed at improving the US’s overall economic mojo, such
as investing in infrastructure or reducing corporate taxes. If the problem is perceived as
a vast increase in the share of out-of-work Americans that has persisted through good
times and bad, then such macroeconomic interventions seem poorly targeted.
The time series path shows that the jobless rate for prime-aged males has never fallen
below 10% during the entire post-1980 time period. Despite the roaring Reagan
recovery and the successful Clinton years, joblessness remained stubbornly high. That
fact should make us wonder whether any macroeconomic policy can solve the problem
of persistently high joblessness. Interventions targeted at less prosperous Americans
seem more likely to be successful.
The cross-sectional relationship between education and unemployment is so strong that
it is hard not to focus on America’s troubled education system. As of June 2014, 72.7%

Secular joblessness
77
of college graduates over the age of 25 were employed, while only 39.4% of high
school dropouts had a job (Bureau of Labor Statistics 2014). This extraordinary cross-
sectional gap doesn’t prove causality, but the hundreds of studies attempting to estimate
the casual impact of education on earnings and employment have generally confirmed
at least some positive effect.
The US’s school systems may have once been the best in the world (Goldin and Katz
2009), but at this point, the country’s scores are middling. On maths scores, US students
perform far below students in European countries like Germany and the Netherlands,
which in turn are outperformed by Asian competitors like South Korea and Singapore
(Hanushek et al. 2010). Moreover, while US test scores are improving, they are not
improving relative to the world’s higher performers.
This chapter cannot dwell on the possible approaches to education reform in the
US Charter schools have often been effective, but it is hard to imagine that they can
completely replace conventional schools. There is a long literature documenting the
importance of teacher quality, but it is hard to hire good teachers or fire bad teachers.
Electronic learning may come to play a critical role in teaching the underprivileged.
The key point is that improving America’s education, especially for the less successful
half of the population, seems critical.
It is perhaps also appropriate to do more to emulate the German apprenticeship
programmes and to improve vocational training within the US. Grafting foreign
institutions into US labour markets is not easy, however, and we surely need more
experiments before embracing any system-wide reform.
Education cannot fix the problem single-handedly, especially if we refuse to write off the
current generations of adults. One possibility is that targeted demand-side interventions,
such as infrastructure investments, can employ these workers and thereby rebuild their
human capital. Perhaps this will be the case, but there are reasons to be sceptical. Much
infrastructure investment is now capital intensive. America’s infrastructure programmes

Secular Stagnation: Facts, Causes, and Cures
78
have often been criticised for waste and inefficiency. Better research and, again, more
experiments are surely needed to make the case for such interventions.
Finally, it is surely necessary to rethink the structure of the US’s social safety net and
to ensure that it does less to discourage work. David Autor and Mark Duggan (2010)
have made an interesting proposal suggesting that disabled people be allowed to work.
The idea of combining social welfare programmes to eliminate overlapping anti-work
incentives also seems sensible.
The Earned Income Tax Credit represents a reasonably successful intervention aimed at
making work pay. More can be done in this area. Instead of raising the minimum wage,
which risks deterring future job openings, the wage can be boosted by a federal subsidy.
Social security taxes can be eliminated for workers at the low end of the earnings
distribution. Structural reforms are surely necessary to ensure that the US makes work
more attractive for the jobless.
The massive secular trend in joblessness is a terrible social problem for the US, and
one that the country must try to address. I do not believe that this is a macroeconomic
problem that can be solved with more investment or tax cuts alone. The US needs
targeted investments in education and workforce training, and the country needs to
radically improve the incentives to work.
References
Autor, D H and M Duggan (2010), “Supporting work: A proposal for modernizing
the US disability insurance system”, Center for American Progress and The Hamilton
Project, Brookings Institution.
Autor, D H and M G Duggan (2003), “The rise in the disability rolls and the decline in
unemployment”, Quarterly Journal of Economics 118(1): 157-205.
Secular joblessness
79
Bolt, J and J L van Zanden (2013), “The First Update of the Maddison Project; Re-
Estimating Growth Before 1820”, Maddison Project Working Paper No. 4.
Blanchard, O and J Wolfers( 2000), “The role of shocks and institutions in the rise of
European unemployment: the aggregate evidence”, The Economic Journal 110(462):
1-33.
Brault, M W (2012), “Americans With Disabilities: 2010”, Current Population Reports
p. 70-131, Washington, DC: US Census Bureau.
Bureau of Labor Statistics (2014), “The Employment Situation – June 2014”, Table
A-4. Employment status of the civilian population 25 years and over by educational
attainment.
Clark, A E and A J Oswald (1994), “Unhappiness and Unemployment”, The Economic
Journal 104(424): 648-659.
Clark, G (2010), A Farewell to Alms, Princeton, NJ: Princeton University Press.
Goldin, C D and L F Katz (2009), The Race between Education and Technology,
Cambridge, MA: Harvard University Press.
Hanushek, E A, P E Peterson and L Woessmann (2010), “US Math Performance in
Global Perspective: How Well Does Each State Do at Producing High-Achieving
Students?”, Program on Education Policy and Governance Report No. 10-19, Harvard
University.
Hetschko, C, A Knabe and R Schöb (2014), “Changing identity: Retiring from
unemployment”, The Economic Journal 124(575): 149-166.
Kendrick, W, assisted by M R Pech (1961), Productivity Trends in the United States,
NBER General Series No. 71, Princeton, NJ: Princeton University Press.
Romer, P M (1986), “Increasing Returns and Long-Run Growth”, Journal of Political
Economy 94(5): 1002-1037

Secular Stagnation: Facts, Causes, and Cures
80
Rosen, S (1981), “The Economics of Superstars”, American Economic Review 71(5):
845-858
Social Security Administration, Social Security Beneficiary Statistics, accessed 25 July
2014.

Furtheronpotentialgrowth


83
Secularstagnation?Notinyourlife
Joel MokyrNorthwestern University
In the aftermath of the Great Recession, many economists are persuaded that slow
growth is here to stay. This chapter argues that technological progress – particularly in
areas such as computing, materials, and genetic engineering – will prove the pessimists
wrong. The indirect effects of science on productivity through the tools it provides
scientific research may dwarf the direct effects in the long run. Although technological
advances may polarise labour markets, they also bring widespread benefits that are not
accurately reflected in aggregate statistics.
There is nothing like a recession to throw economists into a despondent mood. Much as
happened in the late 1930s, many of my colleagues seem to believe that ‘sad days are
here again’. Economic growth as it was experienced by the world through much of the
20th century, they tell us, was a fleeting thing. Our children will be no richer than we
are. Some of the best economists of our age, including Larry Summers, Paul Krugman,
and my own colleague Robert J. Gordon, are joining the chorus of the doomsayers.
It is said that we are faced by headwinds that inevitably will slow down growth and
perhaps condemn us to secular stagnation. There is no denying that the population of
the world is getting older, and that the fraction of people working (and supporting the
aged) is falling everywhere except in Africa. The ‘big pushes’ driven by millions of
married women taking jobs and the huge increase in college graduates that drove post
1945 growth were one-off boons, but they are no more. Growing inequality exacerbates
demography. Slow growth is here to stay, say the secular stagnationists.
What is wrong with this story? The one word answer is ‘technology’. The responsibility
of economic historians is to remind the world what things were like before 1800.

Secular Stagnation: Facts, Causes, and Cures
84
Growth was imperceptibly slow, and the vast bulk of the population was so poor that
any disruption in food supply caused by a harvest failure could kill millions. Almost
half the babies born died before reaching the age of five, and those who made it to
adulthood were often stunted, ill, and illiterate. What changed this world was growth
driven by technological progress. Starting in the late 18th century, innovations and
advances in what was then called ‘the useful arts’ slowly began improving life, first in
Britain, then in the rest of Europe, and eventually in much of the rest of the world. The
story has been told many times over, but as Nobelist Robert Lucas once wrote, once you
start thinking about it, it’s hard to think of anything else.
Why did it all happen? In brief: science advanced. The exact interaction between science
and technology is a subtle and complex one, time-variant, and culture-specific. There
can be little doubt that technology can advance without a good scientific understanding
of why techniques work the way they do, but such progress was halting and slow, and
inevitably ran into diminishing returns and fizzled out. After 1750 the epistemic base of
technology slowly began to expand. Not only did new products and techniques emerge;
it became better understood why and how the old ones worked, and thus they could
be refined, debugged, improved, combined with others in novel ways and adapted to
new uses. In short: scientific progress led to productivity growth and a sharp increase
in economic welfare from the mid-19th century on (Mokyr 2002). It was a protracted
process, because many of the natural processes were complex and often contained
technical problems that defied solution for a long time. But between 1780 and 1914,
huge advances were made in the understanding of how to make steel, what makes us
sick, what fertilizers to use, how to make artificial substances and materials, and how to
convert heat into motion (that is, use engines) – to name but a few.
The important thing to remember is that the relationship was a two-way street. One of
the reasons science advanced so rapidly is that technology itself provided the tools and
instruments that allowed ‘natural philosophers’ (as they were known during the Scientific
Revolution) to study the physical world. The most famous of those was the telescope,
used by Galileo to study the stars – and astronomy would never be the same. A less

Secular stagnation? Not in your life
85
hackneyed but technologically more significant example is the barometer; invented by
a student of Galileo’s named Evangelista Torricelli in 1643, it showed the existence of
atmospheric pressure. At about the same time, European instrument builders perfected
the vacuum pump, showing that, contra Aristotle, a vacuum was indeed possible.
Those two scientific insights, as much as anything, spurred the development of the first
steam engines early in the 18th century (known appropriately as atmospheric engines).
In 1800 another Italian named Volta invented the ‘pile’ – the first battery ever made.
In its first decades, this contraption served primarily as a tool for chemical research,
allowing chemists to map out the newly discovered world of elements and compounds,
which unleashed the chemical industries of the 19th century. Or take the improved
microscopes developed in the first half of the 19th century. Advances in optics made
it possible to eliminate what was known as spherical aberration and thus to get greatly
improved image resolution. Would the germ theory of disease and the subsequent
revolution in medical technology have occurred without improved microscopes? In that
fashion, technology pulled itself up by its bootstraps: an invention in one area allowed
scientific progress to occur and thus created technological progress in what could be
quite another field.
Compared to the tools we have today for scientific research, those of Galileo and
Pasteur look like stone-age tools. Yes, we build far better microscopes and telescopes
and barometers today, but digitalisation has penetrated every aspect of science. It
has led to the re-invention of invention. It is not just ‘IT’ or ‘communications’. Huge
searchable databanks, quantum chemistry simulation, and highly complex statistical
analysis are only some of the tools that the digital age places at science’s disposal.
Digital technology is everywhere, from molecular genetics to nanoscience to research
in medieval poetry. Quantum computers, still quite experimental, promise to increase
this power by orders of magnitude. In much recent writings, the importance of ICT on
output and productivity has been stressed, and it is clearly of great importance. What
needs to be kept in mind, however, is that the indirect effects of science on productivity
through the tools it provides scientific research may, in the long run, dwarf the direct

Secular Stagnation: Facts, Causes, and Cures
86
effects. A striking example is the growing use of high-powered computers and radically
new software in material science.
Materials are the core of our production. The terms Bronze Ages and Iron Age signify
their importance; the great era of technological progress between 1870 and 1914 was
wholly dependent on cheap and ever-better steel. In many ways, core-materials can be
viewed as general-purpose technologies made famous by Bresnahan’s and Trajtenberg’s
(1995) seminal paper on the topic. But what is happening to materials now is nothing
short of a sea change, with new resins, ceramics, and entirely new solids designed in
silico, being developed at the nano-technological level. These promise the development
of materials nature never dreamed of and that deliver custom-ordered properties in
terms of hardness, resilience, elasticity, and so on. Graphene, the new super-thin
wonder material, is another substance that promises to revolutionise production in
many lines. The new research tools in material science have revolutionised research.
Historically, progress in material science had been always the result of tedious and
inefficient ‘trial and error’ or highly uncertain serendipity. The classic example is
William Perkin’s discovery of aniline purple in 1856 and Henry Bessemer’s invention
of the eponymous steel-making process the same year. Compare those with the situation
today: researchers can now can simulate in silico the quantum equations that define the
properties of materials, using high-throughput super-computers, and experiment with
materials having pre-specified properties.
But not all research tools depend wholly on computational capacity. Of perhaps even
more revolutionary importance is the powerful technology developed by Stanley Cohen
and Herbert Boyer in the early 1970s, in which they succeeded in creating transgenic
organisms through the use of micro-organisms. Genetic selection is an old technology;
nature never intended to create poodles. But genetic engineering is to artificial selection
what a laser-driven fine-tuned surgical instrument is to a meat axe. The potential
economic significance of genetic engineering is simply staggering, as it completely
changes the relationship between humans and all other species on the planet. Ever since
the emergence of agriculture and husbandry, people have ‘played God’ and changed

Secular stagnation? Not in your life
87
their biological and topographical environment, creating new phenotypes in plants and
animals. Genetic engineering means we are just far better at it.
Not all of it will be net progress; much of it is needed to offset the unanticipated costs
of previous technological advances, most obviously climate change. But the advance
can be seen in less expected areas. In the first half of the 20th century, a vicious fungus
imported unintentionally from the Far East wiped out practically the entire population
of American chestnuts (around four billion trees). Recent work has transplanted a gene
that carries immunity from the by-products produced by the fungus (from wheat genes)
into the somatic cells of chestnut trees, and these transgenic trees promise to be immune
and may lead to the resurrection of a once-proud American icon and reverse one of the
worst ecological disasters that ever befell North America (Rosen 2013).
As science moves into new areas and solves issues that were not even imagined to be
solvable, there are inventors, engineers, and entrepreneurs waiting in the wings to use
the new knowledge and design new gizmos and processes based on it that mostly will
continue to improve our lives. The interplay between science and technology creates a
self-reinforcing or ‘auto-catalytic’ process that seems unbounded.
Speculation on what the new technologies will look like is rife. Robots and the artificial
intelligence are front and centre in this debate, at once wished-for (who likes making
beds?) and feared as job-killers. ICT remains an area in which we have not seen the half
of it, with the much-heralded ‘internet of things’ touted as the next breakthrough. But
perhaps the most unexpected advances may come from less glamorous corners. Combine
the new materials mentioned above with three-dimensional ‘printing’ and you have
mass-customisation, a truly revolutionary concept in the history of manufacturing the
like of which was not seen since the Industrial Revolution. ‘Nanobombs’ that physically
penetrate bacterial and other cell membranes are the next weapon in mankind’s never-
ending war on microbes and possibly cancer. An area of progress few anticipated a
decade ago is the use of ICT in the utilisation rate of fixed assets such as real estate
and cars, as well as human capital. Enterprises such as Airbnb, Uber, Lyft and others

Secular Stagnation: Facts, Causes, and Cures
88
are creating rental markets for assets that were previously lying idle much of the time.
Many of these breakthroughs are not ‘on the horizon’ – they are here. The economy
may be facing some headwinds, but the technological tailwind is more like a tornado.
So, if everything is so good, why is everything so bad? Why the gloominess of my
colleagues? Part of the story is that economists are trained to look at aggregate statistics
like GDP per capita and its derivatives such as factor productivity. These measures were
designed for a steel-and-wheat economy, not one in which information and data are the
most dynamic sector. Many of the new goods and services are expensive to design, but
once they work, they can be copied at very low or zero costs. That means they tend to
contribute little to measured output even if their impact on consumer welfare is very
large. Dealing with altogether new goods and services was not what these numbers
were designed for, despite the heroic efforts by BLS statisticians. The aggregative
statistics miss much of what is interesting.
Another characteristic of many of these goods is the ‘dumbing-down’ of the user; the
ingenuity in a piece of modern technology such as a smartphone is fully frontloaded. A
few thousand highly skilled and creative hardware engineers and a few tens of thousand
software and application writers design it with incredible technical sophistication, so
that hundreds of millions can use it without any. For that reason, there are few jobs in
the high-technology sector, but those that are there pay well. Modern technology often
leads to winner-take-all outcomes, and the inequality implications in terms of income
– though not in terms of access to the good itself – are worrisome. What we gain as
consumers, citizens, viewers and patients we may lose as workers. The demand for
labour ‘hollows out’ and the demand for medium-skilled labour declines unless and
until new jobs are created to absorb those replaced by automatons and robots.
It is impossible to know if such jobs will be created at a sufficient pace. Our own
time has created occupations that may have sounded incomprehensible or grotesque
to our grandparents, from cybersecurity experts to video-game designers to canine
psychiatrists. If the past is any guide, the future holds occupations that will look just

Secular stagnation? Not in your life
89
as strange to us. This very human shortfall of imagination is largely responsible for
much of today’s pessimism. In many other respects, too, the labour-market outlook
is not wholly bleak. The nature of the labour market is changing, to be sure, but if
telecommuting and driverless cars can cut the commuting time for an increasingly
urbanised workforce tormented by traffic jams, at least one major (and uncounted)
tax on workers will be eliminated. Such an improvement would not be reflected in the
aggregate output and productivity statistics.
In short: technology is not our enemy, it is our best hope. It will never be painless,
and there will always be those who draw the short straw in the vast lottery of creative
destruction. But if you think rapid technological change is undesirable, try secular
stagnation.
References
Bresnahan, T and M Trajtenberg (1995), “General purpose technologies ‘Engines of
growth’?”, Journal of Econometrics 65(1): 83–108.
Mokyr, J (2002), The Gifts of Athena, Princeton, NJ: Princeton University Press.
Rosen, R (2013), “Genetically Engineering an Icon”, Atlantic Magazine, 31 May.


91
Secular stagnation: UShypochondria,Europeandisease?
NicholasCraftsCAGE, University of Warwick and CEPR
After the Great Depression, secular stagnation turned out to be a figment of economists’
imaginations. This chapter argues that it is still too soon to tell if this will also be
the case after the Great Recession. However, the risks of secular stagnation are much
greater in depressed Eurozone economies than in the US, due to less favourable
demographics, lower productivity growth, the burden of fiscal consolidation, and the
ECB’s strict focus on low inflation.
The first time around, ‘secular stagnation’ was a hypothesis famously articulated by
Alvin Hansen in his Presidential Address to the American Economic Association
in Detroit in December 1938 (Hansen 1939). Hansen argued that the US economy
faced a crisis of underinvestment and deficient aggregate demand, since investment
opportunities had significantly diminished in the face of the closing of the frontier for
new waves of immigration and declining population growth. It was as if the US was
faced with a lower natural rate of growth to which the rate of growth of the capital stock
would adjust through a permanently lower rate of investment.
As we all know, these fears were completely without foundation – the delusions of a
hypochondriac rather than the insightful diagnosis of a celebrated economist. Trend
growth in the US regained or even exceeded its pre-Depression rate in the following
decades that were characterised by full employment (Ben-David et al. 2003). The US
economy delivered a rapid rate of TFP growth building on the technological prowess
that it had established prior to the Depression (see Table 1), and this sustained a high

Secular Stagnation: Facts, Causes, and Cures
92
level of investment while population growth revived under the auspices of the ‘baby
boom’. Moreover, the textbook antidote for secular stagnation in a depressed economy
at the zero lower bound for nominal interest rates – namely, to cut real interest rates
dramatically by credibly committing to higher inflation – had already been shown to
work by Roosevelt’s New Deal, which delivered a strong recovery in the years after
1933 (Eggertsson 2008).
Table 1 Contributions to labour productivity growth in US (% per year)
K/HW growth HK/HW growth TFP growth Y/HW growth
1906-19 0.51 0.26 1.12 1.891919-29 0.31 -0.06 2.02 2.271929-41 -0.19 0.14 2.97 2.921941-48 0.24 0.22 2.08 2.541948-73 0.76 0.11 1.88 2.75
Note: Estimates are for private non-farm economy. K/HW = capital per hour worked; HK/HW = human capital per hour worked; Y/HW = real GDP per hour worked.
Source: Derived from Field (2013).
The rediscovery of secular stagnation in the context of a sluggish recovery from the
financial crisis of 2008-9 has similar foundations. Forecasts of US economic growth
over a medium- to long-term horizon have been revised down in recent times as the
growth of labour inputs decreases and questions are raised about the future (post-ICT-
revolution) rate of technological progress (Gordon 2014), with the result that investment
opportunities are curtailed. Models have been devised in which, faced with shocks of
this kind, it would be necessary to find a way to have a lengthy period of negative real
interest rates to avoid a prolonged slump (Eggertsson and Mehotra 2014). Aggressive
use of fiscal stimulus might be appropriate in this scenario.
It must be said that once again, this could well turn out to be hypochondria rather
than far-sighted prediction. Even after downward revisions, mainstream projections for
growth over the next ten years or so in the US cluster around 2.1% per year for GDP and
1.6% per year for labour productivity. This productivity growth rate would basically
be a continuation of the average performance of the last 40 years (Fernald 2014), with

Secular stagnation: US hypochondria, European disease?
93
the main headwind being diminished growth of labour inputs in the face of adverse
demographic trends. The future rate of TFP growth is, of course, quite uncertain and
techno-optimists such as Brynjolfsson and McAfee (2014) imagine a much rosier
future. Be that as it may, it is not obvious why an economy with a steady-state growth
rate of more than 2% per year should have a permanent shortfall in demand or a need
for a permanent negative real rate of interest.
However, the threat of secular stagnation may be much more real for Europe. Although
relatively little attention seems to have been given to this possibility, Europe is surely
much more vulnerable, especially in the Eurozone. There are four obvious reasons for
this, two stemming from economic performance and two from policy responses:
• European demographics are less favourable
• Productivity growth in Europe will underperform whatever US achieves
• Fiscal consolidation in the context of a high public debt ratio will bear relatively
heavily on Europe
• In a depressed economy, the Fed is more likely to take appropriate policy action
than the ECB
Table 2 reports OECD growth projections for 2014-2030. In the context of ageing
populations, Eurozone employment growth is projected at 0.2% per year compared
with 0.5% for the US, and for most European countries the demographics are relatively
unhelpful.
It is clear from Table 2 that pre-crisis productivity growth in Europe generally failed to
match that in the US, as was widely noted at the time. A major reason for this in many
countries was the relatively slow exploitation of the potential of ICT (Oulton 2012).
More generally, productivity growth in European countries was frequently held back by
weak competition, excessive regulation and shortfalls in human capital that particularly
undermined productivity performance in marketed services, where the single market
has been ineffective (Crafts 2013a). Europe relies heavily on the US for new technology

Secular Stagnation: Facts, Causes, and Cures
94
and its track record suggests that this will diffuse more slowly in Europe. As Table 2
reports, the OECD (2014) is hopeful that future European productivity growth will
generally better the dismal pre-crisis outcome, presumably because supply-side policy
will improve. However, this does seem to favour hope over experience, given the
protectionist and anti-market responses that the economic history of the 1930s suggests
are likely to be nurtured by prolonged stagnation.
Table 2 Pre-crisis growth and OECD long-term growth projections (% per year)
Real GDP,
1995-2007
Employment, 1995-2007
GDP/ worker,
1995-2007
Real GDP,
2014-30
Employment, 2014-30
GDP/ worker, 2014-30
Eurozone 2.3 1.3 1.0 1.7 0.2 1.5USA 3.2 1.2 2.0 2.4 0.5 1.9France 2.2 1.1 1.1 2.2 0.3 1.9Germany 1.6 0.4 1.2 1.1 -0.5 1.6UK 3.3 1.0 2.3 2.6 0.6 2.0Greece 3.9 1.3 2.6 2.2 0.2 2.0Ireland 7.2 4.3 2.9 2.3 1.2 1.1Italy 1.5 1.2 0.3 1.5 0.3 1.2Portugal 2.4 1.0 1.4 1.4 0.3 1.1Spain 3.7 3.6 0.1 1.5 0.9 0.6
Sources: 1995-2007: The Conference Board Total Economy Database; 2014-30: OECD (2014, Ch. 4).
In the aftermath of the financial crisis, many European countries have high public
debt-to-GDP ratios and for those in the Eurozone extended periods of severe fiscal
consolidation lie ahead if they are to comply with the fiscal rules agreed in 2012. For
example, the OECD (2013) calculates that for every year from 2014 to 2023, Greece
will have to maintain a primary budget surplus of about 9% of GDP, Italy and Portugal
about 6% of GDP, and Ireland and Spain about 3.5% of GDP. Dealing with the debt
legacy of the crisis in this way will clearly be quite painful and is likely to undermine
growth. If fiscal stimulus is required to combat secular stagnation, these countries are
not well placed. Moreover, it is noticeable that, at high levels of debt, restoring fiscal
sustainability typically entails cuts in both public investment and education spending
(Bacchiocchi et al. 2011). The strong likelihood that post-crisis fiscal consolidation will

Secular stagnation: US hypochondria, European disease?
95
undermine these expenditures does not bode well for the growth prospects of highly
indebted EU countries.
The ECB was designed to be a highly independent central bank mandated to achieve a
low inflation target. It has been reluctant to embrace quantitative easing and relatively
content with a rate of inflation close to zero. By contrast, the Fed has been far more
willing to undertake unconventional monetary policy and has a ‘dual mandate’ that
requires weight to be given to employment as well as inflation. It may be that neither
central bank is well placed to make a credible commitment to raising inflation to deliver
negative real interest rates, but the ECB is surely much the less likely to pursue the
monetary policies that the secular stagnation scenario would demand.
If adequate monetary and fiscal responses to a threat of secular stagnation in Europe
are not forthcoming, then that leaves supply-side reform, which might crowd in private
investment and/or consumer expenditure, as well as increase productivity in the long
run, as the only game in town. Such a strategy was successfully pursued in 1980s Britain
with the relaxation of credit rationing, and the relaxation of land-use planning rules could
play a similar role in Britain now (Crafts 2013b). OECD economists have quantified
the possible effects of structural reforms in European economies on productivity and in
many cases they are quite sizeable, as can be seen in Table 3. Moreover, such reforms
need not be fiscally expensive. Unfortunately, however, in practice this is unlikely to be
a feasible way to address a threat of secular stagnation, partly because the impacts are
slow to come through, but more importantly because they are politically very difficult
to implement effectively.

Secular Stagnation: Facts, Causes, and Cures
96
Table 3 Potential impact on real GDP per person of structural policy reforms (%)
Labour market
TaxationProduct market
regulationEducation
R & D incentives
Total
Moving to OECD averageUSA 0.3 1.4 0.0 2.5 0.0 4.2
France 4.5 10.9 2.2 2.1 1.5 21.2Germany 6.1 9.9 0.0 0.0 0.0 16.0UK 1.1 0.0 0.0 4.6 0.0 5.7
Greece 6.0 10.1 22.0 5.8 0.0 43.9Ireland 6.8 0.9 9.7 0.0 0.0 17.4Italy 0.3 10.8 0.3 5.4 0.2 17.0Portugal 7.3 0.7 8.5 21.8 1.3 39.6Spain 3.5 4.6 0.0 6.3 1.4 15.8
Source: Barnes et al. (2011).
In sum, it is too soon to tell whether secular stagnation is going to materialise in the
OECD economies. But it does seem clear that Europeans should be much more afraid
than Americans. The depressing effects of slower growth of productive potential will
probably be felt more keenly in Europe and economic policies to address such problems
will probably be less effective there than in the US.
References
Bacchiocchi, E, E Borghi A and Missale (2011), “Public Investment under Fiscal
Constraints”, Fiscal Studies 32(1): 11-42.
Barnes, S, R Bouis, P Briard, S Dougherty and M Eris (2011), “The GDP Impact of
Reform: A Simple Simulation Framework”, OECD Economics Department Working
Paper No. 834.
Ben-David, D, R Lumsdaine and D H Papell (2003), “Unit Roots, Postwar Slowdowns
and Long-Run Growth: Evidence from Two Structural Breaks”, Empirical Economics
28(2): 303-319.

Secular stagnation: US hypochondria, European disease?
97
Brynjolfsson, E and A McAfee (2014), The Second Machine Age: Work, Progress and
Prosperity in a Time of Brilliant Technologies, New York: Norton.
Crafts, N (2013a), “Long-Term Growth in Europe: What Difference does the Crisis
Make?”, National Institute Economic Review, 224(1): R14-R28.
Crafts, N (2013b), “Returning to Growth: Policy Lessons from History”, Fiscal Studies
34(2): 255-282.
Eggertsson, G B (2008), “Great Expectations and the End of the Depression”, American
Economic Review 98(4): 1476-1516.
Eggertsson, G B and N R Mehotra (2014), “A Model of Secular Stagnation”, mimeo,
Brown University.
Fernald, J G (2014), “Productivity and Potential Output before, during and after the
Great Recession”, NBER Working Paper No. 20248.
Field, A J (2013), “Economic Growth and Recovery in the United States, 1919-41”, in
N Crafts and P Fearon (eds), The Great Depression of the 1930s: Lessons for Today,
Oxford: Oxford University Press, 358-394.
Gordon, R. J. (2014), “The Demise of U. S. Economic Growth: Restatement, Rebuttal,
and Reflections”, NBER Working Paper No. 19895.
Hansen, A H (1939), “Economic Progress and Declining Population Growth”, American
Economic Review 29(1): 1-15.
OECD (2013), Economic Outlook, Paris: OECD.
OECD (2014), Economic Outlook, Paris: OECD.
Oulton, N (2012), “Long-Term Implications of the ICT Revolution: Applying the
Lessons of Growth Theory and Growth Accounting”, Economic Modeling 29(5): 1722-
1736.


Further on effective demand


101
Aprolongedperiodoflowrealinterest rates?1
OlivierJBlanchard,DavideFurceriandAndreaPescatoriInternational Monetary Fund
From a peak of about 5% in 1986, the world real interest rate fell to about 2% before
the Global Crisis, and to approximately 0% in 2012. This chapter discusses the major
factors behind this decline both before and during the Crisis, and argues that most
of them are still relevant. Indeed, the legacies of the Crisis may imply an even lower
natural rate in future. This would be bad news for monetary policy, but good news for
fiscal policy and debt overhang.
Figure 1 shows the evolution of the world real interest rate over the last 30 years.
More specifically, it shows the evolution of the GDP-weighted average of ten-year real
interest rates on sovereign bonds across 19 advanced economies since 1985. It has two
striking features.
The first is the decline in the rate from a peak of about 5% in 1986 to 2% before the
crisis and to approximately zero in 2012. This evolution has led to the worry that the
rate needed to maintain output at potential may remain very low in the future, perhaps
even negative. Given the combination of the zero lower bound on nominal rates and low
inflation, such a negative real rate might be impossible to achieve, leading to insufficient
demand – a worry known as the ‘secular stagnation’ hypothesis.
1 This chapter is based in part on Chapter 3 of the April 2014 World Economic Outlook. We would like to thank Jorg Decressin and Thomas Helbling and various colleagues at the IMF for very useful discussions and suggestions. We would like also to thank for Sinem Kilic Celik and Katherine Pan for excellent research assistance.

Secular Stagnation: Facts, Causes, and Cures
102
The second is the degree to which real interest rates have increasingly moved together,
as shown by the tight – indeed, increasingly tighter – interquartile range for individual
country real interest rates in the figure. This suggests that one can, and actually must,
think of a global interest rate, determined in a global market. The factors behind
movements in the global real rate are the focus of this chapter.
Figure 1 Short- and long-term global real interest rates (% per year)
0
2
4
6
8
1985 88 91 94 97 2000 03 06 09 12
Interquartile range1 Global
Note: 1 The sample consists of: United States, United Kingdom, Austria, Belgium, France, Germany, Italy, Netherlands, Norway, Sweden, Switzerland, Canada, Japan, Finland, Greece, Portugal, Spain, Australia, New Zealand. Global based on the GDP-weighted average.
Source: IMF (2014).
Determinants of real rates
To organise the discussion, a short (low-brow) theoretical detour may be useful. One
can think of the global real rate as being determined by four factors. The first three
determine the ‘natural’ or ‘Wicksellian’ rate, the real interest rate consistent with output
at potential, and stable inflation. The fourth, monetary policy, results in temporary
deviations from that rate.
The first factor is the supply schedule for loanable funds, namely global saving –
assuming output at potential. Shifts in saving can be induced by many factors, including
changes in current and expected income, changes in uncertainty that affect precautionary
saving, demographic changes, financial innovations, and shifts in public saving.

A prolonged period of low real interest rates?
103
The second factor is the demand schedule for loanable funds, namely global investment
–again assuming output at potential. Shifts in investment can be induced by many
factors as well, from changes in expected investment profitability, to changes in the
relative price of investment goods, to changes in financial intermediation.
The third factor is the relative demand for safe versus risky assets. A shift in investors’
preferences towards safe assets – be it due to increases in risk, to increases in market
risk aversion, or to changes in financial regulation – will lead, other things equal, to a
lower rate on safe assets and a higher rate on risky assets.
The first three factors, plus the conditions that the demand and supply of safe assets
be equal and output be at potential, determine the natural rate of interest. Most of the
time, one can think of the goal of monetary policy as to validate this natural rate so as
to maintain output at potential. But if, for example, a central bank wants to return output
to potential, or to achieve lower inflation, monetary policy will lead to deviations from
the natural rate for some time.
Which of the factors discussed above can explain the observed decline in real interest
rates?
Lookingback,pre-crisis
We believe three of the factors discussed above played a major role: monetary policy
in the 1980s and early 1990s, the large increase in emerging market saving rates in the
2000s, and the higher demand for safe assets in the 2000s.
Monetary policy
It is clear that the evolution of real interest rates in the early part of the sample was
dominated by the disinflation policies engineered first in the US and the UK, and a bit
later in many other advanced countries. While inflation indeed decreased, the result
was also a long period of high real rates, in excess of the underlying natural rates. By

Secular Stagnation: Facts, Causes, and Cures
104
the early 1990s, however, the effects of disinflation on the rates were largely gone.
Empirical estimates suggest that from 1980 to 1992, about 90% of the variance in US
short-term real rates could be explained by monetary policy shocks alone; since then, the
percentage of the variance has been much lower. Hence, if monetary policy can explain
much of the movement in real interest rates until the 1990s, afterwards, the monetary
policy stance of most advanced economies was on average neutral, contributing little to
the determination of long-term real interest rates.
Saving
The saving-to-GDP ratio in emerging market economies increased by more than
10 percentage points after 2000. As a result, the global saving rate increased by 1.7
percentage points between 2000 and 2007. Within the emerging market economies,
China’s saving accounted for an ever-increasing share – approaching half of total
emerging market economies’ saving in 2013.
What accounted for this increase? Surely many factors played a role, but our empirical
work has pointed us to the role of growth. Theory is ambiguous about the effects of
growth on saving: higher individual income growth leads people to save less as they
expect their income to be higher in the future, thus leading to a negative effect of growth
on saving; but higher growth leads to a relatively larger pool of saving by the young
(who have relatively more income than the old), leading to a positive effect. Habit
persistence implies that consumption lags income, and generates a positive relation
between growth and saving. In our econometric work, we have indeed found a strong
positive medium-term relation between growth and saving. To the extent that the
relation can be interpreted as causal from growth to saving, and using our estimated
coefficients, the steady increase in emerging market economy growth in the past decade
can explain a shift in saving rates of about 10 percentage points over that period (IMF
2014).

A prolonged period of low real interest rates?
105
Demand for safe assets
Whether they just reflected the surge in private saving, or were the result of policies
aimed at increasing reserves, foreign exchange reserves increased considerably in
the 2000s, and were invested mainly in government or government-guaranteed fixed-
income liabilities. As a result, foreign holdings of US Treasury securities increased
considerably after 2000, and foreign official holdings in China and other emerging
market economies accounted for the largest part of this increase (IMF 2014). Empirical
evidence suggests that these foreign official purchases of US Treasuries contributed
significantly to the decline in real interest rates in the first decade of the 21st century
(Bernanke et al. 2004, Warnock and Warnock 2009, Beltran et al. 2013).
Investment
Some observers have focused on the role of the decrease in the relative price of
investment goods. We do not believe that this actually played a major role. On theoretical
grounds, there are again two effects of such a decrease. The first is that a given volume
of investment implies a smaller demand for loanable funds, decreasing the interest rate.
But the second is that, as capital is cheaper, the rate of return on investment goes up,
leading to a higher volume. Which of the two effects dominates is ambiguous. On
empirical grounds, the relative price of investment has not declined meaningfully since
the early 2000s.
Lookingback.Thecrisis.
Many factors combined to sharply decrease the natural interest rate during the crisis,
from the collapse of financial intermediation to the increase in uncertainty and its
effects on precautionary saving and on investment. Increasing risk, together with
increasing market risk aversion, decreased the safe rate relative to the rate on risky
assets. Monetary policy played a role, although involuntarily: by most estimates, the

Secular Stagnation: Facts, Causes, and Cures
106
zero lower bound on nominal rates and low inflation prevented the actual rate from
declining as much as the natural rate.
Analysing the role of each factor would go far beyond what we can do in this chapter.
And many of these effects, which dominated the early part of the crisis, have either
disappeared or at least receded. What matters for our purposes is what legacies the
crisis will leave, and for how long. With this, we turn to the future.
Lookingforward
Given the complexity of the issues, the global nature of the determination of the rate,
and the number of potential factors in play, any attempt to forecast the future global rate
must be taken with more than a grain of salt. This being said, we believe that the world
real interest rate is likely to remain low, perhaps even lower than before the crisis. Most
of the factors that led to low rates pre-crisis are still present. And the legacies of the
crisis imply, if anything, a lower natural rate than before the crisis.
Investment
We argued that shifts in investment did not play a major role before the crisis. However,
they are likely to be more relevant looking forward. The evidence from previous
financial crises suggests that the investment-to-GDP ratio typically takes a long time
to recover to pre-crisis levels, if it ever does so. Our econometric estimates, shown
in Figure 2, imply that financial crises lead to a significant and long-lasting decline
in the investment-to-GDP ratio. Financial crises have typically reduced this ratio by
about 1 percentage point in the short term (one year after the occurrence of the crisis),
with a peak effect of 3 to 3.5 percentage points three years after the crisis. So far, the
actual evolution of investment in advanced economies points in the same direction: the
estimated effect matches the 2.5 percentage point decline in the investment-to-GDP
ratio between 2008 and 2013 remarkably well.

A prolonged period of low real interest rates?
107
Figure 2 The effect of financial crises on investment-to-GDP ratios (% of GDP)
-6 -5 -4 -3 -2 -1 0 1
–1 0 1 2 3 4 5 6 7 8 9 10 Actual nominal investment to GDP, 2007–13; index, 2007 = 0 Investment-to-GDP ratio
Note: X-axis denotes years, t=0 year of the financial crisis.
Source: IMF (2014).
Demand for safe assets
A reversal of the portfolio shifts favouring safe assets observed in the 2000s is unlikely.
Indeed, one of the legacies of the crisis is tighter financial regulation, ranging from
higher capital ratios to liquidity ratios. The Basel Committee estimates that the effect
may be an additional demand for safe assets by financial institutions of about $3
trillion (for comparison’s sake, China’s reserves stand at about $4 trillion). Will this
be compensated by a slower pace of reserve accumulation by central banks than in the
early 2000s? This depends partly on developments in the provision of international
liquidity, an issue we discuss below.
Saving
Another legacy of the crisis is higher levels of debt, both public and private, especially
in advanced economies. Other things equal, higher debt requires higher saving in order
to either stabilise the debt or return it to a lower level. This is clearly the case for
public saving where, in most advanced economies and many emerging markets, fiscal
Secular Stagnation: Facts, Causes, and Cures
108
consolidation will remain a priority. But this is also the case for corporate and household
saving. Higher debt leads firms to invest less, and consumers to consume less. Given
low growth in advanced economies, such deleveraging may go on for a long time.
Much of what happens to saving, however, will depend on what happens to saving
in emerging markets. If the relation between saving and growth we have estimated
remains stable, the projected reduction in GDP growth in emerging market economies
would lead to a large medium-term negative shift in emerging market economy saving
rates. Based on our projections and our estimated coefficients, the decrease could reach
3.5% of emerging markets’ GDP.
Other factors, from ageing to financial liberalisation, are obviously important. One
strikes us as particularly relevant, and introduces a major source of uncertainty for our
predictions – namely, the evolution of precautionary saving, which plays a central role
in emerging market saving. This is shown for example in Figure 3, which plots the age
profile of saving in China as of 2005. What is striking is that the profile is the mirror
image of what would be predicted by the life-cycle hypothesis, with high saving very
early in life, and then very late in life. The explanation for the second peak is poor social
insurance against medical and other age-related expenses. Provision of better social
insurance would likely have a large effect on the Chinese saving rate. Precautionary
saving is also highly relevant at the country level. Much of the motivation for the
accumulation of reserves by emerging markets in the past has been self-insurance against
capital flow withdrawals. Better provision of international liquidity, be it through swap
lines or IMF programmes, could also lead emerging markets to decrease their reliance
on self insurance. Again, this could have a major effect on emerging markets saving.
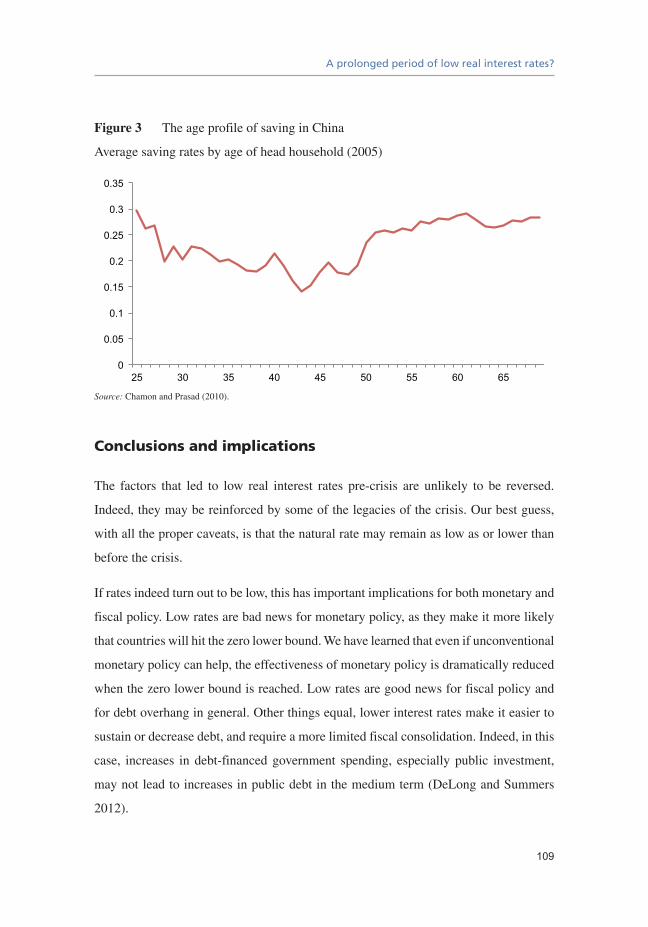
A prolonged period of low real interest rates?
109
Figure 3 The age profile of saving in China
Average saving rates by age of head household (2005)
0
0.05
0.1
0.15
0.2
0.25
0.3
0.35
25 30 35 40 45 50 55 60 65
Source: Chamon and Prasad (2010).
Conclusions and implications
The factors that led to low real interest rates pre-crisis are unlikely to be reversed.
Indeed, they may be reinforced by some of the legacies of the crisis. Our best guess,
with all the proper caveats, is that the natural rate may remain as low as or lower than
before the crisis.
If rates indeed turn out to be low, this has important implications for both monetary and
fiscal policy. Low rates are bad news for monetary policy, as they make it more likely
that countries will hit the zero lower bound. We have learned that even if unconventional
monetary policy can help, the effectiveness of monetary policy is dramatically reduced
when the zero lower bound is reached. Low rates are good news for fiscal policy and
for debt overhang in general. Other things equal, lower interest rates make it easier to
sustain or decrease debt, and require a more limited fiscal consolidation. Indeed, in this
case, increases in debt-financed government spending, especially public investment,
may not lead to increases in public debt in the medium term (DeLong and Summers
2012).

Secular Stagnation: Facts, Causes, and Cures
110
References
Beltran, D O, M Kretchmer, J Marquez and C P Thomas (2013), “Foreign Holdings of
U.S. Treasuries and U.S. Treasury Yields”, Journal of International Money and Finance
32(1): 1120–43.
Bernanke, B S, V R Reinhart and B P Sack (2004), “Monetary Policy Alternatives at
the Zero Bound: An Empirical Assessment”, Finance and Economics Discussion Series
Working Paper No. 48, Federal Reserve Board, Washington, DC.
Chamon, M D and E S Prasad (2010), “Why Are Saving Rates of Urban Households in
China Rising?”, American Economic Journal: Macroeconomics 2(1): 93–130.
DeLong, J B and L H Summers (2012), “Fiscal Policy in a Depressed Economy”,
Brookings Papers on Economic Activity (Spring): 223–97.
International Monetary Fund (IMF) (2014), World Economic Outlook April, 2014,
“Prospective on Global Real Interest Rates,” Research Department paper (Washington).
Warnock, F E and V C Warnock (2009), “International Capital Flows and U.S. Interest
Rates”, Journal of International Money and Finance 28(6): 903–19.

111
On the role of safe asset shortages in secular stagnation
Ricardo J Caballero andEmmanuelFarhiMIT; Harvard University and CEPR
The secular decline in real interest rates over the last two decades indicates a growing
shortage of safe assets – a shortage that became acute during the Global Crisis. Given
the still-depressed levels of real rates and the sluggish investment recovery, this chapter
conjectures that the shortage of safe assets will remain a structural drag on the economy,
undermining financial stability and straining monetary policy during contractions.
Under these conditions, an additional important aspect of public infrastructure
investment is the government’s ability to issue safe debt against such projects.
Introduction
In recent years a confluence of factors – ranging from the rise of international reserve
holdings to institutional mandates, regulation, and demographic factors – has led to a
steady rise in the demand for safe assets. The supply of safe assets has not been able
to keep pace. The unmistakable signature of the growing shortage of safe assets at any
given (safe) real interest rate is the secular downward trend in equilibrium real interest
rates for more than two decades (see Figure 1).

Secular Stagnation: Facts, Causes, and Cures
112
Figure 1 US real interest rates
-4
-3
-2
-1
0
1
2
3
4
5
6
1990
19
92 19
94 19
96 19
98 20
00 20
02 20
04 20
06 20
08 20
10 20
12
Three-Month Real Interest Rate
Ten Year Real Interest Rate
Source: IMF (2014).
The steady rise in the demand for safe assets over this period was behind a wide variety
of macroeconomic phenomena such as the global savings glut, the so-called Greenspan
conundrum of the mid-2000s, and their contemporaneous global imbalances.1 It was
also a powerful macroeconomic force driving the financial engineering required to
create safe asset tranches from subprime mortgages before the Global Crisis (e.g.
Caballero 2009).
What was already a significant phenomenon before the Subprime Crisis turned into an
acute shortage at the onset of the Global Crisis, pushing real interest rates down to new
lows. While it is difficult to pin down a specific definition of safe assets, there have been
several recent attempts to measure the impact of the crisis on the supply of safe assets.
For instance, a 2012 study by Barclays concludes that the world supply of safe assets
collapsed from 37% of world GDP in 2007 to about 18% by 2011. This contraction
was primarily driven by the sudden reassessment of the riskiness of US residential
mortgages and European periphery sovereign debt (see Table 1).2
1 We developed some of these arguments in Caballero et al. (2006, 2008).2 See also IMF (2014).

On the role of safe asset shortages in secular stagnation
113
Table 1 Strong decline of safe assets from 2007 to 2011
USD bn % of world GDP
2007 2011 2007 2011
US Federal government debt held by the public 5,136 10,692 9.2% 15.8% Held by the Federal Reserve 736 1,700 1.3% 2.5% Held by private investors 4,401 8,992 7.9% 13.3%
GSE obligations 2,910 2,023 5.2% 3.0%Agency- and GSE-backed mortgage pools 4,464 6,283 8.0% 9.3%Private-issue ABS 3,901 1,277 7.0% 1.9%
German and French government debt 2,492 3,270 4.5% 4.8%Italian and Spanish government debt 2,380 3,143 4.3% 4.7%
Safe assets 20,548 12,262 36.9% 18.1%
Note: Numbers are struck through as they are believed to have lost their ‘safe-haven’ status after 2007
Source: 2012 Barclays Equity Gilt Study.
As the economy recovered, the safe asset shortage and some of its consequences
abated. However, it is our conjecture, partly based on the still depressed levels of
real interest rates among the major economies and the sluggish investment recovery,
that this shortage remains a latent factor that could re-emerge in full force during the
next severe downturn. It is in this sense that our discussion connects to the ‘secular
stagnation’ theme of this eBook.
There is a benign view of safe asset shortages. Increases in the demand for safe assets
and decreases in the supply of safe assets push down the natural real interest rate.
This virtuous mechanism equilibrates the safe asset market as long as central banks
accommodate this decline in natural real interest rates by lowering nominal interest
rates. But this adjustment breaks down when nominal interest rates hit the zero lower
bound. At this tipping point, perverse mechanisms swing into action, resulting in
economic recessions.

Secular Stagnation: Facts, Causes, and Cures
114
Safetytraps
In a recent paper (Caballero and Farhi 2014), we take the view that a safe asset is one
that is expected to preserve its economic value following bad macroeconomic shocks.
We provide a simple model to illustrate how a chronic shortage of safe assets can push
the economy up against the zero lower bound and weaken the effectiveness of some of
the standard market mechanisms and policy responses that could stimulate a depressed
economy. We refer to this situation as a ‘safety trap’, to emphasise both its similarity
and its difference with conventional liquidity trap analyses.
Both safety and liquidity traps involve severe asset shortages, zero nominal interest
rates, wealth destruction, deficits in aggregate demand, and recessions. But the
distinguishing feature of safety traps is that they are shortages of a particular kind of
assets: safe assets.
This distinction is important because the corresponding financial bottleneck is harder
to fix. It is extremely difficult for the corporate and financial sector of a shell-shocked
economy to produce such assets. Moreover, as we will discuss below, policies aimed at
stimulating aggregate demand by boosting generic wealth, such as forward guidance,
have less traction than in conventional liquidity traps. By the same token, potential
market mediated solutions, such as the emergence of speculative bubbles, are also less
effective.
Safepublicdebtandunconventionalmonetarypolicy
Safe public debt (and ‘helicopter’ money) plays a central role in a safe asset shortage
episode, as typically the government owns a disproportionate share of the capacity to
create safe assets. As long as the economy is at the zero lower bound, public debt can be
increased at no fiscal cost. However, taxes are eventually needed to pay down the debt
On the role of safe asset shortages in secular stagnation
115
when interest rates become positive again.3 One way or another, safe assets created by
the government are backed by taxes. These taxes might crowd out private safe assets – a
Ricardian equivalence of sorts – but this full offset is unlikely to occur in the aftermath
of a financial crisis when the securitisation capacities of the economy (understood to be
the physical, institutional, legal, and reputational resources that are required to isolate
safe financial assets from risky real assets) have been impaired.4
The key concept then is that of fiscal capacity during future times of distress. How
much public debt can the government credibly commit to honouring should a major
macroeconomic shock take place in the future? As long as the government has the spare
fiscal capacity (in this extreme event sense) to back safe asset production, it can increase
the supply of safe assets by issuing public debt. This reduces the root imbalance in
financial markets and stimulates the economy.
The proceeds of the extra public debt issuance can be rebated to consumers. An
attractive alternative is for the government (through the treasury or the central bank)
to buy risky assets, which, for a given fiscal capacity, allows the government to issue
more safe public debt. QE1 in the US, LTRO and TLRTO in Europe, as well as many
other lender-of-last-resort central bank interventions, can be broadly characterised as
swapping private risky assets for safe public debt. These unconventional monetary
policies alleviate the shortage of safe assets and stimulate the economy.
Another popular unconventional monetary policy tool at the zero lower bound is forward
guidance, which is most commonly understood as a commitment to low interest rates
in the future when the economy has recovered.5 It turns out that forward guidance is
of limited effectiveness during safety traps. While low interest rates do increase asset
values, wealth, and hence aggregate demand and output once the economy recovers,
3 The same argument applies for helicopter money. The government needs to raise taxes to buy back part of the money stock when nominal interest rates become positive in order to stabilise the economy.
4 In fact, an intriguing post-crisis development is that the money multiplier M2/M0 has declined substantially. Part of this decline is probably due to increased banking regulation and capital requirements, raising the possibility that the post-crisis equilibrium will require a higher amount of M0 (Chatterjee and Wynne 2014).
5 An alternative strategy at the zero lower bound is ‘unconventional fiscal policy’, which uses time-varying taxes to reduce real interest rates (Correia et al. 2013).

Secular Stagnation: Facts, Causes, and Cures
116
the anticipation of a potential upward effect of low future interest rates on asset values
has no effect on asset prices today, and therefore fails to increase the value of risky
assets, wealth, aggregate demand and output in a safety trap, simply because it does not
increase the value of safe assets. The reason stems from our working definition of a safe
asset as an asset that preserves its value during future distress, not just during a potential
recovery. Any future increase in the value of risky assets in a state of recovery that is
not accompanied by an equivalent increase in a state of distress is mostly dissipated in
a rise in risk premia.6
In practice, the dividing line between safe and risky assets is of course not as stark. As
a result, forward guidance always increases the value of some assets and provides some
stimulus. During the most severe phase of a crisis, the safe category is reduced to the
absolute safest assets. All excluded assets decrease in value, and forward guidance is
least effective. Asset values recover as the flight to safety eases, and forward guidance
regains some kick.7
Bubbles
Low interest rate environments are known to be prone to speculative episodes and the
emergence of financial bubbles. In a conventional liquidity trap environment, financial
bubbles increase wealth and asset values, alleviate the shortage of assets, and stimulate
the economy. Financial bubbles that are large enough can even increase the natural
interest rate above zero and altogether eliminate the liquidity trap. But the stimulus is
6 In a liquidity trap, forward guidance stimulates aggregate demand through the combination of a wealth effect and a substitution effect via inflation and lower real interest rates (e.g. Krugman 1998, Eggertsson and Woodford 2003, Werning 2012). The strength of the substitution effect increases with the slope of the Phillips curve – which lately appears to be very flat – and hence with the flexibility of prices or wages. At the limit where inflation is independent of the output gap (when prices or wages are entirely rigid), the substitution effect disappears and only the wealth effect remains. Comparing a safety trap to a liquidity trap, we have argued in the main text that the wealth effect is muted. For this reason and because of the reduced incentive for forward-looking agents to increase their prices or wages in anticipation of higher output when the economy recovers (because these states are more heavily discounted), the substitution effect is also weakened.
7 Following this logic, one can account for the rise in risky financial assets (equity, in particular) during the US recovery from the crisis. Importantly, Hall (2014) argues that risk premia applicable to capital formation have remained high, contributing to the sluggish recovery.

On the role of safe asset shortages in secular stagnation
117
temporary: the economy returns to the zero lower bound as soon as the bubble bursts,
echoing some arguments in Summers’ (2013) rekindling of the ‘secular stagnation’
concept. A financial bubble can therefore arise as an imperfect market solution to a
shortage of financial assets. The solution is no panacea because it is temporary and
comes with risks to financial stability.8
The cost-benefit ratio of financial bubbles worsens in safety traps, as the expansionary
effects of financial bubbles are weakened. Because bubbles are risky, they do little to
increase the supply of safe assets and, hence, to alleviate the shortage of safe assets
that plagues the economy. They mostly end up crowding out other private risky assets,
leaving wealth, demand, and output largely unchanged.
The mechanism
To gain a better understanding of the basic mechanics of safety traps, it is useful to
think about an economy with two types of agents: neutrals and Knightians. Neutrals
are risk-neutral; Knightians are infinitely risk-averse. Real assets come in the form of
Lucas trees, which are claims to a risky dividend that can increase or decrease with
some probability. The securitisation capacity of the economy determines the fraction
of these real assets that can be securitised into risky and safe financial assets (financial
assets that stay constant in value when the economy is hit by a shock). In equilibrium,
Knightians hold the safe assets, while neutrals hold the risky assets.
8 In Caballero et al. (2006), we outline how ‘speculative growth’ paths that look like temporary bubbles associated with investment booms could arise endogenously and take the economy to a different equilibrium with a higher capital stock and higher output. Along these paths, potential output increases but natural interest rates decrease, which could eventually trigger liquidity-trap- and safety-trap-like mechanisms and result in output below its increased potential level.

Secular Stagnation: Facts, Causes, and Cures
118
Figure 2 Supply and demand for safe assets as a function of the real interest rate
0
Demand Supply
E E’
r
Notes: The initial equilibrium is at point E. The dashed lines illustrate how an exogenous reduction in the supply of safe assets pushes the economy against the zero lower bound. Equilibrium is restored at point E’ by an endogenous reduction in the demand for safe assets associated with a recession.
Figure 2 represents equilibrium in the safe asset market. The demand for safe assets
(Knightian wealth) increases with the real interest rate because a high real interest rate
increases the growth rate of safe wealth. Higher precautionary savings, mandates and
regulation forcing higher holding of safe assets, and increased demand for reserves
from emerging markets would shift this curve to the right. For simplicity, the supply
of safe assets is assumed to be independent of the real interest rate (this is not essential
to the argument). Heightened perceptions of macroeconomic risk, impairments to the
securitisation capacity of the economy, and tighter regulation restricting the private
creation of safe assets would shift this curve to the left. The initial equilibrium is at
point E with a positive real interest rate.
Now consider a decrease in the supply of safe assets (the argument is similar for an
increase in the demand for safe assets), captured by an exogenous leftward shift in
the supply curve. Equilibrium in the safe asset market is restored by a reduction in
real interest rates. With strong price or wage rigidities, this adjustment can only occur
through a reduction in nominal interest rates.9 When nominal interest rates reach
the zero lower bound, further reductions cannot take place. At zero nominal interest
9 This remains true if prices or wages are sticky but not entirely rigid as long as the central bank adheres to a constant inflation target.

On the role of safe asset shortages in secular stagnation
119
rates, there is excess demand for safe assets and excess supply of goods (insufficient
aggregate demand). Because of the deficit in aggregate demand, output and income
decrease, further reducing aggregate demand, and so on, generating a recession. The
recession lowers Knightian wealth at any given real interest rate, endogenously shifting
the demand curve for safe assets to the left. Equilibrium in the safe asset market is
restored when the reduction in Knightian wealth matches the initial reduction in the
supply of safe assets at point E’.10 In parallel, risk premia adjust to clear the market for
risky assets at a lower level of neutral wealth and a lower value of risky assets. This
perverse equilibrating mechanism is the essence of a safety trap.
In this simple model, when the economy falls into a safety trap, output is entirely
determined by equilibrium in the safe asset market. Output can only be stimulated
by reducing the demand for safe assets or by increasing their supply. This is exactly
what issuing safe public debt or swapping private risky assets for safe public debt
accomplishes. By contrast, forward guidance and financial bubbles have no effect on
the supply of or demand for safe assets. Hence they have no effect on output, and
even no effect on the value of neutral wealth or the value of risky assets. Instead, they
move risk premia. Obviously, these stark results are unlikely to hold in such extreme
form in practice. But they provide a sharp illustration of some important limits to the
effectiveness of the corresponding mechanisms.
Implications for the supply side of the economy and for financialmarketincentives
In the core of this chapter, we focused on the aggregate demand-side problem caused by
a chronic shortage of safe assets, but surely there are important supply-side implications
of this deficit as well.
10 To the extent that prices and wages are sticky but not entirely rigid, inflation might decline, increasing real interest rates, requiring a further endogenous decline in the demand for safe assets, and creating a deeper recession. This logic applies as long as the central bank is unwilling or unable to increase its inflation target above the opposite of the (negative) natural real interest rate – a solution that, if feasible, would altogether eliminate the safety trap but would come with its own side-effects and limitations.

Secular Stagnation: Facts, Causes, and Cures
120
On one hand, safe asset shortages shape corporations’ capital costs and create incentives
to cut back on risky investment and to either accumulate cash, return money to investors
through equity buybacks and dividend payments, or substitute towards safer or easier-
to-securitise forms of investment, sacrificing output for safe asset production.
On the other hand, safe asset shortages also create strong incentives for the financial
system to engage in subprime-like forms of financial engineering, which can be thought
as the process of extracting a ‘safe’ tranche from inherently risky loans backed by
systemically exposed real estate collateral. And as the recent crisis demonstrated, this
process can go to extremes, leading to waves of ‘fake’ safe asset creation, followed by
sudden and violent episodes of collective realisation of their actual riskiness.
Conclusion
Absent major financial innovations or changes in economic agents’ and institutions’
preferences and mandates, the shortage of safe assets is likely to worsen over time,
perhaps as a latent factor during booms only to re-emerge in full force during
contractions. It is our conjecture that the shortage of safe assets will remain a structural
drag, pushing down real interest rates, putting pressure on the financial system, and
straining monetary policy during contractions.
Absent these changes, there is a significant need for policy intervention. Other chapters
in this eBook will surely address the potential role of public infrastructure investment.
From our point of view, an additional important aspect of such policy is the government’s
ability to issue safe debt against such projects.11
11 In this sense one could imagine a situation where the real investment could in part be undertaken by the private sector, catalysed by public support in the creation of the debt associated to such investment. See Caballero and Kurlat (2009) for a proposal of public private partnerships in financial asset creation.

On the role of safe asset shortages in secular stagnation
121
References
Caballero, R (2009), “The Other Imbalance and the Financial Crisis”, Paolo Baffi
Lecture, Bank of Italy.
Caballero, R J and E Farhi (2014), “The Safety Trap,” NBER Working Paper No. 19927.
Caballero, R J, E Farhi and M L Hammour (2006), “Speculative Growth: Hints from the
U.S. Economy”, American Economic Review 96(4): 1159-1192.
Caballero, R J, E Farhi and P-O Gourinchas (2008), “An Equilibrium Model of Global
Imbalances and Low Interest Rates”, American Economic Review 98(1): 358-393.
Caballero, R J and P Kurlat (2009), “The Surprising Nature and Origin of Financial
Crises: a Macroeconomic Policy Proposal”, in Financial Stability and Macroeconomic
Policy, Kansas City, MO: Federal Reserve Bank of Kansas City.
Chaterjee, A and J Wynne (2014), “Banking regulation and seigniorage: Asset
implications of shrinking banks”, Barclays, June 2014.
Correia, I, E Farhi, J-P Nicolini and P Teles (2013), “Unconventional Fiscal Policy at
the Zero Bound”, American Economic Review 104(4): 1172-1211.
Eggertsson, G B and M Woodford (2003), “The Zero Bound on Interest Rates and
Optimal Monetary Policy”, Brookings Papers on Economic Activity 34(1):139-211.
Hall, R E (2014), “Quantifying the Lasting Harm to the U.S. Economy from the
Financial Crisis”, NBER Macroeconomics Annual, forthcoming.
Krugman, P R (1998), “It’s Baaack: Japan’s Slump and the Return of the Liquidity
Trap”, Brookings Papers on Economic Activity 29(2): 137-206.
IMF (2014), World Economic Outlook, Washington, DC: International Monetary Fund,
April.

Secular Stagnation: Facts, Causes, and Cures
122
Summers, L H (2013), Speech at the IMF Fourteenth Annual Economic Conference,
Washington, DC, 8 November.
Werning, I (2012), “Managing a Liquidity Trap: Monetary and Fiscal Policy”, mimeo,
MIT.

123
A model of secular stagnation
Gauti B. Eggertsson andNeilMehrotraBrown University
Japan’s two-decade-long malaise and the Great Recession have renewed interest in
the secular stagnation hypothesis, but until recently this theory has not been explicitly
formalised. This chapter explains the core logic of a new model that does just that. In
the model, an increase in inequality, a slowdown in population growth, and a tightening
of borrowing limits all reduce the equilibrium real interest rate. Unlike in other recent
models, a period of deleveraging puts even more downward pressure on the real interest
rate so that it becomes permanently negative.
During the closing phase of the Great Depression in 1938, the President of the American
Economic Association, Alvin Hansen, delivered a disturbing message in his Presidential
Address to the Association (Hansen 1939). He suggested that the Great Depression
might be the start of a new era of ongoing unemployment and economic stagnation
without any natural force pushing the economy towards full employment. This idea was
termed the ‘secular stagnation’ hypothesis. One of the main driving forces of secular
stagnation, according to Hansen, was a decline in the birth rate and an oversupply of
savings that was suppressing aggregate demand. Hansen’s fears of secular stagnation
turned out to be unwarranted. World War II led to a massive increase in government
spending, ending any concern of insufficient demand. And the subsequent baby boom
drastically changed the population dynamics in the US, erasing the problem of excess
savings driven by an ageing population.
Secular Stagnation: Facts, Causes, and Cures
124
The return of the secular stagnation hypothesis
Recently, Hansen’s secular stagnation hypothesis has gained renewed attention. One
obvious motivation is the Japanese malaise that has by now lasted two decades and
shares many of the same symptoms as the Great Depression in the US – namely,
decreasing population growth, a nominal interest rate stuck at zero, and subpar GDP
growth. Another reason for renewed interest is that, even if the financial panic of 2008
was contained, growth remains weak in the US and employment growth remains
sluggish. Most prominently, Lawrence Summers raised the prospect that the crisis of
2008 may have ushered in the beginning of secular stagnation in the US in much the
same way as suggested by Alvin Hansen in 1938. In the words of Summers, we may
have found ourselves in a situation in which the natural rate of interest – the short-term
real interest rate consistent with full employment – is permanently negative (Summers
(2013).
Lack of a formal model
Despite the prominence of Summers’ discussion of the secular stagnation hypothesis
and the flurry of commentary that followed it, there has not been an attempt to formally
model this idea – to write down an explicit model in which unemployment is high for
an indefinite amount of time due to a permanent drop in the natural rate of interest. Our
recent work (Eggertsson and Mehrotra 2014, on which this chapter is based) seeks to
fill this gap. It may seem somewhat surprising that the idea of secular stagnation has
not already been studied in detail in the recent literature on the liquidity trap, which
concerns itself with policy options once the central bank cannot lower the nominal
interest rate beyond zero. This literature already invites the possibility that the zero
bound on the nominal interest rate is binding for some period of time due to a drop in
the natural rate of interest.
However, secular stagnation does not emerge naturally from the current vintage
of models in use in the literature. Most analyses of zero lower bound episodes take

A model of secular stagnation
125
place within models with a representative agent (e.g. Krugman 1998, Eggertsson and
Woodford 2003). In these models, the long-run real interest rate is directly determined
by the discount factor of the representative agent, which is fixed. The natural rate of
interest can then only temporarily deviate from this fixed state of affairs due to preference
shocks or some similar alternatives. And changing the discount rate permanently
(or assuming a permanent preference shock) is of no help either, since this leads the
intertemporal budget constraint of the representative household to ‘blow up’ and the
maximisation problem of the household to no longer be well defined. Moreover, even
in models with some heterogeneity in borrowing and lending, it remains the case in
most of those settings that a representative saver’s discount factor pins down a positive
steady-state interest rate. But, as our paper shows, moving away from a representative
savers framework to one in which households transition from borrowing to saving over
their lifecycle will have a major effect on the steady-state interest rate and can open up
the possibility of secular stagnation.
The logic of a secular stagnation model
In our work, we consider a simple overlapping generation (OLG) model (in the spirit of
Samuelson 1958) where households go through three stages of life: young, middle aged
and old. Income is largely concentrated within the middle generation. This gives rise to
demand for borrowing by the young, and gives the middle aged an incentive to save part
of their endowment for old age by lending it to the young. We assume that borrowing by
the young is constrained by an exogenous debt limit. In this environment, we show that
the steady-state real interest rate is no longer determined solely by households’ discount
factor. Instead, it depends on the relative supply of savings and demand for loans, and
the equilibrium real interest rate may easily be permanently negative. Forces that work
in this direction include a slowdown in population growth, which increases the relative
supply of savings, along with a tighter debt limit, which directly reduces demand
for loans. An increase in income inequality, either across or within generations, may
also generate a negative real interest rate. Interestingly enough, all three factors – an

Secular Stagnation: Facts, Causes, and Cures
126
increase in inequality, a slowdown in population growth, and a tightening of borrowing
limits – have been at work in several economies that have experienced low interest
rates and subpar growth in recent years. We also show that a fall in the relative price of
investment works in the same direction.
Permanentdeleveragingwhenthereisnorepresentativesaver
One interesting result emerges when we consider a debt deleveraging shock of the kind
common in the literature (e.g. Eggertsson and Krugman 2012 for a theoretical analysis).
In that work, a deleveraging shock leads to a temporary reduction in the real interest
rate as debtors pay down their debt. If prices are fully flexible, then this reduction in
the real interest rate leads savers to increase their spending, fully compensating for the
lower spending by borrowers. (This effect is complicated when prices are not fully
flexible by a zero lower bound in nominal rates). Once the deleveraging process is
complete (debt is back to a new debt limit), the economy returns to a steady state with
a positive interest rate. In our model of secular stagnation, however, no such return to
normal occurs. Instead, a period of deleveraging puts even more downward pressure
on the real interest rate so that it becomes permanently negative. The key here is that
households shift from borrowing to saving over their lifecycle. If a borrower takes on
less debt today (due to the deleveraging shock), then tomorrow he has greater savings
capacity since he has less debt to repay. This implies that deleveraging – rather than
facilitating the transition to a new steady state with a positive interest rate – will instead
reduce the real rate even further by increasing the supply of savings in the future.
Thinking about prices
Consider now how inflation behaves when the zero bound on the nominal rate is taken
into account. A key result that emerges is that, under flexible prices, the zero bound
on the nominal interest rate implies the existence of a lower bound on steady state

A model of secular stagnation
127
inflation, which can be no lower than the negative of the natural rate of interest. Thus,
for example, if the natural rate of interest is -4%, then there is no equilibrium that is
consistent with inflation below 4% in steady state. The secular stagnation hypothesis
implies that long-run price stability is impossible when prices are flexible. We show
that this has profound implications for an economy with realistic pricing frictions. If
a central bank can force inflation below this ‘natural’ lower bound, it does so at the
expense of generating a permanent recession.
To formalise a permanent recession explicitly, we assume in our model that wages are
downwardly rigid (this particular theory of downward nominal rigidity is not central to
our result, and other alternatives are very well possible). In this economy, we show that if
the central bank is unwilling to tolerate high enough inflation, output falls permanently
below the full-employment level. In line with the literature that emphasises deleveraging
shocks that have short-term effects, we find that, in this economy, a long slump is one
in which usual economic rules are stood on their head. The old Keynesian paradox of
thrift is in full force, as well as the more recent ‘paradox of toil’ (Eggertsson 2010),
where an increase in potential output decreases actual output, as well as the proposition
that increasing wage flexibility only worsens the shortfall in output (Eggertsson and
Krugman 2012).
Monetaryandfiscalpolicy
Secular stagnation leaves important roles for both monetary and fiscal policy. We find
that a high enough inflation target can – if credible – always do away with the slump
altogether as it accommodates a negative natural interest rate. Importantly, however, an
inflation target that is below what is required has no effect in this context. This result
formalises what Krugman (2014) has referred to as the ‘timidity trap’ – an inflation
target that is too low will have no effect in an economy experiencing secular stagnation.
We show this trap explicitly in the context of our model, which only arises if the shock
is permanent. Similarly, we illustrate that, in a secular stagnation environment, there are

Secular Stagnation: Facts, Causes, and Cures
128
strong limitations of forward guidance with nominal interest rates. Forward guidance
relies on manipulating expectations after the zero lower bound shock has subsided; as
the shock in our model is permanent, manipulating these types of expectations is of more
limited value. Moving to fiscal policy, we show that either an increase in government
spending or a redistribution of income from savers to borrowers can eliminate the output
gap, although this latter result depends on the details of the distribution of income.
Takeaway
The main takeaway from our analysis is not a prediction that the world as we see it
today will remain mired in a recession forever. Instead, the purpose is to establish
conditions under which a permanent recession can take hold, or more to the point,
provide a formalisation of the secular stagnation hypothesis. An important conclusion
from our analysis is not just that a permanent recession is possible, but instead that a
liquidity trap can be of arbitrary duration and last as long as the particular shocks that
give rise to it (such as a deleveraging shock and/or a rise in inequality and/or population
growth slowdown). This is particularly relevant when considering the Great Depression
in the US (where the short-term interest rate started to drop in 1929, only to finally start
rising again in 1947) or current-day Japan (where interest rates started falling in 1994
and remain at zero). It highlights that a passive attitude towards a recession of the kind
experienced by the world today is not appropriate. Our model of secular stagnation
instead provides, in our view, a strong case for aggressive policy interventions that are
aimed at increasing aggregate demand.
References
Eggertsson, G B (2010), “The Paradox of Toil”, Staff Report, Federal Reserve Bank of
New York.
Eggertsson, G B and M Woodford (2003), “The Zero Bound on Interest Rates and
Optimal Monetary Policy”, Brookings Papers on Economic Activity 34(1): 139–234.

A model of secular stagnation
129
Eggertsson, G B and P Krugman (2012), “Debt, Deleveraging, and the Liquidity: A
Fisher-Minsky-Koo Approach”, The Quarterly Journal of Economics 127(3): 1469–
1513.
Hansen, A (1939), “Economic Progress and Declining Population Growth”, American
Economic Review 29(1): 1–15.
Krugman, P R (2013), “Secular Stagnation, Coalmines, Bubbles, and Larry Summers”,
The New York Times blog, 16 November.
Krugman, P R (2014), “The Timidity Trap”, The New York Times, 20 March.
Samuelson, P A (1958), “An Exact Consumption-Loan Model of Interest With or
Without the Social Contrivance of Money”, Journal of Political Economy 66(6): 467–
482.
Summers, Lawrence (2013), “Why Stagnation Might Prove to be the New Normal”,
Financial Times, 15 December.


131
Balance sheet recession is the reason for secular stagnation
Richard C KooNomura Research Institute
The Great Recession is often compared to Japan’s stagnation since 1990 and the Great
Depression of the 1930s. This chapter argues that the key feature of these episodes is
the bursting of a debt-financed asset bubble, and that such ‘balance sheet recessions’
take a long time to recover from. There is no need to suffer secular stagnation if the
government offsets private sector deleveraging with fiscal stimulus. However, until the
general public understands the fallacy of composition, democracies will struggle to
implement such policies during balance sheet recessions.
With the developed economies failing to regain forward momentum after six years
of zero interest rates, people are beginning to worry that they may be facing secular
stagnation. Although this is an understandable reaction, a large part of the stagnation
may be due to the balance sheet recession that these economies are all facing after the
bursting of their debt-financed asset price bubbles. And this type of recession takes a
long time to overcome, for both economic and political reasons.
The mechanics of balance sheet recession
On the economic front, when a debt-financed bubble bursts, a large number of
businesses and households realise that the liabilities they incurred during the bubble
days are still on their books, while the assets they bought with borrowed funds have
collapsed in value, leaving their balance sheets deep underwater. In order to climb out
of their negative equity territory, they have no choice but to pay down debt with their

Secular Stagnation: Facts, Causes, and Cures
132
cash flow as quickly and quietly as possible. In other words, they are minimising debt
instead of maximising profits.
Although this is the right thing to do for individual businesses and households,
when everybody does it at the same time the economy falls into a massive fallacy of
composition problems. This is because in a national economy, if someone is saving
money or paying down debt, someone else must be borrowing and spending the same
amount for the economy to move forward.
In the usual economy that task is borne by the financial sector, which has the incentive
to lend or invest all the funds entrusted to it in order to maximise profits. And the usual
mechanism to make sure that all saved funds are borrowed and spent is the interest rate;
when there are too many borrowers, interest rates are raised and when there are too,
few rates are lowered.
But after the bursting of a nationwide asset price bubble, those with balance sheets
under water are not interested in increasing borrowing at any interest rate. There will
not be many lenders either, especially when the lenders themselves have balance sheet
problems. The lack of borrowers means a significant portion of the newly saved and
deleveraged funds that are entrusted to the financial sector are unable to re-enter the
real economy. This in turn means that those unborrowed savings become a leakage
in the income stream and a deflationary gap for the economy. If left unattended, this
deflationary gap will push the economy ever deeper into balance sheet recession, a
highly unusual recession that happens only after the bursting of a nationwide asset price
bubble.

Balance sheet recession is the reason for secular stagnation
133
Figure 1 The US, UK, South Korean & Australian private sectors are deleveraging
after the bubble1,2
Korea:US: UK:
Australia:
-15
-10
-5
0
5
10
15
03 04 05 06 07 08 09 10 11 12 13 14
UK US Australia South Korea
Balance sheet recession
(as a ratio to nominal GDP, %)
(Financial surplus)
(Financial deficit)
Bubble
2014 1Q private sector
savings
4.80% 3.92% 1.68% -1.09%
Notes: 1. Private Sector = Household Sector + Non-Financial Corporate Sector + Financial Sector. 2. All entries are four-quarter moving averages. For the latest figures, four-quarter averages ending in 1Q/’14 are used.
Sources: Office for National Statistics, UK, FRB, Australian Bureau of Statistics and Bank of Korea.
The flow of funds data for the developed countries that experienced housing bubbles
until 2008 indicate that, except for Australia, their private sectors are all in financial
surplus, i.e. they are either saving money or paying down debt (Figures 1 and 2). The
fact that they are saving money or paying down debt instead of borrowing at zero
interest rates means the private sectors of all of these countries are facing severe balance
sheet challenges. The same pattern is observed in the private sectors in Japan after the
bursting of its massive real estate and equity bubbles in 1990 and in Germany after the
bursting of its telecom bubble in 2000 (Figure 3).
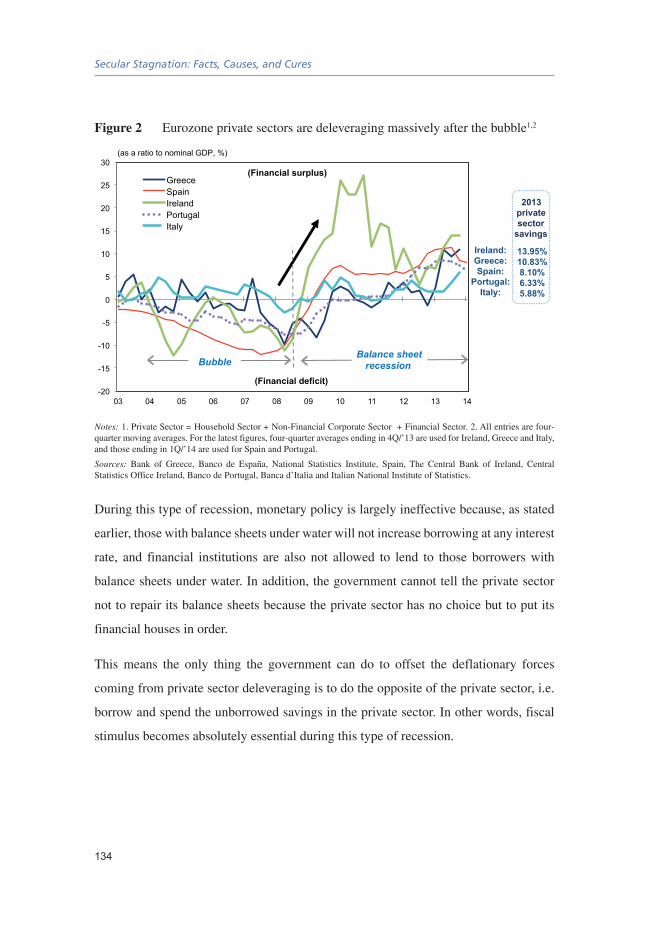
Secular Stagnation: Facts, Causes, and Cures
134
Figure 2 Eurozone private sectors are deleveraging massively after the bubble1,2
Ireland: Greece:Spain:
Portugal: Italy:
-20
-15
-10
-5
0
5
10
15
20
25
30
03 04 05 06 07 08 09 10 11 12 13 14
Greece Spain Ireland Portugal Italy
Balance sheet recession
(as a ratio to nominal GDP, %)
(Financial surplus)
(Financial deficit)
Bubble
2013 private sector
savings
13.95% 10.83% 8.10% 6.33% 5.88%
Notes: 1. Private Sector = Household Sector + Non-Financial Corporate Sector + Financial Sector. 2. All entries are four-quarter moving averages. For the latest figures, four-quarter averages ending in 4Q/’13 are used for Ireland, Greece and Italy, and those ending in 1Q/’14 are used for Spain and Portugal.
Sources: Bank of Greece, Banco de España, National Statistics Institute, Spain, The Central Bank of Ireland, Central Statistics Office Ireland, Banco de Portugal, Banca d’Italia and Italian National Institute of Statistics.
During this type of recession, monetary policy is largely ineffective because, as stated
earlier, those with balance sheets under water will not increase borrowing at any interest
rate, and financial institutions are also not allowed to lend to those borrowers with
balance sheets under water. In addition, the government cannot tell the private sector
not to repair its balance sheets because the private sector has no choice but to put its
financial houses in order.
This means the only thing the government can do to offset the deflationary forces
coming from private sector deleveraging is to do the opposite of the private sector, i.e.
borrow and spend the unborrowed savings in the private sector. In other words, fiscal
stimulus becomes absolutely essential during this type of recession.

Balance sheet recession is the reason for secular stagnation
135
Figure 3 The Japanese and German private sectors also deleveraged after their
bubbles1,2
-5
0
5
10
15
88 89 90 91 92 93 94 95 96 97 98 99 00 01 02 03 04
Japan
Germany
Balance sheet recession
(as a ratio to nominal GDP, %)
(Financial surplus)
(Financial deficit)
Bubble
98 99 00 01 02 03 04 05 06 07 08 09 10 11 12 13 14
Japan
Germany
Notes: 1. Private Sector = Household Sector + Non-Financial Corporate Sector + Financial Sector. 2. All entries are four-quarter moving averages. The latest figure for Germany is four-quarter moving average ending in 4Q/’13.
Sources: Bank of Japan, Cabinet Office, Japan, Bundesbank and Eurostat.
If the government promptly borrowed and spent the unborrowed savings in the private
sector, there would be no leakage in the income stream and the GDP level will be
maintained. If the GDP level is maintained, the private sector will have the income to
pay down debt. Since asset prices will not fall below zero, as long as the private sector
has the income to pay down debt, the balance sheet problem will eventually be resolved.
This also means the government must sustain the fiscal stimulus for years until the
private sector has finished repairing its balance sheets and has become ready to borrow
again. Any premature withdrawal of fiscal stimulus would unleash the deflationary
forces, as unborrowed savings are allowed to become a leakage in the economy’s
income stream. Indeed, the US in 1937, Japan in 1997 and the UK and Eurozone in
2010 all experienced serious double-dip recessions when their governments pursued
fiscal consolidation while their private sectors were still in the process of repairing
balance sheets.

Secular Stagnation: Facts, Causes, and Cures
136
The forward momentum of economies during this period is necessarily weak because
a large part of corporate cash flow is directed towards paying down debt instead of
towards research and new product development. Even if corporate research departments
are coming up with new ideas and products, their management may be unable to put
them into production because of the need to first repair their balance sheets. Many
Japanese companies lost their lead to foreign competitors during the last 20 years due
to this reason.
Many households will also be rebuilding the savings they thought they had prior to the
bubble bursting. That means they will be cutting down on purchases of all kinds, but
especially those on credit. The fact that the household sectors of virtually all developed
countries have become huge net savers after 2008, in spite of record low interest rates,
made even those businesses with clean balance sheets extremely cautious to invest in
new capacity.
Recoveryfrombalancesheetrecessiontakestime
When the economy is confronting a fallacy of composition problem affecting a large
part of society, the burden cannot be easily shifted to another group. If the government
decides to waive all debt for insolvent businesses and households, for example, the
problem merely shifts to the entities that lent them the money, i.e. banks and depositors.
This means the only option is to wait for the whole of society to get better, a process
that takes time.
In a balance sheet recession, the affected businesses and households must use fresh
flows of savings to slowly repair their balance sheets burdened by the stock of excessive
debt. The greater the damage to balance sheets, the more time it takes to clean them up.
For example, if a company has a $10 million hole in its balance sheet and can generate
$2 million a year in cash flow that can be used to pay down debt, the repair process will
take five years.

Balance sheet recession is the reason for secular stagnation
137
But as more firms embark on this process and start to use a large part of their free cash
flows to pay down debt, the recession worsens, squeezing cash flow and leading to
further declines in the asset prices that triggered the recession in the first place. That is
why the government – which is outside the fallacy-of-composition problems – has to
proactively take the other side of the bet, so to speak, from the private sector and prevent
a vicious cycle. If the government makes the mistake of opting for fiscal consolidation
too soon, a recession that people expected would end in two or three years – like Japan’s
in 1997 – may persist for seven years, or even ten.
Even after the balance sheets are repaired, people who were forced to deleverage for an
extended period of time tend to experience a kind of debt-related trauma that acts as a
psychological block to borrowing, even after they have cleaned up their balance sheets.
The Americans who had to pay down debt during the Great Depression – the balance
sheet recession par excellence – never borrowed money until they died. Even after
US private sector balance sheets were repaired thanks to the astronomical government
spending of World War II, it still took until 1959 (i.e. full three decades) for US interest
rates to return to the average level of 1920s.
The Japanese finished repairing their corporate balance sheets by 2005, but there is
no sign that they are resuming their borrowing in spite of the lowest interest rates in
human history and the most willing bankers. And that is true even after one full year of
Abenomics, which included massive monetary easing.
Democraciesareill-equippedtodealwithbalancesheetrecessions
On the political front, the unfortunate fact is that democracies are ill-equipped to handle
such recessions. For a democracy to function properly, people must act based on a
strong sense of personal responsibility and self-reliance. But this principle runs counter
to the use of fiscal stimulus, which involves depending on ‘big government’ and waiting
for a recovery. During a balance sheet recession, people with good incomes and sound

Secular Stagnation: Facts, Causes, and Cures
138
balance sheets will vociferously object to fiscal stimulus and with it the implications of
big government, especially once they learn that the stimulus will help rescue people and
institutions that participated in the bubble.
Moreover, most people are not aware that this kind of recession is triggered by fallacy-
of-composition problems that occur when individual businesses and households begin
doing the right and responsible thing by repairing their balance sheets. When the
government tries to administer fiscal stimulus, the media, pundits and ordinary citizens
who do not understand balance sheet recessions are quick to argue that politicians are
wasting taxpayers’ money on useless projects to win re-election.
For the past 20 years, the Japanese media and orthodox academics have self-righteously
and almost reflexively equated fiscal stimulus with pork-barrel politics. In the US,
members of the Tea Party, the Republican Party splinter group that has become so
influential, have effectively staked their political careers on preventing the federal
government from undertaking fiscal stimulus. German Chancellor Angela Merkel’s
decision to force through a fiscal compact calling on all Eurozone countries to follow
Germany’s example and pursue fiscal consolidation was based on a similar philosophy.
Since these people were never exposed to the concept of balance sheet recession at
university, it is difficult to convince them of the need for fiscal stimulus to cure a disease
they have never heard of.
The point is that it is almost impossible to maintain fiscal stimulus in a democracy during
peacetime. It is difficult in a democracy because such policies cannot be implemented
and maintained during peacetime unless millions of people are persuaded of the need
for fiscal stimulus. In contrast, in an autocratic state, only one person – the dictator –
needs to be persuaded in order to both administer and maintain fiscal stimulus.
It is difficult in peacetime because during war, when a nation’s survival is at stake, no
one complains about government spending on armaments or air-raid shelters. There
is no danger of getting bogged down in endless debates over how to spend the money,
because the answer to that question during wartime is clear to all involved.

Balance sheet recession is the reason for secular stagnation
139
Adolf Hitler and Franklin Roosevelt were both elected in 1933 when Germany and the
US were in severe balance sheet recessions. The German unemployment rate reached
28% that year and US rate was not far behind at 25%. Although both started with fiscal
stimulus, Roosevelt, worried about the criticisms from deficit hawks, reversed course in
1937, resulting in a serious double-dip recession and the unemployment rate increasing
to nearly 20% again. Hitler, on the other hand, stayed the course and by 1938, German
unemployment had fallen to 2%. And nothing is worse than a dictator with a wrong
agenda having the right economic policy, especially when the democracies around him
are held hostage to the orthodoxy and remain unable to adopt correct policies.
More recently, the Chinese government implemented a 4 trillion renminbi fiscal
stimulus in November 2008 when it was facing a sharp fall in both domestic asset
prices and exports. As a percentage of GDP, the stimulus was more than double the
size of President Obama’s $787 billion package unleashed three months later. At the
time, western observers were laughing when the Chinese government announced that
they are going to maintain 8% growth. China’s growth soon reached 12%, and nobody
was laughing.
The US government, on the other hand, was extremely cautious with its fiscal stimulus
because of the fear that the stimulus package might be criticised for wasting money.
As a result, it could not offer the kind of positive jolt its designers have hoped for.
The Obama Administration’s inability to renew the fiscal stimulus package due to
Republican opposition slowed down the subsequent US recovery in no small way.
It is actually not difficult to implement fiscal stimulus when a country experiences a
major shock (like the Lehman failure and the Global Crisis). The challenge is whether
it can be kept in place long enough for the private sector to finish repairing balance
sheets.
At the emergency G20 meeting held in Washington two months after Lehman Brothers
collapsed, the 20 nations agreed to administer a dose of fiscal stimulus – a decision
attributable in no small part to the efforts of Japanese Prime Minister Taro Aso. Formerly

Secular Stagnation: Facts, Causes, and Cures
140
a corporate executive, Aso was one of the few Japanese politicians who understood that
fiscal stimulus was the key to maintaining Japanese GDP when the private sector was
saving 8% of GDP at zero interest rates. And at the G20 meeting, he used Figure 4 to
tell the leaders of the other 19 countries that Japan was able to maintain its GDP at
above the bubble peak for the entire post-bubble period with fiscal stimulus, in spite of
commercial real estate prices falling 87% from the peak to the level of 1973.
Figure 4 Japan’s GDP grew despite major loss of wealth and private sector
deleveraging
down 87%
25
40
55
70
85
100
115
130
0
20
40
60
80
100
120
140
80 81 82 83 84 85 86 87 88 89 90 91 92 93 94 95 96 97 98 99 00 01 02 03 04 05 06 07 08 09 10 11 12 13 14
(Sep.1990=100, seasonally adjusted)
Real GDP (right scale)
Land price index in six major cities (commercial, left scale)
(Sep. 1990=100)
Nominal GDP (right scale)
Likely GDP path w/o government action
Last seen in 1973
Cumulative 90-05 GDP
supported by government
action: ~ ¥2000 trillion
Cumulative loss of wealth on shares and
real estate ~ ¥1500 trillion
Sources: Cabinet Office, Japan Real Estate Institute
The G20 ultimately agreed to administer fiscal stimulus in 2009, and the global
economy staged a V-shaped recovery instead of falling into a depression, as had been
feared. But as soon as the economy started to show signs of life, deficit hawks took
over the policy debate.

Balance sheet recession is the reason for secular stagnation
141
Thosewhopreventcrisesneverbecomeheroes
It is often said that people who prevent crises never become heroes. Hollywood teaches
us that for there to be a hero there must first be a crisis, and the experience of Prime
Ministers Taro Aso and Gordon Brown bears that out.
The Japanese media, for example, completely missed the significance of Aso’s
contribution at G20 in November 2009. Instead, they tried to portray his administration
as a care-taker government ahead of the general election scheduled for 2009, and
devoted a great deal of coverage to the prime minister’s misreading of a single Chinese
character in one speech. Partly as a result of such publicity, the LDP was defeated in the
election held in August 2009. The UK Prime Minister Gordon Brown, another leader
who understood what a balance sheet recession was and used fiscal stimulus to address
it, was also defeated in his quest for re-election.
At the Toronto Summit in 2010 – with both Aso and Brown, who had prevented crises,
out of the picture – the G20 leaders agreed on a plan to halve their fiscal deficits in three
years. This in spite of the fact that the private sectors in these countries continued to
save massively despite near zero interest rates.
The resulting fiscal retrenchment sent the developed economies into reverse, with the
UK and many parts of the Eurozone falling into double-dip recessions. Japan, under
the new DPJ government that understood nothing of balance sheet recessions, also
stagnated.
In the US, however, Federal Reserve Chairman Ben Bernanke and others soon realised
that the Toronto agreement had been a mistake. They kept the US from pursuing
premature fiscal consolidation by issuing the warning with the expression ‘fiscal cliff’,
thereby making it the first country to renege on the agreement. Consequently, the US
– alone among the developed economies – continued to post modest economic growth,
while Japan, the UK, and continental Europe faced severe economic weakness.

Secular Stagnation: Facts, Causes, and Cures
142
Partly because of subsequent reflection on this error, the pendulum had swung back
towards the recognition of the importance of fiscal stimulus by the time the St.
Petersburg G20 Summit was held in 2013. Although the three years following the
Toronto Summit were completely wasted from a global economic perspective, at least
there has been some recognition among policymakers that fiscal stimulus is important
in this type of recessions. The risk remains, however, that this will turn out to be just
another phase in an on/off cycle of fiscal stimulus in democracies during peace time.
The above examples show that there is no need to suffer ‘secular stagnation’ if proper
policies are put in place, but that democracies are very bad at implementing such policies
during balance sheet recessions. This predicament will stay with democracies until the
general public (the millions) is made aware of the disease called balance sheet recession
and how to cure it. Until then, the far-from-ideal on/off cycle of fiscal stimulus and
the resultant delayed recovery will make people feel like they are in secular stagnation.

143
Monetarypolicycannotsolvesecularstagnation alone
GuntramBWolffBruegel
The persistence of low Eurozone inflation undermines private and public debt
sustainability – especially in the periphery where the overhang is greatest. However,
since bubbles and unsustainable borrowing supported demand before the Global
Crisis, this chapter argues that higher inflation cannot be a permanent cure for secular
stagnation. Instead, a targeted quantitative easing programme and increased public
investment would help rebalance Eurozone demand. At the global level, population
growth in Asia and Africa will provide ample investment opportunities if they can be
fully integrated into the world economy.
Larry Summers crystallised an important development and question in a recent speech
given at the IMF research conference: Has the world economy entered a period of
‘secular stagnation’? The slow recovery in the US since the Global Crisis is his starting
point and he argues that secular stagnation could also retrospectively explain features
of previous decades such as low inflation. Summers thereby picked up an old term
from Alvin Hansen (1939), who used it in the Presidential Address of the American
Economic Association in 1938. Back then, Hansen focused on the importance of
(public) investment expenditure to achieve full employment. His argument was that for
such investment to happen, the economy needs new inventions, the discovery of new
territory and new resources, and finally population growth.
Summers’ argument is centred on the fact that inflation rates have been falling in the past
two decades and have been mostly lower than expected. Has there been a permanent

Secular Stagnation: Facts, Causes, and Cures
144
fall in the equilibrium real interest rates? Do our economies need real interest rates of
-2% or -3% to generate enough demand to achieve full employment? Is the fact that
inflation rates were so low and even falling over the last decades really a sign that the
global economy was suffering from a permanent demand weakness? Was there really
no demand excess?
Olivier Blanchard (2013) has written a VoxEU column summarising and drawing
lessons from the recent IMF conference at which Larry Summers spoke. One lesson is
that it paid off to have kept one’s fiscal house in order prior to the crisis. He then focuses
on how to macro-manage a liquidity trap. In fact, if one agrees with his assessment
that the effects of unconventional monetary policy are “very limited and uncertain”,
then one can come rapidly to his conclusion that it would be advisable to have higher
inflation rates in normal times, which makes it possible to drive down nominal interest
rates more in a crisis so that real interest rates fall even further. Krugman (2013a) goes
one step further, even arguing that the new normal may be a permanent liquidity trap,
and it would therefore not be advisable to have low inflation rates in the Eurozone
(Krugman 2013b)
Threecentralpolicymeasurestodealwithsecularstagnation
While I see the merits of the arguments of Krugman, Blanchard and Summers, I am
worried that too little thinking is being put into the actual real economic drivers of
secular stagnation and what could be done about them. Let me organise my thinking
around three central points.
First, prior to the crisis, the global economy generated just enough demand to achieve
reasonable employment rates thanks to significant bubbles in a number of major
economies, excess borrowing by low-income households, high corporate borrowing,
and/or unsustainable fiscal policies to balance the large amount of global savings. With
the erupting crisis, high household, corporate and government borrowing and the house-

Monetary policy cannot solve secular stagnation alone
145
price bubbles became visible as unsustainable sources of global demand. So would
the answer to secular stagnation really have been more demand? Or put differently,
how could one have achieved higher inflation rates prior to the crisis, as Blanchard
suggested, without creating even more bubble-like phenomena? Isn’t the suggestion
to solve the liquidity trap problem by running higher inflation rates prior to the crisis
an attempt to cure the problem with the problem itself? If there is an insufficiency of
demand even in normal times, this problem would need to be addressed with structural
policies. The answer can hardly be more bubbles so that inflation rates go up. Using
monetary policy to drive the real interest rate permanently to low, or perhaps even
negative, rates is difficult and can create significant distortions in the economy.
This point can be illustrated by the US example. While monetary policy has been very
supportive and has helped avoid a slide into deflation during the crisis, arguably before
the crisis it contributed to the build-up of many of the problems in the US economy.
The massive bubbles that resulted from the combination of lax monetary policy and an
inadequate financial regulatory system should certainly be considered a problem, not
a solution. A perhaps more important part of the solution to the current problem has
been the acceptance of structural policies that are more conducive to a recovery; the US
recovery has been helped by very significant debt reductions in the household sector
thanks to non-recourse mortgages and the like. More importantly, the banking system
has been cleaned up relatively quickly, which also helped the recovery.
Turning to the Eurozone, I would advise against changing the ECB’s inflation target of
close to, but below, 2% for two reasons. First, such a step would severely undermine
trust in a young institution whose actions are still criticised in some countries of the
EU’s young monetary union. It would constitute a breach of the contract under which
Germany subscribed to the monetary union. Second, changing the target under current
circumstances would be largely ineffective; the current target will not be achieved in the
relevant time horizon, and a higher target would only increase this gap.

Secular Stagnation: Facts, Causes, and Cures
146
Second, like Hansen, I believe in the importance of the structural factors that actually
provide investment opportunities. The overall lesson of secular stagnation, as outlined
by Larry Summers, seems to go in a different direction from monetary policy that,
in normal times, can hardly help address an equilibrium negative real interest rate
without risking major bubbles and unsustainable borrowing, as the European and US
experiences suggest. The fundamental question is why has the equilibrium interest rate
been falling globally and the global economy entered ‘secular stagnation’. Is it global
demographics? Is it the lack of good investment opportunities? Is it the fact that we lack
new places that can be ‘conquered’?
Certainly, population growth is starting to fall in many countries, especially in the
more advanced economies. Yet, the global population is still increasing. This would
suggest that globally, there should still be ample investment opportunities if framework
conditions are put right. This is where the role of the integration of Asian and African
economies into the global economy becomes central. More than half of the world’s
population is concentrated in a small circle in Asia, including China and India. The
more they are integrated into the global economy, the more they should increase global
demand, and the more opportunities for profitable investment should exist. To achieve
this, a well-functioning financial system is critical. It would need to prevent excessive
risk-taking while channelling savings to the right countries and deployments. Clearly,
critical questions are if and how saving and investment patterns will change in Asia.
How sustainably capital accounts are opened up will also be critical.
The Eurozone also provides important evidence that structural policies that allow for
capital to be channelled into productive uses, that allow new innovations to emerge,
and that allow for new inventions are critical. Prior to the crisis, many thought that the
Eurozone had solved the secular stagnation problem and had actually provided the right
framework conditions for more investment. The capital flows in the European periphery
were praised for proving that capital would flow ‘downhill’, where its marginal
productivity is still highest. Unfortunately, the reality turned out to be much less rosy.
Instead of being used productively, much of the capital flows went into consumption
Monetary policy cannot solve secular stagnation alone
147
spending, including on housing. As in the US and UK, increasing house prices initiated
a financial accelerator model in which more and more borrowing followed, thereby
driving a consumption boom.
The European experience underlines the importance of structural reforms that allow
for proper business opportunities and innovation. The downhill capital flows are
welcome in principle, but they only contribute to sustainable growth if they flow into an
environment in which they can drive investment, as outlined by Hansen. In the European
case, part of the problem was that the financial system did not properly steer capital
flows into those productive uses. The regulatory and supervisory system of Europe’s
monetary union was not properly developed, risk became too concentrated and moral
hazard was prevalent. The creation of Europe’s banking union, while incomplete, is
certainly a step in the right direction to solve this problem. But I am also convinced
that Europe should be able to create much better investment opportunities to solve
its stagnation. For this, reforms that reduce administrative burdens, improve education
systems and create better conditions for R&D are central.
Turning to Japan, the importance of structural reforms also becomes apparent. Since
the election of Shinzo Abe as prime minister, Japan has embarked on a QE programme
on an unprecedented scale. The effect has been a much weaker yen, together with an
increase in inflation. This was a welcome policy development. Yet, one year later, it also
becomes clear that a strategy based on a weaker yen to increase exports as the only anti-
deflation strategy cannot work forever. To return to growth and inflation, the third arrow
of Abenomics matters equally: improving investment conditions, creating new business
opportunities, increasing competition in the economy, and deepening trade integration.
Third, how shall macroeconomic policies deal with the liquidity trap, low inflation and
insufficient demand problem in the Eurozone of today? Six years on from the beginning
of the crisis, growth remains sluggish and inflation rates are low or falling. The Eurozone
is still at risk of falling into deflation. Eurozone core inflation rates, i.e. inflation rates
excluding volatile energy and food prices, have been falling since late 2011. Inflation

Secular Stagnation: Facts, Causes, and Cures
148
expectations two years ahead are hardly above 1%, and even at the five-year horizon
the market-determined inflation forecast is 1.19%. This has consequences. Lower-
than-expected inflation redistributes wealth from debtors to creditors and increases the
burden of the debtors. Thus, disinflation in the Eurozone undermines private and public
debt sustainability, in particular in the periphery where the debt overhang is greatest. It
is therefore a real risk for the Eurozone as a whole and should be addressed.
I see a role for both monetary and fiscal policy in helping to overcome this low growth-
low inflation environment. Turning first to monetary policy, it has to deal with two
central problems in the Eurozone. The first is that monetary policy should not undermine
the ongoing relative price adjustment process between the Eurozone periphery and core
(see Figure 1). A monetary policy measure that would increase inflation in the periphery
would only undermine the restoration to health of the Eurozone economy. Instead, the
policy measure should ensure inflation rates are increased in Germany as well as in the
periphery. Ideally, the German inflation rate should move well above the 2% target that
the ECB has set for the Eurozone as a whole. The second concern in the Eurozone right
now is that the process of the banking sector clean-up is unfinished. The ECB would
certainly like to avoid preventing a bank restructuring with monetary policy measures
that would overly distort prices.

Monetary policy cannot solve secular stagnation alone
149
Figure 1 Real effective exchange rate versus EZ18
85
90
95
100
105
110
115
120
2000
20
01
2002
20
03
2004
20
05
2006
20
07
2008
20
09
2010
20
11
2012
20
13
2014
Germany Ireland Greece Spain France Italy Cyprus Portugal
Note: The real effective exchange rate vs EZ18 aims to assess a country’s price or cost competitiveness relative to the currency area as a whole. It corresponds to the nominal effective exchange rate deflated by the GDP deflator.
Source: DG ECFIN – E4.
In Claeys et al. (2014), we have argued that a quantitative easing (QE) programme
focused on the purchase of ESM/EFSF/EIB/EC bonds, corporate bonds and ABS would
overcome those constraints and help to increase inflation via a portfolio-rebalancing
effect and a weaker exchange rate. The recent decision by the ECB (2014) – while a
welcome form of monetary and credit easing – is unlikely to be enough to push demand
and inflation upwards. I am thus not quite as negative on QE as Olivier Blanchard and
also believe that the Japanese experience shows that a large monetary policy measure
can be part of the solution, even if the nominal interest rate is already at the zero lower
bound.
But fiscal policy will also have to play a larger role. One of the big problems in the
Eurozone has been the weakness in public investment in recent years, in contrast to
the US where public investment actually increased. Much the weakness in public
investment needs to be solved by more public investment in Germany. More European-

Secular Stagnation: Facts, Causes, and Cures
150
level investment in European public goods, such as new and better energy and digital
networks, should also be undertaken. This brings us back to the work by Hansen: public
investment and new investment opportunities are needed to address secular stagnation.
References
Blanchard, O (2013), “Monetary policy will never be the same”, VoxEU.org, 27
November 2013
Claeys, D, Z Darvas, S Merler and G B Wolff (2014), “Addressing weak inflation: The
ECB’s shopping list”, Bruegel policy contribution.
ECB (2014), ECB press conference, 5 June.
Hansen, A (1939), “Economic progress and declining population growth”, American
Economic Review 29(1).
King, S (2013), “There is no easy escape from secular stagnation”, FT.com blog, 25
November.
Krugman, P (2013a), “Three charts on secular stagnation”, The New York Times blog,
7 May.
Krugman, Paul (2013b), “Secular stagnation in the euro area”, The New York Times
blog, 17 May.
Summers, Lawrence H (2013), “Crises Yesterday and Today”, speech at the 14th
Jacques Polak Annual Research Conference, Washington, DC, 7 November.

Further on sclerosis


153
Secular stagnation: A view from the Eurozone1
Juan F. Jimeno, Frank Smets and Jonathan YiangouBanco de España and CEPR; ECB and CEPR; ECB
In the Eurozone, rising dependency ratios, tougher financial regulation, debt overhang,
and poor productivity growth are exerting downward pressure on equilibrium real
interest rates. A key question is whether these trends are truly ‘secular’, or whether
policy can improve matters. This chapter argues that there is significant scope to increase
the efficiency of financial intermediation in the Eurozone, and that the potential for
structural reforms remains much greater than in other advanced economies. Reforms
that could help avoid secular stagnation in the long run would also boost demand
today.
Seven years on since financial market turmoil signalled the start of the Great Recession,
output in the Eurozone remains below pre-crisis levels, and unemployment stubbornly
high. Potential growth looks little better: recent estimations from the European
Commission suggest a medium-term potential of only around 1% (2014-2023)
(European Commission 2013). And despite accommodative monetary policy, inflation
is still below target. Against this background, it is not surprising that the Eurozone has
been identified as one of the regions where secular stagnation is most likely to become
reality (e.g. Buiter et al. 2014).
1 The views expressed are our own and do not necessarily reflect those of the Banco de España or ECB. We would like to thank Eric Persson for his research assistance and Arnaud Marès for his input and for many insightful discussions that helped produce this contribution.

Secular Stagnation: Facts, Causes, and Cures
154
Is the threat of secular stagnation in the Eurozone real?
Secular stagnation usually refers to a situation in which saving can only equal investment
at a negative real interest rate – an equilibrium that cannot be achieved because of the
zero lower bound (ZLB) constraint on interest rates and low inflation. We can certainly
see trends in the Eurozone that suggest this could be a possibility.
On the savings side, Europe’s demographic prospects point towards rising savings
rates. As seen in Figure 1, the ratio of the retired population (over 65 years of age)
to the working age population (between 20 and 64) in Europe is projected to increase
from 24.3% in 2000 to 35.4% in 2025, and to 57.5% by 2100. Even with public debt to
GDP ratios much lower than they currently are (92.6% in 2013 for the Eurozone), this
would render most social security systems incapable of providing pension benefits at
the current replacement rates.
Figure 1 Population over 65 years of age/Population 20-64 years of age
0
0.1
0.2
0.3
0.4
0.5
0.6
0.7
0.8
2000
20
05 20
10 20
15 20
20 20
25 20
30 20
35 20
40 20
45 20
50 20
55 20
60 20
65 20
70 20
75 20
80 20
85 20
90 20
95 21
00
World Europe Eastern Europe
Northen Europe Southern Europe Western Europe
Source: The 2012 Revision of the World Population Prospects, United Nations.
The rise of life expectancy, combined with uncertainty about future pension benefits,
can be expected to lead to a significant increase in savings per capita, both of workers
and of the retired population. Even with the change in population composition towards

Secular stagnation: A view from the Eurozone
155
a higher weight of cohorts with lower savings rates, aggregate savings would increase
(Backus et al. 2013, Carvalho and Ferrero 2014).
On the investment side, demand is currently weak. Figure 2 shows investment as a share
of GDP in the Eurozone and the UK, US and Japan. In the Eurozone during the period
2007-2012, this share was almost one percentage point lower than the average for the
period 2000-2006. Even taking into account cyclical factors, it seems unlikely that
investment shares will return to their pre-crisis levels, which in several countries (such
as Spain and Ireland) were exceptionally high because of huge residential investment.
Figure 2 Gross fixed capital formation (as a percentage of GDP)
0
5
10
15
20
25
30
France Germany Italy Spain Eurozone UK US Japan OECD - Total
2000-2006 2007-2012
Source: OECD.
There are some reasons to be concerned that this trend might become structural. One is
the rising cost of capital resulting from tougher financial regulation, which cannot be
offset by interest rates constrained by the ZLB. Another is the debt overhang confronting
both banks and firms in the Eurozone that implies a long deleveraging process – a
process which, so far, has started only gradually (see Figure 3). Indeed, evidence from
Eurozone firms suggests that deleveraging pressures are strongly affecting investment

Secular Stagnation: Facts, Causes, and Cures
156
behaviour. The effect is both on the supply side – higher bank lending rates – and the
demand side – the inability of firms to take on new credit (ECB 2013).
Figure 3 Debt-to-GDP ratios (%)
40
50
60
70
80
90
100
110
2000 2001 2002 2003 2004 2005 2006 2007 2008 2009 2010 2011 2012 2013
General government Households Non-financial corporations
Source: ECB.
Low investment demand could also become persistent due to the Eurozone’s weak
productivity performance. Figure 4 shows an international comparison of recent
total factor productivity (TFP) developments. Although there are differences among
Eurozone economies, in general the Eurozone has lagged other advanced economies in
productivity growth – and not just since the crisis.
Were TFP growth in the Eurozone to remain at such low levels, the set of profitable
investment projects, even at very low long-run real rates, would not expand significantly.
Together with the secular reduction in the relative price of capital, this would generate a
decreasing trend in investment per capita.

Secular stagnation: A view from the Eurozone
157
Figure 4 Total factor productivity (growth rates in percentage, annual average)
-1.5
-1
-0.5
0
0.5
1
1.5
2
France Germany Italy Spain United Kingdom
United States
Japan
1995-2011 2001-2007 2007-2011
Source: OECD.
Can secular stagnation in the Eurozone be avoided?
When thinking about secular stagnation, in our view the key point is not so much
whether such trends exist, but whether they are truly ‘secular’. Put differently, how
much potential is there for policy to reverse the downward drift in the equilibrium real
rate?
Some of the long-run trends appear largely irreversible. Demographic patterns in
particular are characterised by significant inertia. Even with some recovery in the
fertility rate, increases in retirement age, and higher immigration flows from outside
Europe, the ratio of the retired population to the working age population will continue
rising strongly.
The outlook for investment demand, however, is in our view not so set in stone. There
are two factors that could materially alter the investment environment in the Eurozone
– and that are in fact largely unique to the region.

Secular Stagnation: Facts, Causes, and Cures
158
These are, first, the potential to lower the cost of capital by rebooting the financial
sector and completing the single market in capital, and second, the potential to unleash
productivity gains from structural reforms – a potential which remains much greater
than in other advanced economies. While progress has been made in both areas in
recent years, these challenges deserve to remain at the top of policymakers’ agendas.2
Lowering the cost of capital
A lower cost of capital helps mitigate the constraint of the ZLB while, more generally,
improving the risk-return profile for a given investment project. There are two reasons
why we might expect to see this in the Eurozone.
First, through the ECB’s comprehensive assessment of bank balance sheets, the
deleveraging process in the Eurozone is starting to gather speed. The assessment seems
already to have frontloaded the deleveraging of the banking sector. Bank balance sheets
declined by around 20 percentage points of GDP in 2013 alone. As result, financial
frictions that raise the cost of intermediation are expected to wane.
At the same time, this process creates the conditions for a gradual workout of the
private debt overhang (Draghi 2014b). Acknowledging losses and raising capital is a
pre-requisite for banks to restructure loans to distressed borrowers. This may in turn
increase incentives to invest, as firms will not raise new finance to invest if the profits
generated by that investment will be absorbed by servicing existing debt.
Second, deleveraging is initiating a broader and ultimately more important development,
which is a shift in the structure of financial intermediation in the Eurozone. The
Eurozone is in the process of transitioning towards a permanently smaller and more
streamlined banking sector. This is leading naturally to the deepening of capital markets
– if intermediation between savings and investment is taking place less through banks,
then it must take place more elsewhere.
2 See Draghi (2014a) for an in-depth exposition of a sustainable recovery strategy for the Eurozone.

Secular stagnation: A view from the Eurozone
159
This is a welcome development as it provides the impetus not only for a more diversified
financing mix in Europe, but for the development of a genuine single capital market
– something that has long been identified as key to lowering the cost of capital for
European firms (European Commission 2001).
In particular, there is clearly a large untapped potential in Europe to reap economies of
scale from financial integration. This is true especially for risk capital: venture capital
investment in Europe is consistently much lower than in the US and rates of returns are
worse (Veugelers 2011). This reflects the fact that the industry is fragmented across
Europe: successful venture capital depends on a large deal flow to cover the majority
of investments that will fail.
But it is also true for more established European companies, for whom the cost of raising
capital is higher than in the US. The additional cost comes from the complexity of cross-
border capital raising within the EU where, among other structural impediments, there
is no single legal regime for rights in securities, insolvency or corporate governance.
Thus, markets are generally less efficient and less contestable.
In other words, unlike in many advanced economies where financial markets are
already highly efficient, there is significant scope in Europe to increase the efficiency
of intermediation – and so to lower the cost of capital.
Boosting productivity
A lower cost of capital, however, is necessary but not sufficient to achieve higher
investment. Put simply, it makes little difference unless there are productive projects to
invest in. The important point about the Eurozone, however, is that its weak productivity
performance is also an opportunity. Since many member states are far from the frontier
of best practice in terms of structural reforms, productivity gains are easier to achieve
and the potential magnitude of such gains is greater.

Secular Stagnation: Facts, Causes, and Cures
160
The link between structural reforms and productivity is not primarily via greater
flexibility in the formation of wages and prices. This is certainly relevant for smooth
macroeconomic adjustment, but perhaps more important for productivity is ‘horizontal’
flexibility – the ability of resources to reallocate within and across sectors to firms
where they are used most productively.
Indeed, new micro-level research from the Eurosystem’s Competitiveness Network
suggests that reallocation within the Eurozone could yield significant productivity
gains. It finds that the distribution between the most and least productive firms within
Eurozone countries is very large and skewed, with a few highly productive firms and
many which have low productivity (CompNet Task Force 2014).
This is one of the main reasons why increasing labour market flexibility could
produce major benefits. Flexible labour markets not only help limit unwarranted
wage differentials between sectors, they also facilitate mobility between firms and,
importantly, across countries. Eurozone countries have much potential to advance
in this area: on the OECD’s Strictness of Employment Protection Legislation (EPL)
indicator, only four Eurozone countries currently score below the OECD average (i.e.
have higher-than-average labour market flexibility).
At the same time, there needs to be a balance between mobility and stability, and in
certain countries labour market reforms could actually help boost productivity by
improving the latter – especially for young workers. Of particular relevance here is
reducing the dual nature of EPL in several southern European countries that contributes
to inefficient worker turnover and lowers incentives to invest in job-specific skills.
Allocation of production factors is also why European policymakers are increasingly
drawing attention to the ‘softer’ type of structural reforms linked to the business
environment, as these are crucial for the productivity-enhancing process of firm birth,
expansion and death (‘churning’). A few examples from the World Bank’s Ease of
Business index illustrate the scope for Eurozone countries to make improvements
(Figure 5):

Secular stagnation: A view from the Eurozone
161
• If an entrepreneur wants to start a new business in Spain she has to go through ten
separate procedures, while doing so in Slovenia requires only two. Similarly, for
that business to be resolved and the resources reallocated takes less than six months
in Ireland, while in Slovakia it takes about four years.
• If a successful firm wants to expand and invest in new capital, it would have to wait
200 calendar days in Ireland before a new warehouse gets electricity; in Germany it
would only have to wait 17 days. That is not to mention regulatory distortions that
discourage growth above a certain number of employees.
• If firms are in dispute over a contract, enforcing it in Italy requires 37 different pro-
cedures, and takes on average over three years. By contrast, an identical dispute in
France or Germany would be resolved through about 30 procedures and would take
a little more than a year.
While quantifying the benefits of these and other structural reform measures involves
some uncertainty, simulations by researchers at the OECD suggest that a broad package
of labour, product, tax and pension reforms would raise GDP per capita by about 11%
after ten years for the average EU country under relatively quick reform implementation.
The equivalent for the US is under 5% (Bouis and Duval 2011). Other empirical studies
confirm that among the advanced economies the Eurozone, along with Japan, has the
most to gain from structural reforms.
In short, one should not underestimate the power of structural reforms in Europe.3
3 For a formal model of how these reforms may contribute to faster deleveraging and, hence, short-term gains in employment, see Andrés et al. (2014).

Secular Stagnation: Facts, Causes, and Cures
162
Figure 5 World Bank Ease of Doing Business Index
Overall index Dealing with Construction Permits Enforcing Contracts Getting Credit Paying Taxes
Protecting Investors Registering Property Resolving Insolvency Starting a Business Trading Across Borders
AT
BE
CY
DE
EE
ES
FI
FR
GR
IE
ITLU
LV
MT
NL
PT
SI
SK
AT
BE
CY
DE
EEES
FI
FR
GR
IE
IT
LU
LV
MT
NL
PT
SI
SK
ATBE
CY
DE
EE
ES
FI
FR
GR
IE
IT
LU
LV
MT
NL
PT
SI
SK
AT
BE
CY
DE
EE
ES
FI
FR
GR
IE
ITLU
LV
MT
NL
PTSI
SK
AT
BE
CY
DE
EE
ES
FI
FR
GR
IE
IT
LU
LV
MTNL
PT
SI
SK
AT
BECY
DE
EE
ES
FI
FRGR
IE
IT
LU
LVMT
NL
PT
SI
SK
AT
BE
CY
DE
EE
ES
FI
FR
GR
IEIT
LU
LV
MT
NL
PT
SI
SK
AT
BE
CY
DE
EE
ES
FI
FR
GR
IE
IT
LU
LV
MT
NL
PT
SISK
AT
BE
CY
DE
EE
ES
FI
FR
GR
IE
ITLU
LV
MT
NL
PTSI
SK
AT
BE
CY
DE
EE
ES
FI
FR
GR
IE
ITLU
LV
MT
NL
PT
SISK
0 25 50 75 100 0 25 50 75 100 0 25 50 75 100 0 25 50 75 100 0 25 50 75 100
0 25 50 75 100 0 25 50 75 100 0 25 50 75 100 0 25 50 75 100 0 25 50 75 100
20072014
Distance to frontier (frontier = 100)
Conclusion
Some observers may see the policy agenda we have laid out today as focused entirely
on supply conditions. They may reasonably ask: “What about demand?” – for the
longer demand remains weak, the greater the risk of labour and capital hysteresis, and
then policymakers may find themselves running simply to stand still.
In our view, however, there is no contradiction. The same policies that will help avoid
secular stagnation in the future will help boost demand in the current environment.
The purpose of lowering the cost of finance and creating a more dynamic business
environment is to raise investment – and investment is not only tomorrow’s supply, but
today’s demand.

Secular stagnation: A view from the Eurozone
163
Figure 6 Expected real intertest rates in the Eurozone
-2
-1
0
1
2
3
4
2009 2010 2011 2012 2013 2014
five-year forward five years ahead real yield
five-year spot real yield
ten-year spot real yield
Moreover, rebooting the banking sector and deepening financial integration will reinforce
the transmission of the ECB’s monetary policy across the Eurozone. Monetary policy
is very accommodative: as Figure 6 shows, riskless real rates are negative and expected
to remain so for a long time. The more this accommodative stance feeds through to the
real economy, the more the ECB will regain grip over demand conditions.
References
Andrés, J, O Arce and C Thomas (2014), “Structural reforms in a debt overhang”,
Banco de España Working Paper No. 1421.
Backus, D, T Cooley and E Henriksen (2013), “Demography and Low Frequency
Capital Flows”, NBER Working Paper No. 19465.
Bouis, R and R Duval (2011), “Raising the Potential Growth after the Crisis: A
Quantitative Assessment of the Potential Gains from Various Structural Reforms in the
OECD Area and Beyond”, OECD Economics Department Working Paper No. 835.

Secular Stagnation: Facts, Causes, and Cures
164
Buiter, W, E Rahbari and J Seydl (2014), “Secular Stagnation: Only If We Really Ask
For It”, Global Economics View, Citi Research.
Carvalho, C and A Ferrero (2014), “What Explains Japan’s Persistent Deflation?”,
work in progress.
CompNet Task Force (2014), “Micro-based Evidence of EU Competitiveness: The
CompNet Database”, ECB Working Paper Series No. 1634.
Draghi, M (2014a), “A consistent strategy for a sustained recovery”, lecture at Sciences
Po, Paris, 25 March.
Draghi, M (2014b), ”Bank restructuring and the economic recovery”, speech at the
presentation ceremony of the Schumpeter Award, Oesterreichische Nationalbank,
Vienna, 13 March.
ECB (2013), “Corporate Finance and Economic Activity in the Euro Area”, Structural
Issues Report 2013, ECB Occasional Paper Series No. 151.
European Commission (2001), Final Report of the Committee of Wise Men on the
Regulation of European Securities Markets, Brussels.
European Commission (2013), “The euro area’s growth prospects over the coming
decade”, Quarterly Report on the Euro Area 12(4).
Veugelers, R (2011), “Mind Europe’s Early-Stage Equity Gap”, Bruegel Policy
Contribution No. 2011/18.

e
A VoxEU.org Book
Secular Stagnation: Facts, Causes and Cures
Edited by Coen Teulings and Richard Baldwin
Centre for Economic Policy Research
77 Bastwick Street, London EC1V 3PZTel: +44 (0)20 7183 8801 Email: [email protected] www.cepr.org
Six years after the Global Crisis, the recovery is still anaemic despite years of near-zero interest
rates and extraordinary central bank manoeuvres. Is ‘secular stagnation’ to blame?
This eBook gathers the thinking of leading economists including Larry Summers, Paul Krugman,
Robert Gordon, Olivier Blanchard, Richard Koo, Barry Eichengreen, Ricardo Caballero, Ed
Glaeser and a dozen others. A fairly strong consensus emerged on four points.
• Secular stagnation (SecStag) means that negative real interest rates are needed to
equate saving and investment at full-employment output levels.
• The key worry is that SecStag will make it hard to achieve full employment with low
inflationandfinancialstabilityusingmacroeconomicpolicyasitiscurrentlystructured
and operated.
• It is too early to tell whether secular stagnation is to blame, but uncertainty is not
an excuse for inaction. Policymakers should start thinking about solutions; if secular
stagnation sets in, today’s toolkit will be inadequate.
• Europe has more to fear from the possibility of secular stagnation than the US, given
its slower overall growth and its lack of pro-growth reforms and more constrained
policy framework.
The authors point to two classes of solutions: ‘Prevention’ (raising long-run growth potentials)
and‘symptomatictreatment’(raisingtheinflationtargettoalleviatethezerolowerbound
problem,andusingfiscalpolicytoaddressbalance-sheetrecessions).
Secular Stagnation: Facts, Causes and C
ures
aCEPR Press
aCEPR Press9 781907 142772
ISBN 978-1-907142-77-2