sector report, january 9, 2015 capital goods in japan and ...€¦ · sandvik (nsk, kito, doosan,...
TRANSCRIPT
Equity Research
Sector report, January 9, 2015
Capital Goods in Japan and Korea
We met 19 companies in five days
Conclusions for twelve Nordic Capital Goods companies
Regional winners are Autoliv and Atlas Copco
Regional losers are shipbuilding companies (Alfa Laval/Wartsila/Cargotec) and SKF

Contents Executive summary: Rising suns and falling stars 3
Who, what and where: company overviews, trip agenda 6
BoJ saves Japan but puts pressure on South Korea 10
Shipbuilding: Slow steaming until 2016 demand pick-up 12
Japanese truck market: From a vacuum to growth 32
ABB (Hyosung) 36
Alfa Laval (Alfa Laval, Wartsila, Cargotec, DSME, etc.) 38
Atlas Copco (Atlas Copco, Komatsu, etc.) 40
Autoliv (Hyundai, Suzuki and Denso) 42
Cargotec (Cargotec, shipbuilding) 47
Konecranes (Kito) 49
Metso (Metso Flow Control in South Korea) 51
Nokian Tyres (Bridgestone) 53
Sandvik (NSK, Kito, Doosan, Komatsu, Mitsubishi) 54
SKF (NSK, Kito, Denso, Bridgestone, etc.) 56
Volvo in Japan 60
Wartsila (Wartsila, shipbuilding) 63
Disclaimers 64
Peder Frölén +46 8 701 12 51 [email protected] Hampus Engellau +46 8 701 35 76 [email protected]
Tom Skogman +358 10 444 27 52 [email protected] Carl Bertilsson +46 8 701 82 84 [email protected]

Sector report, January 9, 2015
3
Executive summary: Rising suns and falling stars This report contains details and outlooks about some of the Nordic companies in our universe with operations
in South Korea and Japan, reflecting our recent visit to those countries and discussions with local and Nordic
companies there. In this report, we also reach conclusions about how the shipping industry will affect our
Nordic universe, and we take a deep dive into the Japanese heavy truck market, as well as reviewing operations
and prospects in Japan and South Korea for companies in our Nordic Capital Goods universe. We rank our
universe based on size, position and demand outlook in the region. Autoliv and Atlas Copco score the best,
while the companies exposed to shipbuilding (Alfa Laval, Cargotec and Wartsila) and SKF score the worst.
Overall outlook for Japan and South Korea Much of the success in turning deflation into inflation and boosting company profits, the labour market and wages can be pinned on the dramatic expansion of the Bank of Japan’s balance sheet. Last month the BoJ revealed that it will do more of the same. We now estimate that USD/JPY will reach 130 next year, further boosting profits and stocks. South Korean exporters will face increasing competition from Japan and this will make the central bank dovish, putting downward pressure on interest rates and ultimately stimulating domestic demand conditions.
Companies in Japan foresee a healthier domestic economic climate, with the Construction segment highlighted during most discussions. Although companies expect some growth of industrial demand in 2015 after a flat 2014, one should bear in mind that the absolute level is rather constant (NSK has had flat sales in Japan since 2005). Strength from improved local demand will be used to seek expansion overseas and not only in the rest of Asia, which could play out interestingly in some industries. Although this viewpoint does not take FX developments into account, currency movement advantages are quite obvious and will likely be even stronger ahead. It is quite clear that Japanese companies are skeptical about Chinese demand. Both NSK and Kito claim that the low-end market for industrial distribution products is shrinking in China.
Shipbuilding industry Ship orders collapsed in 2014 and at our meetings in South Korea and Japan we did not meet anybody who expected a swift 2015 recovery. Instead, the common message was that a generally better global economy hopefully should lead to better ship orders in 2016 and that the Korean yards will enter a restructuring phase. On the other hand, a performance ‘Ice Age’ looms for offshore, with the risk of spillover effects from surprisingly weak demand for gas carriers.
We argue that high energy prices together with cheap financing have prevented the shipbuilding industry from starting heavy restructuring earlier. Notably, yards also still presented great profitability in 2011-12, stemming from late deliveries of orders booked at a high gross margin in 2008. Now restructuring seems unavoidable and we see it likely that the entire industry will shrink, offering fewer opportunities for the Nordic suppliers.
Based on historical ship orders and our new knowledge gained in Asia, we estimate ship orders ahead and how that transfers into business for Nordic suppliers in our coverage. Thanks to favourable currency movements, sizeable acquisitions and large Service businesses, the outlook is luckily far less acute for these suppliers than could be judged from poor vessel orders.
BoJ balance sheet
expansion fuels
turnaround
Lift in demand
expected in Japan,
not in China
Dim picture for a fast
recovery…
…but Nordic
suppliers to benefit
from FX, buyouts
and Service

Sector report, January 9, 2015
4
Table 1: HCMe vessel order growth (number of vessels), y-o-y
Source: Handelsbanken Capital Markets
Table 2: Total Marine order growth y-o-y in reporting currencies, Nordic suppliers*
Source: Handelsbanken Capital Markets
* Including Service and presented acquisitions
Japanese heavy truck industry The Japanese heavy truck market has been extremely competitive since the bubble years, due to structurally lower volumes and four established local players. The tough pricing situation has made Japan a low-margin market with an EBIT margin for OEMs that is about 3 p.p. lower on average compared to average profitability for European and North American truck OEMs. However, growing demand in Japan and Southeast Asia as well as a gradual return of pricing power suggest that margins might be on the rise in Japan, while the opposite has been the case in Europe and North America since the financial crisis. We expect the 2014 market to have reached close to 39,000 units from a combination of an ageing truck population, improving business confidence and infrastructure investments from build-ups following the Fukushima disaster, but also investments ahead of the 2020 Olympics. We expect 2015 to continue on the growth lane as new JPN 16 emission standards in 2016 will spur investments in mid-2015.
How Nordic companies measure up We look at the size, position and demand outlook in the region and rank our covered Nordic Capital Goods companies from +++ to ---, presented in order of rank.
Figure 1: Nordic Capital Goods, share of sales in Japan and South Korea
Source: Company data and Handelsbanken Capital Markets
Bulk & Container Tankers Offshore Gas Others2014 -58% -23% -47% -5% -31%2015e -10% 5% -70% -30% 15%2016e 10% 10% 15% 5% 10%2017e 0% 5% 100% 20% 5%2018e 10% 5% 50% 20% -10%
Alfa Laval MacGregor Wartsila
2015e -24% -16% -4%
2016e 15% -22% -3%
2017e 16% -6% 8%
0%1%2%3%4%5%6%7%8%9%
10%
Japan & South Korea, share of group sales
Fierce competition
due to low volumes,
local players
From basically none
to 9% of sales for the
Nordic Cap Goods
universe in Japan
and South Korea

Sector report, January 9, 2015
5
Autoliv (+++): Autoliv has a strong position in Asia, especially in Japan and China. We believe Autoliv will gain further market share in this region on the back of Takata’s problems.
Atlas Copco (++): A strong local position, favourable segment exposure and ongoing efforts make Atlas look good in the region. Atlas is also one of the few Nordic suppliers that has managed to land local acquisitions.
ABB (+): Transformer demand remains challenging but Korean profitability speaks of clearly better pricing.
Volvo (+): With the finalised acquisition of Donfeng we believe Volvo is in a better position to leverage its Quester mid-segment product. That said, Japan will remain a mid-single digit EBIT margin market.
Metso (+): Metso has a still small but very interesting position in South Korea, supplying valves to the country’s vibrant EPC companies building global infrastructure projects.
Nokian Tyres (+): We met with Nokian’s main owner Bridgestone (15% of the shares), which states it also has a great EBIT margin in its Winter Tyres division at ~26%.
Sandvik (+/- to -): Sandvik Machining Solutions (SMS) will enjoy a better general economic climate and Sandvik Materials Technology (SMT) will gain some help from nuclear power partly being put back online. However, both SMS and SMT have strong local competitors, which could potentially hurt pricing.
Konecranes (-): Konecranes is not present in South Korea or Japan but it owns 22% of Japan’s leading crane manufacturer Kito. Kito is struggling to see growth in Japan and its market comments about China were negative while the company is optimistic about the US.
SKF (-): Japan is the Mecca of ball bearings, and we are fearful of more exposure for SKF to the weak JPY, especially as main peer NSK is sceptical about volume and has excess capacity.
Cargotec (---): Cargotec’s MacGregor division has an excellent market position in Korean shipbuilding, but orders unfortunately collapsed in 2014 with no clear sign for any improvement in 2015.
Alfa Laval (---): With its relatively large exposure to the region and to the Marine industry, Alfa scores poorly in the group.
Wartsila (---): Wartsila has a great market position in South Korea in particular. However, 2014 ship orders and especially critical offshore orders were very low and we got the impression that yards are preparing for restructuring, as the order outlook remains weak for 2015.
Leaders benefitting
from niches, local
initiatives
Laggards hurting
from weak macro
economies,
shipbuilding

Sector report, January 9, 2015
6
Who, what and where: company overviews We present here our impressions of the operations, performances and prospects of Nordic Capital Goods
companies that have sales or operations in Japan and South Korea. We also provide more detailed rankings
of our perception of these companies in the region, according to size, position and demand outlook. An
itinerary of our recent trip is included at the end of this section. For fuller details on a company’s operations
in Japan and South Korea, refer to that company’s separate chapter further on in this report.
Overviews and ranking of Nordic companies in the region We look at the size, position and demand outlook for companies in the region and rank them from +++ (highest) to --- (lowest), presented in alphabetical order.
ABB (+): In South Korea, we met with Hyosung, an industrial conglomerate that comprises four business areas. Our main focus in this meeting was the Power & Industrial Systems business area and its two product areas: 1) Power Systems focusing on UHV transformers and circuit breakers, making it a competitor to ABB’s Power Products transformer business. 2) Industrial Machinery focusing on electric motors and generators, making it a competitor to ABB’s DM business area. The combination of reduced capacity for transformers globally and an anti-dumping ruling in the US on Korean transformer manufacturers including Hyosung has improved profitability for the industry. According to Hyosung, Power Systems (70% transformers) is the most profitable business unit in the Power &Industrial Systems business area. Hyosung expects Power & Industrial Systems to grow 5%, China and America to grow higher and Europe less. Transformers’ business sentiment continues to be tough globally and Honda Engineering is most competitive on pricing. Today, about 10% of ABB’s Power Products transformers business is in the highly competitive, more commoditised transformers, where pricing remains tough. That said, we believe this transformers business in ABB Power Products is a low double-digit-margin business.
Alfa Laval (---): Energy imports and more efficient energy usage will boost demand for Alfa Laval in Japan and will increase construction activity. The Marine segment is the most important for Japan and South Korea and faces a tough future (see the section on shipbuilding and our separate research report on Alfa Laval for more details). Alfa Laval has a relatively good balance with locally produced products in Marine, but in total we consider the company to be a net importer in Japan, hurting earnings a bit from FX reasons apart from translation effects. If we combine a relatively large exposure (4% of orders in Japan and 5% in South Korea) with the tough Marine outlook, Alfa scores poorly in our ranking.
Atlas Copco (++): Atlas has around 2% of its sales in Japan and 2.5% in Korea and has benefitted from acquiring companies in Japan (Fuji) or companies with a presence in the region (Drilling Solutions, SCA, Edwards). We find the positive positioning journey in CT, IT and Construction to be of great interest, as it creates good growth prospects in addition to the improving construction activity. Thus, we see relatively good growth prospects for Atlas Copco in the region, helped by expansion plans from Samsung in South Korea. On global mining, Komatsu expects rebuilding activity improvement soon, while parts inventory destocking could continue for a while longer. For construction globally, Komatsu paints a very bleak picture in China and raises a warning about the standard view that US construction activity will continue to rise.
Autoliv (+++): Autoliv is one of the companies in this group with the highest exposure to Asia, which accounts for 33% of group of sales, with China at 15.8%, Japan 7.5% and the rest of Asia at 9.6%. Hyundai is by far Autoliv’s biggest customer among the Asian OEMs and accounts for 9% of Autoliv’s sales. This is followed by Toyota and Honda with 6% of sales each. We believe Korean OEMs are well positioned to grab further
Transformers
providing a firm
foundation
Marine prospects
look really poor
A strong local
position, favorable
segment exposure
and ongoing efforts
make Atlas look good
in the region
Takata airbag
inflator recall could
inflate Autoliv
market share
Sector report, January 9, 2015
7
market share in Asia, while the Triad is less prioritised. That said, we believe Japanese OEMs will grow more aggressively in the Triad, benefitting from the more favourable FX situation, even though much production is localised. Given the recall problems for Takata in relation to airbag inflators (Takata is a Japanese competitor to Autoliv that we did not get to meet), we believe Autoliv will gain more market share in Asia. Takata has become less reluctant to call for a nationwide recall in the US, which we believe will be the first step toward a global recall that could involve as many as 30 to 60 million cars at a total cost of USD 3-6bn for Takata. This will create massive problems for Takata financially, and likely either trigger a rights issue or a restructuring. We believe OEMs will help Takata stay in business, but this is likely going to make Takata a smaller company than today, resulting in long-term global market share gains for Autoliv and TRW of potentially a couple of percentage points each.
Cargotec (--): The company had 7% of group sales in South Korea in 2013 and 1% in Japan. All of Cargotec’s three divisions operate in Korea. Kalmar exports some container port equipment to the country and Hiab has a small factory producing truck-mounted cranes there. However, the majority of Cargotec’s business in these countries comes from MacGregor supplying load-handling equipment and offshore cranes to the building industry for large vessels. The company has an excellent market position in Korea with a 50-60% market share, while it is comparatively weak in Japan. MacGregor expects Korean yards to struggle with order booking in 2015, with the greatest hopes on large container vessels; the offshore outlook is weak, forcing Korean yards to restructure their businesses. Just as with the other yard and shipping equipment suppliers we met, MacGregor shared the view that demand will likely recover in 2016.
Konecranes (+/- to -) has no direct sales in South Korea or Japan but owns 22% of Japan’s biggest crane manufacturer, Kito, with which it also shares some procurement activities, and a cross-selling agreement also exists between the companies. Kito is the global leader in chain hoists while Konecranes is the global leader in wire-rope hoists. Kito has managed to lift its EBIT margin from 4.0% in 2010 to just below 10% in 2014e, indicating it is not impossible to improve profitability in the crane industry. Looking ahead, Kito’s CEO said he remains optimistic about the demand outlook in the US, while he is pessimistic about China for the coming 12-18 months, with only the Automotive and Power Plant segments showing health.
Metso (+) booked 1.3% of group orders from South Korea but all of this came from Flow Control (i.e. nothing from Mining & Construction). However, orders there are expected to rise significantly in the coming years, as after our visit Metso opened a new valves factory, raising the company’s global valves production by 5%. This factory represents one out of Metso’s seven valve factories globally. More than half of Metso’s South Korean sales go to the country’s large and vibrant EPC industry construction’s oil refineries, gas systems, petrochemical factories and power plants across the world. Metso’s idea is that local engineering and production can significantly improve its market position at these EPC companies from the current market share of just above 5%. Of the global valves companies only two have local manufacturing in South Korea, implying Metso has a first-mover advantage.
Nokian Tyres (+/-) has no sales in Japan or South Korea, but China is a potential growth market to which Nokian will deliver some 300,000 tyres in 2014e. In Tokyo, we met with Nokian’s main owner Bridgestone, holding 15% of the shares. Bridgestone expressed no intention to increase or reduce its holding. Currently, the key cooperation between the companies involves Bridgestone offering its Southern European distribution chain to Nokian while Nokian offers its distribution chain in Northern Europe. A key lesson from the meeting is that Bridgestone has a ~26% EBIT margin in winter tyres, i.e. almost in line with Nokian. The key winter tyre markets for Bridgestone are Europe, Japan and Canada. China is still a very small winter tyre market and Bridgestone did not see any great opportunity in China over the next few years. Bridgestone is due to open a factory in Russia in 2016. Approximately 30% of the
Near-term threat in
Korea from yard
orders, restructuring
Can Konecranes
succeed with a
similar turnaround
as Kito’s?
Metso has just
opened a valves
factory in Korea
Bridgestone is
Nokian’s main owner

Sector report, January 9, 2015
8
output from the new Russian factory is planned to go car manufacturers in Russia. While Nokian currently manufactures 45,000 tyres in Russia per day, the Bridgestone factory will at full capacity produce 12,000 tyres by 2018. It is interesting to note that Bridgestone’s biggest factory globally produces 50,000 tyres per day – i.e. Nokian’s factory is one of the biggest tyre factories in the world.
Sandvik (+/- to -): Sandvik has a relatively small exposure to the region (2% of sales to Japan and 1% to South Korea). The company will enjoy a potentially warmer economic climate in SMS and from parts of nuclear power being turned back on driving some modernisation need although we do not expect any investments in new reactors. We do not look for expect Sandvik to win over local suppliers of pipes for gas transportation. Regarding pricing, there is a small downside risk in Sandvik Machining Solutions (SMS) due to competition and in Sandvik Materials Technology (SMT) from both competition and weak energy capex sentiment. Overall, we rank Sandvik as neutral to slightly negative when it comes to potential growth in and from the region.
SKF (-) has limited sales in Japan and South Korea (4%) but the market is very important, as three out of the six largest global players in bearings are Japanese. A possible consolidation (which we actually find unlikely in the short term) could mean less fierce competition for SKF. We fear that insufficient volume growth (demand and distributor destocking) in combination with excess capacity for bearings players, tempting FX advantages for Japanese competitors, increased Chinese competition and an overall weak pricing climate, will force SKF to work even harder to sustain profitability. From a Japanese perspective, a large European exposure, potential positive indirect effects from weaker oil prices, and limited exposure to oil and marine has driven the SKF share recently, and we expect that this could continue in the short term.
Volvo (+): Volvo is represented in Japan through its UD brand, although there is a CKD facility that sells Volvo. In 2013, Volvo sold about 43,560 trucks in Asia including Eicher, representing 20% of Trucks sales. About 22% of Asia sales for Volvo trucks were to Japan (4.4% of Trucks) and Japan accounted for 67% of UD truck sales in 2013. Even though Volvo is adjusting capacity and streamlining its UD business in Japan, we believe it will continue to be a mid-single-digit margin business with a potential repeat of the historical peak EBIT margin of 7.5%. However, if the introduction of Quester turns out to be a successful volume story reaching 30,000 units, incremental earnings on the UD technology could yield over-the-cycle higher margins. From listening to Volvo and also annualising the previous action programme to increase margins over the cycle, we believe the Quester product is part of the programme to increase the Asia profitability over the cycle. Higher volumes in Asia for Volvo, but also the possibility to extend the life of old technologies from ended products in the Volvo group, speak for better margins, if successful.
Wartsila (--) generated 7% of its 2013 sales in South Korea, with Japan <1% but China another 6%. Almost all of Wartsila’s sales in these countries come from Ship Power with some from Service, implying that Korea and China are the two most important end-markets for Wartsila’s Ship Power. The company has a very strong market position in advanced offshore solutions and gas system solutions. For instance, within LNG (liquefied natural gas) systems Wartsila said it has a market share of >70% in South Korea. The outlook for offshore solutions is weak, and within gas carriers, LPG (liquefied petroleum gas) ship orders will likely weaken while LNG vessels should be strong in 2015. We got the general impression that Korean shipyards expect low orders in 2015 with a recovery expected in 2016.
Local metal-cutting
exposure and little
presence offset a
warmer economic
climate
Japanese bearing
industry getting
stronger
Great market
position in gas
systems
Quester, volumes
and extended life for
old technologies
could boost margins
Sector report, January 9, 2015
9
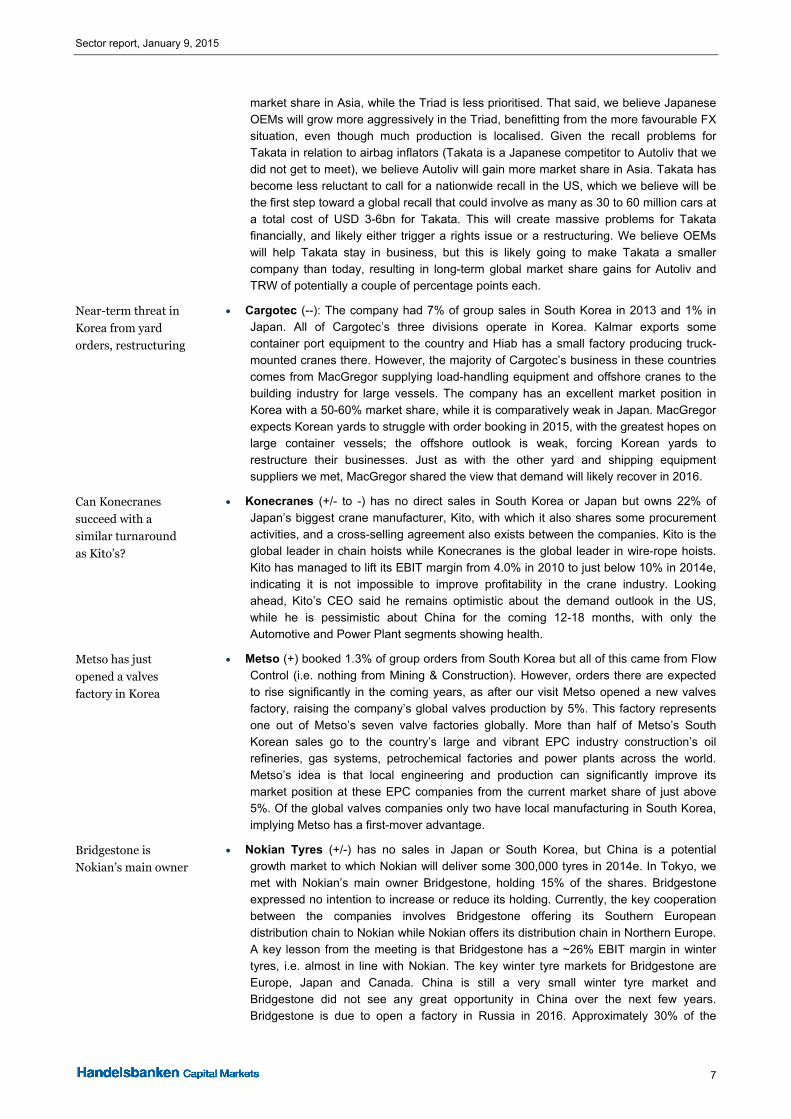
Table 3: Itinerary, Capital Goods trip to Japan and South Korea
Source: Handelsbanken Capital Markets
Japan
Company Speaker Name OccupationKomatsu Masahiro Kitaoka Head of IR
Takuya Imayoshi IRTomomi Odawara IR
Suzuki Masahiko Nagao Executive GM, Corporate PlanningToyokazu Sugimoto Councelor, Corporate PlanningSeiji Kobayashi Head of IRKojima Hideo IRShunsuke Shibuya IR
Mitsubishi Heavy Industries Kenichi Nakamura Manager, IR and FP&AAlfa Laval Richard Kelly Managing Director, JapanAtlas Copco Thomas Östergren General Manager, JapanKito Yoshio Kito President & CEO
Hiroshi Sasaki Senior Manager, Corporate PlanningTsuyoshi Oshita Manager, Communications
Hino Matsukawa Toru Manager, Corporate PlanningTsuchiya Naoyo Head of IRKashiwa Kensuke IR
NSK Saimon Nogami VP, Corporate PlanningYasushi Uchida Head of IRKoji Minami IR
Denso Shinichi Niinomi IR ManagerNaohito Tainaka General Manager, Finance & Acc.
Bridgestone Kenjiro Miwa IR ManagerJun Suzuki IR
South Korea
Company Speaker Name OccupationHyosung Corporation Seung Wook Lee General Manager, IR
Yeon Jae Jeong IRJae Min Joo IR
Daewoo Shipbuilding & Marine Eng. June-sun Hwang Head of IRByung-gwang Son IR
Hyundai Motors Yong-hyun Chung Head of IRMin-Kyun Kang IR
Doosan Heavy Industry Joonhong Kim Head of IRYoungsoo Won IR
Metso Flow Control Markus Hauhia Director, Global Valve Product LineWärtsilä Sung Bok Yoo Managing Director, Korea
Hans Lahej Area Sales DirectorNatalia Valtasaari IR
Cargotec Jeon Hong San Sales Director, KoreaHanjin Heavy Industries Sung Pill Lee Head of IR
Dong Ju Lee IRSeung Ho Yang General Manager, Shipbuilding SalesJae Won Kim Manager, Finance
Hyundai Heavy Industry Jeon Hong San Sales Director Korea, CargotecYong Un Park License Management, Wärtsilä KoreaEero Markkinen Director, 2SLM, Wärtsilä KoreaBanu Kannu GM Marketing, Wärtsilä Ship PowerPeik Jansson Business Dev., Oil and Gas, WärtsiläNatalia Valtasaari IR, Wärtsilä
We met with ten
companies in Japan
and nine in South
Korea
Sector report, January 9, 2015
10
BoJ saves Japan but puts pressure on South Korea Much of the success in turning deflation into inflation and boosting company profits, the labour market and
wages can be pinned on the dramatic expansion of the Bank of Japan (BoJ) balance sheet. Last month the
BoJ revealed that it will do more of the same. We now estimate that the USD/JPY will reach 130 next year,
further boosting profits and stocks. South Korean exporters will face increasing competition from Japan and
this will make the central bank dovish, putting downward pressure on interest rates and ultimately
stimulating domestic demand conditions.
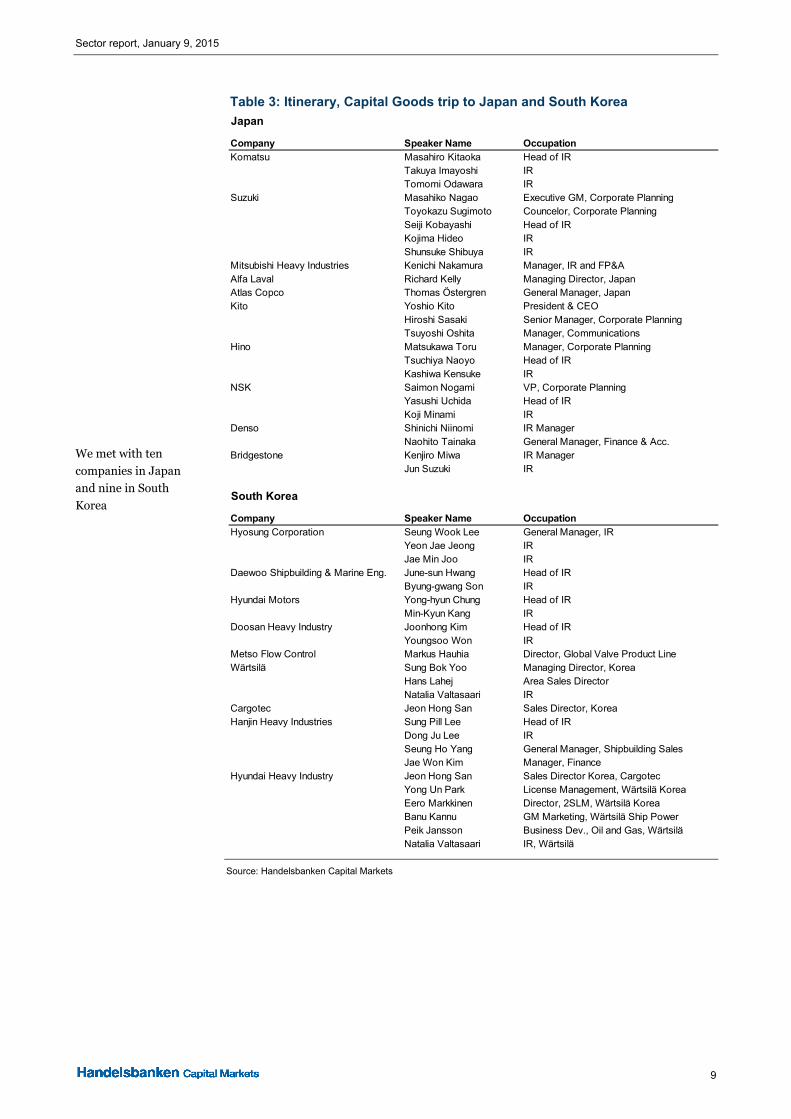
The Bank of Japan did the right thing when it decided to double the size of its balance sheet. The JPY has declined dramatically, dragging import prices higher but also boosting pricing power for companies and thus lifting profit margins. As a result, demand for labour has increased and wages are no longer falling but have started to rise again. All of this is good news for the economy but also for the stock market. There is a striking correlation between the Nikkei Index and the yen (see chart below).
Japan Strong correlation Nikkei and JPY
JPY per USD
Nikkei, 225 Index (left)
Inde
x
7000
8000
9000
10000
11000
12000
13000
14000
15000
16000
17000
18000
19000
JPY
per US
D
75
80
85
90
95
100
105
110
115
120
125
2006 2007 2008 2009 2010 2011 2012 2013 2014 2015
Source: Macrobond
JPY/USD vs central bank balance sheets
JPYUSD
BoJ balance sheet relative to Fed, rhs
EU
R/S
EK
70
80
90
100
110
120
130
140
June 2008 = 100
90
100
110
120
130
140
150
160
170
180
2012 2013 2014 2015
Source: Macrobond
The flip side of the coin is that success in driving inflation up has turned real yields on Japanese government bonds (JGBs) from positive to negative. We do not think that private sector demand for JGBs can be sustained with persistently negative real interest rates. Indeed, a government commission last spring concluded that if the public pension fund, GPIF, is going to deliver reasonable returns for retirees in the future, it has to switch out of JGBs and into Japanese equities and foreign assets. This investment recommendation will now be implemented so the GPIF will turn from a net buyer of JGBs to a net seller. Given that real yields are negative and that there is downward pressure on the yen, it is hardly likely that foreign investors will pick up the tab.
This leaves a huge burden on the BoJ. Not only will it have to buy every bond that investors want to sell. The BoJ will also have to fund the government budget deficit, which is now running close to 10 percent of GDP. If the BoJ does not buy when everybody is selling and the government has to fund the large budget shortfall, there will be a huge upward pressure on government bond yields.
So what if yields rise? Is that so bad? Well, let us say that bond yields were to go up 2 p.p. to compensate for the rise in inflation. This would be more than a quadrupling of the interest burden on the government debt. Given that the public sector debt-to-GDP ratio is approaching 250%, it is not trivial if interest rates rise by 2 p.p.. That would correspond to 5% of GDP. Is that a lot to worry about? Yes, for Japan it is. Government revenues only amount to 10% of GDP, so an additional spending of 5% of GDP on interest payments would soak up half of revenues and leave less room for other spending.
Rising inflation has
caused real yields on
JGBs to flip from
positive to negative
But if yields rise to
make up for
inflation,
government debt will
be burdened

Sector report, January 9, 2015
11
Consequently, we think that the BoJ has ended up on a one-way street. Unlike the Fed, which has stopped buying US treasuries without creating any turmoil, the BoJ likely will have to keep on buying Japanese treasuries in order to prevent government debt funding costs from skyrocketing. Unless there is a spectacular turnaround in Japanese government finances, the BoJ might find itself pushing the JPY. We estimate that the USD/JPY will reach 130 next year if the BoJ continues to buy bonds in 2015 to the tune of JPY 80tr per year.
This will clearly have an impact on South Korean exporters, who compete with Japanese producers in many markets. The relative performance of the Korea Composite Stock Price Index (KOSPI) to the Nikkei illustrates how Japanese companies have gained compared to South Korean competitors.
Real Effective Exchange Rates (BIS)
South Korea
Japan
Inde
x
70
80
90
100
110
120
130
140
1996 1998 2000 2002 2004 2006 2008 2010 2012 2014
Source: Macrobond
Nikkei vs Kospi
South Korea, KOSPI 50
Japan, Nikkei 225
Inde
x 20
10-0
1-02
70
80
90
100
110
120
130
140
150
160
170
2010 2011 2012 2013 2014
Source: Macrobond
The relative strength of the South Korean won (KRW) has led to a relative soft stance for Korean monetary policy. Money supply growth is approaching 10% and the policy rate has been cut by 125bp in 18 months down to 2%, a level not seen since the depth of the financial crisis in 2009. This is despite the fact that core inflation at the same time has doubled to close to 3%. No doubt, the aggressive Bank of Japan policy is having a spillover effect on South Korea. The situation is actually a little similar to the relationship between the ECB and the Swedish Riksbank.
Bond yields have also nosedived to a record-low 2.50 for the government 10-year bond. But although monetary conditions are expansionary, there has not yet been a dramatic impact on domestic demand conditions. Consumer confidence is rather bleak, resulting in relatively downbeat retail sales, and house prices are only rising moderately. Further depreciation of the Japanese yen might well put additional pressure for monetary easing in South Korea, in which case domestic demand is likely to pick up and compensate for adverse competitive conditions in export markets.
Jan Häggström, +46 8 701 197, jaha05
BoJ on a one-way
street
KRW’s strength has
softened monetary
policy; policy rate
now at its lowest
since 2009
Sector report, January 9, 2015
12
Shipbuilding: Slow steaming until 2016 demand pick-up The shipbuilding industry was a key reason for our trip to South Korea and Japan; these countries are of
global importance for the sector, with more than 50% of all ships being built (compensated gross tones, CGT)
in these countries. During our trip we met with the world’s two biggest shipbuilders, Hyundai Heavy and
Daewoo in South Korea, and with number five Mitsubishi Heavy Industries in Tokyo. We also met with a
smaller Korean shipbuilder, Hanjin, and the key Nordic suppliers to the shipbuilding industry of Alfa Laval,
Cargotec and Wartsila. The key common denominator from the meetings seemed to be that all of these
companies expect weak ship orders in 2015 following a very weak 2014 but that a general economic pick-up
will improve ship demand from 2016. For offshore, companies now seem to expect several hard years ahead.
Gas carrier demand signals are mixed. Based on our new knowledge and ship order data, we have built a
model to estimate 2015e-17e Marine orders and sales for the Nordic suppliers.
Executive summary Within Nordic engineering we maintain that shipbuilding-related orders are harder to estimate than most other segments despite access to ship order data on a monthly basis. Equipment order value by ship category and lead times makes estimates unusually difficult. In our search for a better understanding, we met with Hyundai Heavy Industry (global no. 1) and Daewoo Shipbuilding and Marine Engineering (DSME, global no. 2) in South Korea and Mitsubishi Heavy Industries (global no. 5) in Tokyo. We also met with the small Korean shipbuilder Hanjin and with all three big Nordic suppliers to the shipbuilding industry: Alfa Laval, Cargotec (MacGregor division) and Wartsila.
They all seemed to agree that ship orders will be weak in 2015 with a recovery expected in 2016. In 2015e, shipbuilders basically hope to book large container and LNG ship orders. The outlook for bulk ships, LPG carriers and offshore was said to be weak. On the back of this and the 2014 ship order collapse, we conclude that ship building-related orders are set to decline for Nordic suppliers in 2015.
The sole argument presented to us as to why 2016 ship orders might recover is a general global economic pick-up and yards offering heavy discounts, as they are getting increasingly desperate with overcapacity and too-low orders. We did not get the sense there would be new innovations or that any certain ship segment would see orders booming ahead. Notably, the merchant ship mini-boom in orders in H2 2013-Q1 2014 was driven primarily by heavy discounting and financing being available. As soon as order books at the yards were filled to a good level, yards hiked their prices, resulting in another collapse of orders. Due to lower oil prices the Koreans might be right about a general economic pick-up; but on the other hand, we note the record amount of vessels at anchor which could be run at healthy profitability with lower fuel costs, given that fuel typically amounts to ~50% of the total sailing cost in shipping.
South Korean yards are already starting to restructure, as 2014 orders have been far below budgeted levels, implying the order books are dropping below the critical two-year level at all major yards apart from DSME. The aim with restructuring for the Korean yards seems to be to regain competitiveness with cheaper Chinese yards (whose salaries are one third lower) for capacity in lower-tech merchant ships. They are forced to restructure, as it is obvious that offshore orders that filled the order books in 2010-13 will not come back soon. However, this strikes us as an act of desperation and not a long-term solution. Taking a 5-10 year perspective, we would bet that almost all production of merchant ships will move from South Korea
Companies we met
all expect weaker
orders in 2015, but
rising in 2016
Korean restructuring
a desperate act
against longer-term
perspective of China
taking over merchant
ship production
Sector report, January 9, 2015
13
to China. This would not be an issue for the Nordic suppliers that have equally good market positions in China as in South Korea.
We argue there are three reasons for the abnormally large ship orders in 2010-14:
High energy prices boosted orders for offshore vessels and gas carriers but also for new energy-efficient merchant vessels.
Too much shipbuilding capacity was built up in 2006-08, based on China’s seemingly endless need for raw materials and the world facing an energy challenge. Yards with too much capacity at hand enjoyed strong earnings in 2011-12 from old orders but almost all profits are now eroded, implying heavy discounting cannot continue. Instead, we expect shipbuilders to accelerate dock closures.
Cheap financing with private equity became an important source of financing during times of unusual central bank policies, with some regular banks exiting ship financing due to the high risks.
Looking ahead, we fear that all three of these factors will turn more negative, with the result of a reduced normal state for the shipbuilding industry. The oil price has been cut in half, implying there is less incentive to order new, more fuel-efficient vessels, and it looks as though a new ‘Ice Age’ awaits offshore investments. We also fear that lower oil prices will spill over into disappointingly low orders for gas carriers.
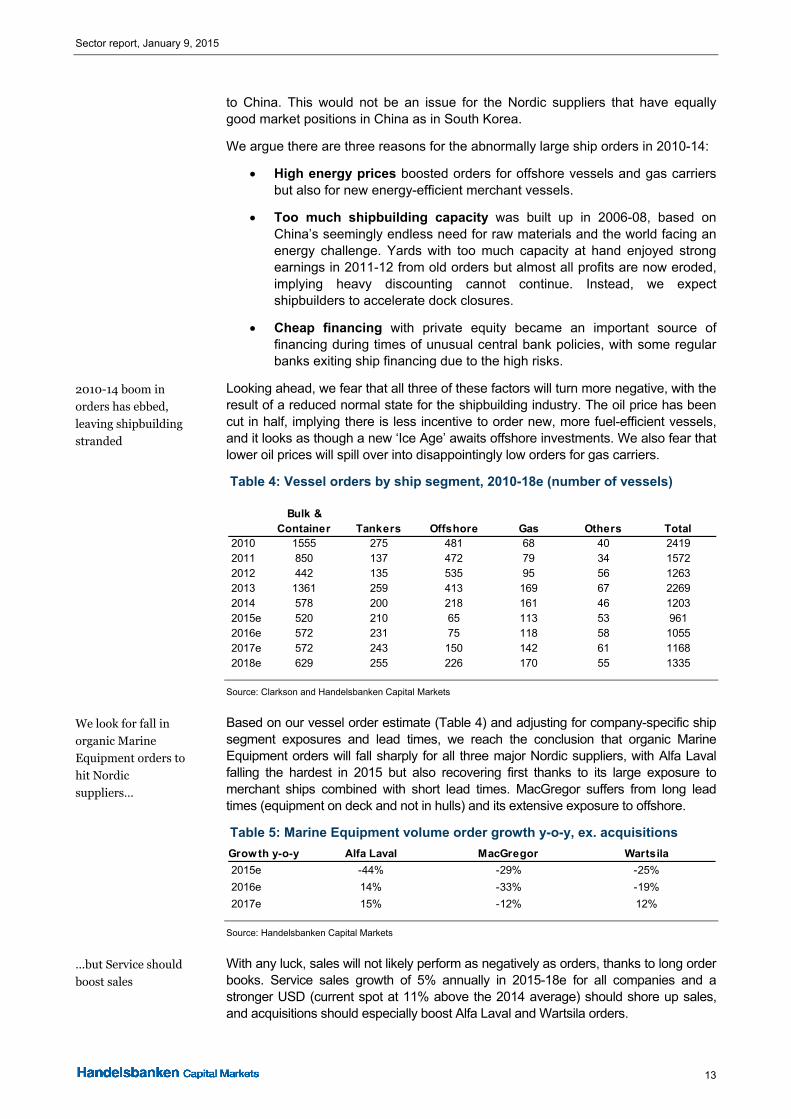
Table 4: Vessel orders by ship segment, 2010-18e (number of vessels)
Source: Clarkson and Handelsbanken Capital Markets
Based on our vessel order estimate (Table 4) and adjusting for company-specific ship segment exposures and lead times, we reach the conclusion that organic Marine Equipment orders will fall sharply for all three major Nordic suppliers, with Alfa Laval falling the hardest in 2015 but also recovering first thanks to its large exposure to merchant ships combined with short lead times. MacGregor suffers from long lead times (equipment on deck and not in hulls) and its extensive exposure to offshore.
Table 5: Marine Equipment volume order growth y-o-y, ex. acquisitions
Source: Handelsbanken Capital Markets
With any luck, sales will not likely perform as negatively as orders, thanks to long order books. Service sales growth of 5% annually in 2015-18e for all companies and a stronger USD (current spot at 11% above the 2014 average) should shore up sales, and acquisitions should especially boost Alfa Laval and Wartsila orders.
Bulk & Container Tankers Offshore Gas Others Total
2010 1555 275 481 68 40 24192011 850 137 472 79 34 15722012 442 135 535 95 56 12632013 1361 259 413 169 67 22692014 578 200 218 161 46 12032015e 520 210 65 113 53 9612016e 572 231 75 118 58 10552017e 572 243 150 142 61 11682018e 629 255 226 170 55 1335
Growth y-o-y Alfa Laval MacGregor Wartsila
2015e -44% -29% -25%
2016e 14% -33% -19%
2017e 15% -12% 12%
2010-14 boom in
orders has ebbed,
leaving shipbuilding
stranded
We look for fall in
organic Marine
Equipment orders to
hit Nordic
suppliers…
…but Service should
boost sales

Sector report, January 9, 2015
14
Table 6: Marine sales growth y-o-y in reported currencies*
Source: Handelsbanken Capital Markets
* Including acquisitions and Service
Exposure of Nordic suppliers to the shipbuilding industry Alfa Laval, Cargotec and Wartsila have remained key suppliers to the shipbuilding industry even though production of ships has moved almost completely to Asia. All Nordic suppliers have a very strong market position in South Korea, which for these suppliers is at least as important as the other leading shipbuilding nation of China.
To put Nordic supplier shipbuilding exposures into perspective, we begin by looking at the amount of sales in EURm that Nordic suppliers have to the Marine industry.
Figure 2: Nordic suppliers, Marine sales (EURm) in 2014e
Source: Handelsbanken Capital Markets
This means that Wartsila is the company having the largest relative exposure to the Marine industry for both sales and profits.
Figure 3: 2014e Marine exposure in Alfa Laval, Cargotec and Wartsila
Source: Handelsbanken Capital Markets
Alfa Laval MacGregor Wartsila
2015e 21% 12% 13%
2016e 2% -17% -4%
2017e 3% -11% -4%
0
500
1000
1500
2000
2500
3000
Alfa Laval Cargotec-MacGregor Wartsila
Equipment Service
0%
10%
20%
30%
40%
50%
60%
Alfa Laval Cargotec-MacGregor Wartsila
% of 2014e Sales % of 2014e EBIT
Wartsila has largest
relative exposure to
Marine
Wartsila is the big
play on shipbuilding
in the Nordics but it
is geared towards
specialised ships
rather than
merchant ships

Sector report, January 9, 2015
15
Next we notice that Wartsila, thanks to its huge installed base and relatively service-intensive products, has the greatest share of its Marine sales in Service. 97% of Wartsila’s Service sales are made to the company’s own installed base, and roughly half of Service sales are generated from spare parts and a quarter from field service, with the rest coming from projects and long-term contracts.
Figure 4: Share of Marine sales in Service
Source: Handelsbanken Capital Markets
Finally, we study the extent of exposure for each supplier by different ship segment. Here we note MacGregor has no sales to oil or gas tankers or any other special vessels apart from offshore. We also note Alfa Laval is very exposed to merchant vessels.
Figure 5: Q1-Q3 2014 orders split by four key ship segments
Source: Handelsbanken Capital Markets
Finally, we look at how large a share of the Nordic suppliers’ orders in the first nine months of 2014 came from up-, mid- and downstream activities in oil and gas.
0%
5%
10%
15%
20%
25%
30%
35%
40%
45%
Alfa Laval Cargotec-MacGregor Wartsila
2014e share of Marine sales in Service
0%
10%
20%
30%
40%
50%
60%
Bulk & Container Tankers Offshore Gas Others
Alfa Laval Cargotec-MacGregor Wartsila
Wartsila has the
most developed
Service business out
of the three Nordic
Marine Equipment
suppliers
Very big differences
when it comes to
ship type exposures

Sector report, January 9, 2015
16
Figure 6: Oil & gas share of orders, Q1-Q3 2014, up-, mid- and downstream
Source: Handelsbanken Capital Markets
South Korean shipbuilding from past to present From a 30-year perspective the South Korean shipbuilding industry has been a major success story, as it has grown from nothing to the biggest shipbuilding nation in the world. However, in the aftermath of the financial crisis the Korean yards have struggled from increasingly fierce competition in merchant ships from Chinese yards. It appears as if the strong push to offshore will only be a temporary solution due to the foggy order outlook. Thus, Korean yards are now about to start restructuring to regain competitive ability against low-cost Chinese yards in the production of merchant ships.
Figure 7: Shipbuilding constantly moving between countries
Source: Wartsila and Clarksons
0%
5%
10%
15%
20%
25%
30%
Alfa Laval Cargotec Wärtsilä
Upstream Midstream Downstream
Tough future for
Korean yards despite
excellent history

Sector report, January 9, 2015
17
Table 7: Major yards in South Korea
Source: Wartsila
Profitability collapsing at major South Korean yards, triggering restructuring South Korean shipbuilding peaked in 2011 when 500 vessels were delivered, while approximately 400 will be delivered in 2014 with Hyundai Heavy Industry (HHI) representing half of the value. As the Chinese yards have improved significantly, the Korean yards have until recently managed to keep their leading position by switching production to more advanced ships, with offshore making up 60% (value in USD) of Korean yard orders in 2012. However, due to the lower oil price, this has now turned into a problem as the share of offshore has fallen to only 15% in the first nine months of 2014 while total orders have also collapsed.
Despite offshore deliveries still being high on the back of strong orders in 2011-13, the South Korean shipyards are currently fighting financial difficulties, with many struggling to deliver profits. 2014 is proving to be an even more difficult year than the tough 2013.
With 2014 orders disappointing, we think the outlook is far from promising for the South Korean yards. In H1 2014, South Korean shipbuilders won orders valued at USD 3.9bn, which is only 26% of the communicated FY 2014 target of USD 15bn. With yards not expressing any confidence in an order recovery in 2015 during our meetings and basically only pointing out hopes of a 2016 order recovery being based on improving global economic growth, we fear that the South Korean shipyards face difficult times ahead.
Offshore made up
only 15% of orders at
Korean yards in Q1-
Q3 2014 vs. 60% in
2012
Profitability already
low at Korean yards
despite still very high
delivery volumes

Sector report, January 9, 2015
18
Figure 8: Adj. net income (EURm) for top four South Korean shipbuilders
Source: FactSet
Figure 9: Share prices* for top South Korean shipbuilders
Source: FactSet
*EUR indexed to 100 five years ago
South Korean yards look set to lose market shares to Chinese yards During the boom years of 2005-08, Chinese yards built up massive but mostly unproductive capacity (a huge number of small yards). The South Korean yards still enjoy a size and productivity advantage over Chinese yards, but as the remaining Chinese yards improve and as Chinese salaries are about one third of Korean pay, it is not a wild guess to bet on Chinese yards increasing their market shares in the coming ten years.
The question, in our view, is whether any merchant ship production will be left in South Korea by 2025, or if Korean yards will fully concentrate on special ships. (During our trip, we heard Koreans even talking about starting to build cruise ships that are still made predominantly in Europe.) After the 2009 crisis many Korean yards have focused strongly on offshore applications. However, even if Korean yards shift entirely to special ships such as offshore and gas carriers, they will remain top customers for Alfa Laval, Cargotec and Wartsila, which all are important suppliers to special ship types.
-500
0
500
1,000
1,500
2,000
2,500
2009 2010 2011 2012 2013
Hyundai Heavy Industries Co., Ltd.
Daewoo Shipbuilding & Marine Engineering Co., Ltd
Samsung Heavy Industries Co., Ltd.
Hanjin Heavy Industries & Construction Co., Ltd
050
100150200250300350400
14/12/09 14/12/10 14/12/11 14/12/12 14/12/13
Hyundai Heavy Industries Co., Ltd. (Rebased)
Daewoo Shipbuilding & Marine Engineering Co., Ltd (Rebased)
Samsung Heavy Industries Co., Ltd. (Rebased)
Hanjin Heavy Industries & Construction Co., Ltd (Rebased)
Chinese salaries
appear to be about
one third of South
Korean
Korean merchant
shipbuilding clearly
at risk but Korean
yards will remain key
customers to Nordic
suppliers due to
strong position in
special vessels
Sector report, January 9, 2015
19
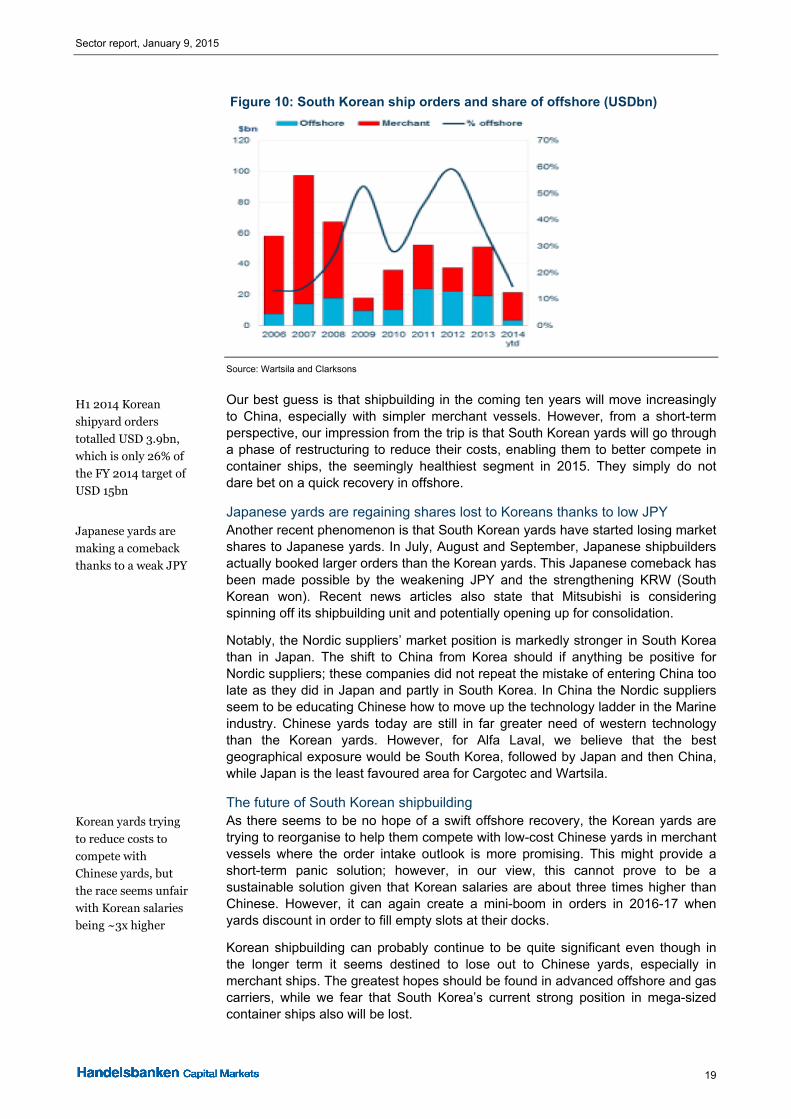
Figure 10: South Korean ship orders and share of offshore (USDbn)
Source: Wartsila and Clarksons
Our best guess is that shipbuilding in the coming ten years will move increasingly to China, especially with simpler merchant vessels. However, from a short-term perspective, our impression from the trip is that South Korean yards will go through a phase of restructuring to reduce their costs, enabling them to better compete in container ships, the seemingly healthiest segment in 2015. They simply do not dare bet on a quick recovery in offshore.
Japanese yards are regaining shares lost to Koreans thanks to low JPY Another recent phenomenon is that South Korean yards have started losing market shares to Japanese yards. In July, August and September, Japanese shipbuilders actually booked larger orders than the Korean yards. This Japanese comeback has been made possible by the weakening JPY and the strengthening KRW (South Korean won). Recent news articles also state that Mitsubishi is considering spinning off its shipbuilding unit and potentially opening up for consolidation.
Notably, the Nordic suppliers’ market position is markedly stronger in South Korea than in Japan. The shift to China from Korea should if anything be positive for Nordic suppliers; these companies did not repeat the mistake of entering China too late as they did in Japan and partly in South Korea. In China the Nordic suppliers seem to be educating Chinese how to move up the technology ladder in the Marine industry. Chinese yards today are still in far greater need of western technology than the Korean yards. However, for Alfa Laval, we believe that the best geographical exposure would be South Korea, followed by Japan and then China, while Japan is the least favoured area for Cargotec and Wartsila.
The future of South Korean shipbuilding As there seems to be no hope of a swift offshore recovery, the Korean yards are trying to reorganise to help them compete with low-cost Chinese yards in merchant vessels where the order intake outlook is more promising. This might provide a short-term panic solution; however, in our view, this cannot prove to be a sustainable solution given that Korean salaries are about three times higher than Chinese. However, it can again create a mini-boom in orders in 2016-17 when yards discount in order to fill empty slots at their docks.
Korean shipbuilding can probably continue to be quite significant even though in the longer term it seems destined to lose out to Chinese yards, especially in merchant ships. The greatest hopes should be found in advanced offshore and gas carriers, while we fear that South Korea’s current strong position in mega-sized container ships also will be lost.
H1 2014 Korean
shipyard orders
totalled USD 3.9bn,
which is only 26% of
the FY 2014 target of
USD 15bn
Japanese yards are
making a comeback
thanks to a weak JPY
Korean yards trying
to reduce costs to
compete with
Chinese yards, but
the race seems unfair
with Korean salaries
being ~3x higher

Sector report, January 9, 2015
20
South Korea enjoys a very strong market position in gas carriers Wartsila is today the only complete supplier of gas solutions in ships and its market share is above 70% in LNG carriers produced in South Korea. Thus, Korea’s strong push in LNG carriers should benefit Wartsila. This is also important for Alfa Laval given the value of equipment in those ships. We got the impression that South Korean yards are strongly pushing LNG-fuelled merchant vessels. However, we also sensed that it is too early to bet on merchant ships turning to gas in the next couple of years also in newbuilds. Most definitely the strong slide in the oil price will further postpone this transfer to LNG fuelled Merchant ships. However, this trend presents an interesting long-term opportunity for South Korean yards and Wartsila. For Alfa Laval, though, a transformation to gas engines might slightly drive up value for equipment aside from the engines, but scrubbers would not be needed, which would negative some of the benefits to Alfa from a switch to LNG.
The likely outcome of this is that South Korean yards must restructure and cut prices heavily. However, we do not believe Wartsila and Alfa Laval will be forced, to any major extent, to cut their prices despite ship prices falling. Another key conclusion from our meeting was that it still feels too early to bet on merchant ships turning to LNG as a main fuel in the next couple of years.
‘Koreanisation’ and its impact for Nordic suppliers South Korea is ambitiously climbing the technology ladder in shipbuilding, as shown by the manufacturing of advanced offshore vessels taking place now mainly by Korean shipbuilders. In Korea there is a strong push for Koreanisation, i.e. the use of more technologies developed and produced in South Korea. This might naturally be a long-term threat to companies such as Alfa Laval, Wartsila, Cargotec and Rolls-Royce. However, we still got the impression that the Korean companies have not really managed to position themselves to, for instance, take the lead in 4-stroke mid-speed engines due to lack of a service network and references, despite HHI having produced Himsen engines for more than a decade.
In our view, it actually appeared as if the Korean engineering skills are in material technology (strength of materials, etc.) rather than in developing new shipping concepts and fuel-saving designs. It appears that the epicentre of this innovation is still in Norway. According to Wartsila, Koreans are slowly building Service capabilities, but it will take many years before they become a threat to companies such as Wartsila and Alfa Laval.
Things to consider when studying the outlook for ship orders Long-term ship orders are naturally a function of demand/supply in sea transportation. However, the world is not quite that simple. Thus, we continue by describing other key drivers for ship orders that must be taken into account when building our forecast models.
Number of ships ordered and value are two completely different things A mega-sized 19,000 TEU container ship is priced at only USD 120m (according to HHI) vs. the largest bulk ship (Capesize) carrying a price of USD 550m (according to DSME), while the price of a FPSO stretches up to USD 2-3bn or more per unit. There is also a great variation between the different ship segments when it comes to the delivery value per vessel for the Nordic suppliers.
Korean yards
strongly pushing
LNG-fuelled
merchant vessels but
customers do not
seem eager to order
in coming years
Still too early to bet
on merchant ships
turning to LNG as a
main fuel
Strong push for more
local content but lack
of Korean innovation
in shipbuilding
despite excellent
quality

Sector report, January 9, 2015
21
Figure 11: Ship orders by type and country
Source: Samsung Heavy Industries
Longer cycles than in other industries Delivery times are generally exceptionally long in the shipbuilding industry but they also vary greatly between different ship segments. Merchant ships typically have two years from order to delivery while offshore vessels have three years and FPSOs four years, and oil platform order-to-deliver times stretch even to five years.
During our meetings in South Korea, we concluded that shipbuilders think an order backlog of two to two and a half years is ideal. If the order backlog goes below two years, the yards typically start heavy discounting. Currently 97% of all shipbuilders today have a backlog below two years, according to DSME, which itself has a backlog of 2.3 years.
The long cycles in the shipbuilding industry mean book-to-bill goes from very low to very high levels. When prices bottom out, some customers typically start speculative buying, and then everybody is in a hurry to order.
China has overtaken
South Korea’s
leading position as
ship builder

Sector report, January 9, 2015
22
Table 8: DSME ship orders and backlog
Source: DSME
Figure 12: Yard contracting and deliveries
Source: Alfa Laval, Clarksons
Pricing New shipbuilding prices recovered as the big yards returned to a healthy order book length during the mini-boom in H2 2013 and Q1 2014. This triggered shipbuilders to raise prices but orders disappeared immediately, signalling there are no strong underlying fundamentals at the moment.
At the end of October 2014 the world’s largest shipbuilder, HHI, had booked vessel orders YTD amounting to USD 4,936m, while the FY 2014 target has been set at USD 9,150m, implying that only 54% of the 2014 target had been reached with
H2 2015 and Q1
2014 saw a rebound
that has played out

Sector report, January 9, 2015
23
only two months left in the year. No doubt, we are again approaching a heavy discounting season.
According to DSME the price of a ship is the most important factor, followed by lead time and quality. This naturally differs depending on ship type and owner. The expected lifetime for a vessel starts at 20 years for a simple carrier and ranges up to 40 years for an oil production structure.
Figure 13: Newbuild price trend
Source: HHI and Clarksons
Scrap prices Another factor to take into account is the scrap prices of vessels due for retirement. The Chinese government has worked with this tool, for instance, when shipyards have had low order books.
Financing European banks were the key sources of financing until 2008, but their share has now fallen from 80% to 60% with some major banks exiting ship financing. When no one else ordered vessels, private equity suddenly began to order ships.
Currency swings between shipbuilding nations Currency movements make up the greatest cost item between shipbuilding nations that yards cannot control or hedge longer term. Currently, Japan is making a comeback in shipbuilding thanks to the low JPY.
‘Invest or die’ phenomenon The shipping industry has through the years experienced a lot of technological breakthroughs that have reduced the cost of shipping. As soon as one shipping company orders a more fuel-efficient vessel, its competitors must do the same to stay competitive. Currently, this can be seen in Maersk’s Triple E 18,000-TEU container ships soon getting competition from even larger container vessels.
In addition to larger ships, key innovations have been revolutionary hull designs and slow steaming. Our impression after visiting South Korea and Japan is that innovations still come mainly from Europe.
Large need for global aftersales activities Many buy ships purely on speculation. These and basically all advanced shipowners want to own a liquid asset that can be sold. This however demands well-known brands and global aftersales on everything that can break down. Based on our meetings, we conclude that the South Korean shipbuilders are slowly trying
Big drop in newbuild
prices in 2009-10,
followed by
stagnancy

Sector report, January 9, 2015
24
to build up service activities, but that western companies still have more than a twenty-year head start in this field.
Green shipping Shipping is subject to limited regulation when compared to land-based traffic. However, things are now changing with the IMO introducing new regulations on SOx and NOx emissions and ballast water treatment.
Different dynamics in different shipping segments Ship buyers also need to take the different business dynamics into account. Within LNG, LPG and FSRU, more than 80% of the vessels run on charter rates, while spot rates are usual in bulk and container shipping. A higher share of charter rates naturally decreases the risk level when ordering a ship.
Order intake comments by ship segment from companies we met in Asia We start by highlighting comments made by the companies we met on the different ship types:
Bulk: The bulk shipping market may improve in line with global economic recovery from 2015 (DSME). The problem is that the economic recession in emerging markets has slowed down the need for iron ore. However, will the low raw material prices turn into a demand improvement? Hanjin foresees that bulk shipping will remain poor.
Container: All of the companies we met see the greatest chance for 2015 order growth in container ships.
Figure 14: Trade fleet growth and container ship orders
Source: Samsung Heavy Industries and Clarksons
Tanker: There are signs of demand picking up, according to general comments by the companies we met. Hanjin sees some demand for crude oil and chemical bunkers. The low oil price should support demand for gasoline and diesel.
Gas: Strong growth for global LNG demand is pushing the LNG industry to embrace the concept of FSRU, which could replace onshore storage terminals. LNG trading volumes will increase with Australia’s exports of offshore gas and US shale gas from 2017. Considering a three-year building period, ship owners need to place LNG orders by 2015 at the latest to meet the exporting schedule in 2017. 410 LNG vessels today are in operation out of a total global vessel fleet of more than 22,000. DSME sees 10-15% CAGR in LNG carriers in the next ten years. However, what would happen to investment with a lower oil price? There was news out on December 3 that Petronas informed the government of Canada that it will defer a decision on a huge USD 36bn LNG export terminal complex proposed for the West Coast of Canada. Also, Santos, which is developing a huge LNG project in Australia, announced that it is delaying a plan to raise capital and that it plans to make significant cuts to both capex and opex in 2015.
Fleet capacity
outgrowing trade
growth for many
years, forcing
shipping companies
to also anchor fairly
new vessels

Sector report, January 9, 2015
25
LPG: Many LPGC orders have already been placed so additional orders could be limited, according to DMSE.
LNG: DSME said that the outlook for LNG carriers is better for LNG than for LPG. The key argument is that significant infrastructure projects are in the pipeline. However, this might change with a lower energy price, when the attractiveness of LNG as a substitute for oil decreases, which also implies a narrower price difference between US gas and Russian gas. In Japan, however, Mitsubishi Heavy Industry said it is not seeing any gas turbine orders, suggesting Japan will soon restart a significant share of its currently closed nuclear power plants. The company also said that the LNG ship orders it has booked recently should be seen as replacement orders, rather than Japan preparing for a nuclear-free future in which gas would be a more important component in energy generation.
Background to our ship order intake forecasts Based on comments from the companies we met in Asia and on the recent oil price collapse, we have every reason to believe 2015 will be difficult for Asian shipyards and thereby, with company-specific lags, the year will also be tough for Nordic equipment suppliers. We highlight that ship order comparisons y-o-y remain very difficult in Q1 2015e.
Ship orders have at least partly been better than they rationally should have been in 2010-14, given the high amount of ships at anchor.
Figure 15: Anchored vessels and fleet development
Source: Wartsila and Bloomberg
We maintain that three reasons pushed ship orders unrealistically high in 2010-14 and increased the risk of a catch-up period in 2015-18:
High energy prices boosted ship orders to irrational levels
Shipbuilding capacity built up during the boom years will now be closed
Cheap financing for shipbuilding might end
High energy prices boosted ship orders to irrational levels High energy prices in 2010-14 pushed up orders for offshore vessels and gas carriers but also for new energy-efficient merchant vessels. Now the oil price has been cut in half, implying vessels put at anchor can again be used profitably. We also fear there will be a coming ‘Ice Age’ for offshore investments and that spillover effects will lead to lower-than-expected demand for gas carriers.
Shipbuilding capacity built up during boom years will now be closed Too much shipbuilding capacity was built up in 2006-08. Before the boom an average of 1,500 ships were ordered annually, but at the peak of the boom as many as 5,000 ships were ordered in one year. China advanced greatly in shipbuilding during this hectic period, and all major Korean yards also invested
2015 likely to be the
Year of the Sheep in
orders, too
Slashed oil price
could float some
anchored vessels
Shipbuilding boom
has gone bust…

Sector report, January 9, 2015
26
heavily. Yards with too much capacity at hand have since then offered heavy discounting in 2010-14 to fill up capacity instead of closing down docks. Now, in contrast to 2011-12 when shipbuilders still delivered orders taken at great prices during the boom, the entire industry is suffering from low profitability. In our view, this suggests that yards will close down capacity and end crazy discounting. With lower capacity available, the number of ships ordered will also decline ahead, leading to a smaller available market for the Nordic equipment suppliers.
Cheap financing for shipbuilding might end Cheap financing with private equity becomes an important source of financing at times of unusual central bank policies, and some regular banks exited ship financing due to the high risks and a prolonged period of very low profitability in shipping in general. Unless private equity companies succeed in making profits on their investments in shipping, there is an increased risk that money available for shipbuilding will decrease ahead, as some banks have made irreversible decisions to exit ship financing.
Our ship order estimates 2014 ship orders were a great disappointment to shipyards, with hardly any reaching budgeted orders. This means almost all shipbuilders are starting 2015 with order books below optimal 2-year levels. DSME said as many as 97% of all shipbuilders currently have an order book below this benchmark.
Figure 16: 2014 growth y-o-y, in numbers of ships
Source: Clarkson
Based on the arguments presented above and on our impressions from meetings in South Korea and Japan, tough times will continue in 2015 at the least, despite yards offering hefty discounts. For 2015 we see scope for order growth only in tankers (lower oil prices should shoot up demand) and in ‘Others’, where strong consumerism coupled with new environmental regulations should lead to renewed interest in cruise ship and passenger ferry orders. Looking into 2016 we see a high likelihood for an order recovery especially in container ships.
Table 9: HCMe 2015-18 ship order growth y-o-y (number of ships)
Source: Handelsbanken Capital Markets
-70%
-60%
-50%
-40%
-30%
-20%
-10%
0%
Bulk & Container Tankers Offshore Gas Others
Bulk & Container Tankers Offshore Gas Others2015e -10% 5% -70% -30% 15%2016e 10% 10% 15% 5% 10%2017e 0% 5% 100% 20% 5%2018e 10% 5% 50% 20% -10%
…and shipbuilding
money likely to
tighten
Tanker, cruise ship
and ferry orders
could give some
relief to tough 2015e

Sector report, January 9, 2015
27
Table 10: Number of ships ordered annually by key segments
Source: Clarkson and Handelsbanken Capital Markets
We continue by presenting our scenario in detail for the five key different ship types for the 2015e-18e order intake outlook.
Bulk and container ship order intake outlook, 2015e-18e We expect bulk and container ship orders to fall moderately by 10% y-o-y in 2015 given tough comparisons in Q1. In 2016 we expect a 10% order recovery boosted by global consumption growth stemming from lower oil prices. Fundamentals are certainly negative for merchant ship orders at the moment, but simultaneously the world has an almost given shipbuilding capacity that can decrease only slowly, forcing yards to provide heavy discounting to sustain work. There is a record amount of ships at anchor and all of the companies we met in South Korea and Japan cannot see a 2015 recovery for bulk ship orders. Their pessimism is based on the slowdown of the Chinese economy and the great orders in 2013 that were boosted at least partly private equity companies entering the scene as major shipbuilding financers, when banks restricted lending to shipping in the aftermath of the financial crisis.
However, lower oil prices should start to boost private consumption and thereby the demand for container ships. Furthermore, the introduction of Maersk’s Triple E-class vessel is now forcing other container lines to order ultra-large container vessels if they want to stay in business. We understand that oil consumption per container is up to 40% lower in these ships than in five-year-old large container vessels. Finally, we also highlight that the short order books of many shipbuilders are forcing them to offer heavy discounting in 2015. However, on the negative side, we expect several ship yards to close in 2015 and Korean yards to start heavy restructuring for the first time, implying a decline in total shipbuilding capacity.
Figure 17: Bulk and container ship orders in number of ships, 12-month rolling
Source: Clarkson and Handelsbanken Capital Markets
Bulk & Container Tankers Offshore Gas Others Total
2010 1555 275 481 68 40 24192011 850 137 472 79 34 15722012 442 135 535 95 56 12632013 1361 259 413 169 67 22692014 578 200 218 161 46 12032015e 520 210 65 113 53 9612016e 572 231 75 118 58 10552017e 572 243 150 142 61 11682018e 629 255 226 170 55 1335
0
200
400
600
800
1000
1200
1400
1600
1800
2010-Q4
2011-Q1
2011-Q2
2011-Q3
2011-Q4
2012-Q1
2012-Q2
2012-Q3
2012-Q4
2013-Q1
2013-Q2
2013-Q3
2013-Q4
2014-Q1
2014-Q2
2014-Q3
2014-Q4
2015-Q1e
2015-Q2e
2015-Q3e
2015-Q4e
2016-Q1e
2016-Q2e
2016-Q3e
2016-Q4e
2017-Q1e
2017-Q2e
2017-Q3e
2017-Q4e
2018-Q1e
2018-Q2e
2018-Q3e
2018-Q4e
Merchant (Bulk & Container)
10% y-o-y drop
expected in 2015e
Maersk Triple E
could spur ultra-
large orders

Sector report, January 9, 2015
28
Oil and chemical tanker orders in 2015e-18e We expect the lower oil price to increase demand for oil and chemical products in the coming years. Thus, there will be a greater need for oil and chemical transportation capacity.
Figure 18: Oil & chemical tanker orders in number of ships, 12-month rolling
Source: Clarkson and Handelsbanken Capital Markets
Offshore vessel orders in 2015e-18e We expect offshore orders to remain under severe pressure given the low oil price. As the oil price seems lately to have stabilised at a low level, nobody seems willing any more to speculate about a quick price recovery to USD 100/bbl. Thus, we fear offshore orders will be weaker for a longer period, and some observers are starting to speculate about a new ‘Ice Age’ for deepwater oil investments. Notably, yards have some time to adjust capacity and wait for a recovery, as delivery times are exceptionally long, with some deliveries for the current order book taking place in 2018.
Figure 19: Offshore ship orders in number of ships, 12-month rolling
Source: Handelsbanken Capital Markets
Gas carrier order outlook in 2015e-18e Shipbuilders and suppliers put great faith in strong gas carrier orders ahead. We argue that this could be a false hope, with this segment potentially providing the
0
50
100
150
200
250
300
350
2010-Q4
2011-Q1
2011-Q2
2011-Q3
2011-Q4
2012-Q1
2012-Q2
2012-Q3
2012-Q4
2013-Q1
2013-Q2
2013-Q3
2013-Q4
2014-Q1
2014-Q2
2014-Q3
2014-Q4
2015-Q1e
2015-Q2e
2015-Q3e
2015-Q4e
2016-Q1e
2016-Q2e
2016-Q3e
2016-Q4e
2017-Q1e
2017-Q2e
2017-Q3e
2017-Q4e
2018-Q1e
2018-Q2e
2018-Q3e
2018-Q4e
Merchant (Oil & Chemical tankers)
0
100
200
300
400
500
600
2010-Q4
2011-Q1
2011-Q2
2011-Q3
2011-Q4
2012-Q1
2012-Q2
2012-Q3
2012-Q4
2013-Q1
2013-Q2
2013-Q3
2013-Q4
2014-Q1
2014-Q2
2014-Q3
2014-Q4
2015-Q1e
2015-Q2e
2015-Q3e
2015-Q4e
2016-Q1e
2016-Q2e
2016-Q3e
2016-Q4e
2017-Q1e
2017-Q2e
2017-Q3e
2017-Q4e
2018-Q1e
2018-Q2e
2018-Q3e
2018-Q4e
Offshore
Lower oil price
expected to keep
tanker orders
buoyant
Offshore orders
taking a hit from
sagging oil price

Sector report, January 9, 2015
29
biggest disappointment in 2015, when we expect orders to fall by 30% y-o-y when calculating the number of vessels.
The yards we visited in Asia remained optimistic about the gas carrier order outlook, even if they acknowledge LPG orders likely will decline from exceptionally high levels. However, the outlook for LNG vessels was said to be quite robust.
However, after we heard these statements, the oil price has fallen so sharply that we fear some potential buyers of LNG ships will postpone planned orders while they watch what happens to energy prices generally. Perhaps shipping gas from the US to Europe is not such a great idea after all if the oil price stabilises at USD 50/bbl or even lower. Order volumes should not implode, however, as some 80% of gas carriers run on long-term charter rates. However, in the longer term, gas carriers should be a growth segment due to the environmental benefits of gas vs. oil. Thus, we expect a moderate 5% order recovery in 2016 followed by even stronger growth in 2017e-18e.
‘Other’ ship segment order outlook in 2015e-18e We expect orders for ‘Other’ special ship segments (including fishing boats, harbor tugs, cruise ships, ferries, Ro-Ro wheeled cargo carriers, etc.) to show the best growth in the coming years. The outlook seems especially promising for cruise ship orders given US consumer strength and the evolution of cruise holidays in Asia. Ferry and RoRo vessel orders can also be boosted by strengthened SOx emission rules which are now being enforced.
Figure 20: Gas and Other ship orders in number of ships, 12-month rolling
Source: Handelsbanken Capital Markets
Our order intake forecast model for Alfa, MacGregor and Wartsila Ship Power After presenting our vessel order scenario above, we continue by studying the Nordic suppliers’ different exposures by the five ship types: Bulk and container, Tankers, Offshore, Gas and Others. We then look at the demand outlook by different ship segment and thus obtain an estimate for 2015-17 equipment order growth for within the respective marine businesses of Alfa Laval, Cargotec (MacGregor) and Wartsila.
0
50
100
150
200
2502010-Q
42011-Q
12011-Q
22011-Q
32011-Q
42012-Q
12012-Q
22012-Q
32012-Q
42013-Q
12013-Q
22013-Q
32013-Q
42014-Q
12014-Q
22014-Q
32014-Q
42015-Q
1e2015-Q
2e2015-Q
3e2015-Q
4e2016-Q
1e2016-Q
2e2016-Q
3e2016-Q
4e2017-Q
1e2017-Q
2e2017-Q
3e2017-Q
4e2018-Q
1e2018-Q
2e2018-Q
3e2018-Q
4e
Gas Others
Long-term charter
rates should help
2016e order recovery
Consumer strength
steering ‘Other’
outlook

Sector report, January 9, 2015
30
Figure 21: Q1-Q3 2014 orders split by five key ship segments
Source: Handelsbanken Capital Markets
The next step is to note the significant differences in lead times from the vessel order to when the Nordic supplier books its orders. The reason for MacGregor’s comparatively long lead times is that its equipment is installed on the topside of a vessel, while Alfa Laval and Wartsila deliver equipment built into the hull of a vessel.
Table 11: Lead times from vessel order to equipment order, by ship type
Source: Handelsbanken Capital Markets
To smooth out the order volumes, compared to the hefty volatility in vessel orders that might show extreme peaks and valleys, we distribute the 6-18 month lead times between quarters.
Table 12: Lead time distribution
Source: Handelsbanken Capital Markets
Compiling the order and lead time information, and also adjusting for seasonality patterns, we conclude that 2015e will be a very tough year for the Nordic suppliers, with Alfa Laval, MacGregor and Wartsila showing organic equipment order declines of 44%, 29% and 25% respectively. Tough times should first turn into order growth for Alfa Laval, thanks to its large exposure to container vessels and oil tankers combined with the relatively short lead times. In contrast MacGregor will continue to suffer in 2016e and 2017e due to its long lead times and substantial exposure to offshore.
0%
10%
20%
30%
40%
50%
60%
Bulk & Container Tankers Offshore Gas Others
Alfa Laval Cargotec-MacGregor Wartsila
Alfa Laval MacGregor Wartsila
Bulk & Container 6 12 6
Tankers 6 12 6
Offshore 6 18 12
Gas 6 12 9
Others 6 12 6
Months/Quarter -3 -2 -1 0 1 2 3
6 15% 60% 25%
9 5% 15% 55% 20% 5%
12 5% 20% 45% 25% 5%
18 5% 10% 15% 35% 20% 10% 5%
Topside installation
draws out
MacGregor’s lead
time
Tough times await
Marine in 2015e, but
Alfa should rebound
more quickly

Sector report, January 9, 2015
31
Table 13: Marine Equipment order growth y-o-y in constant currencies ex. acquisitions
Source: Handelsbanken Capital Markets
However, reported Marine orders will not collapse this badly due to three reasons:
Ships are bought in USD and the USD/EUR spot rate is now 11% higher than the 2014 average
We expect Service orders to grow by 5% annually for all companies in 2015e-18e
Wartsila has just announced the acquisition of L-3, which boosts 2015e and 2016e sales by EUR 200m respectively. Alfa Laval has acquired Frank Moon, which adds significant revenues for 2014 and 2015. In 2015, Cargotec will gain some benefit by consolidating the Pusnes acquisition into results from February 1, 2014.
Taking these factors into account we expect total Marine orders in reported currencies to fall but not implode for the Nordic Equipment suppliers.
Table 14: Marine order growth y-o-y in reported currencies*
Source: Handelsbanken Capital Markets
* Including acquisitions and Service
Because of currently strong order books, sales will develop very differently than orders. At the end of Q3 2014 MacGregor’s and Wartsila’s order books were up by 33% and 5% y-o-y respectively. This means that at the end of Q3 the order books corresponded to 1.18x for MacGregor and 1.07x for Wartsila. Taking this into account 2015e will actually be a year of strong sales growth for all the Nordic suppliers while 2016e looks likely to be a demanding year.
Table 15: Marine sales growth y-o-y in reported currencies
Source: Handelsbanken Capital Markets
Table 16: Previous HCMe Marine sales growth, y-o-y
Source: Handelsbanken Capital Markets
Growth y-o-y Alfa Laval MacGregor Wartsila
2015e -44% -29% -25%
2016e 14% -33% -19%
2017e 15% -12% 12%
Alfa Laval MacGregor Wartsila
2015e -24% -16% -4%
2016e 15% -22% -3%
2017e 16% -6% 8%
Alfa Laval MacGregor Wartsila
2015e 21% 12% 13%
2016e 2% -17% -4%
2017e 3% -11% -4%
Alfa Laval MacGregor Wartsila
2015e 28% 15% 3%
2016e 9% 3% -4%
2017e 5% -21% -4%
Worse order collapse
prevented due to
currency, Service
and acquisitions
Sales picture not as
gloomy as forecast
orders
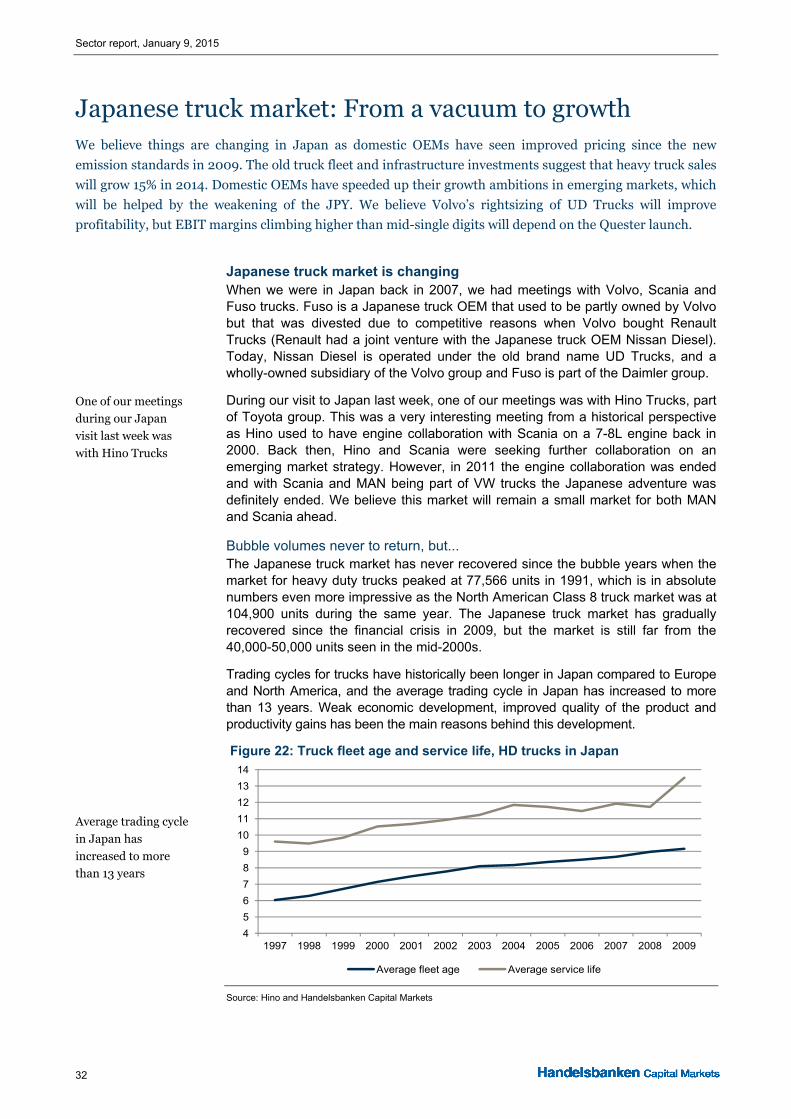
Sector report, January 9, 2015
32
Japanese truck market: From a vacuum to growth We believe things are changing in Japan as domestic OEMs have seen improved pricing since the new
emission standards in 2009. The old truck fleet and infrastructure investments suggest that heavy truck sales
will grow 15% in 2014. Domestic OEMs have speeded up their growth ambitions in emerging markets, which
will be helped by the weakening of the JPY. We believe Volvo’s rightsizing of UD Trucks will improve
profitability, but EBIT margins climbing higher than mid-single digits will depend on the Quester launch.
Japanese truck market is changing When we were in Japan back in 2007, we had meetings with Volvo, Scania and Fuso trucks. Fuso is a Japanese truck OEM that used to be partly owned by Volvo but that was divested due to competitive reasons when Volvo bought Renault Trucks (Renault had a joint venture with the Japanese truck OEM Nissan Diesel). Today, Nissan Diesel is operated under the old brand name UD Trucks, and a wholly-owned subsidiary of the Volvo group and Fuso is part of the Daimler group.
During our visit to Japan last week, one of our meetings was with Hino Trucks, part of Toyota group. This was a very interesting meeting from a historical perspective as Hino used to have engine collaboration with Scania on a 7-8L engine back in 2000. Back then, Hino and Scania were seeking further collaboration on an emerging market strategy. However, in 2011 the engine collaboration was ended and with Scania and MAN being part of VW trucks the Japanese adventure was definitely ended. We believe this market will remain a small market for both MAN and Scania ahead.
Bubble volumes never to return, but... The Japanese truck market has never recovered since the bubble years when the market for heavy duty trucks peaked at 77,566 units in 1991, which is in absolute numbers even more impressive as the North American Class 8 truck market was at 104,900 units during the same year. The Japanese truck market has gradually recovered since the financial crisis in 2009, but the market is still far from the 40,000-50,000 units seen in the mid-2000s.
Trading cycles for trucks have historically been longer in Japan compared to Europe and North America, and the average trading cycle in Japan has increased to more than 13 years. Weak economic development, improved quality of the product and productivity gains has been the main reasons behind this development.
Figure 22: Truck fleet age and service life, HD trucks in Japan
Source: Hino and Handelsbanken Capital Markets
4
5
6
7
8
9
10
11
12
13
14
1997 1998 1999 2000 2001 2002 2003 2004 2005 2006 2007 2008 2009
Average fleet age Average service life
One of our meetings
during our Japan
visit last week was
with Hino Trucks
Average trading cycle
in Japan has
increased to more
than 13 years

Sector report, January 9, 2015
33
…double-digit growth in 2014 In 2013, heavy duty truck sales in Japan amounted to 33,883 units. We expect the market in 2014 to reach close to 39,000 units from a combination of ageing truck population, improving business confidence and infrastructure investments from build-up following the Fukushima disaster but also investments ahead of the Olympics. We expect 2015 to continue on the growth lane as new JPN 16 emission standards in 2016 will pull forward investments in mid-2015.
Figure 23: Japan heavy duty truck market, >15 tonnes
Source: Industry and Handelsbanken Capital Markets
Locked pricing situation set to change One of our main lessons from 2007 relates to the tough pricing situation in Japan. It was impossible for the OEMs to increase prices even if they launched a new product. Any margin improvement or increasing cost from developing new products had to be absorbed by cost take-out and productivity gains. From talking to Hino, we understand that following the change to new emission standards (JPN 09) after 2009, this policy has loosened up and OEMs are gradually seeing some pricing power return.
Figure 24: Sales of heavy trucks >15 tonnes by OEMs in Japan, 2013
Source: Industry and Handelsbanken Capital Markets
-60%
-40%
-20%
0%
20%
40%
60%
0
10,000
20,000
30,000
40,000
50,000
60,000
70,000
80,000
90,000
1985 1988 1991 1994 1997 2000 2003 2006 2009 2012 2015e
Japan Heavy Duty truck registrations Growth
0
5,000
10,000
15,000
20,000
25,000
30,000
2010 2011 2012 2013
Hino Isuzu Fuso UD Others
In 2014 we expect
the Japanese HD
truck market to
reach close to
39,000 units, +15%
y-o-y
The locked pricing
situation in Japan is
gradually being
wrapped up

Sector report, January 9, 2015
34
Hino is the market leader The market is dominated by the four local players Hino, Fuso, Isuzu and UD Trucks, even though the western European players are represented in the market with CKD facilities. In 2013, Hino was the market leader with a 32% market share, followed by Isuzu with 28%. UD Trucks, which is part of the Volvo group, held a 19% share in the heavy duty segment.
Figure 25: Market share, HD truck OEMs in Japan, 2013
Source: Industry and Handelsbanken Capital Markets
A low-margin market The structurally lower volumes in Japan since the bubble years combined with four local players have resulted in a very competitive market. The tough pricing situation has made Japan a low-margin market with about a 3 p.p lower EBIT margin on average for the OEMs compared to average profitability for European and North American truck OEMs. However, growing demand in Japan and South East Asia as well as a gradual return of pricing power suggest that margins might be on the rise in Japan while the opposite has been the case in Europe and North America since the financial crisis.
Table 17: Japanese listed truck OEMs
Source: FactSet and Handelsbanken Capital Markets
Japanese OEMs to take up the fight over emerging markets Hino is one of the OEMs in Japan with a very clear strategy to expand in emerging markets. In 2013, Hino sold 205,000 trucks (LD, MD and HD), including the 50,000 Toyota-branded trucks. By 2020, Hino targets to expand further into the MEA region, LATAM, China and the rest of Asia, reaching a total 300,000 unit sales of
32%
28%
21%
19%
Hino Isuzu Fuso UD Others
Revenue (JPYbn) 2006 2007 2008 2009 2010 2011 2012 2013 20142015
(target)
Hino (FY ending March) 1,197 1,288 1,369 1,069 1,023 1,243 1,315 1,541 1,700 1,660
Isuzu (FY ending March) 1,582 1,663 1,925 1,425 1,081 1,416 1,400 1,656 1,761 1,850
EBIT 2006 2007 2008 2009 2010 2011 2012 2013 2014 2015
Hino (FY ending March) 41 37 46 -19 1 29 38 65 112 100
Isuzu (FY ending March) 91 107 110 22 11 88 97 131 174 165
EBIT-margin 2006 2007 2008 2009 2010 2011 2012 2013 2014 2015
Hino (FY ending March) 3.4% 2.9% 3.4% -1.8% 0.1% 2.3% 2.9% 4.2% 6.6% 6.0%
Isuzu (FY ending March) 5.8% 6.4% 5.7% 1.5% 1.0% 6.2% 7.0% 7.9% 9.9% 8.9%
Average 4.6% 4.6% 4.5% -0.1% 0.6% 4.3% 4.9% 6.1% 8.2% 7.5%
Japan is a mid-
single-digit EBIT
margin market

Sector report, January 9, 2015
35
heavy, medium and light duty trucks. By region, Hino targets to produce 60,000 units in Japan, 100,000 in the rest of Asia, 50,000 in Americas, and 10,000 in MEA.
Figure 26: Hino light, medium and heavy duty truck sales
Source: Hino and Handelsbanken Capital Markets
Figure 27: Hino truck sales, all weight classes (units)
Source: Hino and Handelsbanken Capital Markets
0
50
100
150
200
250
2005 2006 2007 2008 2009 2010 2011 2012 2013 2014
Produced in Japan for domestic market Produced in Japan for overseas market
Produced in Indonesia (Light duty) Toyota brand vehicle (Loading vehicle)
0
50
100
150
200
250
300
350
2008 2009 2010 2011 2012 2013 2014 2015 target Long term
Japan Overseas
Japanese OEMs to
take their fair share
of emerging markets
Hino targets to
increase truck sales
from 205,000 units
to 300,000 by 2020
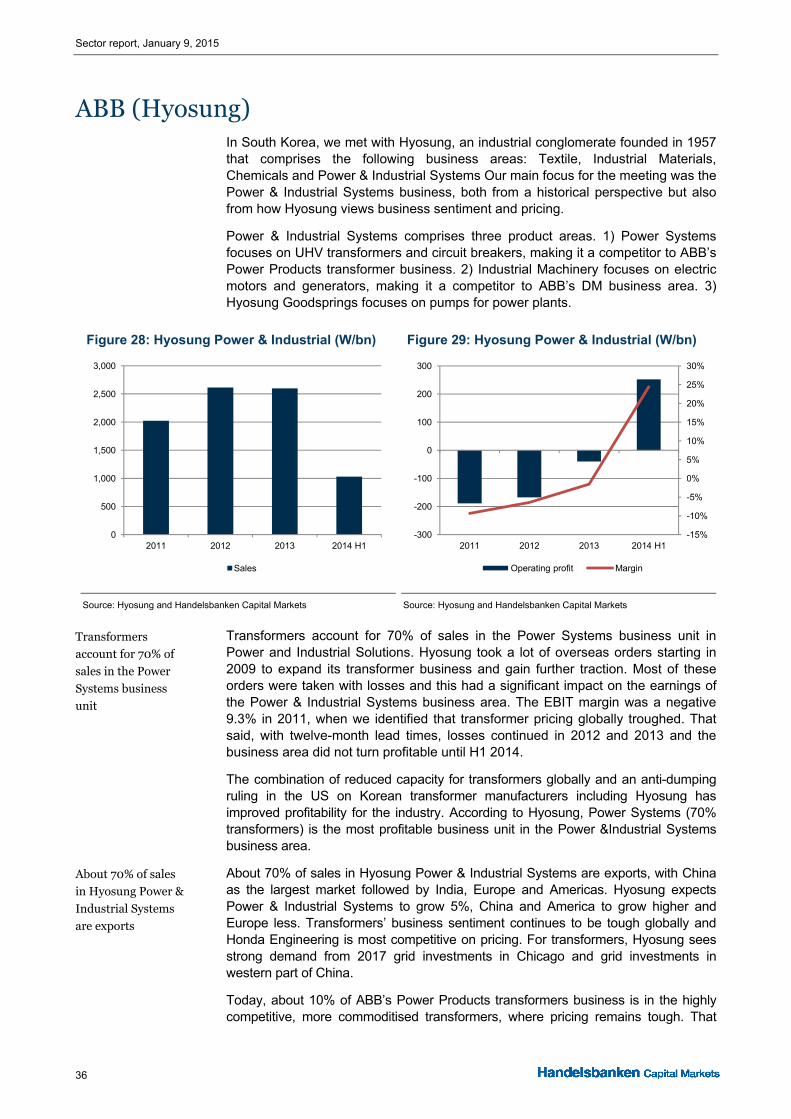
Sector report, January 9, 2015
36
ABB (Hyosung) In South Korea, we met with Hyosung, an industrial conglomerate founded in 1957 that comprises the following business areas: Textile, Industrial Materials, Chemicals and Power & Industrial Systems Our main focus for the meeting was the Power & Industrial Systems business, both from a historical perspective but also from how Hyosung views business sentiment and pricing.
Power & Industrial Systems comprises three product areas. 1) Power Systems focuses on UHV transformers and circuit breakers, making it a competitor to ABB’s Power Products transformer business. 2) Industrial Machinery focuses on electric motors and generators, making it a competitor to ABB’s DM business area. 3) Hyosung Goodsprings focuses on pumps for power plants.
Figure 28: Hyosung Power & Industrial (W/bn)
Source: Hyosung and Handelsbanken Capital Markets
Figure 29: Hyosung Power & Industrial (W/bn)
Source: Hyosung and Handelsbanken Capital Markets
Transformers account for 70% of sales in the Power Systems business unit in Power and Industrial Solutions. Hyosung took a lot of overseas orders starting in 2009 to expand its transformer business and gain further traction. Most of these orders were taken with losses and this had a significant impact on the earnings of the Power & Industrial Systems business area. The EBIT margin was a negative 9.3% in 2011, when we identified that transformer pricing globally troughed. That said, with twelve-month lead times, losses continued in 2012 and 2013 and the business area did not turn profitable until H1 2014.
The combination of reduced capacity for transformers globally and an anti-dumping ruling in the US on Korean transformer manufacturers including Hyosung has improved profitability for the industry. According to Hyosung, Power Systems (70% transformers) is the most profitable business unit in the Power &Industrial Systems business area.
About 70% of sales in Hyosung Power & Industrial Systems are exports, with China as the largest market followed by India, Europe and Americas. Hyosung expects Power & Industrial Systems to grow 5%, China and America to grow higher and Europe less. Transformers’ business sentiment continues to be tough globally and Honda Engineering is most competitive on pricing. For transformers, Hyosung sees strong demand from 2017 grid investments in Chicago and grid investments in western part of China.
Today, about 10% of ABB’s Power Products transformers business is in the highly competitive, more commoditised transformers, where pricing remains tough. That
0
500
1,000
1,500
2,000
2,500
3,000
2011 2012 2013 2014 H1
Sales
-15%
-10%
-5%
0%
5%
10%
15%
20%
25%
30%
-300
-200
-100
0
100
200
300
2011 2012 2013 2014 H1
Operating profit Margin
Transformers
account for 70% of
sales in the Power
Systems business
unit
About 70% of sales
in Hyosung Power &
Industrial Systems
are exports

Sector report, January 9, 2015
37
said, we believe this transformers business in ABB Power Products is a low double-digit margin business.
We do not believe pricing will improve further in transformers and most of ABB’s margin improvement is from the repositioning of the product offer in China and stepping out of less profitable segments.
Figure 30: ABB Power Products sales split
Source: ABB and Handelsbanken Capital Markets
Table 18: ABB Power Products sales channels and end markets
Source: Handelsbanken Capital Markets
Transformers
Medium Voltage
High Voltage
Distribution
Transmission
Generation
Industry
Mature
Emerging
Late
Mid
0%
10%
20%
30%
40%
50%
60%
70%
80%
90%
100%
Products Sectors Markets Cycles
% %Direct 55 Industry 33Indirect 45 Utility transmission 28
Utility distribution 26Power generation 13
We do not believe
pricing will improve
further in
transformers and
most of ABB’s
margin
improvements are
from structural
measures

Sector report, January 9, 2015
38
Alfa Laval (Alfa Laval, Wartsila, Cargotec, DSME, etc.) According to management, a lot of the companies look at Alfa Laval as a Japanese company since its history there dates back to 1925 when the first high-speed separator was imported from the US. Today, Alfa Laval (excluding Tranter and Frank Moon) employs 180 people in sales, 70 in production and has four service centres. Japan is home to the second largest plate heat exchanger plant outside Sweden. Around 60% is produced for the local markets. For example, welding is imported from Sweden and spirals from France, but plates get pressed locally for export to South East Asia and Korea. For Marine, the ratio is around 50%. In total, we believe Alfa Laval is a net importer. Japan reports to Asia as a region, which then reports to Sweden.
Japan (13% of Asia) accounts for some 4% of Alfa Laval orders and Korea ~5%. Marine accounts for about 28% of orders in Japan (excluding Tranter and Frank Moon, i.e. a larger share than 28% when incorporated). Services is some 29%, and growth is decent.
Alfa Laval plans for a slowdown in marine but argues that it can balance this with environmental products, aftermarket, etc. For regular marine, Alfa Laval agrees that orders and eventually sales will be lower ahead. Local management did not seem to be worried however as the shipyards have capacity which will lead to controlled deliveries and less variation in Alfa’s sales. The Japanese organisation is not planning any major changes due to the restructuring programme, but rather normal belly-buckling.
Figure 31: Alfa Laval, Japan order split
Source: Handelsbanken Capital Markets
Figure 32: Alfa Laval, Asia share of orders
Source: Handelsbanken Capital Markets
Alfa Laval highlighted growth opportunities in Japan and South Korea as being:
Significant energy imports create a need for greener energy forms.
Efficient energy usage and reduced waste. Technology shift in traditional process industry cooling applications to recover waste heat and save energy.
Construction and rebuilding ahead of 2020 Olympics. Alfa Laval is getting interest now but no orders yet. This will also stimulate the international business hub. On top of this, construction will benefit from the energy-saving trend.
LNG/LPG transportation leading to more specialised shipbuilding.
11%
13%
7%
12%
28%
29%
Industrial Equipment OEM Food & Pharma
Process Industry Marine & Diesel Parts & Service
4%6%
21%
68%
Japan South Korea Other Asia RoW
Alfa Laval’s history
in Japan dates back
some ninety years
Sector report, January 9, 2015
39
Emissions legislation and ballast water restrictions driving equipment demand (ballast water, SOx, oil waste recovery, etc.). There is massive interest in SOX (a fair in April 2014) and ratification in ballast is close, according to management. Alfa Laval has not had any cancellations so far, but agrees that this is likely given the lower oil price. Japanese ship owners show an early interest but will test before implementing, and Europeans are probably a bit earlier to implement.
Summary Energy imports and more efficient energy usage will boost demand for Alfa Laval in Japan and so will increase construction activity. The marine segment is the most important for Japan and Korea and faces a tough future (see the section on Shipbuilding and our separate research report on Alfa Laval, published alongside this sector report, for more details). Alfa Laval has a relatively good balance with locally produced products in Marine, but in total we consider the company to be a net importer in Japan, hurting earnings a bit due to FX reasons apart from translation effects. So if we combine a relatively large exposure (4% of orders in Japan and 5% in South Korea) with the tough marine outlook, Alfa does not score well compared to its peers.

Sector report, January 9, 2015
40
Atlas Copco (Atlas Copco, Komatsu, etc.) Atlas Copco has been present in Japan since 1979, but sold its first product in the country in 1912. All four business areas are present and Atlas has offices in 25 locations in 13 prefectures. Around 2% of group revenues derive from Japan. In Korea, the main business is Edwards (semiconductor focus towards Samsung) and sales represent (pro forma) around 2.5% of group revenues. In true Atlas manner, the company addresses the market through multi-brands, and Fuji, SCA, Edwards and Atlas are all present with their own entities in both countries. We guess that margins are lower than the group average and that Atlas is posting organic growth year-to-date in the region. Atlas has been lucky to have conducted acquisitions with a significant foothold in Japan (Drilling Solutions, SCA, Edwards and Fuji) as it is very hard to acquire in Japan in particular.
Table 19: Atlas Copco in Japan and Korea
Source: Handelsbanken Capital Markets
Compressor Technique Atlas finds its position relatively stronger in the high-end segment and does not have a distribution network like its competitors. Compressor Technique (CT) established operations in Japan in 1986, when the market was already mature. Kobelco, Hitachi and so on are all strong players. Atlas is however the only non-Japanese competitor and its position as the only foreigner should improve over time, as Atlas grows over the years and has an ambition to increase its distribution network, although a part of the market is not possible for Atlas to approach given the competition as part of conglomerates. With the recent weakening of the yen, local competitors are feeling relief that they can survive, which eases the situation somewhat. Investments are being made again after having been delayed, which partly balances the negatives in terms of earnings from a weak yen as the Atlas Copco brand imports a lot (both Fuji and Edwards are exporters). Still, the improved sentiment is not really visible in activity yet. Atlas’ aftermarket ratio is very high in Japan for CT.
Industrial Technique Atlas Industrial Technique’s strongest competitor in Japan is Uryu, but this company has revenues of only USD 70m and Atlas claims that Atlas has rather widened the gap toward the Japanese given its broadened product portfolio (both acquisitions and innovations). Atlas is number one in Japan with all its brands but not as big as in other markets. The domestic market is very fragmented as Uryu is small and probably exports 50%. Atlas hopes for more acquisitions of family-owned businesses.
Japan entities Korea entitiesAtlas Copco KK Atlas Copco KoreaFuji Industrial Technique Chicago Pneumatic Tools KoreaSCA Schucker Japan SCA Schucker KoreaEdwards Japan Edwards Korea
762 employees 1,054 employeesEstablished 1979 Established 1981
Present in Japan
since 1979 and in
Korea since 1981
Lacks distribution
network in Japan but
position set to
improve over time

Sector report, January 9, 2015
41
Mining and Rock Excavation Technique There are almost no mines in Japan, but on the other hand there is a lot of construction. Atlas has already seen some positive signs in terms of construction activity and it will get better. One example is the motorway construction between Tokyo and Niguygya, which is a ten-year project. There will also be effects from preparations for the 2020 Tokyo Olympics. Furukawa Rock Drill is the only competitor.
We met with Komatsu to discuss Mining demand globally. Our main impression from the meeting was that Komatsu expects rebuild activity to return soon and that units sold will be down another 34% in fiscal 2014 (former outlook of -40%) after a 51% drop in 2013. The forecast implies a slight drop in parts (-3% in JPY vs. +5% in the initial projection) and 10% growth in service (-7% former projection). Komatsu’s installed base of 15,000 machines over the past decade implies that equipment demand will pick up from the current 600 machines (from a peak of 2,200) back to 1,500 machines shortly. This implies rebuild activity, although machine utilisation has not changed from last year. On parts inventory, Komatsu expects smaller distributors to reduce inventory further. On pricing, Komatsu naturally claims that it will not use price and that there have been too many bad experiences in Japan during the nineties. However, Komatsu expects basically no price contribution, which is less than historically. Regarding Komatsu’s JV with GE on underground mining, the company is as secretive as always, but we sense that it could be about conveying.
Construction Technique Atlas is still very small but has put in some effort to increase its position. This has been a very competitive market and, although it has not been a focus area since the construction business area was formed in 2011, actions have been initiated. This means that construction activity will increase as a market in Japan, and Atlas will increase its market share. Concerns in the short and medium term regard shortage of labour, which might delay construction projects.
On Construction, Komatsu is worried about Chinese demand and the current low utilisation rate (at 200 hours per month versus 500) and recently cut its outlook for 2015. Also, Caterpillar is increasing its share in China and Komatsu says that it does not understand why CAT is so aggressive on prices. Local competition (like Sany) is now at 75-80 price index if CAT and Komatsu are at 100. In terms of aftermarket, Komatsu sees dull activity in China as it mainly sells excavators, which consume few parts in relation to other machines. Also, Komatsu is losing share to pirates. Like most others, Komatsu agrees that the US is strong, but in contrast to others, it warns that one should be a bit cautious with regard to projections for the US as 2014e is back at the high level seen in 2007.
Summary Atlas has around 2% of sales in Japan and 2.5% in Korea and has benefitted from acquisitions of companies in Japan (Fuji) or companies with presence in the region (Drilling Solutions, SCA, Edwards). We find the positive positioning journey in CT, IT and Construction interesting as well as good exposure to potentially better construction activity. So we see fairly good growth prospects for Atlas Copco in the region, helped by expansion plans from Samsung in South Korea. On global mining, Komatsu expects an improvement in rebuild activity soon while parts inventory destocking could continue a while longer. For construction globally, Komatsu paints a very bleak picture in China and raises a warning finger against the standard view that US construction activity will just continue to rise.
Atlas has already
seen some positive
signs
Komatsu expects
rebuild activity to
return
Distributors
reducing inventory
Demand and share
to help Atlas, but
lack of labour is a
concern
China looks very
bleak and the US
should be looked
upon with a degree
of caution
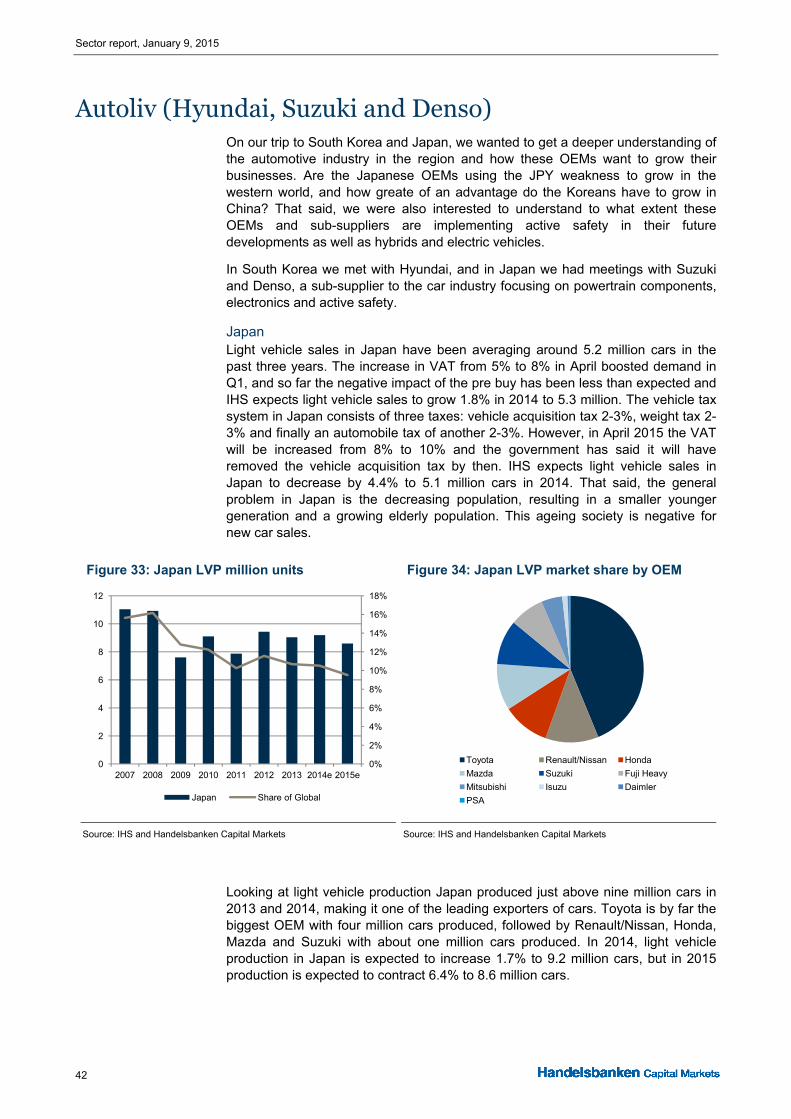
Sector report, January 9, 2015
42
Autoliv (Hyundai, Suzuki and Denso) On our trip to South Korea and Japan, we wanted to get a deeper understanding of the automotive industry in the region and how these OEMs want to grow their businesses. Are the Japanese OEMs using the JPY weakness to grow in the western world, and how greate of an advantage do the Koreans have to grow in China? That said, we were also interested to understand to what extent these OEMs and sub-suppliers are implementing active safety in their future developments as well as hybrids and electric vehicles.
In South Korea we met with Hyundai, and in Japan we had meetings with Suzuki and Denso, a sub-supplier to the car industry focusing on powertrain components, electronics and active safety.
Japan Light vehicle sales in Japan have been averaging around 5.2 million cars in the past three years. The increase in VAT from 5% to 8% in April boosted demand in Q1, and so far the negative impact of the pre buy has been less than expected and IHS expects light vehicle sales to grow 1.8% in 2014 to 5.3 million. The vehicle tax system in Japan consists of three taxes: vehicle acquisition tax 2-3%, weight tax 2-3% and finally an automobile tax of another 2-3%. However, in April 2015 the VAT will be increased from 8% to 10% and the government has said it will have removed the vehicle acquisition tax by then. IHS expects light vehicle sales in Japan to decrease by 4.4% to 5.1 million cars in 2014. That said, the general problem in Japan is the decreasing population, resulting in a smaller younger generation and a growing elderly population. This ageing society is negative for new car sales.
Figure 33: Japan LVP million units
Source: IHS and Handelsbanken Capital Markets
Figure 34: Japan LVP market share by OEM
Source: IHS and Handelsbanken Capital Markets
Looking at light vehicle production Japan produced just above nine million cars in 2013 and 2014, making it one of the leading exporters of cars. Toyota is by far the biggest OEM with four million cars produced, followed by Renault/Nissan, Honda, Mazda and Suzuki with about one million cars produced. In 2014, light vehicle production in Japan is expected to increase 1.7% to 9.2 million cars, but in 2015 production is expected to contract 6.4% to 8.6 million cars.
0%
2%
4%
6%
8%
10%
12%
14%
16%
18%
0
2
4
6
8
10
12
2007 2008 2009 2010 2011 2012 2013 2014e 2015e
Japan Share of Global
Toyota Renault/Nissan Honda
Mazda Suzuki Fuji Heavy
Mitsubishi Isuzu Daimler
PSA

Sector report, January 9, 2015
43
South Korea Light vehicle sales in South Korea were at 1.5 million in 2013, and for 2014 the market is expected to increase 5% to 1.6 million cars. During January to September, import car sales increased 34% while Hyundai and Kia grew 3.3% and 20% respectively. For 2015, IHS expects sales to increase 1% to just above 1.6 million cars, driven by improving business confidence.
The number of light vehicles produced in South Korea was 4.5 million cars. The market is clearly dominated by Hyundai and Kia, accounting for 78% (3.5 million light vehicles) together. IHS projects that light vehicle production will decrease 0.7% in 2014 to just above 4.4 million vehicles.
Figure 35: South Korea LVP million units
Source: IHS and Handelsbanken Capital Markets
Figure 36: South Korea LVP market share OEM
Source: IHS and Handelsbanken Capital Markets
Hyundai cornering Asia, 9% of Autoliv’s sales From our meetings we were very impressed by Hyundai. We all knew of the remarkable journey this OEM has taken since the mid-1990s. That said, it seems that this journey is far from over. Hyundai is today the fourth largest car manufacturer in the world and the second most profitable after BMW, with an EBIT margin close to double digits.
Figure 37: EBIT margin by OEM
Source: Industry and Handelsbanken Capital Markets
0%
1%
2%
3%
4%
5%
6%
7%
0
1
2
3
4
5
2007 2008 2009 2010 2011 2012 2013 2014e 2015e
South Korea Share of Global
General Motors Hyundai
Mahindra & Mahindra Mitsubishi
Renault/Nissan
0%
2%
4%
6%
8%
10%
12%
Hyundai Toyota Honda VW Nissan Ford BMW
Operating margin (2013) Average

Sector report, January 9, 2015
44
Hyundai targets to sell 4.9 million cars in 2014. This is 6.5% more than in 2013 and represents a 5.8% global market share. Oversea sales will surpass 3 million cars and China is set to account for 1.1 million cars, followed by India at 600,000 cars and US at 370,000 cars.
Part of this success is how Hyundai managed to increase brand value and residual values of the brand. Hyundai today uses six platforms where 40 different models are produced. And new model development time has been reduced from 40 months down to 19 months. Hyundai is today a full-range supplier covering small cars, SUVs and the large premium segment.
Figure 38: Geographical split by OEM
Source: Industry and Handelsbanken Capital Markets
Hybrids and electric cars are all developed in-house. Hyundai follows the EuroNCAP crash test standard, making it one of the most equipped Asian OEMs when it comes to passive and active safety. Hyundai’s strategy is to grow in Asia Pacific. Apart from the premium brands from the west, we identify Hyundai as the OEM with the best prospects to capitalise on China and India.
Hyundai is one of Autoliv’s biggest customers, accounting for 9% of sales. We believe the combination of high ambitions in safety combined with its excellent growth prospects will drive Autoliv sales going forward.
Suzuki In Japan we met with Suzuki, the tenth largest light vehicle OEM globally with 2.7 million cars sold in 2013 and sales for 2014 expected to increase 3.8% to 2.8 million cars. Japan accounts for 39% of sales and overseas 61%. Suzuki comprises three business areas: cars accounting for 89% of sales, motor cycles 9% and outboard engines 2%. In the automotive segment, Asia and India is by far the biggest market, accounting for 62% of vehicle sales, followed by Japan accounting for 24% and Europe 7%.
Suzuki is the true market leader in India with a 40% market share and about 1.3 million cars sold. This is (India) a market expected to end at 3.67 million cars in 2014, flat year-on-year. Suzuki’s small car profile has served it well in its growth strategy, which is why Asia will continue to be the biggest market for the group. Fuel efficiency and small engines (600cc) have also been part of the success. In China, demand for the A- and B- segment is weak while the C-segment and SUV are growing. Suzuki targets to grow more in China with its newly introduced C-segment cross-over “SX4 S-CROSS”.
0%
10%
20%
30%
40%
50%
60%
70%
80%
90%
100%
Hyundai VW Renault Toyota Honda
Domestic North America Europe Asia Others
Hyundai is one of
Autoliv’s biggest
customers,
accounting for 9% of
sales in 2013
Suzuki is the true
market leader in
India with a 40%
market share, about
1.3 million cars sold

Sector report, January 9, 2015
45
Figure 39: India LVP million units
Source: IHS and Handelsbanken Capital Markets
Figure 40: Suzuki auto split of sales, ’000 units
Source: Suzuki and Handelsbanken Capital Markets
Suzuki accounts for about 1% of Autoliv sales as the small cars have less passive safety features. For the cars sold and produced in India, Autoliv sells seat belts and the cars lack airbags. However, we believe that India will move up in the value chain in the long term and will buy cars that are bigger and safer. In such a scenario, we believe Suzuki will manage to grow with its clients.
Denso In our meeting with Denso, the world’s largest sub-supplier to the automotive sector, we focused on their active safety business. We have earlier pointed to Denso having a long-term 10% market share in vision with its stereo vision systems developed from the Toshiba collaboration on software and chip. The Toshiba chip is already in the market today and used in the stereo vision camera in Subaru. This camera has, as we have shown, also outperformed in independent AEB tests against LIDAR, RADAR and mono vision combined with radar.
Figure 41: Denso OEM split of sales
Source: Denso and Handelsbanken Capital Markets
With USD 39.8bn in sales in 2014, Denso is the largest sub-supplier to the automotive industry. The business is split into five business areas, although Powertrain Control (engine control, diesel injection, electrical and hybrids products)
0%
1%
2%
3%
4%
5%
0
1
2
3
4
5
2007 2008 2009 2010 2011 2012 2013 2014e 2015e
India Share of Global
0
500
1,000
1,500
2,000
2,500
3,000
2009 2010 2011 2012 2013 2014 forecast
Japan Europe North America Asia Others
47%
7%3%3%
3%3%
2%2%
2%2%
15%
11%
Toyota Honda Hyundai/Kia GM Chrysler Suzuki
Mazda Ford Fiat VW/Audi Other OE Aftermarket
Suzuki accounts for
about 1% of Autoliv
sales
Toyota is the largest
customer,
accounting for 47%
of sales

Sector report, January 9, 2015
46
and Thermal (climate, cooling and heating products) represent 35% and 31% of the group respectively. Toyota is the largest customer, accounting for 47% of sales, followed by Hyundai and Honda making up 3% and 6.8% of sales respectively.
Figure 42: Denso split of sales by product
Source: Handelsbanken Capital Markets
The Information and Safety Systems business area accounts for 14% of Denso’s sales and this is where the active safety business is included. Apart from the information systems, Denso currently offers products for lane departure warning, adaptive cruise control, front light detection, airbag sensors and AEB vehicle collision. Products include vision systems (camera), radar, ECU and sensors. Denso is also developing a stereo vision camera with the Toshiba technology to take up the competition with Autoliv, Bosch, Continental and Mobileye.
Figure 43: Denso mono vision camera
Source: Denso and Handelsbanken Capital Markets
From talking to Denso, our main impression in terms of active safety is that Denso believes it will be an open architecture in the fusion systems that are under development for advanced Autonomous Emergency Braking (AEB) and semi-autonomous driving. Second, we also got the understanding that competition will be high both in software and hardware development for vision systems. We believe that Denso’s collaboration with Toyota (owns 24.8% of Denso) guarantees that Denso will play a role in active safety. And in our market projection for Vision systems, we believe Denso will have 10% market share through Toyota with the Toshiba technology.
35.0%
30.4%
15.3%
9.4%
7.0%0.9% 0.2% 1.8%
Powertrain Control Systems Thermal SystemsInformation and Safety Systems Electronic SystemsSmall Motors Industrial SystemsConsumer Products Others
The Information and
Safety Systems
business area
accounts for 14% of
Denso’s sales
Denso believes it will
be an open
architecture in the
fusion systems that
are under
development
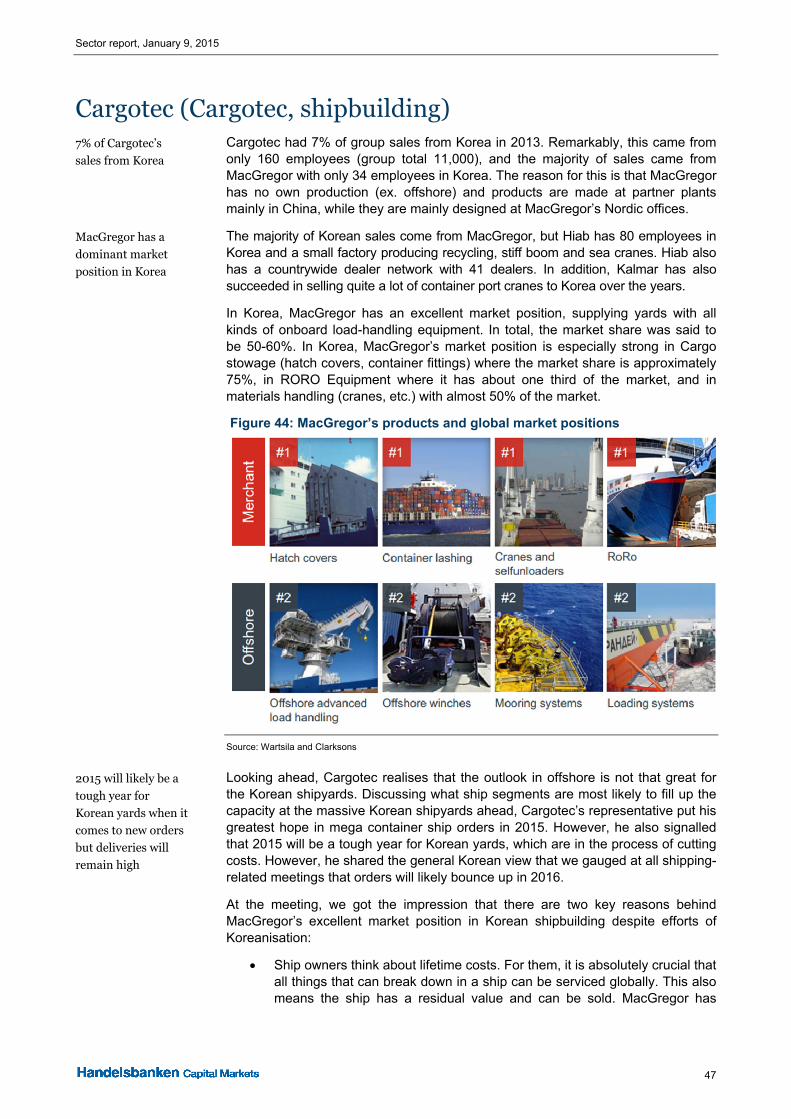
Sector report, January 9, 2015
47
Cargotec (Cargotec, shipbuilding) Cargotec had 7% of group sales from Korea in 2013. Remarkably, this came from only 160 employees (group total 11,000), and the majority of sales came from MacGregor with only 34 employees in Korea. The reason for this is that MacGregor has no own production (ex. offshore) and products are made at partner plants mainly in China, while they are mainly designed at MacGregor’s Nordic offices.
The majority of Korean sales come from MacGregor, but Hiab has 80 employees in Korea and a small factory producing recycling, stiff boom and sea cranes. Hiab also has a countrywide dealer network with 41 dealers. In addition, Kalmar has also succeeded in selling quite a lot of container port cranes to Korea over the years.
In Korea, MacGregor has an excellent market position, supplying yards with all kinds of onboard load-handling equipment. In total, the market share was said to be 50-60%. In Korea, MacGregor’s market position is especially strong in Cargo stowage (hatch covers, container fittings) where the market share is approximately 75%, in RORO Equipment where it has about one third of the market, and in materials handling (cranes, etc.) with almost 50% of the market.
Figure 44: MacGregor’s products and global market positions
Source: Wartsila and Clarksons
Looking ahead, Cargotec realises that the outlook in offshore is not that great for the Korean shipyards. Discussing what ship segments are most likely to fill up the capacity at the massive Korean shipyards ahead, Cargotec’s representative put his greatest hope in mega container ship orders in 2015. However, he also signalled that 2015 will be a tough year for Korean yards, which are in the process of cutting costs. However, he shared the general Korean view that we gauged at all shipping-related meetings that orders will likely bounce up in 2016.
At the meeting, we got the impression that there are two key reasons behind MacGregor’s excellent market position in Korean shipbuilding despite efforts of Koreanisation:
Ship owners think about lifetime costs. For them, it is absolutely crucial that all things that can break down in a ship can be serviced globally. This also means the ship has a residual value and can be sold. MacGregor has
7% of Cargotec’s
sales from Korea
MacGregor has a
dominant market
position in Korea
2015 will likely be a
tough year for
Korean yards when it
comes to new orders
but deliveries will
remain high

Sector report, January 9, 2015
48
spare part hubs in Singapore, Rotterdam and Houston. Thus, it can always deliver spare parts to all major ports in the world within 24 hours.
Korean yards are surprisingly passive when it comes to innovations that are crucial to secure ship orders in a world with lots of newly built ships at anchor. Through continual productivity-enhancing products, MacGregor has been able to help Korean yards to sell new ships despite shipping markets being characterised by oversupply.
Looking ahead, we believe that MacGregor will continue to enjoy strong market shares in Korea. However, with its small organisation it would not be a major problem for MacGregor if shipbuilding were to move faster to China than expected.
Due to long lead times, ship deliveries (in value) will likely rise globally in 2015 and remain more or less flat in 2016. However, based on the slow order generation at especially Korean yards in 2014 and with the commented bleak order outlook in 2015, we fear that MacGregor might experience declining sales in 2017 and beyond. However, this is still very far out and we think it is too early to start betting on this as shipyards have a history of going from book-to-bill levels of almost zero to orders exceeding deliveries by several times. At the end of the day, shipping will remain a growth industry and there are great innovations within the field of fuel savings and transition to gas that should eventually create a new ship order boom. However, the predominant feeling at the moment is that it is hard to see a brisk ship order recovery in the near future.
We believe Cargotec
can hold onto its
abnormally high
market shares in the
Korean shipbuilding
industry
Ship deliveries will
likely rise in 2015
and remain more or
less flat in 2016, but
beyond that there is
risk that sales will
shrink dramatically

Sector report, January 9, 2015
49
Konecranes (Kito) The reason we met Kito is that Konecranes owns 22% of the shares in Kito. It also has some joint procurement activities and cross-selling of products. Kito is the global leader in chain hoists while Konecranes is the global leader in wire-rope hoists. The average sales price of a wire-rope hoist is approximately three times higher than that of a chain hoist. Kito has 2,500 employees and subsidiaries in ten countries, while it has distribution in 50 countries.
Kito’s own 2014 sales are forecast at slightly below EUR 400m while we forecast that Konecranes will generate EUR 2,017m in 2014. Studying EBIT, the difference is however smaller as Kito is forecast to generate EBIT of approximately EUR 35m in 2014 while we estimate Konecranes’ 2014 EBIT at EUR 119m. Kito is estimated to reach an EBIT margin of 9.6% while Konecranes is expected to reach 5.9%. In doing this comparison, one needs to keep in mind that Kito only generates EUR 10-15%m of sales from Service while Konecranes generates 44% of 2014e sales from Service. In contrast, Kito has a larger share of high value-added component sales in its Equipment business.
The current market capitalisation of Kito is EUR ~250m. In other words, Kito presents a unique acquisition target for Konecranes, which is seeking to buy companies in this size range. As indicated in the following figure, Konecranes would significantly improve its geographical positioning by acquiring Kito. However, we clearly understood from company CEO and President Yoshio Kito, the grandson of the founder, that the company is not for sale.
Figure 45: 2013 geographical sales split
Source: Handelsbanken Capital Markets
Kito’s history is that it has been the key crane supplier to the Japanese manufacturing industry, and showed steady growth until 1990. Since then, the company has experienced a huge decline in Japan, which had accounted for 91% of sales in 1988. Understandably, the company faced a crisis and it was taken out by a private equity company and then IPO’d a second time in 2007.
In 2010, Kito presented a new strategy for up to 2015, aiming to internationalise the company and more than double sales and lift the EBIT margin from 4.0% in 2010 to 12.0% in 2015. The company is slightly behind its own plan and blames this on the Asian slowdown. Watching Konecranes’ continued struggle since 2009, we are certainly impressed by Kito’s performance, especially considering that the share of sales coming from Japan has declined to 24% in 2014e vs. 91% in 1988.
0%
10%
20%
30%
40%
50%
60%
70%
EMEA Americas APAC
Konecranes Kito
Kito the best
acquisition target for
Konecranes, but
unfortunately the
company is not for
sale
Kito generated 21%
of 2013 sales from
China and 28% from
Japan

Sector report, January 9, 2015
50
A key driver has been massive market share gains in the Americas and the fact that Kito has half of its production costs in JPY.
2014 sales are guided to double vs. 2009 and be 35% above the 2007 peak in JPY. As a comparison, Konecranes’ 2013 sales matched peak 2008 sales.
Figure 46: Kito financial performance in 2010-14e
Source: Handelsbanken Capital Markets
Commenting about the market outlook, CEO Kito said he remains optimistic about the US while he is pessimistic about the China outlook twelve to eighteen months ahead. 2016 can be a recovery year in China but this demands a new stimulus package. As for now, the only two healthy segments in China are automotive and power plants. In China the quality segment is growing while the low segment is declining. Within China, Kito sees growth in Northern and Inland regions while the most developed coastal regions are slow.
0.0%
2.0%
4.0%
6.0%
8.0%
10.0%
12.0%
0
100
200
300
400
500
600
2010 2011 2012 2013 2014e
Sales (Yen in million) Operating margin
Pessimistic about
China for next twelve
to eighteen months

Sector report, January 9, 2015
51
Metso (Metso Flow Control in South Korea) Metso booked orders from South Korea amounting to EUR 50m in 2013. This represented 1.3% of total group orders. However, as all of this came from Flow Control, the share of Korean orders in Flow Control was ~5%. This is expected to rise significantly in the coming years as Metso in Q4 2014 will open a new Korean valves technology centre and factory that will increase Korean manufacturing capacity for production valves fivefold to above 10,000 units annually. This investment means that Metso’s total valve production capacity grows by approximately 5% globally. In other words, Metso is well prepared for growth in Korea. During the meeting, Metso commented that profitability for Metso in Korea is similar to global levels and thus very healthy.
Metso currently has 100 employees in Korea. The new factory in Chungju (120km south east of Seoul) will, when it is ramped up (opened late 2014), have 120 employees, almost doubling the total Korean staff at Metso. The new factory represents one of Metso’s seven valve factories globally.
Metso’s history in Korea dates back to 1989 when it opened a branch office in Seoul. The big change took place in 2012 when Metso acquired Valstone. This company supplied high quality complementary valves to Metso’s offering, but they were sold only locally.
More than 50% of Metso’s sales in Korea go to the country’s big and vibrant EPC sector. Korean EPC companies are building major infrastructure projects across Asia and increasingly globally. Valves are a crucial part in many of these projects involving oil refineries, gas systems and petrochemical and power plants. Of all major global valve companies (crucial with global aftersales support), only Metso and CCI have local production in Korea, making them the preferred suppliers for Korean EPC companies. Currently, Metso estimates its market share at just above 5% at Korean EPC companies, but the potential is huge, which is why Metso is making a big investment in Korea.
In addition to the EPC companies, Metso has local sales to the Korean petrochemical and pulp and paper industries. The most important EPC segments for Metso’s valves business in Korea are, in order of relevance:
Oil refinery and petrochemical
Chemical
Energy (gas production) and power generation
Pulp and paper
The foundation for Metso’s Flow Control presence in Korea is the huge opportunity that Korean EPC companies provide. Today, more than ten Korean EPC giants cooperate with Metso, which now has more than ten years experience of working with these EPC companies. Metso’s presenter underlined that the barriers of entry are very high at EPC companies if you are working close to their local engineers in Korea.
The history of the massive Korean EPC industry is it has taken over Japan’s leading position thanks to equal quality but significantly lower costs. This happens especially at times when the JPY is strong but manpower is still reported to be significantly cheaper in Korea than in Japan (approximately 70% of Japanese level currently).
Korean share of
group sales only 1%
today (5% of Flow
Control) but
expected to rise
strongly
New Korean Valves
factory opening in
late 2014
>50% of Metso’s
Korean sales to
Korean EPC
companies
Only two
international valves
companies have local
manufacturing
supplying Korean
EPC companies
~5% market share at
Korean EPC
companies today
Sector report, January 9, 2015
52
Given that more than 50% of Metso’s Korean sales go to EPC companies, it is crucial to Metso that the positive development continues for the Korean EPC companies. Korean EPC companies are expected to have generated 8% order growth in 2014, reaching USD 70bn. Looking back, order growth has been very stable in the Korean EPC industry and the industry seems confident that the growth will continue despite the strong South Korean won. However, while order growth has remained strong in 2014, a first negative sign is evident as the margin has decreased for several Korean EPC companies lately.
Korean EPC
companies remain
optimistic but are
experiencing lower
profitability

Sector report, January 9, 2015
53
Nokian Tyres (Bridgestone) The reason we met Bridgestone is that it is the main owner of Nokian Tyres, with 15% of the shares. At our meeting, Bridgestone expressed that it has no intentions to increase or decrease the holding in Nokian Tyres. It appears that Bridgestone’s management feels pressured to both increase the dividend payout ratio from ~20% to 30% and simultaneously make a lot of greenfield investments (global tyre demand expected to grow 3-4% annually over the next five years). Accordingly, we see a very low likelihood that Bridgestone would utilise the current Russian crisis as an opportunity to take over 100% of Nokian Tyres.
Nokian and Bridgestone have historically shared technologies. However, after Bridgestone decided to build a factory in Russia, Bridgestone’s representative exited Nokian’s board. At the meeting, Bridgestone helped us to understand that the key link at the moment is within distribution in Europe excluding Russia. The idea seems to be that Bridgestone wants to utilise Nokian’s excellent sales channels in Northern Europe while Bridgestone in return offers its sales channels in Southern Europe to Nokian.
Bridgestone benefits from weakening raw material prices and a weakening JPY. Thus, the group EBIT margin is now 13% while it was only 3% in 2009. This progression has been steady. There are significant geographical differences in profitability as the 2014 EBIT margin is guided at 4% in Europe, 10% in Americas and 16% in Japan, while it is 9% in Others (Asia, Russia Middle East and Africa). Looking into 2015, however, the company signalled that the progression is unlikely to continue as the sales price to raw material gap was said to be likely to shrink in 2015. However, since our meeting, the oil price has collapsed, implying that this comment may have been premature.
Another interesting feature of the meeting was the large EBIT margin differences at Bridgestone in different tyre segments:
5-6% when selling summer tyres to car manufacturers (used to be negative)
25% premium summer tyres
Winter tyres 26%
Run-flat tyres showing an even higher EBIT margin than winter tyres
In contrast to Nokian, which generates 80% of sales from winter tyres, Bridgestone generates only 20% of sales from winter tyres. This means that Nokian’s Winter Tyres’ profitability is more or less equal to Bridgestone as the EBIT margin for the Nokian Group in 2013-14e is 26% and 22% respectively.
For Bridgestone the big winter tyres markets are Europe, Japan and Canada while China is still a very small winter tyre market, just as it is for Nokian. Bridgestone did not show any signs of seeing a great opportunity for winter tyres in China.
Bridgestone’s Russian factory opens in 2016, from where production output will rise to 12,000 units per day by 2018e. Approximately 30% of the capacity is intended to go to car manufacturers. As a comparison, we estimate Nokian to produce 45,000 tyres per day in Russia in 2014 (all replacement). Bridgestone’s biggest factory globally is located in Japan and produces 50,000 tyres per day, implying that Nokian’s Russian factory is similar in size.
Bridgestone said it
has no intentions to
increase or decrease
its holding in Nokian
at the moment
Bridgestone utilises
Nokian’s sales
channels in Northern
Europe and Nokian
utilises Bridgestone’s
channels in Southern
Europe
Nokian Tyres and
Bridgestone show
equal profitability in
winter tyres,
suggesting there
should not be any
pressure on Nokian’s
long-term
profitability as long
as it remains a
winter tyre supplier
Bridgestone does not
see winter tyres in
China as a major
opportunity
Bridgestone’s
Russian factory will
be very small
compared to
Nokian’s

Sector report, January 9, 2015
54
Sandvik (NSK, Kito, Doosan, Komatsu, Mitsubishi) We did not meet with Sandvik on this trip (the last time we met with Sandvik in Japan was 2007). Also, at our meeting with Mitsubishi, it was not possible to discuss metal-cutting. Nonetheless, we still believe that a number of conclusions can be reached. Sandvik’s exposure to Japan is around 2% of group sales (sales of SEK 1,725m in 2013). For South Korea, we expect around 1% of group sales.
On nuclear demand, this was naturally discussed during our trip and our conclusion is that it corresponds to around half of the formal nuclear capacity. This is a combination of costly and environmentally unfriendly coal and safety concerns about nuclear, but also that around half of the nuclear power is possible due to age reasons to turn back on with some modernisation. Experts do not find it likely that investment in new reactors will be made. This is positive for gas supply as such, but could also mean some modernisation equipment need from Sandvik Material Technology (SMT). Doosan Heavy Industries (Korean power equipment player in Korea) claims that there are only two suppliers of tube in the reactor and that all power equipment makers (as Doosan) use global sourcing. In Korea, there are two nuclear projects awarded. Shin-Gori No. 5 and No. 6 are the first nuclear power plants awarded in Korea in nine years. Major equipment supply will take place in April 2018-19 and completion is expected in 2021 and 2022.
Figure 47: Sandvik Materials Technology energy segment exposure (2013)
Source: Handelsbanken Capital Markets
On metal-cutting, we did not meet any of Sandvik’s peers. We can however conclude that the Japanese companies we met all argue (perhaps with the exception of NSK) that they will not use pricing to take market share. However, we expect Mitsubishi Carbide and other Japanese players such as Kyocera to use the cost advantage to put more effort into R&D. Given this assumption, we find it reassuring that Sandvik Machining Solutions (SMS) has a good pipeline with new products (the best in many years, with a total of 15,000 new items). We expect price/mix in SMS to increase to 2.0% in 2015e from 1.5% in 2014 based on mix. This forecast could prove too optimistic if Japanese players decide to use their cost advantage to cut prices. For SMT, we expect a positive price/mix of 0.4% in 2015e, which also has downside from competition reasons in combination with weak energy capex sentiment.
For mining and construction, please see the section on Atlas Copco.
28%
8%
4%
60%
Energy oil & gas Energy nuclear Energy other Other
We did not meet
with Sandvik on this
trip
Some nuclear
potential for Sandvik
in Japan & Korea
We do not see
Sandvik supporting
local gas
transportation
Metal-cutting as well
as steel has some
strong players in
Japan with cost
advantages putting
pressure on Sandvik
SMS and SMT

Sector report, January 9, 2015
55
Summary Sandvik has a relatively small exposure to the region (2% of sales to Japan and 1% to Korea) and will enjoy a potentially warmer economic climate in SMS and from parts of nuclear power being turned back on driving some modernisation need, although we do not expect any investments in new reactors. We do not expect Sandvik to win over local suppliers of pipes for gas transportation. On pricing, there is a small downside risk in SMS due to competition reasons. In SMT we see potential downside due to competition and weak energy capex sentiment. In all, we rank Sandvik as neutral to slightly negative when it comes to potential in/from the region.

Sector report, January 9, 2015
56
SKF (NSK, Kito, Denso, Bridgestone, etc.) SKF has some 4% of its revenues in Japan and South Korea, but Japan is of significant importance given that three out of the six largest bearings players globally are Japanese. We did not meet SKF on our trip but its main peer NSK. This section also contains some information on the bearing market as such.
More aggressive growth plans ahead NSK has a strong couple of years behind it. Although helped by the weak JPY, the company has already reached its mid-term plan for 2015 (ending March 2016) in terms of profitability, both on the EBIT margin and ROE. When combining this with the main objective of the mid-term plan to establish fundamentals appropriate for a company with JPY 1 trillion in sales (JPY 950bn in 2014 forecast), we find it likely that NSK will revise its mid-term plan in a couple of months with a more aggressive sales plan (“we will grow even faster in the future”).
Figure 48: NSK, domestic and overseas sales (JPYbn)
Source: Handelsbanken Capital Markets
Figure 49: NSK, EBIT margin progression and target
Source: Handelsbanken Capital Markets
The margin target in Automotive has already been overshot, but the gap for Industrial bearings is still large. This combined with the fact that SKF is moving more and more toward Industrial, means that we argue that NSK will take some automotive volume ahead even if it also aims to shift towards industrial.
355 364 333 329 331
356 369 400543
620
0
100
200
300
400
500
600
700
800
900
1,000
2010 2011 2012 2013 2014 forecast
Japan Non-Japan
1.9%
6.1% 6.1%
4.4%
7.8%
9.1% 9.1%
0%
2%
4%
6%
8%
10%
2009 2010 2011 2012 2013 2014 forecast 2015 plan
EBIT-margin
Flat sales in Japan
over the past five
years and efforts
overseas will
increase
Already met 2015
mid-term plan on
sales…
…and on EBIT
margin as well as
ROCE

Sector report, January 9, 2015
57
NSK will continue to be more global, although the share of sales in Japan is down from 51% in 2007 to 35% this year. So the growth efforts will naturally be directed overseas, predominantly in emerging economies but we also believe Europe is on the agenda. The success in China has been massive with sales of JPY 200bn or 21% of 2014e sales, up from JPY 46bn or 6% of sales in 2007. Large investments have been down lately for increased production capacity for large size bearings in China and NSK now has 12 factories in the country. In order to grow the automotive business, some additional investments are needed (SKF has invested a lot in China and capacity utilisation will not reach reasonable levels until 2016-17 at the earliest, in our view).
Figure 50: NSK sales by region, 2013 and 2007
Source: Handelsbanken Capital Markets
NSK actively seeks alliances to grow overseas and finds this more important than consolidating the Japanese market (which we think needs to be consolidated with four strong players).
Pricing and demand – price discipline but with tempting fundamentals Bearings are a lot about production. NSK ships 300-400 million pieces a month and the production setup is huge. In order to run that business, NSK argues that it needs to have a professional setup in order not to mismanage in terms or quality, safety, compliance, etc. According to NSK, it has invested a lot in capacity over the past couple of years (5-6% of sales) and is running production at 85% of previous peak capacity on the industrial side and close to max on Chinese automotive. So it is natural that NSK wants to fill its production, and we rather expect this to happen in the coming years in terms of mentality from Tokyo rather than saying no to low profitable businesses. As the production to sales gap in Europe and the US is large in Industrial (still 50% of production in Japan and China self-sufficient), we see a clear risk that NSK could be more aggressive on prices although it that this will not be the case.
Figure 51: SKF price/mix vs. producer prices in EU and NA
Source: Handelsbanken Capital Markets
0
50
100
150
200
250
300
350
400
China Asia (other) Europe Americas Japan
2007 2013
-6%
-4%
-2%
0%
2%
4%
6%
8%
Price/mix SKF Industrial producer prices EU Producer prices USA
Growth effort
directed to EU and
emerging markets
Large investments
made
China now the
second largest
market
NSK is getting
stronger and
stronger
Capacity utilisation
has come down on
industrial bearings
while high on
Chinese automotive
Risk on 2015e
price/mix

Sector report, January 9, 2015
58
According to NSK, there is a clear distinction between industrial and automotive segments when it comes to pricing, where fierce price competition in the first is not that common. NSK believes that prices in China will be up slightly next year but flat in Europe (expect SKF to increase distribution prices). We argue that SKF is likely to announce another price increase soon in the aftermarket as it will be much tougher ahead. NSK said that “they were disappointed to see SKF’s margin”.
On demand, NSK is still bullish on automotive in the US and in China and expects growth to remain strong for non-Chinese brands in China, suiting their exposure.
On the industrial side, the outlook is flat and two out of eleven segments are up (machine tools and semiconductors). Also the aftermarket is expected to be flat. Hence the FY 2014 forecast has been cut from the original plan both in terms of sales (approximately a 10% cut) and profitability (from 16% to 11.6%, due to volume). When we take FX out of the equation, NSK’s outlook shows that volumes are expected to be down y-o-y over the next six months, which we find worrying.
Figure 52: NSK growth guidance for H2 2014 (calendar Q4 2014 and Q1 2015)
Source: NSK, Handelsbanken Capital Markets
Table 20: SKF forecast, volume by division
Source: Handelsbanken Capital Markets
0%
2%
4%
6%
8%
10%
12%
14%
16%
Japan Americas Europe Rest of Asia China Total
Y/Y growth of which FX (HCMe)
Volume 2013 Q1 14 Q2 14 Q3 14 Q4 14e 2014e Q1 15e Q2 15e Q3 15e Q4 15e 2015eSSI -4.1% 7.2% 10.1% 7.8% 9.0% 8.5% 13.0% 3.0% -3.0% -3.0% 2.5%Automotive 5.0% 8.8% 0.3% -1.8% -5.0% 0.6% 3.0% 3.0% 3.0% 3.0% 3.0%SRSS -1.8% 2.8% 1.0% -0.5% 0.0% 0.8% 2.0% 2.0% 2.0% 2.0% 2.0%Specialty Busine 1.8% 13.4% 5.3% 4.7% 9.0% 8.1% 3.0% 3.0% 3.0% 3.0% 3.0%Total -0.7% 6.2% 3.6% 1.9% 1.7% 3.4% 5.6% 2.6% 0.8% 0.8% 2.5%
NSK talks about flat
prices in the EU in
2015, while we
expect SKF to
announce a price
increase soon
NSK’s outlook
excluding FX implies
negative volumes in
the coming two
quarters
Risk on volumes,
according to NSK’s
outlook

Sector report, January 9, 2015
59
Table 21: Bearing data
Source: Handelsbanken Capital Markets, company reports
Summary SKF has limited sales in Japan and Korea (4%) but the market is very important as three out of the six largest players globally in bearings are Japanese. A possible consolidation (which we find unlikely in the short term) could mean less fierce competition for SKF. Bearings are an asset-heavy industry and it is not particularly clear whether innovation returns are as attractive as in other industries. We also see a potential significant restructuring of the production footprint in the coming years, regardless of the “Internet of Things”. This could be seen as a positive self-help story, but we rather see it as a function of a tough industry. We fear that insufficient volume growth (demand and distributor destocking) in combination with excess capacity for bearings players, tempting FX advantages for Japanese competition, increased Chinese competition and an overall weak pricing climate will force SKF to work even harder to sustain profitability. Large European exposure, a potential positive indirect effect from the weaker oil price and limited exposure to oil and marine have driven SKF over the past couple of months and we see that this could continue in the short term.
Capex/sales 2012 2013Schaeffler 7.7% 5.1%Timken 6.0% 7.5%SKF 3.1% 3.5%NSK 6.1% 5.0%NTN 9.1% 5.2%Average 6.4% 5.2%
R&D/sales 2012 2013Schaeffler 5.3% 5.5%Timken 1.1% 1.1%SKF 2.5% 2.9%NSK 0.0% 1.1%NTN 3.0% 2.8%Average 2.4% 2.7%
Production units 2012 2013Schaeffler 70 73Timken 61SKF 165NSK 64NTN 68Total 70 431
Sales (USDm) 2012 2013Schaeffler Industrial 4,319 4,043SKF SI and RSS 6,809 6,638Timken Process Industries and Aerospace 1,690 1,565NSK Industrial Machinery Bearings + Precision Machiner 2,161 2,430NTN Industrial Machinery (incl. share of aftermarket) 1,123 1,208Total 16,103 15,884
Sales (USDm) 2012 2013Schaeffler Automotive 9,732 10,859SKF Automotive 2,542 2,672Timken Mobile Industries 1,676 1,475NSK Automotive Bearings 2,365 2,780NTN Automotive (incl. share of aftermarket) 4,273 5,182Total 20,588 22,969
High capex industry
Is this industry really
receptive to
innovation?
Huge manufacturing
base
NSK has surpassed
SKF in automotive
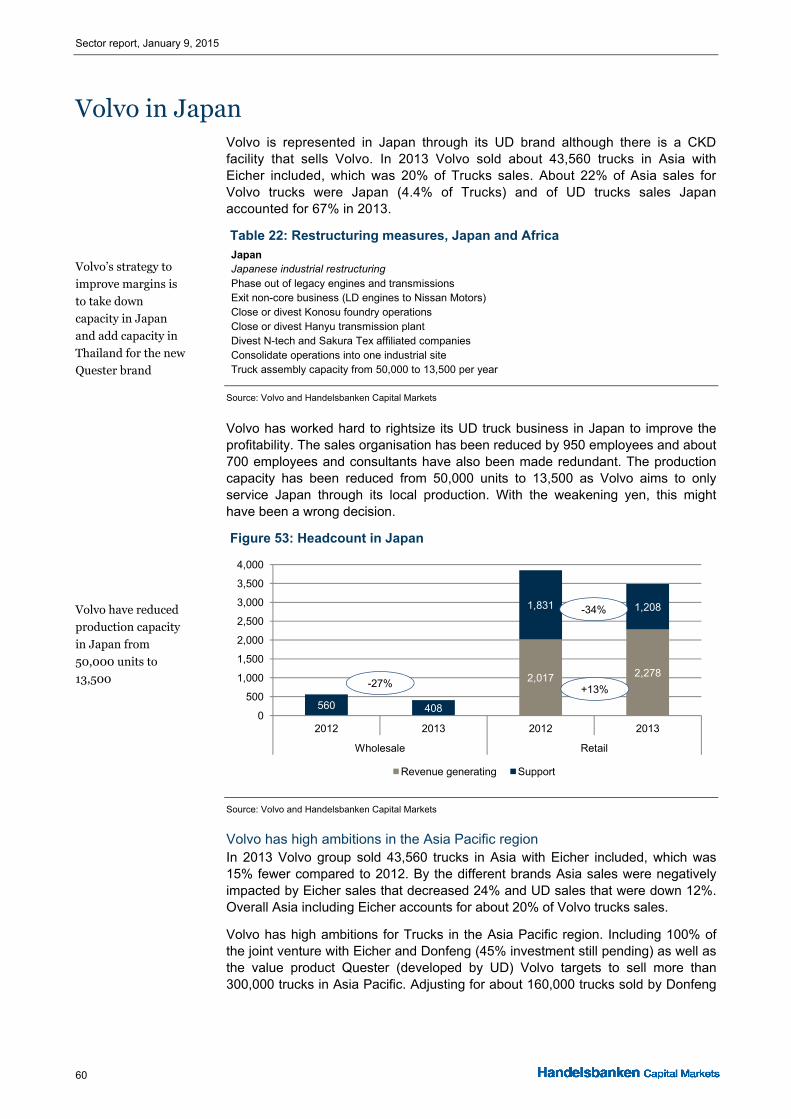
Sector report, January 9, 2015
60
Volvo in Japan Volvo is represented in Japan through its UD brand although there is a CKD facility that sells Volvo. In 2013 Volvo sold about 43,560 trucks in Asia with Eicher included, which was 20% of Trucks sales. About 22% of Asia sales for Volvo trucks were Japan (4.4% of Trucks) and of UD trucks sales Japan accounted for 67% in 2013.
Table 22: Restructuring measures, Japan and Africa
Source: Volvo and Handelsbanken Capital Markets
Volvo has worked hard to rightsize its UD truck business in Japan to improve the profitability. The sales organisation has been reduced by 950 employees and about 700 employees and consultants have also been made redundant. The production capacity has been reduced from 50,000 units to 13,500 as Volvo aims to only service Japan through its local production. With the weakening yen, this might have been a wrong decision.
Figure 53: Headcount in Japan
Source: Volvo and Handelsbanken Capital Markets
Volvo has high ambitions in the Asia Pacific region In 2013 Volvo group sold 43,560 trucks in Asia with Eicher included, which was 15% fewer compared to 2012. By the different brands Asia sales were negatively impacted by Eicher sales that decreased 24% and UD sales that were down 12%. Overall Asia including Eicher accounts for about 20% of Volvo trucks sales.
Volvo has high ambitions for Trucks in the Asia Pacific region. Including 100% of the joint venture with Eicher and Donfeng (45% investment still pending) as well as the value product Quester (developed by UD) Volvo targets to sell more than 300,000 trucks in Asia Pacific. Adjusting for about 160,000 trucks sold by Donfeng
JapanJapanese industrial restructuringPhase out of legacy engines and transmissionsExit non-core business (LD engines to Nissan Motors)Close or divest Konosu foundry operationsClose or divest Hanyu transmission plantDivest N-tech and Sakura Tex affiliated companiesConsolidate operations into one industrial siteTruck assembly capacity from 50,000 to 13,500 per year
2,017 2,278
560 408
1,831 1,208
0
500
1,000
1,500
2,000
2,500
3,000
3,500
4,000
2012 2013 2012 2013
Wholesale Retail
Revenue generating Support
-27%
-34%
+13%
Volvo’s strategy to
improve margins is
to take down
capacity in Japan
and add capacity in
Thailand for the new
Quester brand
Volvo have reduced
production capacity
in Japan from
50,000 units to
13,500

Sector report, January 9, 2015
61
and the 44,000 trucks Volvo sold in Asia including 100% of Eicher in 2013 Volvo targets incremental sales of close to 100,000 trucks.
Figure 54: Volvo Asia truck sales including Eicher (units)
Source: Volvo and Handelsbanken Capital Markets
In the growth target for Asia Pacific, Volvo includes the newly UD-developed value truck Quester. A production facility in Thailand is up and running with a total capacity of 20,000 units, although current demand only suggests that about 1,500 trucks will be produced in 2014. The Thailand facility will service the South East Asia market, but Volvo targets to set up a facility in China for Quester together with Donfeng, and in India there will be a similar facility together with Eicher trucks.
Volvo is clearly targeting to grow in emerging markets to reach the long term goal of above 300,000 units in Asia Pacific. The value-segment Quester product developed by UD Trucks should be perfect for these markets as the local truck fleets are climbing up the value chain from domestic OEMs in China and India to the high-end segments from the western world.
Table 23: Volvo trucks brand segmentation
Source: Volvo
Most competition from Asia We believe Volvo will see the toughest competition from the Japanese truck OEMs together with Daimler in Asia Pacific in the value segment. The Japanese truck OEMs have no ambition to break into the European or North American heavy duty truck markets apart from special vehicles for vocational trucks or other types of
0%
5%
10%
15%
20%
25%
30%
35%
40%
0
10,000
20,000
30,000
40,000
50,000
60,000
70,000
80,000
2005 2006 2007 2008 2009 2010 2011 2012 2013 2014e
Renault Volvo UD Eicher Mack Share of Trucks
We believe Volvo will
see the toughest
competition in
emerging markets
from the Japanese
OEMs and Daimler

Sector report, January 9, 2015
62
utilities vehicles, which makes them even more determined to grow in Asia and MEA. Secondly, the product offer and geographical exposure also makes the Japanese OEMs very competitive. Daimler has the same strategy as Volvo for emerging markets and Asia Pacific in particular. Daimler’s Fuso product offer together with the joint ventures in China and with Tata makes Daimler highly competitive.
Even if Volvo is adjusting capacity and is streamlining its UD business in Japan, we believe it will continue to be a mid-single-digit margin business with a potential repeat of the historical peak EBIT margin of 7.5%. However, if the introduction of Quester turns out to be a successful volume story reaching 30,000 units, incremental earnings on the UD technology could yield over-the-cycle higher margins. From listening to Volvo and also annualising the old action programme to increase margins over the cycle, we believe the Quester product is part of the programme to increase the Asia profitability over the cycle. Higher volumes in Asia for Volvo but also the possibility to extend the life of old technologies from ended products in the Volvo groups speaks for better margins, if successful.
The possibility to
extend the life of old
technologies in
Quester from ended
products in the Volvo
speaks for better
margins if successful

Sector report, January 9, 2015
63
Wartsila (Wartsila, shipbuilding) Korea represented ~7% of Wartsila’s 2013 sales while China made up 6% and Japan <1%. Almost all of Wartsila’s sales in these countries came from Ship Power, with a small share also from Service. With Ship Power making up 28% of 2013 group sales, it is fair to say that Korea and China are the two clearly most important end markets for Wartsila’s Ship Power. However, it is important to understand that the end customer paying for a vessel being built at Asian yards is still mainly located in the Western world and thinks about lifetime costs and not only the purchasing cost of the vessels. For him, it is crucial that the movable parts on the vessel that may break down have a global service network. This is also crucial for the residual value of the ship. This, together with state-of-the-art technologies, has so far granted Wartsila a leading position in Korea despite increasing Korean efforts to lift the share of local supply.
Wartsila procured its first agreement in Korea in 1975 and it today employs 235 people in Korea. At the peak in 2009, the figure was 352. Wartsila has a very good market position especially in LNG solutions in Korea, with a market share exceeding 70%. Interestingly, Japanese shipbuilders are also buying LNG systems from Wartsila. Currently, there are 30 LNG vessels being built in Japan. At our meeting with Mitsubishi Heavy Industries in Tokyo, we however got the impression that these vessels will mainly be built for replacement need rather than Japan preparing for a future without nuclear power plants. Thus, these LNG vessels being built in Japan is likely only a temporary mini boom and not the beginning of a revolution.
Wartsila is in Korea also a major supplier of engines to more advanced vessels (especially offshore), propulsion equipment and electrical and automation systems. A key reason for Wartsila’s success in Korea is the JV factory with Hyundai Heavy Industries (HHI), which produces dual fuel 4-stroke engines for LNG applications. This factory has 200 employees and makes up to 120 engines annually. If more engines are needed, they are imported from Wartsila’s Italian factory.
2014 will be a relatively good year for Wartsila in Korea despite the offshore collapse. This is however explained by the long lead times in the shipbuilding industry. Wartsila, just like the shipbuilders we met in Korea, did not succeed in convincing us what ship segments will be strong in 2015-16 given the bleak outlook for offshore, which was the key driver for Korean shipyards in 2011-13. To us, it seems that Korean yards are already realising that ship orders will be very low in 2015, and we got the impression that their hope of a recovery in 2016 was mainly based on general global economic activity increasing rather than new innovations.
The likely outcome of this is that Korean yards must restructure and cut prices heavily. However, we do not believe that Wartsila to any major extent will be forced to cut its prices despite ship prices falling. Another key conclusion from our meeting was that it still feels clearly too early to bet on merchant ships turning to LNG as a main fuel in the next couple of years.
7% of Wartsila sales
from Korea that
together with China
and Norway is the
most important end
market for Ship
Power
Wartsila has an
excellent market
position in LNG also
in Korea
We remain
unconvinced on how
order slots will be
filled in 2015-16 at
Korean yards

Recommendation Structure, Definitions and Allocations Handelsbanken Capital Markets Equity Research (HCM) employs a four-graded recommendation scale. The recommendations reflect the analyst’s assessment of how much the share price may appreciate or depreciate in absolute terms in a 12-month time horizon and takes into account risks related to both fundamental expectations and share performance. Investment ratings are determined by the ranges described in the table below. The recommendations do not represent the analyst’s or the bank’s assessment of the company’s fundamental value or quality. All investments involve risks and investors are encouraged to make their own decision as to the appropriateness of an investment in any securities referred to in this report, based on their specific investment objectives, financial status and risk tolerance. The recommendations and absolute performance intervals, together with the allocation of the rating categories amongst companies under coverage and amongst companies under coverage for which Handelsbanken has provided investment banking services in the past 12 months are listed below:
HCM rating RTP is expected to be1 HCM Universe2 IB services3
Buy >+20% 30% 5%Accumulate +5% - +20% 42% 7%Reduce -15% - +5 % 26% 0%Sell < -15 % 1% 0%1 RTP is defined as the expected share price appreciation (depreciation) including dividends over the next 12 months2 Percentage of companies under coverage within each rating category3 Percentage of companies within each rating category for which investment banking services have been provided in the past 12 months
Ratings: definitions and allocations
Source: Handelsbanken Capital Markets, as per 2/1 2015 At times, the expected total returns may fall outside of the above stated ranges because of price movement and/or volatility. Such interim deviations from specified ranges will be permitted but will become subject to review by Research Management. Recommendations are continuously reviewed by the analyst and monitored by the Research Management and will be updated and/or refreshed regularly. The rationale behind a change in recommendation will be explained in such a refresher/update. The target price (TP) is the analyst’s assessment of the level at which the share should be traded in a 12-month period. The TP is used as a basis for the recommendation (see explanation above) and takes into account timing-related issues and triggers, such as relative valuation and newsflow. The TP does not represent the analyst’s or the bank’s assessment of the company’s fundamental value or quality.
Valuation and earnings forecasts Target prices, outlooks and recommendations expressed in this research report are based on a combination of valuation models, such as discounted cash flow (DCF) and relative valuation to peers using ratios such as price-to-earnings (P/E), enterprise-value-to-operating profit (EV/EBITDA), price-to-book (P/B) and earnings models. Sales and earnings forecasts are based on historical financial data as reported by the company and the analyst's expectations for company-specific performance are derived from expectations of micro- and macro-economic developments. The company's different business segments are modelled separately in this process and then aggregated to achieve group forecasts for sales, earnings, cash flow and the balance sheet.
Research Disclaimers Handelsbanken Capital Markets, a division of Svenska Handelsbanken AB (publ) (collectively referred to herein as ‘SHB’), is responsible for the preparation of research reports. SHB is regulated in Sweden by the Swedish Financial Supervisory Authority, in Norway by the Financial Supervisory Authority of Norway, in Finland by the Financial Supervisory of Finland and in Denmark by the Danish Financial Supervisory Authority. All research reports are prepared from trade and statistical services and other information that SHB considers to be reliable. SHB has not independently verified such information and does not represent that such information is true, accurate or complete. Accordingly, to the extent permitted by law, neither SHB, nor any of its directors, officers or employees, nor any other person, accept any liability whatsoever for any loss, however it arises, from any use of such research reports or its contents or otherwise arising in connection therewith. In no event will SHB or any of its affiliates, their officers, directors or employees be liable to any person for any direct, indirect, special or consequential damages arising out of any use of the information contained in the research reports, including without limitation any lost profits even if SHB is expressly advised of the possibility or likelihood of such damages. The views contained in SHB research reports are the opinions of employees of SHB and its affiliates and accurately reflect the personal views of the respective analysts at this date and are subject to change. There can be no assurance that future events will be consistent with any such opinions. Each analyst identified in this research report also certifies that the opinions expressed herein and attributed to such analyst accurately reflect his or her individual views about the companies or securities discussed in the research report. Research reports are prepared by SHB for information purposes only. The information in the research reports does not constitute a personal recommendation or personalised investment advice and such reports or opinions should not be the basis for making investment or strategic decisions. This document does not constitute or form part of any offer for sale or subscription of or solicitation of any offer to buy or subscribe for any securities nor shall it or any part of it form the basis of or be relied on in connection with any contract or commitment whatsoever. Past performance may not be repeated and should not be seen as an indication of future performance. The value of investments and the income from them may go down as well as up and investors may forfeit all principal originally invested. Investors are not guaranteed to make profits on investments and may lose money. Exchange rates may cause the value of overseas investments and the income arising from them to rise or fall. This research product will be updated on a regular basis. No part of SHB research reports may be reproduced or distributed to any other person without the prior written consent of SHB. The distribution of this document in certain jurisdictions may be restricted by law and persons into whose possession this document comes should inform themselves about, and observe, any such restrictions. Please be advised of the following important research disclosure statements: SHB employees, including analysts, receive compensation that is generated by overall firm profitability. Analyst compensation is not based on specific corporate finance or debt capital markets services. No part of analysts’ compensation has been, is or will be directly or indirectly related to specific recommendations or views expressed within research reports. From time to time, SHB and/or its affiliates may provide investment banking and other services, including corporate banking services and securities advice, to any of the companies mentioned in our research. We may act as adviser and/or broker to any of the companies mentioned in our research. SHB may also seek corporate finance assignments with such companies. We buy and sell securities mentioned in our research from customers on a principal basis. Accordingly, we may at any time have a long or short position in any such securities. We may also make a market in the securities of all the companies mentioned in this report. [Further information and relevant disclosures are contained within our research reports.] SHB, its affiliates, their clients, officers, directors or employees may own or have positions in securities mentioned in research reports. According to the Bank’s Ethical Guidelines for the Handelsbanken Group, the board and all employees of the Bank must observe high standards of ethics in carrying out their responsibilities at the Bank, as well as other assignments. The Bank has also adopted Guidelines concerning Research which are intended to ensure the integrity and independence of research analysts and the research department, as well as to identify actual or potential conflicts of interests relating to analysts or the Bank and to resolve any such conflicts by eliminating or mitigating them and/or making such disclosures as may be appropriate. As part of its control of conflicts of interests, the Bank has introduced restrictions (“Information barriers”) on communications between the Research department and other departments of the Bank. In addition, in the Bank’s organisational structure, the Research department is kept separate from the Corporate Finance department and other departments with similar remits. The Guidelines concerning Research also include regulations for how payments, bonuses and salaries may be paid out to analysts, what marketing activities an analyst may participate in, how analysts are to handle their own securities transactions and those of closely related persons, etc. In addition, there are restrictions in communications between analysts and the subject company. For full information on the Bank’s ethical guidelines please see the Bank’s website www.handelsbanken.com/About the bank/Investor relations/Corporate social responsibility/Ethical guidelines. Handelsbanken has a ZERO tolerance of bribery and corruption. This is established in the Bank’s Group Policy on Bribery and Corruption. The prohibition against bribery also includes the soliciting, arranging or accepting bribes intended for the employee’s family, friends, associates or acquaintances. For company-specific disclosure texts, please consult the Handelsbanken Capital Markets website: www.handelsbanken.com/research. When distributed in the UK Research reports are distributed in the UK by SHB. SHB is authorised by the Swedish Financial Supervisory Authority (Finansinspektionen) and the Prudential Regulation Authority and subject to limited regulation by the Financial Conduct Authority and Prudential Regulation Authority. Details about the extent of our authorisation and regulation by the Prudential Regulation Authority, and regulation by the Financial Conduct Authority are available from us on request. UK customers should note that neither the UK Financial Services Compensation Scheme for investment business nor the rules of the Financial Conduct Authority made under the UK Financial Services and Markets Act 2000 (as amended) for the protection of private customers apply to this research report and accordingly UK customers will not be protected by that scheme. This document may be distributed in the United Kingdom only to persons who are authorised or exempted persons within the meaning of the Financial Services and Markets Act 2000 (as amended) (or any order made thereunder) or (i) to persons who have professional experience in matters relating to investments falling within Article 19(5) of the Financial Services and Markets Act 2000 (Financial Promotion) Order 2005 (the “Order”), (ii) to high net worth entities falling within Article 49(2)(a) to (d) of the Order or (iii) to persons who are professional clients under Chapter 3 of the Financial Conduct Authority Conduct of Business Sourcebook (all such persons together being referred to as “Relevant Persons”). When distributed in the United States Important Third-Party Research Disclosures: SHB and its employees are not subject to FINRA’s research analyst rules which are intended to prevent conflicts of interest by, among other things, prohibiting certain compensation practices, restricting trading by analysts and restricting communications with the companies that are the subject of the research report. SHB research reports are intended for distribution in the United States solely to “major U.S. institutional investors,” as defined in Rule 15a-6 under the Securities Exchange Act of 1934. Each major U.S. institutional investor that receives a copy of research report by its acceptance hereof represents and agrees that it shall not distribute or provide research reports to any other person Reports regarding fixed-income products are prepared by SHB and distributed by SHB to major U.S. institutional investors under Rule 15a-6(a)(2). Reports regarding equity products are prepared by SHB and distributed in the United States by Handelsbanken Markets Securities Inc. (“HMSI”) under Rule 15a-6(a)(2). When distributed by HMSI, HMSI takes responsibility for the report. Any U.S. person receiving these research reports that desires to effect transactions in any equity product discussed within the research reports should call or write HMSI. HMSI is a FINRA Member, telephone number (+1-212-326-5153).

Svenska Handelsbanken AB (publ) Stockholm Blasieholmstorg 11 SE-106 70 Stockholm Tel. +46 8 701 10 00 Fax. +46 8 611 11 80
Copenhagen Havneholmen 29 DK-1561 Copenhagen V Tel. +45 46 79 12 00 Fax. +45 46 79 15 52
Helsinki Aleksanterinkatu 11 FI-00100 Helsinki Tel. +358 10 444 11 Fax. +358 10 444 2578
Oslo Tjuvholmen allé 11 Postboks 1249 Vika NO-0110 Oslo Tel. +47 22 39 70 00 Fax. +47 22 39 71 60
London 3 Thomas More Square London GB-E1W 1WY Tel. +44 207 578 8668 Fax. +44 207 578 8090
New York Handelsbanken Markets Securities, Inc. 875 Third Avenue, 4th Floor New York, NY 10022-7218 Tel. +1 212 326 5153 Fax. +1 212 326 2730 FINRA, SIPC
Equity & Credit Research
Peter Karlsson +46 8 701 2151 Head of Equity and Credit Research
Consumer Discretionary & Staples Consumer Goods Rasmus Engberg +46 8 701 5116 Erik Sandstedt +46 8 701 3128 Marcela Klang +46 8 701 5118 Peter Wallin +46 8 701 2534 Robin Santavirta +358 10 444 2483 Casper Blom +45 33 41 8295 Kjetil Lye +47 22 39 7299 Magnus Råman +46 8 701 1727 Karri Rinta +46 8 701 3636
Media & Services Rasmus Engberg +46 8 701 5116
Energy Oil and Gas Anne Gjøen +47 22 39 7022 Kjetil Sørum +47 22 39 7107
Oil Services Daniel Råvik +47 22 39 7323 Kjetil Sørum +47 22 39 7107
Strategy Peter Karlsson +46 8 701 2151 Jan Dworsky +46 8 701 5555
Large Caps Jan Dworsky +46 8 701 5555 Pierre Mellström +46 8 701 5114
Small/Mid Caps Fredrik Skoglund +46 8 701 3393 Pierre Mellström +46 8 701 5114
Healthcare Medtech Hans Mähler +46 8 701 8155
Pharmaceuticals Hans Mähler +46 8 701 8155 Peter Sehested +45 46 79 1618
Telecom & IT Telecom Operators Thomas Heath +46 8 701 5055
Telecom Equipment Daniel Djurberg +46 8 701 5575 Thomas Heath +46 8 701 5055
IT Daniel Djurberg +46 8 701 5575 Thomas Heath +46 8 701 5055
Small Caps Jon Hyltner +46 8 701 1275 Fredrik Skoglund +46 8 701 3393 Robin Santavirta +358 10 444 2483 Marcela Klang +46 8 701 5118
Branch Network Sweden Lars Westberg +46 8 701 4113 Peter Engstedt +46 8 701 3104 Mikaela Strand +46 8 701 4359
Denmark Jon Abakka +45 46 79 1621 Michelle Nørgaard +45 46 79 1504
Industrials Capital Goods Hampus Engellau +46 8 701 3576 Peder Frölén +46 8 701 1251 Tom Skogman +358 10 444 2752 Carl Bertilsson +46 8 701 8284 Jon Hyltner +46 8 701 1275 Marcela Klang +46 8 701 5118
Construction Albin Sandberg +46 8 701 8016 Marcela Klang +46 8 701 5118
Commercial Services Staffan Åberg +46 8 701 4024
Transportation Dan Togo Jensen +45 46 79 1246
Materials Steel and Metal Anne Gjøen +47 22 39 7022 Mikael Doepel +358 10 444 2450
Paper Mikael Doepel +358 10 444 2450
Chemicals Mikael Doepel +358 10 444 2450
Financials Banking Peter Wallin +46 8 701 2534 Mads Thinggaard +45 46 79 1587
Insurance Kimmo Rämä +358 10 444 2454
Investment Companies Magnus Råman +46 8 701 1727
Real Estate Albin Sandberg +46 8 701 8016 Marcela Klang +46 8 701 5118
Utilities Karri Rinta +46 8 701 3636
Equity Sales
Eggert Mörling, Nordics +46 8 463 4911
Lars Hallström, Stockholm +46 8 463 2561
Micaela Grimm, New York +1 212 326 5153
Lauri Suoninen, Finland +358 10 444 6215
Ole Bernhard Haugnes, Oslo +47 22 82 3009
Jesper Olsen, Copenhagen +45 884 15706
Angus McNeilage, London +44 207 57 88658
Joe Tracy, Continental Europe +46 8 463 3601